Preliminary Report on a Pilot Investigation to Maximise ... … · A FRDC funded project in...
58
t INTERNAL REPORT NO. 2 A Preliminary Report on a Pilot Investigation to Maximise Tasmania's Sea Urchin (Heliocidaris erythroaramma) Resource J Craig Sanderson Principal Investigator ~e'itember 1993 (Not to be cited without permission) , , . . ..<I M~N I OF PRIMARY INDUSTRY AND FISHERIES, TASMANIA 7
Transcript of Preliminary Report on a Pilot Investigation to Maximise ... … · A FRDC funded project in...

t INTERNAL REPORT NO. 2
A Preliminary Report on a Pilot Investigation to
Maximise Tasmania's Sea Urchin (Heliocidaris erythroaramma)
Resource
J Craig Sanderson Principal Investigator
~e'itember 1993
(Not to be cited without permission)
,,. . ..<I M ~ N I OF PRIMARY INDUSTRY AND FISHERIES, TASMANIA 7
Department of Primary Industry and Fisheries, Sea Fisheries Division
INTERNAL REPORT NO. 2
A Preliminary Report on a Pilot Project to Maximize Tasmania's Sea Urchin (Heliocidaris erythrograrnma)
Resource.
J Craig Sanderson October 1993
A FRDC funded project in conjunction with Tasmanian Sea Urchin Developments.
Requests for copies of this report or queries can be made to Craig Sanderson: c/- Tasmanian Sea Urchin Developments, P.O. Box 172 Moonah, Tasmania 7009,
Fax/Ph. No.: (002) 233510 or to Tasmanian Sea Fisheries Division, Taroona Research Laboratories
Crayfish point, Taroona 7053 Ph. No.: (002) 277277.

Sea Fisheries Internal Report No.2
ABSTRACT
A commercial fishery for Heliocidaris erythrogramma has been in
progress in Tasmania since 1983. At present (1993) there are two
processors and 30 commercial divers of which 15 work at least 8
months of the year. For 1992, divers estimated total annual landings at
about 520 tonnes with a value of approximately $2m. This study is
aimed at maximizing the value of these resourse through controlled
fishing. This report details preliminary findings.
A quadrat size of 5 x lm is determined as the optimal size for
density determinations at the two research sites, Hope Is in the south of
Tasmania and at Meredith Point in the east. Measured densities of
urchins at these two sites are 2.8 ~ 1 1 % and 4.1 215% per m2
respectively (25 x lm quadrats used). Urchin sizes are greatest in
vegetated areas with smaller urchins in shallower waters in those areas.
Roe recovery as a proportion of urchin weight is least in barren areas.
Roe condition (colour and coarseness) deteriorates with increasing size
(age) of the urchin. The size at which deterioration occurs is site
dependant. Roe of urchins from barren areas is in poorer condition at
smaller sizes.
INTRODUCTION
History of Tasmanian Sea Urchin Industry Trial fishing for Heliocidaris erythrogramma began in Tasmania in the 1960fs, but most
the fish landed were poor quality and there were no established markets. The first quality roe
was landed in 1983 for a newly developed market in Melbourne. In 1985 three divers began
export sales to Japan sparking a speculative demand for licenses. In that year 250 commercial
licenses were issued.
Currently there are about 30 commercial divers working on sea urchins between St
Helens on the east coast and Dover in the south. Some are part timers, but about 15 work
systematically for not less than eight months a year, each aiming to land an average of 1 tonne
(live weight) a week. The divers use hookah gear and work mainly in pairs, although a few
work solo or with a deckhand. The total catch is taken inside the seaward limits of bull kelp.
About 95% of fish are retrieved from water averaging 4 meters in depth but in a few specific
areas divers work as deep as 25 meters.

Tasmanian Sea Urchin Developments
Until December 1992, virtually all sea urchins were sold live to two specialist
processors and exporters: Oceania Trading Pty Ltd in southern Tasmania and Tashimi Fish in
northern Tasmania. Oceania grades and ships the roe on traditional wooden display racks for
auction in Japan, employing three to four processing workers for each supplying diver.
Tashimi fish sells its roe in bulk for re-packaging overseas employing two to three processing
workers for each supplying diver.
Divers are paid for roe weight recovered. In late 1992 Tashimi Fish paid $26-kg;
Oceania $30-/kg. Prices in Japan for Tasmanian roe fluctuate considerably because of the
inconsistency of the product. In 1992 prices typically ranged between $A80- to $A120-/kg and
peaking at $250-kg.
Divers estimate total annual landings (to December 1992) at about 520 tonnes gross.
Annual Tasmanian roe exports are estimated by divers to be about 18.2 tonnes. The 1992 FOB
value of the fishery is estimated by divers to have been about $A2m.
Justification for present research aims At present the current fishery is unmanaged. Consequently the average roe quality is
poor and the harvest season is short, which results in minimal returns and prevents the fishery
realising its immense potential.
In many Tasmanian coastal areas, 'urchin barrens' are evidenced with reduced
availability of foods preferred by urchins, including the important native string kelp,
Macrocystis pyrifera. Denied sufficient food, vast colonies of sea urchins are unprofitable
because of their minimal roe weights while, at the same time, our observations indicate they are
devastating algal growth in the coastal zone to the detriment of other marine species and the
coastal ecosystem.
There is an urgent need therefore to develop cost effective, commercial enhancement
techniques for these key areas which will restore biological balance and maximise the fisheries
value and employment potential by increasing both roe weight and roe quality.
With the aim of optirnising this resource, funding has been allocated to Tasmanian Sea
Urchin Developments through the Commonwealth funding agency FRDC (July 1993, Pr. No.
931221) to initiate a pilot program to maxirnise Tasmania's sea urchin Resource.

Sea Fisheries Internal Report No.2
Research Sites The principal thrust of the project as detailed in the application entails manipulating
densities of urchins and monitoring resulting roe yield and quality. To this end two lease sites
have been allocated to Tasmanian Sea Urchin Developments for the project by the Division of
Primary industry and Fisheries, one at Hope Island in the south and the second at Meredith
Point on the east coast (see fig la-c) . These areas are restricted to other urchin divers allowing
control over experimental conditions.
Hope Island. Hope Island is an island 2-3 km from the jetty at Dover in Port Esperence (Fig. lb).
Rock type is predominantly dolerite. It receives slight swell action on its south east corner
during a large southerly roll (infrequent). Maximum depth for most of the island is less than
12m within lOOm of the island. A shallow sand bottom broken by occasional low reef, at less
than 6m depth extends from the north western side towards Faith and Charity Islands.
Macroalgal vegetation is confmed to a fringing rim to less than 2m depth for most of the
island except for the south eastern and the south western comer where the vegetation can
extend to the limit of firm substrate. The dominant algae on the wave exposed side consists of
Phyllospora comosa, Cystophora ntortiliformis, Acrocar'pia panrliculata and Carpoglossunz
confluens. On the more sheltered side, dominant algae are Phyllospora comosa, Macrocystis
pyrifera, Ecklortia radiata, Cystophora retroflexa and Sargassrrm fallax.
Below the fringing algal rim, the rocks are mostly bare except for some encrusting
coralline algae. Most of these 'bare' rock surfaces are free of silt or turfing algae possibly due
to the action of tidal currents in the area (tidal range of approx. 1 meter) and/or the action of
herbivores continually scraping the rock surfaces. These areas are termed 'urchin barrens'.
Caulerpa species can be found on the sand adjacent to the reef and the seagrass , Heterozostera tasmanica is found further out on the sand. Also on the sand on the north
western side shells and shell fragments are common. Occasional urchins can be found on the
sand in this area using the fragments for camouflage.
Anecdotally, Hope Island is poor for sea urchin roe recovery with only the infrequent
bin harvested. This reflects the situation for much of the D'Entrecasteaux Channel.
Meredith Point In contrast to Hope Island, Meredith Point (Fig. lc) is an area of good recovery in
terms of urchin roe yield. According to local divers in 1992, 10-20 tonnes of urchin were
harvested from this approximately 2.0 km of shoreline. The substrate here is predominantly
4
--

Tasmanian Sea Urchin Developments
dolerite with sandstone towards the western edge of the lease area. Depths are maximum on the
eastern side where they can reach 8-12 m within 100 m of the shore. From the south eastern
comer of the shoreline, a reef extends south outside the lease area to approximately lkrn (?)
off-shore, averaging 4-5m depth to the top of the reef. For the remainder of the site, the reef
meets the sand at 4-5 m depth.
On the eastern section of the lease area, there is a band of macroalgal vegetation in the .
shallow water with barrens below. This band consists mainly of Colpomenia sp., Zonaria sp.,
Cystophora spp. and Cazllocytsis cephalinorthis. Below this the rocks are bare until the reef - sand edge where Caulerpa flexilis is dominant. Over the 'bare rocks' a fine turfing alga is
common along with much silt. The introduced algaundaria pinnatifida is a rapid colonizer of
these bare areas in the spring. Growth is fastest in the shallows for Undaria with a climax in
late summer.
From the south eastern corner to the western edge of the lease, macroalgal cover
extends from the low tide level to the extent of hard substrate. Cystophora spp., Sargassum
sp., Acrocarpia panniculata, Caulocystis cephalinorthos and Zonaria sp. are common in the
shallows. Sargassum fallax (?), Caulerpa jlexilis and other Caulerpa spp. become more
common in the deeper waters (>2m). Heterozostera tasmanica is on the sand beyond the reef
edge.
Tasmania's predominant swell direction is from the west. Easterly swells are infrequent
and are more likely to occur over the summer period. Meredith Point is protected from direct
easterly swells by Maria Island but occasional swell action can be quite significant.
The following report details preliminary investigations in these two lease areas. The
investigations can be divided into three parts: 1. Determination of appropriate quadrat size for sampling urchins (QUADRAT SIZE). ,
2. Size frequency of test diameters and roe analysis at the two lease sites (SIZE
FREQUENCY AND ROE ANALYSIS) and
3. Mapping of vegetation, substrate and urchin numbers at the two sites (MAPPING
OF LEASE SITES).
Urchin divers associated with Tasmanian Sea Urchin Developments used in this
program to be acknowledged are Will James (WILL), Maurice Le Rossignol (TINY) and
Mathew (MAT).

Sea Fisheries Internal Report No.2
1. QUADRAT SIZE
To ensure optimal sampling strategy in determining density of urchins at the various
sites, quadrats of varying sizes were tested.
METHOD
To determine appropriate quadrat size, five sites were sampled at the two lease areas
(see fig.lb). At each of these five sites, at sections of the coast chosen arbitrarily, a meter
square quadrat was laid down successively 25 times parallel to the shore at both 2m and 5m
depth (see fig. 2). Urchins were counted in each quadrat with the number below 40mm
(estimated) noted. By combining quadrats in various combinations, the precision of using
varying quadrat sizes for calculating urchin density could be determined (see Andrew and
Mapstone 1985).
The haphazard selection of quadrat/transect locations gives an indication of urchin
densities and variation at both the sites.
Figure 2 Diagram showing quadrat arrangement in relation to the shore and subsequent
B groupings for varying quadrat size.
. . SHORE
5m Depth
Quadrat Grouoinas
The factor of depth has been included as Dix (1970) noted changes with depth in his
reports on H. erythrogamma in Tasmania. Also divers claim better return in shallow waters

Tasmanian Sea Urchin Developments
compared to deep and personnel observation indicates that barren areas in sheltered waters tend to be in deeper water (>2m).
Two divers were used to conduct density determinations at Hope and one at Meredith.
The principal investigator did the deep quadrats at both sites and the shallow at Meredith, while
'TINY' did the shallow at Hope Island.
Auto correlation between successive quadrats would also be tested to determine the
necessity for random allocation of quadrats.
RESULTS
1. Quadrat size As might be expected, the quadrat size for greatest precision for equivalent number of
quadrats is the largest: 25 x lm (fig. 3), although there is little difference between these, 5 xlm
, 10 x l m and 20 x lm sizes. As searching time is linearly related to the area searched, 5 x lm
quadrats would appear to give the best result for least time involvement.
The mean standard error as a percentage of the mean (also a measure of precison) for
various clumpings of 5 x lm quadrats indicates a minimal area of 15 quadrats to be sampled for
acceptable precision of less than 15% (fig. 4).
The 1 x lm quadrats are used for density estimates in Figure 5a. This is not statistically
correct however due to the sampling strategy (quadrats not randomly allocated) and some auto-
correlation was detected (fig.5b). They do indicate however a trend of higher density of
urchins in the deeper waters which is confirmed when the 25 x lm quadrats are used to
compare density differences for the two depths at both the sites (Table 3).
The low mean values for urchin numbers for 1 x lm quadrats ( 4 ) also indicate that a size of at least 5 x lm quadrat would be more appropriate for sampling (urchin numbers >15).
Auto-correlation was checked by plotting quadrat density readings against subsequent
readings (fig.5b). These indicate a high correlation for shallow quadrats and not significant for
deep at both sites for 1x1 m quadrats.
DISCUSSION
Quadrats of 5 x lm appear to be the optimal size for best precision and minimal time
commitment. They also result in a reasonable number of urchins per quadrat for easy

Sea Fisheries Internal Report No.2
comparison. The higher variation in density readings for the 1 x lm quadrats is probably a
reflection of patch size in the distribution of these animals.
2. SIZE FREQUENCY AND ROE ANALYSIS.
Measurements on variation in gonad condition and size were required on which to base l-af&r-s-&nj str&te@-e-SS- - - - - - - - - - - - - - - - - - - - - - - - - - - - - - - - - - - - - - - - - - - - - - - - - - - - -
METHOD
At four arbitrarily chosen sites within both lease areas 100 urchins were harvested at 2m (shallow-'St) and 5m depth (deep 'D') for measurement of diameter and weight (NB: different
sites to Section l., see fig.s l b & c). This was done on 4.7.93 at Hope Island and 22.7.93 at
Meredith Point. All urchins seen were collected eliminating bias towards any particular size.
Boulders were not overturned but crevices and nooks examined. At two of the sites within each
lease, 25 urchins were sub-sampled from each 100. Roes were dissected out and weighed in
the laboratory (DPIF, Taroona) and condition and sex noted (results also include urchins - - - - - - - - - - soUectedat secondgonad sampleAwg, 19931: Percentage-recovery was determined as:
- - - - - - - - - - - - - - - - - - - - - - - - - - -
1 (wet weight of roe /the wet weight of the total urchin) x 100
The condition of roes has importance commercially. Colour and coarseness is
considered. For colour, a coding from white (I), yellow (2), orange (3), brown (4) and black
(5) was used. For coarseness, roes were divided into very fine (VF), fine (F), coarse (C) and
very coarse (VC). Male urchins tend to have finer roe.
'A' grade roe, suitable for the Japanese market, is white-yellow and fine-very fine. 'B'
grade roe includes these and orange and coarse grades. In 1992 'A' and 'B' grade roe was
processed by the northern Tasmanian processor. In 1993 no market has been found for 'B"
grade roe. . . . . . . . . . . . . . . . . . . . . . . . . . . . . . . . . . . . . . . . . . . . . . . . . . . . . . . . . . . . . . . . . . . . . . . . . . . . .
RESULTS
Hope Is. Modal test diameter at Hope Is is 65-70mm. Mean test diameter is greatest at the more
vegetated sites. Generally there was little difference between sites and between shallow and

Tasmanian Sea Urchin Developments
deep at each site (figs 6-7, table 1) except at the more exposed (2s & D) andlor vegetated
locations (5S* -not presented; mean diameter: 79.0rnrn H . 8 s.e., sampled Aug. 1993).
Percentage recovery of roe (figs 8a & b) is least at site 1-deep (ID). This coincides with
an area barren of larger thallose algae.
TABLE 1. Mean size of urchins (mm, +I-s.e.) collected at both lease areas from all sites.
HOPE MEREDITH ISLAND POINT
SHALLOW
DEEP
OVERALL
Meredith Point Modal test diameter at Meredith Point is 80-85mm. There is a tendency for urchins with
larger tests to be in the deeper water (fig. 10-11, note that 2 s and 2D are not directly
comparable as they correspond to different areas of the coast).
Percentage recovery of roe (fig 12) is least at site 1-deep (ID). This coincides with an
area barren of larger thallose algae. The sampling size of 25 appears to be sufficient to
discriminate percentage roe recovery of urchins from barren and vegetated areas.
Gonad Condition A line of best fit using a quadratic equation of all urchins harvested so far is presented
for both sites in Fig. 13. This includes all urchin (a) and only those urchins from outside the
barrens (b). Note the higher recovery for urchins outside the 'barrens'. All fitted curves are
significant at at least the .05 level despite the apparent wide spread of points. A quadratic
equation was used as this was the anticipated relationship between % recovery and diameter
based on anecdotal evidence. The result presented here is not necessarily proof of the
relationship however.
* Code relates to transect number (see section 3.) and 'S' to shallow. Warning! note that as the numbering system for sections 1,2 and 3 are similar and shallow IS' and deep 'D' are the same beware of confusion in interpreting results).
9
-

Sea Fisheries Internal Report No.2
Judging coarseness of the roe tends to be very subjective and discrimination is not
always consistent. Results show a statistically significant difference for the diameter of urchins
with differing colour roe however. Undesirable roes (very coarse and brown-black
colouration) tend to occur in the larger urchins (>80rnm) and optimal recovery is obtained from
mid sized animals (65-85 mm diam., fig. 14 & 15) but this can be site specific (fig. 16-18) ie.
barren areas with smaller urchins have coarser, discoloured roes at a smaller size.
Percentage recovery of roe from monthly samples for the first four months (July-Oct.)
for both sites is depicted in Figure 19. They demonstrate consistant significant differences in
roe recovery of urchins from 'barren' areas compared to vegetated areas for both the sites and a
gradual overall increase since the start of monitoring.
DISCUSSION
Overall mean diameter of urchins is similar for shallow and deep waters but there is a
tendency for a greater test diameter in deeper waters on the more exposed vegetated sites. This
may be due to some grading as a result of the swell action and limited mobility due to the algal
cover. Greater vegetated sites in general tend have larger test diameters.
Percentage recovery of roe is least within the barren areas but can be good at the barren-
weed fringe (<2m depth). This agrees with diver experience.
Although percentage recovery from the urchins in this trial appears good relative to
optimal diver recoveries (approx. 4-6 %), if undesirable roes here are eliminated, then overall
percentage recovery is greatly reduced (Table 2). Introducing grading of urchins using a cutoff
based on the results of increasing coarseness and decreasing colour with agelsize (figs 14 and
15) increases percentage recovery. This indicates a greater return for divers who are selective in
their sizes when harvesting (Meredith Point only). These results may be improved again if
confined to 'good' (vegetated) areas only as the results here include barren areas.
TABLE 2. Overall percentage recovery for 1) ' A' and 'B' grade roe and 2) 'A' grade only. HOPE IS. MEREDITH POINT
Total Urchin Roe
Wt. Wt. % (gm) (gm) rcvry
TOTAL 26670 1) 964.7 3.6 2) 312 1.2
c75mm 9807 1) 342.8 3.5 diam. 2) 103.7 1.1
Total Urchin Roe
WT. Wt. % (gm) (gm) rcvry
TOTAL 23997 1) 1428.8 6.0 2) 555.7 2.3
c78mm 11224 1) 817.2 7.3 diam. 2) 321.7 2.9

Tasmanian Sea Urchin Developments
3. MAPPING OF LEASE SITES.
Knowledge of the vegetation, substrate and urchin density distributions at the two sites
were required before the pilot study is to proceed.
METHOD
Both sites were divided into equidistant sections. These have been marked with
numbered boards at both sites to enable re-location. Transects were run perpendicular to the
shore at each of these marks (see fig.lb & c). The transect line consisted of a lOOm length of
7mm rope marked every meter with lead 'net' weights and canvas 'flags' every 5 meters with
the distance inscribed. Using a meter length of PVC pipe, urchins were counted for five meter
lengths of the transect line within a distance of a meter from the line. Two divers were used for
each transect.
The divers did alternate 5 meter sections contiguously (see fig.20). Diver 1 (principal
investigator) used a 0.25m2 quadrat, laid at each 10m mark (always starting from '0') to record
vegetation cover. The quadrat was divided by seven lines running horizontally and vertically
giving 49 intersection points. These and one of the corners gave 50. Substrate was divided into
Reef, Boulders (0.5-1.0m diam.), Rocks (0.1-0.5m diam.), Rubble (0.02-0.lm diam.), Sand
and Shells. Algae were divided into species as best as possible underwater. Algal cover and
substrate were given a reading based on the number of points intersected. Total cover for algae
can come to a number greater than 50 due to successive layers of algae.
Figure 20 Diagram showing contiguous arrangement of quadrats about the transect line
(numbers are distance along the transect line in meters).
0 5 10 15 25 etc
Diver 2 [ Diver 1
Recordings were made only for the extent of hard substrate as urchins are not generally
not found on sand.
-

Sea Fisheries Internal Report No.2
RESULTS
Figures 21 - 28 are a graphical representation of results. Algae have been identified tc
species level in the field but clumped to give representation as indicated. Full details of al:
species are available on request.
Barren areas are distinguished by few fleshy algae (excluding filamentous varieties anc - -
thus probably ephemeral-and high cora1Iinexad~-(a Hope Island) or high -fine turf r e a d w
(at Meredith Point).
Figure 29 shows the difference between counts for the divers for alternate contiguous
quadrats. The chief investigator (JCS) did all transects. Other divers (WILL, TINY and MAT:
counted contiguous quadrats. Overall there appears to be little difference between divers.
Figures 30 & 31 show the relationship between various parameters and urchin
numbers. To reduce the effect of the availability of substrate on urchin numbers, quadral
readings with substrate counts of less than 25 (50%) have been eliminated where indicated. A
number of parameters (Total Algal Cover, Fine Turf, Encrusting Corallines etc.) were plotted - - - - - - - - - - - -
I ag&s~mchin numbersbutpresented here only where possible relationships are evident.
- - - - - - - - - - - - - - - - - - - - - - - - - - - - - - - -
Hope Island Urchin numbers show a reduction with depth. There are also negative correlations with
cover of encrusting coralline algae and Larninariales.
I Meredith Point Again a reduction in numbers of urchins is noted with depth. This occurs also with total
cover of brown algae but not total Laminariales cover as for Hope Island.
I
Auto-correlation A correlation between successive quadrats (fig 32) along the transect line at both sites is
noted. This is due to the apparent reduction in numbers with depth. Stratification of the
----r ~ - - - ~ ~ ~ - - - - - - - - - - -
densitv.
Estimates of urchin densities do not differ significantly from estimates made in section : (see Table 3) especially if auto-correlation is considered and the consequent actual increase il
uncertainty of error.

Tasmanian Sea Urchin Developments
TABLE 3. Comparison of urchin density estimates made from section 1 and section 3 standardized to 1 x lm &s.e.)
Orig. Density Est.s Final Density Est.s (25 x lm quad.s) (5 x lm quad.s)
SHALLOW DEEP OVERALL OVERALL
Hope Island 2.2 3.5 2.8 2.4 +lo% - - +9% - +11% - +8%
Meredith Point 5.7 2.5 4.1 3.2 +12% - - +8% - +15% - +9%
DISCUSSION
Findings so far are consistent with research in California and Canada. Evidence
supports urchin mediated barren areas in coastal areas around Tasmania. Densities are highest
at the edges of these barrens with a lower density of urchins required to maintain the barren
condition. Urchin distribution is determined by wave action and can act preferentially against
larger urchins. Most barren areas do not extend beyond less than 2 meters depth due to wave
action.
Urchins with the highest percentage recovery of roe by weight are generally found in
more highly vegetated areas or at the edges of the barrens.
Larger urchins tend to have undesirable roe. Cutoff sizes for optimal roe condition are
site specific however, being lower within barren areas. This suggests that roe condition may be
age related and urchin in slower growing areas such as are believed to occur in barren areas
have poor roe at smaller sizes.
Monthly samples of roe condition at both sites indicates an increase from winter to early
summer, with urchins from barren areas consistantly having significantly less percentage roe
recovery than those from vgetated areas.
Anecdotal evidence suggests good roe recovery also occurs in deeper water (10-30 m)
tidal areas such as in the middle of the Mercury Passage and at the top of the DtEntrecasteaux
Channel. Urchins presumably feed on drift algae in these areas. At present, these areas will not
be considered as part of this program.

- - Sea Fisheries Internal ReportNo.2
Proposed program July1993 - July1996 FRDC Grant
The initial program as detailed to FRDC entailed principally manipulating densities at
the two sites and monitoring recovery with the anticipated result of improving gonad condition.
The means of determining density will be achieved by different harvesting regimes. To this end
both lease sites will be sub-divided into nine sections.
At each of the sites three of the sections will remain un-fished until the final year of the
program in the summer of 1995 (control areas). Three of the sections will be fished in 1993
and 1995 and three will be fished in all three years 1993,1994 and 1995.
Fishing intensity will be severe, with a revisit after at least a month to re-harvest for any
missed fish. Catches from each of the sections will be carefully monitored All sections will be
fished in the spring-summer period. Urchins only greater than approx. 60mm will be harvested
as results from above indicate that urchins below this size have minimal roe recoveries
(probably immature) at both lease areas.
Meredith Point, the sections will be large eno-ugh (80-100m along the shore) that
mt : of urchins between areas will be minimal. Buffer zones will be utilized. At Hope
Island, where wave action is minimal it is likely that fences will be used. These are presently
being trialled. Sections will be a lot smaller here at 20-30m of shoreline.
Thc e two dj lfferent method: qed to subdivide the coast are done so for practical
(fences are easier to implement at Hope Island) and economic considerations (Meredith Point
can presently be fished profitably while Hope cannot). T )f smaller areas at Hope Is.
ensures minimal time involvement at this site.
he use c
Monitoring the sites will be done on a quarterly basis. Monitoring will consist of
transects, size frequency analysis and gonad condition.
Transects Transects will be conducted for urchin density determinations and vegetation analysis.
The actual methods used at each site are determined by the results of this preceding report.
There will be two for each section, both cross shore, one at 2m depth and one at 5m depth using 1 x 5m quadrats.

Tasmanian Sea Urchin Developments
Size frequency analysis This will be done to monitor the new age class moving through the population and in
conjunction with the gonad analysis and density determinations give an indication of tors!
gonad harvestable. It will probably consist of 100 animals from 2m and 5m depth.
Gonad condition At each quarter 25 urchins will be harvested at 2m and 5m depth within each of tLe
sections. These will be analysed for roe condition and percentage recovery.
Other aspects to the program are the surveys, monthly gonad analysis at both sites .-2
some growth and movement studies.
Surveys Transects to determine the relationship between vegetation cover and urchin density .-
being conducted at a number areas to deteimine a possible 'critical' density for the formation p i
urchin barrens. Data will also indicate how representative the lease areas are of conditicrs
generally and the possible application of management procedures trialled generally. This r r . 2 ~
include a visit to the north coast and may result in the spin-off of opening further areas for
fishing.
Monthly Gonad Analysis Twenty five urchins are harvested from a barren area and a 'good' vegetated area every
month at both the sites outside of intended treatment areas. This gives a record of variation with
time of gonad condition and may lead to an insight into the environmental cues for improved
gonad condition and spawning periods. Temperature loggers are being installed at both sites.
Growth and Movement Studies Some urchins will be tagged at both sites and movement and size measured regularly,
probably in conjunction with the regular sampling for gonad condition.
The urchin divers associated with the program also intend small scale pilot projects.
These consist of transplanting small unproductive urchins to to higher productive areas within
the sites and monitoring recovery and trying to re-initiate the growth of Macrocystis pyrifera. These aspects however have low priority.

I 1 I I
Maps showing location of lease areas. See over page for greater detail.
TASMANIA
MEREDITH POINT


Figure 3 Graphs of precision levels for varying quadrat sizes where precision: SELF. Results are mean precision calculations for groupings of 5 quadrats.
HOPE ISLAND
- DEEP
- SHALLOW
A
+
I l ' " ' l " " l " " i " " l " " ~
0 5 10 15 20 25
QUADRAT SIZE (MI
" DEEP - SHALLOW
QUADRAT SIZE (M)

Figure 4
Graphs of standard deviation and standard error as a percentage of the mean versus replication of 5 x 1 m quadrats for both sites.
Meredith Point
0 10 20 30 40 50 Number of quadrats
Number of quadrats

a) Density of urchins as determined from 1 x 1 m quadrats at sites in the two lease areas. Note that as quadrats were not randomly
placed and auto-correlation (Fig 5b) confidence is reduced.
I Hope Is.
'barren'
I 'barren'
I o ! I 1 I I I I I I I
SITE IS S SITE 2 D SITE 3s SITE 3 D SITE 4s SITE 4 D SITE 5s SITE 5 D
SITE
Meredith Pt ,
'barren'
o ! I I I I I I I 1 I 1 'I
SlTE IS SlTE I D SITE25 SlTE 2 D SlTE 3s SlTE 3 D SlTE 45 SlTE4D SlTE 5s SITESD
SITE


Figure 6
Urchin wet weight versus diameter for individual sites (a) and for all sites (b).
HOPE ISLAND DATA, SAMPLED: 15.7.93
m . , . . . 30 4C I 60 70 80 90 160
TEST DIAMETER (MM)
TEST DIAMETER (MM)

Figure 7.
Mean b s t diameter for the sibs a t Hope Island with a breakdown of sizes for all sites (6c) and for each site (6 c -j 1.
HOPE ISLAND DATA, SAMPLED: 1 5.7.93
1 S 1 D 2s 20 35 3D 4s 4D SITE
9SW Error Bars 90-
85-
r r
80- W
ki r 75- 4 - 0
b 70- W I-
t , I I I
(a)
i
i ! 'barren'
'barren' *,,,en1
i i 60-
i I I I I I I I
: -
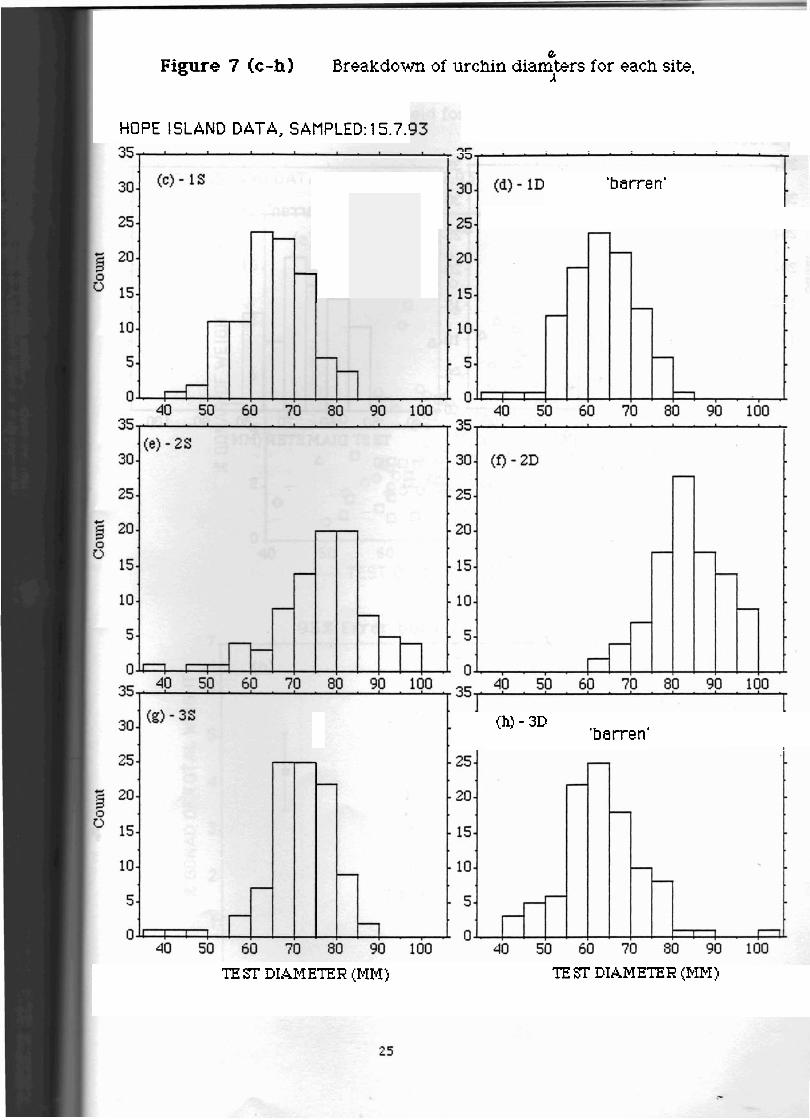
e Figure 7 (c-h) Breakdown of urchin diamters for each site,
A
HOPE ISLAND DATA, SAMPLED: 15.7.'
'barren'
'"-" 'barren'
TE ST DIAMETER (MM) TE ST DIAMETER (MM)
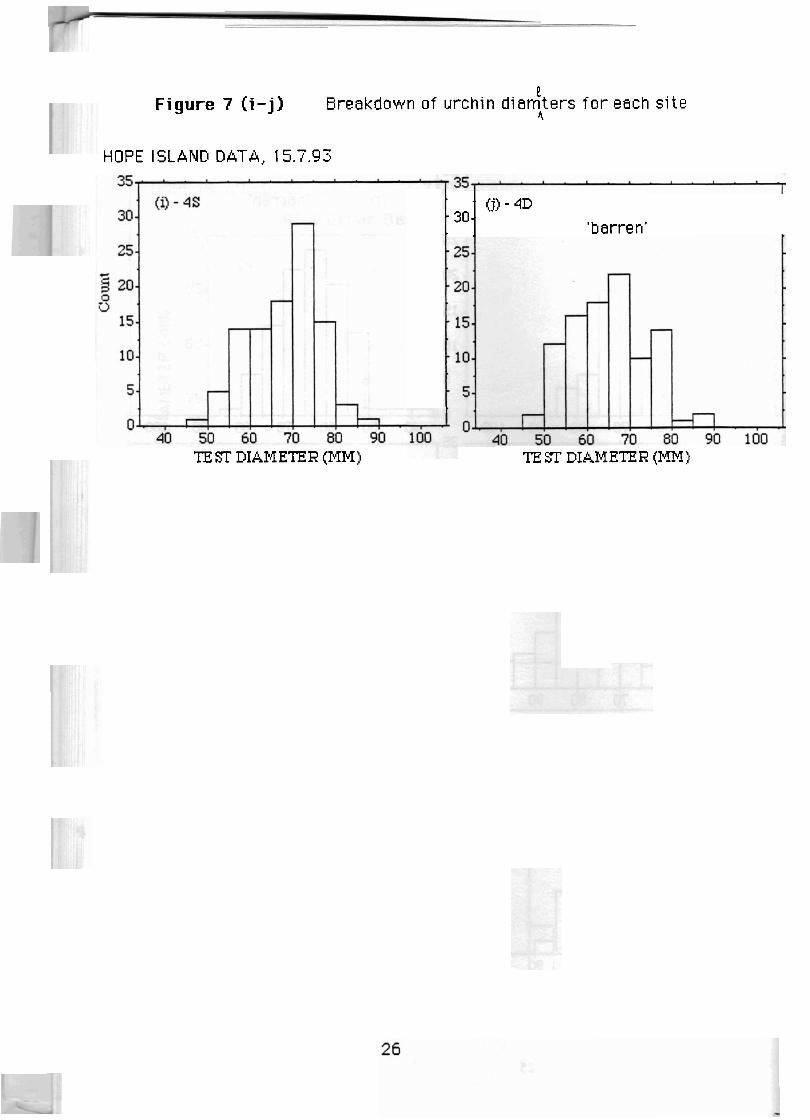
e Figure 7 (i-j) Breakdown of urchin d iamters f o r each s i t e
4
HOPE ISLAND DATA, 15.7.93
TE ST DIAMETER (MM TE ST DIAMETER (MM)
3 0 1 (I)- 4D 'barren'

Figure 8
Test diameter versus gonad yield for all sites (a) and mean values for each site (b).
HOPE ISLAND DATA, SAMPLED: 15.7.93
90 100 TEST DIAMETER (CM)
95% Error Bars 7,
% 6- (3 - Y
'
2- 5 1 Q I- p, 4 LL. a a 3 4 - L . 0 (-3 2 . IX
1 -
0 -
I I I I
(h'
I 1 I : I
'barren'
h
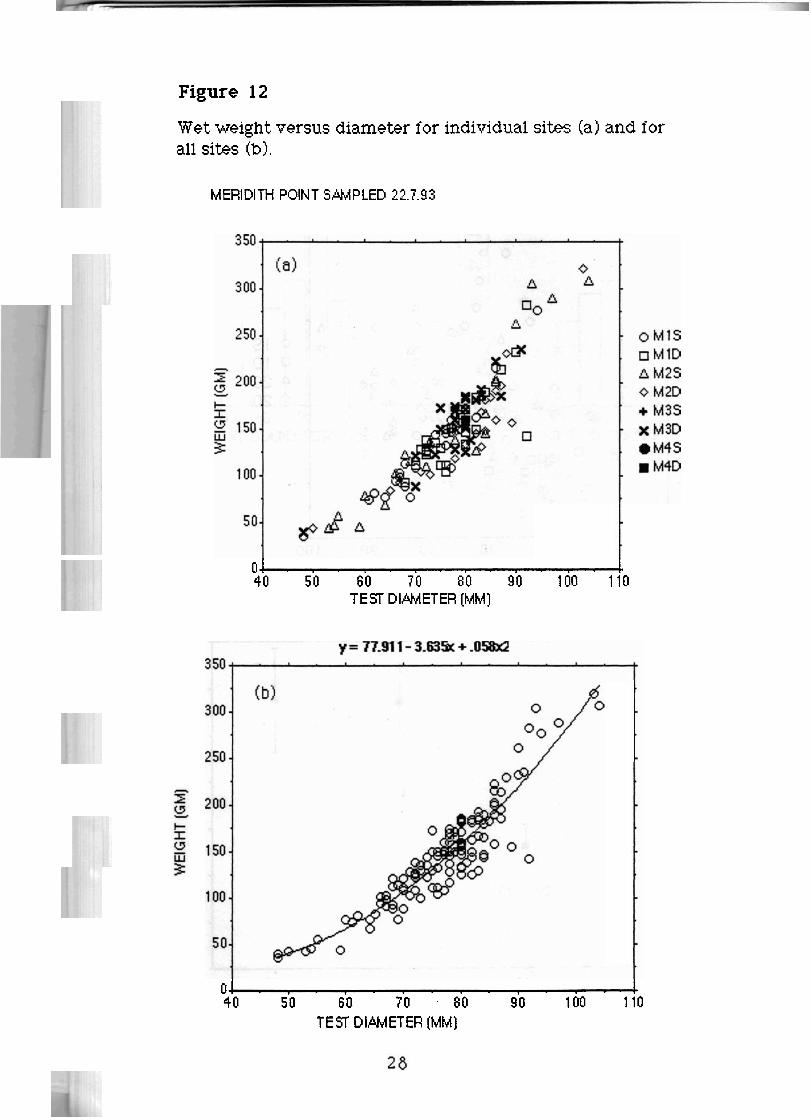
Figure 12
W e t weight versus diameter for individual sites (a) and for all sites (b ).
MERl Dl TH POINT SPMPLED 22.7.93
0 4 . ~ . C 40 50 6 0 7 0 8 0 9 0 100 110
TEET DIPMETER [MM]
04 1 40 5 0 6 0 70 8 0 90 1 00 110
TEST DIPMETER [MM]

Figure 1 1,
Mean test diameter for the sites at Meredith YL { I la) with a breakdown of sizes for all sites ( 1 I b) and for each site ( 1 1 c -j 1.
72 I I I I , I I I L M I S MID M2S M2D M3S M3D M4S M4D
SIT E
MERlDlTH POINT SPMPLED 22.7.93
TEST DIMETER [MMj

Figures 13 c-j, breakdown of urchin diamsters for sach site (n= 100, for each sample).
MEREDITH PClNT SMPLED 22.7.93.
'barrens'
. DIAMETER (MM) DIAMETER (MM)


Figure 12
Test diameter versus gonad yield for all sites (a) and mean values for each site (b).
MERl Dl TH POINT SPMPLED 2.2.7.9 3
L J
0 n 0.1 - x . - n n n n n
40 5 0 w - - . - . - .
6 0 7 0 80 9 0 . 100 110 T E 9 DIPMETER [MM]
MERl Dl TH POlN T SAMPLED 22.7.9 3
9 s tir# mu3
M 1 S SIT E


FIGURE 14 Graphs of mean diameter versus (a) colour and (b t>) texture for all sites a t Hope Island.
95% E r r o r Bars 40 I I I I I
HOPE ISLAND - COLOUR I
5 5 ................... ...................................................................................................................................................................... : 1 6 41 40 38 1 3 7
50 I , , I I
1 2 3 4 5 COLOUR
TEXTURE
urchins 95% E r r o r Bars
40 --
8 5
80 .
7 5 - E E 70 w
cc W
65 W r Q - 60 n
55 .
50- F C VC
I I
HOPE IS - TEXTURE .... - ................................................................................................................................................. ..............................
..................................................................................... .......................................................... .............................. i i ............................. .. ........................................................................................................................................................... i ...........................-......................................................................................................................................................
........................................................................................................................... - .............................. ....-
...........................................................................................................................................................................................
.............................................................. " .............. " .. ........................................................... 53 55 IS+
............................
..............
I I I

FIGURE 15 Graphs of mean diameter versus (a) colour and (b) texture for all sites a t Meredith Point.
95% E r r o r Bars I I
(a) MEREDITH POINT - COLOUR. -
95% Error Bars 951 I I I I
I
.
90 -,
85 -
(b) MEREDITH POINT - TEXTURE. -
B -.

Figure 16 Comparison of sites within Hope Is (a) vegetated area (b) 'barrens' area for colour.
95% Error Bars '30
Colour
3 4
Col our
I 1
..............................................-.....
-3
. (a)
......... ... ; .
-
I I
HOPE I S - 1D .....................................................................................................................
..... ..
-."..*
.......................................................................................................................................................................................
II i .......................................................................................................................................................................................... l, f . I ............................................................................................................................................................................................
....................... ............................................................................................................................................................
................................................................................................................................... " ........................ " .............................
............................................................................................................................. .. ...................................................... 2 15 19 1 1 3
I I I I I

Figure 17 Comparison of sites within Hope Is [a) vegetated area (b) 'barrens' area for texture,
95Z E r r o r B a r s 90 - I I
L
[a) HOPE IS - IS 85 ....... - ..-........ "...-..
8 0 ..-.. "......-....-..-
Texture
95% E r r o r B a r s
I (b) HOPE IS - 2D I
Texture

Figure 17 Comparison of sites within Meredith Point for (a) vegetated area and (b) 'barrens' area for colour-
(a) 95% E r r o r Bars 95-
g 0.
r? 8 5 E C r
80 L Q) d
75 h
a .- 0 7 0.
.
6 5 .
6 0
55-
(b' 95% E r r o r Bars
1 2 3 4 5 Col our
I
MEREDITH POINT .....................................................................
............................................................................
........................................................
.............................................................................................
1 I
,
-
-
95.
g 0 - E 8 5 E w
8 0. 4 al
(R E 7 5 .C
a 70
6 5.
60.
55' 1 2 3 4 5
Col our
3s
I t I I
- 2D .. .......................................................... " ......................................................
............................................................................................................ -
!. ...........................................................................................................................
.................................................................................... f .............................................................................................................................. " .................... ...............................
............................................
2 25
I 1 : .......................................................................................................................................... "."
.....................................................................................................................................................................................
9 8 I I I I
I I I
.
-
MEREDITH POINT - 5s ............ ..........................................................................................................................................
................................................................................................................................... .....................................................
................................................................................. .. .......................................................................... ......
......... ............................................................................................................ .... .....................................................
1
.... ..............-
...................
- - I 1
I " " "
...... .. ........ -.. ................ " .................. .................................... ..........................................................-..............*...
".
- --.**------..
.................
.....................................................................................................................*..*.................*..............*..... -... ........................
4, ................................................. " .................................................................................................................... 8 14 2 1 4 3
A I I I I

Figure 1% Comparison of sites within Meredith Point for (a) vegetated area and (b) 'barrens' area for texture.
95% Error Bars 95 I I I 1
MEREDITH POINT - 2D -......-.-...-..-...-.-am... "." ..... ..... .................... " .... " .... " ............... " ..................................... .. .... ".... ............... ..." ........ " .................
............................................................................................................................................................................................. II . .................................................................... .....................................................................................................................
............................................. " ............................................................................................................. .. ........................... I I
................................................................................................................................... " ...................... " ................................
..... - ......................................................................................................................................................................................
........................................................................................................................................................................
3 &
16 27 0 - F C Texture
95% Error ears /
MEREDITH POINT - 55
Texture

FIGURE 19 (a &b> Graph or' mean percentage recovery of roe for a barren area and a vegetated area and k&d) mean diameter of processed urchins a t both sites for July to October 1993
95% E r r o r Bars 1. I I I
I . 0. (a) HOPE IS
9m - - - - - -
0.
7.
6; I
5
4 2~ 'barrens'
31
2.
95% E r r o r Bars 18 I I I I
24.8.93 23.9.93 DATE

Fl GURE 1 9 (c&d) Mean diameter o f processed urchins from monthly sampleS,25 urchins i n each sample and I D J 2DJ 20 and SS
refer to location w i th respect to transect numbers.
95% Error Bars 00- 1 I 1
I
95. (c) HOPE IS
90- 1 D
80
DATE

FIGURE 21 Graphs of distance versus depth for each transect at Hope Island.
T n n s e c t NO. o Transect No. 6
-16 -16 1 0 10 20 30 40 50 60 70 80 90 100 0 10 20 30 40 50 60 70 80 PO 100
DISTANCE (rn) DISTANCE (rn)
1 ' -16 -16! l i 2. 3u 40 50 60 70 80 90 160
I
0 IC 20 30 40 50 60 70 80 SO 1OC1
DISTANCE (m) DISTANCE (rn) TrlnSBCt NO. 1 Trancect No. 7
Tmnsect No. 3 0, 1
0.
-2'
4
2 -6. - E -8. a Y =- lo.
-12
-16 ! 0 10 20 30 40 50 60 70 80 90 100
DI-ANCE (m) Transect No. 4
OF, I
-6 E - r -8
1 ?::
-16 i 0 10 20 30 40 50 60 70 00 90 100
DISTANCE (rn) T n n s e c t No. 5
- I & -16. 0 & 10 . 20 . 30 DISTANCE 40 50 (m) 60 70 80 90 100 -14 -16 !! 0 10 20 30 DISTANCE 40 50 (rn) 60 70 80 SO 100
Transect No. 2 u Transect No. 8 0.
-4 0
- -6
. -12.
. -14.
Transect No. 9
t 0 10 20 30 40 50 60 70 80 90 100
DISTANCE (m) Transect NO. 10
t 0 10 20 SO 40 50 60 70 80 90 100
DISTANCE (rn)
Transect No. 1 I
e X- 10.
-12. -12
-14 -14.
-16 10 20 30 40 50 60 70 80 90 1
DISTANCE (rn) DISTANCE (m)

I FIGURE 22 Graphs of substrate type versus distance for Hope Is. T r a n s e c t NO. o
5 I) - x TOTAL HARD B O T T O ~ i REEF
o ROCKS
0 l o 0 DISTANCE (m)
T m s e c t No. I
0 0 0 I 0 10 20 3 0 40 50 6 0 70 80 9 0 100
DISTANCE (m) T r a n s e c t No. 2
I T
T r a n s a c t No. 3
0 0 0 0
0 10 20 3 0 JO 5 0 6 0 7 0 8 0 100 DISTANCE !m)
T r a n s e c t No. 4
5lSTarfCi im) T r a n s a c t No. 5
T m n s e c t No. 6
\ 0 U Y Y Y Y Y Y
0 I 0 20 % z 5 3 63 fO 8.0 6.0 100 DISTANCE (m)
T m n s e c t No. 7
.
1 2 20. U
10.
0. - u u - u - u - u .
0 27 fO 5 3 6 3 7 5 87 97 100 DISTANCE (m)
T m n s e c t No. 8
Y
q 3 0
d > 20
10 : 0 0 10 \= 20 30 DISTANCE 40 = 50 = (m) 60 5 80 x , " : 8 100
T m n s e c t No. 9
DISTANCE (m)
T r a n s e c t No. 1 0
OISTANCE (m) T r a n s e c t No. 1 1
I 10 t o 50 80 SO 00 70 ao $0 100
DISTANCE (m)

FIGURE 23 Graphs of algal cover versus distance for transects at Hope Island.
T r a n s e c t No. 0 T r a n s e c t No. 6
x TOTAL FLESHY ALGAE o F l H i TURF A CORALLINES
', %\.,
561 I
. 10 20 30 4u 50 60 7u 0 90 100 DISTANCE lm)
T m n s e c t NO. I
f 0 . . - . . - - - - - - -
Cv 1Co 20 3Ce 40 50 60 7q:. 2:s 90 100 DISTANCE (m)
T r a n s e c t No. 7
o j L = - = , , , - , I I
0 i3 20 30 40 50 60 70 60 90 100 DISTANCE (m)
T r a n s e c t No. 6
50 60 NCE (In)
T m n s e c t No. :
:.I-
- - - - - - - - - - - - - - - 0 10 20 30 40 50 60 70 80 90 100
DISTANCE (m) DISTANCE (m)
T m n s e c t No. 9
DISTANCE (m) T m n s e c t No. 4
f = 3 0 0 = 20
10 !:kkb7T 0 0 10 20 3 0 DISTANCE 40 50 (m) 6 0 7 0 # : : : 80 90 100
DISTANCE (m) T m m e c t No. 10
T m n s e c t No. 5 70, . P
T m m e c t No. I I
60 0
DISTANCE (m)

FIGURE 23Graphs of number of urchins in quadrats versus distance for transects at Hope Island.
Transect NO. 0 45
40.
35.
30.
g 25. : 20. L1 a 15.
0 10 20 30 40 50 60 70 80 90 100 DISTANCE (m)
Transect NO. 1
Transect No. 2
30
Transect No. 3
10
51
0 0 10 20 30 40 50 60 70 80 90 100
DISTANCE (ml Transect No. 4
Trensect No. 6
40.
35
30.
g 25.
20. L1 a 15.
0 10 20 SO 40 50 60 70 80 90 100 DISTANCE (m)
Transect No. 7 45
40.
35.
01 1 0 10 20 30 40 50 60 70 80 . 9 0 100
DISTANCE (m) Transact NO. 8
DISTANCE (m)
Trensect No. 9
do.
35.
30.
g 25. - 20. z
2 15.
0 10 20 30 40 50 60 70 80 90 100 DISTANCE (m)
Transact No. 10
Transect No. 5
DISTANCE (m)
Transect NO. I I
DISTANCE (m)
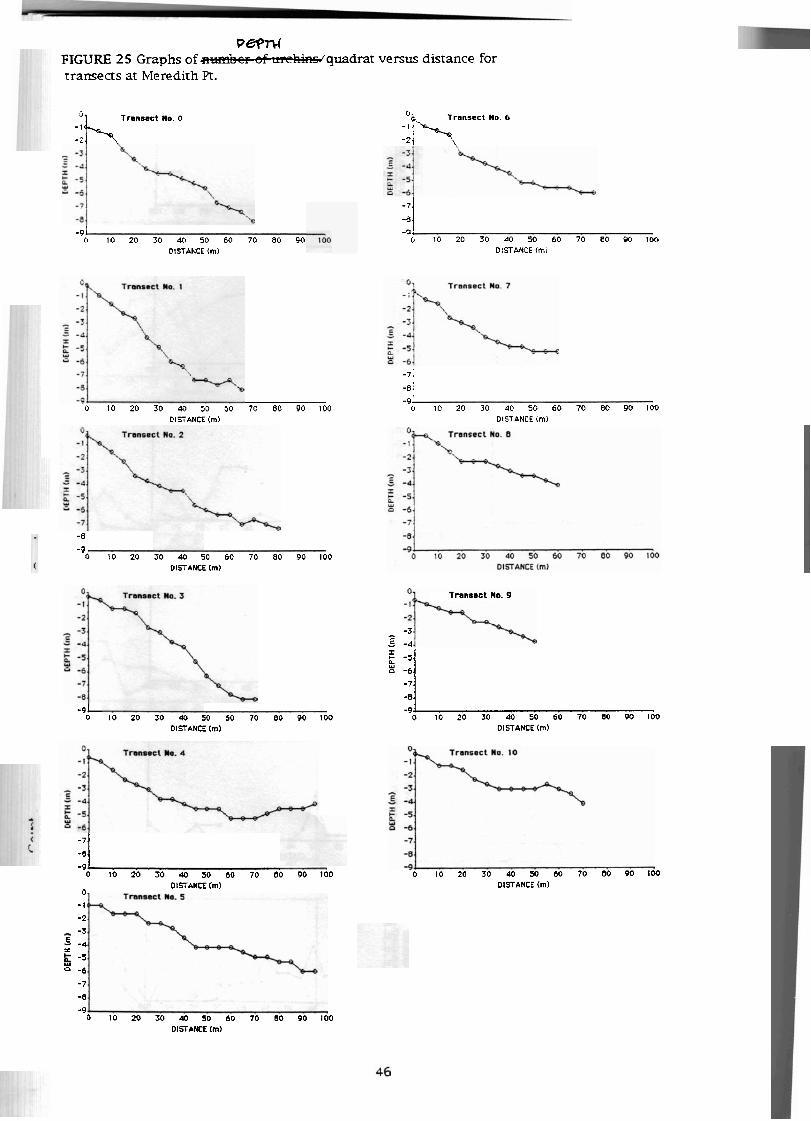
P e n 4 FIGURE 2 5 Graphs of -quadrat versus distance for rranseas at Meredith Pt.
-:L, Tramsect Na. o
- .
-9 1 0 10 20 3 0 40 50 60 70 80 90
DISTANCE ( m )
0 10 20 3 0 40 50 60 70 80 90 100 DISTANCE (m)
11 -a, 0 10 20 30 A0 5 0 6 0 7 0 8 0 90 100
DISTANCE (mi
0 -,rkTrnnsect No. 6
-2 { \.
-8
-9 0 10 20 3 0 40 50 60 70 80 90 100
DISTANCE (m)
- 9 L 0 I 0 20 3 0 40 50 60 70 0 0 90 100
DISTANCE (rn)
, I , . , ,
-9 0 10 2 0 3 0 40 5 0 60 7 0 8 0 9 0 100
DISTANCE (m) 0
-1
-2
-3 E -4 x
-5 .a -6
-7
-8
-9 0 10 2 0 3 0 40 5 0 60 7 0 8 0 90 I 0 0
DISTANCE (m)
-7
-81 -9 0 10 20 30 40 5 0 6 0 7 0 8 0 9 0 100
DISTANCE im)
Transnct No. 9
- -3
E -4
-8 ":/! -9 0 10 20 30 DISTANCE 40 50 ( m ) 60 7 0 80 9 0 100
0 10 20 30 40 50 60 7 0 8 0 90 100 DISTANCE (m)


FIGURE 27 Graphs of algal cover versus distance for transects at Meredith Pc.
Transect No. 0
60 j xTOTAL FLESHY ALGAE fi. .CORALLINES ,, . 5 5oj \ A FINE TURF
0 3 : 40; ,x- h U x 3GL...' ",
p . '. - ZCj',
DISTANCE (mi Tmnsect Wn 1
DISTANCE (mj Transect No. 2
Transect No. 6 7 6 ,
/"\ I I
DISTANCE (m)
Transect NO. 7
DISTANCE (m) Transect NO. 8
I DISTANCE (m)
Tmnsect No. 3
DISTANCE (m)
T m n s e c t No. 9
DISTANCE (m)
T m n s e c t No. 4
DISTANCE (m) T m n s e c t No. 5
70 t
DISTANCE (m)
Transect No. 10 70, . . - t
60.
0 10 20 30 40 50 60 70 80 90 100 DISTANCE (m)
DISTANCE (m)
48

FIGURE 28 Graphs of number of urchin per quadrat versus distance for transeas at Meredith Pt.
Transact No. 0
DISTANCE (m) Transact No. l
DISTANCE (m) Transact N0.7
or 1 0 10 2 0 3 0 40 5 0 6 0 7 0 8 0 9 0 1 0 0
Tmnsect N o 2 DISTANCE (m)
d . . . L 0 1 0 2 0 3 0 40 5 0 6 0 7 0 8 0 9 0 100
Tmnsact No.8 DISTANCE (m)
6 0 + r
DISTANCE (m) DISTANCE (m)
Tmnsect No.3 Transect n0.9 60,
I I
OISTANCE (m) Transect 110.4
DISTANCE (m!
Transect no. lo
Transect n o . 5 DISTANCE !m)
DISTANCE (m)

2
74
i-'

Figure 30 (a-d) Possible relationships between urchin number and measured parameters.
45 HOPE IS. , no restrictions. 1 0
4 6 8 10 12 14 EPTH ('-'
45 - (b)
HOPE IS, , Hard Bottom > 25 (50%). 40 -
35 - 0
30 -
4 '4 w
1 b Q @ ~ . oQ 09 0 O COO 0 O0
0 . :: .> - - - DEPTH IM)
5 1

Figure 30 (a-d) Possible relationships between urchin numbers and measured parameters.
lope Is., hard bottom, >25.
COVER OF ENCRUSTING CORALLINES
Hope Is,, Cover o f Laminar ia les 1 ( i n r. Ecklonfia. H~~cmcyslis. L essonia)
COVER OF LAMINAR IALES
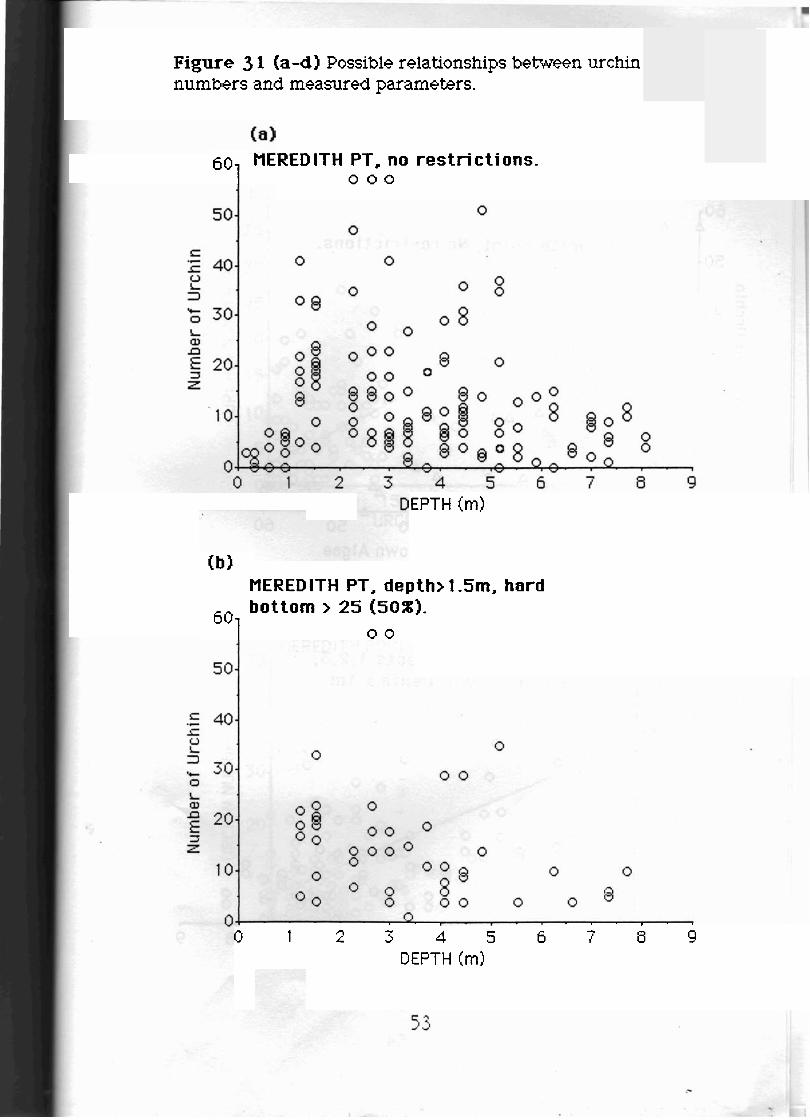
Figure 3 1 (a-d) Possible relationships between urchin numbers and measured parameters.
60 MEREDITH PT, 1 0 0
no restrictions. 0
EPTH (m)
i b ) MEREDITH PT, depth> l.Sm, hard
601 bottom > 25 (50%).
0 0
. . . - , . . 0 1 2 3 4 5 6 i S 9 7
DEPTH (m)

Figure 3 1 (a -d) Possible relationships between urchin numbers and measured parameters.
(GI
Meredith Point, No restrictions. 50
0 10 20 30 40 50 60 70 T o t a l Cover o f B r o w n A lgae
Meredith Pt, Transects 1,2,3, ('barrens area'), Depth > 1 m.
DEPTH (m)


Sea Fisheries Internal Report No.2
REFERENCES Andrew, NL and BD Mapstone 1987 Sampling and the description of spatial pattern in marine
ecology. Oceanogr. Mar. Biol. Ann. Rev., 25: 39-90.
Dix, TG 1977 Survey of Tasmanian Sea Urchin Resources. Tasmanian Fish. Res., 21: 1-14.