
Preliminary Recommendations for the Collection, … Recommendations for the Collection, Storage, and...
65
NASA/TM–2013–216624 Preliminary Recommendations for the Collection, Storage, and Analysis of UAS Safety Data Francis Enomoto Ames Research Center, Moffett Field, California David Bushnell TRACLabs Ames Research Center, Moffett Field, California Ewen Denney, Ganesh Pai, and Johann Schumann SGT, Inc. Ames Research Center, Moffett Field, California December 2013 https://ntrs.nasa.gov/search.jsp?R=20140011531 2018-05-28T01:58:44+00:00Z
Transcript of Preliminary Recommendations for the Collection, … Recommendations for the Collection, Storage, and...

NASA/TM–2013–216624
Preliminary Recommendations for theCollection, Storage, and Analysis ofUAS Safety Data
Francis EnomotoAmes Research Center, Moffett Field, California
David BushnellTRACLabsAmes Research Center, Moffett Field, California
Ewen Denney, Ganesh Pai, and Johann SchumannSGT, Inc.Ames Research Center, Moffett Field, California
December 2013
https://ntrs.nasa.gov/search.jsp?R=20140011531 2018-05-28T01:58:44+00:00Z

NASA STI Program . . . in Profile
Since its founding, NASA has been dedicated tothe advancement of aeronautics and spacescience. The NASA scientific and technicalinformation (STI) program plays a key part inhelping NASA maintain this important role.
The NASA STI Program operates under theauspices of the Agency Chief InformationOfficer. It collects, organizes, provides forarchiving, and disseminates NASA’s STI. TheNASA STI Program provides access to theNASA Aeronautics and Space Database and itspublic interface, the NASA Technical ReportServer, thus providing one of the largestcollection of aeronautical and space science STIin the world. Results are published in bothnon-NASA channels and by NASA in the NASASTI Report Series, which includes the followingreport types:
• TECHNICAL PUBLICATION. Reports ofcompleted research or a major significantphase of research that present the results ofNASA programs and include extensive data ortheoretical analysis. Includes compilations ofsignificant scientific and technical data andinformation deemed to be of continuingreference value. NASA counterpart ofpeer-reviewed formal professional papers, buthaving less stringent limitations on manuscriptlength and extent of graphic presentations.
• TECHNICAL MEMORANDUM.Scientific and technical findings that arepreliminary or of specialized interest, e.g.,quick release reports, working papers, andbibliographies that contain minimalannotation. Does not contain extensiveanalysis.
• CONTRACTOR REPORT. Scientific andtechnical findings by NASA-sponsoredcontractors and grantees.
• CONFERENCE PUBLICATION.Collected papers from scientific and technicalconferences, symposia, seminars, or othermeetings sponsored or co-sponsored byNASA.
• SPECIAL PUBLICATION. Scientific,technical, or historical information fromNASA programs, projects, and missions, oftenconcerned with subjects having substantialpublic interest.
• TECHNICAL TRANSLATION. English-language translations of foreign scientific andtechnical material pertinent to NASA’smission.
Specialized services also include creating customthesauri, building customized databases, andorganizing and publishing research results.
For more information about the NASA STIProgram, see the following:
• Access the NASA STI program home page at
http://www.sti.nasa.gov
• E-mail your question via the Internet to
• Fax your question to the NASA STI Help
Desk at 443-757-5803
• Phone the NASA STI Help Desk at
443-757-5802
• Write to:
NASA STI Help Desk
NASA Center for AeroSpace Information
7115 Standard Drive
Hanover, MD 21076–1320

NASA/TM–2013–216624
Preliminary Recommendations for theCollection, Storage, and Analysis ofUAS Safety Data
Francis EnomotoAmes Research Center, Moffett Field, California
David BushnellTRACLabsAmes Research Center, Moffett Field, California
Ewen Denney, Ganesh Pai, and Johann SchumannSGT, Inc.Ames Research Center, Moffett Field, California
National Aeronautics and
Space Administration
Ames Research Center
Moffett Field, California 94035-1000
December 2013

Acknowledgments
We would like to thank Kelly Hayhurst for her patient guidance and for providing many insightful and
useful comments, Matt Fladeland for allowing access to UAS data from the NASA Ames Airborne Science
Program, and Jav Shively and Eric Mueller for discussing the Human Systems Integation (HSI) and Sense
and Avoid / Separation Assurance Integration (SSI) projects, respectively.
The use of trademarks or names of manufacturers in this report is for accurate reporting and does not constitute an
offical endorsement, either expressed or implied, of such products or manufacturers by the National Aeronautics and
Space Administration.
Available from:
NASA Center for AeroSpace Information
7115 Standard Drive
Hanover, MD 21076-1320
443-757-5802

ContentsList of Tables ii
List of Figures ii
1 Introduction 11.1 Motivation . . . . . . . . . . . . . . . . . . . . . . . . . . . . . . . . . . . . . . . . . . . . . . 1
1.2 Background . . . . . . . . . . . . . . . . . . . . . . . . . . . . . . . . . . . . . . . . . . . . . 1
1.3 This Report . . . . . . . . . . . . . . . . . . . . . . . . . . . . . . . . . . . . . . . . . . . . . 2
2 Methodology 32.1 Overview . . . . . . . . . . . . . . . . . . . . . . . . . . . . . . . . . . . . . . . . . . . . . . 3
2.2 Approach . . . . . . . . . . . . . . . . . . . . . . . . . . . . . . . . . . . . . . . . . . . . . . 4
2.3 Analysis Methods . . . . . . . . . . . . . . . . . . . . . . . . . . . . . . . . . . . . . . . . . . 6
2.3.1 Safety and Hazard Analysis . . . . . . . . . . . . . . . . . . . . . . . . . . . . . . . . 6
2.3.2 Analysis of Incidents and Accidents . . . . . . . . . . . . . . . . . . . . . . . . . . . . 7
2.3.3 Data Mining and Statistical Techniques . . . . . . . . . . . . . . . . . . . . . . . . . . 7
2.4 Categories of Hazard and Risk Related Data . . . . . . . . . . . . . . . . . . . . . . . . . . . . 9
2.4.1 Data Requirements Induced from Safety Analysis . . . . . . . . . . . . . . . . . . . . . 9
2.4.2 Incident and Accident Data . . . . . . . . . . . . . . . . . . . . . . . . . . . . . . . . . 10
2.4.3 Data Requirements for Statistical Analysis and Data Mining . . . . . . . . . . . . . . . 12
3 Data Sources 133.1 Primary Sources . . . . . . . . . . . . . . . . . . . . . . . . . . . . . . . . . . . . . . . . . . . 13
3.1.1 National Aeronautics and Space Administration (NASA) . . . . . . . . . . . . . . . . . 13
3.1.2 Other U.S. Government Agencies . . . . . . . . . . . . . . . . . . . . . . . . . . . . . 15
3.1.3 Branches of the U.S. Military . . . . . . . . . . . . . . . . . . . . . . . . . . . . . . . 17
3.1.4 Foreign Governments . . . . . . . . . . . . . . . . . . . . . . . . . . . . . . . . . . . . 18
3.2 Performance Data with Safety Relevance . . . . . . . . . . . . . . . . . . . . . . . . . . . . . . 19
3.2.1 Data from Existing Approval Procedures . . . . . . . . . . . . . . . . . . . . . . . . . 19
3.2.2 Sense and Avoid / Separation Assurance Integration (SSI) . . . . . . . . . . . . . . . . 21
3.3 Summary of Safety Data Collected . . . . . . . . . . . . . . . . . . . . . . . . . . . . . . . . . 22
3.4 Commentary . . . . . . . . . . . . . . . . . . . . . . . . . . . . . . . . . . . . . . . . . . . . 24
4 Data Collection Problems and Gaps 24
5 Recommendations 265.1 Improving the Quality of Data Collected . . . . . . . . . . . . . . . . . . . . . . . . . . . . . . 26
5.2 Improving the Quantity of Data Collected . . . . . . . . . . . . . . . . . . . . . . . . . . . . . 27
5.2.1 Incident Reporting . . . . . . . . . . . . . . . . . . . . . . . . . . . . . . . . . . . . . 27
5.2.2 Data Recording . . . . . . . . . . . . . . . . . . . . . . . . . . . . . . . . . . . . . . . 28
5.2.3 Modeling and Simulation . . . . . . . . . . . . . . . . . . . . . . . . . . . . . . . . . . 30
5.2.4 Harnessing NASA Data Sources – UAS Projects . . . . . . . . . . . . . . . . . . . . . 30
5.2.5 Other Subprojects of the UAS integration in the NAS project . . . . . . . . . . . . . . . 31
5.2.6 UAS Centennial Challenge . . . . . . . . . . . . . . . . . . . . . . . . . . . . . . . . . 32
5.2.7 Other Agencies . . . . . . . . . . . . . . . . . . . . . . . . . . . . . . . . . . . . . . . 32
5.3 Framework for Reasoning about Heterogeneous Data . . . . . . . . . . . . . . . . . . . . . . . 32
Appendices 35
A Acronyms 35
B Safety Analysis Techniques 37
i

C Data Sources 42
D UAS Data Requirements 45
References 55
List of Tables1 UAS Safety Data Sources and Analysis Methods . . . . . . . . . . . . . . . . . . . . . . . . . 4
2 Incident and risk exposure data . . . . . . . . . . . . . . . . . . . . . . . . . . . . . . . . . . . 10
3 NASA Data Sources . . . . . . . . . . . . . . . . . . . . . . . . . . . . . . . . . . . . . . . . 13
4 Other US Government Data Sources . . . . . . . . . . . . . . . . . . . . . . . . . . . . . . . . 16
5 Non-US Government Data Sources . . . . . . . . . . . . . . . . . . . . . . . . . . . . . . . . . 18
6 Independent variables in the SSI experiment categories . . . . . . . . . . . . . . . . . . . . . . 22
7 Dependent variables in the SSI experiment categories . . . . . . . . . . . . . . . . . . . . . . . 23
List of Figures1 Examples of Applying Statistical Analysis . . . . . . . . . . . . . . . . . . . . . . . . . . . . . 8
2 Clustering of UAS into 5 categories [1] . . . . . . . . . . . . . . . . . . . . . . . . . . . . . . 9
3 Towards safety data collection for Unmanned Aircraft Systems (UASs) . . . . . . . . . . . . . 33
ii

1 Introduction
1.1 Motivation
Although the use of UASs in military and public service operations is proliferating, civilian use of UASs remains
limited1 in the United States today. With efforts underway to accommodate and integrate UASs into the National
Airspace System (NAS), a proactive understanding of safety issues, i.e., the unique hazards and the corresponding
risks that UASs pose not only through their operations for commercial purposes, but also to existing operations
in the NAS, is especially important so as to:
• support the development of a sound regulatory basis,
• regulate, design and properly equip UASs, and
• effectively mitigate the risks posed.
Data, especially about system and component failures, incidents, and accidents, provides valuable insight into
how performance and operational capabilities/limitations contribute to hazards. Additionally, understanding UAS
performance characteristics and limitations is necessary to establish standards for airworthiness and operational
performance. Finally, understanding the causes of mishaps when they do occur is necessary to prevent them
from happening again. Since the majority of UAS operations today take place in a context that is significantly
different from the norm in civil aviation, i.e., with different operational goals and standards, identifying that
which constitutes useful and sufficient data on UASs and their operations is a substantial research challenge.
1.2 Background
According to recent testimony from the Government Accountability Office (GAO) [2], the Federal Aviation
Administration (FAA) has historically used safety relevant data in a reactive manner to prevent future accidents
and mitigate safety risks. Indeed, failure data provides the opportunity to learn lessons. As part of the adoption of
Safety Management Systems (SMSs), the FAA is moving toward a proactive approach to safety data to identify
and mitigate risks before they result in accidents. It has been argued, therefore, that
“. . . implementing systems and processes that capture accurate and complete data [is] critical for
[the] FAA to determine the magnitude of safety issues, assess their potential impacts, identify their
root causes, and effectively address and mitigate them.” [2]
Contemporary work done till date highlights the limited nature of the available data on UAS hazards. For
example, as acknowledged in [3],
“. . . there is limited data on UAS accidents and incidents. The majority of publicly available data
relate to military UAS operations primarily because of the limited amount of non-military UAS
activity to date (a product of the current regulatory environment) and the mandatory reporting of
accidents and incidents involving non-military UAS has only recently come into force. Seldom does
a review of accident and incident data provide a comprehensive identification of the potential hazards
and their outcomes. This is particularly the case for UAS, where there is limited data available and
the primary hazards are inherently rare events.” [3]
The GAO was critical about the FAA’s lack of progress in analyzing Department of Defense (DoD) data as
of Sept. 2012. [4], stating:
“While FAA officials stated that the agency’s efforts to develop standards have been slowed by
the lack of operational data, FAA has not utilized the operational data it does possess. In 2008,
we recommended that FAA expedite efforts to ensure that UAS have routine access to the national
1UAS operation is constrained by the requirements of either a Certificate of Authorization (COA) or a Special Airworthiness Certificate
– Experimental Category (SAC-Exp)
1

airspace system by analyzing the data FAA collects on UAS operations as part of its COA process
and establish a process to analyze DOD data on its UAS research, development, and operations.
Safety and operational data can directly support the development of UAS technology. For example,
in the development and validation of UAS technology, GBSAA2 for example, the FAA requires
data to demonstrate that cooperative and non-cooperative aircraft can be consistently identified at all
operational altitudes and ranges, and the proposed system can effectively avoid a potential collision.
To date, FAA has not utilized the operational data available to the agency as part of the COA process
for the development of standards. According to a DoD official, it started providing FAA with 7 years
of operational and safety data in September 2011. However, according to FAA officials, the agency
has been unable to use the data to support its standards development because the data was not in a
usable format. As of June 2012, FAA was still defining the data fields it needed and how the data
will be used to support the development of performance or certification standards and the regulatory
process for UAS. FAA officials have since communicated their data requirements to DOD and also
provided us with a list of general data requirements. Furthermore, FAA officials also noted that the
agency currently has a contract with MITRE to address these data challenges in fiscal year 2013.”
The GAO updated the progress on this matter in April 2013 [5], stating:
“While progress has been made, the standards development process has been hindered, in part,
because of FAA’s inability to use safety, reliability, and performance data from the DoD, the need
for additional data from other sources, as well as the complexities of UAS issues in general. As
we previously reported, while the DoD provided the FAA with seven years of data in September
2011, FAA officials told us they have been unable to use this data to develop standards because
of differences in definitions and uncertainty about how to analyze these data. To mitigate these
challenges FAA has been working with the DoD to develop an MOU3 and better identify what data
are needed. Finally, FAA is also working with MITRE to develop a data collection tool that will
allow officials to better analyze the data they receive from DoD.”
Given this context, not only the FAA but also NASA continues to increase its understanding of the design
and operational risks involved, to support the (data driven) development of minimum performance standards
(as a basis for airworthiness certification and safety assurance). Furthermore, there exists a need to supply
manufacturers of UASs with certification requirements so that they are aware of the constraints against which to
design and develop UASs.
1.3 This Report
This report presents the preliminary results of a study of hazard and risk-related data, relevant to the safe inte-
gration of UASs into the NAS, through the certification subproject of the UAS integration in the NAS project4
of the NASA Integrated Systems Research Program. Accordingly, the broad goal is to provide recommendations
on how to more effectively collect, store, and analyze data to improve understanding of the hazards and risks
associated with civilian UAS operations. Our study has examined hazard and risk-related data issues with a view
to answering the following questions:
• What UAS data is currently available, or is expected to become available as access to the NAS moves
forward?
• What data is required for operational approval in the current regulatory regime, e.g., as outlined in the
national policy for operational approval of UASs [6].
• What types of analyses can be used to inform us about UAS hazard identification and mitigation?
2Ground Based Sense and Avoid (GBSAA).3Memorandum Of Understanding4[Online]: http://www.aeronautics.nasa.gov/isrp/uas/
2

• What data needs to be collected to support understanding UAS risk, determining a Target Level of Safety
(TLS), and development of standards/regulations?
• What opportunities are available for collecting additional relevant data?
The study has led to two general recommendations, and a series of possible follow-on research activities
related to collecting data to meet those recommendations, and in support of the broader goal of proactive risk
analysis to enable routine UAS access to the NAS. This effort is consistent with, and, we believe, bolsters
the FAA’s adoption of a SMS approach, i.e., proactively identifying and mitigating risks, through data driven
identification of precursors to hazards.
This report is organized as follows. Section 2 outlines the methodology we have followed, describing both
the approach we have taken to identifying sources of relevant data, and the analysis methods that are germane to
the identified data. Section 3 then describes the resulting concrete data sources which we identified; thereafter,
Section 4 identifies a number of gaps in the data, in the context of the questions we wish to answer. We propose
a set of recommendations to address the identified gaps in Section 5.
2 Methodology
2.1 Overview
On December 5, 2012, a U.S. Air Force MQ-9 Reaper UAS crashed in the Nevada desert while on a training
mission. The accident investigation board determined the cause was the improper reconfiguration of the ground
control station from an MQ-1 mission to an MQ-9 mission – the throttle remained in the MQ-1 configuration and
thereby unexpectedly commanded the MQ-9 engine to produce full reverse thrust. The improper reconfiguration
was determined to be the result of the crew not fully following the preflight checklists [7].
On April 25, 2006, a Customs Border and Protection Predator B UAS crashed outside of Nogales, Arizona.
The subsequent NTSB investigation5 determined the causes to be “the pilot’s failure to use checklist procedures
when switching operational control from a console that had become inoperable due to a ‘lockup’ condition,
which resulted in the fuel valve inadvertently being shut off and the subsequent total loss of engine power, and a
lack of a flight instructor in the Ground Control Station.”
These UAS mishaps, two of hundreds to date, suggest how system safety analysis focused on complex in-
teractions, together with the collection and analysis of UAS incident data can help with evolving UAS design,
personnel training, and operational procedures to produce conditions ensuring that UASs are safe enough to be
integrated into the NAS. The variety and complexity of the mishap causes also suggest that an analysis of safety
without knowledge of past problems may not be sufficient to achieve this goal.
One of the main goals for safety data collection, storage and analysis is to support Safety Risk Management
(SRM), a process to aid decision-makers that is composed of describing the system, identifying the hazards,
and analyzing, assessing, and controlling safety risk. A hazard is a condition that could foreseeably cause or
contribute to an accident (undesired event); safety is the state in which the risk of harm to persons or property
damage is acceptable, whereas safety risk is the composite of predicted severity and likelihood of the potential
effect of a hazard [8]. SRM is performed as part of the wider Safety Management System (SMS) [9]: the
formal, top-down, organization-wide approach to managing safety risk and assuring the effectiveness of safety
risk controls. SMS includes systematic procedures, practices, and policies for the management of safety risk. As
indicated, the main steps in an SRM process are [8],
System Analysis: In brief, this involves understanding and describing the system for which safety is to be as-
sured, to a level of detail that allows the identification of all the pertinent hazards. This will require a
definition of the scope and objectives of the system, identification of the relevant stakeholders, the plan
for risk management, and a description of the system, or the change it introduces if it is being build in the
context of a wider system.
5NTSB Press Release, Oct. 2007. Accessed Jun. 2013. [Online]: http://www.ntsb.gov/news/2007/071016b.htm
3

Hazard Identification: This is a semi-structured approach to comprehensively identify that which can “go
wrong”. In other words, hazard identification seeks to enumerate those conditions in the context of the
system, both nominal and abnormal, that could potentially result in an undesired event, i.e., an incident or
an accident. Hazard identification also attempts to document the potential hazard causes and consequences.
Safety Risk Analysis: This step characterizes the initial predicted risk associated with the identified hazards in
terms of the severity and predicted likelihood of the (hypothesized) outcome(s).
Safety Risk Assessment: Risk assessment categorizes the acceptability of hazards and their corresponding pre-
dicted risk.
Risk Mitigation and Control: This step attempts to reduce risk to acceptable levels by defining mitigation
mechanisms and controls to manage those hazards which have been considered as unacceptable. The
introduction of risk mitigation mechanisms and controls is also analyzed to establish that they do not affect
the existing safety mechanisms in the system.
2.2 Approach
Table 1 depicts the sources of UAS relevant safety data, and the pertinent analysis methods that we believe will
be useful for improving safety analysis.
Table 1: UAS Safety Data Sources and Analysis Methods
Data Source Analysis Method Output Use
UAS data (concept, design, development, operations)
Safety analysis methods (Functional Hazard Analysis [FHA], Failure Modes and Effects Analysis [FMEA], etc.)
Safety data on potential hazards, risks, failure modes, consequences, mitigations, etc. for systems, subsystems, components, etc.
Inform and improve UAS development for certification
Incident and Accident event data + UAS data
Incident/Accident Analysis methods, e.g., Root cause analysis, Why-because analysis, Events and causai factors analysis, etc.
Safety data on actual hazards, failures, root causes, etc.
Inform UAS design and development, improving safety analysis
Incident, Accident and failure data
Data mining and Statistical analysis methods
Data trends and patterns including likelihoods, precursors, correlations, etc.
Inform UAS design and development, improving safety analysis
We apply safety analysis methods (as part of an SRM process), to a specific UAS or a class of UASs, i.e.,
to its concept (functions), design/development artifacts, and (intended) operations, so as to identify hazards and
determine the corresponding safety risks that they pose. The analysis yields safety relevant data, including
hazards posed by the system and its components (in addition to hazards posed by the operating environment), its
failures, failure modes, potential causes, effects, and consequences. The analysis also produces a characterization
of safety risks as a function of the likelihoods and severities of hazards.
Data about likelihoods of certain events, such as system/subsystem failures and failure modes, can be obtained
from a variety of sources including from verification activities, e.g., testing, or design activities, e.g., simulation;
such data can also be obtained from historic incident/accident data. Incident/accident analysis methods focus
on a particular incident/accident, yielding additional information about the chain of events, i.e., so-called root
causes, that led to the undesired outcome. This data can include hazards, failures, failure modes, together with a
characterization of the consequences and their severity. Thus, it is means to inform and update subsequent safety
analysis, by highlighting that which was missed a priori, and serving as a lesson learnt.
4

When data is available on sets of incident/accidents, we can apply data-mining and/or statistical analysis
methods, to further enhance safety analysis and, as a consequence, subsequent UAS design/ development activi-
ties. In particular, this analysis provides information concerning trends and patterns in data, e.g., event sequences,
correlations between root causes, their likelihoods of occurrence, and, potentially, precursors to undesired events.
Thus, in general, data collection activities can initially focus on gathering safety relevant data obtained from
safety analysis methods, incident/accident data, and the results of statistical analysis applied to these data.
Note: In order to apply statistical analysis techniques, data should have a standardized format and should
likely correspond to an appropriate data metamodel. For this report, in particular, the data produced from safety
analysis methods, available incidents/accidents gives a starting point to determine the data needs for UAS safety.
We have conducted a semi-systematic literature survey including accident/incident databases such as the Avia-
tion Safety Reporting System (ASRS), the Incident Reporting Information System (IRIS), the Federal Aviation
Interactive Reporting System (FAIRS), the FAA’s Accident and Incident Data System (AIDS), as well as from
national and international sources.
Relevance for Safety Data Collection
In Figure 3, we have indicated that methods for the analysis of safety risk, both prior to system operation and
subsequently, in the event of an incident/accident, produce safety relevant data. All of the methods are dependent
on the fundamental notion of hazard and to a degree, also on the assumption of a particular model of incident
or accident causation. The methods for safety analysis primarily focus on the identification of hazards and their
consequent elimination, or the mitigation of risk to acceptable levels. Risk mitigation deserves additional thought
especially when considering risk expressed in terms of mishap severity and mishap probability:
• The first consideration is the way in which mishaps occur, requiring the choice of an accident causation
model. The chain-of-events model [10], by-far the most widely accepted, is one in which accidents are
modeled as the consequence of the alignment of a chain of weaknesses in barriers designed to prevent
hazards from manifesting. These weaknesses are considered as failed defenses as a consequence of either
active failures occurring due to unsafe acts, or latent failure conditions that existed in the different barriers.
The barriers themselves are related to organization aspects, supervisory roles and the so-called precondi-
tions for unsafe acts. Other models for accident causation have also been proposed based, e.g., on system
theory [11], and interacting, nested levels of decision making across the socio-technical hierarchy [12].
These models consider accident causation as the consequence of deviations of control, in part, or the sys-
tematic migration of the socio-technical system to higher risk regimes in response to external pressures.
However, at a lower level the notion of event chains leading to undesired events is also embraced, to some
degree, by these alternative models.
For our purposes, in this report, we mainly consider the chain-of-events model, and the associated safety
analysis methods.
• The second consideration is the computation of mishap likelihood as a function of the identified hazards.
Again, this necessitates a choice of the underlying model of a hazard. In [13], a critique is given on the
computation of risk through hazards, wherein at least five distinct and formally different notions of hazard
have been put forth. The analysis further shows that there are challenges to computing risk based on
the notion that is picked, in that likelihood of occurrence can be either overestimated or underestimated.
Furthermore, the analysis also shows how it is possible for an undesired outcome to occur without going
through a hazard state.
These considerations, we believe, influence the data gathered and analyzed to an appreciable degree, by
influencing the techniques that are chosen a priori for hazard identification and analysis, and a posteriori for the
analysis of incident/accident data. Based upon a choice of existing safety analysis methods employed in practice,
the data collection requirements (which we describe in Section 2.4) then depend upon the particulars of the UAS
being considered and its operational context.
5

2.3 Analysis Methods
2.3.1 Safety and Hazard Analysis
As indicated in Figure 3, safety analysis methods yield specific safety relevant data; in this section we highlight
a set of the pertinent safety analysis methods that can inform us about UAS hazard identification and mitigation.
Safety analysis is one of the key activities in ensuring that critical systems have been developed so that they are
inherently safe, and will continue to be safe in operation. There are various methods for hazard identification
and assessment, core safety analysis activities, which are applied during safety-critical system development and
whenever there is a (design) modification to the system, during its operational lifetime.
Other methods exist for the analysis of incident/accident data that are obtained after a system is operational.
These effectively provide insight into hazards that were missed in the safety analysis, thereby (a) providing
feedback for subsequent safety analysis, say, in response to system modifications or for subsequent incarnations
of the system; and (b) closing the loop on safety analysis.
Broadly, safety analysis methods are applied at a high-level, i.e., during concept development and preliminary
design, and at lower levels, i.e., during detailed design, and design verification and validation.
• Traditionally, the higher-level analysis almost always begins with hazard identification, the determination
of hazard causes, and the specification of proposed mitigations. The recommendation from the FAA, as in
Advisory Circular (AC) 23.1309E [14], and the related recommended practice document ARP 4761 [15],
is to use Functional Hazard Assessment (FHA) as the first step for hazard identification. FHA is applied at
the level of the aircraft, and then to the systems comprising the aircraft6.
• Lower-level safety analysis methods support the higher-level analyses by elaborating hazard causes, such
as failures and failure modes, and their effects. Failures are observed deviations from intended or nominal
state/behavior, and failure modes represent the manner in which a failure occurs. The category of failure
hazards especially contribute to increased safety risk, but not all failure hazards may be safety relevant7.
A variety of failure analysis methods are available in order to identify hazardous failures, including Fail-
ure Modes and Effects Analysis (FMEA), Fault Tree Analysis (FTA), Common Cause Analysis (CCA),
Zonal Safety Analysis (ZSA), and Common Mode Analysis (CMA). Again, applying these methods is a
recommended practice as per ARP 4761 [15], forming the core analysis during Preliminary System Safety
Assessment (PSSA) and System Safety Assessment (SSA). The former is applicable during design, while
latter is a verification step to ensure that the system as designed meets the safety requirements.
In addition to these methods, a Hazards and Operability (HAZOP) study is an orthogonal hazard analysis
technique applicable primarily to processes to characterize hazardous deviations, e.g., omission, commission,
early or late issuance of a specific control command, etc. Recently, newer hazard analysis techniques have been
proposed in the literature that adapt HAZOP in specific ways: e.g., STAMP-based Process Analysis (STPA) is
one such technique, which develops on traditional hazard analysis techniques by including additional analysis
for examining hazards arising from system interactions. In particular, it considers the control actions in a system,
and hazards arising from their deviations. Ontological hazard analysis is another technique, where HAZOP is
combined with causal analysis and refinement, with a view toward formalizing the process of hazard identifica-
tion.
For details on a specific safety analysis method, refer to Appendix B and the references therein.
6Preliminary Hazard Analysis (PHA), Concept Hazard Analysis (CHA), System Hazard Analysis (SHA), and Sub-System Hazard Ana-
lysis (SSHA) are hazard identification methods applicable during concept development and preliminary design, as recommended in the
defense standard MIL-STD-882E [16]. PHA has also been recommended as an acceptable method for safety analysis in the FAA Air Traffic
Organization Safety Management System Manual [17].7Note, however, that there can be hazardous system states in which no failure has occurred.
6

2.3.2 Analysis of Incidents and Accidents
Largely, the methods for analyzing a single incidents/accident are a subset of the set of methods for safety-
based and failure-based Root Cause Analysis (RCA) [18]. These include methods such as Events and Causal
Factors (ECF) analysis, Multilinear Events Sequencing (MES), Sequentially Timed Events Plotting (STEP) and
AcciMaps [12].
In addition to these, some of the a priori safety analysis methods can be also applied for incident/accident
analysis, since they are duals. That is, not only are they applicable in an exploratory way, they can be employed in
a forensic manner. However, some of the assumptions made, and data considered change: rather than considering
the set of possible events that might lead to an undesired event, one only considers the factual evidence available
of an undesired event to reason about their causes. Thus, analyzing an incident or accident provides insights into
hazards that were missed, uncovered, or unknown and adds to the body of knowledge used during subsequent
safety analysis. Some examples of methods that serve these dual purposes are FTA, Event Tree Analysis (ETA),
Systems Theoretic Accident Model and Process (STAMP), Cause-consequence charts in AcciMaps, ontological
hazard analysis, and Why-Because Analysis (WBA).
For greater details on a specific method of incident/accident analysis, refer to Appendix B, and the referenced
documentation therein.
2.3.3 Data Mining and Statistical Techniques
In general, the goal of data mining is to prepare large and high-dimensional data sets for human understanding.
Typical tasks include the determination of parameters of a given statistical model (regression), to find structure
and groupings in the data (classification, clustering), or to detect outliers in the data. Data mining, as it pertains
to UAS data, is mainly concerned with tasks that include the following (for details see, e.g., [19])
Association: Association techniques try to discover patterns, which are based on a relationship on a particular
item/event on other items in the same event. For example, association techniques can be used to iden-
tify those failures and behaviors that frequently occur at the same instant that, say, there is a loss of the
communications link.
Classification: Classification is used to sort each item of the data set into one or more predefined classes. Ma-
chine learning techniques are used to automatically learn how to classify the data items into groups. Tech-
niques used for classification include decision trees, neural networks, linear programming, and many other
statistical methods.
Clustering: Clustering is a machine learning technique that tries to identify meaningful groups or clusters of
data items. In contrast to classification with its pre-defined classes, clustering automatically derives the
characteristics of each class or group.
Prediction: Prediction techniques try to discover relationships between independent variables and relationships
between dependent and independent variables. Regression can be used to predict values in the future (for
temporal data) or for yet unknown values.
Time Series Analysis: When temporal data, e.g., telemetry data and maintenance logs, are analyzed, data min-
ing can detect temporal patterns, such as single events when there is a change in the process (change
points), repetitive patterns with a certain frequency (oscillations), or more complicated temporal patterns.
The data to be analyzed can come from different sources and be in different formats. Typically, safety and
risk analysis data are often in the form of text, e.g., system description documentation in a COA application,
incident/accident reports, etc. Manually analyzing a statistically significant amount of such data is inefficient
and time consuming; automated methods have to address issues such as a large vocabulary containing potentially
many similar notions (e.g., control link, C2, telemetry, control stream), or large variability and ambiguities in
how a single scenario is described. For example, the usage of the word “crashed” in this excerpt from an incident
report8 – . . . crashed and was retrieved with minimal damage – appears to imply a hard landing as opposed to a
8Extracted from UAS accident briefs from the U.S. Army’s Flightfax and Knowledge magazines
7
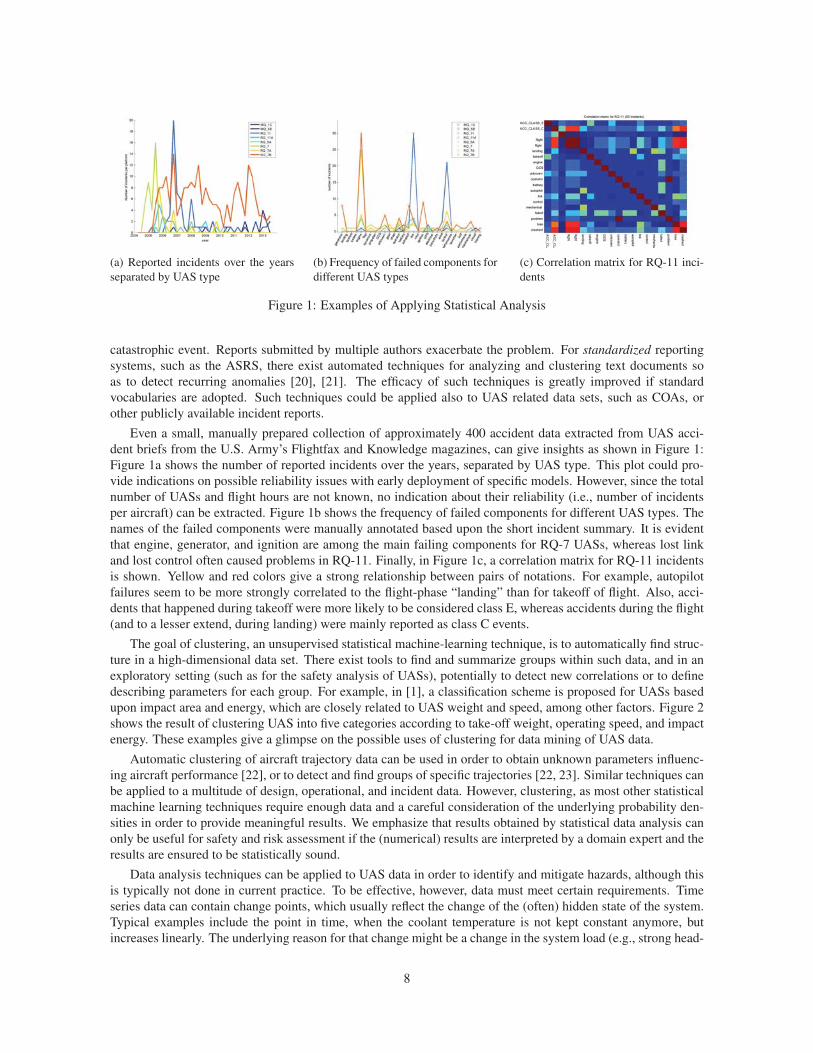
(a) Reported incidents over the years
separated by UAS type
(b) Frequency of failed components for
different UAS types
(c) Correlation matrix for RQ-11 inci-
dents
Figure 1: Examples of Applying Statistical Analysis
catastrophic event. Reports submitted by multiple authors exacerbate the problem. For standardized reporting
systems, such as the ASRS, there exist automated techniques for analyzing and clustering text documents so
as to detect recurring anomalies [20], [21]. The efficacy of such techniques is greatly improved if standard
vocabularies are adopted. Such techniques could be applied also to UAS related data sets, such as COAs, or
other publicly available incident reports.
Even a small, manually prepared collection of approximately 400 accident data extracted from UAS acci-
dent briefs from the U.S. Army’s Flightfax and Knowledge magazines, can give insights as shown in Figure 1:
Figure 1a shows the number of reported incidents over the years, separated by UAS type. This plot could pro-
vide indications on possible reliability issues with early deployment of specific models. However, since the total
number of UASs and flight hours are not known, no indication about their reliability (i.e., number of incidents
per aircraft) can be extracted. Figure 1b shows the frequency of failed components for different UAS types. The
names of the failed components were manually annotated based upon the short incident summary. It is evident
that engine, generator, and ignition are among the main failing components for RQ-7 UASs, whereas lost link
and lost control often caused problems in RQ-11. Finally, in Figure 1c, a correlation matrix for RQ-11 incidents
is shown. Yellow and red colors give a strong relationship between pairs of notations. For example, autopilot
failures seem to be more strongly correlated to the flight-phase “landing” than for takeoff of flight. Also, acci-
dents that happened during takeoff were more likely to be considered class E, whereas accidents during the flight
(and to a lesser extend, during landing) were mainly reported as class C events.
The goal of clustering, an unsupervised statistical machine-learning technique, is to automatically find struc-
ture in a high-dimensional data set. There exist tools to find and summarize groups within such data, and in an
exploratory setting (such as for the safety analysis of UASs), potentially to detect new correlations or to define
describing parameters for each group. For example, in [1], a classification scheme is proposed for UASs based
upon impact area and energy, which are closely related to UAS weight and speed, among other factors. Figure 2
shows the result of clustering UAS into five categories according to take-off weight, operating speed, and impact
energy. These examples give a glimpse on the possible uses of clustering for data mining of UAS data.
Automatic clustering of aircraft trajectory data can be used in order to obtain unknown parameters influenc-
ing aircraft performance [22], or to detect and find groups of specific trajectories [22, 23]. Similar techniques can
be applied to a multitude of design, operational, and incident data. However, clustering, as most other statistical
machine learning techniques require enough data and a careful consideration of the underlying probability den-
sities in order to provide meaningful results. We emphasize that results obtained by statistical data analysis can
only be useful for safety and risk assessment if the (numerical) results are interpreted by a domain expert and the
results are ensured to be statistically sound.
Data analysis techniques can be applied to UAS data in order to identify and mitigate hazards, although this
is typically not done in current practice. To be effective, however, data must meet certain requirements. Time
series data can contain change points, which usually reflect the change of the (often) hidden state of the system.
Typical examples include the point in time, when the coolant temperature is not kept constant anymore, but
increases linearly. The underlying reason for that change might be a change in the system load (e.g., strong head-
8

Figure 2: Clustering of UAS into 5 categories [1]
wind) or a broken coolant pump. The change point is the most likely point in time when the change occurred,
and data analysis is required to estimate such change points, in particular in the presence of noise.
Other examples include a sudden change in vertical velocity or a broken engine bearing resulting in high
vibrations. Similar change points can, for example, be detected in the analysis of maintenance and operational
logs. Such change points need not be discontinuous but they can be smooth or a change occurs in multiple
dimension. The recognition of such trends can reveal insights into potentially safety-relevant issues. For example,
a slow degradation would be detected and could provide hints to an event, when the degradation started.
2.4 Categories of Hazard and Risk Related Data
2.4.1 Data Requirements Induced from Safety Analysis
We assume a standard UAS system organization comprising an airborne component, a Ground Control Sta-
tion (GCS) and communication infrastructure, and also assume that any given UAS provides at least the follow-
ing types of functions: communication, navigation, control. The outcome of safety analysis establishes safety
requirements, some of which may be achieved by a combination of the existing UAS functions, while others will
necessitate the definition of particular safety functions. Safety analyses will require, at the very minimum, data
from the following areas:
• Aircraft performance: Design specifications, with which to characterize and identify hazardous deviations,
together with empirical flight data to support the estimation of frequencies, and therefore the likelihood, of
the deviations.
• Communications: Command and control link availability for line-of-sight and beyond-line-of-sight opera-
tions.
• Human performance, e.g., human response times, human/machine interactions in the GCS, crew proce-
dures, skill, training, and workload.
• Repair and maintenance, including maintenance procedures, maintenance frequency, and parts as well as
correlations with flight and performance data.
9

• Failure data: these may include total failures, such as engine-out, or lost-links, or failure modes of the
system, its subsystems and components, as well as failure rates/probabilities.
• Air and ground lethality statistics: flight data statistics
• Environmental data: noise, emissions, impact on environment
• Individual event descriptions: phase-of flight, mission type, operating conditions,
• Individual event occurrence: nature of accident/incident type, severity, etc.
To an extent, these data categories allow characterization of potential hazards, their causes, and the risk posed
(if likelihoods, e.g., in terms of failure rates can be gathered for failure hazards). In effect they represent safety
management information, and are a subset of that which is to be considered as a source of hazard introduction
As such, it is to be considered when conducting a comprehensive hazard analysis, and it corresponds to the type
of data already solicited by the FAA for existing approval to operate in the NAS, e.g., through the COA process.
(Also see Section 3.2.1).
Appendix D lists the data reporting obligations, imposed as part of the FAA’s UAS test site selection require-
ments. The data can be directly mapped to the categories identified above, as well as to data requirements for the
initial steps of safety analysis conducted as part of the SRM process. In brief, the data to be collected concerns
aircraft design information, flight data, crew data, various (potential) anomalies directly mapped to deviations in
subsystem and component behaviors and/or states as well as training data related to procedures and crew. Data
is also sought on malfunctions, defects, incidents and accidents, about which we give more details subsequently.
2.4.2 Incident and Accident Data
In [24], two primary perspectives have been presented as regards aviation risk data: incident data and risk expo-
sure data. The former is generated when events occur that are, or could be, indicators of the unsafe operation of
the system. The latter is the information necessary to establish the overall risk to an aviation system, i.e., data
defining the context for incident data. Table 2 shows different types of data in these two categories.
Table 2: Incident and risk exposure data
System Generated Human Generated Operational System
UAS Telemetry Accident/Incident Reports Mission Profile/Planning Maintenance Logs
Ground Control Station Air Traffic Information Test and Certification Data
On Board Data Recorder Weather Information Performance Models
Incident Data Risk Exposure Data
Most UAS operators are required to report incidents and accidents as part of the conditions of the COA or
SAC-Exp. Currently, there is no standard on the format and the information that is to be kept (and, to that
end, one of our recommendations is to standardize this format; see Section 5). Some of the accident/incident
reports (and or parts thereof) are publicly available. For example, the U.S. Army uses the publicly available
DA Form 2397-U [25] specifically for UASs, whereas the U.S. Air Force uses a conglomerate, but also public,
“Mishap” Report AF711B9. The Navy and the FAA however initially keep their reporting secure, through the
most modern of the techniques, the Web Enabled Safety System (WESS)10 and the Obstruction Evaluation /
Airport Airspace Analysis11 electronic incident reporting systems respectively. All of these forms and electronic
submission systems ask for largely the same data, including time and location, aircraft type and COA (in the case
of the FAA). As for the electronic systems, a large part of the data is selectable, which greatly assists in data
mining such as incident categorization. Unfortunately, much of the data relating to incidents remains anecdotal,
based on interviews and eye witness accounts, but is still important for collection.
9[Online]: http://www.e-publishing.af.mil/10[Online]: http://www.public.navy.mil/navsafecen/Pages/wess/WESS.aspx11[Online]: https://oeaaa.faa.gov/oeaaa/external/portal.jsp
10

System Generated Incident Data: This is information captured automatically by the UAS, is system generated
data that can provide insight into incidents/accidents. In general, human intervention is not required to
capture system generated data.
Telemetry Data: UAS telemetry data is a data stream that is transmitted from the aircraft to the GCS via a com-
munications link. Telemetry data contains information about vehicle dynamics as reported by a broad range
of sensing devices, navigational information relating to on-board observations of the physical environment,
and guidance information relating to autopilot operations. In addition, telemetry typically contains a great
deal of health and status data reporting the well-being of the vehicle subsystems and payload. Telemetry
data are downlinked to the GCS either in regular intervals or upon request from the GCS station.
Raw telemetry data contains a large amount of (typically labeled) information which can be logged as
time-stamped data records. Mining this data can yield safety-relevant information such as detailed vehicle
dynamics, i.e., translational and rotational accelerations (therefore velocities), actuator response curves,
overall vehicle response-to-command curves, and propulsion details.
Uncertainties and errors (with respect to the intended trajectory), may also be gauged from telemetry data,
e.g., errors in the trajectory resulting from deviations due to weather. This is particularly relevant for small
UASs, since wind speed and turbulence may influence their behavior significantly more than for a large
and heavy aircraft.
Risk Exposure Operational Data: Typically, all commercial flights in the NAS are recorded by the different
Air Traffic Control (ATC) centers. Every 12 seconds, flight number, aircraft type, as well as position,
ground speed, heading, altitude are recorded (usually based upon radar). Detailed information about the
weather (wind speed, wind direction, and pressure) is available. Depending on the UAS type and mission,
the UAS might or might not show up in these data. However, these data can be valuable for setting up
simulations and evaluation of techniques like see-and-avoid, as these data reflect actual air traffic in the
NAS.
Risk Exposure Systems Data: These may further be categorized as:
Maintenance Logs:
For most UAS, detailed maintenance logs are kept. For NASA aircraft, such information is, for ex-
ample, kept in the NAMIS data base. Maintenance records do not only cover scheduled inspections,
but include reports on components that had to be repaired or replaced due to some failure or incident.
Mining this information can yield valuable information about reliability of the UAS system, detec-
tion of critical and high-maintenance components, detailed information about repair actions after an
incident. When correlated with incident reports, often a more detailed view can be obtained.
Test and Certification Data:
Any UAS certification attempt generates large amount of data in the form of plans, tests, reports,
etc. These data, when analyzed can provide valuable information not only on certain aspects of the
UAS system, but also on how the actual certification process was carried out and where issues and
delays showed up. For our purposes of the analysis of avionics and software, it should be noted that
DO-178C specifically elaborates on data that must be assembled and presented during development
of flight software. Although most likely, DO-178C will not be directly applicable, this list can be
used as guidance on which software-engineering related data should be generated during software
certification.
Performance Data:
Performance data includes major characteristics of the UAS like weight, wingspan, speed, payload,
maximal altitude and range, etc. For many existing UAS, these data are available in various lists and
data bases and can be used mainly for UAS classification and risk analysis purposes.
Aerodynamic Models and Data:
11

Aerodynamic models of aircraft are used within aircraft simulators as well as for advanced air traffic
control algorithms. The availability of such model facilitates the setup of simulators for training
purposes, the analysis of UAS incidents, and UAS simulations in the NAS.
2.4.3 Data Requirements for Statistical Analysis and Data Mining
Data collected from UAS design, certification, operations, and incidents come from multiple heterogeneous
sources and can have varying formats or drastic differences in size; these characteristics must be properly con-
sidered, for data mining and statistical data analysis. We mainly focus on the following kinds of data:
Numerical: These data can be in tabular form (e.g., mass and altitude ceiling for each UAS type), or can be
comprised of one or more time series, which can be of variable length. Typically, telemetry data, flight
plans, etc. fall under this category. However, missing and invalid data must be recognized properly before
applying statistical/data mining techniques.
Textual: Typically incident reports fall under this category. If these reports are written in a highly stylized,
regular manner, automatic text mining techniques are likely to be more successful in mining relevant
information from the text. Usually, however, a high amount of preprocessing may be required to make
textual data amenable to automated data analysis.
Spatial: Data sets like weather or maps fall under this category. These are usually numerical data, which are
structured as two (or three) dimensional grids.
Image: Images can be part of the data, e.g., as part of incident reports or design and manufacturing reports.
Given the current data sets it seems unlikely that image data will be subject to (automatic) data mining.
Sparse/Skewed: Most safety-relevant events occur very infrequently; often with frequencies of 1E-05 or less.
Most statistical data analysis techniques, however, poorly operate on such skewed data.
Missing: Often, not all data items of a data set are available; some data might be missing due to recording
failures (e.g., missing telemetry data when the communication link is down), drop-outs, or due to the
unavailability of certain artifacts. Data mining algorithms have to properly deal with these situations.
Data Confidence: Most data items are subject to errors and uncertainties. For example, telemetry data for
position and velocity depend on the accuracy and operational condition of the GPS and other sensors.
These inaccuracies are different from, e.g., NAS track data, because the data rely on different measurement
and sensor systems.
Proper data mining and data analysis has to take the different uncertainties into account, e.g., when ana-
lyzing separation violations. Data gathered by human observation can also be subject to errors and inac-
curacies.
Once different data has been collected, e.g., of the kind mentioned above, data mining can be applied to
obtain meaningful and valid results from raw data. The following steps are usually applicable:
Data Acquisition: UAS data is available in many different raw formats as in the preceding discussion; for most
data mining applications, data formats must be appropriately converted.
This step involves not only a detailed knowledge of the structure of the data (which may change over
time), but also can require steps like optical scanning and conversion of printed documents. If data sources
are dynamic (e.g., a repository of incidents) or change over time, a snapshot of exactly the data that have
been used for mining is to be kept. The data to be mined must be obtained and made accessible for the
analysis tools. This can range from a simple file storage to complex database accesses. Of importance is
the accurate documentation of this step in order to be able to reproduce data mining results.
Preprocessing and Feature Extraction: Often an entire data set is of an unsuitable format or can contain more
than necessary information for the mining activity at hand.
12

For example, not all telemetry data (which are high-dimensional time series) may be necessary. A method
known feature extraction is able to dramatically reduce size and complexity of the raw data set by de-
scribing the data using one or more features, which are linked to the analysis task. However, the set of
features must be suitable for the data mining task and must be (usually manually) selected before the actual
analysis. Subsequent analyses usually require re-running of the feature selection process.
Other relevant steps involve recognition of missing data/outliers, dimension reduction, slicing, principal
components analysis, and normalization. The latter is particularly noteworthy, when considering value
ranges of numerical data, to which many data analysis algorithms are particularly sensitive. For example,
a joint analysis of the altitude in feet and the Mach number is calling for trouble: typical values for altitude
are of the order of 103 or 104 whereas (typical) Mach numbers are unlikely to exceed 10. An analysis, of
altitude and Mach number therefore requires normalization, e.g., in a range from [−1, 1], without loss of
generality.
3 Data Sources
With more than 50 countries12 around the world operating UASs, there is the potential for identifying a wealth
of data characterizing UAS incidents, accidents, and normal operations. In this section, we list the outcome of a
semi-systematic literature and website survey.
3.1 Primary Sources
3.1.1 National Aeronautics and Space Administration (NASA)
NASA supports three database systems related to aviation safety: NASA Aircraft Management Information
System (NAMIS), Aviation Safety Reporting System (ASRS), and NASA Incident Reporting Information Sys-
tem (IRIS), the intent of which is to capture information about mishaps, incidents, accidents, and other failure-
related aircraft data. NASA operates a variety of UAS platforms, including the SIERRA, Ikhana, Global Hawk,
Dryden Remotely Operated Integrated Drone (DROID), Dragon Eye, BAT-IV, and the Swift UAS, the data for
which are also captured in the three databases given above.
Table 3: NASA Data Sources
����������� ����������������������� �����������
����� ��
���� � ������
���� �
�������������
������������������������� !"
���������������������������������������������������������������� ��
��� �������������������!� ���"��������
#$���%���������� �!���� �������������%���������������������&��� ��������
'������(�!&���&"����������������)���
�����������)����
*���������+����%�������,�������� ��+�����������������
���������������������������,����%����������� ��������������,�����+�����
�����������
�� ��+������������%��"������������������������������������������
����������+�������������������-�����. �������������%��������%��������������������
�����������)����
12Wikipedia: [Online]: http://en.wikipedia.org/wiki/List_of_unmanned_aerial_vehicles
13

NASA Aircraft Management Information System
The NASA Aircraft Management Information System (NAMIS) database records aircraft maintenance activities
and flight status, rather than accidents or incidents. For example, it tracks grounding discrepancies, inspections,
aircraft configurations, crew flight status, crew proficiency currency, and parts logistics. It also provides contin-
uous and active control of all assets, including materials, parts, and equipment, and provides data and metrics to
support business decisions and financial reporting as required by NPR 7900.3C [26].
However, this information is potentially very useful for analysis so as to quantify, and possibly detect potential
hazards. For example, a critical electrical component that breaks down or has to be replaced frequently could
potentially be the initiating event of an incident. Similarly, software components that “lock-up” frequently, may
be a similar precursor or initiating event. Additionally, there is a potential for reliability quantification, for
example by correlating component failure and repairs with incident reports from IRIS or other flight logs. The
relevant information for all NASA manned aircraft and all UASs weighing more than 330 pounds is recorded in
NAMIS.
NAMIS contains records for NASA’s Global Hawk UASs, the Ikhana UAS, and the Sierra UAS, as well as
their Ground Control Stations (GCSs). The GCS are tracked as separate entities, making this an unusually valu-
able source of data. NAMIS is only accessible with approval and an account. NAMIS tracks crew proficiency
currency, aircraft maintenance, and parts logistics, so it’s usefulness may be for identifying reliability, or corre-
lating component failure and repairs with incidents reports from IRIS or other flight logs. It is required for fall
NASA UASs weighing more than 330 lbs.
Aviation Safety Reporting System
The ASRS database system contains voluntarily submitted reports about aviation safety incidents, hazards, or
concerns from all aviation participants: pilots, flight crew, air traffic controllers, ground personnel, and others.
ASRS does not contain or allow reports of accidents or criminal offenses. It collects, analyzes and responds to
these reports, with the broad goal of reducing the likelihood of similar incidents, and guarantees anonymity to
its reporters, thus encouraging accurate reporting. The ASRS has an extensive database describing all aspects
of an incident with detailed information, i.e., separate database fields, about all aircraft involved, all personnel
involved, location, weather, phase of flight, the incident reporter’s narrative of the event, and so on. The ASRS
organization has recognized the need for collecting accurate information about UASs and is moving to update
their database schemas to include information unique to UASs.
In terms of understanding the incidents in the ASRS database, the narratives provide the most context and
information. The narratives are the reporters’ descriptions of what happened and why they believe the situations
posed safety hazards. Narratives are thus subjective and free-form, but still provide valuable insight into unsafe
events.
An example of a typical narrative is (ASRS report 1003371):
Pilot was cleared to descend and maintain 15,000 MSL while still on an active IFR flight plan.
Pilot initialized descent from 18,000 FT as part of UAV chase and recovery procedures with chase
aircraft providing visual separation services. Pilot was involved with checklists and rushed during
descent phase. Pilot continued descent through 15,000 FT and forgot to contact ATC to cancel
IFR as intended. Controller asked pilot to advise of intentions when descending through 12,000
FT. Pilot notified Controller to cancel IFR; Controller advised IFR cancellation received, maintain
VFR. No further incident. Pilot was in VMC and maintaining visual separation from any other
aircraft in the area through the use of a chase aircraft and radar feed as allowed by FAA Certificate
of Authorization. Contributing factors were the complicated procedures required by the Certificate
of Authorization chase requirement and the pilot’s attempt to rush through the process including
checklists and procedures required for descent and landing. CRM was utilized to resolve the error
when the pilot not flying alerted the pilot flying to the fact that ATC was calling for him. Corrective
actions include slowing down on checklist items and not allowing pilot to be rushed. Also cancel
14

IFR as soon as allowable in descent process.
A preliminary review suggests that the majority of UAS incidents in the ASRS database are caused by human
error rather than equipment problems. Typical anomalies called out in the reports include airspace violations,
airborne conflicts or near misses, excursions from assigned altitudes, and failures to follow procedures.
ASRS reports are publicly available and ASRS allows requests for custom reports based on their internal
database versions. It is effective because of the anonymity given to persons submitting reports. The federal avia-
tion regulation Part 91.25 prohibits regulatory enforcement against those submitting reports. The FAA advisory
circular AC-00-46E states that NASA is responsible for operating ASRS.
Custom reports may produce different results than apparently similar reports generated through the public
ASRS interface. There are several potential reasons for this. ASRS maintains separate internal and public
databases. The internal database contains raw reports with “non-anonymous” information – it takes time for
initial reports to be processed and sanitized so that they can be released to the public and still maintain ASRS’s
mandated anonymity of reporters. So custom reports will be run against different data than public reports.
Additionally, the ASRS database has been evolving to handle UAS incident reports. Like the reports them-
selves, the evolved schema take time to propagate from the internal to the public databases. So it may be possible
to run more precise UAS queries against the internal database than against the public one.
Incident Reporting Information System
IRIS is an online database for submitting safety incidents, mishaps and close calls that occur during NASA
operations and missions as required by NASA Procedural Requirements NPR 8621.113 and NPR 7900.3C [26].
Not all flight anomalies warrant a report unless required by criteria specified in NPR 7900.3C, and anonymous
reports are allowed.
Thus, the IRIS system is NASA’s internal incident reporting system. It contains reports of both aviation and
non-aviation incidents. As such, the database fields are not specific to aviation concerns. Access to IRIS is
restricted because of individually identifiable and other sensitive information it contains; however, it appears that
aviation specific information in the accident reports would be limited to textual (narrative) fields.
3.1.2 Other U.S. Government Agencies
Table 4 summarizes and minimally qualifies the data sources provided by other agencies of the U.S. Government.
Aviation Accident Database (NTSB)
The National Transportation Safety Board (NTSB)’s website contains a variety of documents and resources,
including monthly lists of accidents, lists of investigations nearing completion, downloadable data sets for each
year’s accidents, and other data products.
Of particular relevance to this study, the NTSB’s website gives access to the Aviation Accident Database,
which contains reports from the formal investigations of all civil aviation accidents and selected incidents.
Through the database’s the query system, users can obtain both the factual and probable cause reports on in-
vestigations. In both cases, most of the details are in the narrative portions of the reports, though there are
specific fields for such data as aircraft type, personnel, date, location, and so on. The entire database can also be
downloaded for offline processing.
An example of a report of the facts behind an incident is the following, from a December 19, 2011 crash of a
Meridian UAS at McMurdo Station, Antarctica.
13NPR 8621.1, NASA Procedural Requirements for Mishap and Close Call Reporting, Investigating, and Recordkeeping. Oct. 2011.
[Online]: http://www.hq.nasa.gov/office/codeq/doctree/8621.htm
15

Table 4: Other US Government Data Sources
������������ ��� ������ ������������ ���������������������� ������������
��������������� ����������� � ������
����������������������� ���� �� ������������ �
� ������
� ������
������� ������������ ���� ������������ � ������
�� ����!���� "#� ������
�� ����$ ��� �$������������$�� ��������� �� �������� "��� ������
�� �% $ & ��'��� ����' �� ���� ���$��� ( ������
�������������������������� !#$%
%) *�� ������������& � � ��
% ���� �)� ������ ���� ���$*� ��+%) *,
��������� ��'��� ����' ���� ��'���������'����������'��-�
�����������'��������
!���� ��� ����.���� ������������� $����+!�.� ,
/���� � ��������������� ����+/ �,
����� ��������������'�� �� ������ ���� ������'��������� ��
��������
���������������'��������� �� ��������
������
���$0������1��+ �!2034,
� /������� � ���$+� / ,
���$ ��������'���������'���� �� �������� ���������� / ���� �����
.��������$��'�����������'��5�����6� � ������'� � ������� ���'
��� ����'� ��
�������� ��.�������& � $����+�.& ,
!���� ��� ������������� ����+!��,
& � ��������������� � � ���� ���������� � ��� �������������������(�7#
��������� ��'��� ����' ���� ��'���������'����������'��-������������
%� �4�� ��0�������� $����+%4�0 ,
!���� ��� ������������� ����+!��,
& ��'��� ����' ���� ��'�� ����������'�� ����'�1��������� ���'� ������'
� �� ���
�� ����!����8��������.������ ����*� ��+�.*,
4��� ��������
.������ ������������0� ��� ����������������� ����!���� ���� ��
% �� ������������������� ��������� ���������0������ ����'����$��� ��$����������� ����'� ��'���������'
���� ��'� ����
�� ����$9��������4 � :���
��������6���������� ��'� ��' ���� ���$��'� ��� ������'��-�� ������������
% � ���$0�����
+034%�; �!202%,
� �������'��������������' ����������� ������% $ � �������� ��
On December 20, 2011, at 1517 local time (0317, December 19, Coordinated Universal Time
(UTC)), an experimental Meridian unmanned aerial system (UAS), built, owned, and operated by
the University of Kansas under a National Science Foundation grant, crashed on final approach to
the Pegasus Ice Runway at McMurdo Station, Antarctica. The aircraft was substantially damaged,
and there were no injuries or ground damage.
The aircraft was returning from a flight test in which the airplane was controlled via an over-the-
horizon satellite (Iridium) control link. Approximately 60 seconds prior to the accident, the pilot
took over direct control of the aircraft via 72MHz radio control (similar to a model airplane). On
final approach, as the aircraft was commanded low power and nose down pitch, the aircraft lost
the 72MHz link, and as programmed the flight control system switched to an autopilot Manual
(Assisted) mode. The Manual (Assisted) mode commanded the aircraft to predefined failsafe settings
of 100 knots airspeed and neutral controls, resulting in about 27 degrees of nose up pitch change.
After about one second, the control mode was changed from the failsafe setting to the Home mode,
which was inadvertently left latched due to a functionality test earlier in the flight. The Home mode
commanded the airplane to climb toward the home waypoint, which was over the runway, and enter
an orbit. The airplane was well below the home altitude and at low airspeeds for approach. The
command resulted in a power-on stall and steep nose down descent. Radio control link was re-
established but too late to recover from the stall. The airplane impacted the ice runway and was
substantially damaged.
A preliminary review of the Aviation Accident Database shows that the NTSB attributes most UAS accidents
to human error. Among the causes of or contributing factors to the accidents investigated are misconfigured
ground stations, inexperienced pilots, air traffic controllers being distracted by unusual UAS behavior, and failure
to follow checklists.
Federal Aviation Interactive Reporting System (General Services Administration)
The U.S. General Services Administration Federal Aviation Interactive Reporting System (FAIRS) contains
mainly usage, operational cost and asset information about federal non-military aircraft. However, it does provide
16

information on aircraft mission hours, aircraft inventories, incidents, and accidents.
Aviation Safety Communique (United States Geological Survey)
The U.S. Geological Survey Aviation Safety Communique (SAFECOM) is the aviation mishap database14 used
by the Department of the Interior and the Department of Agriculture Forest Service. It specifically allows report-
ing of and querying for UAS mishaps. As with most other databases, there are only specific fields for descriptive
information (aircraft type, date, location, and so on). Accident causes, event sequences, and corrective actions
are described in the narrative text field. SAFECOM records are textual reports with sections describing the
event (e.g., date, location), mission (e.g., type, destination, persons on board), aircraft (manufacturer and model),
narrative (textual itemize), corrective action (textual itemize), and any relevant attachments.
SAFECOM records do not include reports from formal investigations of the incidents. They generally include
assessments by the participants in the incidents of what went wrong and what corrective actions are needed.
Aviation Safety Information Analysis and Sharing (Federal Aviation Administration)
The Aviation Safety Information Analysis and Sharing (ASIAS) is an FAA portal to a number of safety and
incident databases, as well as a number of studies based on those databases. Eventually it is expected to include
at least sixty four such databases. ASIAS is the result of collaboration between the federal government and
industry and is intended to be used for data sharing and analysis that will lead to improved aviation safety.
Accident and Incident Data System (Federal Aviation Administration)
The FAA’s Accident and Incident Data System (AIDS) system contains reports on aviation incidents not serious
enough in either injuries or damage to meet the NTSB definition of “accident”, but which still could have an
impact on aviation safety. The database contains the usual background information as individual database fields
and uses a “Remarks” text field for the description of the incident. This is one of the publicly accessible databases
available through the FAA’s ASIAS portal (described earlier). AIDS has FAA data on aircraft incidents and
accidents. An incident is an event which is not serious enough to be classified as an accident by the NTSB.
These incidents still provide valuable safety information relevant to, for example, aircraft design.
Near Mid-Air Collision System (Federal Aviation Administration)
Near Mid-Air Collision System (NMACS) is a database that records reports of near mid-air collisions between
civilian aircraft or civilian and military aircraft (i.e., near misses between two military aircraft are not reported
in NMACS). It is provided by the FAA as a mechanism for voluntary reporting. Pilots and other flight crew
members are encouraged, but not required to submit NMACS reports when they believe they have witnessed an
incident. Consequently, NMACS warns that its reports are inherently subjective. NMACS contains fields for
the facts of the near collision (location, date, weather, pilot(s), experience levels, aircraft types, etc.). There are
several narrative text fields containing descriptions and impressions of events from the perspective of the different
participants.
3.1.3 Branches of the U.S. Military
U.S. Air Force
The U.S. Air Force maintains a website15 of textual investigative reports on all Class A accidents involving its
aircraft, including unmanned aircraft, where a Class A accident is one that results in “fatality or total permanent
14[Online]: https://www.safecom.gov/default.asp15[Online]: http://usaf.aib.law.af.mil/
17

disability, loss of an aircraft, or property damage of $2 million or more.” The reports are all narrative text with a
standardized format: first a recitation of the facts (background, sequence of events, maintenance history, aircraft
condition, etc.), then an analysis and conclusions about the cause of the accident. Summaries of most Air Force
Class A accident reports were publicly available on the website, at the time of access. Some reports are classified
and thus unavailable. Reports from FY2011 onward may include both summaries and full narratives. Many
reports from FY2008 required login to a secure website and thus are not publicly available.
U.S. Army
The U.S. Army does not maintain a publicly available database or website of aviation accident or incident reports.
However, it provides official statistics16 of the numbers per year of Class A, B, and C UAS mishaps, and it
publishes a monthly magazine promoting safe operations and behavior, “Knowledge”17. This magazine contains
brief one to two sentence reports on accidents reported to it during the past month. There is a separate section
for UAS accidents.
U.S. Navy and Marines
The U.S. Navy and Marines do not have publicly available databases of detailed aviation mishap reports or
investigations. Their Naval Safety Center (COMNAVSAFECEN) maintains a website18, which offers summary
statistics and one-line reports of some of their UAS incidents.
3.1.4 Foreign Governments
Table 5: Non-US Government Data Sources
������������ ������� ���� ����� ������������ ����������������������� ������������
��������� ����� ��������������������������������� � ������
��������� � � ������
��������� � ������
����� ����� ��������������������������������� � ������
�������� ��� � ������
�������������������������� !"&
������������������������� ���������
������
�������������������������������
!�������������������������� ������������������"��������������#������������������������������#�����#��������#���������#������#������������������������"
������$��������� �������������
����� ����������������������������%�����������������
!�������������������������� ������������������"��������������#������������������������������#�����#��������#���������#������#������������������������"
�������������&��'������������
�������������������������������
������������������������������� ��$�����������(��'
������������#��������#���������#��������#���������#���������%��
����������
������������� ����� ������
����������������������������������
!�������������������������� ������������������"��������������#������������������������������#�����#��������#���������#�������
���������������)������$� ������
����������������� ���������$�
*���+
,�������������#����$�����������#�����������������#���������������#��������������������#��������� �������������������
���������������������������
!�������������������������� ����������������������������������������������"��������������#������������������������������#�����#��������#���������#�������
16[Online]: https://safety.army.mil/statisticsdata/ARMYSTATISTICSREPORTS/tabid/373/Default.aspx17[Online]: https://safety.army.mil/knowledge_online/archives/18[Online]: http://www.public.navy.mil/navsafecen/Pages/execsummary/AviationSummaries.aspx
18

Australia
Under Section 18 of Australia’s Transport Safety Investigation Act 200319, all aviation accidents and serious
incidents must be reported to the Australian Transport Safety Board (ATSB) immediately.The ATSB produces a
number of documents relevant to UAS mishaps, including: safety investigations and reports, short investigation
bulletins, and weekly summaries. Investigations of serious or complex accidents20 (ATSB Levels 1 through 4
accidents) produce full investigation reports, available through their website21. To date there have been no full
investigations of UAS mishaps. The ATSB’s short investigation bulletins summarize limited scope investigations
of less complex (Level 5) mishaps and are available through their website22. To date there have been no short
investigations of UAS mishaps.
The ATSB Aviation Weekly Summaries23 are spreadsheets and PDF documents with brief descriptions of
aviation mishaps reported during the week prior to publication. They include a limited number of factual fields
(location, date, aircraft type, etc.) and a terse (one or two sentence) description of the incident. To date there
have been seven UAS-related incidents reported in the weekly summaries.
United Kingdom
As specified in the United Kingdom Civil Aviation Authority (CAA)’s CAP 722 [27], all accidents or serious
incidents involving a UAS must be reported to the Air Accident Investigation Branch (AAIB). All other oc-
currences should be reported under the CAA’s Mandatory Occurrence Reporting (MOR) Scheme, as specified
in CAP 382 [28]. The AAIB publishes formal investigative reports of aviation accidents and serious incidents
in or of interest to the UK, along with other bulletins, interim reports, and annual safety reports. As with the
other official investigative reports, these are structured narratives starting with an accident’s factual information,
then analysis, followed by conclusions, and ending with safety recommendations. The investigative reports are
available through the AAIB’s publications website24. As of May 2013, there are no UAS related accident reports.
Canada
The Transportation Safety Board of Canada (TSB)25 investigates aviation accidents and incidents “when there is
a high probability that it can advance transportation safety and reduce risks to persons, property or the environ-
ment”. Active (i.e., ongoing) investigation summaries, completed investigation reports, and aviation statistics are
available from its website26.
The TSB’s Aviation Investigation Reports27 are a series of narrative reports similar to the NTSB or AAIB
reports. They are structured narratives with sections containing the facts of the accident, an analysis, the board’s
findings, and safety recommendations. To date there are no reports related to UAS accidents.
3.2 Performance Data with Safety Relevance
3.2.1 Data from Existing Approval Procedures
The FAA already requires UAS proponents to supply the following data, which represents the safety management
information needed to determine UAS contribution to (NAS) hazards and their mitigation. A COA application is
19[Online]: http://www.atsb.gov.au/about_atsb/legislation.aspx20[Online]: http://www.atsb.gov.au/about_atsb/investigation-procedures.aspx#fn221[Online]: http://www.atsb.gov.au/publications/safety-investigation-reports.aspx?mode=Aviation22[Online]: http://www.atsb.gov.au/publications/publications-list.aspx23[Online]: http://www.atsb.gov.au/aviation/weekly-summaries.aspx24[Online]: http://www.aaib.gov.uk/publications/index.cfm25[Online]: http://tsb.gc.ca/eng/enquetes-investigations/index.asp26[Online]: http://tsb.gc.ca/eng/enquetes-investigations/aviation/index.asp27[Online]: http://tsb.gc.ca/eng/rapports-reports/aviation/index.asp
19

typically required to contain the following items 28:
Proponent description indicating the applicant for the COA.
Operational description which includes a program executive summary, and an operations summary. The latter
itself includes items such as the class of airspace for the intended operations, e.g., Class “D”, altitude of
operations, flight times, flight duration, flight frequency, class of operations, e.g., visual/instrument flight
rules (VFR/IFR), time of day, location, etc.
System description which contains descriptions of the aircraft system, control station, communications sys-
tems, certified technical standard order (TSO) components, and other pertinent systems information, in-
cluding aircraft images.
Performance characteristics such as climb/descent/turn rates, operating altitudes, cruise speeds, approach speeds,
take-off weights and procedures for launching and recovering the aircraft.
Airworthiness statement based on the guidelines outlined in [29], that demonstrates that the aircraft is fit to fly.
The airworthiness statement is created by certification of the aircraft against criteria set forth in guidance
documents such as the Department of Defense (DoD) handbook MIL-HDBK-516B. For NASA, equivalent
documents would be NPR 7900.3C [26], together with center-specific procedural requirements, e.g., APR
1740.129 at NASA Ames Research Center.
In [30], guidelines on the data requirements of an airworthiness statement are given, using MIL-HDBK-
516A as the (self) certification basis.30 To summarize, the statement indicates those sections that are
relevant to civilian UAS operations, since the original intent of the certification basis was for aircraft
capable of carrying ordnance. It also includes explanations of how each criterion in the sections applicable
for airworthiness has been addressed. Additionally, there are explanations why specific sections of MIL-
HDBK-516A are not pertinent to airworthiness, if they have been deemed as such, during the preparation
of the statement.
Relevant sections include systems engineering, structures, flight technology, propulsion, air vehicle sub-
systems, diagnostic systems, avionics, electrical systems, electromagnetic environmental effects, system
safety, computer resources, maintenance and other considerations. We do not provide the specific details
of the data required in each section, since they are aircraft-specific.
However, in general, the airworthiness statement in this case can be considered as a comprehensive com-
pendium of documentation including checklists, flight logs, maintenance logs, operational procedures,
supplied in addition to specific data that demonstrates why a UAV is capable of attaining, sustaining and
terminating flight in a safe manner.
Procedures for lost link/mission, lost communications and emergencies.
In [30], specific types of lost link/mission, lost communications and emergency situations have been
identified: (1) inability of the pilot/operator/observer to perform their duties (2) loss of visual line of
sight (VLOS) by observers on the range (3) loss of communication between PIC and Observer, and with
ATC (4) uncontrollable UAV and violation of COA boundary (5) near mid-air collision (6) operator in-
terface software/computer failure (7) ground station failure (8) lost communication to UAV (9) engine
out (10) autopilot / servo power loss (11) uncontrollable aerodynamic surface (12) structural failure, and
(13) degrading autopilot performance.
The procedures to be given for each situation is dependent on the airframe, propulsion system, the autopilot
and the operating crew/team. Note that all of the situations given are hazards, some of which may be
28We have summarized these items from a sample COA application available on the FAA website: [Online]: http://www.faa.gov/about/office_org/headquarters_offices/ato/service_units/systemops/aaim/organizations/uas/coa/
29[Online]: http://server-mpo.arc.nasa.gov/Services/CDMSDocs/Centers/ARC/Dirs/APR/APR1740.1.pdf30Created by the Research and Engineering Center for Unmanned Vehicles (RECUV) group at University of Colorado, Boulder. Contrary
to the airworthiness statement issued by the Airworthiness and Flight Safety Review Board at NASA Ames, their approach is significantly
more detailed. Per our understanding, the FAA examines the airworthiness statement and validates it, using the supporting data provided and
the certification basis.
20

identified through the hazard analysis of the airspace system into which the UAS is being integrated, in the
same manner as in [31].
In this case, however, it appears that the analysis has been performed and the relevant mitigations defined
by the proponent, rather than by the FAA ATO.
Onboard avionics/equipment specifically, GPS, moving map indicator, tracking capability, collision avoid-
ance, emergency locator and transmitter (ELT), and transponder, together with its capabilities.
Lights/Spectrum analysis including (i) information for landing, position/navigation, anti-collision, and in-
frared lights, and (ii) approvals and authorizations for spectrum analysis and communications, if radio
control frequencies are used. The intent, here, is to gauge the capability of the operating UAS to minimize
the risk of mid-air collisions.
Air Traffic Control (ATC) communications for instantaneous two-way voice communication, including trans-
mitter and receiver frequency types and quantities, and methods.
Surveillance/Detection capabilities including those for both electronic and visual surveillance/detection, as
well as for aircraft performance recording, i.e., recording flight data, control station data and voice.
Flight operations areas/plans in detail, including the relevant map depictions, way-points or special use airspace
(SUA), and traffic patterns.
Aircrew qualifications and Special circumstances as appropriate, including qualifications and recent flight ex-
perience for all UAS flight crew-members, observers, and other personnel. Interim Operational Approval
Guidance 08-01 [29] proposes that UAS pilots be current with a manned aircraft license (even though it is
a different skill-set to piloting a UAS).
Launch/Recovery details, such as, for example, whether the UAS takes off and lands from a runway as op-
posed to say, a catapult, or platform. This could also have details of an autolander, and use of associated
communication equipment.
3.2.2 Sense and Avoid / Separation Assurance Integration (SSI)
Separation assurance (SA), and Sense-And-Avoid (SAA) are concepts to assure, and eventually enable, the safe
and seamless integration of unmanned aircraft systems (UAS) into the national airspace system (NAS). The
SA/SAA Integration (SSI) subproject (of the NASA UAS integration in the NAS project] is in the process of
developing a set of technologies to support the integration of SA and SAA.
Data Collected
In developing the concepts for SSI, a variety of research questions are being addressed, related to airspace inte-
gration, SAA performance requirements, SAA interoperability and impact, and the capabilities of the NextGen
air traffic management (ATM) system. For example, determining (a) the performance requirements for UAS con-
taining SAA equipment, (b) the SAA capabilities required to assure a specific minimum closest point of approach
(CPA) given performance characteristics of UAS and other aircraft, and (c) the effects of UAS performance char-
acteristics, missions, lost communications and lost links, lost SAA functions, communication latencies, etc. on
the NAS.
The approach involves a variety of methods including fast-time simulation, human-in-the-loop simulation,
non-simulation analyses, and flight tests. Examples of the fast-time simulation capabilities are the Airspace Con-cept Evaluation System(ACES) and the Multi Aircraft Control System (MACS). ACES is capable of simulating
gate-to-gate operations, but the focus is mainly on the en-route operation for UAS. Currently, the functions for
SA and SAA have been modeled to a level of detail to consider ATC decisions, algorithms for SAA as well as
pilot-based decision making. These require, and produce a variety of data, as shown in Tables 6 and 7.
21

Table 6: Independent variables in the SSI experiment categories
Airspace Integration SAA Performance Requirements SAA Interoperability and Impact NextGen Capabilities
UAS performance characteristics (cruise speed, climb/descent rate, heading rate, acceleration etc.)
UAS performance characteristics (cruise speed, climb/descent rate, heading rate, acceleration etc.)
Conflict resolution maneuver action time and/or distance for SAA system - for both self-separation and collision avoidance functions
Available controller tools (e.g. datalink, trial planner, R-side CD&R tool)
UAS altitude
SAA surveillance system performance (detection range, field of regard, update rate, uncertainties, latency, etc.) SAA algorithms and concepts
Available airspace/user capabilities (e.g. ADS-B/TIS-B, SWIM, TBO, RNP, CPDLC, SAA)
Geographic location and traffic density
Conflict parameters (encounter angle, time-to-CPA, knowledge of state/intent, uncertainty, intruder maneuvering) Interoperability concept
Available procedures (e.g. delegated separation, TBFM, Sensory Flight Rules [SFR])
UAS mission type (point-to-point vs. loitering)Airspace class (e.g. as limits type and character of intruders)
UAS performance characteristics (cruise speed, climb/descent rate, heading rate, acceleration etc.)
UAS performance characteristics (cruise speed, climb/descent rate, heading rate, acceleration etc.)
Uncertainty in vehicle and airspace state/intent parameters Flight rules UAS altitude UAS altitude
Algorithms for SA and SAA Typical intruder characteristics Geographic location and traffic density Geographic location and traffic density
Separation criteria for UAS (horizontal, vertical)
Required "avoidance" criteria (e.g. legal separation, well clear, NMAC volume) UAS mission type (point-to-point vs. loitering) UAS mission type (point-to-point vs. loitering)
CD&R time horizons for SA and SAA algorithms
Uncertainty in vehicle and airspace state/intent parameters
Uncertainty in vehicle and airspace state/intent parameters
Conflict resolution preference by aircraft type Algorithms for SA and SAASA/SAA concept (e.g. who is supposed to maneuver, when, and according to what surveillance info)
Separation criteria for UAS (horizontal, vertical)
CD&R time horizons for SA and SAA algorithms
Conflict resolution preference by aircraft type
SA/SAA concept (e.g. who is supposed to maneuver, when, and according to what surveillance info)
The independent variables represent data that is required as input to the experimental analysis. Noteworthy
are the data relevant for UAS performance characteristics, SAA surveillance system performance, and conflict
parameters (Table 6). For instance, the UAS performance parameters represent models (validated against vehicle
flight data) for five UAS groups covering, respectively, four levels of autonomy and five categories of UAS
(primarily grouped by weight and speed) [32]. The UAS models are medium fidelity, i.e., the observed behavior,
response to commands and emulated latency are acceptable for the SSI experiment categories. The models
produce data such as minimum speed/range maneuverability of the UAS, etc. The input to the simulation models
can also include data such as (randomly picked) failure rates for sensors, etc.
The simulation models will be refined to have greater detail in the models of SA, sensors, sensor fusion,
trajectory projection, command and logic. The models will be detailed enough to represent SAA functionality
which may be either ground-based, airborne, or collaborative between the unmanned aircraft (UAS) and the
ground. The present focus, however, is on ground-based SAA, using sensors such as radar and radar data.
The experiments to be conducted in the SSI subproject assume UAS operations in Class A and E airspaces,
as they provide the broadest coverage of airspace and the minimum constraints, i.e., UAS flying in class A and E
airspaces will need to have see/Sense & Avoid capability and will be tracked by ATC. The B, C, and D airspace
classes are much more structured and extremely controlled; therefore there are additional functions which may
or may not be required by an SAA function.
The dependent variables shown in Table 7 represent data produced from the simulation and analysis, to
characterize the minimum performance requirements for SA/SAA and the performance of SA/SAA as a function
of UAS characteristics.
3.3 Summary of Safety Data Collected
To date, most of the publicly available safety data collected has been after-the-fact incident reports and mishap
investigation reports. Very little non-mishap operational data is available outside of the organizations responsi-
22

Table 7: Dependent variables in the SSI experiment categories
Airspace Integration SAA Performance Requirements SAA Interoperability and Impact NextGen Capabilities
Number of predicted UAS-other aircraft encounters (a generalization of a conflict), broken down by IFR/VFR, altitude and distance to major airports Required maneuver initiation time/distance
Number of additional maneuvers required when the UAS is operating with an SAA system vs. when the UAS does not request maneuvers
Number of predicted UAS-other aircraft encounters (a generalization of a conflict), broken down by IFR/VFR, altitude and distance to major airports
Predicted point of closest approachResultant minimum horizontal and/or vertical separation
Number of SAA “alerts” (if the SAA concept includes alerts) Predicted point of closest approach
Losses of separation Additional flying time due to UAS conflicts Losses of separation
Conflict resolution maneuver delay Increased fuel burn due to UAS conflicts Conflict resolution maneuver delay
Controller workload, situational awareness, "acceptability"
Number of pilot-controller communications required for SAA-driven maneuvers
Controller workload, situational awareness, "acceptability"
UAS pilot workload and situational awareness
Losses of separation under given levels of uncertainty
UAS pilot workload and situational awareness
Missed and false (nuisance) alerts
Secondary encounters with IFR/VFR after (1) SA maneuvers, (2) self-sep maneuvers, (3) CA maneuvers Missed and false (nuisance) alerts
Airspace "efficiency" Range at first SAA alert Airspace "efficiency"
Hoz./vert. maneuvering required by SAA system, as a function of the intruder IFR/VFR status
"Behavior" of UAS once encounter is over
Controller workload, situational awareness, "acceptability"
Discrepancies within and between different SA and SAA algorithms on detection times and maneuvers
Missed and false (nuisance) alerts
ble for individual UASs. This is a large gap: creating or accessing sources of non-mishap operational data is
important to the identification of problems before they happen.
Since the government agencies operating UASs have much longer and more extensive operational experience
with these aircraft than do any commercial or other civil organizations, they have the largest collections of all
forms of data. The U.S. Army and Air Force have been flying the largest numbers of UASs for the longest periods
of time, but for obvious reasons much of their data is unlikely to be released. It is also not clear how much of
their data would be directly applicable to civil operations in the NAS.
NASA flies a limited number of UASs (at least when compared to the U.S. military), but its data may be more
accessible for safety analysis. NASA’s data is mainly collected in its NAMIS database, which is one of the few
available with extensive routine operational data (maintenance issues, aircraft flight hours, “routine” equipment
failures, etc.). This makes NAMIS a potentially valuable source, though NASA’s small number of UASs and
their often experimental nature restricts the applicability of any conclusions drawn from its data.
The FAA has data collected from COA and Special Airworthiness Certificate applications and operations.
This data is probably the most readily accessible safety data available, but is still rather limited.
The ASRS database is wide ranging and publicly available. But its reports are subjective and are not backed
by extensive investigations. This makes it difficult to know the validity of any single report to identifying potential
UAS issues. On the other hand, it could be very valuable for proactively identifying issues common across large
numbers of UASs or UAS interactions with manned aircraft.
The NTSBs’s Aviation Accident Database contains meticulously researched investigations of major acci-
dents. This is extremely valuable, but by its very nature this limits its reports to a relatively small number
appearing a relatively long time after issues have begun to affect aircraft.
Similar problems hold for the Air Force’s AIB Mishap Reports. Moreover, these reports are for military
UASs in (mostly) hostile environments and this affects their timeliness and applicability to UASs operating in
the NAS.
The above databases provide little data relevant to specifying, regulating, and operating one of the critical
23

prerequisites to integrating UASs in the NAS: developing an effective separation assurance and sense-and-avoid
system or systems. This makes the data from the simulations envisioned by the SSA subproject described in
Section 3.2.2 all the more valuable. Although simulations always have issues with validation and accuracy, in
this case they stand to provide one of the very few sources of any data on separation assurance and sense-and-
avoid issues and systems prior to the deployment of such systems.
These, then, are the most sources most likely to provide data relevant to UASs operation in the NAS. The
other databases and sources described earlier in this chapter are either too limited in their content or are too
informal to be likely to provide useful data at this time.
3.4 Commentary
What does all the data tell us about safety when Unmanned Aircraft Systems start flying in the National Airspace
System?
First, we do know that accidental deaths quite caused by UASs have been quite rare: in all of the identified
data sources, only two reports of deaths appear. If hobbyists’ radio-controlled aircraft are considered, a few more
deaths have been reported, but they are still quite uncommon.
Even injuries have been rare: only three incidents resulting in a total of ten people being injured appear in the
various reports. Unfortunately, no formal investigations of these incidents are publicly available. Recent news
reports where commercial operators have lost control of UASs flying directly above crowds 31 suggest, though,
that future injuries and deaths will become much more common without appropriate safety regulations.
To date incidents that cause damage to facilities or other aircraft have been much more common. Both
the Air Force’s AIB reports and the Army’s Knowledge safety magazine’s summaries show that many of these
happen while preparing for take-off or during landing. Only one mid-air collision appears in the available data.
It happened in August, 2011, when an RQ-7B collided with a German C-130 in Afghanistan.
Unfortunately, as noted previously, the differences between military UASs and proposed civilian UASs make
it difficult to use this information to form conclusions about the safety of proposed civilian UASs. Likewise, the
differences between the military and civilian operating environments makes it difficult to apply existing data to
UASs integrated into the NAS.
Looking to non-military data sources, the ASRS database highlights issues that do not appear in military
accident reports. For example, what should happen in response to a lost-link incident while flying in a crowded,
controlled environment? The usual response today when flying in restricted airspace is for the UAS to automa-
tically return to a predefined safe landing place. However, as some ASRS reports make clear, when flying in
a crowded environment under air traffic control more sophisticated responses are needed. As another example,
UASs may have multiple pilots located at multiple ground stations. (Often, the pilots and ground stations respon-
sible for takeoffs and landings are in different locations than the pilots and ground stations that are responsible
for the missions.) Reports from the ASRS database show that the air traffic controllers need to be aware of this
in every instance and be fully cognizant of which pilots are controlling the UASs at all times.
So, while there is much data available on UAS incidents and accidents, there are many gaps in the relevance,
types, quantity, and quality of what is available. The following sections discuss the gaps in more detail (Section 4)
and give recommendations for improving the quality, quantity, and relevance of the data collected (Section 5).
4 Data Collection Problems and Gaps
We now identify a series of problems and gaps which we have identified with existing data collection efforts.
These can be grouped into three broad areas. First, there are cases where relevant data exists, but is apparently
inaccessible (at least to the authors of this report). Second, there are some clear gaps in existing data, that is,
31[Online]: http://www.washingtonpost.com/local/drone-crashes-into-virginia-bull-run-crowd/2013/08/26/424e0b9e-0e00-11e3-85b6-d27422650fd5_story.html?
24
cases where the data is inherently missing something of significance. Third, there are gaps in the overall “data
ecosystem”, that is, the framework and processes within which such data is created and used.
Inaccessible Data: Ideally, we would like to be able to correlate the quality of data available for a UAS with the
severity and occurrence of any incidents. In particular, we would like to correlate the information in COA
applications, with reported incident data. Although both COAs and incident data are publicly available,
since COAs are anonymized it is not possible to determine any correlation.
Data Missing Important Details: COAs are a potentially rich source of information, but their use as a data
source is hampered by inconsistencies in how the data is presented. For example, the type of UA might be
recorded as text, in images, or attached document files in a variety of electronic formats32. In general, it is
unclear whether data appears in the main COA application spreadsheet or in attached documents. Another
source of data is telemetry. Here, again, there are numerous problems with inconsistent data formats, and
gaps. For example:
• In most cases, the communication protocol is vendor-specific and proprietary. Depending on the
situation, this could mean that only a subset of telemetry data is available, is down-sampled, or is not
made available immediately.
• Typically, the GCS generates log files, which contain parts (or all) of the telemetry as well as com-
mands issued and special events. Such data are usually readily available. However, proprietary data
formats and the need to use vendor-specific tools for data access limits usability.
• GCS log data only contain data visible to the GCS. This means that UAS operating in autopilot mode
after a broken communications link are not recorded.
• External GCS events, such as a total freeze of a Commercial Off-the-Shelf (COTS) OS-based GCS,
loss of power to the GCS station or transceivers, or audio data (e.g., audio communications between
GCS operator and ATC) are not recorded.
Data Framework Gaps: Even when data does exist, it is often not statistically significant enough to make the
valid inferences that are required for sound judgment. A solid statistical analysis has to be based upon good
datasets. However, the relatively small number but high diversity of UAS systems complicates statistical
analysis. Furthermore, incidents and accidents are “rare events”, which must be treated carefully in any
statistical analysis. Thus, often it may not be possible to extrapolate data in repeatable ways suitable for
predictive and diagnostic purposes.
The data which is currently collected is highly dependent on the model of incident and accident causation.
The predominant and widely accepted model is that of a chain of failure events [10], which, although sig-
nificant, is only a part of the overall model. An open gap is how to collect data about complex and difficult
to foresee interactions (as opposed to system or component failures). For example, it is not uncommon
to conduct hazard analysis only as deep as the point at which hardware and software requirements have
been determined. Thereafter, software is largely dealt with by demonstrating that software meets its re-
quirements (as well as system requirements) by appeal to guidelines such as RTCA DO-178C. However,
hazards arising as a consequence of unforeseen interactions between correctly functioning software and
environmental conditions can be missed33 when hazard analysis is not conducted on software requirements.
Even for the analysis of a single flight or incident, data from multiple sources must be accessed and merged
for analysis. These data items can be indexed under different keys, which can make a reliable and correct
32Popularly as Microsoft Word document format, or also in portable document format (PDF).33The investigation report on the accident to the DLH 2904 Airbus A320-211 aircraft in Warsaw, indicated a complex interaction between
pilot actions, weather conditions and a software logic that resulted in the aircraft overshooting the runway and crashing, leading to a loss
of two lives. In brief, the weather conditions and pilot actions placed the aircraft in a state of aquaplaning; under these conditions, the
software responsible for engaging the thrust-reverse system and spoilers could not do so, since it could not detect the required condition
of wheel rotation. The inability to detect the condition was not a software failure; rather it was a deficiency in software requirements
hazard analysis, in failing to establish that the corresponding requirement poses a hazard under specific conditions. A full accident report
is available at: [Online]: http://www.rvs.uni-bielefeld.de/publications/Incidents/DOCS/ComAndRep/Warsaw/warsaw-report.html
25

access difficult. For example, telemetry data might be stored under tail number and day/time, whereas
NAS radar tracks are usually are accessed by flight numbers (which might not even exist for a UAS).
In general, there is a lack of a systematic way to process the data in a useful way, i.e., there is no unified
framework.
5 Recommendations
In the previous section we identified several problems with the collection and use of data in the context of UAS
safety. We now propose a series of recommendations, focused in a few broad areas, aimed at closing these gaps.
We first consider how to make more (and better) data available, and then outline a framework for the analysis
and proactive use of that data.
5.1 Improving the Quality of Data Collected
First we consider the quality of data: the gaps we have identified in data collection pertain to the level of detail in
data, the categories of data collected and formats for data collection. One problem is missing information in data;
data can also be poor quality, such as when the reported cause of an incident is somewhat vague. For instance,
consider the following extract of an incident report (ACN 1019368) from the ASRS involving UASs:
Climbing through FL210 conditions were encountered that affected the performance of the aircraftand resulted in a loss of altitude from FL210 to 16,500 MSL.
Although the assessment of the report is that human factors and weather contributed to the altitude deviation, it
may well be that the environmental conditions encountered may have violated certain of the operating assump-
tions made during aircraft design, resulting in an aircraft state in which altitude loss was inevitable. Since the
conditions that were encountered are not precisely recorded, e.g., windspeed, altitude, airspeed, etc., it is diffi-
cult to determine from this report whether or not airworthiness had a role to play in the unanticipated altitude
deviation, and whether or not such conditions can be flagged as a potential precursor to hazardous events.
To characterize whether incident causes are rooted in procedural issues or in airworthiness, it is also important
to characterize the operating context. Furthermore, we believe it is also important to have a standardized qualitymodel for incident/accident reports to distinguish reports that are data rich and suitable for analysis, from those
that are not. A related recommendation, therefore, is to establish the criteria that distinguish high quality data.
Next, we consider the categories of data collected: an overarching recommendation is to look at the underly-
ing model assumed for accident/incidents, and the corresponding safety analysis methods employed for hazard
mitigation, since the data that is collected is fundamentally dependent on them. In particular, the assumption that
only (system, subsystem and component) failures lead to safety violations [10] should be carefully considered
since collecting failure data only highlights a part, albeit significant, of the overall picture of system safety. The
aim, we believe, should be to also acquire interaction data, while being aware of the potential for data explosion
given that complex interactions may take place across various levels of the system. More specifically, hazard
analysis will need to necessarily consider chains of events and their permutations/combinations, and especially
for software, as a rule rather than the exception.
Third, the intended analyses should be carefully considered when setting up the data collection process. We
recommend involving data analysis experts (Section 5.3) at an early stage.
Finally, we recommend that data formats be established so that the data obtained is as consistent as possi-
ble. For example, in text-based incident/accident reports, we encourage the use of a standardized vocabulary to
distinguish different scenarios. To illustrate, the usage of the word “crashed” in this excerpt from an incident
report34 – . . . crashed and was retrieved with minimal damage – appears to imply a hard landing as opposed to
a catastrophic event. Where possible, a detailed time-line of events and failures should be kept in the recorded
34Extracted from UAS accident briefs from the U.S. Army’s Flightfax and Knowledge magazines
26

data. For example, a failed generator followed by a lost link (due to power loss) is fundamentally different from
a lost link scenario, where subsequently the autopilot erroneously shuts down the engine. Thus, providing just a
list of failed components is usually not enough for detailed incident analysis.
5.2 Improving the Quantity of Data Collected
To increase the quantity of data we recommend establishing systematic data collection activities in four areas:
enhanced incident reporting, automated data recording, modeling and simulation, and through collaboration with
individual ongoing projects.
5.2.1 Incident Reporting
NASA’s ASRS has been a successful mechanism for the reporting of incident and accident data but it was not set
up with UAS in mind, and a UAS specific solution is needed. We recommend either the enhancement of ASRS
to include more UAS specific reporting fields that can better handle UAS specific incidents, or the development
of a dedicated reporting mechanism. The data collected would likely depend on the UA type.
If ASRS is adopted, we recommend promoting awareness and encouraging use of ASRS to the growing UAS
community, especially with operators not from the traditional aviation community. UAS operations are expected
to significantly increase once the FAA’s six proposed test sites become operational and the congressionally man-
dated policy for small UAS and streamlined public safety UAS operations go into effect.
We now consider possible enhancements to the ASRS reporting forms to provide better reporting of UAS
safety concerns. Clearly there is a trade-off between soliciting detailed information which might preclude a
potential reporter from submitting a report or having something broader, like the existing form. The current
guidelines in the form give some suggestions on what one could fill for an incident description, so that it comes
down to the individual reporting it and not so much the form itself.
There are three ASRS reporting forms35 relevant to UAS operations: “General”, for pilots, dispatchers, etc.;
“Air Traffic Control”, for air traffic controllers; and “Maintenance”, for mechanics. The fourth reporting form is
for cabin crew, which is obviously not relevant to UASs as currently envisioned.
Form: General The event field is currently free text, and we believe that additions should made be made in the
event description.
We suggest that seven of the twelve reporting sections (counting “AIRCRAFT 1” and “AIRCRAFT 2”
only once since they are identical) in the “General” form could be enhanced.
• Section: Reporter
Additions: GCS Operator
• Section: Certificates & Ratings
Additions: GCS Operator qualification categories
• Section: Conditions/Weather Elements
Additions: Separate reporting for conditions and weather at the ground station and at the UAS
• Section: Light/Visibility
Additions: Separate reporting for lighting and visibility at the ground station and at the UAS
• Section: Aircraft
Additions: An indication of whether the UAS is flying autonomously or under human control, possi-
bly in the “Flight Phase” subsection. For the near future, autonomous flight would most likely occur
only during “lost-link” conditions.
If the UAS is flying autonomously, an indication of what phase of the autonomous flight it was in
(e.g., “flight termination” or “lost-link orbit points”)
35[Online]: http://asrs.arc.nasa.gov/report/electronic.html
27

• Section: Location
Additions: Separate sections for the location of the ground station and location of the unmanned
aircraft.
• Section: Conflicts
Additions: Did onboard sense-and-avoid systems activate? Did ground-based sense-and-avoid sys-
tems activate?
Form: Air Traffic Control We suggest that six of the nine reporting sections in the “Air Traffic Control” form
could be enhanced.
• Section: Reporter
Additions: “Do you have UAS pilot experience?”
• Section: Conditions/Weather Elements
Additions: Separate reporting for conditions and weather at the ground station and at the UAS
• Section: Light/Visibility
Additions: Separate reporting for lighting and visibility at the ground station and at the UAS
• Section: Aircraft
Additions: An indication of whether the UAS is flying autonomously or under human control, possi-
bly in the “Flight Phase” subsection. For the near future, autonomous flight would most likely occur
only during “lost-link” conditions.
If the UAS is flying autonomously, an indication of what phase of the autonomous flight it was in
(e.g., “flight termination” or “lost-link orbit points”).
• Section: Location
Additions: Separate sections for the location of the ground station and location of the unmanned
aircraft.
• Section: Conflicts
Additions: Did onboard sense-and-avoid systems activate? Did ground-based sense-and-avoid sys-
tems activate?
Form: Maintenance We suggest that four of the eight reporting sections in the “Maintenance” form could be
enhanced.
• Section: Experience
Additions: Qualifications for maintaining the elements of the ground station in addition to the aircraft.
• Section: Consequence/Outcome Additions: communication lost-link, ground station hardware or
software failure
• Section: Aircraft/Airworthiness Status
Additions: ground station status
• Section: Type of Aircraft (Make/Model)
Additions: Ground station make/model
5.2.2 Data Recording
Similar to the need for a more systematic reporting mechanism for human-recorded incident and accident data, a
new approach is needed to record autogenerated data. Such data are produced on-board the UAS by the autopilot
and on the ground by the GCS as well as by the ground-based ATC radar. In most cases, only telemetry data sent
to the ground station as well as the general ATC data (for larger UAS in the NAS only) are recorded.
28

Federal aviation regulations36 state that an on-board data recorder is only mandatory for aircraft with at least
two people on board. Consequently, no on-board data recorder is required for any UAS. However, the tech-
nology to store large amounts of data in very small and low power electronics packages is readily available for
a relatively low cost. This means that installing non-hardened (for radiation) data recording devices on-board
even moderately small UAS is entirely feasible. Moreover, the lightweight and solid-state nature of the elec-
tronics makes them relatively simple to protect against destruction and loss of data in the case of a catastrophic
UAS event. Finally, these recording devices can include on-board intelligence, assisting in the telemetry capture,
filtering, and fusion process even when communication links are healthy.
Many parameters and signals can be extracted for on-board storage, which might be useful for incident ana-
lysis. Currently, the very weak computational power of the on-board computers seem to be a limiting factor, as
frequent writing of the data sets into the on-board storage can overburden the system. Modern on-board comput-
ers should be able to perform the recording task without problems. Although it is likely that vendors may use
proprietary formats for such data, we believe provisions will need to exist to extract and record relevant infor-
mation e.g., position, attitude, altitude, speed, system status, detailed information on command/communication
links, etc., in an open and well-documented format, for example, a format derived from aircraft track data format
used in Air Traffic Control. There, important flight data (e.g., ID, AC type, position, altitude, speeds, flight plan,
etc) are recorded in regular intervals for each aircraft. These data should be augmented by UAS specific data
items concerning link status, system status, and communications with the GCS.
Most GCS already provide log files. However, proper time stamps and additional information is necessary to
correlate on-board data with GCS data for incident and UAS performance analysis. As the basis for a possible
standardized UAS telemetry format, we could first consider the data format for NASA’s CTAS system. CTAS
data consists of entries repeated every 12 seconds for each commercial transport:
AC_DATA -- elapsed_time id x y lat long altitudevertical_speed ground_speed ground_accel heading heading_ratetrack_time geo_sector_id host_sector_id turn_status altitude_statuslanded_zone_bit coast_bit data_source raw_vertical_speedraw_ground_speed raw_heading
The entry for additional AC operation information is:
ADD_FLIGHT_PLAN -- elapsed_time id data_source callsign cid tidpseudo_id beacon_code atc_type route coordination_fix coordination_timeassigned_altitude filed_airspeed flight_plan_type
As an example of an entry in a possible format for recording UAS waypoint operations (either adding or
removing), we could consider:
UAS_WAYPOINT -- elapsed_time id data_source callsignwaypoint_operation wp_x wp_y wp_alt wp_range wp_limits
An example in a possible UAS_DATA format (based upon the CTAS AC_DATA record), including UAS and
communication link status (which might be extended to distinguish between ground and on-board data) could
be:
UAS_DATA -- elapsed_time id x y latlong altitude vertical_speed ground_speed ground_accel headingheading_rate track_time geo_sector_id host_sector_id turn_statusaltitude_status landed_zone_bit coast_bit data_sourceraw_vertical_speed raw_ground_speed raw_heading lnk_status payload_statuslast_received uas_status1 uas_status2 uas_mode uas_faults
36Flight data recorders are covered under 14 CFR Parts 23, 25, 27, and 29, xx.1459 (i.e., 23.1459, 25.1459, etc.) while cockpit voice
recorders are covered under xx.1457.
29
In summary, the data-recording on-board and on the ground should
• use well documented and preferably open formats, which include a time stamp. A time stamp, which, for
example, could be obtained from a GPS receiver, is necessary to align the recorded on-board data with
GCS and ground ATC data for analysis,
• on-board data recording is essential, because lost link situations causes incomplete telemetry log files at
the ground station. Many UAS incidents are preceded by a lost link event, so on-board data recording,
combined with other recorded information can yield valuable information about cause and timeline of the
incident,
• ATC data formats, like the data format used for NASA’s CTAS system are widely used and many analysis
tools already exist for that format. Therefore, a format for GCS and on-board data should be based upon
such a data format,
• the data record format should be flexible enough to adapt toward storage of UAS type and model specific
data and payload data, when applicable. A concise definition of these data terms is important to enable
proper analysis and avoid confusion (e.g., alternator current versus generator current), and
• a defined process is necessary to mask certain mission or vendor proprietary data without hampering access
to the major recorded UAS data for operational purposes or incident analysis.
5.2.3 Modeling and Simulation
The more severe and catastrophic incidents are, of course, quite rare, but must be considered in the safety man-
agement process. In order to obtain data on rare incidents, we recommend the use of modeling and simulation.
High-fidelity models already exist for, e.g., air traffic control. We recommend the creation of reference mod-
els that realistically model UAS sub-systems, air traffic, and the operating environment. Anomalies, incidents,
and mishaps reported from actual flights could then be studied using simulation. In fact, efforts along these lines
are already under way: the SSI subproject of the UAS in the NAS project is creating and using high-fidelity
models of certain classes of UAS in order to determine thresholds of UAS performance requirements against
which to design sense-and-avoid capabilities (see section 3.2.2).
In the absence of prior information on frequencies of hazard or failure occurrences, high-fidelity simulations
coupled with stochastic simulation, may provide so-called prior distributions for these events. Advanced on-line
statistical techniques, like active learning or filtering and statistical emulation models can be used to construct
compact and efficient models and obtain accurate distributions without an excessive number of simulation runs.
Together with a Bayesian framework for updating these distributions, it may be possible to update these data
with evidence as it is obtained.
5.2.4 Harnessing NASA Data Sources – UAS Projects
We believe that NASA can lead the way in establishing procedures and baselines for the collection of UAS
data—formats, sanitization procedures, etc.
NASA operates a fleet of UAS at several centers to support scientific missions and aeronautical research.
Concentrating on NASA UAS can be justified for several reasons: there is easier access to data, NASA’s fleet
is representative of most UAS categories, and the agency has significant experience operating UAS in the NAS
and international airspace. Several of NASA’s UAS are of the same types as operated by the DoD and the De-
partment of Homeland Security (DHS) (RQ-4 and MQ-9) while others have size and performance characteristics
comparable to mid and small-scale civil UAS designs (SIERRA, BAT-4, Dragon Eye). Although NASA has
fewer aircraft and accumulated flight hours than DoD or DHS, data collected from NASA aircraft will help with
understanding the performance and risks associated with these aircraft types.
30
The types of data available include UAS design specifications, flight data, flight logs/reports, data link logs,
maintenance records, incident reports, air traffic data (if flights are conducted in the NAS), and communication
link data (not always available).
5.2.5 Other Subprojects of the UAS integration in the NAS project
Other subprojects of the NASA UAS integration in the NAS project also can be potential sources of data.
Human Systems Integration: The Human Systems Integration subproject is considering issues arising pri-
marily from pilot interaction with ATC and ground stations. They are also compiling a catalog that describes a
wide range of GCS platforms, and gathering GCS requirements in several categories: phase-of-flight, functional,
and regulatory. These requirements will eventually go into a relational database. Several simulations are planned,
or have already been carried out, in order to determine baseline performance and the effects of adding various
features to GCS.
• Measured Response:
The NASA-FAA agreed upon definition of measured response includes the time for pilot to respond to ATC
instruction, time for a pilot to initiate an action, the time for the UAS to execute the command, and the time
for the maneuver to be detected by ATC. Components of this include, e.g., communication link latency,
pilot decision making time, interface navigation by the pilot, control link latency, aircraft processing and
maneuver time. The goal is to measure components of pilot response (verbal, initiate action) to various
ATC commands, using the Multiple UAS Simulator (MUSIM) in Ames’ Flight Deck Display Research
Lab (FDDRL) UAS GCS testbed. After each trial, operator rating is assessed in terms of pilot workload
and ATC acceptability. The aim is to develop metrics, define scenarios to exercise it, and simulations to
develop proofs of concept.
• Traffic Display:
In this simulation, the goal is to investigate the effects on various human factors of introducing a traffic dis-
play into GCS. Pilot performance, workload, and situation awareness are measured, while questionnaires
are used for pilot self-assessment. Experimental runs are carried out in FDDRL using MUSIM, CSD (3D
cockpit situation display), and MACS (Multi-aircraft control system), with varying traffic densities. The
participants then follow ATC instructions, with and without a display. The conclusion is that traffic display
does not affect performance (in terms of horizontal and vertical separation) where ATC is responsible for
separation, but does have an effect when pilots are responsible, and also lowers workload.
• Line of Sight:
Simulations are planned to determine requirements for visibility relating to line of sight, taking into account
issues such as color contrast against background sky, sun glare, weather attenuation. These will feed into
flight tests, information requirements and ConOps/guidelines.
Sense and Avoid / Separation Assurance Integration: The data produced and used in the SSI experiment
categories (Tables 6 and 7), are not hazard data nor are they directly related to safety risk. However, depending
on how the SA/SAA functions are developed and allocated, they are closely related to UAS airworthiness de-
termination, and are relevant for safety risk analysis. For instance, in an SSI concept where the SA function is
collaborative between the the UA and the ATC (or fully onboard the UA, i.e., as SSA), the minimum performance
baselines on the equipment supporting SA/SAA considered as part of the UAS, will be included in the basis for
airworthiness determination (for a particular category of UAS). As such, this equipment is then subject to safety
analysis, to determine its contribution to system safety and airworthiness.
Some of the independent variables, and the methodologies used in their determination, present potential
sources of safety risk. Consider, for instance, the algorithms used for implementing the SAA concept: for the
SAA function, in establishing the minimum performance requirements and thresholds for parameters such as the
31
closest point of approach (CPA), time to CPA, etc., there is an assumption of completely accurate surveillance
data and perfectly reliable sensors [33]. However, safety analysis of the sensor performance will be required (and
is alluded to, in [33]) as part of airworthiness certification (when the sensors are part of the UAS). The actual
safety analysis is not part of the SSI subproject scope, and the sensor safety data is assumed to be available as
input to the simulations and analysis.
Similarly, for the SS function of SAA, there is an identification of a “self-separation volume”, in addition to
existing airspace volumes surrounding the UA (namely, the collision volume, CV; the collision avoidance thresh-
old, CAT; the self-separation threshold, SST, and the ATC separation services). SSV, in fact, is a performance
goal in the design of the SS function that must also satisfy the “well-clear” regulatory requirement. There is,
again, an allusion to the need for safety analysis to determine acceptable SSV incursion rates and for the selec-
tion of self-separation function design parameters, but this analysis does not appear to be in the present scope of
the data being gathered.
Certain dependent variables, produced from the simulations may be safety relevant, e.g., the losses of sepa-
ration, the missed and false alerts, and the number of SAA alerts. While these measures better characterize the
performance of SA/SAA functions, they are also indicators of overall airspace safety. As already mentioned,
simulations that are being used to set UA performance baselines against which concepts for SA and SSA will be
developed, fit well with the recommendation to use modeling and simulation as a potential source of data.
5.2.6 UAS Centennial Challenge
We recommend collaboration with the NASA UAS Airborne Operations Centennial Challenge, as this is a key
opportunity to collect information about and learn from the development of flight critical software that will
eventually be required for civil UAS airworthiness type certification. The competition’s objective is to test
the performance and robustness of separation and sense-and-avoid technologies. Depending on the number
of competitors, we would be able to collect data from a variety of designs (algorithms and hardware) trying to
accomplish the same SAA function. The results of this competition should be very relevant to the SSI subproject’s
research and to stakeholders such as the FAA.
It would be useful to collect data from the competition that address concerns for competition safety, speci-
fically in regards to vehicle autopilot and flight management software. In addition, we would collect flight and
simulation data artifacts for the purpose of developing models to support a data-centered safety framework (see
next section) and to analyze the behavior of UAS autopilots and flight managers in real flight conditions.
The first phase of competition flights will utilize ADS-B SAA, and is planned for Spring 2014. The second
phase dealing with non-cooperative traffic is planned for 2015. Data collection will finish by the end of 2015, but
analysis and modeling development is expected to continue thereafter. Appendix B provides a list of information
UAS test site operators must collect and provide to the FAA.
5.2.7 Other Agencies
There are tentative agreements between NASA and other federal agencies, such as DoI and USFS, to share
operational data when they become available. These would be aggregated with NASA data to establish a larger
pool of data for analysis. NASA already has established partnerships with some universities and consortiums
that are doing UAS research, such as the CU/BYU Center for Unmanned Aircraft Systems. These groups could
be likely sources of data.
5.3 Framework for Reasoning about Heterogeneous Data
Our second broad recommendation is for the creation of a framework to make better use of the data that is
collected. We argue that three key components of such a framework are an evidence-based approach, integration
of data analysis, and a heterogeneous data metamodel.
32

Figure 3 depicts the mechanisms from which safety data can be generated and/or gathered as pertinent to the
domain of UASs and its safety.
Safety Analysis Methods
FHA, SHA, SSHA, FME(C)A, FTA, ETA, HAZOP,
Bow-Tie Analysis, CCA, CMA,
ZSA, OSA, …
Unmanned Aircraft System (UAS) Concept, Design and Development,
Operations
applied to Safety Relevant Data Hazards, Risks, Failures, Failure modes, Effects,
Consequences, Mitigations, Controls, …
(For systems, subsystems, components, parts …)
provides
Informs and improves
Accident / Incident Analysis Methods RCA, MES, ECF, STEP, AcciMaps, WBA, STPA, …
Incident And Accident
Events
Chain of deviation events
applied to (individual event)
Accident/Incident Data Hazards, Risks, Failures, Failure modes, Deviations
provides
Informs and improves
Data Mining and Statistical Analysis
Methods Association, Classification,
Clustering, Prediction, Time Series Analysis
applied to (multiple events)
Informs and improves
Data Trends and Patterns Likelihoods, Correlations Precursors, Event-chains
provides
Figure 3: Towards safety data collection for UASs
The aim of collecting more, and better, data is to close the loop between data and safety. To that end,
we recommend the creation of a framework in which data is more tightly integrated into safety management.
Essentially, we recommend the adoption of an evidence-based approach, that is, one in which evidence, in the
form of safety data, is used for the identification and reasoned mitigation of hazards, and is continually collected
throughout UAS operations.
Currently, data is often collected with only an implicit connection to wider system safety concerns. Moreover,
emergent and unforeseen properties are not handled well by current safety analysis techniques, and it has been
argued [34] that evidence-based approaches are better suited at revealing gaps, and inferring connections between
safety data and safety claims.
Outlining these connections in a systematic manner gives rise to an argument-based approach. The resulting
synthesis of evidence and argument is often called a safety assurance case (or safety case for short). Specifically,
an operational safety case is a compendium of evidence (including data and analysis) structured so as to support
the goal that the intended operations are acceptably safe and will continue to remain safe in future. The FAA
already considers SAA as requiring the submission of a safety case as part of alternative means of compliance
(AMOC), as in the N8900.207 policy document on UAS operational approval.
Second, existing data only says so much, and does not directly reveal complex, non-intuitive interactions that
might be precursors to things going wrong. It is desirable to identify precursors and then mitigate. We believe
this can be better achieved via an integrated approach to safety management incorporating analyses such as data
mining on both systems such as avionics/GCS software and incident data.
Data mining should be applied to COA incident and operational data (if in some usable level of detail) to
investigate whether there are common risks amongst all classes of aircraft or are there risks that cluster according
to certain factors that can differentiate classes of UAS. If this proposed activity is accepted, then the next step
is to define requirements for sharing data between NASA and the FAA. Ideally, additional sources of data that
33

the FAA has access to (such as from the military) would be included in such an agreement. Also, contingent
on accessibility, efforts should be made to correlate between COA applications and COA operational/incident
reports, tieing in with ongoing work on UAS classification.
Third, underlying the framework is, of course, the data itself. We recommend the creation of a safety data
metamodel (or ontology) to provide a foundation for integrated reasoning about heterogenous data. The model
should cover all phases of system development and safety analysis, including hazard data. This could incorporate
elements of existing efforts.This would allow the comparison and aggregation of data from different sources.
The metamodel would provide a uniform internal representation for statistical analyses, such as clustering, and
be augmented with a domain-specific thesaurus to support the disambiguation of textual descriptions.
One advantage of a (formalized) model of this form, is the ability to discover interactions that may not be
otherwise apparent, by the application of automated reasoning and inference logics. The model also serves as
a domain model against which to base and validate fundamental assumptions being made, say, in the safety
analysis and also during design and development.
We hypothesize that the adoption of these recommendations will allow safety data to be used more effectively
To test this hypothesis, therefore, we recommend that a pilot project be established that shadows an actual UAS
project from inception to operation. This would allow piloting the application of the recommended techniques
on an actual, non-trivial UAS system or subsystem, all the way from conception and design through to operation,
considering, in particular, avionics and software analysis.
These recommendations are consistent with, and bolster, the FAA’s move towards Safety Management Sys-
tems, and we believe that the connections between safety cases and safety management systems merit further
exploration.
34

Appendices
A Acronyms
AC Advisory Circular
AAIB Air Accident Investigation Branch
AIDS Accident and Incident Data System
ASRS Aviation Safety Reporting System
ASIAS Aviation Safety Information Analysis and Sharing
ATC Air Traffic Control
ATSB Australian Transport Safety Board
CAA Civil Aviation Authority
CCA Common Cause Analysis
CHA Concept Hazard Analysis
CMA Common Mode Analysis
COA Certificate of Authorization
COTS Commercial Off-the-Shelf
DFT Dynamic Fault Tree
DoD Department of Defense
DROID Dryden Remotely Operated Integrated Drone
ECF Events and Causal Factors
ET Event Tree
ETA Event Tree Analysis
FAA Federal Aviation Administration
FAIRS Federal Aviation Interactive Reporting System
FHA Functional Hazard Assessment
FMEA Failure Modes and Effects Analysis
FT Fault Tree
FTA Fault Tree Analysis
GAO Government Accountability Office
GBSAA Ground Based Sense and Avoid
GCS Ground Control Station
GSA General Services Administration
HAZOP Hazards and Operability
IRIS Incident Reporting Information System
MES Multilinear Events Sequencing
MOR Mandatory Occurrence Reporting
NAS National Airspace System
NASA National Aeronautics and Space Administration
NAMIS NASA Aircraft Management Information System
35

NMACS Near Mid-Air Collision System
NTSB National Transportation Safety Board
PHA Preliminary Hazard Analysis
PHL Preliminary Hazard List
PSSA Preliminary System Safety Assessment
RCA Root Cause Analysis
SAC-Exp Special Airworthiness Certificate – Experimental Category
SFT Static Fault Tree
SHA System Hazard Analysis
SMS Safety Management System
SRM Safety Risk Management
SSA System Safety Assessment
SSHA Sub-System Hazard Analysis
STAMP Systems Theoretic Accident Model and Process
STEP Sequentially Timed Events Plotting
STPA STAMP-based Process Analysis
TLS Target Level of Safety
TSB Transportation Safety Board of Canada
UAS Unmanned Aircraft System
USGS United States Geological Survey
WBA Why-Because Analysis
WBG Why-Because Graph
WBL Why-Because List
ZSA Zonal Safety Analysis
36
B Safety Analysis Techniques
Note that this is not a comprehensive list of the available methods, but represents some of the prescribed/recom-
mended methods that are used in practice (in aviation), for hazard identification and analysis, failure analysis,
and incident/accident analysis.
Preliminary Hazard Analysis Preliminary Hazard Analysis (PHA) [16] is systematic procedure to identify
hazards, and to qualify (or quantify), their consequences, severity, and likelihood, i.e., their (initial) risk.
It is best applied during the early stages of systems engineering, i.e., during concept definition and design,
creating the link between engineering activities and system safety. Consequently, it facilitates the early
identification of the relevant and/or appropriate mitigation measures so that (a) hazards are mitigated/elim-
inated, and (b) the system design includes safety aspects.
The input to PHA is usually a Preliminary Hazard List (PHL), and/or the outcomes from CHA. The former
may be obtained from several sources including, but not limited to, design and concept documentation,
known and relevant hazards, and brainstorming by the relevant stakeholders about other potential mishap
scenarios.
The latter is hazard analysis performed at the concept level and is used to identify major hazards from
previous generations of the system or from similar systems.
PHA forms one step in a chain of successively and continuously refined analyses and yields a detailed
evaluation of the safety risks for a given design (or a set thereof). Among the main outcomes from PHA
are: (i) failure modes and relevant hazards, (ii) initiating and pivot events in an event chain leading to
mishap(s), (iii) a basis for risk categorization according to the acceptability of risk, (iv) evidence that there
is compliance with the safety regulations and standards, (v) a preliminary set of system safety requirements
and (vi) inputs for design specifications. While this is not a comprehensive list of outcomes from PHA,
it represents some key outcomes of interest for the scope of this document. PHA also forms the basis for
subsequent and deeper hazard analyses.
System Hazard Analysis System Hazard Analysis (SHA) proceeds in the same manner as PHA, building upon
its basic principles. However, the focus is narrower, considering system operation, subsystem interfaces
and their interactions (both with other subsystems and the external environment, including operators), and
the nominal and failure behavior of components. An eventual outcome of SHA is the identification of
lower-level hazards, e.g., a failed subsystem.
SHA is applied to (a) refine the mitigation mechanisms, e.g., design constraints, identified from PHA,
and (b) trace these mechanisms to lower level components, e.g., through functional decomposition and
allocation.
In reasoning about lower-level hazards, techniques such as event tree analysis ETA and FTA may be
used; the intention is to explore the states or conditions of the system that could lead to the lower-level
hazards identified in SHA. SHA is also used to verify system compliance with requirements for hazard
elimination or risk reduction. SHA is also used to determine whether methods of implementing system
design requirements and hazard mitigation measures are themselves not hazardous [16].
Subsystem Hazard Analysis Sub-System Hazard Analysis (SSHA) is a lower level of hazard analysis, where
the focus is on both nominal and off-nominal behavior, as well as operational degradation at the subsystem
level, and the contributions to system-level hazards.
In SSHA, the subsystems are verified to be compliant with requirements for hazard elimination or risk
reduction. Additionally, the subsystem design is analyzed to identify previously unidentified hazards, e.g.,
through determining failure modes, single point and common mode failures, failure effects of subsystem
components and functional relationships of components/equipment comprising the subsystems.
Furthermore, SSHA is used to ensure that implementations of subsystem designs and mitigation measures
have themselves not introduced new hazards [16].
37

Functional Hazard Assessment Functional Hazard Assessment (FHA) is a two-tier safety analysis method re-
commended as a best practice in [15], for (new or modified) aircraft programs. It is a systematic, top-down
method where system functions and their associated failure conditions are listed, together with their effects,
classification of severity, likelihood of occurrence and mitigation measures, stated as requirements.
In principle, FHA is applied in the same way as PHA, but the focus is on a functional breakdown rather
than other decompositions of the system, e.g., a physical breakdown, or a logical decomposition. FHA is
orthogonal to PHA, at the system level: FHA focuses on functions that the system provides and the hazards
arising from deviations in these functions, whereas PHA considers any system condition/state irrespective
of whether or not the state represents a function. At the same time, FHA can be considered as narrower
in focus than PHA, since functional failures represent a subset of the set of conditions/states of the system
that are considered hazardous.
Specific details on how FHA is to be performed are available in [15] which also describes the subse-
quent activities, i.e., Preliminary System Safety Assessment (PSSA) and System Safety Assessment (SSA).
These can be considered as processes that combine methods such as Fault Tree Analysis (FTA), Common
Cause Analysis (CCA), Failure Modes and Effects Analysis (FMEA), etc., rather than as particular safety
analysis methods. PSSA can be contrasted with the SHA, as both attempt to iteratively determine whether
the safety requirements for the system can be met by the system design.
Hazard and Operability Study Hazards and Operability (HAZOP) study [35] is a qualitative, highly structured
and predictive analysis method primarily applicable to the identification and analysis of process hazards.
HAZOP is typically performed with the use of guide words and is steered by process (or design) conditions.
In the general HAZOP procedure, the analysis proceeds first by selecting an appropriate system repre-
sentation and identifying nodes, i.e., subsystems and/or components in that representation. Thereafter,
properties or attributes of those subsystems/components are identified, which represent process (or design)
conditions. These conditions are systematically extended using guide words such as “more”, “less”, “as
well as”, etc. The combinations of guide words and conditions point to potential deviations in the de-
sign intent. This process is systematically repeated on all the defined nodes, to identify and assess the
(safety-related) impact of the deviations.
One of the main advantages of applying HAZOP analysis in the safety plan is that it is systematic and com-
prehensive. However, it requires experienced practitioners, a relatively detailed design. One disadvantage
of HAZOP is mainly that hazards that are identified are associated with single deviations from the design
intent. When there are two or more separate deviations, hazards may not be easily identifiable.
For further details on HAZOP analysis, see [35] and [36].
STAMP based Process Analysis Systems Theoretic Accident Model and Process (STAMP) has been put forth
as a new model for accident causation [11]. It differentiates itself from the chain-of-events model of acci-
dent causation (one instance of which is popularly known as the swiss-cheese model [10]), by (a) rejecting
the notion that accidents are only a consequence of a sequence of (component) failure events, and (b) as-
serting that, rather, they result from “inadequate control actions not enforcing necessary constraints on the
system design and operation” [37].
STAMP further asserts that constraints on safe operation ought to be the key concept for safety analysis
rather than a failure event, and that mishaps are a consequence of not only component failures, but largely
also because of unsafe interactions between humans, machines and the environment. The associated safety
analysis process that accompanies STAMP is known as STAMP-based Process Analysis (STPA). STPA
has the same objectives as traditional hazard analysis, but deviates from the traditional approach by go-
ing beyond the identification of system hazards and the definition of safety requirements. STPA includes
additional steps for defining the control structure of the system under analysis, identifying the inadequate
control actions that could lead to a hazardous system state, and determining the potential constraint vio-
lations along with the definition of elimination/control measures. Specifically, the accompanying analysis
technique involves the following broad steps:
38
• Identifying and modeling the hierarchical levels of system organization and the interactions between
those levels. Here, the system organization is again a sociotechnical one, spanning the wider social
context in which the technical system operates.
• Defining the processes that operate between the levels of control in and across the identified levels
• Identifying the deviations and inconsistencies between the actual processes and the model.
The main goals are to identify the control structures or actions that did not enforce the safety constraints
that should have been in place, how the control structure may degrade and the coordination issues involved
when multiple controllers are involved.
Ontological Hazard Analysis Ontological hazard analysis [38], [39] is a formally-based method for safety ana-
lysis, that combines concepts of causal analysis, refinement and HAZOP, to formulate safety requirements
that are complete relative to the ontology.
In summary, the procedure is as follows: first, provide an abstract system description containing the sys-
tem objects, properties and their relations, in an appropriate formal language, i.e., a language that has a
formal notion of refinement. These form a formal ontology. Then, to identify mishap/hazard events, apply
HAZOP to the ontology. In fact, this procedure no different from the application of HAZOP in general,
with the exception that (a) the ontology can be systematically extended by refinement, and (b) the proper-
ties defined in the refined ontology can be shown to be consistent with the properties defined in the abstract
ontology. The main rationale here is that a simple ontology can be easily validated and the refinements,
which add detail, can be formally verified against their higher-level abstractions.
Thereafter, for all identified mishap/hazard events, a formal causal analysis is performed to identify the
causal factors of the hazard. Once these have been identified, requirements can be defined so as to elimi-
nate/mitigate these causal factors. Finally, a deductive form of causal analysis, i.e., Why-Because Analysis
(see Section B), is repeated to verify that the mitigation measures are, in fact, effective barriers.
Failure Modes and Effects Analysis Failure Modes and Effects Analysis (FMEA) is a systematic procedure
for analysis of the functional failure modes in a system and the (local, next higher-level and system-level)
effects of those failures. The analysis also includes a characterization of the failures based on their severity
and likelihood; although this appears to be similar to risk characterization of hazards, the distinction lies
in the definitions of failures and hazards.
Not all failures are hazards; whereas hazards describe states/conditions of the system which in conjunction
with environmental conditions can lead to a loss event, failures represent observed deviations from intended
behavior/function. A failure mode is the manner by which failure is observed, describing the way in which
failure occurs and its impact on equipment operation. For greater details on the FMEA method, see [40].
Fault Tree Analysis Fault Tree Analysis (FTA) is a deductive analysis method for reasoning about hazards and
their causes. Traditionally, FTA has been considered as a qualitative method, where a hazard and its causes
are modeled using Boolean logic. However, sound mathematical models have been developed that also per-
mit sophisticated quantitative analysis [41]. Fault Trees (FTs) effectively model the relationships between
basic events (usually failure events) and top events (representing hazards such as system or subsystem fail-
ure), both graphically and logically. However, the way in which this model is built starts with the top-event
and successively deduces the failure conditions and paths to yield the basic failure events that led to the
top-event.
Qualitative FTA involves the determination of cut-sets. These represent the set of basic events or their
combinations whose occurrence is sufficient for the occurrence of the top event. Minimum cut-set analysis,
i.e., identifying the minimum set of cut-sets is useful for identifying single points of failure in a system
design. In quantitative FTA, the probability of the top event (hazard) is computed given the probabilities
of occurrence of the basic events and the mathematical model which describes the relationship between
the top event and the basic events. Classically, an FT is a combinatorial model, known as a Static Fault
Tree (SFT). Dynamic Fault Trees (DFTs) are an extension to SFTs, allowing the mathematical modeling
and consequent quantitative analysis of stochastic relationships between basic events and top events [42].
39

Event Tree Analysis Whereas FTA is deductive, Event Tree Analysis (ETA) is inductive. ETA is used to iden-
tify and analyze the event sequences in a potential mishap/hazard scenario, after an initiating event has
occurred [43]. Thus, an Event Tree (ET) logically models an event sequence starting from an initiatingevent (also known as an accidental event, and is usually a failure event or a deviation from a normal situ-
ation), followed by the outcomes of a series of pivot events (representing the success/failure of so-called
barriers, i.e., safety functions / protection mechanisms in the system), and terminating in outcomes (which
may or may not be hazards/mishaps).
If an initiating event in an ET is a failure event and the terminating event is a hazard, then an ET may
be the considered as the dual of an SFT, since they both model combinatorial failure paths. ETA can be
combined with FTA for quantitative risk analysis, if we consider that pivot events in the ET have binary
outcomes, i.e., success or failure, and by modeling such failure outcomes (as well as the occurrence of the
initiating event) using SFT [43], or by using DFT when the failures cannot be modeled using combinatorial
means [44].
Events and Causal Factors Analysis Events and Causal Factors (ECF) analysis is a means to model the se-
quence of events leading to an undesired event, i.e., an incident/accident. The analysis is assisted by
means of an ECF chart, a graphical (or tabular) representation, that provides specific modeling notations
for the particular concepts required to capture event sequences [45].
An ECF chart documents a chronology of events, that model actions, with the event sequence proceeding
in the direction of the lapse of time, e.g., from left to right, or top to bottom, assuming that either are used
to denote the forward lapse of time. There is a notion of so-called primary event chains and secondaryevent chains, modeling the proximate sequence of events (that led to the undesired event), and the nearest
neighbor sequence of events (that led to the initiating event of the primary chain), respectively. In a
graphical ECF chart, secondary chains are placed above primary chains, to denote the occurrence earlier
in time.
There are notions of conditions which model state-based information or emergent properties that develop
over time. Events can be linked through event connections, whereas conditions are linked via conditionconnections. When events and/or conditions are not based on factual evidence, ECF charts provide the
notion of presumptive events and conditions. We refer the reader to [46], and [45] for greater details on the
application of ECF analysis.
Multilinear Events Sequencing Multilinear Events Sequencing (MES) is an investigative technique that mod-
els an undesired event as multiple linear chains of events, i.e., as event sequences, uses a time scale to
show the temporal ordering of those events, and counterfactual reasoning to show the causal relationships
between the events. MES is closely related to ECF analysis.
MES diagrams model actors, which are entities such as machines, equipment, humans, etc., that perform
actions. Unique actor-action combinations represent events. Events are modeled on two dimensions: the
horizontal (X) axis represents increasing time on an appropriately chosen scale, and the vertical (Y) axis
contains an arbitrary ordering of actors. Thus, events occur at specific times. In addition to these constructs,
MES diagrams also provide the notion of an enabling condition which model situations that can themselves
be the outcome of external disturbances. The rationale in MES, is that events and interactions between
events model processes, and these interactions for the basis for successful operations or failures [45].
Sequentially Timed Events Plotting Sequentially Timed Events Plotting (STEP) refines MES and ECF ana-
lysis; whereas MES largely is graphically based, STEP is tabular. In STEP, the so-called STEP cards
consolidate event information; each card is a table containing information about actors, and actions, and
add additional temporal information, e.g., when an event commenced, the duration of the event. Further-
more, location information and evidence are also data elements in a STEP card.
The incident/accident process analysis is stored in a STEP worksheet, which is a two dimensional matrix,
with the rows representing each involved actor and the columns indicating a time line; in the usual way,
time is assumed to increase from left to right. As in MES, an actor-action combination describes a single
40

event. The STEP analysis organizes the set of events in a cascading flow, in turn resulting in a logically
and temporally ordered set of event sequences leading from the initial event to the undesired event.
Unlike MES, in STEP the notion of a condition is omitted, in part, due to the observation that this concept
is a source of bias and also due to the rationale that conditions are the consequences of other (prior) ac-
tions [45]. STEP includes specific tests for completeness validation: each row should model the complete
set of actions for an actor, all actions for each actor, i.e., events, are correctly placed in relation to other
events in the logical and temporal flow, and the event sequence meets both the counterfactual test and the
causal sufficiency test.
Why-Because Analysis Why-Because Analysis (WBA)37 is a rigorous method for causal analysis of an incident
or accident, using counterfactual reasoning to determine the causal factors, and causal sufficiency reasoning
to determine missing causes [13].
The analysis proceeds from the incident/accident to be analyzed, a top event, and creates a Why-Because
List (WBL), containing a list of the facts available or gathered about that event and a set of all pairs of facts
that are related through the counterfactual test. Informally, for a pair of facts C (Cause), and E (Effect), the
counterfactual test examines whether E would be true had C been false. The outcome of the test establishes
that C and E are related through a cause-effect relationship if and only if the non existence of C implies
the non existence of E.
WBA formalizes this notion on all facts / pairs of facts to create a directed-acyclic graph (DAG), known
as a Why-Because Graph (WBG), which models the causal factors leading to the top event. The causal
factors are of four types: (i) system state (ii) events, capturing change of state (iii) processes, which contain
both events and system states, and (iv) non-events, i.e., an absent event determined to be relevant through
counterfactual reasoning. Thus, the WBG contains four types of nodes, and the directed links between the
nodes model the cause-effect relationships between the nodes. Once the WBG has been created, it can
be formally verified for causal sufficiency, i.e., whenever all the causes (as determined using WBA) of an
effect occur, then the effect is certain to occur.
AcciMaps AcciMaps are a graphical representation used for structuring accident/incident analysis in the con-
text of complex sociotechnical systems with inherent hazards, e.g., civil aviation. The rationale for this
approach is the observations that (a) the control of hazardous processes involves several decision-making
levels that are nested, and interrelated, and (b) proper risk management and defining the right regulatory
controls requires that the decision making process be co-ordinated at all the relevant levels, i.e., starting
from the government, at the very top-level, through the regulatory authority at the next level, through the
relevant organizations, their management, staff,and through the technical system providing the required
services at the lowest level (although, the technical system itself may be further refined into its lower
levels).
The core formalism employed in the analysis is the cause-consequence chart, modeling a chain of poten-
tial or actual events. The model includes decision switches, that represent choices made through human
intervention, in the set of possible routes to an accident/incident. The cause-consequence chart itself is a
network of causal trees [12], modeling the necessary causes for a set of hazards, connected to the event
trees that model the consequent event flows, and the set of possible accident/incident events. Thus, the
chart is actually a generalization of the set of possible accident/incidents for the system under considera-
tion, and the choice of individual undesired event is a function of the choice of the hazard (termed as the
critical event in AcciMaps terminology).
In the post hoc analysis, AcciMaps is differentiated from traditional techniques through the identification of
preconditions, decisions, orders, functions, plans, tasks, actions, direct and indirect consequences, through
all levels of the nested, decision making levels. Additionally, the hallmark of the approach is the eventual
identification of decision makers at all levels in the hierarchy that can influence decisions such that hazards
are controlled. Thus, AcciMaps represent a (somewhat) radical departure from the “traditional” techniques
for accident/incident analysis.
37More details on WBA are available at: [Online]: http://www.rvs.uni-bielefeld.de/research/WBA/
41

C Data Sources
Data from NASA
• NASA Aircraft Management Information System (NAMIS):Primary contact: Noreen McLeroy, Johnson Space Center
E-mail: [email protected]
Phone: 281-244-9702
Bob Garcia, Aircraft Maintenance Division, NASA Dryden
E-Mail: [email protected]
Phone: 661-276-3826
NAMIS requires an account approved by the center aviation safety manager and NASA HQ. Data is con-
sidered NASA sensitive.
• Aviation Safety Reporting System (ASRS):Primary contact: Linda Connell, ASRS Director, NASA Ames
E-mail: [email protected] Phone: 650-604-0795
ASRS is publicly accessible at [Online]: http://asrs.arc.nasa.gov. ASRS is also linked to the FAA
ASIAS database portal.
• Incident Reporting Information System (IRIS):Primary contact: Suzanne Otero
E-Mail: [email protected]
Accessing IRIS requires an account approved by the center aviation safety manager. Data is considered
NASA sensitive.
Other US Government UAS Data Sources
• National Transportation Safety Board (NTSB) Aviation Accident/Incident DatabasePrimary Contact: [email protected] ; [email protected]
The NTSB database is available both through the Aviation Safety Information Analysis and Sharing
(ASIAS) website: [Online]: http://www.asias.faa.gov/pls/apex/f?p=100:24:0::NO:::
and the NTSB’s website: [Online]: http://www.ntsb.gov/aviationquery/index.aspx
The database can be either queried through the ASIAS and NTSB websites or it can be downloaded in its
entirety from the NTSB website as either a text or an XML file. For a description of the data fields, see the
website: [Online]: http://www.asias.faa.gov/pls/apex/f?p=100:9:0::NO::P9_REGION_VAR:
3
• Federal Aviation Interactive Reporting System (FAIRS)Primary contact: Jay Spurr
Email: [email protected]: 202-208-0519
FAIRS is a system for reporting aircraft owned by the federal government and their costs. FAIRS is
available to all federal government agencies that own or hire aircraft, but only users and reviewers chosen
by their agencies and trained by GSA can access the FAIRS website:
[Online]: http://www.gsa.gov/portal/content/104076
42

Some of its data, including aircraft accident listings, is available via the explore.data.gov website38.
which is a restricted access database that is mainly concerned with the costs associated with govern-
ment aircraft. However, it does include accident reports and summaries are available through the ex-
plore.data.gov website. The data available include aircraft costs, aircraft mission hours, aircraft invento-
ries, usage and operational costs, incidents and accidents
• US Geological Survey Safety Communique (SAFECOM)There is no single point of contact listed for SAFECOM. Instead, points of contact for the various regions
of the Forest Service and for the various agencies and regions of the Department of the Interior are found
on the SAFECOM website39. The database is also publicly available40.
As of 2012-06-04, only one UAS mishap has been reported in the SAFECOM database. SAFECOM
records are textual reports with sections describing the event (e.g., date, location), mission (e.g., type,
destination, persons on board), aircraft (manufacturer and model), narrative (textual itemize), corrective
action (textual itemize), and any relevant attachments.
• FAA Aviation Safety Information Analysis and Sharing (ASIAS)Primary Contact: [email protected]
The Aviation Safety Information Analysis and Sharing (ASIAS) system is an FAA portal to a number of
safety and incident databases, as well as a number of studies based on those databases. Eventually it is
expected to include at least sixty four such databases. ASIAS is the result of collaboration between the
federal government and industry and is tended to be used for data sharing and analysis that will lead to
improved aviation safety.
Some parts of the database are publicly available at: [Online]: http://www.asias.faa.gov/ but other
parts contain proprietary information and access is restricted. As of 06-06-2012, there are seven publicly
accessible databases.
• Accident and Incident Data System (AIDS)Primary Contact: [email protected]
This is one of the publicly accessible databases available through the FAA’s ASIAS portal (see above).
AIDS has FAA data on aircraft incidents and accidents. An incident is an event which is not serious enough
to be classified as an accident by the NTSB. These incidents still provide valuable safety information
relevant to, for example, aircraft design. This database is publicly searchable through the ASIAS system:
[Online]: http://www.asias.faa.gov/pls/apex/f?p=100:12:0::NO:::
AIDS has data on aircraft incidents and accidents from 01-01-1978 through the present. The data fields are
described at: [Online]: http://www.asias.faa.gov/pls/apex/f?p=100:15:0::NO::P15_REGION_
VAR:3
• Near Midair Collision System (NMACS)Primary Contact: [email protected]
NMACS is a database that records reports of near misses between civilian aircraft or civilian and military
aircraft (i.e., near misses between two military aircraft are not reported in NMACS).
This database is publicly searchable through the ASIAS system: [Online]: http://www.asias.faa.
gov/ by way of the webpage: [Online]: http://www.asias.faa.gov/pls/apex/f?p=100:4:0::
NO:::
NMACS has data on near misses from 1992 until the present. Report records contain data fields de-
scribed as given in: [Online]: http://www.asias.faa.gov/pls/apex/f?p=100:35:0::NO::P35_
REGION_VAR:3
38 [Online]: https://explore.data.gov/Information-and-Communications/Federal-Aircraft-Cost-and-Utilization-Data/4kfg-wew6
39[Online]: https://www.safecom.gov/SAFECOM_Contact_List.pdf40[Online]: https://www.safecom.gov/search.asp
43

Many fields may not be filled in for any given report.
• U.S. Air Force: Accident Investigation Board (AIB) Mishap ReportsThe U.S. Air Force convenes an Accident Investigation Board whenever there is are “Class A accidents
involving Air Force aircraft, unmanned aerial vehicles (UAVs), missiles, and space systems or equipment,
unless they result in damage solely to government property (in which case the accident investigation is
discretionary).” A Class A accident is one that results in “fatality or total permanent disability, loss of an
aircraft, or property damage of $2 million or more.”
Summaries of most Air Force Class A accident reports, which are largely textual accident reports, are
publicly available at the AIB website: [Online]: http://usaf.aib.law.af.mil/.
Some reports are classified and thus unavailable. Reports from FY2011 onward may include both sum-
maries and full narratives. Many reports from FY2008 required login to a secure website and thus are not
publicly available. Not all accident reports listed on the AIB website are available. In general, most of the
unavailable resources are from recent mishaps whose investigations may not be complete.
44

D UAS Data Requirements
On February 14, 2013, the FAA issued Screening Information Request (SIR) No. DTFACT-13-R-00002 for the
Unmanned Aircraft Systems Test Site Selection (UASTSS) requirement41. The draft of the Other TransactionAgreement (OTA), i.e., a memorandum of agreement between the FAA and a UAS proponent, to conduct research
and testing for the safe integration of UASs into the NAS, under FAA oversight, provides a detailed listing of
data to be reported by the proponent through a Site Operator authorized by the FAA.
The subsequent content of this appendix reproduces verbatim, pages 24 – 31 of Appendix B – Reported Data,
of the Draft Other Transaction Agreement (OTA) for the FAA Unmanned Aircraft Systems Test Site Require-
ment, dated Feb. 14, 2013. The entire document is also available at:
[Online]: https://faaco.faa.gov/index.cfm/announcement/view/14348
41[Online]: https://faaco.faa.gov/index.cfm/announcement/view/14348
45

2-14-2013 Page 24 of 58
������������ �������� This Appendix provides a sample listing of the data the Site Operator will collect and provide to the FAA. The exact data, the means to transfer the data, and its due date(s) will be specified, as required. 1 Administrative/Design 1.1 Submit Date N-Number Make Type of Aircraft: (Airplane, Rotorcraft, Airship, Powered Glider) Type of Engine: (Reciprocating, Turbo-Propeller, Gas Turbine) Type of Fuel Type of Propeller: (Fixed Pitch or Variable Pitch/Constant Speed) Propeller Diameter Static rpm @ max permissible throttle setting (fixed pitch) Pitch settings (low & high) (constant speed/variable pitch) Geographic Location See-and-Avoid Method 1.2 Vehicle Description Length Height Width (wing span) Maximum Allowable Gross Weight Maximum Allowable Landing Weight Maximum Zero Fuel Weight (turbine powered) Minimum Flying Weight (turbine powered) 1.3 Weight and Balance Most Forward Center of Gravity (CG) Location Most Aft Center of Gravity (CG) Location Actual Aircraft Take-Off Weight (with fuel and payload configuration) Actual CG Location for Flight (within longitudinal forward & aft limits) 1.4 Manufacturer’s Design Airspeeds (CAS/IAS in knots or mph; minimum, maximum and
nominal) Vs (stall) Vlo (landing gear operating) Vfe (flaps extension) Va (maneuvering) Vc (cruise) Vne (never exceed) [reciprocating] Vmo (maximum operating) [turbine powered] Vd (dive) V1 (rotation)
46

2-14-2013 Page 25 of 58
V2 (positive rate of climb) Vy (best angle of climb) 1.5 Manufacturer’s Design Performance Data Ceiling limitations Environmental Limitations Wake Turbulence tolerances 1.6 Control Station MCS LRS RCPS Primary Operating Frequency Secondary Operating Frequency Other Spectrum Utilization 1.7 System Interoperability
Data is needed that identifies how interoperable UAS sub-systems are in the NAS environment, as well as how integration impacts overall functionality and performance of both systems
Autopilot Logic Sense and Avoid Technologies ATC Automation System Latencies System Inter-dependencies Overall system response times 1.8 Communications Data
Command and Control (C2) link and ATC voice communications data is needed to evaluate crucial communications architectures for visual line of sight (VLOS) and beyond visual line of sight (BVLOS) operations.
How the architectures are designed and intended to function Actual performance under all conditions Security requirements System latencies 1.9 Human Performance Data
Data concerning human performance as it relates to operational performance in the overall system (basically anything that captures UAS functionality that is not facilitated by the systems and technologies). This is a very broad category of data that includes the following items under all flight operating conditions:
Human response times Human/machine interactions in the control station (CS) Effect of crew procedures Impact of skill Impact of training
47

2-14-2013 Page 26 of 58
Impact of the allocation of responsibilities Impact of workload Impact of situation awareness 1.10 Repair and Maintenance Data
Information/data that identifies repair and maintenance procedures and frequency, life-limited parts, etc., as well as correlating aircraft flight and performance data and its impact on necessary repair and maintenance.
1.11 Air and Ground Lethality Data
Flight data and flight data statistics that can be used to accurately determine lethality risks in the NAS environment.
1.12 Environmental Data
Data concerning noise, emissions, impact to the environment. 2 Flight Data 2.1 Weather Wind Speed and Direction Visibility Time of Day Ceiling Temperature Altimeter Setting Density Altitude 2.2 Take-Off Time 2.3 Take-Off Distance 2.4 Landing Time 2.5 Landing Distance 2.6 Flight Time (hours accumulated this flight) 2.7 Number of Landings/Cycles 2.8 Maximum Altitude Achieved (service ceiling) 2.9 Maximum Distance from ground control distance (GCS) 2.10 Lift to Drag Profile 2.11 Airspeed Envelope 2.12 Climb/Descend Rates 2.13 Turn Rates 2.14 Engine / Power System
Run Time Serial Number % RPM % energy use (e.g., battery, solar) Oil Pressure Oil Temperature Fuel Quantity at Take-Off
Fuel Remaining at Landing
48

2-14-2013 Page 27 of 58
Fuel Consumption (gallons per hour or pounds per hour) 2.15 Payload Type 2.16 Transponder
Transponder Model Transponder Code
2.17 Launch/Recovery Method of launch (e.g., runway, rail, hand launch, maritime…) Method of recovery (e.g., runway, catch wire, maritime…) Runway length required
Crosswind limitation Surface condition limitations (e.g., braking action, cross-wind…) Atmospheric performance limitations (e.g., high altitude, high temperature, icing…) 2.18 Time in Service 2.19 Total Airframe Time (hours) 2.20 Total Engine Time (hours) 2.21 Total Number of Landings (cycles) 3 Crew Data 3.1 Flight/Ground Crew (Hours and Time of Day) 3.2 Pilot-in-Command (PIC) 3.3 PIC Time in Type or Category 3.4 Pilot Internal 3.5 Pilot External 3.6 Payload Operator 3.7 Instructor Pilot 3.8 Transfer(s) 3.9 Number of Observers 3.10 Chase Aircraft 4 Malfunctions or Defects, Incidents, and Accidents 4.1 Unusual Equipment Malfunctions (hardware/software) 4.2 Deviations from ATC Instructions 4.3 All Periods of Loss of Communication and Duration 4.4 Deviations from the "Special Provisions" of the Test Site COA 4.5 All periods of Total Loss Link; Including Duration 4.6 Incidents/Accidents involving the UAS as Defined in 49 Code of Federal Regulations (CFR)
830 4.7 Other 5 Data to be Collected on Potential Anomaly(s) 5.1 Loss of Propulsion Engine failure Fuel starvation Stuck throttle Icing/weather
49

2-14-2013 Page 28 of 58
5.2 Loss of Lift Structural failure Icing/weather 5.3 Loss of Heading/Altitude/Position Information Heading/attitude system failure Navigation system failure 5.4 Unplanned Loss of Link Radio frequency interference Flight beyond horizon Antenna masking Loss of CS Software interrupt between CS and unmanned aircraft (UA) Atmospheric attenuation Inadvertent deactivation of autopilot Loss of satellite link 5.5 Loss of Control Surface Performance Stuck servo Autopilot failure Icing/damage to control surface 5.6 Loss of UAS Electrical Power Generator failure Backup battery failure Excessive load from payload 5.7 Loss of Control Station Loss of GCS power GCS computer failure GCS transmitter/receiver/antenna failure 5.8 Mission Planning/Operator Error Flight below minimum en-route safe altitude Undetected man-made obstacles (towers, cables, etc.) 5.9 Altitude Error Incorrect barometer setting Inadequate alert for altitude deviation 5.10 Navigation Error Navigation system failure Navigation system discrepancy (Inertial Navigation System (INS) vs. Global Positioning System (GPS)) Map display inaccuracy
50

2-14-2013 Page 29 of 58
5.11 Failure to See and Avoid Terrain No capability Autonomous operation 5.12 Loss of Link “Fly Home” Mode Mission planning error for loss of link mode 5.13 Unable to “See & Avoid” Limited capability Autonomous operation 5.14 Mission Planning Error Inadvertent flight into routes of other aircraft 5.15 Not Seen by Other Aircraft Strobe/position lights inadequate or failed Traffic Alert and Collision Avoidance System (TCAS) failure ATC/UAS operator communication link failure 5.16 Pilot Induced Oscillation System latency 5.17 Automatic Landing System Failure Radio Frequency Interference (RFI) Handoff errors Missed approach procedures 5.18 Operator Error Outside weather/wind limits Internal pilot/external pilot handoff errors 5.19 Inadequate Operator Response Failure to recognize flight critical situation Erroneous flight critical information Delays in information flow 5.20 Incorrect Inputs of Flight Critical Parameters Operator entry errors 5.21 Operator Information Overload Tasking Sensory overload 5.22 Critical Information Unavailable, Inadequate, Blocked, etc. 5.23 Design dependent
51
2-14-2013 Page 30 of 58
5.24 Latency of Flight Control Commands Operator removed from control loop Non-deterministic software Control link through satellite 5.25 Operator Fatigue Inadequate crew rest Task saturation Long/boring mission 5.26 Software Paths to Unsafe State Unexpected reboot Inadequate software safety process Other observational data should be noted for each flight. This data may include subjective evaluation or overview of the flight conducted, and is intended to provide a reporting mechanism for data points not specifically outlined above. 6 Training Data 6.1 Name of aircraft to be used 6.2 Method of ground control station 6.3 Training program syllabus 6.3.1 Aircraft system overview 6.3.2 Engine and associated accessories 6.3.3 Electrical system and associated accessories. 6.3.4 Data link 6.3.5 Lost link procedures 6.3.6 Aircraft limitations 6.3.7 Emergency procedures 6.3.8 Test site parameters 6.3.9 Weather limits and methods to obtain weather briefings 6.3.10 Runways and Test Site limitations 6.3.11 Accident procedures 6.3.12 Hazardous materials on the Unmanned Aircraft 6.3.13 Local fire department, police, and closet ambulance 6.3.14 Name of Chief pilot 6.3.15 Qualification of Chief pilot 6.3.16 Qualifications of the pilot in command and other crew members 6.3.17 Airspace and 14 CFR Part 91 6.3.18 Traffic Flow Management (TFM) 6.3.19 The number of hours it will take to deliver this training 6.3.20 Name and qualifications of instructors and name of Chief Flight Instructor both for air
and ground 6.3.21 Data to support that the following pre-flight took place: Aircraft familiarization
52

2-14-2013 Page 31 of 58
6.3.22 Taxi, takeoff, launch 6.3.23 Lost link procedures 6.3.24 Emergency procedures 6.3.25 Climbs, descents, straight and level 6.3.26 Landings 6.3.27 Maneuvers to be performed to gain proficiency in flying the aircraft 6.3.28 Localized airspace management (e.g., pertinent air traffic procedures, airspace policy,
etc.)
7 Data on the following 7.1 Number of hours flown each month for each pilot and crew member 7.2 Number of students trained. 7.3 Pilot deviations from Test Site SOP's and/or Certificate of Authorization (COA) 7.4 Any accidents/incidents 7.5 Any medical issues for any pilot or crew member 7.6 Recommendations on pilot training 7.7 Pilot read back errors
53

This page is intentionally blank.
54

References
[1] R. A. Clothier, J. L. Palmer, R. A. Walker, and N. L. Fulton, “Definition of an airworthiness certification
framework for civil unmanned aircraft systems,” Safety Science, Mar. 2011.
[2] Gerald L. Dillingham, “FAA Is Taking Steps to Improve Data, but Challenges for Managing Safety Risks
Remain.” GAO-12-660T, Apr. 2012.
[3] R. A. Clothier and R. A. Walker, “The safety risk management of unmanned aircraft systems,” in Hand-book of Unmanned Aerial Vehicles (K. P. Valavanis and G. J. Vachtsevanos, eds.), Dordrecht, Netherlands:
Springer Science+Business Media B.V., 2013.
[4] Dillingham, G. L., “Unmanned Aircraft Systems - Measuring Progress and Addressing Potential Privacy
Concerns Would Facilitate Integration into the National Airspace System.” GAO-12-981, Sep. 2012.
[5] Dillingham, G. L., “Unmanned Aircraft Systems - Continued Coordination, Operational Data, and Perfor-
mance Standards Needed to Guide Research and Development.” GAO-13-346T, Feb. 2013.
[6] Federal Aviation Administration, “Unmanned Aircraft Systems (UAS) Operational Approval.” National
Policy. N 8900.207, Jan. 2013.
[7] E. C. Grace, “U.S. Air Force Abbreviated Aircraft Accident Investigation Board Report, MQ-9, T/N 09-
004065,” 2013.
[8] Federal Aviation Administration, “Safety Risk Management Policy.” National Policy. Order 8404.4A, Apr.
2012.
[9] Federal Aviation Administration, “Safety Management System.” National Policy. Order 8000.369A, May
2013.
[10] J. Reason, Human Error. Cambridge University Press, 1990.
[11] N. Leveson, “A systems-theoretic approach to safety in software-intensive systems,” IEEE Transactions onDependable and Secure Computing, vol. 1, pp. 66 – 86, Jan.-Mar. 2004.
[12] I. Svedung and J. Rasmussen, “Graphic representation of accident scenarios: mapping system structure and
the causation of accidents,” Safety Science, vol. 40, pp. 397–417, 2002.
[13] P. B. Ladkin, “Accident analysis: Why-because analysis,” in Causal System Analysis, no. RVS-BK-05-01,
Aug. 2001.
[14] ACE-100, U.S. Department of Transportation, Federal Aviation Administration, “System Safety Analysis
and Assessment for Part 23 Airplanes.” Advisory Circular, AC No: 23.1309-1E, Nov. 2011.
[15] S-18, Aircraft And System Development And Safety Assessment Committee, ARP 4761, Guidelines andMethods for Conducting the Safety Assessment Process on Civil Airborne Systems and Equipment. Society
of Automotive Engineers (SAE), Dec. 1996.
[16] U.S. Department of Defense (DoD), “Standard Practice for System Safety.” MIL-STD-882E, May 2012.
[17] FAA Air Traffic Organization, Safety Management System Manual. Version 2.1, May 2008.
[18] A. D. Livingstone, G. Jackson, and K. Priestly, “Root causes analysis: Literature review,” Contract Research
Report 325/2001, Health and Safety Executive, UK, 2001.
[19] A. Berson, S. Smith, and K. Thearling, Building Data Mining Applications for CRM. McGraw Hill, 1999.
[20] S. Budalakoti, A. N. Srivastava, and M. E. Otey, “Anomaly detection and diagnosis algorithms for discrete
symbol sequences with applications to airline safety,” IEEE Transactions on Systems, Man, and Cybernet-ics, Part C, vol. 39, no. 1, pp. 101–113, 2009.
55

[21] A. N. Srivastava et al., “Enabling the discovery of recurring anomalies in aerospace system problem reports
using high-dimensional clustering techniques,” in 2006 Proceedings of the IEEE Aerospace Conference,
IEEE, 2006.
[22] J. Schumann, K. Cate, and A. Lee, “Analysis of air traffic track data with the autobayes synthesis system,”
in Logic-Based Program Synthesis and Transformation - 20th International Symposium, LOPSTR 2010,
vol. 6564 of LNCS, pp. 21–36, Springer, 2011.
[23] M. Gariel, A. N. Srivastava, and E. Feron, “Trajectory clustering and an application to airspace monitoring,”
IEEE Transactions on Intelligent Transportation Systems, vol. 12, no. 4, pp. 1511–1524, 2011.
[24] A. Rose, “Understanding Aviation Risk,” in 11th International Conference on Information Fusion, pp. 1–7,
IEEE, 2008.
[25] U.S. Department of the Army, “Unmanned Aircraft System Accident Report (UASAR), Form 2397-U,”
Feb. 2010.
[26] NASA Aircraft Management Division, NPR 7900.3C, Aircraft Operations Management Manual. NASA,
Jul. 2011.
[27] Safety Regulation Group, CAP 722 Unmanned Aircraft System Operations in UK Airspace – Guidance.
U.K. Civil Aviation Authority, Aug. 2012.
[28] Safety Regulation Group, CAP 382 The Mandatory Occurrence Reporting Scheme – Information and Guid-ance. U.K. Civil Aviation Authority, Mar. 2011.
[29] K. D. Davis, “Unmanned Aircraft Systems Operations in the U.S. National Airspace System.” Interim
Operational Approval Guidance 08-01, Mar. 2008.
[30] J. Elston, M. Stachura, B. Argrow, E. Frew, and C. Dixon, “Guidelines and Best Practices for FAA
Certificate of Authorization Applications for Small Unmanned Aircraft,” in Proceedings of the AIAA In-fotech@Aerospace Conference, no. AIAA 2011-1525, 2011.
[31] A. Williams, Safety Risk Management Document (SRMD) For Establishing a Baseline Hazard AnalysisFor Operating Unmanned Aircraft Systems (UAS) In Class D Airspace. Air Traffic Organization, Federal
Aviation Administration, Sep. 2008.
[32] J. Kautzky, S. Berg, S. Claggett, and R. Estkowski, “UAS in the NAS Modeling and Simulation.” Boeing
NRA Final Report, NASA Contract NND11AQ73C, Sep. 2012.
[33] Separation Assurance / Sense and Avoid Interoperability Subproject, “Concepts for Integration of UAS in
the NAS.” Draft Report, Aug. 2012.
[34] UK Ministry of Defence (MOD), “Safety management requirements for defence systems.” Defence Stan-
dard 00-56 Issue 4, Jun. 2007.
[35] F. Redmill, M. Chudleigh, and J. Catmur, System Safety: HAZOP and Software HAZOP. John Wiley &
Sons, Inc., Jun. 1999.
[36] National Aeronautics and Space Administration (NASA), “Facility System Safety Guidebook.” NASA-
STD-8719.7, Jan. 1998.
[37] N. Dulac and N. Leveson, “An approach to design for safety in complex systems,” in International Sympo-sium on Systems Engineering (INCOSE), pp. 33–407, 2004.
[38] P. B. Ladkin, “Ontological Analysis,” Safety Systems, vol. 14, May 2005.
56

[39] J. Stupohorn, B. Sieker, and P. B. Ladkin, “Dependable risk analysis for systems with E/E/PE components:
Two case studies,” in Safety-Critical Systems: Problems, Process and Practice (C. Dale and T. Anderson,
eds.), pp. 95–115, Springer London, 2009.
[40] U.S. Department of Defense (DoD), “Procedures for performing a Failure Modes, Effects and Criticality
Analysis.” MIL-STD-1629A, Nov. 1980.
[41] J. Dugan, S. Bavuso, and M. Boyd, “Fault trees and markov models for reliability analysis of fault tolerant
systems,” Journal of Reliability Engineering and System Safety, vol. 39, pp. 291–307, 1993.
[42] J. Dugan, S. Bavuso, and M. Boyd, “Dynamic fault tree models for fault tolerant computer systems,” IEEETransactions on Reliability, vol. 41, no. 3, pp. 363–373, Sept. 1992.
[43] C. A. Ericson II, Hazard Analysis Techniques for System Safety. John Wiley & Sons, Inc., 2005.
[44] J. B. Dugan, G. J. Pai, and H. Xu, “Combining software quality analysis with dynamic event/fault trees for
high assurance systems engineering,” in 10th IEEE International Symposium on High Assurance SystemsEngineering (HASE 2007), pp. 245–255, Nov. 2007.
[45] C. W. Johnson, Failure in Safety-Critical Systems: A Handbook of Accident and Incident Reporting. Uni-
versity of Glasgow Press, Glasgow, Scotland, Oct. 2003.
[46] Office of Nuclear Safety Policy and Standards, Root Cause Analysis Guidance Document. U.S. Department
of Energy (DOE), Feb. 1992.
57

REPORT DOCUMENTATION PAGE Form ApprovedOMB No. 0704–0188
The public reporting burden for this collection of information is estimated to average 1 hour per response, including the time for reviewing instructions, searching existing data sources,gathering and maintaining the data needed, and completing and reviewing the collection of information. Send comments regarding this burden estimate or any other aspect of this collectionof information, including suggestions for reducing this burden, to Department of Defense, Washington Headquarters Services, Directorate for Information Operations and Reports(0704-0188), 1215 Jefferson Davis Highway, Suite 1204, Arlington, VA 22202-4302. Respondents should be aware that notwithstanding any other provision of law, no person shall besubject to any penalty for failing to comply with a collection of information if it does not display a currently valid OMB control number.PLEASE DO NOT RETURN YOUR FORM TO THE ABOVE ADDRESS.
Standard Form 298 (Rev. 8/98)Prescribed by ANSI Std. Z39.18
1. REPORT DATE (DD-MM-YYYY)
01-12-2013
2. REPORT TYPETechnical Memorandum
3. DATES COVERED (From - To)
4. TITLE AND SUBTITLE
Preliminary Recommendations for the
Collection, Storage, and Analysis of
UAS Safety Data
5a. CONTRACT NUMBER
5b. GRANT NUMBER
5c. PROGRAM ELEMENT NUMBER
5d. PROJECT NUMBER
5e. TASK NUMBER
5f. WORK UNIT NUMBER
6. AUTHOR(S)
David Bushnell, Ewen Denney, Francis Enomoto, Ganesh Pai, and Johann
Schumann
7. PERFORMING ORGANIZATION NAME(S) AND ADDRESS(ES)NASA Ames Research CenterMoffett Field, California 94035-1000
8. PERFORMING ORGANIZATIONREPORT NUMBER
L–
9. SPONSORING/MONITORING AGENCY NAME(S) AND ADDRESS(ES)National Aeronautics and Space Administration
Washington, DC 20546-0001
10. SPONSOR/MONITOR’S ACRONYM(S)NASA
11. SPONSOR/MONITOR’S REPORTNUMBER(S)
NASA/TM–2013–216624
12. DISTRIBUTION/AVAILABILITY STATEMENT
Unclassified-Unlimited
Subject Category
Availability: NASA CASI (443) 757-5802
13. SUPPLEMENTARY NOTES
An electronic version can be found at http://ntrs.nasa.gov.
14. ABSTRACT
Although the use of UASs in military and public service operations is proliferating, civilian use of UASs remains limited in the United States
today. With efforts underway to accommodate and integrate UASs into the NAS, a proactive understanding of safety issues, i.e., the unique
hazards and the corresponding risks that UASs pose not only through their operations for commercial purposes, but also to existing
operations in the NAS, is especially important so as to (a) support the development of a sound regulatory basis, (b) regulate, design and
properly equip UASs, and (c) effectively mitigate the risks posed.
Data, especially about system and component failures, incidents, and accidents, provides valuable insight into how performance and
operational capabilities/limitations contribute to hazards. Since the majority of UAS operations today take place in a context that is
significantly different from the norm in civil aviation, i.e., with different operational goals and standards, identifying that which constitutes
useful and sufficient data on UASs and their operations is a substantial research challenge.
15. SUBJECT TERMS
Risk Analysis, Aviation Safety, Hazard Analysis, Data Collection, Unmanned Aircraft Systems
16. SECURITY CLASSIFICATION OF:
a. REPORT
U
b. ABSTRACT
U
c. THIS PAGE
U
17. LIMITATION OFABSTRACT
UU
18. NUMBEROFPAGES
65
19a. NAME OF RESPONSIBLE PERSONSTI Help Desk (email: [email protected])
19b. TELEPHONE NUMBER (Include area code)(443) 757-5802
3

4


![Methodology material. References and Data Collection for local products Screening 1 Recommendations Screening 2 Recommendations and archetype [Step 1]](https://static.fdocuments.net/doc/165x107/56649e915503460f94b96138/methodology-material-references-and-data-collection-for-local-products-screening.jpg)
