Preliminary Issues Associated with the Next Generation ...
133
Preliminary Issues Associated with the Next Generation Nuclear Plant Intermediate Heat Exchanger Design ANL/EXT-06/46 Nuclear Engineering Division
Transcript of Preliminary Issues Associated with the Next Generation ...

Preliminary Issues Associated with the Next Generation Nuclear Plant Intermediate Heat Exchanger Design
ANL/EXT-06/46
Nuclear Engineering Division

Availability of This ReportThis report is available, at no cost, at http://www.osti.gov/bridge. It is also available on paper to the U.S. Department of Energy and its contractors, for a processing fee, from:
U.S. Department of Energy
OfficeofScientificandTechnicalInformation
P.O. Box 62
Oak Ridge, TN 37831-0062
phone (865) 576-8401
fax (865) 576-5728
Disclaimer
This report was prepared as an account of work sponsored by an agency of the United States Government. Neither the United States
Governmentnoranyagencythereof,norUChicagoArgonne,LLC,noranyoftheiremployeesorofficers,makesanywarranty,express
or implied, or assumes any legal liability or responsibility for the accuracy, completeness, or usefulness of any information, apparatus,
product,orprocessdisclosed,orrepresentsthatitsusewouldnotinfringeprivatelyownedrights.Referencehereintoanyspecific
commercial product, process, or service by trade name, trademark, manufacturer, or otherwise, does not necessarily constitute or imply
its endorsement, recommendation, or favoring by the United States Government or any agency thereof. The views and opinions of
documentauthorsexpressedhereindonotnecessarilystateorreflectthoseoftheUnitedStatesGovernmentoranyagencythereof,
Argonne National Laboratory, or UChicago Argonne, LLC.
About Argonne National Laboratory Argonne is a U.S. Department of Energy laboratory managed by UChicago Argonne, LLC under contract DE-AC02-06CH11357. The Laboratory’s main facility is outside Chicago, at 9700 South Cass Avenue, Argonne, Illinois 60439. For information about Argonne, see www.anl.gov.

Preliminary Issues Associated with the Next Generation Nuclear Plant Intermediate Heat Exchanger Design
ANL/EXT-06/46
by K. Natesan, A. Moisseytsev, S. Majumdar, and P.S. ShankarNuclear Engineering Division, Argonne National Laboratory
forU.S. Department of Energy Office of Nuclear Energy, Science, and Technology
September 2006

1
Executive Summary
The Next Generation Nuclear Plant (NGNP), which is an advanced high temperature gas reactor (HTGR) concept with emphasis on production of both electricity and hydrogen, involves helium as the coolant and a closed-cycle gas turbine for power generation with a core outlet/gas turbine inlet temperature of 900-1000*C. In the indirect cycle system, an intermediate heat exchanger is used to transfer the heat from primary helium from the core to the secondary fluid, which can be helium, nitrogen/helium mixture, or a molten salt. The system concept for the vary high temperature reactor (VHTR) can be a reactor based on the prismatic block of the GT-MHR developed by a consortium led by General Atomics in the U.S. or based on the PBMR design developed by ESKOM of South Africa and British Nuclear Fuels of U.K.
This report has made a preliminary assessment on the issues pertaining to the intermediate heat exchanger (IHX) for the NGNP. Two IHX designs namely, shell and tube and compact heat exchangers were considered in the assessment. Printed circuit heat exchanger, among various compact heat exchanger (HX) designs, was selected for the analysis. Irrespective of the design, the material considerations for the construction of the HX are essentially similar, except may be in the fabrication of the units. As a result, we have reviewed in detail the available information on material property data relevant for the construction of HX and made a preliminary assessment of several relevant factors to make a judicious selection of the material for the IHX.
The assessment included four primary candidate alloys namely, Alloy 617 (UNS N06617), Alloy 230 (UNS N06230), Alloy 800H (UNS N08810), and Alloy X (UNS N06002) for the IHX. Some of the factors addressed in this report are the tensile, creep, fatigue, creep fatigue, toughness properties for the candidate alloys, thermal aging effects on the mechanical properties, American Society of Mechanical Engineers (ASME) Code compliance information, and performance of the alloys in helium containing a wide range of impurity concentrations.
A detailed thermal hydraulic analysis, using a model developed at ANL, was performed to calculate heat transfer, temperature distribution, and pressure drop inside both printed circuit and shell-and-tube heat exchangers. The analysis included evaluation of the role of key process parameters, geometrical factors in HX designs, and material properties. Calculations were performed for helium-to-helium, helium-to–helium/nitrogen, and helium-to-salt HXs. The IHX being a high temperature component, probably needs to be designed using ASME Code Section III, Subsection NH, assuming that the IHX will be classified as a class 1 component. With input from thermal hydraulic calculations performed at ANL, thermal conduction and stress analyses for both compact and shell-and-tube HXs were performed.
Several conclusions were drawn from this assessment:
• In general, majority of materials research and development programs in support of HTGRs were conducted in the 1960s to early 1980s. The thrust of these programs was to develop a database on materials for application in steam-cycle and process-nuclear-heat based HTGRs. Very little work was done on materials with emphasis on direct and/or indirect gas-turbine-based (of interest for IHX in NGNP) HTGRs during this period.
• Among the four candidate materials, Alloy 800H is code certified for temperatures only up to 760°C for use in nuclear systems and therefore, the temperature limit is not high enough for application of this alloy in the NGNP IHX. Neither Alloy 617 nor Alloy 230 is currently allowed in ASME Code Section III, although both are allowed in Section VIII,

2
Division 1 (for non-nuclear service). A draft code case for Alloy 617 has been developed but is not approved by the ASME Code. A limited database exists for Hastelloy X. Since the high temperature scaling in Hastelloy X has not been adequate, a modified version Hastelloy XR has been developed in programs conducted in Japan for which the U.S. has little access for both evaluation and for ASME Code qualification.
• Specific conclusions pertaining to materials database for Alloys 617 and 230 are as follows:
- Alloy 617: Composition refinement is necessary to achieve consistent mechanical properties and precise evaluation of microstructural effects on mechanical performance. There is a need to generate additional mechanical property data, especially on creep fatigue behavior with and without hold time. The analysis showed that the damage under creep-fatigue conditions is much more than predictions based on the linear rule. Additional data on creep-fatigue under different loading scenarios are needed to develop a predictive capability on creep fatigue damage in the alloy, especially in helium purity levels typical of gas-turbine-based HTGRs. There is a need to establish corrosion regimes in helium with impurity levels anticipated in gas-turbine-based reactor system. Microstructural and mechanical property characterizations are needed for thin section materials, especially for use in compact HXs. It is necessary to validate the effect of system pressure on the corrosion performance of the alloy in impure helium. Tests are needed to verify that the tensile, creep, and creep-fatigue strengths of the diffusion bonded Alloy 617 joints used in the compact HX are adequate.
- Alloy 230: Limited data are currently available on the mechanical property for the alloy. Data on Long term aging effects on the mechanical property need to be generated. There is lack of information on the long-term corrosion performance of the alloy in helium of relevant impurity levels. Microstructural and mechanical property characterizations are needed for thin section materials, especially for use in compact HXs. The effect of system pressure on the corrosion performance of the alloy in impure helium needs evaluation.
• Significant R&D will be needed to qualify Alloy 617 under ASME Code Section III for high temperature applications, even though some design-relevant material properties are given in the draft code case for temperatures up to 982°C. The ratcheting rules, that were limited to <650°C in the draft code case, need to be expanded to allow higher temperatures. At present, there is insufficient data for Alloy 230 to develop a code case for elevated temperature application. If the IHX is classified as a Class 2 or Class 3 component, new Code Cases need to be developed for high temperature applications.
• Design rules of Subsection NH of the ASME Code, which were developed for shell like structures (such as shell-and-tube HX), are not strictly applicable to the compact three-dimensional honeycomb structures of PCHE. New design rules and analyses tools are needed for this type of structure.
• A thermal hydraulic model has been applied to NGNP IHX conditions to calculate the required size of the HX. Sensitivity study of HX parameters was conducted for helium-to-helium, helium-to-helium/nitrogen, helium-to-salt heat transfer. Calculations were made to compare the performance of a compact heat exchanger with a shell-and-tube heat

3
exchanger. The results showed a reduction in compact HX volume of factors of 30 (compared to a shell-and-tube HX without ID and OD fins) and 5 (compared to a shell-and-tube HX with ID and OD fins), respectively. The pressure drop increases for the hot side for the compact HX were factors of 512 (without fins in shell-and-tube HX) and 8 (with fins in shell-and-tube HX). The corresponding pressure drop increases for the cold side for the compact HX were factors of 875 (without fins in shell-and-tube HX) and 12 (with fins in shell-and-tube HX). The results also showed that for an IHX heat duty of ≈45 MWt, ≈20 compact heat exchangers would be required based on the fabrication size limit used in the calculations.
• For a reactor outlet temperature and pressure of 900°C and 7 MPa, respectively, and a secondary side inlet temperature and pressure of 575°C and 1.95 MPa, respectively, the allowable design life (based on in-air tensile and creep rupture strengths of Alloy 617) of the compact IHX is 80,000 h and that of the shell and tube IHX (for the tube size selected) is 20,000 h. These design lifetimes are based on analyses of the IHX core and further reduction in life may result from interaction of the core region with the header region. The design lifetimes may also decrease, if thin section creep properties (which are generally less than those of thicker materials) are considered. In addition, the effect of impure helium on creep properties needs to be incorporated in the design data and in the lifetime calculations. At high temperatures, Alloys 617 and 230 have almost identical YS and UTS and have similar creep rupture properties. Therefore, replacing Alloy 617 with Alloy 230 may not lead to longer design lifetime for the IHX unless the performance of Alloy 230 in NGNP helium is significantly superior to that of Alloy 617.

4
Contents Executive Summary...........................................................................................................1
1. Introduction............................................................................................................... 15
2. Intermediate Heat Exchanger Requirements ............................................................ 15
2.1 IHX Design Concepts..................................................................................... 16 2.1.1 Gas-to-Gas Heat Exchanger.............................................................16
3. Materials of Construction .......................................................................................... 21
3.1 Metallic Alloys ................................................................................................ 21 3.1.1 Alloy 617 (UNS N06617)...................................................................21
3.1.2 Alloy 230 (UNS N06230)...................................................................41
3.1.3 Alloy 800H (UNS N08810) ................................................................52
3.1.4 Alloy X (UNS N06002) ......................................................................58
3.2 Ceramic Materials .......................................................................................... 63 3.3 Thin-section Mechanical Properties of Metallic Alloys .................................... 63 3.4 Corrosion in Reactor Helium Environments.................................................... 66
3.4.1 Coolant Chemistry ............................................................................66
3.4.2 Corrosion Performance Data ............................................................67
4. Gas-to-Gas IHX Calculations .................................................................................... 73
4.1 Printed Circuit Heat Exchanger ...................................................................... 73 4.1.1 Base Case ........................................................................................73
4.1.2 Effect of PCHE Construction Material ...............................................78
4.1.3 Effect of Reactor Outlet Temperature ...............................................78
4.1.4 Effect of Intermediate Loop Pressure................................................78
4.1.5 Effect of Mass Flow Margin on IHX Heat Duty ..................................81
4.1.6 Effect of Nitrogen-Helium Mixture in Secondary Loop.......................83
4.2 Shell-and-Tube IHX........................................................................................ 86 5. Stress Calculations in Gas-to Gas IHX ..................................................................... 99
5.1 Compact IHX ................................................................................................. 99 5.1.1 Thermal Conduction Analysis ...........................................................99
5.1.2 Stress Analyses ..............................................................................101

5
5.1.3 ASME Code Compliance Calculations ............................................103
5.2 Shell and Tube IHX ...................................................................................... 107 5.2.1 Primary Stresses ............................................................................108
5.2.2 Primary and Secondary Stresses....................................................108
5.3 Discussions and Conclusions....................................................................... 109 6. Gas-to-Molten Salt IHX Calculations....................................................................... 111
6.1 Base Case ................................................................................................... 111 6.2 Sensitivity Study........................................................................................... 111
6.2.1 6.2.1 Salt Flow Rate Variation.........................................................111
6.2.2 Variation of other parameters .........................................................113
7. Summary ................................................................................................................ 121
8. References ............................................................................................................. 124

6
Acronyms
ANL Argonne National Laboratory
DOE Department of Energy
GT-MHR Gas Turbine - Modular Helium Reactor
HTGR High Temperature Gas Reactor
HX Heat Exchanger
ID Inside Diameter
IHX Intermediate Heat Exchanger
NGNP Next Generation Nuclear Plant
OD Outside Diameter
ORNL Oak Ridge National Laboratory
PBMR Pebble Bed Modular Reactor
PCHE Printed Circuit Heat Exchanger
PH-MHR Process Heat-Modular Helium Reactor
PNP Prototype Nuclear Process
UTS Ultimate Tensile Strength
VHTR Very High Temperature Reactor System
YS Yield Strength

7
Figures
2.1 Possible tube configurations: a) bare tubes, b) fins on outer surface, c) fins on inner surface, and d) fins on both surfaces ......................................................................... 18
2.2 PCHE configuration for the model.............................................................................. 19
2.3 Heatric PCHE platelet design..................................................................................... 20
2.4 Zigzag channel in PCHE............................................................................................ 20
3.1 Mechanical properties of as-received Alloy 617 from past HTGR program conducted at ORNL and from French VHTR data ....................................................................... 23
3.2 Mechanical properties of as-received Alloys 617 and 230 from the French VHTR program.…………………………………………………………… ................................... 23
3.3 Heat-to-heat variation of creep behavior of Alloy 617 from past US HTGR programs. 24
3.4 Applied stress versus time-to-1% strain from creep of Alloy 617 at several temperatures .............................................................................................................. 25
3.5 Applied stress versus time-to-rupture from creep of Alloy 617 at several temperatures................................................................................................................ 25
3.6 Applied stress versus secondary creep rate for Alloy 617 at several temperatures ...... 26
3.7 Larson-Miller parameter versus time-to-1% strain for Alloy 617 ................................... 26
3.8 Larson-Miller parameter versus time-to-rupture for Alloy 617....................................... 26
3.9 Creep rupture strength of Alloys 617, 230, 800H and Hastelloy X................................ 27
3.10 Comparison of fatigue behavior of Alloy 617 with several conventional materials at 538°C .......................................................................................................................... 27
3.11 Low cycle fatigue results of Alloy 617 at 950ºC in air from present and past studies .... 28
3.12 Low cycle fatigue behavior of Alloy 617 in air environment .......................................... 28
3.13 Crack initiation life as a function of thermal cycling temperature .................................. 29
3.14 Effect of frequency on thermal fatigue behavior of Alloys 617 and 230 in air................ 29
3.15 Thermal fatigue behavior of Alloys 617 and 230 as a function of the mechanical strain range.................................................................................................................. 29
3.16 Illustrative rate dependence of creep-fatigue strength at elevated temperatures
3.17 Creep-fatigue response of Alloy 617 in air at 1000ºC................................................... 30
3.18 Creep curves for Alloy 617 at 950°C in a helium environment...................................... 32
3.19 Heat-to-heat variation in the creep behavior of Alloy 617 in helium .............................. 32
3.20 Variation in creep rupture time as a function of applied stress for Alloy 617 in air and in HTGR helium at several temperatures ..................................................................... 33
3.21 Variation in creep rupture time as a function of applied stress for Alloy 617 in air and in impure helium at several temperatures .................................................................... 33
3.22 Time-to-1% strain and time-to-rupture as a function of applied stress for Alloy 617 in air and in HTGR helium ............................................................................................... 34

8
3.23 Creep rupture ductility of Alloy 617 in air and in helium................................................ 34
3.24 Examples of creep curves and cracking behavior for Alloy 617 tested in air and in helium at 950°C ........................................................................................................... 35
3.25 Effect of Helium environment on the creep behavior of Alloy 617 from past US HTGR programs ..................................................................................................................... 35
3.26 Creep behavior of Alloy 617 at 843 and 950ºC in pure helium environment ................. 36
3.27 Creep rupture life of Alloy 617 in helium environments from past and present studies . 36
3.28 Effect of methane and oxygen impurities on the creep behavior of Alloy 617 .............. 37
3.29 Variation of rupture strain with applied stress in different helium environments............ 37
3.30 Low magnification fracture surface of specimen failed under creep at 27.6 MPa, 950ºC in He containing 675 ppm CH4 .......................................................................... 38
3.31 Cleavage fracture morphology of specimen shown in Fig. 3.29.................................... 39
3.32 Longitudinal cross-section of fracture specimen shown in Fig. 3.29 indicating crack propagation through coarse Cr-carbide network .......................................................... 39
3.33 Comparison of low-cycle fatigue behavior of Alloy 617 tested in air and in helium at 704°C .......................................................................................................................... 40
3.34 Comparison of low-cycle fatigue behavior of Alloy 617 tested in air and in helium at 871°C .......................................................................................................................... 40
3.35 Comparison of the low-cycle fatigue behavior of Alloy 617 tested in air and in helium with the design curves ................................................................................................. 40
3.36 Comparison of low-cycle fatigue behavior of solution-treated and carburized Alloy 617 tested in air and in helium at 1000°C..................................................................... 41
3.37 Influence of hold time on fatigue life of Alloy 617 at 1000°C......................................... 41
3.38 Comparison of experimental creep-fatigue data with linear damage accumulation rule 42
3.39 Tensile properties of hot rolled and solution annealed Alloy 230 plate ......................... 43
3.40 Creep rupture behavior of Alloy 230 in air .................................................................... 43
3.41 Comparison of 1% creep strengths and stress-rupture strengths of Alloy 230 with other alloys .................................................................................................................. 44
3.42 Creep rupture comparison of Alloys 230 and 617 with ASME allowables..................... 44
3.43 Creep data of Alloy 230 from current French VHTR program compared to that from a previous German HTGR program ................................................................................ 45
3.44 Low-cycle fatigue behavior of Alloy 230 in air............................................................... 45
3.45 Low cycle fatigue behavior of Alloy 230 with and without hold time.............................. 46
3.46 Effect of tensile hold time on the low cycle fatigue of Alloy 230 and two other superalloys .................................................................................................................. 46
3.47 Effect of hold-time on crack growth rate of Alloy 230 at 927ºC ..................................... 47
3.48 Mass change as a function of thermal cycles in cyclic oxidation test for Alloys 230 and 617........................................................................................................................ 47

9
3.49 Comparison of room temperature tensile elongation after 8000 h exposure in the 650-871ºC temperature range...................................................................................... 48
3.50 Effect of thermal aging on room temperature properties of Alloys 230 and 617............ 50
3.51 Effect of thermal aging on high temperature properties of Alloys 230 and 617 ............. 50
3.52 Comparison of isothermal oxidation behavior of Alloy 230 with other candidate heat exchanger materials after exposure at 950ºC and 800 hours in a helium environment. 51
3.53 Mass change as a function of time in air+10% water vapor at 1100ºC for Alloys 617, 230, and Hastelloy X.................................................................................................... 52
3.54 Mass change as a function of exposure time in H2-1%CH4 carburizing environment at 1000ºC for Alloys 617, 230, 188 and Hastelloy X ......................................................... 52
3.55 Mass change as a function of time in H2-5.5%CH4-4.5%CO2 carburizing environment at 1000ºC for Alloys 617, 230, 188, and Hastelloy X .................................................... 52
3.56 Minimum creep rate versus stress at 538-760°C and correlations developed by regression analysis ...................................................................................................... 53
3.57 Allowable stress values Smt for primary membrane calculations for actual service life and for normal-plus-upset conditions, as specified by the ASME Code........................ 54
3.58 Low- and high-cycle fatigue behavior of Alloy 800H at 760°C ...................................... 54
3.59 Creep-fatigue behavior of Alloy 800H in air environment at 600 and 800ºC ................. 54
3.60 Creep-fatigue damage envelope for Alloy 800H and other materials............................ 55
3.61 Creep rupture data for Alloy 800H at 650 and 760°C in helium with comparison to specifications based on air data, used in ASME Code ................................................. 55
3.62 Creep-rate comparison of Alloy 800H in air and in helium............................................ 56
3.63 High-cycle fatigue behavior of Alloy 800H at 760ºC in a helium environment............... 56
3.64 Creep behavior of Alloy 800H in different environments at 1000ºC .............................. 57
3.65 Effect of methane on the creep rupture behavior of Alloy 800H at 750ºC..................... 57
3.66 Brittle fracture in Alloy 800H after creep testing in He + 675 vppm methane environment at 750ºC, 68.95 MPa ............................................................................... 58
3.67 Effect of methane on the creep rupture behavior of Alloy 800H at 843ºC..................... 59
3.68 Effect of methane on the creep fracture mechanism in Alloy 800H tested at 843ºC, 55.2 MPa. .................................................................................................................... 59
3.69 Tensile properties of Hastelloy X and Alloy 617 in solution-annealed and aged conditions .................................................................................................................... 60
3.70 Applied stress versus rupture time for Hastelloy X at 760 and 871°C........................... 61
3.71 Applied stress versus minimum creep rate for Hastelloy X at 760 and 871°C .............. 61
3.72 Low-cycle fatigue behavior of Hastelloy X at several temperatures in air ..................... 61
3.73 Creep-fatigue behavior of Hastelloy X at 816 and 927ºC in air..................................... 62
3.74 Creep response of Hastelloy X and Hastelloy XR from the Japanese HTTR program.. 62

10
3.75 Comparison of strain-controlled fatigue data generated at 871°C in air and in helium for Hastelloy X in several conditions ............................................................................ 63
3.76 Corrosion behavior of Hastelloy X from the previous US HTGR program..................... 63
3.77 Variation of tensile properties with temperature of bar and sheet forms of Alloy 617.... 65
3.78 Allowable stress for heat exchanger materials for plate, sheet and strip forms............. 65
3.79 Effect of sample thickness on creep-rupture behavior of Alloy 230 tested at 750ºC, 100 MPa ...................................................................................................................... 66
3.80 Influence of specimen diameter/mean grain diameter ratio and solution temperature on the creep-rupture properties of a wrought nickel-base superalloy tested at 870ºC,138 MPa............................................................................................................ 66
3.81 Different surface layers observed on high temperature alloys exposed to helium ........ 68
3.82 Equilibrium partial pressure for several oxides as a function of reciprocal temperature, along with calculated oxygen partial pressures for several environments used in experiments..................................................................................................... 70
3.83 A comparative plot of corrosion behavior for Alloys 800H, Nimonic 86, and 617 from 2- and 50-atm tests ...................................................................................................... 72
3.84 Comparative plot of the environments used in different research programs ................. 73
4.1 Temperature profiles for base case.............................................................................. 75
4.2 Effect of PCHE channel diameter on HX size and pressure drop ................................. 76
4.3 Effect of PCHE hot side zigzag channel angle on HX size and pressure drop.............. 77
4.4 Effect of PCHE cold side zigzag channel angle on HX size and pressure drop ............ 78
4.5 Effect of PCHE core material on HX size and pressure drop........................................ 80
4.6 Effect of Reactor outlet temperature on HX size and pressure drop............................. 81
4.7 Effect of intermediate loop pressure on HX size and pressure drop ............................. 82
4.8 Effect of flow rate variation on HX heat duty and pressure drop ................................... 83
4.9 Effect of flow rate variation on outlet temperatures....................................................... 84
4.10 Results for nitrogen-helium mixture.............................................................................. 85
4.11 Temperature profiles for different inlet temperatures in nitrogen-helium mixture .......... 86
4.12 Effect of tube diameter on shell-and-tube IHX performance ......................................... 88
4.13 Effect of tube length on shell-and-tube IHX performance ............................................. 89
4.14 Effect of tube fins on shell-and-tube IHX performance ................................................. 90
4.15 Effect of tube inner surface fins on shell-and-tube IHX performance ............................ 91
4.16 Effect of tube outer Surface fins on shell-and-tube IHX performance ........................... 92
4.17 Effect of tube material on shell-and-tube IHX performance .......................................... 93
4.18 Effect of reactor outlet temperature on shell-and-tube IHX performance ...................... 94
4.19 Effect of intermediate loop pressure on shell-and-tube IHX performance..................... 95
4.20 Effect of flow rate variation on shell-and-tube IHX performance ................................... 96

11
4.21 Effect of flow rate variation on shell-and-tube outlet temperatures ............................... 97
5.1 Half of the cross-section of a repeating unit cell of the compact IHX ............................ 99
5.2 Temperature distribution in the compact IHX at the hot end......................................... 100
5.3 Temperature distribution in the compact IHX at the cold end ....................................... 100
5.4 Temperature distribution at an interior section (z=0.24 m) of the compact IHX ............ 101
5.5 Distribution of primary von Mises effective stress at either end of the compact IHX ..... 102
5.6 Distribution of von Mises effective stress due to thermal loading at the hot end of the 102IHX......................................................................................................................... 102
5.7 Distribution of von Mises effective stress due to thermal loading at the cold end of the IHX .............................................................................................................................. 103
5.8 Distribution of von Mises effective stress due to thermal loading at an interior section. 103
5.9 Variation of Sm and St of Alloy 617 with temperature and time ..................................... 104
5.10 Variation of von Mises effective stress along a path across the (a) hot channel-to-hot channel ligament and (b) hot channel-to-cold channel ligament at the hot end of the IHX. ............................................................................................................................. 105
5.11 Calculated Pm and PL + Pb values along paths across the (a) hot channel-to-hot channel ligament and (b) hot channel-to-cold channel ligament for the IHX plotted on the allowable stress intensities vs. temperature and time curves for Alloy 617............. 106
5.12 Variation of von Mises effective stress along a path on the diffusion joint and the primary membrane stress intensity Pm and the allowable stress intensities vs. temperature and time curves for Alloy 617................................................................... 106
5.13 Calculated Pm and PL + Pb values for the shell and tube IHX plotted on the allowable stress intensities vs. temperature and time curves for Alloy 617 .................................. 108
5.14 Variation of PL + Pb and Q along the length of the tube................................................ 108
5.15 Variation of X + Y and average T along the length of the tube...................................... 109
5.16 Comparison of yield and ultimate tensile strengths and creep rupture strengths of Alloys 617 and 230 ...................................................................................................... 110
6.1 Salt flow rate effect ...................................................................................................... 112
6.2 Effect of PCHE channel diameter on HX size and pressure drop for gas-to-salt case .. 113
6.3 Effect of PCHE hot side zigzag channel angle on HX size and pressure drop for gas-to-salt case .................................................................................................................. 114
6.4 Effect of PCHE cold side zigzag channel angle on HX size and pressure drop for gas-to-salt case ........................................................................................................... 115
6.5 Effect of PCHE core material on HX size and pressure drop for gas-to-salt case......... 116
6.6 Effect of reactor outlet temperature on HX size and pressure drop for gas-to-salt case............................................................................................................................. 117
6.7 Effect of intermediate loop pressure on HX size and pressure drop for gas-to-salt case............................................................................................................................. 118
6.8 Effect of flow rate variation on HX heat duty and pressure drop for gas-to-salt case .... 119

12
6.9 Effect of flow rate variation on outlet temperatures for gas-to-salt case........................ 120

13
Tables
3.1 Composition specification of candidate IHX materials ................................................. 22
3.2 Low-cycle fatigue behavior of as-received Alloy 617 in air .......................................... 30
3.3 Creep-fatigue response of as-received Alloy 617 in air ............................................... 31
3.4 Creep rupture data of Alloy 617 at 843 and 950ºC in different helium environments ... 38
3.5 Effect of thermal aging in air for 10,000 hr at different temperatures on the room temperature mechanical properties of Alloy 230 ......................................................... 49
3.6 Room temperature impact energy after exposure at different temperatures for 100 and 500 h.................................................................................................................... 49
3.7 Creep data for Alloy 800H at 750 and 843ºC .............................................................. 59
3.8 Gas chemistries used in various investigations ........................................................... 69
4.1 Gas-to-gas base case parameters .............................................................................. 74
4.2 Gas-to-gas base case results ..................................................................................... 75
4.3 Shell-and-tube IHX base case parameters and results ............................................... 87
4.4 Comparison of PCHE and shell-and-tube IHX design ................................................. 98
5.1 Summary of primary and secondary stresses in the IHX at three axial locations......... 107
6.1 Gas-to-salt base case ................................................................................................. 111

14

15
Preliminary Issues Associated with the Next Generation Nuclear Plant Intermediate
Heat Exchanger Design 1. Introduction
In the coming decades, the United States and the entire world will need energy supplies to meet the growing demands due to population increase and increase in consumption due to global industrialization. One of the reactor system concepts, the Very High Temperature Helium Cooled Reactor System (VHTR) has been identified as uniquely suited for producing hydrogen without consumption of fossil fuels or the emission of greenhouse gases [Generation IV 2002]. The U.S. Department of Energy (DOE) has selected this system for the Next Generation Nuclear Plant (NGNP) Project, to demonstrate emissions-free nuclear-assisted electricity and hydrogen production within the next 15 years.
The NGNP reference concepts are helium-cooled, graphite-moderated, thermal neutron spectrum reactors with a design goal outlet helium temperature of ≈1000°C [MacDonald et al. 2004]. The reactor core could be either a prismatic graphite block type core or a pebble bed core. The use of molten salt coolant, especially for the transfer of heat to hydrogen production, is also being considered. The NGNP is expected to produce both electricity and hydrogen. The process heat for hydrogen production will be transferred to the hydrogen plant through an intermediate heat exchanger (IHX).
The basic technology for the NGNP has been established in the former high temperature gas reactor (HTGR) and demonstration plants (DRAGON, Peach Bottom, AVR, Fort St. Vrain, and THTR). In addition, the technologies for the NGNP are being advanced in the Gas Turbine-Modular Helium Reactor (GT-MHR) project, and the South African state utility ESKOM-sponsored project to develop the Pebble Bed Modular Reactor (PBMR). Furthermore, the Japanese HTTR and Chinese HTR-10 test reactors are demonstrating the feasibility of some of the planned components and materials.
The proposed high operating temperatures in the VHTR place significant constraints on the choice of material selected for the IHX for both the PBMR and prismatic design. The main focus of this report is the IHX for both design concepts with emphasis on material selection, long term performance, and viability.
2. Intermediate Heat Exchanger Requirements
Several different potential plant design configurations for the NGNP with either direct or indirect power conversion cycles and integrated IHX designs were proposed and evaluated by Davis et al. [2005]. These configurations included IHX designs in parallel or in series with the NGNP power conversion system. In the serial designs, the total primary system flow from the reactor outlet passes through the IHX where approximately 50 MWt is transferred to the intermediate loop to drive the hydrogen production process. In these designs, heat is extracted from the primary fluid at the highest possible temperature (the reactor outlet temperature) for delivery to the hydrogen production process, while the power conversion system receives a slightly lower temperature fluid. In the parallel designs, the flow from the reactor outlet is split, with a small fraction of the flow (approximately 10%) going to the IHX to drive the hydrogen production process, while the majority of the flow is delivered to the power conversion system for

16
electrical power production. In these designs, both the hydrogen production process and the power conversion system receive the highest possible temperature fluid. Harvego [2006] has discussed the possible configurations for the design of IHX for NGNP and established the pros and cons of each configuration. Based on the design, he also established the flow rates, temperatures distribution through the loops, and other IHX requirements. Based on results from his study, we have selected 900°C reactor outlet temperature as the base case.
The purpose of the IHX in NGNP is to transfer the heat from the nuclear reactor to the hydrogen production facility. Due to safety concerns, the hydrogen production facility cannot be integrated into the nuclear power production plant and the heat generated in the reactor may need to be transported over significant distances to the hydrogen production plant [Lillo et al. 2005]. The IHX must be robust enough to effectively transfer the heat from the reactor outlet helium at 900-1000°C to the secondary system. The hydrogen production facility requires a minimum temperature of 800°C for the thermochemical production of hydrogen (e.g., Sulfur-Iodine cycle) and about 700°C for high temperature electrolysis of water [Independent Technology Review Group 2004]. Therefore, the components of the heat transport system will be subjected to elevated temperatures for long times where adequate and reliable performance of materials is critical. This report addresses several of the key issues related to material selection, performance, heat transfer characteristics, fabrication, long-term reliability, and technology gaps.
2.1 IHX Design Concepts
Three potential IHX design concepts, namely shell and tube, plate and fin, and compact heat exchangers, are possible for the transfer of heat from the primary helium to the secondary system. Compared to shell and tube heat exchangers, the compact HXs are characterized by a large heat transfer area per unit volume of the exchanger, resulting in reduced space, weight, support structure, and material cost.
The shell and tube exchanger is generally built of round tubes in a cylindrical shell with the tube axis parallel to that of the shell. One fluid flows inside the tubes and the other flows across and along the tubes. The major components of this exchanger are tubes, shell, front-end head, rear-end head, baffles, and tubesheets.
The pate-type heat exchangers are usually built of thin plates. The plates are either smooth or have some form of corrugation which could be either flat or wound in an exchanger. McDonald [1996] made a detailed review of the plate and fin heat exchanger requirements for process heat-modular helium reactor (PH-MHR) application. The review identifies several technical issues and the development of the IHX to be a formidable task. The plate type exchangers will not be considered further in the current assessment.
Compact heat exchangers or printed circuit heat exchangers, which can substantially reduce the size of the unit for a given thermal capacity, have the potential for application in NGNP system. Additional details on such exchangers will be discussed later in this report.
2.1.1 Gas-to-Gas Heat Exchanger
Model Description
The thermal hydraulic model has been developed to calculate heat transfer, temperature distribution, and pressure drop inside a heat exchanger (HX). The model is one dimensional, meaning that it is assumed that all channels on one side are identical and the calculations are

17
done for one hot channel and one cold channel. Thus, any edge effects, such as heat losses though HX outside surface, are ignored. The model also assumes that the flow inside the HX is counter-flow, i.e. any heat transfer in flow distribution regions is ignored. Also the model is for single-phase fluids only and it is assumed that there is no phase transition inside the HX.
The model takes into account the fluid properties variation along the channel length. The channel length is divided into a number of regions. Inside each region the fluid properties are assumed to be constant, but the properties vary from region to region. For each region the heat transfer equations are solved to calculate the temperature changes in the region for both fluids. Also, the pressure drop for each region is calculated. The heat transfer equations, as well as their solution are described elsewhere [Moisseytsev 2003].
The input data for the model include:
- Hot and cold side fluids, - Hot and cold side inlet conditions (temperature and pressure), - Hot and cold side flow rates, - Number of HX units and unit dimensions (length, height and width, or diameter), - HX-type specific information to describe the channel geometry (e.g., tube inner and outer
diameter, tube pitch, etc.), - HX (tube) material, - Heat transfer correlation to use, - Number of regions along the channel, and - Required accuracy of the calculation.
The output data (results) of the model are:
- Hot and cold sides outlet temperatures and pressures, - HX heat duty, and - Pressure and temperature distribution along the channel inside the heat exchanger.
2.1.1.1 Shell-and-Tube Heat Exchanger
Shell-and-tube heat exchanger is a HX consisting of number of tubes placed inside a volume (shell). Although there are several types of shell-and-tube heat exchangers, only a counter-flow straight-tube design is considered in this report.
The geometric parameters that are required to establish the HX geometry for the model include:
- Tube inner diameter and wall thickness, - Tube length, - Tube pitch and arrangement (triangular or square), - Shell inner diameter, and - Tube side fluid (hot or cold).
The model has a capability of taking into account the heat transfer surface enhancement by utilization of tube surface fins (Fig. 2.1). The effect of the fins on the heat transfer and how it is taken into account in the model is described elsewhere [Moisseytsev 2003]. If fins are used, their parameters (number of fins, length, and thickness) also need to be specified in the input data.

18
Figure 2.1. Possible tube configurations: a) bare tube, b) fins on outer surface, c) fins on inner surface, and d) fins on both surfaces.
The pressure drop is calculated as a frictional pressure drop along the tube surface only, i.e. pressure loss that is associated with flow distributors or collectors as well as friction along the shell surface are neglected.
2.1.1.2 Compact Heat Exchanger
Heat Exchanger Design
A compact heat exchanger is a heat exchanger (HX), which achieves volume reduction compared to conventional (e.g., shell-and-tube) heat exchanger through special design features. The most common design feature to achieve compactness has been small channel size. Among compact heat exchangers, the most advanced at present is a Printed Circuit Heat Exchanger (PCHE) developed by Heatric Division of Meggitt (UK) Ltd [Heatric 2006, Li et al. 2006]. PCHE consists of metal plates on the surface of which millimeter-size semicircular channels are chemically etched. Subsequently, the plates then are diffusion bonded together to fabricate a HX core (see Fig. 2.2). Flow distributors could be integrated into plates or could be welded outside the core depending on the design. Several PCHE concepts have been developed by Heatric and a platelet configuration, shown in Fig. 2.3, has been selected for present analysis since it has advantages of shortest flow distribution region compared to the counter-flow region. In this configuration, the flow distributors are integrated into the plates. Following a small flow distribution region, the flow is purely counter-flow.
The internal configuration of a PCHE is proprietary information of Heatric. Therefore, some parameters, such as channel diameter, can only be assumed and may not represent the actual PCHE configuration shown in Fig. 2.3. Each PCHE is a custom-built heat exchanger in that the PCHE technology allows variation of configuration parameters (channel diameter, plate thickness, channel angles, and so on) to fit the specified task. The current fabrication limits are 1.5 m x 0.6 m on plate dimension and 0.6 m on stack height.
PCHE Model Description
Figure 2.3 shows the PCHE configuration for the model. It demonstrates that the PCHE consists of plates stacked one hot plate for one cold plate. It also shows the assumed channel cross-section (semi-circular) as well as the computational cell. Figure 2.3 also shows that the calculations are done assuming counter-flow region, i.e. the heat transfer in the flow distribution regions is ignored. Although Fig. 2.3 shows the straight flow, the model actually allows for the zigzag channels with different zigzag angles on different sides as defined in Figure 2.4 to represent actual PCHE channel configuration (Fig. 2.2). Figure 2.4 also demonstrates the relationship between the channel length and the HX length.
a) b) c) d)

19
Figure 2.2. PCHE configuration for the model.
Figure 2.3. Heatric PCHE platelet design.
Hot channel
Cold channel Plate boundaries
Computational cell

20
Figure 2.4. Zigzag channel in PCHE.
The geometric input data for the PCHE model include:
- Number of HX units and unit outside dimensions (length, width, and height), - Length of header (flow distribution region) on each side (top and bottom of Fig. 2.3), - Pressure boundary thickness (regions without channels on left and right sides in Fig. 2.3), - Channel zigzag angle on each side, - Channel diameter (assumed the same on both sides), - Channel pitch-to-diameter ratio (assumed the same on both sides), and - Plate thickness-to-channel diameter ratio (assumed the same on both sides).
Since the calculations are done for the counter-flow (heat transfer) region only, the calculated pressure drop should be corrected to take into account flow distribution regions and headers. The pressure drop in flow distribution region depends on the region internal configuration, which is unknown. Still, in order to account for pressure losses outside the heat transfer region, some value for the ratio of the pressure drop in the heat transfer region to the total HX pressure drop is assumed in the model. This ratio is also the input to the model.
The heat transfer and pressure drop correlations used in the current PCHE model are different from those reported earlier [Moisseytsev 2003]. The new correlations were obtained by validating the PCHE model against the test data from PCHE tests performed at Argonne National Laboratory (ANL). According to the PCHE purchase agreement, any information obtained in the tests should be approved by Heatric for public release. The heat transfer and pressure drop correlations are considered by Heatric as commercial information; the correlations are now pending permission from Heatric for release.
α
α/2
λ
l ( )2cos
1
2
2
!""===
ll
L
L
HT
channel

21
3. Materials of Construction
The IHX of the NGNP is required to withstand high temperatures (850-950ºC) for long-life without mechanical property degradation and to resist corrosion/oxidation and erosion from a fast flowing impure helium coolant. The primary materials that can withstand such high temperatures are nickel-based superalloys. Four metallic materials have been identified as candidate materials for the construction of the NGNP IHX. These include UNS 06617 (Alloy 617), UNS 06230 (Alloy 230), UNS 08810 (Alloy 800H), and UNS 06002 (Hastelloy X). The elemental composition of these alloys is given in Table 3.1 [ASME Code 2004]. Different ASME specifications (SB-564 for forgings, etc) exist for these materials based on the product form but all of them have the same composition specification. Ceramic materials, in general, have superior high temperature strength than metals; but, their inherent brittleness makes machining and fabrication of ceramic HXs a challenge. Also, there is limited experience manufacturing heavy duty, elevated temperature heat exchangers that are anticipated for the NGNP. These factors have ruled out ceramic heat exchangers as candidates.
Table 3.1. Composition (wt.%) specification of candidate IHX materials [ASME Code 2004] Material/Common Name
UNS 06617 (Alloy 617)
UNS 06230 (Alloy 230)
UNS 08810 (Alloy 800H)
UNS 06002 (Hastelloy X)
Nominal Composition
52Ni-22Cr-13Co-9Mo
57Ni-22Cr-14W-2Mo-La 33Ni-42Fe-21Cr
47Ni-22Cr-9Mo-18Fe
Element C 0.05-0.15 0.05-0.15 0.05-0.1 0.05-0.15 Cr 20.0-24.0 20.0-24.0 19.0-23.0 20.5-23.0 Ni 44.5 min. Balance 30.0-35.0 Balance Mn 1.0 max. 0.3-1.0 1.5 1.0 max. Mo 8.0-10.0 1.0-3.0 - 8.0-10.0 max. Al 0.8-1.5 0.2-0.5 0.15-0.6 - Ti 0.6 max. - 0.15-0.6 - Fe 3.0 max. 3.0 max. 39.5 min. 17.0-22.0 Si 1.0 max. 0.25-0.75 1.0 max. 1.0 max. P, max. 0.030 0.030 - 0.040 S, max. 0.015 0.015 0.015 0.030
Others
Co: 10.0-15.0, B: 0.006 max., Cu: 0.5 max.
W: 13.0-15.0, Co:5.0 max., B: 0.015 max., La: 0.005-0.050 Cu: 0.75
Co: 0.5-2.5, W: 0.2-1.0
Heat treatment Solution annealed Solution annealed Solution annealed Solution annealed
3.1 Metallic Alloys
This subsection will present elevated temperature mechanical properties of the four candidate materials in air as well as in helium environments. The data presented in this Section are mainly obtained from a previous report on High Temperature Gas-cooled Reactors [Natesan et al. 2003], which reviewed data from the U.S., European, and Japanese programs obtained during the late 1970s and early 1980s. Furthermore, any available data from the current Gen IV/VHTR program are also presented.
3.1.1 Alloy 617 (UNS N06617)
Alloy 617 is an austenitic alloy based on nickel-chromium with further alloying additions of cobalt, molybdenum, and aluminum. The alloy has exceptional creep strength at temperatures

22
above 870°C, enhanced by solution strengthening from molybdenum and cobalt additions. It has good cyclic oxidation and carburization resistance, imparted by the chromium and aluminum additions. The alloy retains toughness after long-time exposure at elevated temperatures and it does not form embrittling phases such as, sigma, mu, chi, or Laves. It has good weldability and lower thermal expansion than most austenitic stainless steels. As a result, the alloy has been extensively studied for application at elevated temperatures in HTGRs, and is the primary candidate for construction of the IHX for the NGNP.
Extensive studies on mechanical properties were conducted at ORNL [McCoy 1985, Strizak, 1982], GE [Baldwin 1986], and Huntington Alloys specifically aimed at HTGRs. The Aerospace Structural Metals Handbook [1994] also gives a compilation of mechanical properties of Alloy 617. Figure 3.1 shows the variation of yield and ultimate tensile strengths with temperature of as-received Alloy 617 [McCoy and King 1985]. A complete summary of these results is given elsewhere [Ren and Swindeman 2005]. Figure 3.2 gives the tensile behavior from the French VHTR program conducted under the current Gen IV program [Burlet et al. 2005]. As shown in Fig. 3.2a, the yield strength of Alloy 617 typically drops from room temperature up to about 400ºC, roughly stays constant between 400-800ºC, beyond which it decreases again. The reason for the increase in yield strength from 600 to 750ºC as seen in Fig. 3.1 is not established.
0
200
400
600
800
1000
0 200 400 600 800 1000
Yield streth
Ultimate tensile strength
Yie
ld o
r U
ltim
ate
te
nsile
str
en
gth
(M
Pa
)
Temperature (°C)
Figure 3.1. Mechanical properties of as-received Alloy 617 from past HTGR program conducted at ORNL [McCoy 1985].
0
100
200
300
400
500
0 200 400 600 800 1000
617
230
Yie
ld s
tre
ss (
MP
a)
Temperatue (°C)
0
200
400
600
800
1000
0 200 400 600 800 1000
617
230
Ultim
ate
te
nsile
str
en
gth
(M
Pa
)
Temperature (°C) Figure 3.2. Mechanical properties of as-received Alloys 617 and 230 from the French VHTR program (a) Yield Stress vs. Temperature and (b) UTS vs. Temperature [Burlet et al. 2005].

23
3.1.1.1 Creep Behavior in Air
Several studies have been conducted to evaluate the creep and rupture properties of Alloy 617 at temperatures >650°C [McCoy and King 1985, Baldwin 1986, Schubert et al. 1984, Tanabe et al. 1984, Cook 1984, Schneider et al. 1984, Osthoff et al. 1984]. A database has been developed for the alloy that includes (1) creep properties such as time for 1% strain and time to rupture, (2) correlation between secondary creep rate and applied stress, and (3) correlations using the Larson-Miller parameter to depict time for 1% creep strain and rupture as functions of test time and temperature. Data have been generated up to test times of 40,000 h and in multiple heats of the alloy. Figure 3.3 shows the creep behavior for different heats of Alloy 617 from the previous US HTGR programs [McCoy and King 1985, Baldwin 1986]. It is evident that there is heat-to-heat variation of the creep behavior that signifies the importance of composition control. The grain size of Heat A is ≈130 µm and that of Heat B is ≈210 µm but, surprisingly the creep strength of Heat A is better as seen in Fig. 3.3. Reason for this is not established. In Baldwin’s [1986] work, the grain size of the two heats, Heat 1 and Heat 4 are unknown but from the figure it appears that Heat 1 is coarser than Heat 4. As will be seen in a later section, varied creep behavior for different heats was also observed in helium environments. The impurities in helium in the ORNL work [McCoy and King 1985] were 337 ppm H2, 32 ppm CH4, 19 ppm CO, 2 ppm H2O, and <0.5 ppm N2. Oxygen was removed by reaction with H2 as the gas passed through a furnace at 500ºC. In the GE study [Baldwin 1986], the impurities were 400±75 ppm H2, 2±0.75 H20, 40±7.5 CO, 0.2±0.05 CO2, 20±7.5 CH4, and 6±3 N2. However, it should be mentioned that the helium concentration varied considerably between the inlet and the outlet of the test chamber. Also, the total pressure of the test chamber was ≈2 atm.
10
100
100
101
102
103
104
Air, 850°C, Heat 1 (Baldwin)
Air, 850°C, Heat 4 (Baldwin)
Air, 950°C, Heat 1 (Baldwin)
Air, 950°C, Heat 4 (Baldwin)
Str
ess (
MP
a)
Time to 1% strain (h)
101
102
100
101
102
103
104
105
Air, 850°C, Heat 1 (Baldwin)Air, 850°C, Heat 4 (Baldwin)Air, 950°C, Heat 1 (Baldwin)Air, 950°C, Heat 4 (Baldwin)Air, 871°C, Heat A (McCoy and King)Air, 871°C, Heat B (McCoy and King)
Str
ess (
MP
a)
Rupture life (h)
Figure 3.3. Heat-to-heat variation of creep behavior of Alloy 617 from past US HTGR programs (a) stress vs. time to 1% strain (b) stress vs. rupture life. [McCoy and King 1985, Baldwin 1986]. Grain sizes of Heats A and B were 130 and 210 µm, respectively.
To address the issue of heat-to-heat variation, ORNL has performed microstructural and mechanical characterization of CCA 617 alloy, which is a controlled chemistry version of standard Alloy 617 [Shingledecker et al. 2005]. The study so far suggests that CCA 617 has better creep strength up to about 750ºC but above 750ºC, the creep strength of CCA 617 and standard 617 are anticipated to be similar. The increase in creep strength is believed to be due to γ′

24
precipitation until 750ºC and re-solution of the same in the matrix beyond that temperature. Based on existing knowledge of creep data of standard Alloy 617 and CCA 617, ORNL is developing another composition of Alloy 617 termed GenIV617 specifically aimed for Gen IV VHTR applications. The elemental composition of GenIV617 is within the limits of ASTM/ASME specification for standard Alloy 617. In addition, GenIV617 is slated to contain small amounts of P and N. There is no mechanical property or microstructural results available on this GenIV617 composition as of this report date. The development of GenIV617 is in its early stages and the composition is still evolving. Details on this on-going research on the composition-refined alloy, GenIV617, can be found elsewhere [Ren and Swindeman 2005/504].
Creep results from the previous German program on HTGRs are shown in Figs. 3.4-3.8. Figure 3.4 shows the experimental data on 1% creep strain as a function of applied stress at temperatures between 800 and 1000°C. Figure 3.5 shows similar data for rupture time at several temperatures. Figure 3.6 shows a plot that relates the secondary creep rate to the applied stress at several temperatures. Figures 3.7 and 3.8 show correlations using the Larson-Miller parameter to depict time for 1% creep strain and rupture as functions of test time and temperature.
10
100
100
101
102
103
104
105
Str
ess (
MP
a)
Time to 1% strain (h)
800°C
900°C
1000*C
10
100
100
101
102
103
104
105
Str
ess (
MP
a)
Time to 1% strain (h)
850°C
950°C
Figure 3.4. Applied stress versus time-to-1% strain from creep of Alloy 617 at several temperatures [Schubert et al. 1984].
10
100
100
101
102
103
104
105
Str
ess (
MP
a)
Time to rupture (h)
800°C
900°C
1000°C
10
100
100
101
102
103
104
105
Str
ess (
MP
a)
Time to rupture (h)
850°C
950°C
Figure 3.5. Applied stress versus time-to-rupture from creep of Alloy 617 at several temperatures [Schubert et al. 1984].

25
10
100
10-7
10-6
10-5
10-4
10-3
10-2
10-1
Str
ess
(M
Pa
)
Secondary creep rate (h-1
)
800°C
850°C 900°C
950°C
1000°C
Figure 3.6. Applied stress versus secondary creep rate for Alloy 617 at several temperatures [Schubert et al. 1984].
100
101
102
103
1.5 104
2 104
2.5 104
Str
ess for
1%
cre
ep s
train
(M
Pa)
PLM
= T(15.9 + log t)
100
101
102
103
1.4 104
1.6 104
1.8 104
2 104
2.2 104
2.4 104
2.6 104
Ru
ptu
re s
tre
ss (
MP
a)
PLM
= T(14.6 + log t)
Figure 3.7. Larson-Miller parameter versus stress for 1% strain for Alloy 617 [Schubert et al. 1984].
Figure 3.8. Larson-Miller parameter versus rupture stress for Alloy 617 [Schubert et al. 1984].
In addition to the past HTGR U.S. and German programs, the current Generation IV partners have conducted creep tests on Alloy 617. Figure 3.9 shows the creep rupture behavior of candidate heat exchanger materials in air environment from the Korean program on high temperature materials [Ryu 2005]. As evident in the figure, Alloys 617 and 230 have the best creep rupture behavior followed by Hastelloy X and then 800H. No information on grain size was available.

26
0
10
20
30
40
50
60
70
80
100
101
102
103
104
105
Str
ess (
MP
a)
Time to rupture (h)
Alloy 230
Hastelloy X
Alloy 617
Alloy 800H
Temperature 982°C
Figure 3.9. Creep rupture strength of Alloys 617, 230, 800H, and Hastelloy X [Ryu 2005].
3.1.1.2 Fatigue Behavior in Air
Low-cycle fatigue, thermal-fatigue, creep-fatigue, and crack-growth rate tests on Alloy 617 have been conducted by several researchers to establish the susceptibility of the alloy to cyclic loading and also to evaluate the role of surface interactions of coolant on the fatigue crack initiation and propagation [Strizak et al. 1982, Meurer et al. 1984, Hsu 1991]. Figure 3.10 shows the fatigue behavior of Alloy 617 and several conventional materials at 538°C [Strizak et al. 1982]. Figure 3.11 shows the low-cycle fatigue results in air environment [McGreevy et al. 2005]. As seen in the figure, results from both studies are comparable. Figure 3.12 shows the low-cycle fatigue behavior of Alloy 617 at 760, 871 and 982ºC [Srivastava and Klarstrom 1990]. As expected, the fatigue life decreases at higher temperatures. Furthermore, the figure indicates that up to ≈104 cycles, the fatigue life decreases sharply with increasing temperature. At higher cyclic strain ranges (and lower lives), failure predominantly occurs by mechanical loading whereas at lower cyclic stress ranges (and higher lives), the effects of material microstructure and environment on failure mechanisms and resulting fatigue life are significant.
10-2
10-1
100
101
102
103
104
105
106
107
108
Tota
l str
ain
range (
%)
Cycles to failure
2.25Cr-1M0 steel (annealed)
AISI 1010 steel
Alloy 617
304 stainless steelAlloy 718
Alloy 800
Hastelloy X
Strain rate 4 x 10⁻³
s-1
Figure 3.10. Comparison of fatigue behavior of Alloy 617 and several conventional materials at 538°C. Lines represent best fit of experimental data [Strizak et al. 1982].

27
0.1
1
102
103
104
105
Meurer 1980
ORNL 2005
Str
ain
range (
%)
Cycles to failure
Figure 3.11. Low-cycle fatigue results of Alloy 617 at 950ºC in air from present and past studies [McGreevy et al. 2005].
0
0.2
0.4
0.6
0.8
1
103
104
105
R = -1, f = 0.33 Hz (20 cycles/min)
760ºC
871ºC
982ºC
Tota
l str
ain
range, %
Cycles to failure, Nf
Fig. 3.12. Low-cycle fatigue behavior of Alloy 617 in air environment [Srivastava and Klarstom, 1990].
Meyer-Olbersleben [1999] evaluated the thermal-fatigue behavior of Alloys 617 and 230 in air using flat single-wedge plate specimens at maximum cycle temperatures 850-1050ºC, by using high frequency induction heating techniques. Thermal cycling was performed between 200ºC and a maximum cycle temperature. A thermal fatigue cycle included heating at constant energy input for 60 s up to the maximum cycle temperature followed by cooling at constant air pressure during 20 s to 200ºC without hold time. Figure 3.13 shows the effect of maximum cycle temperature on the number of cycles to crack initiation, which was defined as the time to initiate a 0.3-mm crack on the specimen surface. Figure 3.14 shows the number of cycles to crack initiation at two different frequencies, and also the variation of crack length with continued thermal cycling. As evident in the figure, at higher frequency, the time to crack initiation is higher because higher thermal gradients are induced at the wedge tip compared to the lower frequency thermal cycling. Figure 3.15 shows the crack initiation life versus mechanical strain range, which was calculated by subtracting thermal strain range from the total strain range. The total strain was measured over the gage length of the specimen using an extensometer. Thermal strain was calculated analytically (thermal strain =αΔT), where α, the coefficient of thermal expansion was measured using dilatometry.

28
800
850
900
950
1000
1050
1100
1,000 10,000
230, 3 MHz230, 200 kHz617, 3 MHz617, 200kHz
Maxi
mum
cyc
le tem
pera
ture
(°C
)
Number of thermal cycles to crack initiation
617
230
Figure 3.13. Crack initiation life as a function of thermal cycling temperature.
0
1
2
3
4
5
6
7
0 5,000 10,000 15,000
Cra
ck le
ng
th (
mm
)
Number of thermal cycles
Temperature 950°C
617 230
(a)
0
0.5
1
1.5
2
2.5
3
0 500 1000 1500 2000 2500 3000
Cra
ck length
(m
m)
Number of thermal cycles
617
230
(b)
Figure 3.14 Effect of frequency on thermal fatigue behavior of Alloys 617 and 230 in air.
0.2
0.25
0.3
0.35
0.4
0.45
0.5
0.55
0.6
103
104
230, 3MHz
230, 200 kHz
617, 3MHz
617, 200 kHz
Me
ch
an
ica
l str
ain
ra
ng
e (
%)
Number of thermal cycles
Figure 3.15. Thermal fatigue behavior of Alloys 617 and 230 as a function of the mechanical strain range.

29
Creep-fatigue of candidate heat exchanger materials is the most important property (due to possible vibration and substantial amount welded or diffusion-bonded joints) that needs to be properly addressed in designing NGNP. The complex interaction of creep and fatigue combined with high temperature oxidation/corrosion makes creep-fatigue characterization very complicated. The effect of creep and environment on the fatigue life is illustrated in Fig. 3.16, which schematically shows the dependence of fatigue rate on the fatigue life at different plastic+creep strain ranges (Δεp). The trend lines shown are only for illustrative purposes and do not represent any particular material. At very high frequencies, the effect of creep and environment is negligible and the fatigue life is independent on fatigue rate. As the cyclic rate decreases, both creep and environmental effects become significant, thereby reducing the overall fatigue life as indicated in the figure. Furthermore, at a given cyclic rate, the fatigue life reduces with increasing strain range.
101
102
103
104
10-3
10-2
10-1
100
101
102
103
104
Cyc
les
to fa
ilure
Frequency (cpm)
Material and environment
sensitive regime
Time independent regime
Environment sensitive regime
Figure 3.16. Illustrative rate dependence of creep-fatigue strength at elevated temperatures [O’Donnell 2005].
Table 3.2 shows the low-cycle fatigue behavior of 617 in air environment at 950ºC [Baldwin 1986] and Table 3.3 shows the creep-fatigue behavior of the same heat of alloy. Comparison of the two tables clearly indicates that even a 2 minute hold time significantly reduces the fatigue life N5, which is the number of cycles for a 5% decrease in the stress range below the saturation value. N5 at 0.3% strain range and 0.05 strain rate was 6690 and 9990 as seen in Table 3.2, whereas with only a 2 minute tensile hold, N5 reduced to 3100 cycles as seen in Table 3.3. Furthermore, Table 3.3 indicates that for the same strain range and strain rate, a 20 minute hold time is more detrimental than a 2 minute hold time.
Table 3.2. Low-cycle fatigue data for as-received Alloy 617 in air [Baldwin 1986]
Temperature (°C) Strain range (%) Strain rate (s-1) Lifea (N5) Stress rangeb (MPa) 950 1.0 0.4 590 441
0.6 0.2 1300 424 0.4 0.1 2820 412 0.3 0.04 22190 377 0.3 0.05 9990 365 0.3 0.05 6690 372 0.25 0.05 19000 368
aN5 is the number of cycles to a 5% decrease in the stress range below the saturation value. bReported values are at approximately N5/2.

30
Table 3.3. Creep-fatigue response of as-received Alloy 617 at 950°C in air [Baldwin 1986]
Tensile hold time (min) Strain range (%) Strain rate (s-1) Lifea (N5) Stress rangeb (MPa)
2 1.0 0.05 420 352 0.6 0.1 850 372 0.4 0.08 2000 374 0.3 0.05 3100 352
20 1.0 0.05 360 316 0.6 0.1 610 363 0.4 0.05 1750 314
aN5 is the number of cycles to a 5% decrease in the stress range below the saturation value. bReported values are at approximately N5/2.
Preliminary creep-fatigue evaluation of Alloy 617 in air from the current NGNP program is shown in Fig. 3.17, which indicates the effect of tensile hold time on fatigue life [Williamson and Wright 2005]. Tests were conducted at 1000ºC with a loading/unloading rate of 1x10⁻³/s at total strain ranges of 0.3 and 1%. It is evident from the figure that a tensile hold time of just one minute drops the fatigue life significantly at both the applied strain ranges. At 1% strain range, the effect of hold time on fatigue life appears to saturate. Furthermore, the fatigue life at 1% strain range is an order of magnitude lower than the life at 0.3% at all hold times. Also, it is evident that the crack propagation life at 0.3% strain range is higher than at 1%.
102
103
104
105
0 5 10 15 20 25 30
Failure - 1%Initiation - 1%Failure - 0.3%Initiaation - 0.3%
Cyc
les
Tensile hold time (min)
Figure 3.17. Creep-fatigue response of Alloy 617 in air at 1000ºC [Williamson and Wright 2005].
3.1.1.3 Influence of Helium Environment on Creep Properties
Several studies have been conducted in the past HTGR programs to evaluate the mechanical properties of candidate alloys for structural applications and for power conversion systems. The mechanical properties evaluated in these studies include creep, creep rupture, low- and high-cycle fatigue, creep fatigue, and fracture toughness. Mechanical tests were conducted in a helium environment that contained impurities such as H2, H2O, CH4, CO, and CO2. The impurity levels were selected to simulate helium environments that contained sufficiently high H2O

31
(typical of steam-cycle-based HTGRs) so that the alloys predominantly developed oxide scales on the surface during mechanical testing.
The creep curves of Alloy 617, especially at elevated temperatures of interest in HTGRs, show a monotonically increasing creep rate from the start of the test and virtually no secondary creep region (see Figure 3.18). This behavior is different from that of austenitic stainless steel, which distinctly shows primary, secondary, and tertiary creep regimes. Therefore, the creep data for Alloy 617 rarely include strain and time for onset-of-tertiary creep. At elevated temperatures, the creep properties of interest are the minimum stress for 1% creep strain and the rupture strength [Schubert et al. 1983].
-5
0
5
10
15
20
25
30
35
0 5,000 10,000 15,000 20,000
Str
ain
(%
)
Time (h)
34 MPa23 MPa
16 MPa
14 MPa
Figure 3.18. Creep curves for Alloy 617 at 950°C in a helium environment [Schubert et al. 1983].
In addition, the creep behavior of the alloy seems sensitive to factors other than composition, as evidenced by the test data generated on three heats of the alloy (with nominally the same composition) in a helium environment (see Fig. 3.19). As much as a factor of ten increase in rupture life was observed for a given applied stress for different heats of the alloy [Ennis et al. 1984].
0
2
4
6
8
10
12
0 5,000 10,000 15,000 20,000 25,000 30,000
Str
ain
(%
)
Time (h)
Air, 15 MPa
Air, 17 MPa
He, 16 MPa
He, 13.5 MPa
Heat 1
Heat 1
Heat 2
Heat 3
Figure 3.19. Heat-to-heat variation in the creep behavior of Alloy 617 in helium [Ennis et al. 1984].
Figure 3.20 shows the variation in creep rupture time with applied stress for Alloy 617 in air and in helium at several temperatures, compiled by Ennis et al. [1984]. The helium used in these experiments had a nominal impurity content (in Pa) of H2:CO:CH4:H2O in the ratio of 50:5:5:0.15,

32
except for those at 1000°C, in which the environment was decarburizing to the alloy. The few data points obtained at 1000°C under decarburizing conditions show a significant decrease in rupture life when compared with the data developed in air. Figure 3.21 shows data from another study conducted in helium that was decarburizing to Alloy 617 at 950°C [Huchtemann 1989]. The impurity levels in helium in this experiment was (in Pa) H2:CO:CH4:H2O:N2 in the ratio of 50:1.5:2:0.015:0.5. The data show a significant decrease in creep life in helium when compared with that in air, for a given applied stress. Detailed examination of the tested creep specimens
100
101
102
103
100
101
102
103
104
105
Str
ess (
MP
a)
Timw to rupture (h)
Open symbols: in air
Closed symbols: in helium
800°C
900°C
1000°C
101
102
103
100
101
102
103
104
105
Str
ess (
MP
a)
Timw to rupture (h)
Open symbols: in air
Closed symbols: in helium
850°C
950°C
Figure 3.20. Variation in creep rupture time as a function of applied stress for Alloy 617 in air and helium at several temperatures [Ennis et al. 1984].
10
20
30
40
50
60
7080
102
103
104
Str
ess
(M
Pa)
Rupture life (h)
Air
Impurehelium
Figure 3.21. Variation in creep rupture time as a function of applied stress for Alloy 617 at 950°C in air and in helium of low steam content [Huchtemann 1989].
showed that Alloy 617 did not develop a protective oxide scale but exhibited significant internal oxidation of aluminum in the alloy accompanied by carbon loss. Note that the helium environment in the gas-turbine-based systems will be closer to the latter environment than those used in the study of either the steam-cycle system or the process nuclear plant.
Figure 3.22 shows the stress dependence of time to accumulate 1% strain and of time to rupture for Alloy 617 tested at 800 to 1000°C in air and in helium with “nominal” impurity levels [Schubert et al. 1983]. The data, developed up to ≈20,000 h, indicate that the chemistry of the helium environment used had no significant effect on both the 1% strain and creep rupture properties, although the data set exhibits significant scatter.

33
Figure 3.22. Time-to-1% strain and time-to-rupture as a function of applied stress for Alloy 617 in air and in HTGR helium [Schubert et al. 1983].
One of the interesting creep properties to compare is the rupture ductility for Alloy 617 that has been tested in air and in helium. Figure 3.23 shows a plot of elongation at rupture from creep tests as a function of test time and temperature, obtained in two studies [Schubert et al. 1983, Cook 1984]. The data indicate that the alloy had much lower ductility in helium compared to that obtained in air. Reason for these differences can be seen from the creep curves and microstructures in Fig. 3.24, where air testing apparently induced surface cracks early in the test, leading to higher initial creep rates [Cook 1984]. In helium, the shape of the creep curve indicated nucleation of surface cracks to be more difficult and virtual absence of “tertiary” creep. Rupture was reported without development of a large number of creep cracks in the helium environment. The apparent improvement of ductility in air was attributed to a combination of oxidation and crack growth.
0
20
40
60
80
100
120
100
101
102
103
104
105
Cre
ep
ru
ptu
re e
lon
ga
tio
n (
%)
Time (h)
Alloy 617, 950°COpen symbols: in airClosed symbols: in helium
(a)
(b)
Figure 3.23. Creep-rupture ductility of Alloy 617 in air and in helium: (a) Schubert et al. 1983 and (b) Cook 1984.

34
0
5
10
15
20
25
30
0 1000 2000 3000 4000 5000
Str
ain
(%
)
Time (h)
950°C, 23 MPa
Air
Helium
Figure 3.24, Examples of creep curves and cracking behavior for Alloy 617 tested in air and in helium at 950°C [Cook 1984].
Creep results from the past U.S. HTGR program on the effect of helium environment on the time to accumulate1% strain and on rupture life of Alloy 617 are shown in Fig. 3.25. Figure 3.25b shows no difference in rupture life in air and He environments [McCoy and King 1985] whereas the GE results [Baldwin 1986] indicate a mixed trend at different temperatures. At 850ºC, there was no difference in the rupture life in He and in air. However, at 950ºC, the life in air was lower than in helium at higher stresses but was similar to helium at lower stresses [Baldwin 1986]. This varying creep behavior may be partly attributed to the lack of chemistry control of the helium environment in the test chamber. Furthermore, heat-to-heat variation in creep rupture life was also observed in helium environments.
10
100
100
101
102
103
104
Air, 800°C, Heat 1 (Baldwin)
Air, 850°C, Heat 1 (Baldwin)
Air, 871°C, Heat A (McCoy)
He, 871°C, Heat A (McCoy)
Air, 950°C, Heat 1 (Baldwin)
Air, 950°C, Heat 1 (Baldwin)
Str
ess (
MP
a)
Time to 1% strain (h) (a)
10
100
102
103
104
105
Air, 850°C, Heat 1 (Baldwin)He, 850°C, Heat 1 (Baldwin)Air, 950°C, Heat 1 (Baldwin)He, 950°C, Heat 1 (Baldwin)Air, 871°C, Heat A (McCoy)He, 871°C, Heat A (McCoy)
Str
ess (
MP
a)
Rupture life (h) (b)
Figure 3.25. Effect of helium environment on the creep behavior of Alloy 617 from past US HTGR programs (a) time to 1% strain (b) rupture life [Baldwin 1986 and McCoy and King 1985].
Recently, ANL has been conducting creep tests on Alloy 617 in pure and impure helium at 843 and 950ºC [Shankar and Natesan 2006]. The composition of pure helium was He-99.999%, O2 <1 ppm, H2O <2 ppm, and total hydrocarbons <1 ppm. Figure 3.26 shows the creep behavior of the alloy in pure helium at 843 and 950ºC at different applied stresses. Figure 3.27 shows the

35
0
30
60
90
120
0 350 700 1050 1400 1750
Cre
ep s
train
(%
)
Elapsed Time (h)
68.9 MPa
Alloy 617Temperature 843°C (1550°F)Pure He environment
82.7 MPa
55.2 MPa
(a)
0
30
60
90
120
0 300 600 900 1200 1500
Cre
ep
str
ain
(%
)
Elapsed Time (h)
68.9 MPa
Alloy 617Temperature 950°C (1742°F)Pure He environment
55.2 MPa
27.6 MPa
(b)
Figure 3.26. Creep behavior of Alloy 617 at 843 and 950ºC in a pure helium environment. (a) 843ºC (b) 950ºC [Shankar and Natesan 2006].
10
100
102
103
104
105
ANL (Shankar and Natesan)CookEnnis et al.BaldwinHuchtemannMcCoySchubert et al.
Ap
plie
d s
tre
ss (
MP
a)
Rupture life (h)
Region I: 843-871°C
Region II: 950°C
Figure 3.27. Creep rupture life of Alloy 617 in helium environments from past work and from present ANL study.
rupture life variation with applied stress observed in the ANL and other studies. The rupture lives in the ANL study appear to be of the same order of magnitude as those obtained in the German studies. The figure also indicates that the GE data has much higher rupture lives at lower applied stresses at both temperature ranges. The lack of chemistry control of helium environment could be a reason for the variation in rupture lives observed in the GE study. The figure also indicates that at 950ºC, the rupture life observed by Huchtemann [1989] was lower compared to the other data. They attributed this decrease to the formation of a decarburized zone and lack of a protective oxide layer on the surface.
ANL has also conducted creep tests in helium environments containing controlled amount of impurities, specifically, in helium with 675 vppm methane (He+CH4) and in helium with 500 ppm O2 (He+O2) environments [Shankar and Natesan 2006, Shankar et al. 2006]. Figure 3.28 shows the effect of methane and oxygen impurities in helium on the creep behavior of Alloy 617 at 843 and 950ºC. It is clearly evident from the figure that the rupture life is longest in the He+CH4 environment and shortest in the He+O2 environment. The reduction in life in the He+O2 environment and increase in life in the He+CH4 environment are very significant at 950ºC than at 843ºC. Hosoi and Abe [1975] also observed a reduction in rupture life in an environment containing helium with 500 ppm O2 compared to pure helium (99.995% purity) at 1000ºC.

36
0
20
40
60
80
0 225 450 675 900 1125
Cre
ep s
train
(%
)
Elapsed Time (h)
Pure He
Alloy 617Temperature 843°C (1550°F)Stress 68.95 MPa (10 ksi)
He with 500 vppm O2
He with 675 vppm CH4
(a)
0
30
60
90
120
0 1000 2000 3000 4000 5000 6000 7000
Cre
ep s
train
(%
)
Elapsed Time (h)
Alloy 617
Temperature 950°C (1782ºF)Stress 27.6 MPa (4ksi)
He with 675 vppm CH4
Pure He
He with500 vppm O2
(b)
Figure 3.28. Effect of methane and oxygen impurities on the creep behavior of Alloy 617 (a) 843ºC (b) 950ºC [Shankar et al. 2006, Shankar and Natesan 2006]. They attributed this reduction (more than 50%) to the occurrence of a decarburized zone ≈1 mm from the surface. They also observed maximum reduction in life at 500 ppm O2; at higher and lower O2 levels the rupture life increased but was still lower than those observed in pure helium. The longer life in He+CH4 environment is accompanied by a significant decrease in rupture strain when compared to the rupture strains observed in He and in He+O2. Figure 3.29 shows the variation of rupture strain versus applied stress in all three environments [Shankar and Natesan 2006]. The data clearly show a degrading effect of methane on rupture strain at both test temperatures. A decrease in rupture elongation in pure helium environment when compared to in air has been observed as shown earlier in Fig. 3.23.
20
40
60
80
100
120
140
20 30 40 50 60 70 80 90 100
He, 843°CHe+CH
4, 843°C
He+O2, 843°C
He, 950°CHe+CH
4, 950°C
He+O2, 950°C
Ruptu
re s
train
(%
)
Applied stress (MPa)
Figure 3.29. Variation of rupture strain with applied stress in different helium environments [Shankar and Natesan 2006].
Table 3.4 presents the complete creep data for Alloy 617 at 843 and 950ºC in He, He+CH4, and He+O2 environments obtained from the ANL study [Shankar and Natesan 2006]. At 950ºC and 27.6 MPa in He+CH4, the specimen had accumulated >6500 h and the creep curve seemed to indicate sufficient ductility (≈40%) during the test period. However, upon termination of the test and cooling the specimen to room temperature, the specimen fractured (literally split into two pieces) indicating brittle behavior of the alloy due to exposure.

37
Figure 3.30 shows a low magnification micrograph of the aforementioned specimen indicating a blocky intergranular brittle failure. Detailed fractographic evaluation was performed to identify the fracture modes in pure helium and in helium containing impurity species. The fracture mode was ductile in both pure helium and He+O2 environments. However, in He+CH4 environment, at higher stresses, a ductile fracture was observed whereas at lower stresses a brittle fracture was observed. Figure 3.31 shows a higher magnification image of the Fig. 3.30 illustrating cleavage fracture morphology. Figure 3.32 shows the longitudinal section of the fracture surface of the specimen shown in Fig. 3.31 that was creep tested in He+CH4 environment. The dark phase in the figure was identified as (Fe,Cr)23C6 carbides rich in chromium and the lighter phase was an intermetallic compound of chromium and molybdenum. The figure shows a network of coarse Cr23C6 carbides with clear indication of preferential crack propagation along the carbide phase. The Cr-Mo intermetallic phase may also crack with exposure time due to its inherent brittleness. The alloy’s propensity to crack along the carbide and/or intermetallic phase may, under creep-fatigue operating conditions in a VHTR, lead to rapid crack initiation and propagation, which could severely decrease the operating life of components made of this alloy.
Table 3.4. Creep data of Alloy 617 at 843 and 950ºC in different helium environments [Shankar and Natesan 2006]
Environment Temperature (ºC)
Applied Stress (MPa)
Rupture Life (h)
Rupture Strain (%)
Minimum Creep Rate (s-1)
55.2 1807 51.00 3.8 x 10⁻⁸ 68.95 582 68.50 1.5 x 10⁻⁷
Pure He 843
82.7 204 74.70 4.6 x 10⁻⁷ 55.2 1668 51.42 4.8 x 10⁻⁸
68.95 1179 30.04 2.5 x 10⁻⁸ He with 675 vppm methane
843
82.7 191 69.95 4.5 x 10⁻⁷ 55.2 1223 62.00 6.9 x 10⁻⁸ He with 500 vppm
oxygen 843
68.95 478 68.25 1.9 x 10⁻⁷ 27.6 1568 112.90 6.6 x 10⁻⁸ 55.2 50 72.58 2.1 x 10⁻⁶
Pure He 950
68.95 16 78.44 6.6 x 10⁻⁶ 27.6 >6527a 43.30 1.5 x 10⁻⁸ 41.4 587 43.30 1.3 x 10⁻⁷
He with 675 vppm methane
950
55.2 81 37.30 4.9 x 10⁻⁷ 27.6 475 52.10 1.6 x 10⁻⁷ He with 500 vppm
oxygen 950
41.4 184 53.60 4.2 x 10⁻⁷ aTest terminated and specimen cooled to room temperature.
Figure 3.30. Low magnification fracture surface of specimen failed under creep at 27.6 MPa, 950ºC in He+CH4 environment.

38
Figure 3.31. Cleavage fracture morphology of specimen shown in Fig. 3.29 [Shankar and Natesan 2006].
Figure 3.32. Longitudinal cross-section of fractured specimen shown in Fig. 3.29, indicating crack propagation through coarse Cr-carbide network [Shankar and Natesan 2006].
3.1.1.4 Fatigue, Fatigue Crack Growth, and Creep-Fatigue in helium
Strain-controlled fully reversed fatigue tests were conducted from room temperature to 871°C and at a cyclic strain rate of 4 x 10
-3/s [Strizak et al. 1982]. The helium environment had
impurities (in Pa) of H2:CO:CH4:H2O in a ratio of 30:2:3:0.2. Figures 3.33 and 3.34 compare the data generated for Alloy 617 specimens in solution-annealed and solution-annealed-plus-aged conditions, in which the aging and test temperatures were identical. The results on thermal aging showed that aging for 10000 h at these temperatures before testing reduced fatigue life, but aging for 20000 h improved fatigue life slightly. These changes were attributed to microstructural changes that were noted in posttest examination of specimens. Results of testing Alloy 617 in impure helium indicated an improved cycle life when compared with the life obtained in pure helium. Strizak et al. [1982] also compared the data generated in impure helium with those generated in air and concluded that the helium environment was in no case detrimental to fatigue life for the alloy but was usually beneficial. Figure 3.35 shows a comparison of the low-cycle fatigue behavior of Alloy 617 in air and in helium with the design curves [Schubert et al. 1983].

39
0.2
0.3
0.4
0.5
0.6
0.70.80.9
1
101
102
103
104
105
106
Annealedann.+aged 10,000 hann.+aged 20,000 h
Str
ain
ran
ge
(%
)
Cycles to failure
Open symbols: in airClosed symbols: in impure helium
Figure 3.33. Comparison of low-cycle fatigue behavior of Alloy 617 tested in air and in helium at 704°C [Strizak et al. 1982].
0.2
0.3
0.4
0.5
0.6
0.7
0.80.9
1
101
102
103
104
105
106
Annealedann.+aged 10,000 hann.+aged 20,000 h
Str
ain
ra
ng
e (
%)
Cycles to failure
Open symbols: in airClosed symbols: in impure helium
Figure 3.34. Comparison of low-cycle fatigue behavior of Alloy 617 tested in air and in helium at 871°C [Strizak et al. 1982].
0.1
1
102
103
104
105
106
750°C
850°C
950°C
Str
ain
ra
ng
e (
%)
Cycles to failure
Range for design curves
Open symbols: in airClosed symbols: in impure helium
Figure 3.35. Comparison of the low-cycle fatigue behavior of Alloy 617 in air and in helium with the design curves [Schubert et al. 1983].

40
Kitagawa et al. [1979] evaluated the low-cycle fatigue and creep fatigue behavior of Alloy 617 at 1000°C in air and in helium and the results are shown in Fig. 3.36. They also tested some precarburized specimens, the results for which are also shown in Figure 3.36. They concluded that the fatigue properties in four-nine helium improved due to decarburization of the alloy, whereas the precarburized specimens exhibited somewhat lower fatigue properties when compared with data obtained in air. Figure 3.37 shows the fatigue lives of Alloy 617 under strain-hold conditions tested at 1000°C in helium. The fatigue lives decreased with an increase in strain hold time.
Figure 3.38 compares the experimental data on creep fatigue of Alloy 617 with the linear summation rule for creep and fatigue damage. It is evident that the damage under creep-fatigue conditions is much more than predicted based on the linear rule. Additional data under different loading scenarios are needed to develop a predictive capability on creep-fatigue damage in the alloy, especially for helium purity levels typical of gas-turbine-based HTGRs.
Rao et al. [1988] evaluated the effects of strain rate (4x10⁻³ to 2x10⁻⁵ /s) and hold time on the low-cycle fatigue life of Alloy 617 at 950ºC in a simulated helium environment. The impurities in the helium gas were H2 - 500±50 ppm, CH4 - 20±5 ppm, H2O - 1.5±1 ppm, CO - 15±5 ppm, CO2 - 1.0 ppm and N2 - 5 ppm. The gas pressure was 1.8 atm and the flow rate was 3 l/h. A slight reduction in fatigue life was observed with decreasing strain rate. Hold time always reduced fatigue life, irrespective of the duration of the hold. Tensile holds were more damaging than compressive holds. Symmetrical tension-plus-compression holds resulted in fatigue lives close to the continuously cycled tests. In the continuously cycled tests, creep fracture was transgranular ductile while under tensile hold, creep fracture occurred by grain boundary cavitation and oxidation.
10-3
10-2
10-1
101
102
103
104
105
Annealed, in airAnnealed, in HeCarburized, in airHe Exposed, in air
Str
ain
ra
ng
e (
%)
Cycles to failure
Figure 3.36. Comparison of low-cycle fatigue behavior of solution-treated and carburized Alloy 617 tested in air and in helium at 1000°C [Kitagawa et al. 1979].
101
102
103
10-1
100
101
102
0,65% Tension-Compression1.1% Tension-Compression0,65% Tension only1.1% Tension only
Cycle
s f
or
10
% r
ed
uctio
n in
lo
ad
Time for one cycle (min)
Half of strain range
Figure 3.37. Influence of hold time on fatigue life of Alloy 617 at 1000°C [Kitagawa et al. 1979].

41
0
0.2
0.4
0.6
0.8
1
0 0.2 0.4 0.6 0.8 1
Fatigue d
am
age
Creep damage
Alloy 617, 950°C
Figure 3.38. Comparison of experimental creep-fatigue data with linear damage accumulation rule [Schubert et al. 1983].
3.1.1.5 Aging effects on Microstructure and Mechanical Properties
Aging generally influences the microstructure and resulting mechanical properties. Several studies have been conducted to evaluate the effect of aging on the mechanical properties of Alloy 617 [Strizak et al. 1982, Mankins et al. 1974, Kimball et al. 1976, Kihara et al. 1980, Kirchofer et al. 1984, McCoy 1985, Allen et al. 2004]. A comprehensive review of the existing literature can be found in two recent publications [Swindeman and Ren 2005, Ren and Swindeman 2006], which highlight the effect of aging on microstructure, hardness, tensile, toughness, creep and stress-rupture, fatigue and fatigue crack growth. Among the important conclusions was that short-time creep and relaxation need further evaluation. In addition, most of the studies on aging effects were conducted at high stress-low rupture life regime. It would be beneficial to characterize the effect of aging on low-stress creep and stress-rupture behavior.
In terms of influence on microstructure, the review [Swindeman and Ren 2005] identified that the precipitation of γ′ was observed in some studies and not in others. Wu et al. [2005] reported that γ′ forms between 600-800ºC but not above 800ºC. As mentioned in an earlier section, ORNL is developing GenIV617 composition of Alloy 617 that has stringent compositional control as compared to the standard 617 composition. The objective is to develop the GenIV composition having grain size ASTM 3 to 5 and with improvement in mechanical properties. The use of P and N that are slated for inclusion in the GenIV composition needs adequate justification, since the tendency of N to easily form TiN precipitates may produce agglomerates leading to inhomogeneous microstructure. If P and N are to be included in the GenIV 617 specification, processing the superalloy composition would be a critical step for the above mentioned reason. Use of double or triple vacuum induction melting procedure may be needed to achieve the desired uniform chemistry.
3.1.2 Alloy 230 (UNS N06230)
Alloy 230 is a solid-solution strengthened Ni-Cr-W austenitic superalloy possessing excellent high-temperature strength that is enhanced by additions of molybdenum and cobalt. It exhibits outstanding resistance to the oxidizing environment, excellent stability and resistance to grain coarsening with long-term thermal exposures, and a lower thermal expansion coefficient than Alloy 617. In addition, it also has good weldability and fabricability. The alloy typically has

42
an austenitic matrix that contains a distribution of coarse intra- and intergranular precipitates likely of M6C type. In addition, fine intragranular precipitates of M23C6 are also present. The composition of the alloy is such that M23C6 forms preferentially over M6C. This alloy, like Alloy 617, also does not precipitate laves, sigma or mu phases.
Over the years, several studies have evaluated mechanical properties of this alloy. Figure 3.39 shows the variation of YS and UTS with temperature [Haynes International 2006]. Figure 3.2 (in Section 3.1.1) compares the properties of Alloys 230 and 617, obtained in the current VHTR French program. It is evident that Alloy 230 has superior properties than Alloy 617 up to about 800ºC, beyond which the difference is not significant.
0
200
400
600
800
1000
0 200 400 600 800 1000
Yield Strength
UTS
Str
ess (
MP
a)
Temperature (ºC)
Figure 3.39. Tensile properties of hot rolled and solution annealed Alloy 230 plate [Haynes International 2006].
3.1.2.1 Creep Behavior in Air
Several investigators have evaluated the creep rupture response of Alloy 230 as a function of temperature [Katcher 1998, Klarstrom 2001, Klova and Sobaru 1993, Shingledecker et al. 2005]. The creep-rupture behavior of Alloy 230 in an air environment at different temperatures is given in Fig. 3.40 [Katcher 1998]. As the temperature increases beyond 900ºC, the rupture life is more dependent on applied stress.
100
101
102
103
101
102
103
104
105
106
Applie
d S
tress (
MP
a)
Rupture Life (h)
815°C
704°C
649°C
760°C
871*C
927°C
982°C
1038°C1093°C
Figure 3.40. Creep rupture behavior of Alloy 230 tested in air [Katcher 1998].

43
Fig. 3.41 compares the creep rupture behavior of Alloy 230 in sheet form with other alloys indicating superior performance of Alloy 230 compared to Hastelloy X [Klarstrom 2001]. Klova and Sobaru [1993] predicted stress required to accumulate 0.5% strain at different temperatures of Alloy 230. The Larson-Miller parameter of Alloy 230 for various product forms of Alloy 230 can be found elsewhere [Shingledecker et al. 2005]. Creep strength in Alloy 230 is brought about by solid solution strengthening, low stacking fault energy, and precipitation of M23C6 carbides on glide dislocations [Klarstrom 2001, Tawancy 1992].
10
100
700 750 800 850 900 950 1000
Str
ess (
MP
a)
Temperature (°C)
Hastelloy X
Alloy 188Alloy 230
1% Creep strength
10
100
700 750 800 850 900 950 1000
Str
ess (
MP
a)
Temperature (°C)
Hastelloy X
Alloy 188Alloy 230
Rupture strength
Figure 3.41. Comparison of 1% creep strengths and stress-rupture strengths of Alloy 230 with other alloys [Klarstrom 2001].
Figure 3.42 compares the stress rupture behavior of Alloys 230 and 617 along with ASME stress allowables [Burlet et al 2005]. In the figure, the Alloy 230 data are from Haynes International and the Alloy 617 data are from INCO Alloys. It is clear that both exceed the ASME requirement. Up to 850ºC, both the alloys have similar creep strength but at 950ºC, Alloy 617 has better creep strength at longer lives (>3000 h). The French and Korean VHTR programs have conducted baseline creep tests on Alloy 230 along with other heat exchanger materials.
100
101
102
103
10-1
100
101
102
103
104
105
106
Str
ess (
MP
a)
Time (h)
1050*C
950*C
850*C
750*C
617 and 230
617
230
617
617
230
ASME Code allowables
Figure 3.42. Comparison of creep properties of Alloys 230 and 617 along with ASME Code allowables [Burlet et al. 2005].

44
Figure 3.9 (in Section 3.1.1.1) shows the creep behavior of various heat exchanger candidate materials at 982ºC, evaluated by the current Korean VHTR program. The figure indicates that Alloy 617 has slightly higher creep rupture life than Alloy 230. Figure 3.43 shows the creep data (indicated by ‘stars’) of Alloy 230 in air from the current French program along with the creep behavior of Alloy 617 obtained from a previous German program [Ennis et al. 1984]. The figure shows that the creep data of both the alloys are similar.
101
102
103
101
102
103
104
105
Str
ess (
MP
a)
Rupture time (h) Figure 3.43. Creep data of Alloy 230 from a current French VHTR program [Cabet et al. 2006] compared to that from a previous German HTGR program [Ennis et al. 1984].
3.1.2.2 Fatigue Behavior in Air
Low cycle fatigue of Alloy 230 at high temperatures has been evaluated by several authors [Klarstrom 2001, Haynes International 2006, Srivastava and Klarstrom 1990] at high. Fig. 3.44 shows the low-cycle fatigue behavior at various temperatures [Srivastava and Klarstrom 1990]. These authors also evaluated the LCF behavior of Alloy 617 (see Fig. 3.12 in Section 3.1.1.2), and observed that in the range 760-982ºC, Alloy 230 had better fatigue properties than Alloy 617. However, the grain size of Alloy 617 was coarser than that of Alloy 230 that may explain the difference in fatigue response.
0.2
0.4
0.6
0.8
1
1.2
103
104
105
R = -1, f = 0.33 Hz (20 cycles/min) 760ºC
871ºC982ºC
Tota
l str
ain
range (
%)
Cycles to failure
Figure 3.44. Low-cycle fatigue behavior of Alloy 230 in air [Srivastava and Klarstrom 1990].

45
Chen at al. [2001] evaluated the creep-fatigue behavior of Alloy 230 at 816 and 927ºC. Figure 3.45 shows the variation of fatigue life with applied strain range as a function of tensile hold time. The frequency of loading in the absence of hold time was 1 Hz. It can be seen that a hold time of 2 min. reduces the fatigue life at all strain ranges investigated. In the absence of hold time, the fatigue behavior at 816 and 927ºC is similar above a strain range of 0.4%, indicating no effect of temperature. This is a surprising result since a temperature effect on fatigue is expected, as observed in other studies [Klarstrom 2001, Srivastava and Klarstrom 1990]. The reason for the similarity in fatigue behavior was not discussed in the original paper nor was any microstructural investigation performed that precludes us from identifying the cause of such behavior. The effect of varying hold time (up to 60 min.) on the fatigue behavior is shown in Fig. 3.46. The data indicate that the fatigue life drops significantly with hold time up to about 10 min. after which the effect of hold time seems to be not significant
0.5
1
1.5
2
101
102
103
104
105
816°C, 0 min816°C, 2 min927°C, 0 min927°C, 2 min
To
tal str
ain
ra
ng
e (
%)
Cycles to failure
Figure 3.45. Low cycle fatigue behavior of Alloy 230 with and without hold time [Chen et al. 2001].
100
200
300
400
500
600
700
0 10 20 30 40 50 60 70
Hastelloy X
230
188
Cycle
s to failu
re
Hold tome (min)
(a) 816°C, Strain range 1%
100
200
300
400
500
600
700
0 10 20 30 40 50 60 70
Hastelloy X
230
188
Cycle
s t
o f
ailu
re
Hold tome (min)
(b) 927°C, Strain range 1%
Figure 3.46. Effect of tensile hold time on the low cycle fatigue of Alloy 230 and two other superalloys (a) at 816ºC (b) at 927ºC [Chen et al. 2001].

46
The effect of tensile hold time on creep-fatigue crack growth behavior can be seen in Fig. 3.47 [Lu et al. 2002]. It is clear from Fig. 3.47a that in the presence of 2 min. hold time, the crack growth rate per cycle, da/dN, increases by an order of magnitude indicating the damaging effect of creep on the life of the material. Figure 3.47b plots the crack growth rate in unit-time. The two da/dt-ΔK curves cross at a ΔK of about 22 MPa√m. At this point, crack growth rate per unit time from the cyclic fatigue damage and the maximum load creep damage are equal. To the left of the cross-point, the cyclic fatigue is more damaging while to the right, creep is more damaging.
10-4
10-3
10-2
10-1
100
101
102
103
10 100
da
/dn
(m
m/c
ycle
)
Delta K (MPa m1/2
)
0 min
2 min
(a)
10-4
10-3
10-2
10-1
10 100d
a/d
t (m
m/s
)Delta K (MPa m
1/2)
2 min0 min
(b)
Figure 3.47. Effect of hold-time on crack growth rate of Alloy 230 at 927ºC (a) da/dN vs. ΔK and (b) da/dt vs. ΔK [Lu et al. 2002].
As discussed earlier in Section 3.1.1.2 (Figs 3.13-3.15), Meyer-Olbersleben et al. [1999] evaluated the thermal-fatigue behavior of Alloys 617 and 230 in air using flat single-wedge plate specimens in high frequency induction heating at maximum cycle temperatures of 850-1050ºC. They observed that Alloy 230 had better thermal fatigue crack initiation resistance in air compared to Alloy 617. The crack initiation life under purely mechanical loading was similar in both alloys.
Figure 3.48 compares the cyclic oxidation resistance of Alloy 230 with other alloys in air+10% water vapor oxidizing environment [Ganesan et al. 1995] that shows the mass change as a function of thermal cycles. Each cycle consisted of holding the specimens at 1093ºC for 15 min. in the environment and then holding at ambient temperature for 5 min. Samples were weighed after every 100 cycles. The data indicate that Alloy 617 has better thermal cycling resistance than Alloy 230 as illustrated by its lesser mass change up to 2337 cycles.
-15
-10
-5
0
5
0 500 1000 1500 2000 2500
Mass c
hange (
mg/m
m2)
Cycles
617
230
Figure 3.48. Mass change as a function of thermal cycles in cyclic oxidation test for Alloys 230 and 617 [Ganesan et al. 1995].

47
3.1.2.3 Thermal Stability
The effect of thermal aging on room temperature tensile ductility is shown in Fig. 3.49, which compares the thermal stability of Alloy 230 along with two other alloys after aging for 8000 h in the temperature range of 650-871ºC. The elongation of Alloy 230 decreases from ≈50% at room temperature to ≈35% at 871ºC. Also, the elongation seems to saturate beyond ≈760ºC as seen in the figure. Microstructural examination indicated precipitation of M23C6 carbides in Alloy 230. No evidence of sigma, mu, or Laves phases were observed. An additional 8000 h aging in this temperature range did not decrease ductility further and the alloy showed good toughness retention [Klarstrom 2001].
10
20
30
40
50
60
0 200 400 600 800 1000
RT
tensile
elo
ngation (
%)
Exposure temperature (°C)
230
188
Hastelloy X
Figure 3.49. Comparison of room temperature tensile elongation after 8000 h exposure in the temperature range of 650-871ºC [Klarstrom 2001].
Jordan et al. [1999] characterized microstructural changes and evaluated tensile and impact properties of Alloy 230 after 10,000 h thermal aging in air in the temperature range of 750-1050ºC. Table 3.5 shows the mechanical properties in as-received and aged conditions. Aging at 1050ºC was done on specimens from a different heat as indicated in the table. It can be seen that tensile ductility and impact properties reached a bottom at 850ºC aging temperature and at 950ºC and beyond, the properties improved. After 1050ºC aging, the toughness and ductility were similar to the values of the as-received material. The significant microstructural changes observed after thermal aging in this temperature range were: (a) the primary carbide morphology and (b) reduction in the amount of intragranular secondary (Fe,Cr)23C6 carbides. After 750ºC aging, coarser intergranular precipitation of (Fe,Cr)23C6 carbides were observed. In addition, coarse and blocky intra-and intergranular precipitates of M6C carbides were observed. At 850-1050ºC aging, the M6C carbides were irregular in shape. After 1050ºC, the secondary intragranular carbides appeared to have re-solutionized in the matrix consistent with the toughness and ductility values being similar to those of the as-received material.
Ganesan et al. [1995] also characterized the effect of thermal aging at 649, 760, 871, and 982°C on the room temperature impact properties. They observed that the impact properties of Alloy 230 were lower compared to Alloy 617 after exposure times of 100 and 500 h but the reduction in properties when going from 100 to 500 h exposure at 649 and 871°C was more drastic in Alloy 617 compared to Alloy 230, as shown in Table 3.6.
Figs. 3.50 and 3.51 show the effect of thermal aging up to 5000 h on the mechanical properties of Alloy 230 and Alloy 617 [Burlet at al 2005]. The impact energy of Alloy 230 decreases up to about 750-850ºC above which it increases. The bottoming of impact energy at 750-850ºC is consistent with the results in Table 3.5 [Jordan et al 1999]. The ductility seems to

48
Table 3.5. Effect of thermal aging in air for 10,000 hr at different temperatures on the room temperature mechanical properties of Haynes 230 [Jordan et al 1999]
Property As received (Heat A)
750°C 850°C 950°C As received (Heat B)
1050°C
0.2% YS(MPa) 460 4011 3821 3751 3951 3191
UTS (MPa) 901 9111 8321 8651 8471 8181
Reduction of area (%) 47.5 24.41 20.11 37.41 47.21 44.51
Charpy impact toughness (ft-lb)
94 19 16 20 112 88
1Represents one data point. All other data represents average of two data points. Table 3.6. Room temperature impact energy (J) after exposure at the indicated temperatures for 100 and 500 hours [Ganesan et al 1995]
100 h exposure 500 h exposure Aging temperature (°C)
617 230 Hastelloy X 617 230 Hastelloy X 649 75 50 64 50 45 52 760 66 34 47 64 28 24 871 72 30 33 54 30 24 982 56 35 91 53 34 34
bottom-out at 750ºC although there is one data point at 850ºC that has very low ductility (≈10%). The UTS remains roughly constant after aging at all temperatures. Comparing the behavior of Alloy 230 with that of Alloy 617, the impact energy and elongation (and toughness) of 617 is higher after aging at 850ºC, even though there is a sharp drop in the same with increasing aging temperature. The UTS of both alloys are comparable after aging at 850ºC. Figure 3.51 shows the influence of aging on high temperature properties. Fig. 3.51a shows that the UTS of Alloy 230 was not affected by aging up to 5,000 h. Figure 3.51b shows that the ductility after aging for 5,000 h at 750ºC is much lower than in the unaged condition. Beyond 750ºC, the ductility increases. Microstructural examination indicated intergranular fracture at 850ºC. The result of this on-going study indicates that the microstructure of Alloy 230 is still evolving after 5,000 h of aging, and that there is a need for aging to longer times. Figure 3.51b also indicates that 1,000 h aging at 750ºC reduces ductility of Alloy 617 more than Alloy 230. With the very limited information available on microstructure and fracture behavior, it clearly warrants additional effort on thermal aging studies on Alloy 230.

49
0
50
100
150
200
250
300
350
0 200 400 600 800 1000
617, 1000 h230, 1000 h230, 5000 h
Imp
act
en
erg
y (
J/c
m2)
Aging temperature (°C)
10
20
30
40
50
60
70
80
90
0 200 400 600 800 1000
617, 1000 h230, 1000 h230, 5000 h
Elo
ng
atio
n (
%)
Aging temperature (°C)
0
200
400
600
800
1000
1200
0 200 400 600 800 1000
617, 1000 h
230, 1000 h
230, 5000 hUltim
ate
te
nsile
str
en
gth
(M
Pa
)
Aging temperature (°C) Figure 3.50. Effect of thermal aging on room temperature properties of Alloys 230 and 617 (a) Impact energy vs aging temperature (b) elongation vs. aging temperature, and (c) UTS vs. aging temperature [Burlet et al 2005].
0
200
400
600
800
1000
1200
0 200 400 600 800 1000
617617, 1000 h230230, 1000 h230, 5000 hU
ltim
ate
te
nsile
str
en
gth
(M
Pa
)
Aging & test temperature (°C)
0
20
40
60
80
100
120
0 200 400 600 800 1000
617617, 1000 h230230, 1000 h230, 5000 h
To
tal e
lon
ga
tio
n (
%)
Aging & test temperature (°C) Figure 3.51. Effect of thermal aging on high temperature properties of Alloys 230 and 617 (a) UTS vs. aging temperature and (b) elongation vs. aging temperature [Burlet et al. 2005].
3.1.2.4 Corrosion and Oxidation Resistance
Figure 3.52 shows the high temperature isothermal oxidation behavior of Alloy 230 and other candidate heat exchanger materials after exposure to impure helium environments at 950ºC for 813 hrs. The helium contained H2 = 189±6 ppm, CH4 = 20.1±0.5 ppm, CO = 50.6±1.4 ppm, H20 ~2.1 ppm, N2 = <8 ppm, and O2 = <0.1 ppm and experiments were conducted with a helium flow rate of 15 L/h [Cabet et al. 2006]. The thicknesses/depths of loose oxide scale, compact oxide scale, internal oxide, and the internally affected region developed (after oxidation) are shown in the figure. The results indicate that PM1000 alloy, an oxide-dispersion strengthened alloy, has the best oxidation resistance. Among the other four materials, Hastelloy X has the best oxidation resistance followed by Alloy 230 and Alloy 617, and then Alloy 800H. Alloy 617 formed

50
a thick irregular chromia scale doped with Ti and Mn, and an internal oxide layer of Al. Alloy 230 formed a slightly thinner scale and some evidence of loose oxide on top. In addition, Alloy 230 had an internal oxide layer of Al and Cr. The difference in the overall oxidation resistance between Alloy 617 and Alloy 230 is not significant. The thickness of internal oxide is similar in both alloys, and the depth of internally affected zone (i.e., carbide-free zone) is also not much different (55 µm in Alloy 230 vs. 65 µm in Alloy 617). The time of exposure is too short (≈800 h) to determine whether Alloy 230 has superior oxidation resistance than Alloy 617. Longer exposures are needed to establish the difference, if any, between the two alloys.
-100
-80
-60
-40
-20
0
20
800H 617 230 Hastelloy X
Compact oxide scaleLoose scaleInternal oxidationInternal affected zone
Th
ickn
ess/d
ep
th (!
m)
Figure 3.52. Comparison of isothermal oxidation behavior of Alloy 230 with other candidate heat exchanger materials after 800-h exposure at 950ºC in helium environment [Cabet et al. 2006].
Figure 3.53 shows the isothermal oxidation resistance of alloys 230, 617 and Hastelloy X at 1100ºC in air+10% water vapor environments [Ganesan et al 1995]. Alloy 617 shows the least mass loss after 672 h of exposure. Again, as mentioned earlier, the time of exposure is too short to determine whether Alloy 617 is superior to Alloy 230 under oxidizing conditions. Figures 3.54 and 3.55 show mass change of alloys 617, 230, 188 and Hastelloy X under two different carburizing environments. The environment H2-1%CH4 had a carbon activity of 1 with no oxygen while the other environment H2-5.5%CH4-4.5%CO2 had a carbon activity of 1 and an oxygen partial pressure of 10-21 atm. In both cases, Alloy 617 had the least mass loss compared to other alloys indicating superior carburization resistance that has been attributed to the formation of a stable surface oxide.

51
-8
-6
-4
-2
0
2
0 100 200 300 400 500 600 700
Alloy 617Alloy 230Hastelloy X
Ma
ss c
ha
ng
e (
mg
/cm
2)
Exposure time (h)
Figure 3.53. Mass change as a function of time in air+10% water vapor at 1100ºC for alloys 617, 230, and Hastelloy X [Ganesan et al. 1995].
-5
0
5
10
15
20
25
30
0 200 400 600 800 1000 1200
Ma
ss c
ha
ng
e (
mg
/cm
2)
Exposure time (h)
Hastelloy X 230
188
617
Figure 3.54. Mass change as a function of exposure time in H2-1%CH4 carburizing environment at 1000ºC for Alloys 617, 230, 188, and Hastelloy X [Ganesan et al. 1995].
0
5
10
15
20
0 200 400 600 800 1000 1200
Ma
ss c
ha
ng
e (
mg
/cm
2)
Exposure time (h)
Hastelloy X230
188
617
Figure 3.55. Mass change as a function of time in H2-5.5%CH4-4.5%CO2 carburizing environment at 1000ºC for Alloys 617, 230, 188, and Hastelloy X [Ganesan et al. 1995].

52
3.1.3 Alloy 800H (UNS N08810)
Alloy 800H is an iron-base solid-solution strengthened alloy with large additions of nickel (30-35 wt.%) and chromium (19-23 wt/%). It has the same basic composition as Alloy 800 except that a minimum carbon content of 0.05 wt.% is specified. The elemental composition is given in Table 3.1. This alloy must be solution annealed at ≈1093°C to achieve stable austenitic structure, and is intended for use at temperatures >593°C. The higher carbon content and coarse grain size are aimed at improving creep resistance brought about by the carbide phases, TiC and M23C6 (primarily Cr23C6). The alloy has good resistance to internal oxidation, scaling, corrosion, and stress corrosion. The alloy is currently approved under ASME Code Section II Subsection NH for use up to 760ºC. The material is free of precipitates in the solution-annealed condition. After long times at a service temperature of ≈550°C, g' precipitates tend to form. These precipitates can reduce the creep ductility of the alloy [Betteridge et al. 1978]. To minimize the decrease in creep ductility, the volume fraction of g' precipitates is controlled by specifying a concentration limit of ≈0.8 wt.% for the Al + Ti content in the alloy. The minimum creep rate at elevated temperatures is depicted by Norton’s law and the Arrhenius function, as follows [Blackburn 1972]:
! m = constant("/E)n # exp($Q/RT) (3.1)
where σ, E, Q, R, and T are applied stress, elastic modulus, activation energy, gas constant, and absolute temperature.
Figure 3.56 shows the minimum creep rate versus stress at 593 to 760°C, with comparison to results derived by regression analysis [Booker et al. 1978]. Figure 3.57 shows the allowable stress values Smt used for primary general membrane calculations for actual service life and for normal-plus-upset conditions, as specified by ASME Code [ASME 1977].
Fatigue behavior of Alloy 800H has been evaluated from room temperature to 760°C [Soo and Chow 1976, Soo and Chow 1978, Chow et al. 1978]. Figure 3.58 shows low- and high-cycle fatigue data (typical of information available) for Alloy 800H at 760°C, plotted as log-log plots of elastic and total strain range versus life. Figure 3.59 shows the creep-fatigue behavior of Alloy800H, clearly indicating the detrimental effect of hold time on fatigue life at 600 and 800ºC [Nilsson and Sandstrom 1988]. The hold time of 360 s reduces the fatigue life by a factor of 10 and 3-5 at 600 and 800ºC respectively. Figure 3.60 shows the creep-fatigue damage envelope for Alloy 800H from the ASME Code. Thermal aging of Alloy 800H in air at 750°C for 10,000 h resulted in a slight decrease in YS (217 to 246 MPa) and UTS (537 to 570 MPa) and a
Figure 3.56. Minimum creep rate versus stress at 538-760°C (1000-1400°F) and correlations developed by regression analysis [Booker et al. 1978].

53
0
50
100
150
400 450 500 550 600 650 700 750 800
Str
ess
(M
Pa)
Temperature (°C)
10
102
103
104
105
5x10⁵
St - miinimum criterion
among time-dependent stress components
Sm
- miinimum criterion
among time-independent stress components
Alloy 800H, solution annealed
Figure 3.57. Allowable stress values Smt for primary membrane calculations for actual service life and for normal-plus-upset conditions, as specified by ASME Code [ASME 1977].
0.01
0.1
1
10
102
103
104
105
106
107
108
109
BNLGEBMIGA
Ela
stic s
train
range (
%)
Cycles to failure
0
1
2
3
4
5
6
102
103
104
105
106
107
108
BNLGEBMIGA
To
tal str
ain
ra
ng
e (
%)
Cycles to failure Figure 3.58. Low- and high-cycle fatigue behavior of Alloy 800H at 760°C [Soo and Chow 1978]. BNL, GE, BMI, and GA in the figures refer to Brookhaven National Laboratory, General Electric Company, Battelle Memorial Institute, and General Atomics Company, respectively.
10-3
10-2
102
103
104
105
Unaged, 800°C
Unaged, 600°C
Aged, 600°CTota
l str
ain
range
Cycles to failure
Open symbols: 0 hold timeClosed symbols: 6 min hold time
Figure 3.59. Creep-fatigue behavior of Alloy 800H in air environment at 600 and 800ºC [Nilsson and Sandstrom 1988].

54
-0.2
0
0.2
0.4
0.6
0.8
1
0 0.2 0.4 0.6 0.8 1
Cre
ep
life
fra
ctio
n
Fatigue life fraction
304 and 316 stainless steel
2 1/4Cr-1Mo and Alloy 800H
9Cr-1Mo-V
Figure 3.60. Creep-fatigue damage envelope for Alloy 800H and other materials [ASME Code 2004].
considerable decrease in toughness (364 to 133 J) and in reduction in area (70 to 58%) [Jordan et al. 1999]. The increased strengths and reduced toughness and ductility were attributed to increase in M23C6 carbide precipitation with exposure.
Several studies have been conducted to evaluate the influence of helium environment on corrosion behavior, mechanical performance, and design aspects of Alloy 800 and 800H [Betteridge et al. 1978, Brinkman 1982, Lee 1984, Lerch et al. 1986]. Betteridge et al. [1978] concluded that the influence of helium environment (with a chemistry typical of steam-based HTGRs) on the creep properties of the alloy is minimal at temperatures up to 760°C (see Figure 3.61), but that more work is needed to fully characterize the behavior at higher temperatures and longer times. Figure 3.62 shows the minimum creep-rate from a different study indicating the minimal effect of helium on the creep rate of Alloy 800H at 649 and 760ºC, and Figure 3.63 shows the fatigue behavior of Alloy 800H at 760ºC in air and helium environment indicating an increased fatigue life in helium environment [Chow et al 1978]. Formation of brittle oxide scale in air was identified as a probable reason for the reduced fatigue life in air. The impurities in the helium environment in this study was 40 ppm H2O, 200 ppm H2, 40 ppm CO, 10 ppm CO2, and 20 ppm CH4. Soo and Sabatini [1984] also observed a similar behavior of Alloy 800H, i.e., lower fatigue strength in air compared to that in a helium environment containing high levels of moisture (2500 ppm H2O) at test temperatures of 538, 760 and 871ºC.
101
102
103
100
101
102
103
104
105
Str
ess (
MP
a)
Time to rupture (h)
Mean data, Air, ASME Code
Minimum data, Air, ASME Code3 heats in He
Figure 3.61. Creep rupture data for Alloy 800H at 650 and 760°C in helium with comparison to specifications based on air data used in ASME Code [Roberts 1978].

55
30
40
50
60
708090
100
200
300
10-4
10-3
10-2
10-1
Str
ess (
MP
a)
Creep rate (%/h)
649°C
760°C
Closed symbols: in airOpen symbols: in helium
Figure 3.62. Creep-rate comparison of Alloy 800H in air and in helium [Chow et al 1978].
100
150
200
250
300
103
104
105
106
107
108
Altern
ating s
tress (
MP
a)
Cycles to failure
Air
He
Figure 3.63. High-cycle fatigue behavior of Alloy 800H at 760ºC in a helium environment [Chow et al. 1978]
The application of Alloy 800H in the heat exchanger in NGNP requires qualification of the alloy by the ASME Code for elevated temperatures in the range of 760-1000ºC. Only very limited data are currently available on the mechanical properties of this alloy beyond 800ºC, especially in impure helium environments. Soo and Sabatini [1984] evaluated the fatigue behavior up to 871ºC. Guttman et al. [1983] evaluated the creep behavior of Alloy 800H in carburizing environments at 1000ºC. Figure 3.64) shows the 1% creep strength and creep rupture strength, illustrating that carburization has a beneficial effect on the strength. Also, it is clear from the figure that a precarburization treatment at 1000ºC for ≈1,000 h increases the rupture strength in helium compared to that in air.

56
5
6
789
10
20
30
40
50
100
101
102
103
air
CH4/H
2
pre-carb.
Str
ess (
MP
a)
Time for 1% strain (h)
(a)
5
6789
10
20
30
40
50
101
102
103
104
air
CH4-H2
Pre carb
Str
ess (
MP
a)
Time to rupture (h)
(b)
Figure 3.64. Creep behavior of Alloy 800H in different environments at 1000ºC (a) 1% creep strength (b) creep rupture strength [Guttman et al. 1983].
ANL has investigated the effect of impure helium on the creep behavior of Alloy 800H at 750 and 843ºC [Shankar and Natesan 2005]. Figure 3.65 shows the effect of methane in helium on the creep behavior of Alloy 800H at 750ºC. The low ductility and long rupture life in the helium containing 675 vppm methane at an applied stress of 68.95 MPa is associated with brittle cleavage fracture as illustrated in Fig. 3.66. At higher applied stresses, ductile fracture was observed in both pure helium and impure helium environments and there was not much difference in either life or ductility in He environments with and without methane addition. The composition of pure helium used in the tests was the same as given earlier in section 3.1.1.1 on Alloy 617. Figure 3.67 shows the creep behavior of Alloy 800H at 843ºC in pure and impure helium

57
environments. At the stress levels shown, there is no significant difference in the creep strength in both environments. The fracture morphology after creep testing at 843ºC and 55.2 MPa is shown in Fig. 3.68, which indicates an intergranular failure in the methane-containing helium environment.
0
10
20
30
40
50
60
0 650 1300 1950 2600 3250
Cre
ep s
train
(%
)
Elapsed Time (h)
Alloy 800H
Temperature 750°C (1382º F)
He with 675 vppm CH4
68.95 MPa (10 ksi)
Pure He, 68.95 MPa
He with 675 vppm CH4, 89.6 MPa
Pure He, 89.6 MPa (13 ksi)
Figure 3.65 Effect of methane on the creep rupture behavior of alloy 800H at 750ºC [Shankar and Natesan 2005].
Figure 3.66. Brittle fracture in Alloy 800H after creep testing in He + 675 vppm methane environment at 750ºC at 68.95 MPa (a) Low magnification image (b) Higher magnification illustrating cleavage facets [Shankar and Natesan 2005].
0
5.7
11.4
17.1
22.9
28.6
34.3
0 100 200 300 400 500
Cre
ep s
trai
n (%
)
Elapsed Time (h)
Alloy 800H
Temperature 843°C
He with 675 vppm CH4
41.4 MPa
Pure He41.4 MPa
He with 675 vppm CH4, 55.2 MPa
Pure He, 55.2 MPa
Figure 3.67 Effect of methane on the creep rupture behavior of Alloy 800H at 843ºC [Shankar and Natesan 2005].

58
Figure 3.68. Effect of methane on the creep fracture mechanisms in Alloy 800H tested at 843ºC at 55.2 MPa. (a) Pure He environment illustrating ductile fracture (b) He + 675 vppm methane illustrating intergranular fracture [Shankar and Natesan 2005].
Table 3.7 shows the rupture life, rupture strain, and minimum creep rate data of Alloy 800H at 750 and 843ºC at different applied stresses. The results of ANL study clearly indicate that methane in helium affects the deformation behavior and the creep rupture strength of Alloy 800H, an observation similar to that discussed earlier for Alloy 617.
Table 3.7: Creep Data for Alloy 800H at 750 and 843ºC [Shankar and Natesan 2005]
Test Environment
Temperature (ºC)
Applied Stress (MPa)
Rupture Life (h)
Rupture Strain (%)
Minimum Creep Rate (s-1)
68.95 1030 28.75 3.0 x 10⁻⁸ 89.6 491 40.79 7.7x 10⁻⁸
Pure He 750
103.4 208 54.92 2.4 x 10⁻⁷ 68.95 3396 14.50 3.0 x 10⁻⁹ He with 675
vppm Methane 750
89.6 332 44.30 1.3 x 10⁻⁷ 27.6 7598a 15.40 1.0 x 10⁻⁹
41.4 516 25.08 3.1 x 10⁻⁸ Pure He 843
55.2 115 27.80 1.9 x 10⁻⁷ 41.4 406 17.60 7.7 x 10⁻⁸ He with 675
vppm Methane 843
55.2 105 30.90 4.3 x 10⁻⁷ a Applied stress increased to 41.4MPa after ≈7500 h to induce specimen failure.
3.1.4 Alloy X (UNS N06002)
Hastelloy X is a nickel-base superalloy with good oxidation resistance at temperatures up to ≈1200°C and moderately good strength properties at temperatures up to 870°C. It is essentially a single-phase austenitic alloy, solid solution strengthened by additions of Cr, Mo, and W. Several studies have been conducted in the U.S. and in Japan to evaluate the tensile, creep rupture, low-cycle fatigue, creep fatigue properties, and fatigue crack growth of Hastelloy X, specifically for application in the helium environment of an HTGR [Lee 1984, Kurata et al. 1984, Nakanishi and Kawakami 1984, Tsuji and Kondo 1984, Bruch et al. 1984, Krompholz et al. 1984, Strizak et al. 1982].
Above ≈700ºC, Hastelloy X can form topographically close-packed phases like sigma, mu, and Laves phases. These phases can embrittle the material and result in property degradation. A Ni-Cr-Mo sigma phase was identified after exposure for more than 2,500 h at 704 and 788ºC

59
[Donachie 2002]. Mu phase was also identified in specimens aged at temperatures between 704 and 954ºC. However, the mu was most prominent in specimens aged at 871 and 954ºC [Donachie 2002].
Figure 3.69 compares the tensile properties of Hastelloy X with those of Alloy 617 in solution-annealed and aged conditions [Strizak et al. 1982]. It is evident that aging for 10,000 h or longer affects properties under tension. Figure 3.70 shows data on rupture time variation with applied stress for Hastelloy X at 760 and 871°C. Data generated for times up to 20,000 h showed that rupture ductility for the alloy is fairly high in an air environment [Lee 1984]. Figure 3.71 shows the variation in minimum creep rate as a function of applied stress for the alloy at 760 and 871°C. Figure 3.72 shows the low-cycle fatigue behavior of Hastelloy X at several temperatures in air [Strizak et al. 1982]. Lines in the figure represent the best fit of experimental data.
0
200
400
600
800
Ultim
ate te
nsile
stre
ngth
(MPa
)
0
200
400
600
800
100
150
200
250
300
350
400
Yiel
d st
reng
th (M
Pa)
100
150
200
250
300
350
400
30
40
50
60
70
80
90
100
Tot
al e
long
atio
n (%
)
30
40
50
60
70
80
90
100
20
30
40
50
60
70
80
90
100
Redu
ction
in a
rea
(%)
20
30
40
50
60
70
80
90
100
0
20
40
60
80
0 200 400 600 800Uni
form
elo
ngat
ion
(%)
Temperature (°C)
0
20
40
60
80
0 200 400 600 800Temperature (°C)
Open circles: annealed; Triangles: aged 2,500 h; Squares: aged 10,000 h; Crosses: aged 25,000 h.
Figure 3.69. Tensile properties of Hastelloy X and Inconel 617 in solution-annealed and aged conditions [Strizak et al. 1982].

60
1
10
100
101
102
103
104
105
Str
ess
(MP
a)
Rupture time (h)
760°C
871°C
Open symbols: in airClosed symbols: in helium
Figure 3.70. Applied stress versus rupture time for Hastelloy X at 760 and 871°C [Lee 1984].
1
10
100
10-7
10-6
10-5
10-4
10-3
10-2
Str
ess
(MP
a)
Minimum creep rate (h-1
)
760°C
871°C
Open symbols: in airClosed symbols: in helium
Figure 3.71. Applied stress versus minimum creep rate for Hastelloy X at 760 and 871°C [Lee 1984].
0.1
1
10
101
102
103
104
105
106
Room temperature538°C649°C760°C871°CJaske data
Tota
l str
ain
range (
%)
Cycles to failure
Figure 3.72. Low-cycle fatigue behavior of Hastelloy X at several temperatures in air. Lines represent best fit of experimental data [Strizak et al. 1982].
Figure 3.73 shows the creep-fatigue response of Hastelloy X in air at 816 and 927ºC [Chen et al 2002]. As seen in Fig. 3.73a, a tensile hold time of 2 min results in life reduction at all strain ranges at both temperatures. Furthermore, at lower strain ranges, the alloy has longer life at 816ºC than at 927ºC in the presence of tensile hold. However, at higher strain ranges, the alloy has shorter life at 816ºC compared to that at 927ºC. Figure 3.73b shows the effect of hold time on the ratio of fatigue life with hold time to that without hold time. As evident in the figure, the fatigue life at 927ºC sharply decreases up to about 10 min. hold time, beyond which the reduction in fatigue life is slower. At 816ºC, fatigue life decreases gradually with an increase in the hold time.

61
0.5
1
1.5
2
101
102
103
104
105
816°C, 0 min816°C, 2 min927°C, 0 min927°C, 2 min
Tota
l str
ain
range (
%)
Cycles to failure
0.2
0.4
0.6
0.8
1
1.2
-10 0 10 20 30 40 50 60 70
Fatig
ue li
fe fra
ctio
n
Hold time (min)
Total strain range 1%
816°C
927°C
(a) (b) Figure 3.73. Creep-fatigue behavior of Hastelloy X at 816 and 927ºC in air. (a) Fatigue life vs. total strain range with and without hold time (b) Fatigue life fraction as a function of hold time [Chen et al 2002].
The current HTTR program of Japan is evaluating Hastelloy X and Hastelloy XR for their high temperature metallic components. Hastelloy XR has a composition similar to that of Hastelloy X but with low levels of Al and Ti content, and precise control of composition to achieve improvement in corrosion resistance and overall mechanical performance. Figure 3.74a shows the creep response of both these alloys at 900ºC in impure helium, illustrating the longer time needed to achieve a given strain in Hastelloy XR compared to Hastelloy X [Tachibana 2005]. The composition of the impure helium was not specified. Figure 3.74b shows the stress dependence of creep rate indicating that until ≈75 MPa, Hastelloy X has a higher creep rate than Hastelloy XR, and vice versa.
-20
0
20
40
60
80
0 50 100 150 200 250 300 350 400
Cre
ep
str
ain
Time (h)
Hastelloy X
Hastelloy XR
39 MPa, 900°CImpure helium
(a)
10-3
10-2
10-1
100
101
102
101
102
103
Secondary
cre
ep s
train
rate
(%
/h)
Stress (MPa)
Hastelloy X
Hastelloy XR
(b)
Figure 3.74. Creep response of Hastelloy X and Hastelloy XR from the Japanese HTTR program. (a) Creep strain vs. time (b) Stress dependence of creep rate [Tachibana 2005].

62
Strizak et al. [1982] developed low-cycle fatigue data on Hastelloy X in solution-annealed and solution-annealed-plus-aged conditions in air and in impure helium. The results were similar to those observed for Alloy 617 (see Fig. 3.75).
0.2
0.3
0.4
0.5
0.6
0.7
0.80.9
1
2
101
102
103
104
105
106
107
Annealed
Annealed +10,000 h aged
Annealed +20,000 h aged
10,000 h aged in He
Str
ain
rang
e (%
)
Cycles to failure
Open symbols in airClosed symbols in impure He
Figure 3.75 Comparison of strain-controlled fatigue data generated at 871°C in air and in helium for Hastelloy X in several conditions [Strizak et al. 1982].
Figure 3.76 shows the corrosion characteristics of Hastelloy X with exposure temperature and time [Wilson and Rittenhouse 2005]. This evaluation was performed at GE as part of the previous U.S. HTGR program. The graph shows the thickness of scale formed, depth of internal oxidized layer, alloy depleted zone, and the carburized zone as a function of exposure temperature and time. As evident in the figure, the oxide scale thickness is less than 5 µm after 1000 and 3000 h exposure. The depth of internal oxidized layer and the alloy depleted zone at 950ºC are twice or more than at lower temperatures. The thickness of the carburized layer sharply increases from about 40 to 120 µm as the exposure temperature is increased from 750 to 850ºC. Hastelloy X has superior corrosion resistance compared to Alloys 617, 800H, and 230. Figure 3.52 (see in Section 3.1.2.4) shows the results of corrosion characterization of candidate heat exchanger materials obtained from the current French VHTR program.
0
20
40
60
80
100
120
140
700 800 900 1000 1100 1200
Scale, 1000 hInternal oxidation, 1000 hAlloy depletion, 1000 hCarburization, 1000 hScale, 3000 hInternal Oxidation, 3000 hAlloy depletion, 3000 h
Corr
osio
n d
epth
(!
m)
Exposure Temperature (ºC)
Figure 3.76. Corrosion behavior of Hastelloy X from the previous US HTGR program [Wilson and Rittenhouse 2005].
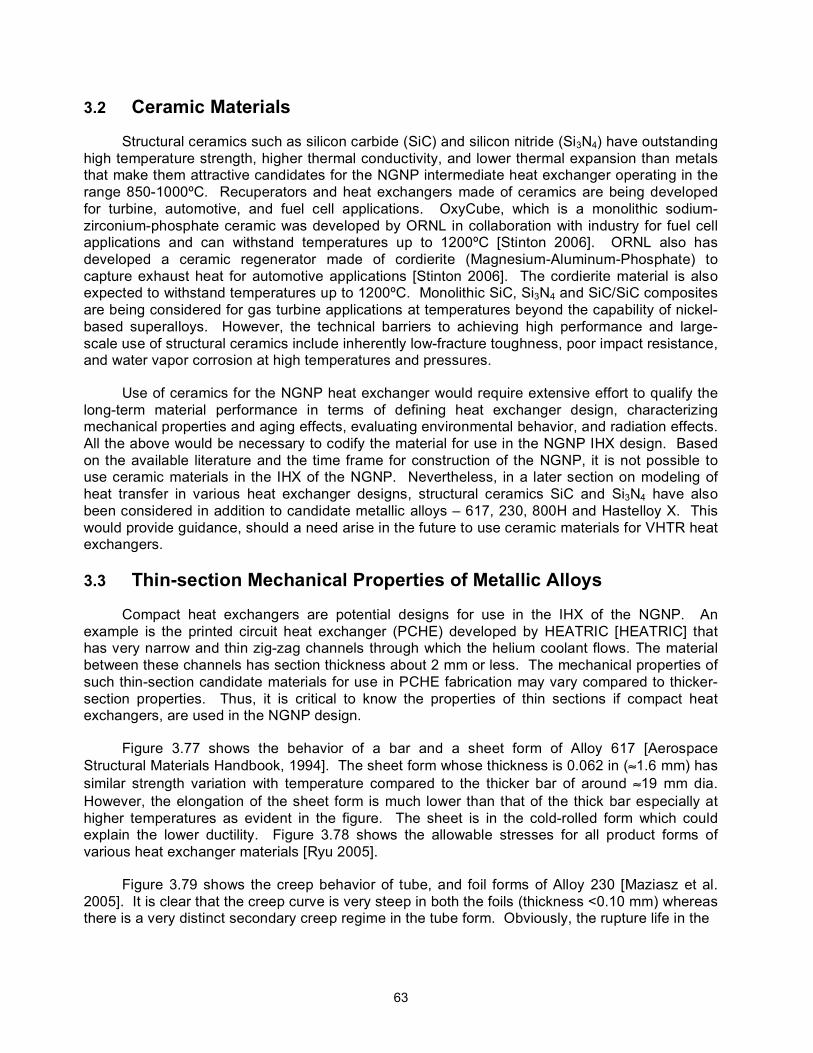
63
3.2 Ceramic Materials
Structural ceramics such as silicon carbide (SiC) and silicon nitride (Si3N4) have outstanding high temperature strength, higher thermal conductivity, and lower thermal expansion than metals that make them attractive candidates for the NGNP intermediate heat exchanger operating in the range 850-1000ºC. Recuperators and heat exchangers made of ceramics are being developed for turbine, automotive, and fuel cell applications. OxyCube, which is a monolithic sodium-zirconium-phosphate ceramic was developed by ORNL in collaboration with industry for fuel cell applications and can withstand temperatures up to 1200ºC [Stinton 2006]. ORNL also has developed a ceramic regenerator made of cordierite (Magnesium-Aluminum-Phosphate) to capture exhaust heat for automotive applications [Stinton 2006]. The cordierite material is also expected to withstand temperatures up to 1200ºC. Monolithic SiC, Si3N4 and SiC/SiC composites are being considered for gas turbine applications at temperatures beyond the capability of nickel-based superalloys. However, the technical barriers to achieving high performance and large-scale use of structural ceramics include inherently low-fracture toughness, poor impact resistance, and water vapor corrosion at high temperatures and pressures.
Use of ceramics for the NGNP heat exchanger would require extensive effort to qualify the long-term material performance in terms of defining heat exchanger design, characterizing mechanical properties and aging effects, evaluating environmental behavior, and radiation effects. All the above would be necessary to codify the material for use in the NGNP IHX design. Based on the available literature and the time frame for construction of the NGNP, it is not possible to use ceramic materials in the IHX of the NGNP. Nevertheless, in a later section on modeling of heat transfer in various heat exchanger designs, structural ceramics SiC and Si3N4 have also been considered in addition to candidate metallic alloys – 617, 230, 800H and Hastelloy X. This would provide guidance, should a need arise in the future to use ceramic materials for VHTR heat exchangers.
3.3 Thin-section Mechanical Properties of Metallic Alloys
Compact heat exchangers are potential designs for use in the IHX of the NGNP. An example is the printed circuit heat exchanger (PCHE) developed by HEATRIC [HEATRIC] that has very narrow and thin zig-zag channels through which the helium coolant flows. The material between these channels has section thickness about 2 mm or less. The mechanical properties of such thin-section candidate materials for use in PCHE fabrication may vary compared to thicker-section properties. Thus, it is critical to know the properties of thin sections if compact heat exchangers, are used in the NGNP design.
Figure 3.77 shows the behavior of a bar and a sheet form of Alloy 617 [Aerospace Structural Materials Handbook, 1994]. The sheet form whose thickness is 0.062 in (≈1.6 mm) has similar strength variation with temperature compared to the thicker bar of around ≈19 mm dia. However, the elongation of the sheet form is much lower than that of the thick bar especially at higher temperatures as evident in the figure. The sheet is in the cold-rolled form which could explain the lower ductility. Figure 3.78 shows the allowable stresses for all product forms of various heat exchanger materials [Ryu 2005].
Figure 3.79 shows the creep behavior of tube, and foil forms of Alloy 230 [Maziasz et al. 2005]. It is clear that the creep curve is very steep in both the foils (thickness <0.10 mm) whereas there is a very distinct secondary creep regime in the tube form. Obviously, the rupture life in the

64
0
100
200
300
400
500
600
700
800
0 500 1000 1500 2000
Ulti
mat
e te
nsile
stre
ngth
(MP
a)Sheet
Bar
50
100
150
200
250
300
350
Yield
stre
ngth
(MPa
) Sheet
Bar
50
60
70
80
90
100
110
120
130
0 500 1000 1500 2000
bar
Elon
gatio
n or
Red
uctio
n of
are
a (%
)
Elongation
RA
Sheet
Bar
Bar
Temperature (°F)
Figure 3.77. Variation of tensile properties with temperature of bar and sheet forms of Alloy 617 [Aerospace Structural metals Handbook, 1994].
0
50
100
150
200
250
0 200 400 600 800 1000
Max
imum
allo
wab
le s
tres
s (M
Pa)
Temperature (°C)
800
Hastelloy X
617
230
For plate, sheet, and strip
Figure 3.78. Allowable stress for heat exchanger materials for plate, sheet and strip forms [Ryu 2005].

65
foil form is much shorter than that of the tube specimen. Maziasz et al. [2005, 2006] also observed such rapid creep rupture in foils of other alloys such as Alloy 625, and HR120. Figure 3.79 clearly suggests that it is critical to evaluate the mechanical properties, especially fatigue, creep and creep-fatigue, of thin sections (of the thickness typically used in PCHEs) of Alloy 617 and other candidate materials and establish the performance envelope.
-5
0
5
10
15
20
25
0 1000 2000 3000 4000 5000 6000 7000
Cree
p st
rain
(%)
Time (h)
Alloy 230, 100!m foli
Alloy 230, 80 !m foli
Alloy 230, wrought tube
Figure 3.79. Effect of sample thickness on the creep-rupture behavior of Alloy 230 tested at 750ºC, 100 MPa [Masiasz et al. 2005].
A method to design materials to achieve properties in thin sections similar to that in thicker
sections is to use the ratio of specimen diameter/grain diameter as a criterion instead of only grain size. Fig. 3.80 shows variation of rupture life and minimum creep rate with the ratio of specimen diameter to grain diameter for a wrought nickel-based superalloy [Donachie 2002]. The figure indicates that as the specimen diameter/grain diameter decreases, i.e, as thickness reduces for a given grain size, the time to rupture reduces and the minimum creep rate increases. Also, the figure indicates that as the grain size increases (increasing solution temperature), the rupture life increases for the same specimen diameter to grain diameter ratio. Figure 3.80 suggests that to achieve the same thin-section properties as a thicker section, it may be necessary to reduce the grain size accordingly so that the specimen diameter/grain diameter ratio is at a desired constant value.
10
100
20 40 60 80 100 120 140 160
Spec
imen
dia
./Gra
in d
ia.
Time to rupture (h)
Solutiontemperature (°C)
1080
1150
1250
10
100
0 0.005 0.01 0.015 0.02 0.025
Spe
cim
en d
ia./G
rain
dia
.
Minimum creep rate (%/h)
1250°C 1150°C
1180°C
Solutiontemperature (°C)
Fig.3.80 Influence of specimen diameter/mean grain diameter ratio and solution temperature on the creep-rupture properties of a wrought nickel-base superalloy tested at 870ºC/138MPa. Note: Grain size was a function of solution temperature as shown on the minimum creep rate plot [Donachie 2002]

66
3.4 Corrosion in Reactor Helium Environments
The focus of this Section is to examine the influence of helium coolant on the chemical compatibility of structural materials that are planned for use in HTGRs. Helium, because of its chemical inertness and attractive thermal properties, is used as a primary coolant in HTGRs. However, the primary coolant in an operating HTGR is expected to be contaminated by small amounts of gaseous impurities such as H2, H2O, CH4, CO, CO2, and O2 from a variety of sources, such as reactions of ingressed water and oil with core graphite, and outgassing of reactor materials. These impurities are projected to be in ppm levels in the helium coolant, but the upper bound would strongly depend on the level of purification used for the helium supply and the leak tightness of the reactor system. Corrosion of structural alloys by these gaseous impurities at elevated temperatures can be significant. Past studies have shown that the corrosion of heat resistant materials such as austenitic stainless steels, Alloy 800H and 617 may involve oxidation, carburization, and decarburization depending on the exposure temperature, carbon activity in the gas phase, and the alloy composition. Further, the corrosion process is dynamic in the sense that it is dictated by the exposure time, gas chemistry variations, integrity of the corrosion product scales, and presence of particulates in the gas phase.
3.4.1 Coolant Chemistry
The helium coolant in an operating HTGR makes a complete circuit from the graphite core to the heat exchangers or gas turbines and back to the core in several seconds. It is reported that the gas components in the coolant, via reaction with the graphite in the core and, to a limited extent, with themselves, will reach a steady state under this dynamic flow condition and may approach an equilibrium state with respect to the core [Johnson and Lai 1981]. Equilibrium between the surfaces of metallic components and the gaseous impurities in the primary coolant helium is not expected to occur under these very fast flow conditions. Therefore, the carbon activity and oxygen partial pressure in the helium coolant, under such nonequilibrium conditions, will be determined by individual reactions that predominate in the gas mixture.
Although the gaseous impurities in a primary coolant environment may not be in equilibrium with themselves or with surfaces of metallic components, driving forces will exist for gas-metal interactions to occur. The extent to which these interactions will occur will be kinetic controlled, dictated by time, temperature, alloy chemistry, and surface condition of the alloy. In such nonequilibrium conditions, potentials for gas-metal corrosion reactions may be determined through equilibrium thermodynamics by considering each individual chemical reaction that is possible between the metal and individual gaseous impurities.
From the structural materials standpoint, we are interested in reactions that can affect the corrosion loss and/or influence the mechanical integrity; reactions that can lead to processes such as oxidation, carburization, and decarburization are of interest. Carburization and decarburization processes are determined by the carbon activity in the gas mixture relative to that in the exposed metal surface. Similarly, the oxidation process is determined by the oxygen partial pressure in the environment relative to the stability of oxides of the constitutive elements that are present on the exposed metal surface. A detailed discussion on reactions between various gas species in helium and its influence on the thermodynamic activity of carbon and oxygen has been discussed elsewhere [Natesan et al. 2003].

67
3.4.2 Corrosion Performance Data
A significant body of corrosion information has been developed on several candidate alloys exposed to helium environments with a narrow range of impurity concentrations [Brenner and Nilsen 1978, Graham et al. 1981, Johnson and Lai, 1981, Kondo 1981, McKee and Frank 1981, Bates 1984, Cappellaere et al. 1984, Huchtemann 1989, and Graham 1990]. The selected gas compositions were based predominantly on steam-cycle HTGRs, which were envisioned during the 1970s and 1980s. A listing of gas compositions used in several of the investigations is given in Table 3.8. Even though several studies have been conducted to evaluate the corrosion performance of structural materials in helium that contained different concentrations (in a somewhat narrow range) of impurities such as H2, H2O, CH4, CO, CO2, none of the studies was conducted with a systematic variation in gas composition to evaluate its influence on the scaling and its protective capacity at elevated temperatures. Figure 3.81 shows examples of scale morphologies that have been observed on Alloy 800H, Nimonic 86, and Alloy 617. There are variations in scaling depending on alloy chemistry. Scaling can also be influenced by gas chemistry in the exposure environment and temperature.
Johnson and Lai [1981] examined the carburization behavior of Alloys 800H and 617 and Hastelloy X in helium containing various amounts of H2, H2O, CH4, CO, CO2, in a temperature range of 649 to 1000°C for exposure times up to 10,000 h. Four different helium environments, identified as A, B, C, and D (see Table 3.8), were used in the experiments. Environments A and B were characteristic of high-oxygen potential, whereas environments C and D were characteristic of low-oxygen potential. Thermodynamic calculations indicated that all four environments were reducing to iron oxides (and to thermodynamically less stable oxides of nickel, molybdenum, cobalt, etc.) and oxidizing to chromium and to elements more reactive than chromium (manganese, silicon, titanium, aluminum, etc.). Figure 3.82 shows the equilibrium partial pressure for several oxides as a function of reciprocal temperature, along with the calculated oxygen partial pressures, for environments A through D listed in Table 3.8. Several conclusions were reported based on the results from the study.
Figure 3.81. Different surface layers observed on high temperature alloys exposed to helium in high temperature reactor [Schubert 1984].

68
Table 3.8. Gas chemistries used in various investigations
Gas Gas composition (in Pa)
Identification H2 CO CH4 CO2 H2O N2 Reference
A 150 45 5 <0.05 5 - Johnson and Lai 1981 B 20 10 2 0.5 5 - Johnson and Lai 1981 C 50 5 5 <0.05 <0.05 - Johnson and Lai 1981 D 50 5 5 <0.05 0.15 - Johnson and Lai 1981, Brenner and
Nilsen 1978 HTR 50 5 2 - 0.1 - Graham et al. 1981 Decarb. 50 0.5 0.5 - 0.1 - Graham 1990 Carb. 50 0.15 0.2 - 0.01 - Graham 1990 JAERI-B 20 10 0.5 0.2 0.1 <0.5 Kondo 1981 ERANS#2 30 10 0.4 0.1 0.3 <0.5 Kondo 1981 PNP 50 2 2 0.1 <0.2 0.5 Kondo 1981, Quadakkers and
Schuster 1984, Bates 1984 GE 40 4 2 0.02 0.2 0.6 McKee and Frank 1981 Lab I 150 45 5 - 5 - Cappellaere et al. 1984 AIDA 150 45 5 - 5 - Cappellaere et al. 1984 Lab II 50 1.5 2 - 0.15 0.5 Huchtemann 1989 ERANS: Engineering Research Association of Nuclear Steelmaking, Japan. JAERI: Japanese Atomic Energy Research Institute. HTR: High Temperature Reactor. PNP: Prototype Nuclear Process. GE: General Electric Company. Lab I and Lab II: Environments in laboratory tests.
• Carburization was observed in all four environments. For all three alloys, carburization kinetics in the low-oxygen-potential environments (C and D) were significantly higher (approximately one order of magnitude) at elevated temperatures than those in the high-oxygen-potential environments (A and B) for all three alloys. The enhanced carburization was attributed to kinetic effects in low-oxygen-potential environments rather than the variation in gas chemistry.
• The scale formed on the metal surface in the high-oxygen-potential environments consisted of oxides of manganese and/or chromium, while the scale formed in the low-oxygen-potential environments consisted of Mn- and/or Cr-rich oxides and Cr-rich carbides.
• Controlling the oxygen potential of the service environment can be an effective means of reducing carburization of austenitic alloys. The effect of increasing the oxygen potential on the corrosion rates of HTGR core graphite must be considered in evaluating the practical application of this approach.
Graham et al. [1981] examined Alloy 617 and Nimonic 86 in a helium environment that was considered as a standard gas (see Table 3.8) for helium-cooled process heat systems by exposing the alloys at temperatures between 800 and 1000°C for times up to 10,000 h. They related the degree of depletion or production of impurities caused by the gas/metal reactions that

69
Figure 3.82. Equilibrium partial pressure for several oxides as a function of reciprocal temperature, along with calculated oxygen partial pressures, for environments A through D listed in Table 3.8 [Johnson and Lai 1981].
occur at the metal surface by a parameter relating the surface area of the specimen and volumetric flow of helium. The study reported several conclusions, as follows:
• Both the alloys developed thin, adherent, chromium-rich oxide scales. These scales gave excellent resistance to carburization, although scale variations occurred due to the influence of minor alloying elements such as titanium, aluminum, and manganese.
• The influence of variations in gas chemistry showed that if the CH4/H2O ratio is unfavorable, enhanced carburization resulted, and if the CO/H2O ratio is unfavorable, decarburization was noted.
In a further study, Graham [1990] evaluated the long-term performance of Alloys 800H and 617 at temperatures between 400 and 1000°C from the standpoint of decarburization, carbon deposition/carburization, internal oxidation of the substrate, and spalling of the surface scales. Two different gas chemistries were used, identified as “Decarb” and “Carb” in Table 3.8. Several conclusions were reported from this study:
• Below ≈475°C corrosion is minimal, and the high-chromium alloys developed thin chromia scales. At temperatures up to 900°C, the high-chromium alloys exhibited thin

70
chromia scales along with internal oxidation of aluminum and precipitate-free zones. Carburization effects are enhanced if the scale is porous or if it spalls. Above 900°C rapid decarburization or carburization occurred, depending on the gas chemistry.
• The onset of rapid carburization or decarburization occurred above a critical temperature that is dependent on the alloy composition and the CO partial pressure in the environment. It was postulated that at this critical temperature CO becomes relatively more stable than the metal oxide and metal carbide. Above the critical temperature, the H2 in the environment reduces the chromia scale, and the released H2O reacts with carbon in the alloy to form CO. Graham [1990] termed this mechanism as “gas catalyzed” reaction, whereas Brenner [1982] called it a “microclimate reaction.” Brenner concluded that a “low” CH4/H2O ratio (i.e., excess H2O) stabilized the Cr-based surface oxide and led to decarburization, whereas a “high” CH4/H2 ratio (i.e., excess CH4) led to Cr-based surface carbide and continuous carburization.
Kondo [1981] evaluated the corrosion performance of Hastelloy X and XR in two gas mixtures (see Table 3.8) and concluded that Hastelloy X suffered from intergranular attack and internal oxidation. The modified alloy XR did not show appreciable susceptibility to such an attack, and it formed a continuous oxide film up to 1000°C in both environments. The kinetics of Cr depletion followed a parabolic rate law, based on exposures up to 6,000 h at 1000°C. The enhanced resistance of Hastelloy XR was attributed to formation of a double layer that consisted of an outer layer of MnCr2O4 and an inner layer of Cr2O3. Kondo also suggested that it is essential to maintain the ratio of the reacting metal surface to the volumetric flow rate of helium-containing impurities during experimentation, thereby minimizing the change(s) in gas chemistry during long exposure periods.
Bates [1984] established the long-term corrosion behavior of Alloys 800H and 617, Nimonic 86, and Hastelloy X for the primary circuit in the prototype nuclear process (PNP) reactor. Exposures were conducted in the temperature range of 700 to 900°C for times up to 10000 h. In PNP helium chemistry (see Table 3.8), Nimonic 86 exhibited resistance to carburization at temperatures of 700 to 900°C, and this behavior was attributed to formation of defect-free chromia scales. Alloys 800H and 617 and Hastelloy X also showed good carburization resistance, but a slow increase in carbon level with a parabolic kinetics. This behavior was attributed to interference (in the formation of chromia scales) from other oxide-forming elements in the alloys. Complete resistance to spalling of the scales was reported in all alloys, except Alloy 800H. The cause for severe spalling in Alloy 800H was attributed to the presence of 0.5 wt.% Si in the alloy. The good carburization resistance observed in the alloys was lost or severely reduced when water levels in the gas dropped below 0.05 Pa.
McKee and Frank [1981] examined the corrosion behavior of several experimental alloys in a simulated helium environment to evaluate the role of alloying additions such as Al, Ti, Si, Nb, and Y in a base composition of Ni-20 wt.% Cr. Experiments were conducted for 1,000 h at 750 and 850°C and for 1,000 and 3,000 h at 950°C. The alloys exhibited considerable variation in corrosion behavior over these test conditions. In general, carburization was more severe at 950°C than at lower temperatures. Alloys containing Al were susceptible to internal oxidation at all three temperatures and to carburization at 950°C. Additions of Nb promoted formation of protective oxide scales at all three temperatures. Alloys containing Si were resistant to carburization but the scales tended to spall. Alloy containing 1 wt.% Y exhibited massive precipitation of Cr carbides and poor corrosion performance at 950°C.

71
Cappellaere et al. [1984] examined the influence of helium pressure on the corrosion of ferritic and austenitic materials by conducting tests at 2 atm in a circuit without helium recirculation and at 50 atm in the AIDA loop. The gas chemistries in both these experiments were the same (Table 3.8). Experiments were conducted with HT 9 ferritic steel, Types 304 and 316 austenitic stainless steels, Alloys 800H and 617, and Hastelloy X. Specimens were exposed at temperatures between 550 and 870°C for time periods up to 10,000 h at 2 atm and for 2,500 h at 50 atm. Several conclusions were drawn from the study:
• Up to 650°C, HT-9 ferritic steel and Types 304 and 316 austenitic steels, and Alloy 800H showed excellent corrosion performance.
• At 750 and 870°C, Hastelloy X exhibited better resistance to oxidation than Alloys 800H and 617. For all three alloys, the oxidation rates decreased with time, but the rates were ≈3 times higher for Alloys 800H and 617 when compared with Hastelloy X.
• In general, the oxidation rates at 50 atm were higher than those at 2 atm. At 870°C, the materials were more damaged after 2,500-h exposure in 50-atm tests, compared with 10,000-h exposure in 2-atm tests. Figure 3.83 shows a comparative plot of the corrosion behavior for the three alloys from 2- and 50-atm tests.
0
0.5
1
1.5
2
2.5
3
103
104
Ma
ss p
er
un
it a
rea
(m
g/c
m2)
Time (h)
Open symbols: 2 atmClosed symbols: 50 atm
800H
617
Hstelloy X
Figure 3.83. A comparative plot of corrosion behavior for Alloys 800H, Nimonic 86, and 617 from 2- and 50-atm tests (Cappellaere et al. 1984).
Huchtemann [1989] reported that in a helium environment with low oxygen pressure (see Table 3.8 for gas chemistry used), the Alloy 617 surface underwent an enrichment of titanium and had no manganese chromium spinel. In addition, an enhanced decarburization and internal oxidation of aluminum occurred.
Figure 3.84 is a comparative plot of the environments used in different research programs listed in Table 3.8. The carbon activity in this plot is based on CH4/H2 equilibrium, whereas the pO2 is based on H2/H2O equilibrium. Consistent with observations reported in several studies, a tentative line can be drawn depicting the transition from the carburizing to oxidizing environment for high chromium alloys. Even among the oxidizing environments, the alloy may undergo decarburization, if the protective scaling process is kinetically slow. The results presented here clearly show that significant additional tests are needed in well-controlled environments to establish the mode of interaction for materials and its dependence on alloy and gas chemistry, exposure time, and temperature.

72
10-5
10-4
10-3
10-2
10-1
10-8
10-7
10-6
10-5
10-4
10-3
10-2
10-1
Para
mete
r pro
port
ional to
aC
Parameter proportional to pO2
A, LabI
B
C D
HTR
Decarb
Carb
JAERI, GE
ERANS
PNPLabII
AIDA
Figure 3.84. Comparative plot of the environments used in different research programs listed in Table 3.8. The carbon activity in this plot is based on CH4/H2 equilibrium, whereas the pO2 is based on H2/H2O equilibrium.

73
4. Gas-to-Gas IHX Calculations
4.1 Printed Circuit Heat Exchanger
4.1.1 Base Case
The gas-to-gas IHX calculations are organized in the following way. First, the calculations are performed for “base case” for which the hot and cold fluid parameters are specified and the HX configuration is assumed. Then, the sensitivity study is performed to determine the effects of the different parameters. Table 4.1 defines the base case parameters.
The internal configuration of PCHE presented in Table 4.1 represents the assumed values for the model. It may not reflect the actual PCHE configuration, which is proprietary information of Heatric and is not known to authors.
Table 4.1. Gas-to-gas base case parameters
Flow Conditions Value Units Hot side fluid He Hot side inlet temperature 900 oC Hot side outlet temperature 575 oC Hot side inlet pressure 7.0 MPa Hot side flow rate 26.7 kg/s Cold side fluid He Cold side inlet temperature 558 oC Cold side inlet pressure 1.95 MPa Cold side flow rate 26.7 kg/s
Heat Exchanger Parameters HX type PCHE Unit length 0.6 m Unit width 1.5 m Unit height 0.6 m Channel diameter 1.6 mm Pitch-to-diameter ratio 1.5 Plate thickness-to-diameter ratio 1.33 Zigzag angles, hot and cold sides 90o, 45o Header length, each side 11 cm Pressure boundary thickness 17 mm HT region pressure drop as fraction of total pressure drop 80 %
HX core material Alloy 617
Since Table 4.1 already defines the hot side outlet temperature, the PCHE model has been modified to calculate the required HX volume, or number of HX units, to match the outlet temperature. (Previously, the model was configured to calculate outlet temperature for given number of HX units). In order to avoid round-up error in the analysis, the number of units is allowed to be non-integer in the results and on the graphs below. (In reality, the number of units should be rounded-up to the nearest integer).

74
Table 4.2 shows the results of the base case calculation. Figure 4.1 shows the calculated temperature profile inside the HX along the channel.
Table 4.2. Gas-to-gas base case results
Parameter Value Units HX total heat duty 45.062 MW Required number of HX units 19.408 Cold side outlet temperature 883 oC Hot side pressure drop 25.6 kPa Cold side pressure drop 43.7 kPa
550
600
650
700
750
800
850
900
950
0 0.05 0.1 0.15 0.2 0.25 0.3 0.35 0.4
Axial Position, m
Tem
pera
ture
, oC
Hot side
Cold Side
Figure 4.1. Temperature profiles for base case
4.1.1.1 Effect of Channel Diameter
In order to investigate the effect of the channel diameter on the IHX sizing and performance the channel diameter was varied while all other parameters were kept the same as defined in the base case above. Since input data specifies pitch-to-diameter and plate thickness-to-diameter ratios, actual channel pitch and plate thickness changed proportional to the channel diameter in this study. Figure 4.2 shows variation of the required HX volume and calculated pressure drop with channel diameter. Smaller channel diameter increases surface are per unit volume. Therefore, smaller HX volume is required to achieve the given heat duty. Thus, small channel diameter is preferred from the heat transfer point of view. At the same time, smaller channel diameter means higher flow velocities and, therefore, higher pressure drop. It follows from Figure 4.2 that the pressure drops on both sides fall below 50 kPa (which was specified as reference) at channel diameters grater than about 1.6 mm. For this reason, d=1.6 mm was selected for the base case above.

75
Effect of HX Channel Diameter
0
20
40
60
80
100
120
140
160
180
200
1 1.5 2 2.5 3
Channel Diameter, mm
Nu
mber
of
HX
u
nit
s
Effect of HX Channel Diameter
0.1
1
10
100
1000
10000
1 1.5 2 2.5 3
Channel Diameter, mm
Pre
ssu
re D
rop
, kP
a
dp_h
dp_c
Figure 4.2. Effect of PCHE channel diameter on HX size and pressure drop.
4.1.1.2 Effect of Channel Zigzag Angle
As it was indicated above, the PCHE technology allows variation of the zigzag channel angle as defined in Figure 2.4. Since the exact range of the angles is unknowna, it was assumed that the angle can be varied from 45o up to 90o. Beside this range, straight channel (α=0o) has been analyzed for comparison.
Figures 4.3 and 4.4 show the effect of the angle variation on the required HX volume and pressure drop. Again, the tradeoff between HX size and pressure drop exists. Larger zigzag angle increases heat transfer area resulting in better heat transfer, but also increases the channel length and pressure loss coefficient resulting in larger pressure drop. It follows from the Figure 4.2 that the hot side pressure drop is smaller than that of the cold side (due to higher pressure and, therefore, higher density and lower velocity). Therefore, the maximum zigzag angle (90o) was selected for hot side for the base case. On the cold side, 45o angle was selected to reduce the pressure drop.
a The zigzag angle is a part of the PCHE internal configuration which is proprietary information of Hetaric.

76
Effect of Hot Side Zigzag Angle
0
5
10
15
20
25
30
0 10 20 30 40 50 60 70 80 90
Zigzag Angle, deg
Nu
mber
of
HX
u
nit
s
Effect of Hot Side Zigzag Angle
1
10
100
0 10 20 30 40 50 60 70 80 90
Zigzag Angle, deg
Pre
ssu
re D
rop
, kP
a
dp_h
dp_c
Figure 4.3. Effect of PCHE hot side zigzag channel angle on HX size and pressure drop.

77
Effect of Cold Side Zigzag Angle
0
5
10
15
20
25
0 10 20 30 40 50 60 70 80 90
Zigzag Angle, deg
Nu
mber
of
HX
u
nit
s
Effect of Cold Side Zigzag Angle
1
10
100
1000
0 10 20 30 40 50 60 70 80 90
Zigzag Angle, deg
Pre
ssu
re D
rop
, kP
a
dp_h
dp_c
Figure 4.4. Effect of PCHE cold side zigzag channel angle on HX size and pressure drop.
4.1.1.3 Effect of other PCHE Internal Configuration Parameters
The other PCHE parameters (such as channel pitch-to-diameter ratio and plate thickness) presented in Table 4.1 could not be optimized based on the HX sizing and pressure drop. This is due to the fact that all thermal hydraulic characteristics are defined by flow rate through one channel, if channel geometry stays the same. Therefore, given heat duty defines the required number of channels. Thus, if pitch-to-diameter ratio is increased, for example, then proportionally larger HX volume would be required to accommodate the same number of channels. In case of the plate thickness, there would be additional effect of the increased thermal resistance of the plate. Therefore, from thermal hydraulic prospective, the smaller values of those parameters the

78
better. Those parameters should be defined from mechanical calculations. At this time, some reasonable values based on engineering judgment are assumed for the base case.
This section completes the optimization of the PCHE for the base case, gas-to-gas IHX. Below is presented the investigation of other external parameters on PCHE performance. In that further investigation, the PCHE configuration is fixed as defined in Table 4.1.
4.1.2 Effect of PCHE Construction Material
Several HX core (plate) materials have been investigated to see the effect on the PCHE thermal hydraulic performance. The considered list of the materials includes:
- Type 316 Stainless steel,
- Alloys 230, 617, 800H, and Hastelloy X,
- Silicon-based ceramics: αSiC, βSiC, and Si3N4.
Figure 4.5 shows the effect of the core material selection. Overall, ceramics materials required smaller HX volume due to higher thermal conductivity. At the same time, smaller HX volume leads to fewer channels increasing flow rate per channel and, therefore, pressure drop. Among the metals, the difference in HX performance is very small. This is due to the fact that for the analyzed conditions the thermal resistance of the plate in PCHE is about order of magnitude lower than the thermal resistance of the gas inside channels. Thus, variation of plate thermal conductivity has minimum effect on the overall thermal resistance. Even for the ceramics, where thermal conductivity is roughly twice that of the metals, the maximum benefit in HX size is only about 13% (~17 HX units for αSiC vs. ~19.5 HX units for alloy 230). Alloy 617 was selected for the base case simply based on expected better mechanical properties at those temperature conditions, and not on the thermal hydraulic HX performance.
4.1.3 Effect of Reactor Outlet Temperature
In this analysis, the reactor outlet (hot side IHX inlet) temperature has been varied in the range +100oC around the base case value. In order to keep the HX heat duty the same, the hot side outlet temperature has been changed too such that ΔT on hot side would be constant. Also, the temperature difference between hot and cold flow at cold side inlet has been kept constant. This approach provides that any change in HX performance is solely due to change in gas and metal properties, mainly thermal conductivity, and not due to changed heat duty, for example.
Figure 4.6 shows the effect of the IHX hot side inlet temperature on the IHX performance. Higher thermal conductivity at higher temperatures enhances heat transfer resulting in smaller required HX volume.
4.1.4 Effect of Intermediate Loop Pressure
In this study the intermediate loop (IHX cold side) pressure has been varied from 1 to 8 MPa. Figure 4.7 shows the effect of the pressure on the HX performance. Since the intermediate fluid (helium) is closely approximated by ideal gas at these conditions, its properties do not change much with pressure, except for the density. Therefore, the heat transfer HX performance does not change much with the pressure. The pressure drop, on the other hand, is mainly affected by the flow velocity, which is defined by the density. So, the cold side pressure drop changes significantly with the pressure.
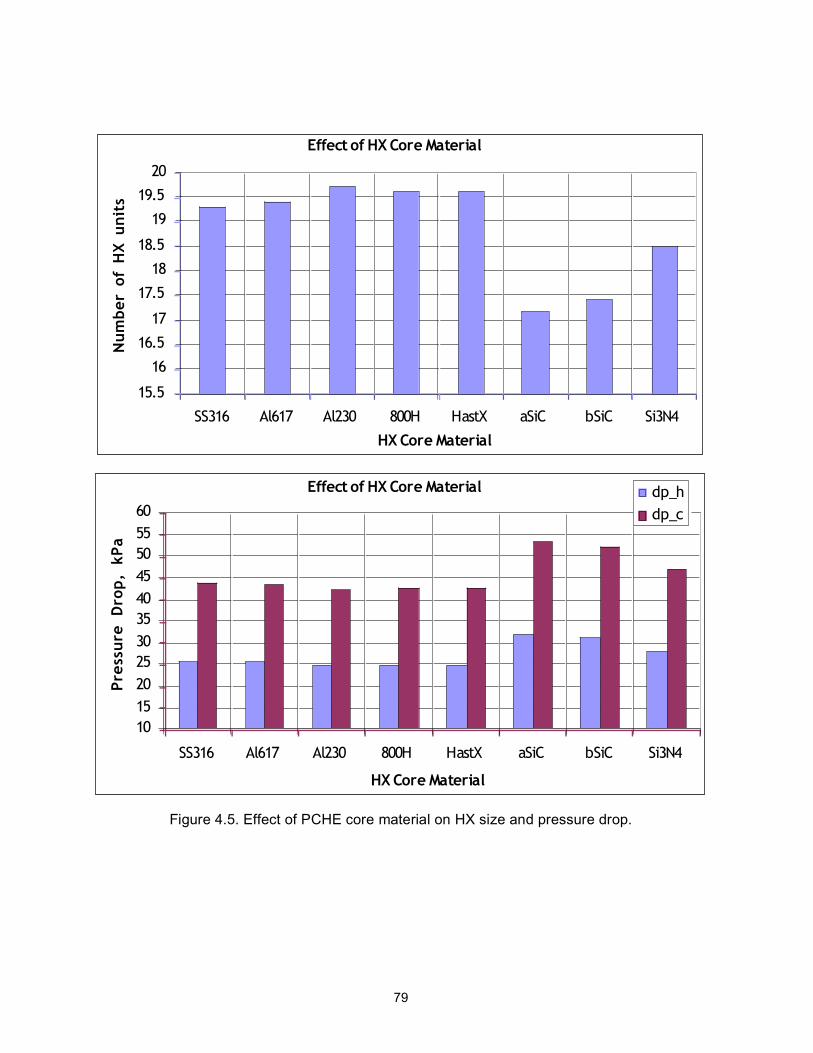
79
Effect of HX Core Material
15.5
16
16.5
17
17.5
18
18.5
19
19.5
20
SS316 Al617 Al230 800H HastX aSiC bSiC Si3N4
HX Core Material
Nu
mber
of
HX
u
nit
s
Effect of HX Core Material
10
15
20
25
30
35
40
45
50
55
60
SS316 Al617 Al230 800H HastX aSiC bSiC Si3N4
HX Core Material
Pre
ssu
re D
rop
, kP
a
dp_h
dp_c
Figure 4.5. Effect of PCHE core material on HX size and pressure drop.

80
Effect of Reactor Outlet Temperature
18
18.5
19
19.5
20
20.5
21
800 850 900 950 1000
Hot Side HX Inlet Temperature, oC
Nu
mber
of
HX
u
nit
s
Effect of Reactor Outlet Temperature
1
10
100
800 850 900 950 1000
Hot Side HX Inlet Temperature, oC
Pre
ssu
re D
rop
, kP
a
dp_h
dp_c
Figure 4.6. Effect of reactor outlet temperature on HX size and pressure drop.

81
Effect of Secondary Side Pressure
19.28
19.3
19.32
19.34
19.36
19.38
19.4
19.42
19.44
1 2 3 4 5 6 7 8
Cold Side HX Inlet Pressure, MPa
Nu
mber
of
HX
u
nit
s
Effect of Secondary Side Pressure
1
10
100
1 2 3 4 5 6 7 8
Cold Side HX Inlet Pressure, MPa
Pre
ssu
re D
rop
, kP
a
dp_h
dp_c
Figure 4.7. Effect of intermediate loop pressure on HX size and pressure drop.
4.1.5 Effect of Mass Flow Margin on IHX Heat Duty
As it was discussed above, the thermal hydraulic performance of the HX is defined by flow rate through one channel. Therefore, if the total flow rate through HX is changing, proportionally more or less channels would be required to achieve the same conditions of the flows. The HX heat duty would be changing proportional to the flow rate too, since the temperature conditions are the same (Q=mCpΔT). Thus, both HX size and heat duty are proportional to the flow rates, if the temperatures are fixed. The pressure drop would remain the same in this case.

82
The other approach to see the effect of the flow rate has also been investigated. In this case, the HX volume (number of units) has been fixed at base case value. The inlet temperatures of both flows have also been fixed at base case values. The flow rates were varied within +20% simultaneously on both sides. The outlet temperatures as well as HX heat duty has been calculated. Figures 4.8 and 4.9 show the results of the calculations. The IHX heat duty and pressure drops increase with the flow rate while temperature change on both sides decreases reflecting better heat transfer at low flow rates.
Effect of FLow Rate Margin
1
10
100
0.8 0.85 0.9 0.95 1 1.05 1.1 1.15 1.2
Flow Rate, fraction of nominal
Pre
ssu
re D
rop
, kP
a
dp_h
dp_c
Effect of FLow Rate Margin
0
10
20
30
40
50
60
0.8 0.85 0.9 0.95 1 1.05 1.1 1.15 1.2
Flow Rate, fraction of nominal
HX
Heat
Du
ty,
MW
Figure 4.8. Effect of flow rate variation on HX heat duty and pressure drop.

83
Effect of FLow Rate Margin
573
573.5
574
574.5
575
575.5
576
576.5
0.8 0.85 0.9 0.95 1 1.05 1.1 1.15 1.2
Flow Rate, fraction of nominal
Hot
Sid
e O
utl
et
Te
mp
era
ture
, oC
Effect of FLow Rate Margin
881.5
882
882.5
883
883.5
884
884.5
885
0.8 0.85 0.9 0.95 1 1.05 1.1 1.15 1.2
Flow Rate, fraction of nominal
Cold
Sid
e O
utl
et
Te
mp
era
ture
, oC
Figure 4.9. Effect of flow rate variation on outlet temperatures.
4.1.6 Effect of Nitrogen-Helium Mixture in Secondary Loop
In this study, the secondary loop fluid has been changed to the nitrogen-helium mixture (80%N2-20%He). The primary side conditions (fluid, flow rate, temperatures and inlet pressure) as well as HX parameters (number of units and configuration) has been fixed as for the base case above. The cold side inlet temperature was varied parametrically while the inlet pressure was fixed at 7 MPa. The code calculated the required N2-He mixture flow rate and outlet temperature, as well as pressure drops on both sides.

84
Figure 4.10 shows the results as a function of the cold side inlet temperature. The results could also be used in the following way. If secondary loop IHX outlet temperature is defined (say, 20 oC below primary loop IHX inlet or 880oC), then results in Figure 4.9 define the required mixture flow rate and inlet temperature (105 kg/s and 550oC in this example).
Effect of Cold Side Inlet Temperature
20
22
24
26
28
30
32
34
480 490 500 510 520 530 540 550 560 570 580
Cold Side HX Inlet Temperature, oC
Pre
ssu
re D
rop
, kP
a
dp_h
dp_c
Effect of Cold Side Inlet Temperature
840
850
860
870
880
890
900
480 490 500 510 520 530 540 550 560 570 580
Cold Side HX Inlet Temperature, oC
Cold
Sid
e O
utl
et
Te
mp
era
ture
, oC
Effect of Cold Side Inlet Temperature
80
85
90
95
100
105
110
115
120
125
130
480 490 500 510 520 530 540 550 560 570 580
Cold Side HX Inlet Temperature, oC
Cold
Sid
e F
Low
R
ate
, kg/
s
Figure 4.10. Results for nitrogen-helium mixture.

85
Figure 4.11 demonstrates how the temperature profiles are affected by the secondary fluid inlet temperature and flow rates. Three N2-He mixture inlet temperatures were selected from Figure 4.10 – 500, 550, and 570oC. The mixture flow rates were defined by Figure 4.9.
450
500
550
600
650
700
750
800
850
900
950
0 0.05 0.1 0.15 0.2 0.25 0.3 0.35 0.4
Axial Position, m
Tem
pera
ture
, oC
Hot side
Cold Side
450
500
550
600
650
700
750
800
850
900
950
0 0.05 0.1 0.15 0.2 0.25 0.3 0.35 0.4
Axial Position, m
Te
mp
era
ture
, oC
Hot side
Cold Side
450
500
550
600
650
700
750
800
850
900
950
0 0.05 0.1 0.15 0.2 0.25 0.3 0.35 0.4
Axial Position, m
Tem
pera
ture
, oC
Hot side
Cold Side
Figure 4.11. Temperature profiles for different inlet temperatures in nitrogen-helium mixture.

86
4.2 Shell-and-Tube IHX
The IHX gas-to-gas calculations were repeated for shell-and-tube HX. Table 4.3 shows the base case parameters and results of the calculations. Figures 4.12-4.21 show the results of the sensitivity analysis of different parameters on IHX performance, similar to those performed for PCHE. Table 4.4 shows the comparison between PCHE and shell-and-tube heat exchangers. The results for the shell-and-tube heat exchanger are reported for bare and finned tubes. Table 4.4 demonstrates the compactness of PCHE compared to shell-and-tube HX.
Table 4.3. Shell-and-Tube IHX Base Case Parameters and Results
Flow Conditions Value Units Hot side fluid He Hot side inlet temperature 900 oC Hot side outlet temperature 575 oC Hot side inlet pressure 7.0 MPa Hot side flow rate 26.7 kg/s Cold side fluid He Cold side inlet temperature 558 oC Cold side inlet pressure 1.95 MPa Cold side flow rate 26.7 kg/s
Heat Exchanger Parameters
HX type Shell-and-Tube
Tube length 6.0 m Tube inner diameter 10 mm Tube outer diameter 14 mm Pitch-to-diameter ratio 1.33 Number of fins on inner tube surface 0 Number of fins on outer tube surface 0 Tube side Hot He Tube material Alloy 617
Results HX total heat duty 45.062 MW Required number of tubes 174,800 Required shell diameter (1 unit) 8.175 m Cold side outlet temperature 883 oC Hot side pressure drop 0.052 kPa Cold side pressure drop 0.055 kPa

87
Effect of HX Tube Diameter
0
5
10
15
20
25
30
0.5 1 1.5 2 2.5 3
Tube Inner Diameter, cm
Sh
ell
D
iam
ete
r,
m
Effect of HX Tube Diameter
0.0001
0.001
0.01
0.1
1
0.5 1 1.5 2 2.5 3
Tube Inner Diameter, cm
Pre
ssu
re D
rop
, kP
a
dp_h
dp_c
Figure 4.12. Effect of tube diameter on shell-and-tube IHX performance.

88
Effect of HX Tube Length
0
5
10
15
20
25
1 2 3 4 5 6 7 8 9 10
Tube Length, m
Sh
ell
D
iam
ete
r,
m
Effect of HX Tube Length
0.001
0.01
0.1
1
1 2 3 4 5 6 7 8 9 10
Tube Length, m
Pre
ssu
re D
rop
, kP
a
dp_h
dp_c
Figure 4.13. Effect of tube length on shell-and-tube IHX performance.

89
Effect of Surface Fins
0
1
2
3
4
5
6
7
8
9
0 2 4 6 8 10 12
Number of Fins on Tube's Inner and Outer Surfaces
Sh
ell
D
iam
ete
r,
m
Effect of Inner Surface Fins
0.01
0.1
1
10
0 2 4 6 8 10 12
Number of Fins on Tube's Inner and Outer Surfaces
Pre
ssu
re D
rop
, kP
a
dp_h
dp_c
Figure 4.14. Effect of tube fins on shell-and-tube IHX performance.

90
Effect of Inner Surface Fins
0
1
2
3
4
5
6
7
8
9
0 2 4 6 8 10 12
Number of Fins on Tube's Inner Surface
Sh
ell
D
iam
ete
r,
m
Effect of Inner Surface Fins
0.01
0.1
1
0 2 4 6 8 10 12
Number of Fins on Tube's Inner Surface
Pre
ssu
re D
rop
, kP
a
dp_h
dp_c
Figure 4.15. Effect of tube inner surface fins on shell-and-tube IHX performance.

91
Effect of Outer Surface Fins
0
1
2
3
4
5
6
7
8
9
0 2 4 6 8 10 12
Number of Fins on Tube's Outer Surface
Sh
ell
D
iam
ete
r,
m
Effect of Outer Surface Fins
0.01
0.1
1
10
0 2 4 6 8 10 12
Number of Fins on Tube's Outer Surface
Pre
ssu
re D
rop
, kP
a
dp_h
dp_c
Figure 4.16. Effect of tube outer surface fins on shell-and-tube IHX performance.

92
Effect of HX Core Material
8.158
8.16
8.162
8.164
8.166
8.168
8.17
8.172
8.174
8.176
8.178
SS316 Al617 Al230 800H HastX aSiC bSiC Si3N4
HX Core Material
Sh
ell
D
iam
ete
r,
m
Effect of HX Core Material
0.05
0.0505
0.051
0.0515
0.052
0.0525
0.053
0.0535
0.054
0.0545
0.055
0.0555
SS316 Al617 Al230 800H HastX aSiC bSiC Si3N4
HX Core Material
Pre
ssu
re D
rop
, kP
a
dp_h
dp_c
Figure 4.17. Effect of tube material on shell-and-tube IHX performance.

93
Effect of Reactor Outlet Temperature
7.8
7.9
8
8.1
8.2
8.3
8.4
8.5
8.6
800 850 900 950 1000
Hot Side HX Inlet Temperature, oC
Sh
ell
D
iam
ete
r,
m
Effect of Reactor Outlet Temperature
0.01
0.1
1
800 850 900 950 1000
Hot Side HX Inlet Temperature, oC
Pre
ssu
re D
rop
, kP
a
dp_h
dp_c
Figure 4.18. Effect of reactor outlet temperature on shell-and-tube IHX performance.

94
Effect of Secondary Side Pressure
8.155
8.16
8.165
8.17
8.175
8.18
1 2 3 4 5 6 7 8
Cold Side HX Inlet Pressure, MPa
Sh
ell
D
iam
ete
r,
m
Effect of Secondary Side Pressure
0.01
0.1
1
1 2 3 4 5 6 7 8
Cold Side HX Inlet Pressure, MPa
Pre
ssu
re D
rop
, kP
a
dp_h
dp_c
Figure 4.19. Effect of intermediate loop pressure on shell-and-tube IHX performance.

95
Effect of FLow Rate Margin
0.01
0.1
1
0.8 0.85 0.9 0.95 1 1.05 1.1 1.15 1.2
Flow Rate, fraction of nominal
Pre
ssu
re D
rop
, kP
a
dp_h
dp_c
Effect of FLow Rate Margin
0
10
20
30
40
50
60
0.8 0.85 0.9 0.95 1 1.05 1.1 1.15 1.2
Flow Rate, fraction of nominal
HX
Heat
Du
ty,
MW
Figure 4.20. Effect of flow rate variation on shell-and-tube IHX performance.
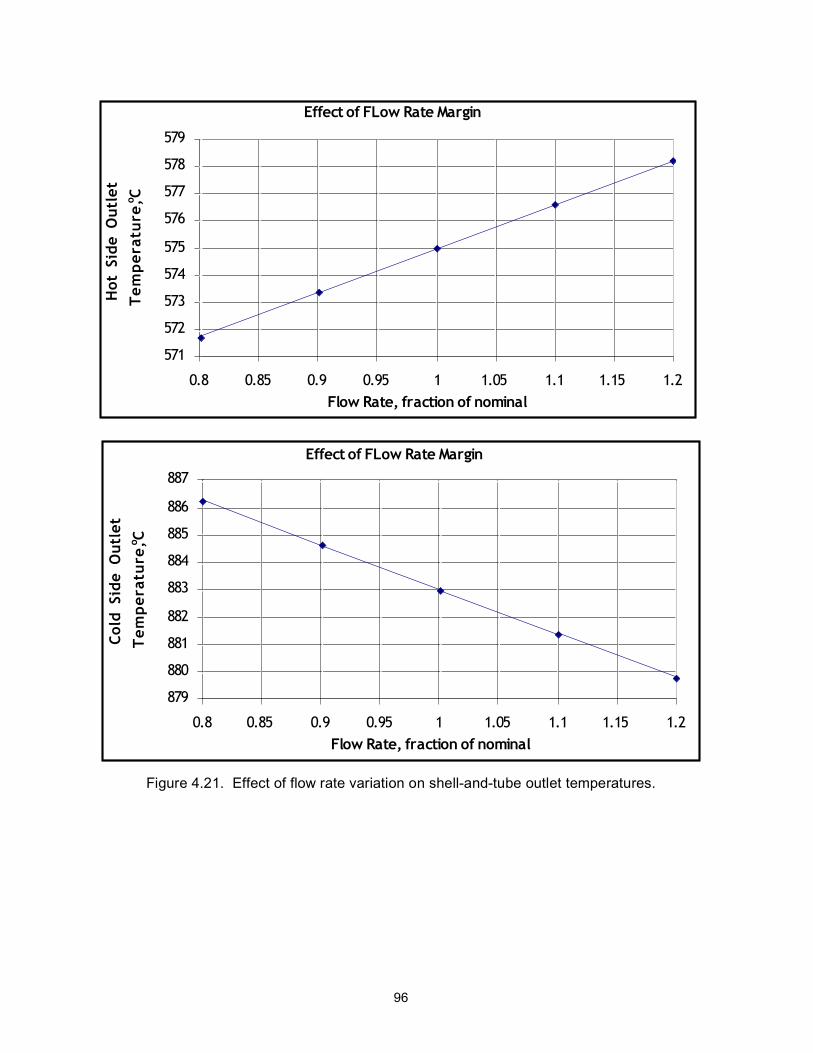
96
Effect of FLow Rate Margin
571
572
573
574
575
576
577
578
579
0.8 0.85 0.9 0.95 1 1.05 1.1 1.15 1.2
Flow Rate, fraction of nominal
Hot
Sid
e O
utl
et
Te
mp
era
ture
, oC
Effect of FLow Rate Margin
879
880
881
882
883
884
885
886
887
0.8 0.85 0.9 0.95 1 1.05 1.1 1.15 1.2
Flow Rate, fraction of nominal
Cold
Sid
e O
utl
et
Te
mp
era
ture
, oC
Figure 4.21. Effect of flow rate variation on shell-and-tube outlet temperatures.

97
Table 4.4. Comparison of PCHE and shell-and-tube IHX designs.
Shell-and-Tube Heat Exchanger Type PCHE
Unit dimensions 0.6 m (L) x 1.5 m (W) x 0.6 m (H)
6 m (L) x 8.17 m (D)
6 m (L) x 3.31 m (D)
Number of units 19.408 1 1
Total HX volume, m3 10.5 314.5 51.6
Pressure drop, hot/cold sides, kPa 25.6 43.7
0.05 0.05
3.2 3.7

98

99
5. Stress Calculations in Gas-to Gas IHX
5.1 Compact IHX
Thermal and stress analyses of a three-dimensional honeycomb structure like the compact IHX are highly complex. Further, Subsection NH of the ASME Code, whose rules were developed for shell-like structures, does not apply directly to three-dimensional structures like the compact IHX. Both analyses and design tools have to be developed for the compact IHX in the future if it becomes a serious option for the NGNP.
For the purpose of the present report, a 0.38 m long (excluding the 0.11 m long header regions at the inlet and outlet ends) unit cell of the compact IHX core is considered. Half of the cross-section of a repeating unit cell from the reference geometry used in the analysis is shown in Fig. 5.1. Semi-circular hot and cold coolant channels have 1.6 mm diameter. The channels were considered to be straight (without zigzag). The hot (and cold) channels have a spacing of 2.56 mm and the hot and cold channels have a spacing of 2.133 mm. The base case with the reactor outlet temperature of 900°C, the reactor outlet pressure of 7 MPa, and the intermediate loop pressure of 2 MPa is considered for stress analysis. First, a steady-state thermal conduction analysis was carried out using the heat fluxes for both the hot and cold channels as a function of axial location reported in Section 4.1.1. Next stress analyses were conducted with and without thermal stress contribution.
Figure 5.1. Half of the cross-section of a repeating unit cell of the compact IHX.
5.1.1 Thermal Conduction Analysis
The structural material considered was Alloy 617 whose thermal conductivity was input as a function of temperature in the finite element code (ABAQUS). Although the HTC and gas temperature data were calculated at 71 axial locations in Section 4.1.1, in the FEA, the total length of the compact IHX was divided into 11 sections and average values of the HTC and gas temperature were used in each section.

100
The FEA-calculated distribution of temperatures at the hot and cold ends of the IHX are plotted in Figs. 5.2 and 5.3, respectively. Note that the temperature gradient at each end from the hottest to the coldest point is small (≈5°C). However, there is a large axial temperature gradient from the hot to the cold end, as expected. The maximum and minimum structure temperatures are 882 and 570°C, respectively. For comparison, the average structure temperatures at the hot end calculated by the thermal hydraulics analysis are 897°C for the hot channel and 880°C for the cold channel. The corresponding structure temperatures at the cold end are 578 and 561°C, respectively. Figure 5.4 gives the temperature distribution at an interior section (z=0.24 m).
Figure 5.2. Temperature distribution in the compact IHX at the hot end.
Figure 5.3. Temperature distribution in the compact IHX at the cold end.

101
Figure 5.4. Temperature distribution at an interior section (z=0.24 m) of the compact IHX.
5.1.2 Stress Analyses
Two stress analyses, both assuming linear elastic behavior, were conducted using the finite element code ABAQUS. First, a primary (pressure) stress analysis was conducted without any contribution from thermal stresses. Second, a secondary (thermal) stress analysis was conducted without the pressure stresses. In the second analysis, the temperature data calculated in the thermal conduction analysis (Section 5.1.1) were input into the ABAQUS code. In both cases, the axial displacement (uz) was set equal to zero at one end (z=0) and generalized plane strain deformation (i.e., uz=constant) was assumed at the other end. Similar boundary conditions were used at the other symmetry planes, e.g., zero ux displacements at x=0 and ux=constant at the other symmetry plane, and so on for the y displacements. Although a periodic boundary condition would be more appropriate, the present approach should give conservative results.
5.1.2.1 Primary Stress Analysis
The primary stress distribution at either end of the IHX is identical and is shown in Fig. 5.5. The stresses are higher near the hot channel than in the cold channel because the pressure in the hot channel is 7 MPa and the pressure in the cold channel is 1.9 MPa. The maximum von Mises effective stress is 22 MPa which occurs locally at the edge of the hot coolant channel. A slightly higher maximum stress (22.5 MPa) occurs at a section in the middle. However, most of the structure is under relatively low stress. There is little variability in the stress distribution along the length of the IHX. Note that the peak stress is not relevant for satisfying ASME primary stress requirements, as will be discussed later.

102
Figure 5.5. Distribution of primary (pressure) von Mises effective stress at either end of the compact IHX.
5.1.2.2 Secondary Stress Analysis
The distribution of effective von Mises stress at the hot and cold ends of the IHX due to thermal loading alone are plotted in Figs. 5.6 and 5.7, respectively. A peak stress of 52 MPa occurs at the periphery of the hot channel where the temperature is 880°C. The peak stress at the cold end is 116 MPa, which also occurs at the periphery of the hot channel (Fig. 5.7) where the temperature is 565°C (Fig. 5.3). In the interior, shown in Fig. 5.8, a maximum stress of 66 MPa occurs at the periphery of the hot channel where the temperature is 664°C (Fig. 5.4).
Figure 5.6. Distribution of von Mises effective stress due thermal loading at the hot end of the IHX.

103
Figure 5.7. Distribution of von Mises effective stress due to thermal loading at the cold end of the IHX.
Figure 5.8. Distribution of von Mises effective stress due to thermal loading at an interior section (z=0.24 m).
5.1.3 ASME Code Compliance Calculations
Since the IHX operates in a high temperature environment where creep deformation is important, Subsection NH of ASME Code, Section III is applicable. However, there are several problems with applying ASME Section III code rules to the compact IHX structure. First, the use of the primary candidate structural Alloy 617 is currently not approved in Subsection NH. There is a draft Code Case (still unapproved) for designs using Alloy 617. The draft Code Case was patterned after relevant portions of Subsection NH, and limited to Alloy 617, temperature of 982°C (1800°F), and maximum service life [total life at temperatures above 427°C (800°F)] of 100,000 h or less. However, the ratcheting rules in the draft Code Case is limited to a maximum temperature of 649°C. The draft Code Case focused on Alloy 617 because it was a leading candidate high-temperature structural material, and there was a significant material properties database at the temperature of interest. We have used the allowable stress values from this draft Code Case for the present report. Second, there is an additional problem because the code rules

104
were formulated for shell-type structures in which one of the dimensions (thickness) is much smaller than the other two. In contrast, the compact IHX is a three-dimensional honey combed structure in which there is no unique way of determining membrane and bending stresses, the limits on which form the bases of many of the Code rules.
In the absence of any guidance on designing these kinds of structures, we have made some ad hoc assumptions to define the membrane and bending stresses by taking advantage of the thinness of the walls separating the channels.
5.1.3.1 Primary Stress Limits
A basic high temperature primary stress limit is Smt, which is the lesser of Sm and St, and is a function of both time and temperature. For nickel-based alloys, Sm is basically defined as follows:
Sm= min
1
3S
u
2
3S
y
!
"##
$##
(5.1)
where Su is the lesser of ultimate tensile strength at temperature and the minimum ultimate tensile strength at room temperature, Sy is the lesser of yield strength at temperature and the minimum yield strength at room temperature. For each specific time t and temperature T, St is defined as the least of the following three stresses:
(1) 100% of the average stress required to obtain a total (elastic, plastic, and creep) strain of 1%,
(2) 80% of the minimum stress to cause initiation of tertiary creep, and (5.2)
(3) 67% of the minimum stress to cause rupture.
In the draft code case for Alloy 617, the condition (2) above is dropped because nickel alloys do not exhibit classical (i.e., primary, secondary, and tertiary) creep behavior. The reported Sm and St values for Alloy 617 are plotted in Fig. 5.9.
0
50
100
150
200
250
300 400 500 600 700 800 900 1000
Sm
or
St (
MP
a)
T (°C)
Sm
10 h
102 h
103 h
104 h
105 h
Figure 5.9. Variation of Sm and St of Alloy 617 with temperature and time.

105
To apply the code rules for primary stresses, primary membrane and bending stresses have to be determined first. To do this, we have plotted the variation of the von Mises effective stress along a path across the hot channel-to-hot channel ligament and another path across the hot channel-to-cold channel in Figs. 5.10 a-b, respectively. These variations of stress remain practically unchanged at any section of the IHX along the length. The membrane and equivalent linear stress distributions were calculated by equating the total force and bending moment of the actual stress distribution to those of the membrane and the equivalent linear stress distributions. This approach allows us to define the primary membrane Pm (and PL) and primary bending stress Pb. Due to symmetry, the hot channel-to-hot channel ligament do not experience any primary bending stress. Note that although the peak stresses do not control the rupture time of the ligaments, they will have an influence on the creep-fatigue life of the IHX.
6
8
10
12
14
16
18
20
22
-0.0002 0 0.0002 0.0004 0.0006 0.0008 0.001
Actual stress variation
Membrane
von M
ises E
ffective S
tress (
MP
a)
Distance (m) (a)
-5
0
5
10
15
20
-0.0005 0 0.0005 0.001 0.0015
Actual stress variation
Equivalent linear
Membrane
von M
ises E
ffective S
tress (
MP
a)
Distance (m) (b)
Figure 5.10. Variation of von Mises effective stress along a path across the (a) hot channel-to-hot channel ligament and (b) hot channel-to-cold channel ligament at the hot end of the IHX. Also shown are the membrane and equivalent linear stress distributions.
The ASME Code (Subsection NH) requires that for normal operation and upset conditions (Service Levels A and B loadings)
Pm ≤ Smt , (5.3)
PL + Pb ≤ KSm, and (5.4)
PL + Pb/Kt ≤ St (5.5)
where Kt accounts for relaxation of extreme fiber bending stress due to creep. The factor is given by
Kt = (K+1)/2 (5.6)
where K is the bending shape factor. For solid rectangular sections, K=1.5. However, for a hollow section like the compact IHX, it should be < 1.5. To be conservative, we have assume K=1. The calculated values of Pm and PL + Pb for the two paths considered in Figs 5.10a-b are plotted on the allowable stress intensities vs. time and temperature plot for Alloy 617 in Fig. 5.11a-b, respectively. It is evident that the PL + Pb limit is the controlling criterion for life of the hot-to-cold channel ligament. The maximum allowable design lives of the hot channel-to-hot channel and the hot channel-to-cold channel ligaments are 80,000 and 90,000 h, respectively, for the assumed reactor outlet conditions. These design lives are based on design curves given in the

106
draft Code Case for Alloy 617 and may have to be reduced if thickness effects are taken into account.
0
20
40
60
80
100
600 650 700 750 800 850 900 950 1000
Pm
Pm
, S
m o
r S
t (M
Pa)
T (°C)
Sm
10 h
102 h
103 h
104 h
105 h
(a)
0
20
40
60
80
100
600 650 700 750 800 850 900 950 1000
Pm
PL+P
b
Pm
, P
L+
Pb,
Sm
or
St (
MP
a)
T (°C)
Sm
10 h
102 h
103 h
104 h
105 h
(b)
Figure 5.11 Calculated Pm and PL + Pb values along paths across the (a) hot channel-to-hot channel ligament and (b) hot channel-to-cold channel ligament for the IHX plotted on the allowable stress intensities vs. temperature and time curves for Alloy 617.
Diffusion Bonded Joint
If the IHX is fabricated by diffusion bonding, the bond strength may become the controlling factor for life. The distributions of the von Mises effective stress along the diffusion joint and the stress normal to the joint are plotted in Fig. 5.12a. Although the integrated net force due to the normal stress across the joint is zero, the von Mises effective stress is relatively constant. Also, half of the joint is under normal tensile stress, which is balanced by compressive stress on the other half. The average value of the von Mises stress is plotted on the allowable stress intensities vs. time and temperature plot for Alloy 617 in Fig. 5.12b. Currently, we have no data on the high temperature creep rupture properties of diffusion-bonded Alloy 617 plates. If the bond strength is as good or better than the base material, the design life of the joint is > 105 h.
-8
-6
-4
-2
0
2
4
6
-0.0005 0 0.0005 0.001 0.0015
von Mises Efective stress
Normal Stress
Str
ess (
MP
a)
Distance Along the Diffusion Bonded Joint (m) 0
20
40
60
80
100
600 650 700 750 800 850 900 950 1000
Pm
Pm
, S
m o
r S
t (M
Pa
)
T (°C)
Sm
10 h
102 h
103 h
104 h
105 h
(a) (b)
Figure 5.12 (a) Variation of von Mises effective stress along a path on the diffusion joint and (b) the primary membrane stress intensity Pm and the allowable stress intensities vs. temperature and time curves for Alloy 617.

107
5.1.3.2 Primary Plus Secondary Stress Limit
The primary plus secondary stress limits were checked at three sections: the hot end, the cold end and an intermediate section at z=0.25 m. A summary of the stresses at these locations is given in Table 5.1.
Table 5.1 Summary of primary and secondary stresses in the IHX at three axial locations.
Location PL + Pb (MPa)
Q (MPa)
T (°C)
Sy (MPa)
X Y
Cold end 22 116 570 238 0.09 0.49
z=0.24 m 22 66 665 238 0.09 0.28
Hot end 22 52 880 220 0.10 0.24
Ratcheting Limit
One of the available tests in Subsection NH for satisfying the ratcheting strain limit is Test no A2.
Test No. A2
X + Y ≤ 1 (5.7)
for those cycles during which the average wall temperature at one of the stress extremes defining the maximum cyclic primary plus secondary stress range is below the temperature where creep is negligible. In Eq. 5.7,
X=(PL + Pb)/Sy or Pm/Sy and Y=Q/Sy where Q=secondary stress intensity range.
Assuming that the low temperature end of the temperature cycle is below the creep range, it can be verified that Test No. A2 is satisfied for all three locations considered in Table 5.1. However, according to the draft code case for Alloy 617, the behavior of Alloy 617 above 650°C is such that simple ratcheting rules like Test No A2 may not be applicable. New rules are needed in this temperature range.
Creep-Fatigue Limit
Creep-fatigue life of the IHX will be influenced by the peak stresses due to the stress concentration effects of the coolant channels. The creep and fatigue curves given in the draft code case do not include the effects of impure helium environment. Further, creep-fatigue test data are not available on diffusion bonded Alloy 617. Currently the design fatigue cycles for the IHX are not well established and therefore, fatigue and creep-fatigue life analyses were not performed.
5.2 Shell and Tube IHX
In contrast to the compact IHX, the shell and tube design is relatively easy to analyze. The effect of the tube end conditions , which will add some complications to the analyses, is ignored for the present. We have analyzed the base case for the reference deign of the shell and tube

108
IHX which consists of 6-m long, 10-mm ID, and 14-mm OD Inco Alloy 617 tubes arranged in a triangular lattice inside a shell. The reactor outlet temperature and pressure are 900°C, and 7 MPa, respectively and the secondary side pressure is 1.95 MPa and the inlet cold temperature is 575°C.
5.2.1 Primary Stresses
The membrane primary stress (Pm) due to the base case primary and secondary side pressures is 12.6 MPa and the maximum average wall temperature 888°C. The membrane plus bending primary stress (PL + Pb) at ID surface is 13.6 MPa and the peak temperature at this location is 896°C. The calculated values of Pm and PL + Pb are plotted on the allowable stress intensities vs. time and temperature plot for Alloy 617 in Fig. 5.13. It is evident that the PL + Pb limit is the controlling criterion for life and the maximum allowable design life for the shell and tube IHX is 20,000 h for the assumed reactor outlet conditions. This design life is significantly greater than that of the compact IHX for the same reactor outlet conditions.
0
20
40
60
80
100
600 650 700 750 800 850 900 950 1000
Pm
PL+P
b
Pm
, PL+
Pb,
Sm
or
St (
MP
a)
T (°C)
Sm
10 h
102 h
103 h
104 h
105 h
Figure 5.13. Calculated Pm and PL + Pb values for the shell and tube IHX plotted on the allowable stress intensities vs. temperature and time curves for Alloy 617.
5.2.2 Primary and Secondary Stresses
Variation of the primary membrane plus bending (PL + Pb) and maximum secondary stress intensities (Q) in the tube at all axial locations is shown in Fig. 5.14.
10
15
20
25
30
35
-1 0 1 2 3 4 5 6 7
Str
ess Inte
nsitie
s (
MP
a)
z (m)
Secondary Stress Intensity (Q)
PL+P
b
Figure 5.14. Variation of PL + Pb and Q along the length of the tube.

109
Ratcheting Limit
As in Section 5.1.3.2, assuming that the low temperature end of the temperature cycle is below the creep range, Test No. A2 (Eq. 5.7) is applied. A plot of the variation of the value of X+Y and average temperature with axial location is plotted in Fig. 5.15 which shows that Test A2 (Eq. 5.7) is satisfied at all axial locations.
0.188
0.19
0.192
0.194
0.196
0.198
0.2
0.202
0.204
550
600
650
700
750
800
850
900
-1 0 1 2 3 4 5 6 7
X+
Y
Ave
rag
e T
(°C)
z (m)
Figure 5.15. Variation of X + Y and average T along the length of the tube.
5.3 Discussions and Conclusions
Preliminary thermal and stress analyses have been conducted for the compact gas-to-gas IHX and the shell and tube gas-to-gas IHX. The compact IHX structure is significantly more difficult to analyze and design than the shell and tube structure. In particular, design rules of Subsection NH of the ASME Code, which were developed for shell like structures like the shell and tube design, are not strictly applicable to the complex three-dimensional structure of the compact IHX. New analyses tools and design rules are needed for this type of structure. One possibility is to replace the complicated honey combed core structure by an equivalent homogeneous, anisotropic structure, conduct the thermal conduction and stress analyses first at a macro level and then follow up with a more detailed analyses at a micro level using the results from the macro analyses to form the boundary conditions for the micro analyses. The header regions have to be included in the analyses, because interaction between the core structure and the header regions may lead to high local stresses.
Approximate analyses of simplified geometries of the core region of both designs conducted in this report show that both designs, using Alloy 617 as the structural material, satisfy the primary stress and ratcheting stress limits for the base case. However, it should be noted that the ratcheting rules in the Draft Code Case for Alloy 617 are limited to temperatures <650°C, which is violated in the base case. Therefore, new ratcheting rules are needed for the IHX.
For a reactor outlet temperature and pressure of 900°C and 7 MPa, respectively, and a secondary side inlet temperature and pressure of 575°C and 1.95 MPa, respectively, the allowable design life (based on in-air tensile and creep rupture strengths of Alloy 617) is 80,000 h for the hot channel-to-hot channel ligament and 90,000 h for the hot channel-to-cold channel ligament of the compact IHX. If the tensile and creep rupture properties of the diffusion bonded joint are as good or better than those of the base metal Alloy 617, its design life would be >105 h. Tests are needed to verify that the tensile, creep and creep-fatigue strengths of the diffusion bonded Alloy 617 joints used in the compact IHX are adequate. The design life of the shell and

110
tube IHX is 20,000 h. These calculations are based on analyses of the IHX core; further reduction in life may result from interaction of the core region with the header regions, which was not included in the present analyses.
It should be noted that the above lifetimes are based on creep rupture data of Alloy 617 in air. If tests show that exposure to high temperature impure helium leads to significant reduction of creep rupture life compared to that in air, the design lifetimes will be reduced. The design lives may also have to be reduced to account for thickness effect.
Alloy 230 is a potential alternate material for the IHX. Comparison of the yield and tensile strengths of Alloy 230 and Alloy 617 (Fig. 5.16a) shows that at high temperatures both materials have almost identical strengths. Comparison of creep rupture strengths (Fig. 5.16b) shows that both materials have similar rupture properties except at 982 and 649°C and long times when Alloy 617 is superior to Alloy 230. Thus, replacing Alloy 617 with Alloy 230 as the structural material for IHX will not lead to longer design lifetime for the IHX.
0
200
400
600
800
1000
200 400 600 800 1000 1200
Yie
ld a
nd T
ensile
Str
ength
(M
Pa)
Temperature (°C)
Ultimate Tensile Strength
Yield Strength
617
617
230
230
10
110
210
310
410
5
101
102
103
Time to rupture (h)
Str
ess (
MP
a) 649°C
760°C
815°C
871°C
982°C
Open symbols: Alloy 230Closed symbols: Alloy 617
(a) (b)
Figure 5.16. Comparison of (a) yield and ultimate tensile strengths and (b) creep rupture strengths of Alloys 617 and 230.

111
6. Gas-to-Molten Salt IHX Calculations
6.1 Base Case
In this study the secondary helium was replaced with molten salt LiF-NaF-KF (FliNaK). The conditions of the primary helium remain the same. Also the IHX configuration for the base case is that defined in Table 4.1 for gas-to-gas base case (including utilization of PCHE technology). Gas-to-salt base case parameters as well as the results are presented in Table 6.1 in comparison with gas-to-gas base case.
Table 6.1. Gas-to-Salt Base Case
Secondary fluid He FLiNaK Primary He inlet temperature, oC 900 Primary He inlet pressure, MPa 7 Primary He flow rate, kg/s 26.7 Primary He outlet temperature, oC 575 Secondary fluid inlet temperature, oC 558 558 Secondary fluid inlet pressure, MPa 1.95 2 Secondary fluid flow rate, kg/s 26.7 72.2 IHX heat duty, MW 45.062 45.062 Number of PCHE units 19.408 66.035 Primary side pressure drop, kPa 25.618 2.819 Secondary side pressure drop, kPa 43.72 0.07 Secondary fluid outlet temperature, oC 883 889.3
6.2 Sensitivity Study
6.2.1 6.2.1 Salt Flow Rate Variation
The effect of different parameters on the gas-to-salt IHX performance has been investigated in the similar manner as for gas-to-gas described above. The only exception is that the salt flow rate is considered an independent variable. Figure 6.1 shows the effect of the salt flow rate variation.
The effect of different parameters on the gas-to-salt IHX performance has been investigated in the similar manner as for gas-to-gas described above. The only exception is that the salt flow rate is considered an independent variable. Figure 6.1 shows the effect of the salt flow rate variation.

112
Effect of Salt Flow Rate
1
10
100
1000
10000
70 75 80 85 90
Salt Flow Rate, kg/s
Nu
mber
of
HX
u
nit
s
Effect of Salt Flow Rate
0.0001
0.001
0.01
0.1
1
10
100
1000
70 75 80 85 90
Salt Flow Rate, kg/s
Pre
ssu
re D
rop
, kP
a
dp_h
dp_c
Effect of Salt Flow Rate
810
820
830
840
850
860
870
880
890
900
910
70 75 80 85 90
Salt Flow Rate, kg/s
Salt
O
utl
et
Te
mp
era
ture
, oC
Figure 6.1. Salt flow rate effect.

113
6.2.2 Variation of other parameters
Variation of other parameters (such as channel diameter) has been carried out for the gas-to-salt case in the same manner as for gas-to-gas case. Figures 6.2 – 6.9 show the results of parameters variation as described in Sections 4.1.1.1-4.1.5 and presented in Figures 4.2 – 4.9.
Effect of HX Channel Diameter
0
100
200
300
400
500
600
700
800
1 1.5 2 2.5 3
Channel Diameter, mm
Nu
mber
of
HX
u
nit
s
Effect of HX Channel Diameter
0.0001
0.001
0.01
0.1
1
10
100
1000
1 1.5 2 2.5 3
Channel Diameter, mm
Pre
ssu
re D
rop
, kP
a
dp_h
dp_c
Figure 6.2. Effect of PCHE channel diameter on HX size and pressure drop for gas-to-salt case.

114
Effect of Hot Side Zigzag Angle
0
10
20
30
40
50
60
70
80
90
0 10 20 30 40 50 60 70 80 90
Zigzag Angle, deg
Nu
mber
of
HX
u
nit
s
Effect of Hot Side Zigzag Angle
0.01
0.1
1
10
0 10 20 30 40 50 60 70 80 90
Zigzag Angle, deg
Pre
ssu
re D
rop
, kP
a
dp_h
dp_c
Figure 6.3. Effect of PCHE hot side zigzag channel angle on HX size and pressure drop for gas-to-salt case.

115
Effect of Cold Side Zigzag Angle
0
10
20
30
40
50
60
70
80
0 10 20 30 40 50 60 70 80 90
Zigzag Angle, deg
Nu
mber
of
HX
u
nit
s
Effect of Cold Side Zigzag Angle
0.01
0.1
1
10
0 10 20 30 40 50 60 70 80 90
Zigzag Angle, deg
Pre
ssu
re D
rop
, kP
a
dp_h
dp_c
Figure 6.4. Effect of PCHE cold side zigzag channel angle on HX size and pressure drop for gas-to-salt case.

116
Effect of HX Core Material
61
62
63
64
65
66
67
SS316 Al617 Al230 800H HastX aSiC bSiC Si3N4
HX Core Material
Nu
mber
of
HX
u
nit
s
Effect of HX Core Material
0.01
0.1
1
10
SS316 Al617 Al230 800H HastX aSiC bSiC Si3N4
HX Core Material
Pre
ssu
re D
rop
, kP
a
dp_h
dp_c
Figure 6.5. Effect of PCHE core material on HX size and pressure drop for gas-to-salt case.

117
Effect of Reactor Outlet Temperature
0
10
20
30
40
50
60
70
80
90
100
800 850 900 950 1000
Hot Side HX Inlet Temperature, oC
Nu
mber
of
HX
u
nit
s
Effect of Reactor Outlet Temperature
0.01
0.1
1
10
800 850 900 950 1000
Hot Side HX Inlet Temperature, oC
Pre
ssu
re D
rop
, kP
a
dp_h
dp_c
Figure 6.6. Effect of reactor outlet temperature on HX size and pressure drop for gas-to-salt case

118
Effect of Secondary Side Pressure
0
10
20
30
40
50
60
70
1 2 3 4 5 6 7 8
Cold Side HX Inlet Pressure, MPa
Nu
mber
of
HX
u
nit
s
Effect of Secondary Side Pressure
0.01
0.1
1
10
1 2 3 4 5 6 7 8
Cold Side HX Inlet Pressure, MPa
Pre
ssu
re D
rop
, kP
a
dp_h
dp_c
Figure 6.7. Effect of intermediate loop pressure on HX size and pressure drop for gas-to-salt case.

119
Effect of FLow Rate Margin
0.01
0.1
1
10
0.8 0.85 0.9 0.95 1 1.05 1.1 1.15 1.2
Flow Rate, fraction of nominal
Pre
ssu
re D
rop
, kP
a
dp_h
dp_c
Effect of FLow Rate Margin
0
10
20
30
40
50
60
0.8 0.85 0.9 0.95 1 1.05 1.1 1.15 1.2
Flow Rate, fraction of nominal
HX
Heat
Du
ty,
MW
Figure 6.8. Effect of flow rate variation on HX heat duty and pressure drop for gas-to-salt case.

120
Effect of FLow Rate Margin
573.5
574
574.5
575
575.5
576
576.5
0.8 0.85 0.9 0.95 1 1.05 1.1 1.15 1.2
Flow Rate, fraction of nominal
Hot
Sid
e O
utl
et
Te
mp
era
ture
, oC
Effect of FLow Rate Margin
888
888.5
889
889.5
890
890.5
0.8 0.85 0.9 0.95 1 1.05 1.1 1.15 1.2
Flow Rate, fraction of nominal
Cold
Sid
e O
utl
et
Te
mp
era
ture
, oC
Figure 6.9. Effect of flow rate variation on outlet temperatures for gas-to-salt case.

121
7. Summary
The NGNP, which is an advanced HTGR concept with emphasis on both electricity and hydrogen production, involves helium as the coolant and a closed-cycle gas turbine for power generation with a core outlet/gas turbine inlet temperature of 900-1000*C. In the indirect cycle system, an intermediate heat exchanger is used to transfer the heat from primary helium from the core to the secondary fluid, which can be helium, nitrogen/helium mixture, or a molten salt. The system concept for the VHTR can be a reactor based on the prismatic block of the GT-MHR developed by a consortium led by General Atomics in the U.S. or based on the PBMR design developed by ESKOM of South Africa and British Nuclear Fuels of U.K.
This report has made a preliminary assessment on the issues pertaining to IHX for the NGNP. Two IHX designs namely, shell and tube and compact heat exchangers were considered in the assessment. Printed circuit heat exchanger, among various compact HX designs, was selected for the analysis. Irrespective of the design the material considerations for the construction of the HX are essentially similar, except may be in the fabrication of the units. As a result, we have reviewed in detail the available information material property data relevant for the construction of HX and made a preliminary assessment of several relevant factors to make a judicious selection of the material for the IHX.
The assessment included four primary candidate alloys namely, Alloy 617 (UNS N06617), Alloy 230 (UNS N06230), Alloy 800H (UNS N08810), and Alloy X (UNS N06002) for the IHX. Some of the factors addressed in this report are the tensile, creep, fatigue, creep fatigue, toughness properties for the candidate alloys, thermal aging effects on the mechanical properties, ASME Code compliance information, and performance of the alloys in helium containing a wide range of impurity concentrations.
A detailed thermal hydraulic analysis, using a model developed at ANL, was performed to calculate heat transfer, temperature distribution, and pressure drop inside both printed circuit and shell-and-tube heat exchangers. The analysis included evaluation of the role of key process parameters, geometrical factors in HX designs, and material properties. Calculations were performed for Helium-to-helium, helium-to–helium/nitrogen, and helium-to-salt HXs. The IHX being a high temperature component, probably needs to be designs using ASME Code Section III, Subsection NH, assuming that the IHX will be classified as a class 1 component. With input from thermal hydraulic calculations performed at ANL, thermal conduction and stress analyses for both compact and shell-and-tube HXs were performed.
Several conclusions were drawn from this assessment:
• In general, majority of materials research and development programs in support of HTGRs were conducted in the 1960s to early 1980s. The thrust of these programs was to develop a database on materials for application in steam-cycle and process-nuclear-heat based HTGRs. Very little work was done on materials with emphasis on direct and/or indirect gas-turbine-based (of interest for iIHX in NGNP) HTGRs during this period.
• Among the four candidate materials, Alloy 800H is code certified for temperatures only up to 760°C for use in nuclear systems and therefore, the temperature limit is not high enough for application of this alloy in NGNP IHX. Neither Alloy 617 nor Alloy 230 is currently allowed in ASME Code Section III, although both are allowed in Section Viii, Division 1 (for non-nuclear service). A draft code case for Alloy 617 has been developed

122
but is not approved by the ASME Code. A limited database exists for Hastelloy X. Since the high temperature scaling in Hastelloy X has not been adequate, a modified version Hastelloy XR has been developed in programs conducted in Japan for which U.S. little access for both evaluation and for ASME Code qualification.
• Specific conclusions pertaining to materials database for Alloys 617 and 230 are as follows:
- Alloy 617: Composition refinement is necessary to achieve consistent mechanical properties and for precise evaluation of microstructural effects on mechanical performance. Need to generate additional mechanical property data, especially on creep fatigue behavior with and without hold time. The analysis showed that the damage under creep-fatigue conditions is much more than predictions based on the linear rule. Additional data on creep-fatigue under different loading scenarios are needed to develop a predictive capability on creep fatigue damage in the alloy, especially in helium purity levels typical of gas-turbine-based HTGRs. Need to establish corrosion regimes in helium with impurity levels anticipated in gas-turbine-based reactor system. Microstructural and mechanical property characterizations are needed for thin section materials, especially for use in compact HXs. It is necessary to validate the effect of system pressure on the corrosion performance of the alloy in impure helium. Tests are needed to verify that the tensile, creep, and creep-fatigue strengths of the diffusion bonded Alloy 617 joints used in the PCHE are adequate.
- Alloy 230: Limited data are currently available on the mechanical property for the alloy. Data on Long term aging effects on the mechanical property need to be generated. There is lack of information on the long-term corrosion performance of the alloy in helium of relevant impurity levels. Microstructural and mechanical property characterizations are needed for thin section materials, especially for use in compact HXs. The effect of system pressure on the corrosion performance of the alloy in impure helium needs evaluation.
• Significant R&D will be needed to qualify Alloy 617 under ASME Code Section III for high temperature applications, even though some design-relevant material properties are given in the draft code case for temperatures up to 982°C. The ratcheting rules, that were limited to <650°C in the draft code case, need to be expanded to allow higher temperatures. At present, there is insufficient database for Alloy 230 to develop a code case for elevated temperature application. If the IHX is classified as Class 2 or Class 3 component, new Code Cases need to be developed for high temperature applications.
• Design rules of Subsection NH of the ASME Code, which were developed for shell like structures (such as shell-and-tube HX), are not strictly applicable to the compact three-dimensional honeycomb structures of PCHE. New design rules and analyses tools are needed for this type of structure.
• Thermal hydraulic model has been applied to NGNP IHX conditions to calculate the required size of HX. Sensitivity study of HX parameters was conducted for helium-to-helium, helium-to-helium/nitrogen, helium-to-salt heat transfer. Calculations were made to compare the performance of a compact heat exchanger with a shell-and-tube heat exchanger. The results showed a reduction in compact HX volume of factors of 30

123
(compared to a shell-and-tube HX without ID and OD fins) and 5 (compared to a shell-and-tube HX with ID and OD fins), respectively. The pressure drop increases for the hot side for the compact HX were factors of 512 (without fins in shell-and-tube HX) and 8 (with fins in shell-and-tube HX). The corresponding pressure drop increases for the cold side for the compact HX were factors of 875 (without fins in shell-and-tube HX) and 12 (with fins in shell-and-tube HX). The results also showed that for an IHX heat duty of ≈45 MWt, ≈20 units of compact heat exchanger would be required based on the fabrication size limit used in the calculations.
• For a reactor outlet temperature and pressure of 900°C and 7 MPa, respectively, and a secondary side inlet temperature and pressure of 575°C and 1.95 MPa, respectively, the allowable design life (based on in-air tensile and creep rupture strengths of Alloy 617) of the compact IHX is 80,000 h and that of the shell and tube IHX (for the tube size selected) is 20,000 h. These design lifetimes are based on analyses of the IHX core and further reduction in life may result from interaction of the core region with the header region. The design lifetimes may also decrease, if thin section creep properties (which are generally less than those of thicker material) are considered. In addition, the effect of impure helium on creep properties needs to be incorporated in the design data and in the lifetime calculations. At high temperatures, Alloys 617 and 230 have almost identical YS and UTS and have similar creep rupture properties. Therefore, replacing Alloy 617 with Alloy 230 may not lead to longer design lifetime for the IHX unless the performance of Alloy 230 in NGNP helium is significantly superior to that of Alloy 617.

124
8. References
Aerospace Structural Metals Handbook,1994.
Allen, D., Keustermans, J.-P., Gijbels, S., and Bicego, V., 2004, “Creep Rupture and Ductility of As-Manufactured and Service-Aged Nickel Alloy IN617 Materials and Welds,” Materials at High Temperature, 21, Issue 1 pp.55-60.
ASME, 1977, Boiler and Pressure Vessel Code Case 1592, Section VIII, American Society of Mechanical Engineers, New York.
ASME Code, 2004, Division III Subsection NH.
ASME Code, 2004, Section II.
Baldwin, D. H., Kimball, O. F., and Williams, R. A., 1986, “Design Data for Reference Alloys: Inconel 617 and Alloy 800H,” Prepared by General Electric Company for the U. S. Department of Energy, Contract DE-AC03-80ET34034, April 1986.
Bates, H. G. A., 1984, “The Corrosion Behavior of High-Temperature Alloys during Exposure for Times up to 10,000 h in Prototype Nuclear Process Helium at 700 to 900°C,” Nuclear Technology, 66, 415.
Betteridge, W., et al., 1978, Proc. Conf. on Alloy 800, Petten, The Netherlands, March 14-16, 1978, North-Holland Publishing Company, Amsterdam, 1978.
Blackburn, L. D., 1972, “Isochronous Stress-Strain Curves for Austenitic Stainless Steels,” The Generation of Isochronous Stress-Strain Curves, American Society of Mechanical Engineers, New York.
Booker, M. K., Baylor, V. B., and B. L. P. Booker, B. L. P.,1978, “Survey of Available Creep and Tensile Data for Alloy 800H,” Oak National Laboratory, ORNL/TM-6029.
Brenner, K. G. E. and L. M. Nilsen, 1978, “High Temperature Materials Program Report 29,” Central Institute for Industrial Research, Oslo, Norway.
Brenner, K. G. E., 1982, in Proc. Conf. on Gas Cooled Reactors Today, British Nuclear Engineering Society, London, 191.
Brinkman, C. R., 1982, “High Temperature Time-dependent Fatigue Behavior of Several engineering Structural Alloys,” International Metals Reviews, 30, pp. 235-258.
Bruch, U., Schuhmacher, D., Ennis, P., Heesen, E., 1984, “Tensile and Impact Properties of Candidate Alloys for High-Temperature Gas-Cooled Reactor Applications,” Nuclear Technology, 66, pp. 357-362.
Burlet, H., Cabet, C., Walle, E., and Dubiez, S., 2005, “French VHTR Near Term High Temperature Alloy Development Program,” Gen IV VHTR Development, Paris, Sep 5-7, 2005.
Cabet, C., Terlain, A., Lett, P., Guetaz, L., and Gentzbittel, J. M., 2006, “High Temperature Corrosion of Structural Materials under Gas-Cooled Reactor Helium,” Materials and Corrosion, 57, pp. 147-153
Cappellaere, M., M. Perrot, and J. Sannier, 1984, “Behavior of Metallic Materials between 550 and 870°C in High Temperature Gas-Cooled Reactor Helium Under Pressures of 2 and 50 Bar,” Nuclear Technology, 66, 465.
Chen, L. J., Liaw, P. K., McDaniels, R. L., Wang, G. Y., Liaw, K., Blust, J. W., Thompson, S. A., Browning, P. F., Bhattacharya, A. K., Aurrecoechea, J. M., Seeley, R. R., and Klarstrom, D. L.,

125
2001, “Low-Cycle Fatigue Behavior and Creep-Fatigue Life Prediction of Three Superalloys,” Modeling the Performance of Engineering Structural Materials II, Leseur, D. R., and Srivatsan, T. S., (Eds.), TMS 2001, pp. 101-117.
Chen, L. J., Liaw, P. K., Wang, G. Y., McDaniels, R. L., Liaw, K., Thoompson, S. A., Blust, J. W., Browning, P. F., Bhattacharya, A. K., Aurrecoechea, J. M., Seeley, R. R., and Klarstrom, D. L., 2002, “Cyclic Deformation Behavior and Damage Mechanisms of Hastelloy X Superalloy under Fatigue and Creep-Fatigue Loading,” Fatigue – D. L. Davidson Symposium, Chan, K. S., Liaw, P. K., Bellows, R. S., Zogas, T. C., and Soboyejo, W. O., (Eds.) TMS 2002. Pp. 191-200.
Chow, J. G. Y., Soo, P., and Epel, L., 1978, “Creep and Fatigue Properties of Incoloy 800H in a High Temperature Gas Cooled Reactor (HTGR) Helium Environment,” Proc. of the Petten Int. Conf. on Alloy 800, March 14-16, 1978, W. Betteridge et al., (Eds.) North Holland, pp. 331-336.
Cook, R. H., 1984, “Creep Properties of Inconel-617 in Air and Helium at 800 to 1000°C,” Nuclear Technology, 66, 283
Davis, C. B., Oh, C. H., Barner, R. B., Sherman, S. R., and Wilson, D. F., 2005, “Thermal-Hydraulic Analyses of Heat Transfer Fluid Requirements and Characteristics for Coupling A Hydrogen Production Plant to a High-Temperature Nuclear Reactor,” INL/EXT-05-00453.
Donachie, M. J., and Donachie, S. J., 2002, “Superalloys: A Technical Guide,” ASM International.
Ennis, P. J., Mohr, K. P., and Schuste, H., 1984, “Effect of Carburizing Service Environments on the Mechanical Properties of High-Temperature Alloys,” Nuclear Technology, 66, 363.
Ganesan P., Smith, G. D., and Yates, D. H., 1995, “Performance of Inconel Alloy 617 in Actual and Simulated Gas Turbine Environments,” Materials and Manufacturing Processes, 10, pp. 925-938.
Generation IV International Forum, 2002, A Technology Roadmap for Generation IV Nuclear Energy Systems, FIF-002-00.
Graham, L. W., 1990, “Corrosion of metallic Materials in HTR-helium Environments,” J. Nuclear Materials, 171, 76.
Graham, L. W., K. G. E. Brenner, and K. Krompholz, 1981, “The Behavior of High Temperature Alloys during Exposure in Impure Helium,” IAEA Specialists Meeting on High Temperature Metallic Materials for Application in Gas-Cooled Reactors, Vienna, Austria, May 4-6 1981, Report IWGGCR-4, paper K1.
Guttman, V., and Burgel, R., Guttman, V., 1983, "Effect of a Carburizing Environment on the Creep Behavior of Some Austenitic Steels," in Corrosion Resistant Materials for Coal Conversion Systems (1982: London), Applied Science Publishers, 1983 pp. 423-438.
Harvego, E. A., 2006, “Evaluation of Next Generation Nuclear Power Plant (NGNP) Intermediate Heat Exchanger (IHX) Operating Conditions,” Idaho National Laboratory Report INL/EXT-06-11109.
Haynes International, Data sheet on Haynes 230 Alloy, www.haynesintl.com
Heatric web site, www.heatric.com
Hosoi, Y., and Abe, S., Metallurgical Transactions, 6A (1975) pp. 1171-1178
Hsu, S. S., 1991, “The Effects of Fatigue, Hold Time, and Creep on Crack Growth in High Temperature Environments: Ni-Cr-Co Alloy,” Scripta Metallurgica et Materialia, 25, No. 5, 1143.
Huchtemann, B., 1989, “The Effect of Alloy Chemistry on Creep Behavior in a Helium Environment with Low Oxygen Partial Pressure,” Materials Science and Engineering, A121, 623.

126
Independent Technology Review Group, 2004, Design Features and Technology Uncertainties for the Next Generation Nuclear Plant, Idaho National Laboratory Report INEEL/EXT-04-01816.
Johnson, W. R. and G. Y. Lai, 1981, “Interaction of Metals with Primary Coolant Impurities: Comparison of Steam-Cycle and Advanced HTGRs,” in Specialist Meeting on High Temperature Metallic Materials for Application in Gas Cooled Reactors, Paper J1.
Jordan, C. E., Rasefske, R. K., and Castagna, A., 1999, “Thermal Stability of High Temperature Structural Alloys,” Long Term Stability of High Temperature Materials, Fuchs, G. E., Dannemann, K. A., and Deragon, T. C., (Eds.) TMS 1999, pp. 55-67.
Katcher, M., 1998, “Creep Analysis of Solid Solution Strengthened Nickel Alloys,” PVP-Vol. 374, Fatigue, Environmental Factors, and New Materials, ASME 1998, pp.341-348.
Kihara, S., Newkirk, J. B., Ohtomo, A., and Saiga, Y., 1980, “Morphological Changes of Carbides During Creep and Their Effects on the Creep Properties of Inconel 617 at 1000ºC,” Metallurgical Transactions, 11A, pp. 1019-1031.
Kimball, G. F., Lai, G. Y., and Reynolds, G. H., 1976, “Effects of Thermal Aging on the Microstructure and Mechanical Properties of a Commercial Ni-Cr-Co-Mo Alloy (Inconel 617),” Metallurgical Transactions, 7A, pp. 1171-1178.
Kirchofer, H., Schubert, F., and Nickel, H., 1984, “Precipitation Behavior of Ni-Cr-22Fe-18Mo (Hastelloy X) and Ni-Cr-22Co-12Mo (Inconel 617) after Isothermal Aging,” Nuclear Technology, 66, pp. 139-148.
Kitagawa, M., Hamanaka, J., Umeda, T., Goto, T., Saiga, Y., Ohnami, M., and Udoguchi, T., 1979, “A New Design for 1.5 MWt Helium Heat Exchanger,” Trans. 5th Intl. Conf. on Structural Mechanics in Reactor Technology, Berlin, Germany, August 13-17, 1979, Paper F9/1
Klarstrom, D. L., 2001, “The Development of Haynes 230 Alloy,” Materials Design Approaches and Experiences, Zhao, J. C., Fahrmann, M., and Pollock, T. M., (Eds.), TMS 2001, pp. 297-307.
Klova, R. J., and Sobaru C. S., 1993, “Upgrading a Power Turbine Stator for Greater Creep Life, Incorporating a Material Change to Haynes 230,” Presented at the International Gas Turbine and Aeroengine Congress and Exposition, Cincinnati, OH, May 24-27, 1993, 93-GT-271, pp. 1-8.
Kondo, T., 1981, “Development and Testing of Alloys for Primary Circuit Structures of a VHTR,” IAEA Specialists Meeting on High Temperature Metallic Materials for Application in Gas-Cooled Reactors, Vienna, Austria, May 4-6, 1981, Report IWGGCR-4, paper B1.
Krompholz, K., Bodmann, E., Gnirss, G. K. H., and Huthmann, H., 1984, “Fracture Mechanics Investigations on High-Temperature Gas-Cooled Reactor Materials,” Nuclear Technology, 66, pp. 371-379.
Kurata, Y., Ogawa, Y., and Kondo, T., 1984, “Creep and Rupture Behavior of a Special Grade Hastelloy-X in Simulated HTGR Helium,” Nuclear Technology, 66, pp. 250-259.
Lee, K. S., 1984, “Creep Rupture Properties of Hastelloy-X and Incoloy-800H in a Simulated HTGR Helium Environment Containing High Levels of Moisture,” Nuclear Technology, 66, pp. 241-249.
Lerch, B. A., Kempf, B., Steiner, D., and Gerold, V., 1986, "Fatigue and Creep Behavior of Alloy 800H at Elevated Temperatures," in Strength of Metals and Alloys (ICMSA 7), Proceedings of the 7th International Conference on the Strength of Metals and Alloys, Montreal, Canada, 12-16 August 1985, Pergamon Press, Vol 2, pp. 1299-1304.

127
Li, X., Le Pierres, R., and Dewson S. J., 2006, “Heat Exchangers for the Next Generation of Nuclear Reactors”, Proceedings of ICAPP ’06, 2006 International Congress on Advances in Nuclear Power Plants, Paper 6105, pp. 201-209, Reno, NV.
Lillo, T. M., Williamson, R. L., Reed, T. R., Davis, C. B., and Ginosar, D. M., 2005, Engineering Analysis of Intermediate Loop and Process Heat Exchanger Requirements to Include Configuration Analysis and Materials Needs, Idaho National Laboratory Report INL/EXT-05-00690.
Lu, Y. L., Chen, L. J., Liaw, P. K., Wang, G. Y., McDaniels, R. L., Thompson, S. A., Blust, J. W., Browning, P. F., Bhattacharya, A. K., Aurrecoechea, J. M., and Klarstrom, D. L., 2002, “Elevated Temperature Crack Growth Behavior of Nickel-Base Haynes 230 Alloy at 927ºC,” Modeling the Performance of Engineering Structural Materials III, Srivatsan, T. S., Leseur, D. R., and taleff, E. M., (Eds.), TMS 2002, pp. 123-133.
MacDonald, P. E., Bayless, P. D., Gougar, H. D., Moore, R. L., Ougouag, A. M., Sant, R. L., Sterbentz, J. W., and Terry, W. K., 2004, The Next Generation Nuclear Plant – Insignts Gained from the INEEL Plant Design Studies, Proc. ICAPP-04, Pittsburgh, PA, June 13-17, 2004, p. 349.
Mankins, W. L., Hosier, J. C., and Bassford, T. H., 1974. “Microstructure and Phase stability of INCONEL Alloy 617,” Metallurgical Transactions, 5, pp. 2579-2590.
Maziasz, P. J., Shingledecker, J. P., Evans, N. D., Yamamoto, Y., More, K. L., Trejo, R., Lara-Curzio, E., and Stinner, C. P.,2006, “Creep Strength and Microstructure of Al20-25+Nb Alloy Sheets and Foils for Advanced Microturbine Recuperators,” Proceedings of ASME Turbo Expo 2006: Power for Land, Sea, and Air, May 9-11, 2006, Barcelona, Spain. GT2006-90195.
Maziasz, P. J., Shingledecker, J. P., Pint, B. A., Evans, N. D., Yamamoto, Y., More, K. L., and Lara-Curzio, E.,2005, “Overview of Creep Strength and Oxidation of Heat-Resistant Alloy Sheets and Foils for Compact Heat Exchangers,” Proceedings of ASME Turbo Expo 2005: Power for Land, Sea, and Air, June 6-9,2005, Reno-Tahoe, NV. GT2005-68927.
McCoy, H. E., 1985, “Mechanical Properties of Hastelloy X and Inconel 617 after Aging 53,000 hrs in HTGR-He,” ORNL/TM-9604, Oak Ridge National Laboratory, Oak Ridge, TN.
McCoy, H. E., and King, J. F., 1985, “Mechanical Properties of Inconel 617 and 618,” Oak Ridge National Laboratory, ORNL/TM-9337, 1985.
McDonald, C. F., 1996, “Compact Buffer Zone Plate-Fin IHX- Key Component for High-Temperature Nuclear Process Heat Realization With Advanced MHR,“ Applied Thermal Engineering, 16, p.32.
McGreevy, T. E., Marriott, D. L., and Carter, P., 2005, High Temperature Design Methods Development Advances for 617: Status and Plans,” ORNL/TM-2005/515. Oak Ridge National Laboratory, TN.
McKee, D. W. and R. G. Frank, 1981, “Corrosion Behavior of Experimental Alloys in Controlled Purity Helium,” IAEA Specialists Meeting on High Temperature Metallic Materials for Application in Gas-Cooled Reactors, Vienna, Austria, May 4-6, 1981, Report IWGGCR-4, Paper I1.
Meurer, H., Gnirss, G., Mergler, W., Raule, G., Schuster, H., and Ullrich, G., 1984, “Investigations on the Fatigue Behavior of High-Temperature Alloys for High-Temperature Gas-Cooled Reactor Components,” Nuclear Technology, 66, 315
Meyer-Olbersleben, F., Kasik, N., Ilschner, B., and Rezai-Aria, F., 1999, “The Thermal Fatigue Behavior of the ombustor Alloys IN 617 and HAYNES 230 Before and After Welding,” Metallurgical Transactions, 30A, pp. 981-989.

128
Moisseytsev, A., 2003, “Passive Load Follow Analysis of the STAR-LM and STAR-H2 Systems”, Ph.D. Dissertation, College Station, TX.
Nakanishi, T. and Kawakami, H., 1984, “Creep Properties of Hastelloy-X in Impure Helium Environments,” Nuclear Technology, 66, pp. 273-282
Natesan, K., Purohit, A., and Tam, S. W., 2003, “Materials Behavior in HTGR Environments,” NUREG/CR-6824 (ANL-02/37), Argonne National Laboratory, IL
Nilsson, J. O., and Sandstrom, R., 1988, “Influence of temperature and microstructure on creep-fatigue of Alloy 800H,” High Temperature Technology, 6, pp. 181-186.
O’Donnell, B., 2005, “Licensing and Safety Issues in High Temperature Reactors,” Generation IV International Forum, Oak Ridge National Laboratory, TN, April 12-14, 2005.
Osthoff, W., Schuster, H., and Ennis, P., 1984, “Creep and Relaxation Behavior of Inconel-617,” Nuclear Technology, 66, 296.
Rao, K. B. S., Meurer, H. P., and Schuster, H., 1988, “Creep-fatigue Interaction of Inconel 617 at 950ºC in Simulated Helium Reactor Helium,” Materials Science and Engineering, A104, pp. 37-51
Ren, W., and Swindeman, R. W., 2005, “Assessment of Existing Alloy 617 Data for Gen IV Materials Handbook,” ORNL/TM-2005/510, Oak Ridge National Laboratory, TN.
Ren, W., and Swindeman, R. W., 2005, “Development of a Controlled Material Specification for Alloy 617 for Nuclear Applications,” ORNL/TM-2005/504, Oak Ridge National Laboratory, TN.
Ren, W., and Swindeman, R. W., 2006, “A Review of Aging Effects in Alloy 617 for Gen IV Nuclear Reactor Applications,” PVP2006-ICPVT-11-93128, Proceedings of PVP2006-ICPVT-11, ASME Pressure Vessels and Piping Division Conference, July 23-27, 2006, Vancouver, BC, Canada.
Roberts, D. I., 1978, “Design Codes and Lifetime Prediction Aspects for Alloy 800 for Nuclear and Non-nuclear Applications, ” Proc. Intl. Conf. on Alloy 800, J. R. C. Petten Establishment, Petten, The Netherlands, North Holland, 403.
Ryu, W. S., 2005, “Korean R&D Program on H. T. Materials,” GIF VHTR Materials & Components, PMB Meeting, Sep 5-7, 2005.
Schneider, K., Hartnagel, W., Schepp, P., and Ilschner, B., 1984, “Creep Behavior of Materials for High-Temperature Reactor Application,” Nuclear Technology, 66, 289.
Schubert, F., 1984, “Evaluation of Materials for Heat Exchanging Components in Advanced Helium-Cooled Reactors,“ IAEA Specialists Meeting on Heat Exchanging Components of Gas-Cooled Reactors, Dusseldorf, Germany, IWGGCR-9, 309.
Schubert, F., Bruch, U., Cook, R., Diehl, H., Ennis, P. J., Jakobeit, W., Penkalla, H. J., Heesen, E. T., and Ullrich, G., 1984, “Creep Rupture Behavior of Candidate Materials for Nuclear Process Heat Applications,” Nuclear Technology, 66, 227.
Schubert, F., H. J. Seehafer, and E. Bodmann, 1983, “Status of Design Code Work in Germany Concerning Materials and Structural Apects for the Heat exchanger Components of Advanced HTRs,” J. Engineering for Power, 105, 713.
Shankar, P. S., and Natesan, K., 2005, Unpublished results.
Shankar, P. S., and Natesan, K., 2006, In review for publication in Journal of Nuclear Materials
Shankar, P. S., Natesan, K., and Rink, D. L., 2006, Transactions of the American Nuclear Society, 94, 692.

129
Shingledecker, J. P., Swindeman, R. W., Wu, Q., Vasudevan, V. K., 2005, “Creep Strength of High-Temperature Alloys for Ultrasupercritical Steam Boilers,” Proceedings of Fourth International Conference on Advances in Materials Technology for Fossil Power Plants, October 25-28, 2004, pp. 1198-1212.
Soo, P. and Chow, J. G. Y., 1976, “Correlation of High and Low-Cycle Fatigue Data for Incoloy 800H,” Brookhaven National Laboratory Report, BNL-NUREG-50574.
Soo, P. and Chow, J. G. Y., 1978, “Correlation of high and low-cycle fatigue data for Incoloy 800H,” Proc. of the Petten Intl. Conf. on Alloy 800, March 14-16, 1978, eds. W. Betteridge et al., North Holland, 169.
Soo, P., and Sabatini, R. L., 1984, “High-cycle Fatigue Behavior of Incoloy 800H in a Simulated HTGR Environment Containing High Moisture Levels,” Nuclear Technology, 66, pp. 324-346.
Srivastava, S. K., and Klarstrom, D. L., 1990. “The LCF Behavior of Several Solid Solution Strengthened Alloys used in Gas Turbine Engines,” Presented at the Gas Turbine and Aeroengine Congress and Exposition, Brussels, Belgium, June 11-14, 1990, 90-GT-80
Stinton, D. P., 2006, Private Communication.
Strizak, J. P., Brinkman, C. R., Booker, M. K., and Rittenhouse, P. L., 1982, “The Influence of Temperature, Environment, and Thermal Aging on the Continuous Cycle Fatigue Behavior of Hastelloy X and Inconel 617,” Oak Ridge National Laboratory, ORNL TM-8130.
Swindeman, R. W, and Ren, W., 2005, “A Review of Aging Effects in Alloy 617,” ORNL/TM-5005/511, Oak Ridge National Laboratory, Oak Ridge,TN.
Tachibana, Y., 2005, “High Temperature Structural Design Guideline of the HTTR Metallic Components,” Presented at the Generation IV Internation Forum, Very High Temperature reactor Systems, Materials and Components Provisional Management Board, Oak Ridge National Laboratory, Oak Ridge, TN, Apr 12-14, 2005.
Tanabe, T., Sakai, Y., Shikama, T., Fujitsuka, M., Yoshida, H., and Watanabe, R., 1984, “Creep Rupture Properties of Superalloys Developed for Nuclear Steelmaking,” Nuclear Technology, 66, 260.
Tawancy, H. M., 1992, “High Temperature Creep Behavior of a Ni-Cr-W-B Alloy,” J. Mat. Sci., 27, pp. 6481-6489.
Tsuji, H. and Kondo, T., 1984. “Low-Cycle Fatigue of Heat-Resistant Alloys in High-Temperature Gas-Cooled Reactor Helium,” Nuclear Technology, 66, pp. 347-353.
Williamson, R. L., and Wright, R. N., 2005, “Intermediate Heat Exchanger and Component Test Facility.” Presentation.
Wilson, D. F., and Rittenhouse, P. L., 2005. “Effects of Impure Helium Environments on Surface and Near –Surface Microstructures of Reactor Candidate Materials,” Oak Ridge National Laboratory, ORNL/TM-2005/525.
Wu, Q., Shingledecker, J. P., Swindeman, R. W., and Vasudevan, V. K., 2005, “Microstructure Characterization of Advanced Boiler Materials for Ultra Supercritical Coal Power Plants,” Proceedings of Fourth International Conference on Advances in Materials Technology for Fossil Power Plants, October 25-28, 2004, pp. 748-761.

A U.S. Department of Energy laboratory managed by UChicago Argonne, LLC
Nuclear Engineering DivisionArgonne National Laboratory9700 South Cass Avenue, Bldg. 212Argonne, IL 60439-4838
www.anl.gov