Preliminary Final Report of Mobile Embrace Limited for the ...
61
Preliminary Final Report of Mobile Embrace Limited for the Financial Year Ended 30 June 2015 (ACN 089 805 416) This Preliminary Final Report is provided to the Australian Securities Exchange (ASX) under ASX Listing Rule 4.3A. Current Reporting Period: Financial Year Ended 30 June 2015 Previous Corresponding Period: Financial Year Ended 30 June 2014 For personal use only
Transcript of Preliminary Final Report of Mobile Embrace Limited for the ...

Preliminary Final Report of Mobile Embrace Limited for the Financial Year Ended 30 June 2015 (ACN 089 805 416) This Preliminary Final Report is provided to the Australian Securities Exchange (ASX) under ASX Listing Rule 4.3A. Current Reporting Period: Financial Year Ended 30 June 2015 Previous Corresponding Period: Financial Year Ended 30 June 2014
For
per
sona
l use
onl
y

APPENDIX 4E RESULTS FOR ANNOUNCEMENT TO THE MARKET Revenue and Net Profit Percentage
change Amount
$
Revenue from ordinary activities
up
71.30%
to
33,015,922
Earnings before interest, depreciation, and amortisation
up
61.85%
to
5,097,768
Profit from ordinary activities before tax attributable to members
up
58.23%
to
4,059,049
Net profit for the period attributable to members up
22.09%
to
3,045,554
Dividends
Amount per security
Franked amount per
security
No dividends were paid or declared during the period
-
-
Net Tangible Asset Backing
¢ per share 2015
¢ per share 2014
Net tangible assets per security
3.5 c
3.9 c
Brief Explanation of Figures Included Above Mobile Embrace Limited posted an improved financial performance with revenue up from $19.27 million to $33.02 million, EBITDA up from $3.149 million to EBITDA of $5.09 million and a profit after tax of $3.05 million compared to the prior year profit after tax of $2.49 million (The company has utilised all its tax losses in FY14 and as a consequence has a tax expense of $1.01 million in FY15). The development, expansion and growth of business activities under taken during this period have been major contributing factors in the further improvement of the trading, and profit result for the year ended 30 June 2015. Mobile Embrace has positioned itself as a leading mobile payments and mobile marketing company with its end-to-end m-payments and m-marketing infrastructure, to take full advantage of the strong industry forecasts for growth in mobile payments and mobile marketing. For Mobile Embrace, this produces a combination of revenue streams in a growing industry environment.
($ million) FY 2014 FY 2015 Variance Revenue $19.27 $33.02 $13.75 Gross Profit $9.93 $14.6 $4.67 Employment costs $4.68 $7.25 $2.57 EBITDA $3.15 $5.09 $1.94 Depreciation and amortisation $0.47 $0.97 $0.50 Impairment of intangible assets $0.10 $0.07 ($0.03) Net Profit / (Loss) After Tax $2.49 $3.05 $0.56
• Sales Revenue of $33.02 million (up 71.30% compared to prior year) • EBITDA $5.09 million (up 61.85% on prior year) • Employment costs $7.25M (up on prior year: $4.68 million) • Group Net Profit After Tax of $3,045,554 (up on 2013-14 profit of $2,494,423)
For
per
sona
l use
onl
y

Strategic Acquisitions: The Performance Factory Pty Ltd was acquired by Mobile Embrace for a total consideration of $3.2 million plus potential contingent consideration of up to a further $4 million (total potential consideration of $7.2 million) over 3 years and subject to profit before tax targets through to 2017. The Company took control of The Performance Factory on 1 July 2014. The Performance Factory posted an EBITDA of $1,416,846 for the period 1 July 2014 to the 30 June 2015. The acquisition of The Performance Factory has contributed to the groups EBITDA in the reporting period by $1,416,846. Eggmobi Pty Limited was acquired by Mobile Embrace for a total consideration of $1.4 million with additional earn out contingent on performance in line with the company’s growth targets. Eggmobi posted an EBITDA of $701,721 for the period 13 August 2014 to the 30 June 2015. The acquisition of Eggmobi has contributed to the groups EBITDA in the reporting period by $701,721. From the 1 July 2014 to the 12 August 2014 Eggmobi lost $303.
For
per
sona
l use
onl
y

Mobile Embrace Directors’ Report
Directors Report The directors of Mobile Embrace Limited present their report together with the financial statements of the Group, being the company and its controlled entities, for the year ended 30 June 2015. The names and particulars of the directors of the company during or since the end of the financial year unless otherwise stated are: Directors
NAME PARTICULARS Drew Kelton Independent Chairman non-executive director Interest in Shares and Options Special Responsibilities Directorships held in other listed entities during the three years prior to the current year
Mr Kelton joined the Board of Mobile Embrace on 1 July 2010. He is currently Vice-president and Managing Director Asia Pacific for Docusign Inc the world’s leading provider of digital transaction management (DTM) solutions. Formally he was Vice-president of T-Mobile in the United States and prior to that he was President Enterprise Services at Bharti Airtel, India’s largest mobile phone operator and one of Asia’s leading integrated telecom service providers and a member of Bharti’s management board. Prior to joining Bharti Airtel, Mr Kelton spent eight years as Managing Director of Telstra Corporation’s International business unit where he was responsible for driving business growth in Telstra’s offshore operations and establishing a multinational customer division to oversee Telstra’s biggest global customers. Mr Kelton has over 30 years’ experience in telecommunications and IT solutions and has worked in Europe, Australia, Asia and the US. He holds a Bachelor of Science in Electrical and Electronic Engineering (Hons) from Glasgow’s Paisley College of Technology. In addition, he is a Chartered Engineer and Member of the Institution of Engineering and Technology. 250,000 ordinary shares and 3,000,000 Options Mr Kelton was appointed Chairman of the Board on the 6 November 2014. Mr Kelton is a member of the Audit committee and the remuneration committee. Nil.
David Andrew Haines Independent chairman non-executive director
A director of the company since May 2001. Mr Haines holds a Bachelor of Education degree and was Secretary to the Standing Committee of Commonwealth, State and Territory Ministers with Censorship Responsibilities (1988 to 1994), Deputy Chief Censor, Australian Film Censorship Board (1986 to 1994) and Member of the Australian Film Censorship Board (1981-1994).
Interest in Shares and Options 415,000 ordinary shares and 1,000,000 options.
Special Responsibilities Directorships held in other listed entities during the three years prior to the current year
Mr Haines is a member the audit and nomination and remuneration committees. Mr Haines resigned from Chair of the Audit Committee on the 30 July 2014. Mr Whyte was appointed Chair of the Audit Committee on the 30 July 2014. Mr Haines resigned as Chairman of the Board on 6 November 2014. Mr Kelton was appointed Chairman of the Board on the 6 November 2014. Nil
1
For
per
sona
l use
onl
y

Mobile Embrace Directors’ Report
Directors
NAME PARTICULARS Christopher Thorpe CEO executive director
CEO and director of the company since May 2001, Mr Thorpe provides his expertise in the global mobile and telecommunications industry, with over 18 years experience gained in the United States, Europe and Australia. The combination of this experience with a financial background provides him with a strong understanding of the industry, its issues and trends, enabling the ability to commercialise and deploy successful business strategies. Mr Thorpe has been at the forefront of the mobile entertainment and telecommunications industry leading with a number of key innovations. His work has been acknowledged through the receipt of numerous business awards for these milestone achievements and contributions to the telecommunications industry. As CEO, Mr Thorpe provides leadership, insight, expertise, understanding along with a global network of leading industry associates and contacts. His vision and drive provide the company with opportunities to capitalise on its position as Australia’s leading mobile services provider.
Interest in Shares and Options Special Responsibilities Directorships held in other listed entities during the three years prior to the current year
22,176,639 ordinary shares and 5,500,000 options Nil. Nil.
Gavin Whyte Independent non-executive director Interest in Shares and Options Special Responsibilities Directorships held in other listed entities during the three years prior to the current year
A director of the company since December 2005, Mr Whyte brings a wealth of global experience in the mobile entertainment media industry to the company.
Gavin is an Advisor to adQuota International which is a leading mobile ad network in Scandinavia. adQuota are a premium ad network specializing in rich media formats and targeting. In addition to advising the Board, he has been leading the company’s M&A activities in Europe. He is the Founder of Rubberduck Consulting which is a new media consulting firm specializing in mobile gaming, marketing and entertainment services.
Gavin was the Co-Founder and CEO of Touch Mobile Limited. Touch was a mobile start-up specialising in skill gaming, lottery games and mobile marketing. Touch was sold in April 2011 to a fast growing mobile operator. He was previously Chief Operating Officer of NetPlay TV plc. NetPlayTV is the UK's largest interactive TV gaming company, which includes brands such as SuperCasino.com, ChallengeJackpot.com, Play Monday and Big Box Bingo.
Prior to this Gavin was Managing Director of Rubberduck Media Lab (RDML) which is a leading supplier of TV to mobile streaming solutions in the UK and Scandinavia. RDML was sold to Aspiro in Sweden in September 2006.
395,000 ordinary shares and 1,000,000 options
Mr Whyte is a member of the nomination and remuneration committee. Mr Whyte was appointed as Chair of the Audit Committee on the 30 July 2014.
Nil.
2
For
per
sona
l use
onl
y
Mobile Embrace Directors’ Report
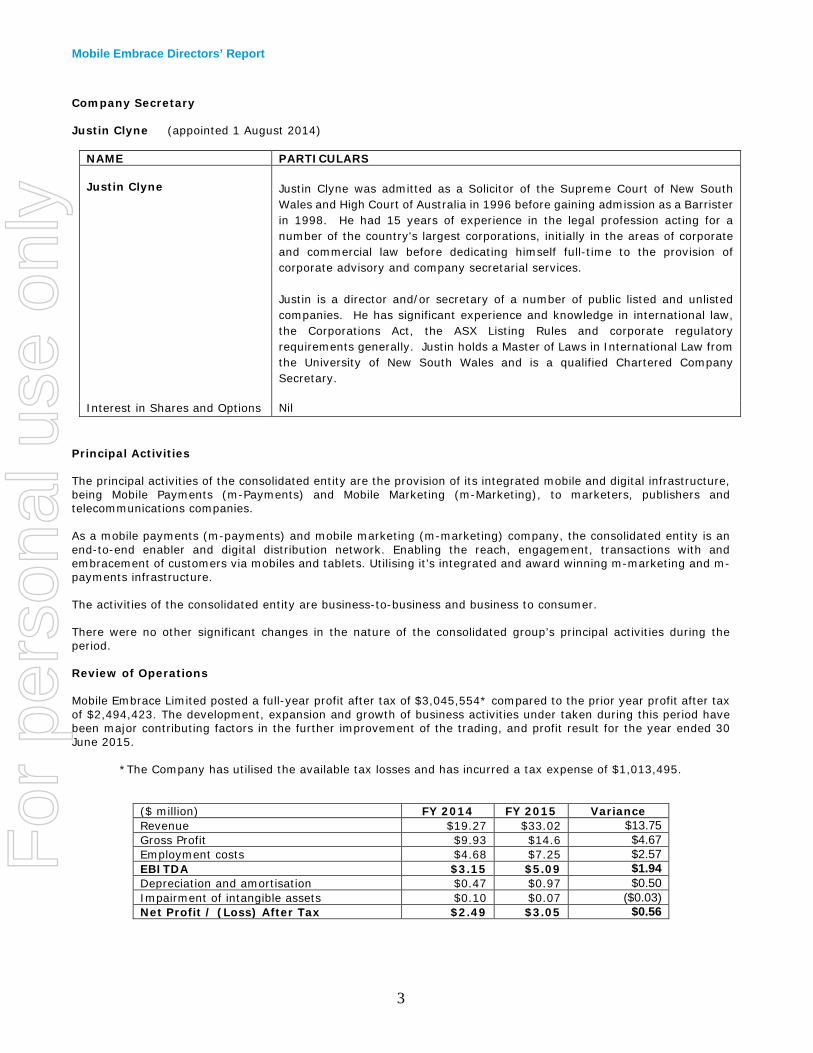
Company Secretary Justin Clyne (appointed 1 August 2014)
NAME PARTICULARS Justin Clyne
Justin Clyne was admitted as a Solicitor of the Supreme Court of New South Wales and High Court of Australia in 1996 before gaining admission as a Barrister in 1998. He had 15 years of experience in the legal profession acting for a number of the country's largest corporations, initially in the areas of corporate and commercial law before dedicating himself full-time to the provision of corporate advisory and company secretarial services. Justin is a director and/or secretary of a number of public listed and unlisted companies. He has significant experience and knowledge in international law, the Corporations Act, the ASX Listing Rules and corporate regulatory requirements generally. Justin holds a Master of Laws in International Law from the University of New South Wales and is a qualified Chartered Company Secretary.
Interest in Shares and Options Nil Principal Activities The principal activities of the consolidated entity are the provision of its integrated mobile and digital infrastructure, being Mobile Payments (m-Payments) and Mobile Marketing (m-Marketing), to marketers, publishers and telecommunications companies. As a mobile payments (m-payments) and mobile marketing (m-marketing) company, the consolidated entity is an end-to-end enabler and digital distribution network. Enabling the reach, engagement, transactions with and embracement of customers via mobiles and tablets. Utilising it’s integrated and award winning m-marketing and m-payments infrastructure. The activities of the consolidated entity are business-to-business and business to consumer. There were no other significant changes in the nature of the consolidated group’s principal activities during the period. Review of Operations Mobile Embrace Limited posted a full-year profit after tax of $3,045,554* compared to the prior year profit after tax of $2,494,423. The development, expansion and growth of business activities under taken during this period have been major contributing factors in the further improvement of the trading, and profit result for the year ended 30 June 2015. *The Company has utilised the available tax losses and has incurred a tax expense of $1,013,495.
($ million) FY 2014 FY 2015 Variance Revenue $19.27 $33.02 $13.75 Gross Profit $9.93 $14.6 $4.67 Employment costs $4.68 $7.25 $2.57 EBITDA $3.15 $5.09 $1.94 Depreciation and amortisation $0.47 $0.97 $0.50 Impairment of intangible assets $0.10 $0.07 ($0.03) Net Profit / (Loss) After Tax $2.49 $3.05 $0.56
3
For
per
sona
l use
onl
y

Mobile Embrace Directors’ Report
Mobile Embrace has positioned itself as a leading m-payments and m-marketing company with its end-to-end mobile payments and mobile marketing infrastructure, to take full advantage of the strong industry forecasts for growth in mobile payments and mobile marketing. For Mobile Embrace, this produces a combination of revenue streams in an expanding industry environment. Cash flow The Company’s Cash at Bank was $9,538,904 at 30 June 2015, compared to $12,257,894 at 30 June 2014. Capital expenditure The company spent and capitalised $1,176,045 FY15 (FY14 $2,253,522) on system development, platform development and product development. A component of that expenditure was wages, this expenditure was capitalised: FY 2015 $721,824 (FY 2014 $1,208,012). This expenditure has underpinned and facilitated the Company’s expansion of markets, products and revenues both in Australia and overseas: revenues in FY2015 increased by 71.35% Financial Position The net assets of the consolidated group have increased by $5,709,361 from 30 June 2014, to $22,540,946 in 2015. The directors believe the Group is in a stable financial position to expand and grow its current operations. The directors believe the Group will be able to fund future operations through share issues, debt instruments, control of costs and the continued commercialisation of its business-to-business activities. Significant Changes in State of Affairs During the financial year there were no significant changes in the state of affairs of the consolidated entity other than that referred to in the financial statements or notes thereto. After Balance Date Events On the 3 July 2015: 5,440,000 employee performance based options were vested converting to shares and held in trust by AET SFS Pty Ltd <MBE employee plan A/C>. On the 29 July 2015 350,000 employee options lapsed due to forfeiture under the MBE performance rights and options plan. The Company has acquired Vizmond Media Pty Ltd for a total consideration of $2.5M plus potential consideration of up to a further $3.5M over 3 years and subject to profit before tax targets through to 2018. Vizmond media is a digital performance based marketing company with cutting edge proprietary technology developed over the last 3 years. Other than the above, there have been no events that have occurred since the reporting date which would materially impact on the financial position of the Company and its controlled entities. Future Developments, Prospects and Business Strategies The Investor presentation released to the ASX on the 4 August 2014 can be viewed at www.mobileembrace.com. Disclosure of certain information regarding likely developments in the operations of the consolidated entity in future financial periods and the expected results of those operations is likely to result in unreasonable prejudice to the consolidated entity. Accordingly, this information has not been disclosed in this report.
4
For
per
sona
l use
onl
y
Mobile Embrace Directors’ Report
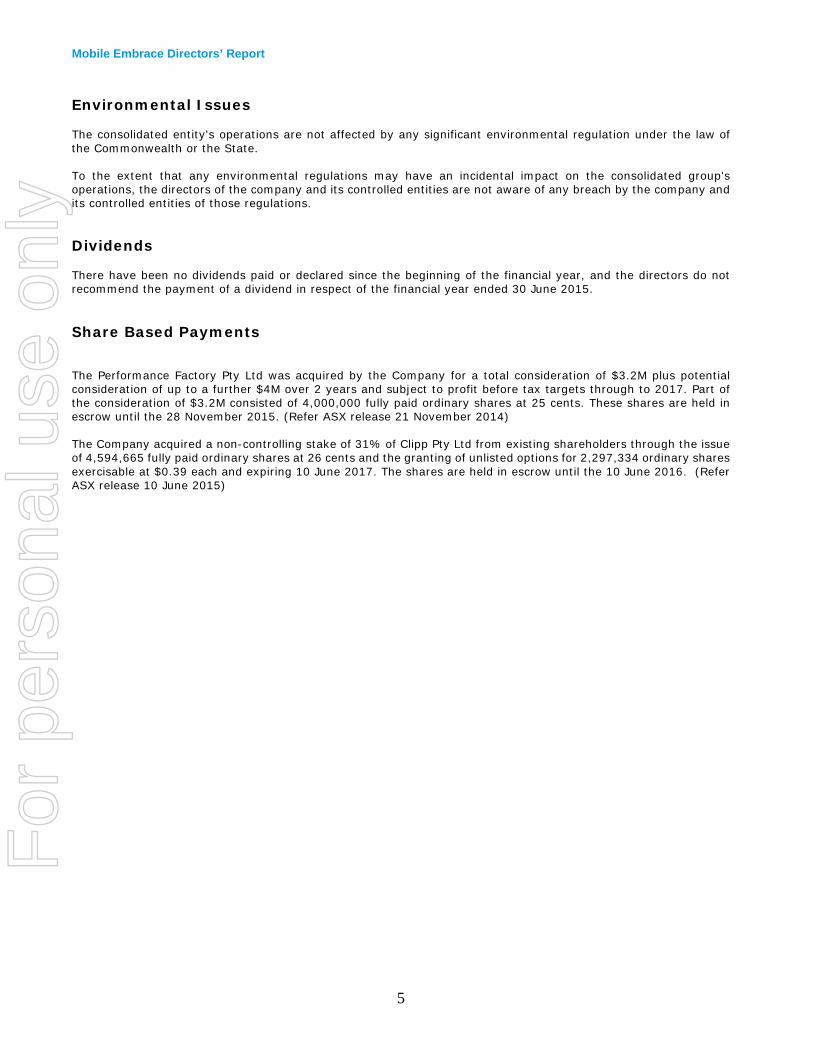
Environmental Issues The consolidated entity's operations are not affected by any significant environmental regulation under the law of the Commonwealth or the State. To the extent that any environmental regulations may have an incidental impact on the consolidated group's operations, the directors of the company and its controlled entities are not aware of any breach by the company and its controlled entities of those regulations. Dividends There have been no dividends paid or declared since the beginning of the financial year, and the directors do not recommend the payment of a dividend in respect of the financial year ended 30 June 2015. Share Based Payments The Performance Factory Pty Ltd was acquired by the Company for a total consideration of $3.2M plus potential consideration of up to a further $4M over 2 years and subject to profit before tax targets through to 2017. Part of the consideration of $3.2M consisted of 4,000,000 fully paid ordinary shares at 25 cents. These shares are held in escrow until the 28 November 2015. (Refer ASX release 21 November 2014) The Company acquired a non-controlling stake of 31% of Clipp Pty Ltd from existing shareholders through the issue of 4,594,665 fully paid ordinary shares at 26 cents and the granting of unlisted options for 2,297,334 ordinary shares exercisable at $0.39 each and expiring 10 June 2017. The shares are held in escrow until the 10 June 2016. (Refer ASX release 10 June 2015)
5
For
per
sona
l use
onl
y

Mobile Embrace Directors’ Report
Remuneration Report The Remuneration Report forms part of the Directors' Report and outlines the remuneration arrangements for executives and employees of Mobile Embrace Limited, including Key Management personnel in accordance with relevant accounting standards and Section 300A of the Corporations Act. The remuneration policy of Mobile Embrace Limited has been designed to align key management personnel objectives with shareholder and business objectives by providing a fixed remuneration component and offering short term incentives and long-term incentives based on key performance areas affecting the consolidated group’s financial results. The Board of Mobile Embrace Limited believes the remuneration policy to be appropriate and effective in its ability to attract and retain the best key management personnel to run and manage the consolidated group, as well as create goal congruence between directors, executives and shareholders. Remuneration of directors and executives is reviewed by the Remuneration Committee in accordance with its Charter. The Remuneration Committee makes recommendations to the Board on the following:
• Executive remuneration and incentive policies; • Ensuring policy allows the company to recruit and retain suitably qualified executives; • Remuneration framework for directors; • Aligning the interests of key employees to the long-term interests of shareholders; and • Demonstrate a clear relationship between key executive performance and remuneration.
The performance of key management personnel is measured against criteria agreed annually with each executive and is based predominantly on the forecast growth of the consolidated group’s revenue, profits, shareholders’ value as well as personal goals. All bonuses and incentives must be linked to predetermined performance criteria. The Board may, however, exercise its discretion in relation to approving incentives, bonuses and options, and can recommend changes to the committee’s recommendations. Any changes must be justified by reference to measurable performance criteria. The policy is designed to attract the highest calibre of executives and reward them for performance results leading to long-term growth in shareholder wealth. The Board’s policy is to remunerate non-executive directors at market rates for time, commitment and responsibilities. The remuneration committee determines payments to the non-executive directors and reviews their remuneration annually, based on market practice, duties and accountability. Independent external advice is sought when required. The maximum aggregate amount of fees that can be paid to non-executive directors is subject to approval by shareholders at the Annual General Meeting. Relationship between Remuneration Policy and Company Performance The remuneration policy has been tailored to increase goal congruence between shareholders, directors and executives. Two methods have been applied to achieve this aim, the first being a performance-based STI bonus based on key performance indicators, and the second being the LTI issue of options to the majority of key management personnel to encourage the alignment of personal and shareholder interests. The company believes this policy was effective in positioning itself for future growth. The following table shows the revenue and earnings for the last five years for the listed entity, as well as the share prices at the end of the respective financial years.
30 June 2011
30 June 2012
30 June 2013
30 June 2014
30 June 2015
Revenue $ 8,824,413 11,368,854 12,228,391 19,273,392 33,015,922 EBITDA $ (981,782) 323,217 1,068,116 3,149,716 5,097,767 Net profit / (loss) after tax (2,586,748) (258,536) 388,838 2,494,423 3,045,554 Share price (cents) 3.6 2.1 2.0 20.0 24.5
The company’s performance over the last five years is set out in the table above. The company has positioned itself to take advantage of the growing market opportunity of mobile payments and mobile marketing products and services. In the opinion of the Board, this can be attributed, in part, to the previously described remuneration policy. The Group’s operations are now more diverse than in the previous financial years.
6
For
per
sona
l use
onl
y

Mobile Embrace Directors’ Report
Key Management Personnel headcount remained unchanged across the financial year 2015. Achieving long term sustainable profitable growth provides the platform to further increase shareholder wealth in the future. Table of Employment Details of Members of Key Management Personnel
Christopher Thorpe Neil Wiles Position held 30 June 2015 Chief Executive Officer Managing Director
Contract details Four years and 7 months from the 1 July 2014. May be extended by mutual agreement.
Four years and 7 months from the 1 July 2014. May be extended by mutual agreement.
Notice period 12 months 12 months
Total employment cost (TEC) $365,041 $359,631
Short term incentive
A discretional amount capped at 60% of the TEC and solely based on the achievement of performance criteria set annually by the Board. Refer to Remuneration Report for KPI’s.
A discretional amount capped at 60% of the TEC and solely based on the achievement of performance criteria set annually by the Board. Refer to Remuneration Report for KPI’s.
Other benefits 30 days annual leave. Corporate parking. Life insurance policy paid for by MBE.
30 days annual leave. Corporate parking. Life insurance policy paid for by MBE.
Termination by Company 12 months’ notice or payment in lieu 12 months’ notice or payment in lieu
Restraint 12 months post termination 12 months post termination
Interest in shares as at 30 June 2015 22,176,639 19,533,000
Long term incentive / Options
- 3,000,000 options with a vesting
date of June 2016, an expiry date of June 2018, with an exercise price of 5 day VWAP of MBE shares on grant date plus a premium of 43% (as approved at the AGM 30 November 2012)
- 2,500,000 options vesting in 3 equal tranches over the next 3 years expiring on 31 December 2018 with a strike price of 19 cents (a 37.8% premium above the 5 day VWAP at grant date)
- 3,000,000 options were issued on
the 24 July 2013 with a vesting date of June 2016, an expiry date of June 2018, with an exercise price of 5 day VWAP of MBE shares on grant date plus a premium of 43%
- 2,500,000 options vesting in 3 equal tranches over the next 3 years expiring on 2 February 2018 with a strike price of 20.6 cents (a 30% premium above the 5 day VWAP at grant date)
7
For
per
sona
l use
onl
y

Mobile Embrace Directors’ Report
Table of Employment Details of Members of Key Management Personnel
Simon Allison
Position held 30 June 2015 CFO
Term of employment agreement
Appointment continued until date the employment is terminated pursuant to the terms of the agreement.
Notice period Three months
Total employment cost (TEC) $277,323
Short term incentive
A discretional amount capped at 60% of the TEC and solely based on the achievement of performance criteria set annually by the Board. Refer to Remuneration Report for KPI’s.
Other benefits 20 days annual leave. Corporate parking.
Termination by Company Three months notice or payment in lieu
Restraint Three months post termination
Interest in shares as at 30 June 2015 1,000,000
Long term incentive / Options
- 3,000,000 options where issued on
the 24 July 2013 with vestment dates commencing June 2014 and staggered to June 2016 with an expiry date of the 30 July 2016.
- 2,000,000 options vesting in 3 equal tranches over the next 2 years expiring on 1 September 2017 with a strike price of 15.85 cents
8
For
per
sona
l use
onl
y

Mobile Embrace Directors’ Report
Director and Executive Remuneration The following table of benefits and payments detail, in respect to the financial year, the components of remuneration for each member of the key management personnel of the consolidated group and, to the extent different, the five Group executives and five company executives receiving the highest remuneration:
Short-term Benefits Post-employment
Benefits
Equity-settle Share-based
Payments
Total $
2015
Salary & Fees and
Leave $
Bonuses
$
Non-Monetary
$
Super-annuation
$
Shares
$
Options
$
Non-Executive Directors
Drew Kelton 61,237 - - 5,768 - 67,005 David Haines 60,000 - - 5,550 65,550 Gavin Whyte 42,180 - - - 42,180 Executives Chris Thorpe 305,536 - 39,159 20,346 365,041 Neil Wiles 304,225 - 36,627 18,779 359,631 Simon Allison 195,000 *50,000 9,048 23,275 277,323 968,178 50,000 84,834 73,718 1,176,730
*STI Bonus to Mr Allison for FY2014
Short-term Benefits Post-employment
Benefits
Equity-settle Share-based
Payments
Total $
2014
Salary & Fees and
Leave $
Bonuses
$
Non-Monetary
$
Super-annuation
$
Shares
$
Options
$
Non-Executive Directors
Drew Kelton 30,000 - - 2,775 - - 32,775 David Haines 55,625 - - 10,469 - - 66,094 Gavin Whyte 30,000 - - - - - 30,000 Executives Chris Thorpe 291,658 - 25,516 17,777 - - 334,951 Neil Wiles 290,891 - 26,202 17,773 - - 334,866 Simon Allison 183,578 *40,000 7,076 17,774 - - 248,428 881,752 40,000 58,794 66,568 - - 1,047,114
*STI Bonus to Mr Allison for FY2013
9
For
per
sona
l use
onl
y

Mobile Embrace Directors’ Report
Short Term Incentive Plan – Cash Bonuses The Company has in place short term incentive plans. Key management are entitled to a short term cash incentive based on performance criteria as determined by and at the discretion of the board. The metrics for the short term incentive plans relate to EBITDA performance and personal goals. The performance criteria must be met within the financial year for the bonus entitlement to be realised. For FY2015 & FY 2016 the STI weighting is 80% EBITDA and 20% personal goals. STI target FY2015 was to achieve a minimum growth rate of 30% of EBITDA against the FY2014 result. Details of Base Incentive Entitlements are detailed as follows: Executive / Position Incentive Base Chris Thorpe CEO $204,000 Neil Wiles Managing Director $204,000 Simon Allison CFO $130,800 Incentive Payments Determination The short term incentive plan for FY 2015 provides for the board to apply at its discretion an adjusted multiplier to the incentive base of each incentive plan participant, based on overall performance, of between 0 and 1.5 The performance of the key executives in delivering the Company’s strategy was high and of great satisfaction to the board. In addition to EBITDA growth of 61.85% and Revenue growth of 71.30%, revenue and EBITDA market guidance was exceeded. The Company’s market position was significantly strengthened and expanded, and the Company completed and successfully integrated two EPS accretive strategic acquisitions. The board has instructed the remuneration committee to make a determination in regard to amount of STI bonus to be paid to the Chief Executive Officer, Managing Director and Chief Financial Officer for FY2015. Share Options Long Term Incentive Plan – Share Options Share options granted to executives during the financial year On the 21 July 2014: (a) 6,440,000 employee performance based options were vested converting to shares and held in trust by AET SFS Pty Ltd <MBE employee plan A/C>. (b) 550,000 employee options lapsed due to forfeiture under the MBE performance rights and options plan. On the 26 August 2014 500,000 performance rights were issued to an employee under the MBE performance rights and option plan. On the 24 December 2014 and as approved at the AGM on the 27 November 2014 the following Directors options were issued: (a) Options were issued to the Directors at a strike price of $0.19, vesting in 3 tranches on 1 December 2015, 1 December 2016 and 1 December 2018 and all an expiry date of 31 December 2018: Andrew Kelton 3,000,000 options Chris Thorpe 2,500,000 options David Haines 1,000,000 options and Gavin Whyte 1,000,000 options. On the 9 January 2015 the following employee options were issued: (a) 2,500,000 options were issued to Neil Wiles at a strike price of $0.206, vesting in 3 tranches on 2 January 2016, 2 January 2017 and 2 January 2018 and all an expiry date of 2 February 2018. (b) 6,400,000 options were issued to Employees at a strike price of $0.1585, vesting in 3 tranches on 1 August 2015, 1 August 2016 and 1 August 2017 and all an expiry date of 1 September 2017.
10
For
per
sona
l use
onl
y

Mobile Embrace Directors’ Report
Post Balance date: On the 3 July 2015: 5,440,000 employee performance based options were vested converting to shares and held in trust by AET SFS Pty Ltd <MBE employee plan A/C>. On the 29 July 2015 350,000 employee options lapsed due to forfeiture under the MBE performance rights and options plan. Share options granted to other parties during the financial year The Company acquired a non-controlling stake of 31% of Clipp Pty Ltd from existing shareholders through the issue of 4,594,665 fully paid ordinary shares at 26 cents and the granting of unlisted options for 2,297,334 ordinary shares exercisable at $0.39 each and expiring 10 June 2017. The shares are held in escrow until the 10 June 2016. (Refer ASX release 10 June 2015) Share options on issue at year end Details of un-issued shares under option at the date of this report are:
Grant date Date of expiry
Exercise price (cents)
Number under option
28-Jun-13 30-Jul-16 0 5,860,000 28-Jun-13 27-Jun-18 3.10 3,000,000 24-Jul-13 1-May-18 4.655 3,000,000 24-Jul-13 30-Jul-16 0 2,100,000
26-Aug-14 1-Jul-16 0 500,000 24-Dec-14 31-Dec-18 19.00 7,500,000
9-Jan-15 1-Sep-17 15.85 6,400,000 9-Jan-15 2-Feb-18 20.06 2,500,000
10-Jun-15 10-Jun-17 26.00 2,297,334
33,157,334 Option holders do not have any rights to participate in any issues of shares or other interests in the company or any other entity. There have been no unissued shares or interests in options of any controlled entity within the Group during or since the end of the reporting period. For details of options issued to directors and executives as remuneration, refer to the remuneration report. No person entitled to exercise the option had or has any right by virtue of the option to participate in any share issue of any other body corporate.
11
For
per
sona
l use
onl
y

Mobile Embrace Directors’ Report
Meetings of Directors During the financial year, 8 meetings of directors (including committees of directors) were held. Attendances by each director during the year were as follows:
Directors’ Meetings Audit Committee Nominations & Remuneration
Committee Directors Held Attended Held Attended Held Attended
David Haines 8 8 2 2 1 1 Chris Thorpe 8 8 2 2 1 1 Gavin Whyte 8 8 2 2 1 1 Drew Kelton 8 7 2 1 - -
Proceedings on Behalf of Company The company was not a party to any proceedings during the year. Indemnification of Officers and Auditors During the financial year, the company paid a premium in respect of a contract insuring the directors of the company (as named in this report), the company secretary and all executive officers of the company against a liability incurred as a director, secretary or executive officer to the extent permitted by the Corporations Act 2001. The contract of insurance prohibits disclosure of the nature of the liability and the amount of the premium. The company has not otherwise, during or since the end of the financial year, except to the extent permitted by law, indemnified or agreed to indemnify an officer or auditor of the company or of any related body corporate of the company against a liability incurred as such an officer or auditor. Non-Audit Services The Board of Directors is satisfied that the general standard of independence for auditors imposed by the Corporations Act has been met. No non-audit services were performed during the financial year to 30 June 2015. Auditor’s Independence Declaration The lead auditor’s independence declaration for the year ended 30 June 2015 has been received and can be found on page 13 of the Annual Report. This report of directors, incorporating the Remuneration Report, is signed in accordance with a resolution of the Board of Directors. Chris Thorpe Director 4 August 2015
12
For
per
sona
l use
onl
y

For
per
sona
l use
onl
y

Mobile Embrace Limited and Controlled Entities Consolidated Statement of Profit or Loss for the year ended 30 June 2015
Consolidated Group Notes 2015 2014 $ $
Continuing Operations Revenue from Continuing Operations rendered 3 32,764,621 19,180,637 Cost of sales (5,945,938) (5,418,800) 26,818,683 13,761,837 Interest income 3 251,301 92,755 Service providers and commissions (1,392,682) - Administration expenses (967,748) - Advertising and marketing expenses (9,891,998) (3,925,076) Finance costs (135) (9,737) Depreciation and amortisation expense (972,951) (472,704)
Impairment of intangible assets (65,633) (101,913)
Employee benefits expense 4 (7,248,659) (4,683,982)
Legal expenses 4 (175,404) (62,642)
Occupancy expenses (475,212) (333,782) Operational expenses (682,948) (776,112) Other expenses from ordinary activities (1,137,565) (923,282)
Profit/(loss) before income tax 4,059,049 2,565,362 Income tax (expense) / benefit 5 (1,013,495) (70,939)
Net profit / (loss) from continuing operations 3,045,554 2,494,423 Discontinued operations Profit/(Loss) from discontinued operations after tax - - Profit/(loss) for the year 3,045,554 2,494,423 Non-controlling interest share - - Profit/(loss) attributable to members of the parent entity 3,045,554 2,494,423
Basic earnings per share (cents per share) 0.80 0.77 Diluted earnings per share (cents per share) 0.76 0.72 Dividends per share (cents) - -
The accompanying notes form part of these financial statements.
14
For
per
sona
l use
onl
y
Mobile Embrace Limited and Controlled Entities Consolidated Statement of Profit or Loss for the year ended 30 June 2015
Consolidated Group 2015 2014
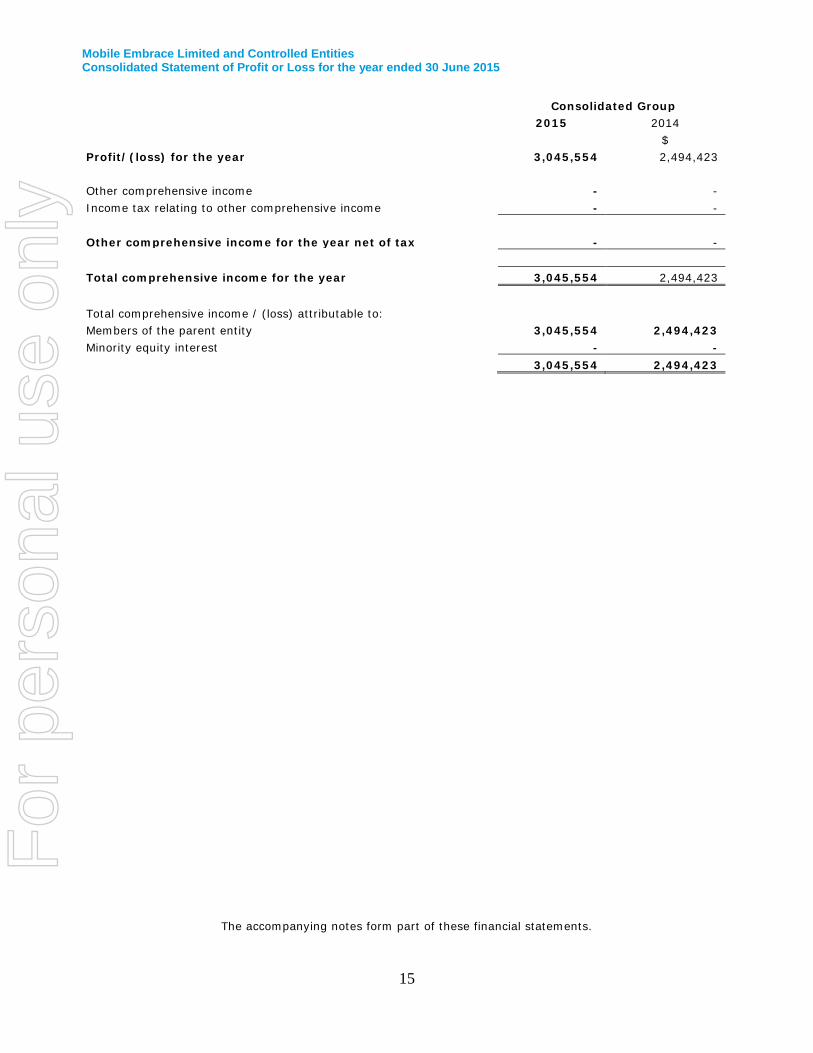
$ Profit/(loss) for the year 3,045,554 2,494,423 Other comprehensive income - - Income tax relating to other comprehensive income - - Other comprehensive income for the year net of tax - - Total comprehensive income for the year 3,045,554 2,494,423 Total comprehensive income / (loss) attributable to: Members of the parent entity 3,045,554 2,494,423 Minority equity interest - - 3,045,554 2,494,423
The accompanying notes form part of these financial statements.
15
For
per
sona
l use
onl
y
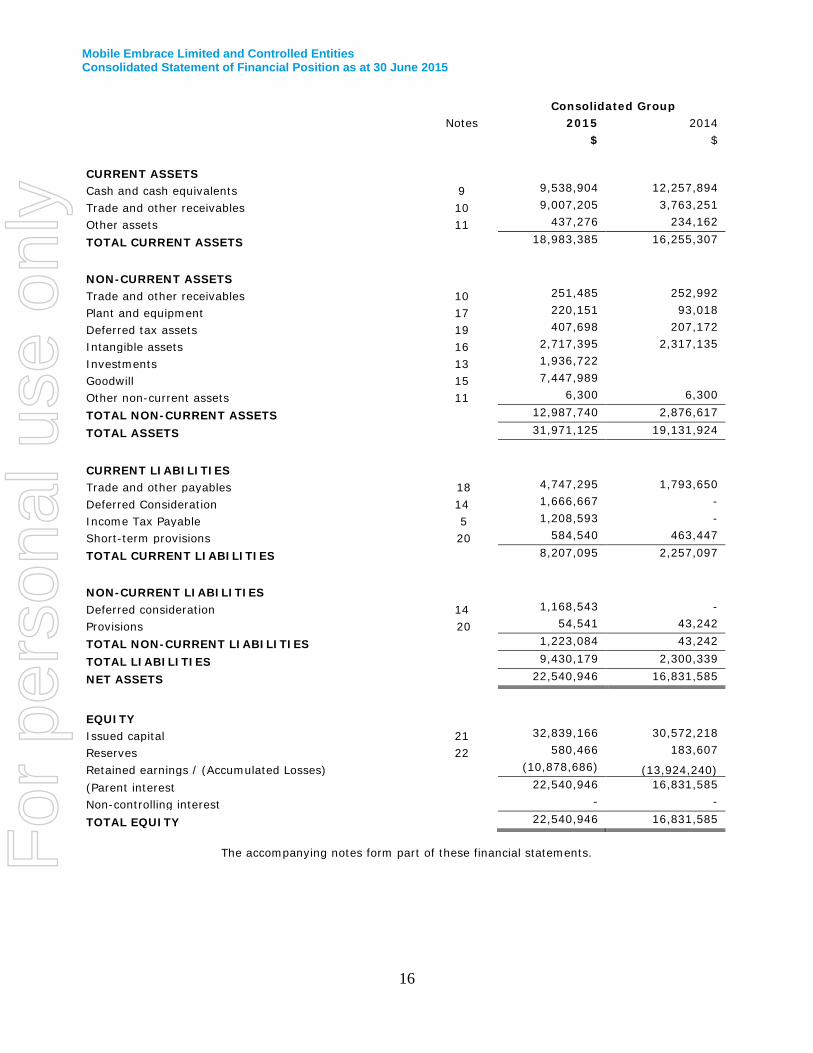
Mobile Embrace Limited and Controlled Entities Consolidated Statement of Financial Position as at 30 June 2015
Consolidated Group Notes 2015 2014 $ $ CURRENT ASSETS Cash and cash equivalents 9 9,538,904 12,257,894
Trade and other receivables 10 9,007,205 3,763,251
Other assets 11 437,276 234,162
TOTAL CURRENT ASSETS 18,983,385 16,255,307
NON-CURRENT ASSETS Trade and other receivables 10 251,485 252,992
Plant and equipment 17 220,151 93,018
Deferred tax assets 19 407,698 207,172
Intangible assets 16 2,717,395 2,317,135
Investments 13 1,936,722
Goodwill 15 7,447,989
Other non-current assets 11 6,300 6,300
TOTAL NON-CURRENT ASSETS 12,987,740 2,876,617
TOTAL ASSETS 31,971,125 19,131,924
CURRENT LIABILITIES Trade and other payables 18 4,747,295 1,793,650
Deferred Consideration 14 1,666,667 -
Income Tax Payable 5 1,208,593 -
Short-term provisions 20 584,540 463,447
TOTAL CURRENT LIABILITIES 8,207,095 2,257,097
NON-CURRENT LIABILITIES Deferred consideration 14 1,168,543 -
Provisions 20 54,541 43,242
TOTAL NON-CURRENT LIABILITIES 1,223,084 43,242
TOTAL LIABILITIES 9,430,179 2,300,339
NET ASSETS 22,540,946 16,831,585
EQUITY Issued capital 21 32,839,166 30,572,218
Reserves 22 580,466 183,607
Retained earnings / (Accumulated Losses) (10,878,686) (13,924,240)
(Parent interest 22,540,946 16,831,585
Non-controlling interest - -
TOTAL EQUITY 22,540,946 16,831,585
The accompanying notes form part of these financial statements.
16
For
per
sona
l use
onl
y

Mobile Embrace Limited and Controlled Entities
Consolidated Statement of Cash Flow for the year ended 30 June 2015
Consolidated Group
Notes 2015 2014 $ $
CASH FLOWS FROM OPERATING ACTIVITIES Receipts from customers 29,507,452 18,830,855 Payments to suppliers and employees (24,506,453) (15,706,663) Interest received 251,166 92,755 Net cash provided by / (used in) operating activities
24 5,252,165 3,216,947
CASH FLOWS FROM INVESTING ACTIVITIES Investment in acquisitions (4,612,779) - Investment in Clipp (1,936,722) - Purchase of property, plant and equipment (203,215) (536,584) Purchase of intangible assets (1,290,515) (1,989,685) Net cash used in investing activities (8,043,231) (2,526,269)
CASH FLOWS FROM FINANCING ACTIVITIES Repayment of borrowings (4,278) Proceeds from borrowings - Issue of capital 72,076 11,415,268
Net cash provided by / (used in) financing activities
72,076 11,410,990 Net increase / (decrease) in cash held (2,718,990) 12,101,668 Cash at beginning of financial year 12,257,894 156,226 Cash at end of financial year 9 9,538,904 12,257,894
The accompanying notes form part of these financial statements.
17
For
per
sona
l use
onl
y
Mobile Embrace Limited and Controlled Entities
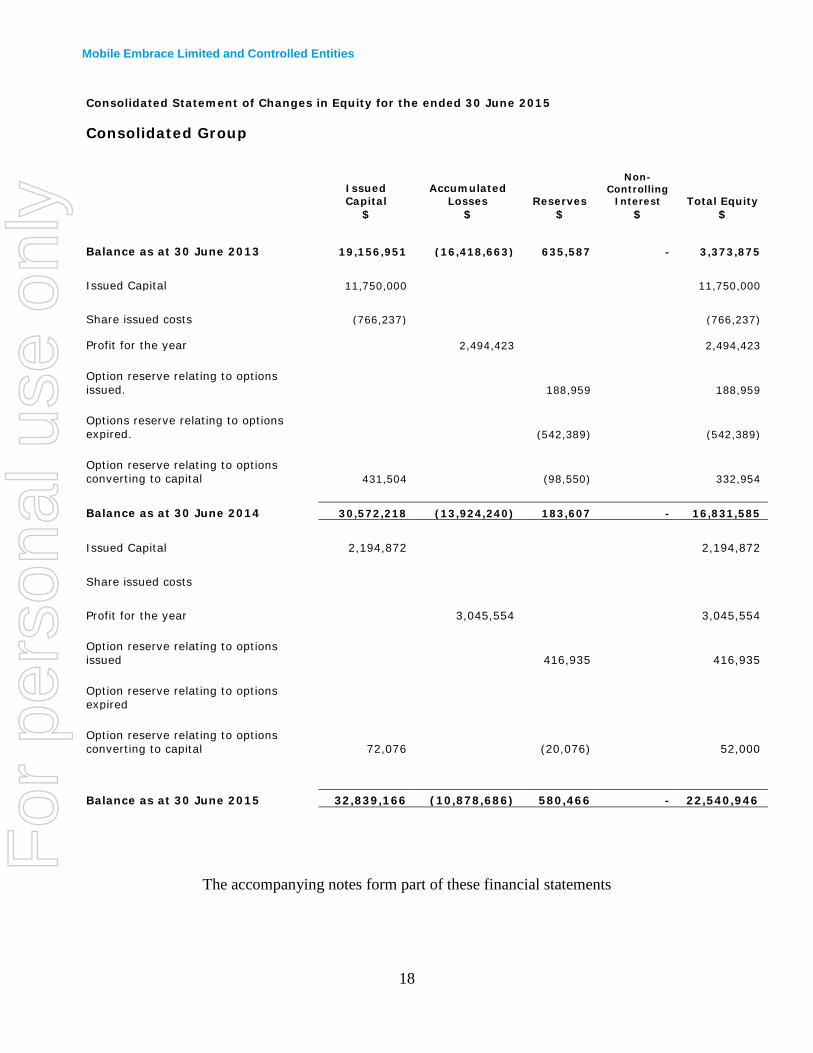
Consolidated Statement of Changes in Equity for the ended 30 June 2015 Consolidated Group
Issued Capital
Accumulated Losses
Reserves
Non-
Controlling Interest Total Equity
$ $ $ $ $
Balance as at 30 June 2013 19,156,951 (16,418,663) 635,587 - 3,373,875 Issued Capital 11,750,000 11,750,000 Share issued costs (766,237) (766,237)
Profit for the year
2,494,423 2,494,423 Option reserve relating to options issued. 188,959 188,959 Options reserve relating to options expired. (542,389) (542,389) Option reserve relating to options converting to capital 431,504 (98,550) 332,954 Balance as at 30 June 2014 30,572,218 (13,924,240) 183,607 - 16,831,585 Issued Capital 2,194,872 2,194,872 Share issued costs Profit for the year 3,045,554 3,045,554 Option reserve relating to options issued 416,935
416,935
Option reserve relating to options expired
Option reserve relating to options converting to capital 72,076 (20,076)
52,000
Balance as at 30 June 2015 32,839,166 (10,878,686) 580,466 - 22,540,946
The accompanying notes form part of these financial statements
18
For
per
sona
l use
onl
y

Mobile Embrace Limited and Controlled Entities Notes to the financial statements for the year ended 30 June 2015
Note 1. Summary of Significant Accounting Policies These consolidated financial statements and notes represent those of Mobile Embrace Limited and controlled entities (‘Consolidated Group’ or ‘Group’). The separate financial statements of the parent entity, Mobile Embrace Limited, have not been presented within this financial report as permitted by the Corporations Act 2001. The financial statements were authorised for issue on 4 August 2015 by the directors of the company. Basis of preparation The financial statements are general purpose financial statements that have been prepared in accordance with Australian Accounting Standards, Australian Accounting Interpretations, other authoritative pronouncements of the Australian Accounting Standards Board and the Corporations Act 2001. The Group is a for profit entity for financial reporting purposes under Australian Accounting Standards. Australian Accounting Standards set out accounting policies that the AASB has concluded would result in financial statements containing relevant and reliable information about transactions, events and conditions. Compliance with Australian Accounting Standards ensures that the financial statements and notes also comply with International Financial Reporting Standards as issued by IASB. Except for cash flow information the financial statements have been prepared on an accruals basis and are based on historical costs, modified, where applicable, by the measurement at fair value of selected non-current assets, financial assets and financial liabilities. The following is a summary of the material accounting policies adopted in the preparation of the financial statements. The accounting policies have been consistently applied, unless otherwise stated. a. Principles of Consolidation The consolidated financial statements incorporate the assets, liabilities and results of entities controlled by Mobile Embrace Limited at the end of the reporting period. A controlled entity is any entity over which Mobile Embrace Limited has the power to govern the financial and operating policies so as to obtain benefits from the entity’s activities. Where controlled entities have entered or left the Group during the year, the financial performance of those entities are included only for the period of the year that they were controlled. A list of controlled entities is contained in Note 12 to the financial statements. In preparing the consolidated financial statements, all inter-group balances and transactions between entities in the consolidated group have been eliminated in full on consolidation. Non-controlling interests, being the equity in a subsidiary not attributable, directly or indirectly, to a parent, are reported separately within the Equity section of the consolidated Statement of Financial Position and Statement of Profit or Loss. The minority interests in the net assets comprise their interests at the date of the original business combination and their share of changes in equity since that date. Business combinations Business combinations occur where an acquirer obtains control over one or more businesses. A business combination is accounted for by applying the acquisition method, unless it is a combination involving entities or businesses under common control. The business combination will be accounted for from the date that control is attained, whereby the fair value of the identifiable assets acquired and liabilities (including contingent liabilities) assumed is recognised (subject to certain limited exemptions). When measuring the consideration transferred in the business combination, any asset or liability resulting from a contingent consideration arrangement is also included. Subsequent to initial recognition, contingent consideration classified as equity is not remeasured and its subsequent settlement is accounted for within equity. Contingent consideration classified as an asset or liability is remeasured each reporting period to fair value, recognising any change to fair value in profit or loss, unless the change in value can be identified as existing at acquisition date.
19
For
per
sona
l use
onl
y
Mobile Embrace Limited and Controlled Entities Notes to the financial statements for the year ended 30 June 2015
Note 1. Summary of Significant Accounting Policies (continued) All transaction costs incurred in relation to the business combination are expensed to the statement of profit or loss. The acquisition of a business may result in the recognition of goodwill or a gain from a bargain purchase. Goodwill Goodwill is carried at cost less accumulated impairment losses. Goodwill is calculated as the excess of the sum of: (i) the consideration transferred;
(ii) any non-controlling interest; and (iii) the acquisition date fair value of any previously held equity interest over the acquisition date fair value of net identifiable assets acquired. The acquisition date fair value of the consideration transferred for a business combination plus the acquisition date fair value of any previously held equity interest shall form the cost of the investment in the separate financial statements. Fair value uplifts in the value of pre-existing equity holdings are taken to the statement of profit or loss. Where changes in the value of such equity holdings had previously been recognised in other comprehensive income, such amounts are recycled to profit or loss. The amount of goodwill recognised on acquisition of each subsidiary in which the Group holds less than a 100% interest will depend on the method adopted in measuring the non-controlling interest. The Group can elect in most circumstances to measure the non-controlling interest in the acquiree either at fair value (full goodwill method) or at the non-controlling interest's proportionate share of the subsidiary's identifiable net assets (proportionate interest method). In such circumstances, the Group determines which method to adopt for each acquisition and this is stated in the respective notes to these financial statements disclosing the business combination. Under the full goodwill method, the fair value of the non-controlling interest is determined using valuation techniques which make the maximum use of market information where available. Under this method, goodwill attributable to the non-controlling interests is recognised in the consolidated financial statements. Goodwill on acquisitions of subsidiaries is included in intangible assets. Goodwill on acquisition of associates is included in investments in associates. Goodwill is tested for impairment annually and is allocated to the Group's cash-generating units or groups of cash-generating units, representing the lowest level at which goodwill is monitored not larger than an operating segment. Gains and losses on the disposal of an entity include the carrying amount of goodwill related to the entity disposed of. Changes in the ownership interests in a subsidiary are accounted for as equity transactions and do not affect the carrying values of goodwill. b. Income Tax The income tax expense (revenue) for the year comprises current income tax expense (income) and deferred tax expense (income). Current income tax expense charged to profit or loss is the tax payable on taxable income. Current tax liabilities (assets) are measured at the amounts expected to be paid to (recovered from) the relevant taxation authority. Deferred income tax expense reflects movements in deferred tax asset and deferred tax liability balances during the year as well as unused tax losses. Current and deferred income tax expense (income) is charged or credited outside profit or loss when the tax relates to items that are recognised outside profit or loss. Except for business combinations, no deferred income tax is recognised from the initial recognition of an asset or liability, where there is no effect on accounting or taxable profit or loss.
20
For
per
sona
l use
onl
y

Mobile Embrace Limited and Controlled Entities Notes to the financial statements for the year ended 30 June 2015
Note 1. Summary of Significant Accounting Policies (continued) Deferred tax assets and liabilities are calculated at the tax rates that are expected to apply to the period when the asset is realised or the liability is settled and their measurement also reflects the manner in which management expects to recover or settle the carrying amount of the related asset or liability. Deferred tax assets relating to temporary differences and unused tax losses are recognised only to the extent that it is probable that future taxable profit will be available against which the benefits of the deferred tax asset can be utilised. Where temporary differences exist in relation to investments in subsidiaries, branches, associates, and joint ventures, deferred tax assets and liabilities are not recognised where the timing of the reversal of the temporary difference can be controlled and it is not probable that the reversal will occur in the foreseeable future. Current tax assets and liabilities are offset where a legally enforceable right of set-off exists and it is intended that net settlement or simultaneous realisation and settlement of the respective asset and liability will occur. Deferred tax assets and liabilities are offset where: (a) a legally enforceable right of set-off exists; and (b) the deferred tax assets and liabilities relate to income taxes levied by the same taxation authority on either the same taxable entity or different taxable entities where it is intended that net settlement or simultaneous realisation and settlement of the respective asset and liability will occur in future periods in which significant amounts of deferred tax assets or liabilities are expected to be recovered or settled. c. Plant and Equipment Each class of plant and equipment is carried at cost or fair value less, where applicable, any accumulated depreciation and impairment losses. Plant and equipment are measured on the cost basis and therefore carried at cost less accumulated depreciation and any accumulated impairment. In the event the carrying amount of plant and equipment is greater than the estimated recoverable amount, the carrying amount is written down immediately to the estimated recoverable amount and impairment losses are recognised either in profit or loss or as a revaluation decrease if the impairment losses relate to a re-valued asset. A formal assessment of recoverable amount is made when impairment indicators are present (refer to Note 1(f) for details of impairment). The carrying amount of plant and equipment is reviewed annually by directors to ensure it is not in excess of the recoverable amount from these assets. The recoverable amount is assessed on the basis of the expected net cash flows that will be received from the asset’s employment and subsequent disposal. The expected net cash flows have been discounted to their present values in determining recoverable amounts. Subsequent costs are included in the asset’s carrying amount or recognised as a separate asset, as appropriate, only when it is probable that future economic benefits associated with the item will flow to the Group and the cost of the item can be measured reliably. All other repairs and maintenance are charged to the statement of profit or loss during the financial period in which they are incurred. Depreciation The depreciable amount of all fixed assets is depreciated on a straight-line basis over their useful lives to the consolidated group commencing from the time the asset is held ready for use. Leasehold improvements are depreciated over the shorter of either the unexpired period of the lease or the estimated useful lives of the improvements. The depreciation rates used for each class of depreciable assets are:
Class of Fixed Asset Depreciation Rate Leasehold Improvements 20% Furniture and fittings 20% Computer equipment 33% Internet website 33% - 67% Software 25%
21
For
per
sona
l use
onl
y

Mobile Embrace Limited and Controlled Entities Notes to the financial statements for the year ended 30 June 2015
Note 1. Summary of Significant Accounting Policies (continued) The assets’ residual values and useful lives are reviewed, and adjusted if appropriate, at end of each reporting period. An asset’s carrying amount is written down immediately to its recoverable amount if the asset’s carrying amount is greater than its estimated recoverable amount. Gains and losses on disposals are determined by comparing proceeds with the carrying amount. These gains and losses are included in the statement of profit or loss. When re-valued assets are sold, amounts included in the revaluation reserve relating to that asset are transferred to retained earnings. d. Leases Leases of fixed assets: where substantially all the risks and benefits incidental to the ownership of the asset but not the legal ownership that is transferred to entities in the consolidated group, are classified as finance leases. Finance leases are capitalised by recording an asset and a liability at the lower of the amounts equal to the fair value of the leased property or the present value of the minimum lease payments, including any guaranteed residual values. Lease payments are allocated between the reduction of the lease liability and the lease interest expense for the period. Leased assets are depreciated on a straight-line basis over the shorter of their estimated useful lives or the lease term. Lease payments for operating leases, where substantially all the risks and benefits remain with the lessor, are charged as expenses in the periods in which they are incurred. Lease incentives under operating leases are recognised as a liability and amortised on a straight-line basis over the life of the lease term. e. Financial Instruments i. Initial Recognition and Measurement Financial assets and financial liabilities are recognised when the entity becomes a party to the contractual provisions to the instrument. For financial assets, this is equivalent to the date that the company commits itself to either the purchase or sale of the asset (ie trade date accounting is adopted). Financial instruments are initially measured at fair value plus transaction costs, except where the instrument is classified at fair value through profit or loss’, in which case transaction costs are expensed to profit or loss immediately. ii. Classification and Subsequent Measurement Loans and Receivables Loans and receivables are non-derivative financial assets with fixed or determinable payments that are not quoted in an active market and are substantially measured at amortised cost using the effective interest rate method. Loans and receivables are included in current assets, except for those which are not expected to mature within 12 months after reporting date. (All other loans and receivables are classified as non-current assets.) iii. Impairment At the end of each reporting period, the Group assesses whether there is objective evidence that a financial asset has been impaired. A financial asset (or a group of financial assets) is deemed to be impaired if, and only if, there is objective evidence of impairment as a result of one or more events (a “loss event”) having occurred, which has an impact on the estimated future cash flows of the financial asset(s).
22
For
per
sona
l use
onl
y

Mobile Embrace Limited and Controlled Entities Notes to the financial statements for the year ended 30 June 2015
Note 1. Summary of Significant Accounting Policies (continued) In the case of financial assets carried at amortised cost, loss events may include: indications that the debtors or a group of debtors are experiencing significant financial difficulty, default or delinquency in interest or principal payments; indications that they will enter bankruptcy or other financial reorganisation; and changes in arrears or economic conditions that correlate with defaults. For financial assets carried at amortised cost (including loans and receivables), a separate allowance account is used to reduce the carrying amount of financial assets impaired by credit losses. After having taken all possible measures of recovery, if management establishes that the carrying amount cannot be recovered by any means, at that point the written-off amounts are charged to the allowance account or the carrying amount of impaired financial assets is reduced directly if no impairment amount was previously recognised in the allowance account. When the terms of financial assets that would otherwise have been past due or impaired have been renegotiated, the Group recognises the impairment for such financial assets by taking into account the original terms as if the terms have not been renegotiated so that the loss events that have occurred are duly considered. iv. De-recognition Financial assets are derecognised when the contractual rights to receipt of cash flows expire or the asset is transferred to another party whereby the entity no longer has any significant continuing involvement in the risks and benefits associated with the asset. Financial liabilities are derecognised when the related obligations are discharged, cancelled or have expired. The difference between the carrying amount of the financial liability extinguished or transferred to another party and the fair value of consideration paid, including the transfer of non-cash assets or liabilities assumed, is recognised in profit or loss. f. Impairment of Assets At the end of each reporting period, the Group assesses whether there is any indication that an asset may be impaired. The assessment will include the consideration of external and internal sources of information including dividends received from subsidiaries, associates or jointly controlled entities deemed to be out of pre-acquisition profits. If such an indication exists, an impairment test is carried out on the asset by comparing the recoverable amount of the asset, being the higher of the asset’s fair value less costs to sell and value in use, to the asset’s carrying amount. Any excess of the asset’s carrying amount over its recoverable amount is recognised immediately in profit or loss, unless the asset is carried at a re-valued amount in accordance with another Standard (eg. in accordance with the revaluation model in AASB 116). Any impairment loss of a re-valued asset is treated as a revaluation decrease in accordance with that other Standard. Where it is not possible to estimate the recoverable amount of an individual asset, the Group estimates the recoverable amount of the cash-generating unit to which the asset belongs. Impairment testing is performed annually for goodwill and intangible assets with indefinite lives. g. Intangible assets other than goodwill Research and development Expenditure during the research phase of a project is recognised as an expense when incurred. Software and product Development costs are capitalised only when technical feasibility studies identify that the project will deliver future economic benefits and these benefits can be measured reliably. Development costs have a finite life and are amortised on a systematic basis matched to the future economic benefits over the useful life of the project. h. Foreign Currency Transactions and Balances Functional and presentation currency The functional currency of each of the Group’s entities is measured using the currency of the primary economic environment in which that entity operates. The consolidated financial statements are presented in Australian dollars which is the parent entity’s functional and presentation currency.
23
For
per
sona
l use
onl
y
Mobile Embrace Limited and Controlled Entities Notes to the financial statements for the year ended 30 June 2015
Note 1. Summary of Significant Accounting Policies (continued) Transaction and balances Foreign currency transactions are translated into functional currency using the exchange rates prevailing at the date of the transaction. Foreign currency monetary items are translated at the year-end exchange rate. Non-monetary items measured at historical cost continue to be carried at the exchange rate at the date of the transaction. Non-monetary items measured at fair value are reported at the exchange rate at the date when fair values were determined. Exchange differences arising on the translation of monetary items are recognised in the statement of profit or loss, except where deferred in equity as a qualifying cash flow or net investment hedge. Exchange differences arising on the translation of non-monetary items are recognised directly in equity to the extent that the gain or loss is directly recognised in equity; otherwise the exchange difference is recognised in the statement of profit and loss. Group companies The financial results and position of foreign operations whose functional currency is different from the Group’s presentation currency are translated as follows:
- Assets and liabilities are translated at year-end exchange rates prevailing at the end of that reporting period;
- Income and expenses are translated at average exchange rates for the period; and - Retained earnings are translated at the exchange rates prevailing at the date of the transaction.
Exchange differences arising on translation of foreign operations are transferred directly to the Group’s foreign currency translation reserve in the statement of financial position. These differences are recognised in the statement of profit or loss in the period in which the operation is disposed. i. Provisions Provisions are recognised when the Group has legal or constructive obligation, as a result of past events, for which it is probable that an outflow of economic benefits will result and that outflow can be reliably measured. Provisions are measured using the best estimate of the amounts required to settle the obligation at the end of the reporting period. j. Employee Benefits Provision is made for the Group’s liability for employee benefits arising from services rendered by employees to the end of the reporting period. Employee benefits that are expected to be settled within one year have been measured at the amounts expected to be paid when the liability is settled. Employee benefits payable later than one year have been measured at the present value of the estimated future cash outflows to be made for those benefits. In determining the liability, consideration is given to employee wages increases and the probability that the employee may satisfy vesting requirements. Those cash flows are discounted using market yields on national government bonds with terms to maturity that match the expected timing of cash flows. Equity-settled compensation The Group operates an employee share ownership plan. Share-based payments to employees are measured at the fair value of the instruments issued and amortised over the vesting periods. Share-based payments to non-employees are measured at the fair value of goods or services received or the fair value of the equity instruments issued, if it is determined the fair value of the goods or services cannot be reliably measured, and are recorded at the date the goods or services are received. The corresponding amount is recorded to the option reserve. The fair value of options is determined using the Black-Scholes pricing model. The number of shares and options expected to vest is reviewed and adjusted at the end of each reporting period such that the amount recognised for services received as consideration for the equity instruments granted is based on the number of equity instruments that eventually vest.
24
For
per
sona
l use
onl
y

Mobile Embrace Limited and Controlled Entities Notes to the financial statements for the year ended 30 June 2015
Note 1. Summary of Significant Accounting Policies (continued) k. Cash and Cash Equivalents Cash and cash equivalents include cash on hand, deposits held at call with banks, other short-term highly liquid investments with original maturities of three months or less, and bank overdrafts. Bank overdrafts are shown within short-term borrowings in current liabilities on the statement of financial position. l. Revenue Revenue is measured at the fair value of the consideration received or receivable after taking into account any trade discounts and volume rebates allowed. When the inflow of consideration is deferred, it is treated as the provision of financing and is discounted at a rate of interest that is generally accepted in the market for similar arrangements. The difference between the amount initially recognised and the amount ultimately received is interest revenue. Revenue from the sale of goods is recognised at the point of delivery as this corresponds to the transfer of significant risks and rewards of ownership of the goods and the cessation of all involvement in those goods. Interest revenue is recognised using the effective interest rate method. All revenue is stated net of the amount of goods and services tax (GST). m. Borrowing Costs Borrowing costs directly attributable to the acquisition, construction or production of assets that necessarily take a substantial period of time to prepare for their intended use or sale, are added to the cost of those assets, until such time as the assets are substantially ready for their intended use or sale. All other borrowing costs are recognised in the period in which they are incurred. n. Goods and Services Tax (GST) Revenues, expenses and assets are recognised net of the amount of GST, except where the amount of GST incurred is not recoverable from the Australian Taxation Office (ATO). Receivables and payables are stated inclusive of the amount of GST receivable or payable. The net amount of GST recoverable from, or payable to, the ATO is included with other receivables or payables in the statement of financial position. Cash flows are presented on a gross basis. The GST components of cash flows arising from investing or financing activities which are recoverable from, or payable to, the ATO are presented as operating cash flows included in receipts from customers or payments to suppliers. o. Comparative Figures Where required by Accounting Standards, comparative figures have been adjusted to conform to changes in presentation for the current financial year. Where the Group has retrospectively applied an accounting policy or makes a retrospective restatement of items in the financial statements, or when it reclassifies items in its financial statements, an additional statement of financial position as at the beginning of the earliest comparative period will be disclosed. p. Critical Accounting Estimates and Judgment The directors evaluate estimates and judgments incorporated into the financial statements based on historical knowledge and best available current information. Estimates assume a reasonable expectation of future events and are based on current trends and economic data, obtained both externally and within the Group.
25
For
per
sona
l use
onl
y

Mobile Embrace Limited and Controlled Entities Notes to the financial statements for the year ended 30 June 2015
Note 1. Summary of Significant Accounting Policies (continued) Estimation uncertainty Information about estimates and assumptions that have the most significant effect on recognition and measurement of assets, liabilities, income and expenditures is provided below. Actual results may be substantially different. Key Estimates – Impairment The Group assesses impairment at the end of each reporting period by evaluating conditions specific to the Group that may be indicative of impairment triggers. Recoverable amounts of relevant assets are reassessed using value-in-use calculations which incorporate various key assumptions. In assessing impairment, management estimates the recoverable amount of each asset or cash-generating unit based on expected future cash flows and uses an interest rate to discount them. Estimation uncertainty relates to assumptions about future operating results and the determination of a suitable discount rate. As a result of impairment testing on the carrying amount of goodwill a provision for impairment has not been recognised in the financial year ending 30 June 2015. Useful lives of depreciable assets Management reviews its estimate of the useful lives of depreciable assets at each reporting date, based on the expected utility of the assets. Uncertainties in these estimates relate to technical obsolescence that may change the utility of certain software and IT equipment. As a result of impairment testing on the useful lives of depreciable assets a provision for impairment of $65,633 has been recognised in respect of software development undertaken in the financial year ending June 2013. Key Judgements – Provisions of Impairment of Receivables A provision for impairment of $108,863 has been recognised in respect of receivables as at year ended 30 June 2015. q. New Accounting Standards for Application in Future Periods Accounting Standards and Interpretations issued by the AASB that are not yet mandatorily applicable to the Group, together with an assessment of the potential impact of such pronouncements on the Group when adopted in future periods, are discussed below: AASB 9: Financial Instruments and associated Amending Standards (applicable to annual reporting periods beginning on or after 1 January 2018). The Standard will be applicable retrospectively (subject to the provisions on hedge accounting outlined below) and includes revised requirements for the classification and measurement of financial instruments, revised recognition and derecognition requirements for financial instruments and simplified requirements for hedge accounting. The key changes that may affect the Group on initial application include certain simplifications to the classification of financial assets, simplifications to the accounting of embedded derivatives, upfront accounting for expected credit loss, and the irrevocable election to recognise gains and losses on investments in equity instruments that are not held for trading in other comprehensive income. AASB 9 also introduces a new model for hedge accounting that will allow greater flexibility in the ability to hedge risk, particularly with respect to hedges of non-financial items. Should the entity elect to change its hedge policies in line with the new hedge accounting requirements of the Standard, the application of such accounting would be largely prospective. Although the directors anticipate that the adoption of AASB 9 may have an impact on the Group’s financial instruments, including hedging activity, it is impracticable at this stage to provide a reasonable estimate of such impact. AASB 15: Revenue from Contracts with Customers (applicable to annual reporting periods commencing on or after 1 January 2017).
26
For
per
sona
l use
onl
y

Mobile Embrace Limited and Controlled Entities Notes to the financial statements for the year ended 30 June 2015
Note 1. Summary of Significant Accounting Policies (continued) q. New Accounting Standards for Application in Future Periods (continued) When effective, this Standard will replace the current accounting requirements applicable to revenue with a single, principles-based model. Except for a limited number of exceptions, including leases, the new revenue model in AASB 15 will apply to all contracts with customers as well as non-monetary exchanges between entities in the same line of business to facilitate sales to customers and potential customers. The core principle of the Standard is that an entity will recognise revenue to depict the transfer of promised goods or services to customers in an amount that reflects the consideration to which the entity expects to be entitled in exchange for the goods or services. To achieve this objective, AASB 15 provides the following five-step process:
- identify the contract(s) with a customer; - identify the performance obligations in the contract(s); - determine the transaction price; - allocate the transaction price to the performance obligations in the contract(s); and - recognise revenue when (or as) the performance obligations are satisfied.
This Standard will require retrospective restatement, as well as enhanced disclosures regarding revenue. Although the directors anticipate that the adoption of AASB 15 may have an impact on the Group's financial statements, it is impracticable at this stage to provide a reasonable estimate of such impact.
Note 2: Parent Information
2015 $
2014 $
The following information has been extracted from the books and records of the parent and has been prepared in accordance with Accounting Standards.
Statement of Financial Position
Assets
Current assets 259,828 259,828
Total current Assets 259,828 259,828
Non-current assets 15,363,208 12,699,400
Total non-current assets 15,363,208 12,699,400
Total Assets 15,623,036 12,959,228
Liabilities
Current liabilities 1,208,593 -
Total current liabilities 1,208,593 -
Non-current liabilities - -
Total non-current liabilities - -
Total Liabilities 1,208,593 -
27
For
per
sona
l use
onl
y

Mobile Embrace Limited and Controlled Entities Notes to the financial statements for the year ended 30 June 2015
Note 2: Parent Information
2015 $
2014 $
Net Assets 14,414,443 12,959,228
Equity
Issued capital 32,839,166 30,572,218
Accumulated losses (19,005,189) (17,796,597)
Reserve 580,466 183,607
Total Equity 14,414,443 12,959,228
Statement of Comprehensive Income
Total profit / (loss) - -
Total comprehensive income - -
Guarantees Mobile Embrace Limited has not entered into any guarantees, in the current or previous financial year, in relation to the debts of its subsidiaries. Contractual commitments At 30 June 2015, Mobile Embrace Limited had not entered into any contractual commitments for the acquisition of property, plant and equipment (2014: nil). Note 3: Revenue and Other Income Consolidated Group
2015 $
2014 $
a) Revenue from continuing operations
Sales revenue:
- Revenue from services rendered 32,764,621 19,180,637
Interest received:
- other persons 251,301 92,755
Total revenue 33,015,922 19,273,392 b) Total revenue and other income
• attributable to members of the parent entity 33,015,922 19,273,392 • attributable to non-controlling interests - -
33,015,922 19,273,392
28
For
per
sona
l use
onl
y

Mobile Embrace Limited and Controlled Entities Notes to the financial statements for the year ended 30 June 2015
Note 4. Profit / (loss) for the Year a. Expenses Consolidated Group
2015 2014 Borrowing expenses: Interest expense 135 9,737 Legal expenses: Legal fees 175,404 62,642 Total legal expenses 175,404 62,642 Amortisation and impairment of intangible assets: Software and website development 890,255 442,184 Impairment of intangible assets 65,633 101,913 Total amortisation and impairment 955,888 544,097
Depreciation of non-current assets: Computer equipment 42,892 24,298 Furniture and fixtures 1,915 1,989 Leasehold improvements 7,499 4,233 Total depreciation 52,306 30,520 Rental expense: Rental expense on operating leases 358,437 299,609 Total rental expense 358,437 299,609 Capitalised Employee Salaries:
Capitalised IT development 353,231 520,128 Capitalise International development 199,652 600,426 Capitalised Platform development 168,937 87,458 Total Capitalised Employee Salaries 721,820 1,208,012 Employee Benefits expense: Employee Benefits expense 7,248,659 4,683,982 Total Employee Benefits expense 7,248,659 4,683,982 Total Employee Benefits expenditure 7,970,479 5,891,994
29
For
per
sona
l use
onl
y

Mobile Embrace Limited and Controlled Entities Notes to the financial statements for the year ended 30 June 2015
Note 5. Income Tax Expense
Note 5: Income Tax Expense a. The components of income tax expense/(credit) comprise: ` Deferred Tax (200,526) 5,360 Current Tax 1,208,593 65,511 Over/under provision from prior years 5,428 68 1,013,495 70,939 b. The prima facie tax on profit/(loss) from ordinary activities before income tax is reconciled to the income tax expense/(benefit) as follows:
Prima facie tax on profit/(loss) before income tax at 30% (2014: 30%) 1,217,714 769,609 Tax effect of: - Other non-assessable items - (83,222) - Other deductible items (324,819) (212,464) - Other non-allowable items 115,172 273,776 - Carried forward tax losses utilised - (682,188) Tax incentive 5,428 5,360 - Movements in Deferred Taxes - 68 Income tax attributable to entity 1,013,495 70,939
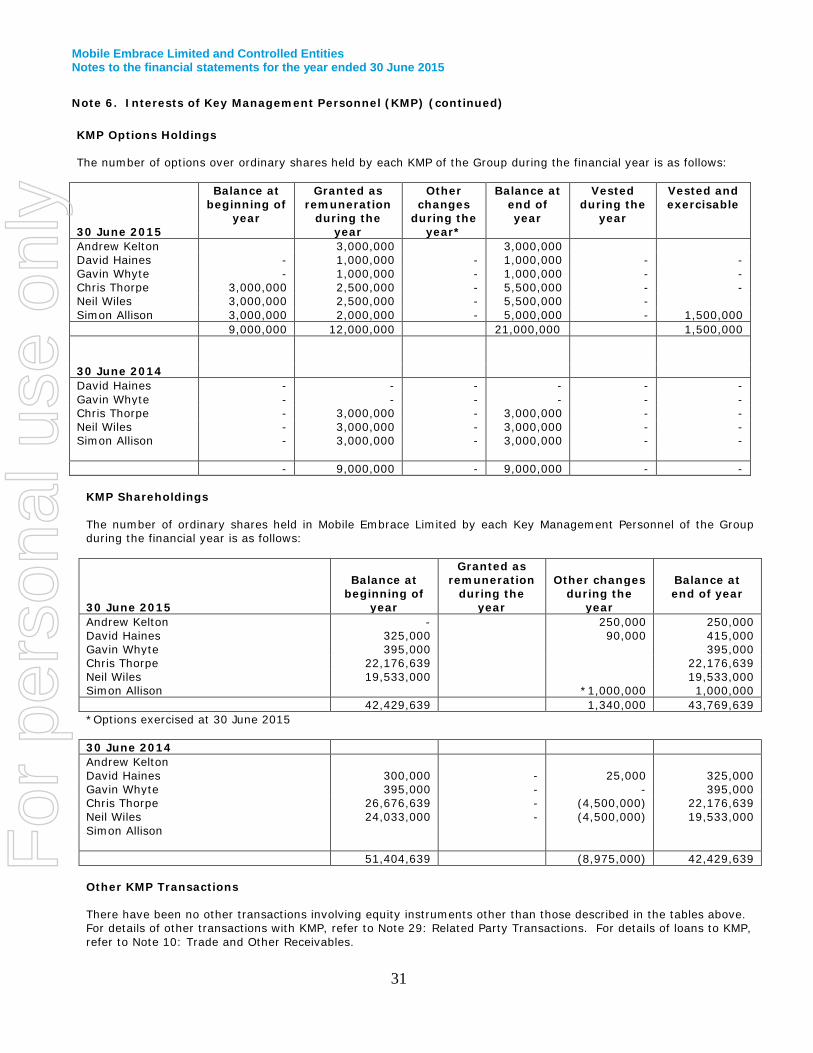
Note 6. Interests of Key Management Personnel (KMP) Refer to the remuneration report contained in the directors’ report for details of the remuneration paid or payable to each member of the Group’s key management personnel for the year ended 30 June 2015. The totals of remuneration paid to KMP of the company and the Group during the year are as follows: • Short-term employee benefits 1,024,576 980,546 • Post-employment benefits 73,718 66,568 1,098,294 1,047,114
30
For
per
sona
l use
onl
y
Mobile Embrace Limited and Controlled Entities Notes to the financial statements for the year ended 30 June 2015
Note 6. Interests of Key Management Personnel (KMP) (continued) KMP Options Holdings The number of options over ordinary shares held by each KMP of the Group during the financial year is as follows:
30 June 2015
Balance at beginning of
year
Granted as remuneration
during the year
Other changes
during the year*
Balance at end of year
Vested during the
year
Vested and exercisable
Andrew Kelton 3,000,000 3,000,000 David Haines - 1,000,000 - 1,000,000 - - Gavin Whyte - 1,000,000 - 1,000,000 - - Chris Thorpe 3,000,000 2,500,000 - 5,500,000 - - Neil Wiles 3,000,000 2,500,000 - 5,500,000 - Simon Allison 3,000,000 2,000,000 - 5,000,000 - 1,500,000 9,000,000 12,000,000 21,000,000 1,500,000 30 June 2014 David Haines - - - - - - Gavin Whyte - - - - - - Chris Thorpe - 3,000,000 - 3,000,000 - - Neil Wiles - 3,000,000 - 3,000,000 - - Simon Allison - 3,000,000 - 3,000,000 - - - 9,000,000 - 9,000,000 - -
KMP Shareholdings The number of ordinary shares held in Mobile Embrace Limited by each Key Management Personnel of the Group during the financial year is as follows:
30 June 2015
Balance at
beginning of year
Granted as remuneration
during the year
Other changes
during the year
Balance at end of year
Andrew Kelton - 250,000 250,000 David Haines 325,000 90,000 415,000 Gavin Whyte 395,000 395,000 Chris Thorpe 22,176,639 22,176,639 Neil Wiles 19,533,000 19,533,000 Simon Allison *1,000,000 1,000,000 42,429,639 1,340,000 43,769,639 *Options exercised at 30 June 2015 30 June 2014 Andrew Kelton David Haines 300,000 - 25,000 325,000 Gavin Whyte 395,000 - - 395,000 Chris Thorpe 26,676,639 - (4,500,000) 22,176,639 Neil Wiles 24,033,000 - (4,500,000) 19,533,000 Simon Allison 51,404,639 (8,975,000) 42,429,639 Other KMP Transactions There have been no other transactions involving equity instruments other than those described in the tables above. For details of other transactions with KMP, refer to Note 29: Related Party Transactions. For details of loans to KMP, refer to Note 10: Trade and Other Receivables.
31
For
per
sona
l use
onl
y

Mobile Embrace Limited and Controlled Entities Notes to the financial statements for the year ended 30 June 2015
Note 7. Auditors’ Remuneration Consolidated Group 2015 2014 $ $
Remuneration of the auditor of the parent entity for: Parent Company Auditor 112,105 88,000 Subsidiary Company Auditor 6,861 - 118,966 88,000
Note 8. Earnings Per Share a. Reconciliation of earnings to profit or loss:
Profit/ (Loss) 3,045,554 2,494,423
Profit/ (Loss) attributable to non-controlling equity interest -
Earnings used to calculate basic EPS 3,045,554 2,494,423
Earnings used in the calculation of dilutive EPS 3,045,554 2,494,423
b. Reconciliation of earnings to profit or loss from continuing operations:
Profit from continuing operations 3,045,554 2,494,423
Profit attributable to non-controlling equity interest in respect of continuing operations
Earnings used to calculate basic EPS from continuing operations 3,045,554 2,494,423
Earnings used in the calculation of dilutive EPS from continuing operations 3,045,554 2,494,423
c. Reconciliation of earnings to profit or loss from discontinued operations:
Loss from discontinued operations - -
Loss attributable to non-controlling equity interest - -
Earnings used to calculate basic EPS from discontinued operations - -
No. No.
d. Weighted average number of ordinary shares outstanding during the year used in calculating basic EPS 382,956,843 320,351,620
Weighted average number of dilutive options outstanding 19,774,151 26,170,000
Weighted average number of ordinary shares outstanding during the year used in calculating dilutive EPS 402,730,994 346,521,620
Note 9. Cash and Cash Equivalents Cash at bank and in hand 4,538,904 2,148,710 Deposits at call 5,000,000 10,109,184 9,538,904 12,257,894 The effective interest rate on at call bank deposits was 2.25% (2014: 3.22%).
32
For
per
sona
l use
onl
y
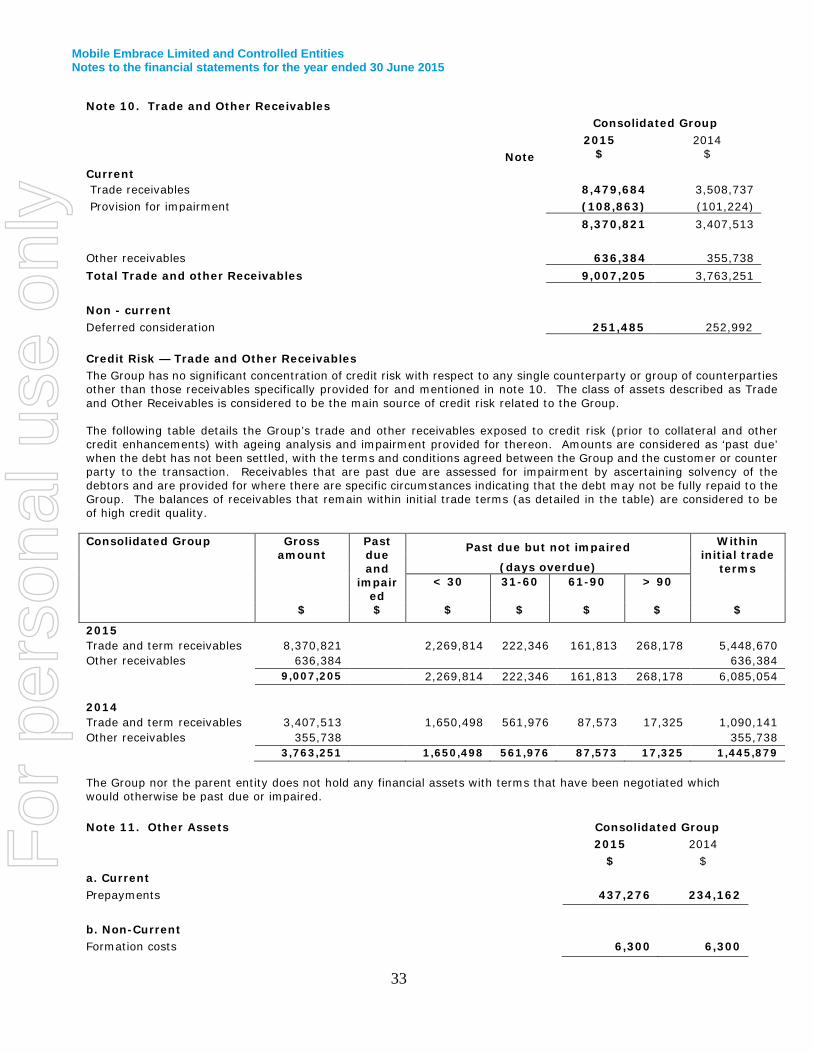
Mobile Embrace Limited and Controlled Entities Notes to the financial statements for the year ended 30 June 2015
Note 10. Trade and Other Receivables Consolidated Group 2015 2014
Note $ $
Current Trade receivables 8,479,684 3,508,737 Provision for impairment (108,863) (101,224) 8,370,821 3,407,513 Other receivables 636,384 355,738 Total Trade and other Receivables 9,007,205 3,763,251 Non - current Deferred consideration 251,485 252,992 Credit Risk — Trade and Other Receivables The Group has no significant concentration of credit risk with respect to any single counterparty or group of counterparties other than those receivables specifically provided for and mentioned in note 10. The class of assets described as Trade and Other Receivables is considered to be the main source of credit risk related to the Group. The following table details the Group’s trade and other receivables exposed to credit risk (prior to collateral and other credit enhancements) with ageing analysis and impairment provided for thereon. Amounts are considered as ‘past due’ when the debt has not been settled, with the terms and conditions agreed between the Group and the customer or counter party to the transaction. Receivables that are past due are assessed for impairment by ascertaining solvency of the debtors and are provided for where there are specific circumstances indicating that the debt may not be fully repaid to the Group. The balances of receivables that remain within initial trade terms (as detailed in the table) are considered to be of high credit quality. Consolidated Group Gross
amount Past due and
impaired
Past due but not impaired Within initial trade
terms (days overdue) < 30 31-60 61-90 > 90
$ $ $ $ $ $ $
2015 Trade and term receivables 8,370,821 2,269,814 222,346 161,813 268,178 5,448,670 Other receivables 636,384 636,384 9,007,205 2,269,814 222,346 161,813 268,178 6,085,054 2014 Trade and term receivables 3,407,513 1,650,498 561,976 87,573 17,325 1,090,141 Other receivables 355,738 355,738 3,763,251 1,650,498 561,976 87,573 17,325 1,445,879
The Group nor the parent entity does not hold any financial assets with terms that have been negotiated which would otherwise be past due or impaired. Note 11. Other Assets Consolidated Group 2015 2014 $ $ a. Current Prepayments 437,276 234,162 b. Non-Current Formation costs 6,300 6,300
33
For
per
sona
l use
onl
y
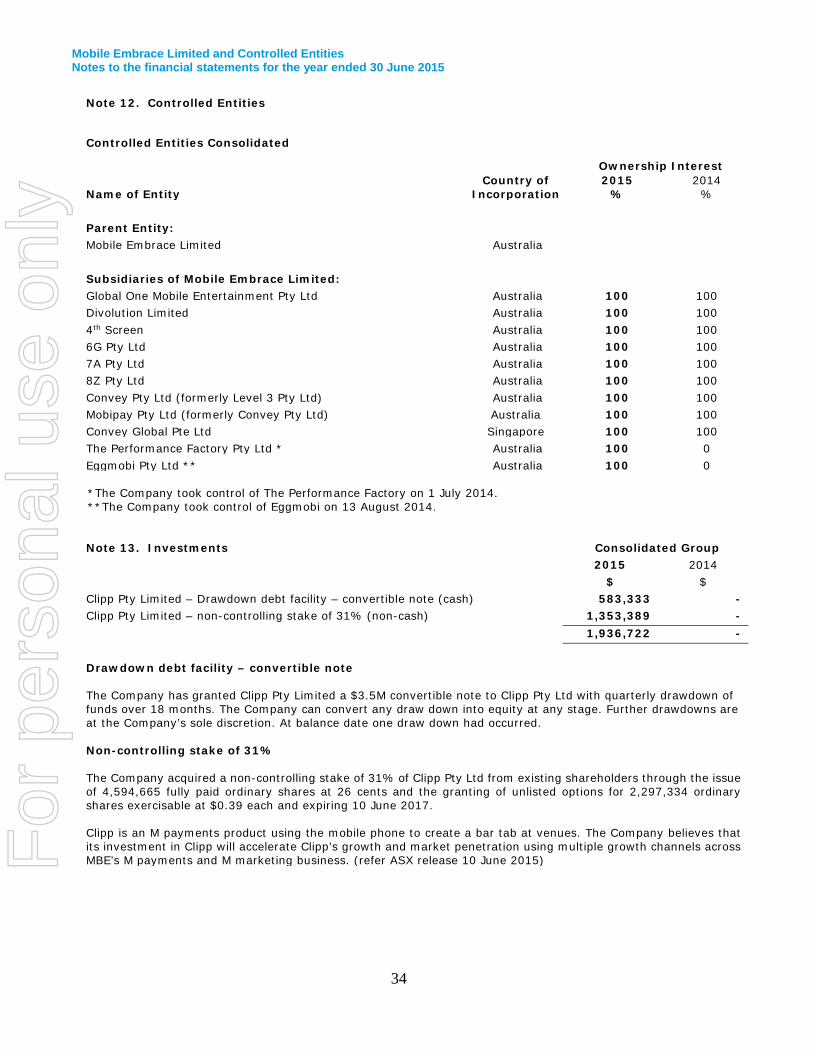
Mobile Embrace Limited and Controlled Entities Notes to the financial statements for the year ended 30 June 2015
Note 12. Controlled Entities
Controlled Entities Consolidated
Name of Entity
Country of
Incorporation
Ownership Interest 2015
% 2014
% Parent Entity: Mobile Embrace Limited Australia Subsidiaries of Mobile Embrace Limited: Global One Mobile Entertainment Pty Ltd Australia 100 100 Divolution Limited Australia 100 100 4th Screen Australia 100 100 6G Pty Ltd Australia 100 100 7A Pty Ltd Australia 100 100 8Z Pty Ltd Australia 100 100 Convey Pty Ltd (formerly Level 3 Pty Ltd) Australia 100 100 Mobipay Pty Ltd (formerly Convey Pty Ltd) Australia 100 100 Convey Global Pte Ltd Singapore 100 100 The Performance Factory Pty Ltd * Australia 100 0 Eggmobi Pty Ltd ** Australia 100 0
*The Company took control of The Performance Factory on 1 July 2014. **The Company took control of Eggmobi on 13 August 2014.
Note 13. Investments Consolidated Group 2015 2014 $ $ Clipp Pty Limited – Drawdown debt facility – convertible note (cash) 583,333 - Clipp Pty Limited – non-controlling stake of 31% (non-cash) 1,353,389 - 1,936,722 - Drawdown debt facility – convertible note The Company has granted Clipp Pty Limited a $3.5M convertible note to Clipp Pty Ltd with quarterly drawdown of funds over 18 months. The Company can convert any draw down into equity at any stage. Further drawdowns are at the Company’s sole discretion. At balance date one draw down had occurred.
Non-controlling stake of 31% The Company acquired a non-controlling stake of 31% of Clipp Pty Ltd from existing shareholders through the issue of 4,594,665 fully paid ordinary shares at 26 cents and the granting of unlisted options for 2,297,334 ordinary shares exercisable at $0.39 each and expiring 10 June 2017. Clipp is an M payments product using the mobile phone to create a bar tab at venues. The Company believes that its investment in Clipp will accelerate Clipp’s growth and market penetration using multiple growth channels across MBE’s M payments and M marketing business. (refer ASX release 10 June 2015)
34
For
per
sona
l use
onl
y

Mobile Embrace Limited and Controlled Entities Notes to the financial statements for the year ended 30 June 2015
Note 14 Business combinations: Acquisitions Acquired Controlled Entities – The Performance factory: The Company took control of The Performance Factory on 1 July 2014. The Performance Factory Pty Ltd was acquired by the Company by purchasing 100% of the issued capital for a total consideration of $3.2M plus potential consideration of up to a further $4M over 2 years and subject to profit before tax targets through to 2017. Part of the consideration of $3.2M consisted of 4,000,000 fully paid ordinary shares at 25 cents. These shares are held in escrow until the 28 November 2015. (Refer ASX release 21 November 2014) The details of the business combination are as follows:
$’000 Fair value of consideration transferred Amount in cash 2,200,000 Amount in shares 1,000,000 Contingent consideration 2,000,000 Total value of consideration 5,200,000 Recognised amounts of identifiable assets - Cash at bank 116,240 - Trade and other receivable 501,583 - Fixed Assets 33,203 Recognised amounts of identifiable liabilities - Trade payables (622,658) - GST & PAYB payable (51,808) Recognised amounts of identifiable net assets/ (liabilities) (23,440) Goodwill – Total value of consideration less identifiable net assets/(liabilities)
5,223,440
The acquisition was settled by: a) a cash payment of $2.2 million b) the issue of scrip in Mobile Embrace limited of 4.0 million shares at a price of 25 cents per share (an attributable value of $1 million) c) a potential consideration of $4 million of over the next 2.5 years based on the Achievement of earnings targets for FY 2015, FY 2016 and FY 2017. In calculating the contingent consideration relating to the earnings targets the Company believes that the FY 2015 and FY 2016 targets are 100% achievable and that it is highly unlikely that the FY 2017 target is achievable. As at the 30 June 2015 there have been no changes in the estimates of the profitable cash outflow and hence no adjustment to the liability. Acquisition related costs of $33,750 are not included as part of consideration transferred and have been recognised as an expense in the consolidated statement of profit and loss and other comprehensive income, as part of the legal expense and as part of the other expenses Identifiable net Assets The fair value of the trade and other receivables acquired as part of the business combination amounted to $501,583. As of the acquisition date, management believed that this was collectable. Goodwill Goodwill of $5,223,440 is primarily related to the growth expectations, future profitability and the synergy between The Performance factory and M payments and M marketing business units of the Company. The Performance Factories contribution to the group results The Performance Factory posted an EBITDA of $1,416,846 for the period 1 July 2014 to the 30 June 2015. The acquisition of The Performance Factory has contributed to the groups EBITDA in the reporting period by $1,416,846.
35
For
per
sona
l use
onl
y

Mobile Embrace Limited and Controlled Entities Notes to the financial statements for the year ended 30 June 2015
Note 14 Acquisitions and Business combinations (continued) Contingent Consideration – The Performance Factory: As at 30 June 2015, the contingent consideration of $2,000,000 recognised in regard to the acquisition of The Performance Factory Pty Ltd, has a balance payable in subsequent periods of $1,000,000. The balance of the contingent consideration at balance date has been classified: Current Portion $1,000,000 Non-Current Portion $1,000,000 Acquired Controlled Entities - Eggmobi: The Company took control of Eggmobi on 13 August 2014. Eggmobi Pty Limited was acquired by Mobile Embrace by purchasing 100% of the issued capital for a total consideration of $1.4 million with additional earn out contingent on performance in line with the company’s growth targets. (Refer ASX release 24 December 2014) The details of the business combination are as follows:
$’000 Fair value of consideration transferred Amount in cash 1,412,775 Contingent consideration 836,210 Total value of consideration 2,248,985 Recognised amounts of identifiable assets - Cash at bank 6,508 - Trade and other receivable 24,427 - Fixed Assets 1,169 Recognised amounts of identifiable liabilities - Trade payables (7,668) Recognised amounts of identifiable net assets 24,436 Goodwill – Total value of consideration less identifiable net assets 2,224,549
The acquisition was settled by: a) a cash payment of $1,412,775. c) A potential consideration of $2 million of over the next 2.5 years based on the Achievement of EBITDA targets for FY 2015, FY 2016 and FY 2017. In calculating the contingent consideration relating to the EBITDA targets the Company believes that the FY 2015 and FY 2016 targets are 100% achievable and that it is highly unlikely that the FY 2017 target is achievable. As at the 30 June 2015 there have been no changes in the estimates of the profitable cash outflow and hence no adjustment to the liability. Acquisition related costs of $28,320 are not included as part of consideration transferred and have been recognised as an expense in the consolidated statement of profit and loss and other comprehensive income, as part of the legal expense. Identifiable net Assets The fair value of the trade and other receivables acquired as part of the business combination amounted to $24,427. As of the acquisition date, management believed that this was collectable.
36
For
per
sona
l use
onl
y

Mobile Embrace Limited and Controlled Entities Notes to the financial statements for the year ended 30 June 2015
Note 14 Acquisitions and Business combinations (continued) Acquired Controlled Entities - Eggmobi: Goodwill Goodwill of $2,224,549 is primarily related to the growth expectations, future profitability and the synergy between Eggmobi and M marketing. Eggmobi contribution to the group results Eggmobi posted an EBITDA of $701,721 for the period 13 August 2014 to the 30 June 2015. The acquisition of Eggmobi has contributed to the groups EBITDA in the reporting period by $701,721. From the 1 July 2014 to the 12 August 2014 Eggmobi lost $303. Contingent Consideration – Eggmobi: As at 30 June 2015, the contingent consideration of $835,210 recognised in regard to the acquisition of Eggmobi Pty Ltd, has a balance payable in subsequent periods of $835.210 The balance of the contingent consideration at balance date has been classified: Current Portion $666,667 Non-Current Portion $168,543 Note 15. Goodwill Consolidated Group 2015 2014
Goodwill $ $
Goodwill on acquisitions – The Performance factory 5,223,440 Goodwill on acquisitions - Eggmobi 2,224,549 - Accumulated Impairment - - Carrying Value at 30 June 2015 7,447,989 - Impairment testing
For the purposes of annual impairment testing goodwill is broken down into the following cash generated units which is consistent with business combination calculations.
The Performance Factory (TPF) 5,223,440 Eggmobi (Egg) 2,224,549 Goodwill allocation at 30 June 2015 7,447,989 The recoverable amounts of the cash generating units were determined based on the value-in-use calculations covering a detailed 5 year forecast, followed by an extrapolation of expected cash flows for the units remaining useful lives using the growth rates determined by management. The present value of the expected cash flows of each segment is determined by applying a suitable discount rate. Management has taken into account the industry growth rates and the relative likely competitive pressures on the sector, and the market growth rates for FY15 against FY14 (TPF revenue growth 110%, Egg revenue growth 457%). The discount rate is based on the WACC for the Company. Since Company has no debt the calculation becomes the return on equity (NPAT/Shareholders Equity: 11.92%)
37
For
per
sona
l use
onl
y

Mobile Embrace Limited and Controlled Entities Notes to the financial statements for the year ended 30 June 2015
Note 15. Goodwill (continued) Growth rates and Discount rates: FY16 FY17 FY18 FY19 FY20 TPF Growth rates 30% 20% 10% nil nil Discount rates 12% 12% 12% 12% 12% Egg Growth rates 30% 25% nil nil nil Discount rates 12% 12% 12% 12% 12%
Cash flow assumptions Management’s key assumptions for both businesses include, stable margin, increased head count through FY 2016 and FY2017 and strong revenue growth across FY 2016 and FY 2017. While management believes growth will continue across FY 2018 to FY 2020 given the sectors infancy and increasing adoption rates for FY 2019 and FY 2020 management has assumed no growth. Management tested a range of sensitives including different discount rates for the impairment testing ranging from 12% to 18%. Apart from the considerations described in determining the value-in-use of the cash generating units described above, management is not currently aware of any other probable changes that would necessitate changes in its key estimates. Impairment testing:
Cash Generating unit Carrying amount of Goodwill NPV of cash flow Surplus/(deficit) The Performance factory 5,223,440 6,529,634 1,306,194 Eggmobi 2,224,549 3,051,421 826,872
*applying discount rate of 12%
38
For
per
sona
l use
onl
y

Mobile Embrace Limited and Controlled Entities Notes to the financial statements for the year ended 30 June 2015
Note 16. Intangible Assets
Consolidated Group 2015 2014 $ $
Software development
4,536,383
3,360,338 Accumulated Amortisation (1,951,759) (1,095,883)
Net Carrying Value
2,584,624
2,264,455 Content and Web development costs 278,354 163,884 Accumulated Amortisation (145,583) (111,204) Net Carrying Value 132,771 52,680
Total Intangibles 2,717,395 2,317,135
Movements in Carrying Amounts
Movement in the carrying amount for each class of intangible assets between the beginning and the end of the current year.
Consolidated Group:
Software and development
$
Premium SMS
Shortcodes $
Content & Web
Development Costs
$
Goodwill
$
Total
$
Year ended 30 June 2014 Balance at the beginning of the year 429,361 - - - 429,361 Additions: external acquired software
1,121,946
-
- 1,121,946
Additions: internally developed software
1,131,576
76,436
1,208,012
Disposals - - - - - Amortisation/Impairment (418,428) - (23,756) - (442,184) 2,264,455 52,680 2,317,135 Year ended 30 June 2015 Balance at the beginning of the year 2,264,455 52,680 2,317,135 Additions: external acquired software
568,691
568,691
Additions: internally developed software
607,354
114,470
721,824
Disposals Amortisation /Impairment (855,876) (34,379) (890,255) 2,584,624 132,771 2,717,395
39
For
per
sona
l use
onl
y

Mobile Embrace Limited and Controlled Entities Notes to the financial statements for the year ended 30 June 2015
Note 17. Plant and Equipment Consolidated Group 2015 2014 $ $
Computer equipment At cost 540,943 342,603 Accumulated depreciation (338,558) (271,891) 202,385 70,712 Furniture and Fittings At cost 33,076 28,201 Accumulated depreciation (29,014) (27,098) 4,062 1,103 Leasehold Improvements At cost 167,623 167,623 Accumulated depreciation (153,919) (146,420) 13,704 21,203 Total Plant and Equipment 220,151 93,018
Note 18. Trade and Other Payables CURRENT 2015 2014
Trade Payables 3,083,252 1,180,482 Sundry payables and accrued expenses 1,664,043 613,168 4,747,295 1,793,650
Movements in Carrying Amounts Movements in the carrying amounts for each class of plant and equipment between the beginning and the end of the current financial year:
Consolidated Group:
Computer Equipment
$
Furniture and Fittings
$
Leasehold
Improvements $
Total $
Balance at 1 July 2013 19,717 3,092 6,329 29,138 Additions 75,293 - 19,107 94,400 Disposals - - - -
Depreciation expense (24,298) (1,989) (4,233) (30,520)
Balance at 30 June 2014 70,712 1,103 21,203 93,018
Balance at the beginning of year 70,712 1,103 21,203 93,018 Additions 198,340 4,875 - 203,215 Disposals
Depreciation expense (66,667) (1,916) (7,499) (76,082)
Closing value at 30 June 2015 202,385 4,062 13,704 220,151
40
For
per
sona
l use
onl
y

Mobile Embrace Limited and Controlled Entities Notes to the financial statements for the year ended 30 June 2015
Note 19. Tax
Opening Balance
Charged to Income Other
Closing Balance CONSOLIDATED GROUP
Deferred Tax Assets
Provisions
152,006
39,718
-
191,724
Accrued Expenses 55,166 160,808
-
215,974
Balance at 30 June 2015
207,172
200,526
-
407,698 Deferred Tax assets not brought to account, the benefits of which will be realised if the conditions of deductibility set out in Note 1b occur: Tax losses: capital loss: $14,443 (2014: $14,443) Tax losses: operating loss: nil (2014: Nil )
Note 20. Provisions
Long term Employee Benefits: 2015 2014
Opening balance at beginning of financial year 506,689 179,403
Additional provisions 132,392 327,286
Amounts used
Balance at end of financial year 639,081 506,689
Analysis of total provisions
Current 584,540 463,447
Non- current 54,541 43,242 A provision has been recognised for employee entitlements relating to long service leave. In calculating the present value of future cash flows in respect of long service leave, the probability of long service leave being taken is based on historical data. The measurement and recognition criteria relating to employee benefits have been included in Note 1.
41
For
per
sona
l use
onl
y

Mobile Embrace Limited and Controlled Entities Notes to the financial statements for the year ended 30 June 2015
Note 21. Issued Capital Consolidated Group 2015 2014 $ $ Ordinary shares 386,429,763 (2014:369,270,098) fully paid ordinary shares 32,829,166 30,572,218 No. No. a. Ordinary shares At the beginning of the reporting period 369,270,098 307,877,790 Shares issued during the year 17,159,665 61,392,308 At reporting date 386,429,763 369,270,098
During the Financial year ending 30 June 2015: 8,565,000 options were exercised at various exercise prices. The Performance Factory Pty Ltd was acquired by the Company for a total consideration of $3.2M plus potential consideration of up to a further $4M over 2 years and subject to profit before tax targets through 2017. Part of the consideration of $3.2M consisted of 4,000,000 fully paid ordinary shares at 25 cents. These shares are held in escrow until the 28 November 2015. (Refer ASX release 21 November 2014) The Company acquired a non-controlling stake of 31% of Clipp Pty Ltd from existing shareholders through the issue of 4,594,665 fully paid ordinary shares at 26 cents. These shares are held in escrow until the 10 June 2016. (Refer ASX release 10 June 2015) Ordinary shares participate in dividends and the proceeds on winding up of the parent entity in proportion to the number of shares held. At the shareholders’ meetings each ordinary share is entitled to one vote when a poll is called, otherwise each shareholder has one vote on a show of hands.
b. Capital Management Management controls the capital of the Group in order to maintain a good debt to equity ratio, provide the shareholders with adequate returns and ensure that the Group can fund its operations and continue as a going concern. The Group’s debt and capital includes ordinary share capital, and financial liabilities, supported by financial assets.
c. Options For information relating to the Mobile Embrace Limited employee option plan including details of options issued, exercised and lapsed during the financial year and the options outstanding at year-end, refer to Note 25 Share Based Payments. For information relating to share options issued to Key Management personnel during the financial year, refer to Note 6 Key Management Personnel Compensation.
Post Balance date: On the 3 July 2015: 5,440,000 employee performance based options were vested converting to shares and held in trust by AET SFS Pty Ltd <MBE employee plan A/C>. On the 29 July 2015 350,000 employee options lapsed due to forfeiture under the MBE performance rights and options plan.
42
For
per
sona
l use
onl
y

Mobile Embrace Limited and Controlled Entities Notes to the financial statements for the year ended 30 June 2015
Note 22. Reserves Consolidated Group 2015 2014 $ $ Employee equity settled benefits
Opening Balance 169,950 528,731
Expensed during the year 258,419 188,959
Exercised during the year (20,076) (98,290)
Cancelled during the year (449,450)
Closing Balance 408,293 169,950
Other equity settled benefits Opening balance 13,656 106,856
Granted/Exercised during the year 158,517 (93,200)
Cancelled during the year -
Closing Balance 172,173 13,656
At reporting date 580,466 183,606
Employee equity settled benefits reserve arises on the grant of share options to employees under the Mobile Embrace Limited Employee Share Option Plan. Amounts are transferred out of the reserve into issued capital when the options are exercised. Further information about share based payments to employees is in Note 25 to the financial statements. Note 23. Operating Segments Identification of reportable segments The Group has identified its operating segments based on the internal reports that are reviewed and used by the Board of Directors (chief operating decision makers) in assessing performance and determining the allocation of resources. The Group is managed primarily on the basis of product category and service offerings as the diversification of the Group’s operations inherently have different risk profiles and performance assessment criteria. Operating segments are therefore determined on the same basis. Reportable segments disclosed are based on aggregating operating segments where the segments are considered to have similar economic characteristics and are also similar with respect to the following:
• The products sold and / or services provided by segment; • the type or class of customer for the products or services; • the distribution method; and • any external regulatory requirements.
43
For
per
sona
l use
onl
y
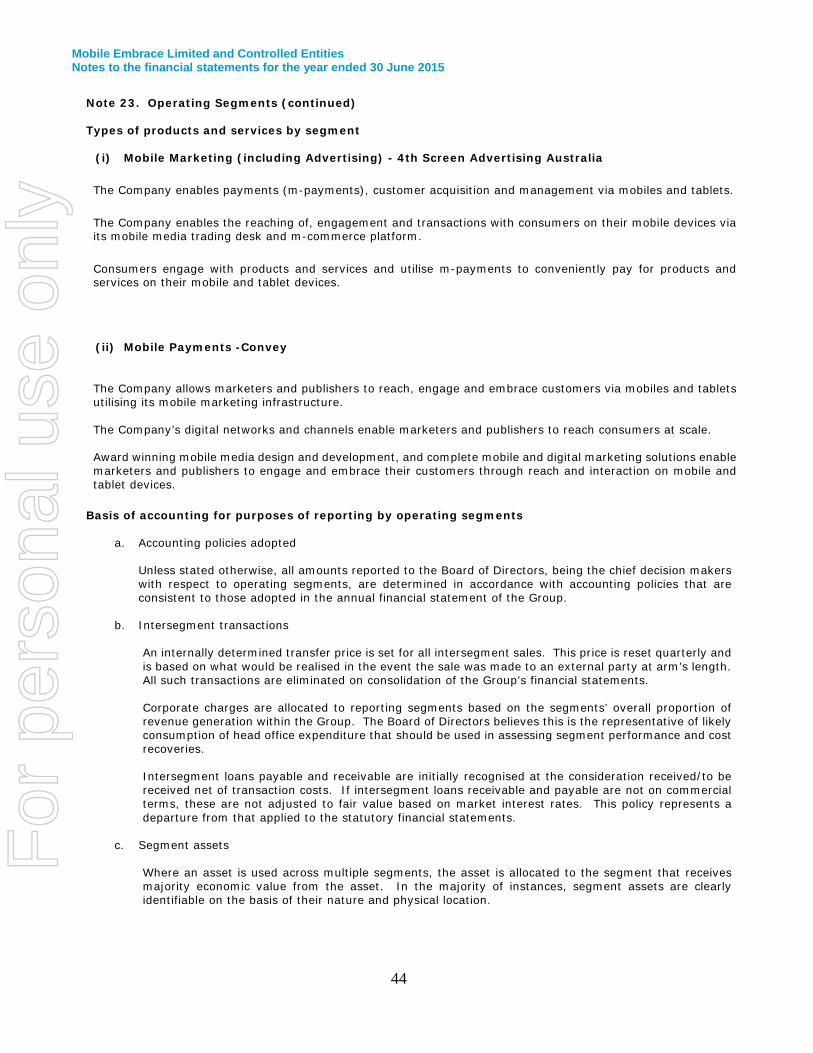
Mobile Embrace Limited and Controlled Entities Notes to the financial statements for the year ended 30 June 2015
Note 23. Operating Segments (continued) Types of products and services by segment
(i) Mobile Marketing (including Advertising) - 4th Screen Advertising Australia
The Company enables payments (m-payments), customer acquisition and management via mobiles and tablets.
The Company enables the reaching of, engagement and transactions with consumers on their mobile devices via its mobile media trading desk and m-commerce platform.
Consumers engage with products and services and utilise m-payments to conveniently pay for products and services on their mobile and tablet devices.
(ii) Mobile Payments -Convey The Company allows marketers and publishers to reach, engage and embrace customers via mobiles and tablets utilising its mobile marketing infrastructure. The Company’s digital networks and channels enable marketers and publishers to reach consumers at scale. Award winning mobile media design and development, and complete mobile and digital marketing solutions enable marketers and publishers to engage and embrace their customers through reach and interaction on mobile and tablet devices.
Basis of accounting for purposes of reporting by operating segments
a. Accounting policies adopted
Unless stated otherwise, all amounts reported to the Board of Directors, being the chief decision makers with respect to operating segments, are determined in accordance with accounting policies that are consistent to those adopted in the annual financial statement of the Group.
b. Intersegment transactions
An internally determined transfer price is set for all intersegment sales. This price is reset quarterly and is based on what would be realised in the event the sale was made to an external party at arm’s length. All such transactions are eliminated on consolidation of the Group’s financial statements. Corporate charges are allocated to reporting segments based on the segments’ overall proportion of revenue generation within the Group. The Board of Directors believes this is the representative of likely consumption of head office expenditure that should be used in assessing segment performance and cost recoveries. Intersegment loans payable and receivable are initially recognised at the consideration received/to be received net of transaction costs. If intersegment loans receivable and payable are not on commercial terms, these are not adjusted to fair value based on market interest rates. This policy represents a departure from that applied to the statutory financial statements.
c. Segment assets
Where an asset is used across multiple segments, the asset is allocated to the segment that receives majority economic value from the asset. In the majority of instances, segment assets are clearly identifiable on the basis of their nature and physical location.
44
For
per
sona
l use
onl
y

Mobile Embrace Limited and Controlled Entities Notes to the financial statements for the year ended 30 June 2015
Note 23. Operating Segments (continued)
d. Segment liabilities
Liabilities are allocated to segments where there is a direct nexus between the incurrence of the liability and the operations of the segment. Borrowings and tax liabilities are generally considered to relate to the Group as a whole and are not allocated. Segment liabilities include trade and other payables and certain direct borrowings.
e. Unallocated items
The following items of revenue, expenses, assets and liabilities are not allocated to operating segments as they are not considered part of the core operations of any segment: - impairment of assets and other non-recurring items of revenue or expense; - income tax expense; - deferred tax assets and liabilities; - current tax liabilities; - other financial liabilities; and - intangible assets;
(iii) Segment Performance
30 June 2015 M pay $
M mar $
Total $
REVENUE
External sales 21,837,249 10,927,372 32,764,621 Interest Revenue 251,301 - 251,301 Total segment revenue 22,088,550 10,927,372 33,015,922
Segment Gross profit 9,584,821 4,981,434 14,566,255
Segment net profit / (loss) before tax 6,274,952 676,497 6,951,449
Reconciliation of segment result to group net profit / loss before tax Amounts not included in segment results but reviewed by the Board:
Depreciation and amortisation (972,951)
Unallocated items:
Corporate charges (1,919,449)
Net profit / (loss) before tax 4,059,049
45
For
per
sona
l use
onl
y

Mobile Embrace Limited and Controlled Entities Notes to the financial statements for the year ended 30 June 2015
Note 23. Operating Segments (continued) 30 June 2014 M Pay
$ M Mar
$ Total
$ REVENUE
External sales 14,161,569 5,019,068 19,180,637 Interest Revenue 92,755 - 92,755 Total segment revenue 14,254,324 5,019,068 19,273,392
Segment Gross profit 8,072,064 3,161,616 11,233,680
Segment net profit / (loss) before tax 4,864,365 72,750 4,937,115
Reconciliation of segment result to group net profit / loss before tax Amounts not included in segment results but reviewed by the Board:
Depreciation and amortisation (574,617)
Unallocated items:
Corporate charges: (1,797,136)
Net profit / (loss) before tax 2,565,362
(iv) Segment assets 30 June 2015 M Pay
$ M Mar
$ Total
$ Segment assets 6,714,719 5,918,793 12,633,512 Unallocated assets:
- Cash at bank 4,538,904 - Term Deposit 5,000,000 - Deferred tax assets 407,698 - Investments 1,936,722 - Goodwill 7,447,989 - other 6,300
Total group assets 31,971,125 30 June 2014 M Pay
$ M Mar
$ Total
$ 5,341,149 1,325,709 6,666,858 Segment assets Unallocated assets:
- Cash at Bank 2,148,710 - Term Deposit 10,109,184 - Deferred tax assets 207,172
Total group assets 19,131,924
46
For
per
sona
l use
onl
y

Mobile Embrace Limited and Controlled Entities Notes to the financial statements for the year ended 30 June 2015
Note 23. Operating Segments (continued) (v) Segment liabilities 30 June 2015 M Pay
$ M Mar
$ Total
$ Segment liabilities 1,854,752 2,947.262 4,802,014 Unallocated liabilities:
- Income tax payable 1,208,593 - Deferred consideration 2,835,032 - Short term provisions 584,540
Total group liabilities 9,430,179 30 June 2014 M Pay
$
M Mar $
Total $
Segment liabilities 999,515 1,300,824 2,300,339 Total group liabilities 999,515 1,300,824 2,300,339 (vi) Revenue by geographical region Revenue attributable to external customers is disclosed below, based on the location of the external customer
30 June 2015
$
30 June 2014
$ Australia 31,512,493 18,302,813 Singapore M marketing - 596,104 Singapore M payments 456,216 - New Zealand M marketing 341,519 363,842 United Kingdom M payments 348,370 10,633 Switzerland M Payments 357,324 - Total revenue
33,015,922 19,273,392 (vii) Assets by geographical region The location of segment assets by geographical location of the assets is disclosed below:
30 June 2015
$
30 June 2014
$
Australia 31,510,164 18,839,440 Singapore 434,394 257,539 New Zealand 26,567 35,423 European Union - - America - 4,950 Total segment assets 31,971,125 19,137,352
47
For
per
sona
l use
onl
y
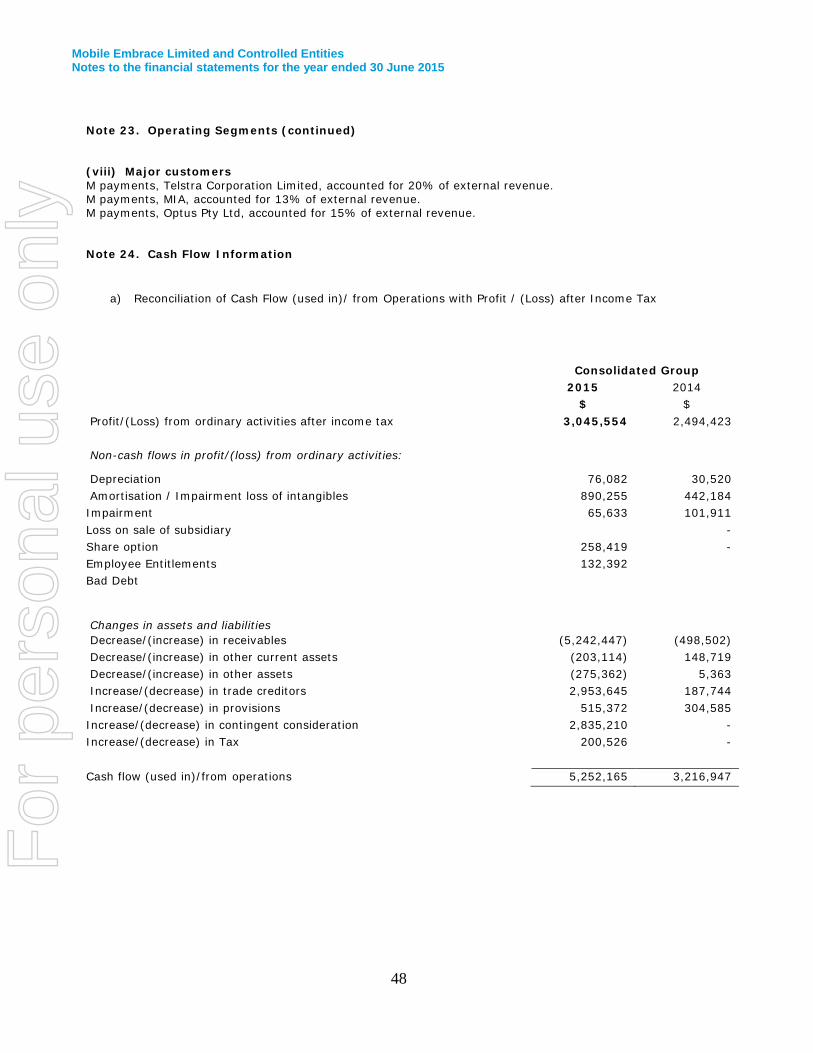
Mobile Embrace Limited and Controlled Entities Notes to the financial statements for the year ended 30 June 2015
Note 23. Operating Segments (continued) (viii) Major customers M payments, Telstra Corporation Limited, accounted for 20% of external revenue. M payments, MIA, accounted for 13% of external revenue. M payments, Optus Pty Ltd, accounted for 15% of external revenue. Note 24. Cash Flow Information
a) Reconciliation of Cash Flow (used in)/ from Operations with Profit / (Loss) after Income Tax
Consolidated Group
2015 2014 $ $
Profit/(Loss) from ordinary activities after income tax 3,045,554 2,494,423 Non-cash flows in profit/(loss) from ordinary activities:
Depreciation 76,082 30,520 Amortisation / Impairment loss of intangibles 890,255 442,184 Impairment 65,633 101,911 Loss on sale of subsidiary - Share option 258,419 - Employee Entitlements 132,392 Bad Debt
Changes in assets and liabilities Decrease/(increase) in receivables (5,242,447) (498,502) Decrease/(increase) in other current assets (203,114) 148,719 Decrease/(increase) in other assets (275,362) 5,363 Increase/(decrease) in trade creditors 2,953,645 187,744 Increase/(decrease) in provisions 515,372 304,585 Increase/(decrease) in contingent consideration 2,835,210 - Increase/(decrease) in Tax 200,526 - Cash flow (used in)/from operations 5,252,165 3,216,947
48
For
per
sona
l use
onl
y

Mobile Embrace Limited and Controlled Entities Notes to the financial statements for the year ended 30 June 2015
Note 25. Share Based Payments (i) The following share based payments were made during the financial year 2015:
a) The Performance Factory Pty Ltd was acquired by the Company for a total consideration of $3.2M plus potential consideration of up to a further $4M over 2 years and subject to profit before tax targets through 2017. Part of the consideration of $3.2M consisted of 4,000,000 fully paid ordinary shares at 25 cents. These shares are held in escrow until the 28 November 2015. (Refer ASX release 21 November 2014)
b) The Company acquired a non-controlling stake of 31% of Clipp Pty Ltd from existing shareholders through the issue of 4,594,665 fully paid ordinary shares at 26 cents and the granting of unlisted options for 2,297,334 ordinary shares exercisable at $0.39 each and expiring 10 June 2017. The shares are held in escrow until the 10 June 2016. (Refer ASX release 10 June 2015)
(ii) A summary of the movements of all companies options issued is as follows: Number Weighted
Average Exercise Price
Options outstanding as at 30 June 2010 12,850,000 $0.0619 Granted - - Forfeited (200,000) $0.0375 Exercised - - Expired (3,000,000) $0.1128 Options outstanding as at 30 June 2011 9,650,000 $0.0466 Granted 12,800,000 $0.0203 Forfeited - - Exercised - - Expired (6,650,000) $0.0375 Options outstanding as at 30 June 2012 15,800,000 $0.0295 Granted 16,250,000 $0.0130 Forfeited (3,000,000) $0.0688 Exercised - - Options outstanding as at 30 June 2013 29,050,000 $0.0393 Granted 9,225,000 $0.0224 Forfeited Exercised (15,200,000) $0.0201 Options exercisable as at 30 June 2014 23,075,000 $0.0129 Granted 19,197,334 $0.1618 Forfeited (550,000) $0.0000 Exercised (8,565,000) $0.0258 Options exercisable as at 30 June 2015 33,157,334 $0.0985 Options exercisable as at 30 June 2014: 23,075,000 $0.0129
49
For
per
sona
l use
onl
y

Mobile Embrace Limited and Controlled Entities Notes to the financial statements for the year ended 30 June 2015
Note 26. Options Share options granted as consideration for acquisition during the financial year The amount relating to options granted expensed to the Statement of profit or loss for the 2013-14 financial year was $258,419 (2014: $272,857). On the 3 July 2014: 5,440,000 employee performance based options were vested converting to shares and held in trust by AET SFS Pty Ltd <MBE employee plan A/C>. On the 30 July 2014: 550,000 employee options lapsed due to forfeiture under the MBE performance rights and options plan. Post Balance date: On the 3 July 2015: 5,440,000 employee performance based options were vested converting to shares and held in trust by AET SFS Pty Ltd <MBE employee plan A/C>. On the 29 July 2015 350,000 employee options lapsed due to forfeiture under the MBE performance rights and options plan.
Note 27. Dividends Consolidated Group 2015 2014 $ $ No dividends were provided for or paid - - Dividends franking account Balance of franking account at year end arising from payment of provision for income tax 779,446 779,446 The above available amounts are based on the balance of the dividend franking account at year-end, adjusted for franking credits that will arise from the payment of the amount of the provision for income tax.
Note 28. After Balance Date Events On the 3 July 2015: 5,440,000 employee performance based options were vested converting to shares and held in trust by AET SFS Pty Ltd <MBE employee plan A/C>. On the 29 July 2015 350,000 employee options lapsed due to forfeiture under the MBE performance rights and options plan. The Company has acquired Vizmond Media Pty Ltd for a total consideration of $2.5M plus potential consideration of up to a further $3.5M over 3 years and subject to profit before tax targets through to 2018. Vizmond media is a digital performance based marketing company with cutting edge proprietary technology developed over the last 3 years. Other than the above, there have been no events that have occurred since the reporting date which would materially impact on the financial position of the Company and its controlled entities. Note 29. Related Party Transactions Transactions between related parties are on normal commercial terms and conditions no more favourable than those available to other parties unless otherwise stated. Transactions with related parties: nil (2014: nil)
50
For
per
sona
l use
onl
y

Mobile Embrace Limited and Controlled Entities Notes to the financial statements for the year ended 30 June 2015
Note 30. Contingent Liabilities There are no contingent liabilities at balance date. Note 31. Leasing Commitments Consolidated Group 2015 2014 $ $ a) Hire-purchase commitments Payable - not later than one year - - - later than one year but not later than five years - -
Minimum payments - - Less: future finance charges Present value of minimum payments - - Minimum hire-purchase payments - - b) Operating lease commitments Non-cancellable operating lease contracted for but not recognised in the financial statements: Payable - not later than one year - - - later than one year but not later than five years - -
- - The property lease is on a month to month Tenancy.
Note 32. Financial Risk Management The Group does not engage in any significant transactions that are speculative in nature. The Group's financial instruments consist mainly of deposits with banks, accounts receivable and payable, loans to and from subsidiaries. The Board of Directors monitor and manage financial risk exposures of the Group. The Board monitors the Group’s financial risk management policies and exposures and approves financial transactions within the scope of its authority. It also reviews the effectiveness of internal controls relating to counter party credit risk, currency risk, financing risk and interest rate risk. The Board’s overall risk management strategy seeks to assist the Group in meeting its financial targets while minimising potential adverse effects on financial performance.
51
For
per
sona
l use
onl
y

Mobile Embrace Limited and Controlled Entities Notes to the financial statements for the year ended 30 June 2015
Note 32. Financial Risk Management (continued) The main risks the Group is exposed to through its financial instruments are credit risk, liquidity risk and interest rate risk. a) Interest Rate Risk The consolidated group's exposure to interest rate risk which is the risk that a financial instruments value will fluctuate as a result of changes in market interest rates and the effective weighted average interest rates on classes of financial assets and financial liabilities, is as follows: Consolidated Group Weighted
Average Interest
Rate %
Non-Interest Bearing
$
Fixed Interest Rate Maturing Floating Interest
Rate $
Total $ 1 Year or
Less $
1 to 5 Years $
2015 Financial Assets: Cash and cash equivalents 2.13 - 5,000,000 4,538,904 9,538,904 Trade and other receivables 9,007,205 9,007,205
9,007,205 5,000,000 4,538,904 18,546,109 Financial Liabilities: Trade and other payables 4,747,295 4,747,295 Income Tax Payable 1,208,593 1,208,593 Deferred consideration 1,666,667 1,168,543 2,835,210
7,622,555 1,168,543 8,791,098 Weighted
Average Interest
Rate %
Non-Interest Bearing
$
Fixed Interest Rate Maturing Floating Interest
Rate $
Total $ 1 Year or
Less $
1 to 5 Years $
2014 Financial Assets: Cash and cash equivalents 1.34 106,365 10,109,184 2,042,345 12,257,894 Trade and other receivables 3,763,251 - - 3,763,251
3,869,616 10,109,184 2,042,345 16,021,145 Financial Liabilities: Trade and other payables 1,793,650 1,793,650 Borrowings
- -
1,793,650 1,793,650 b) Credit Risk The maximum exposure to credit risk by class of recognised financial assets at balance date, excluding the value of any collateral or other security held, is equivalent to the carrying value and classification of those financial assets (net of any provisions) as presented in the statement of financial position. The Group has during the financial year reduced its previous material credit risk exposure to a debtor under financial instruments entered into by the Company. The Group's exposure to Sybase Australia Pty Ltd was reduced as a result of the Company implementing direct connections in to carriers, thereby spreading debtor risk.
52
For
per
sona
l use
onl
y

Mobile Embrace Limited and Controlled Entities Notes to the financial statements for the year ended 30 June 2015
Note 33. Financial Risk Management (continued) c) Net Fair Values The carrying value of financial assets and financial liabilities recorded in the statement of financial position approximates their respective net fair values. Fair values are determined by reference to standard terms and conditions, quoted market prices, where available, or discounting expected future cash flows.
d) Liquidity risk Liquidity risk arises from the possibility that the Group might encounter difficulty in settling its debts or otherwise meeting its obligations related to financial liabilities. The Group manages this risk through the following mechanisms:
– preparing forward-looking cash flow analysis in relation to its operational, investing and financing activities;
– using derivatives that are only traded in highly liquid markets; – monitoring undrawn credit facilities; – obtaining funding from a variety of sources; – maintaining a reputable credit profile; – managing credit risk related to financial assets; – only investing surplus cash with major financial institutions; and – comparing the maturity profile of financial liabilities with the realisation profile of financial assets.
The table below reflects an undiscounted contractual maturity analysis for financial liabilities. Financial guarantee liabilities are treated as payable on demand since the Group has no control over the timing of any potential settlement of the liabilities. Cash flows realised from financial assets reflect management’s expectation as to the timing of realisation. Actual timing may therefore differ from that disclosed. The timing of cash flows presented in the table to settle financial liabilities reflects the earliest contractual settlement dates and does not reflect management’s expectations that banking facilities will be rolled forward. Within 1 Year 1 to 5 Years Total Consolidated Group 2015
$ 2014
$ 2015
$ 2014
$ 2015
$ 2014
$ Financial liabilities due for payment
Loans - - - - Trade and other payables
4,747,295 1,793,640 - - 4,747,295 1,793,640
Deferred Consideration 1,666,667 - 1,168,543 - 2,835,210 - Income tax payable 1,208,593 1,208,593 Financial guarantees - - - - - Total contractual outflows
7,622,555 1,793,640 1,168,543 - 8,791,098 1,793,640
Less bank overdrafts - - Total expected outflows 7,622,555 1,793,640 1,168,543 - 8,791,098 1,793,640 Financial assets – cash flows realisable
Cash and cash equivalents
9,538,904 12,257,894 - - 9,538,904 12,257,894
Trade and loan receivables
9,007,205 3,763,251 251,485 252,922 9,258,690 4,016,173
Total anticipated inflows 18,546,109 16,021,145 251,485 252,922 18,797,594 16,274,067 Net (outflow)/ inflow on financial instruments 10,923,554 14,227,505 (917,058) 252,922
10,006,496
14,480,427
53
For
per
sona
l use
onl
y

Mobile Embrace Directors’ Declaration
Directors’ Declaration The directors of the company declare that:
1. the financial statements and notes, as set out on pages 14 to 53, are in accordance with the Corporations Act 2001 and:
a. comply with Australian Accounting Standards, which as stated in accounting policy Note 1 to the financial statements, constitutes compliance with International Financial Reporting Standards (IFRS); and
b. give a true and fair view of the financial position as at 30 June 2015 and of the performance for the year ended on that date of the consolidated group;
2. in the directors’ opinion there are reasonable grounds to believe that the company will be able to pay its debts as and when they become due and payable; and
3. the directors have been given the declarations required by s295A of the Corporations Act 2001 from the Chief Executive Officer and Chief Financial Officer.
At the date of this declaration, there are reasonable grounds to believe that the members of the group will be able to meet any obligations or liabilities to which they may become subject. Chris Thorpe Director 4 August 2015
54
For
per
sona
l use
onl
y
For
per
sona
l use
onl
y
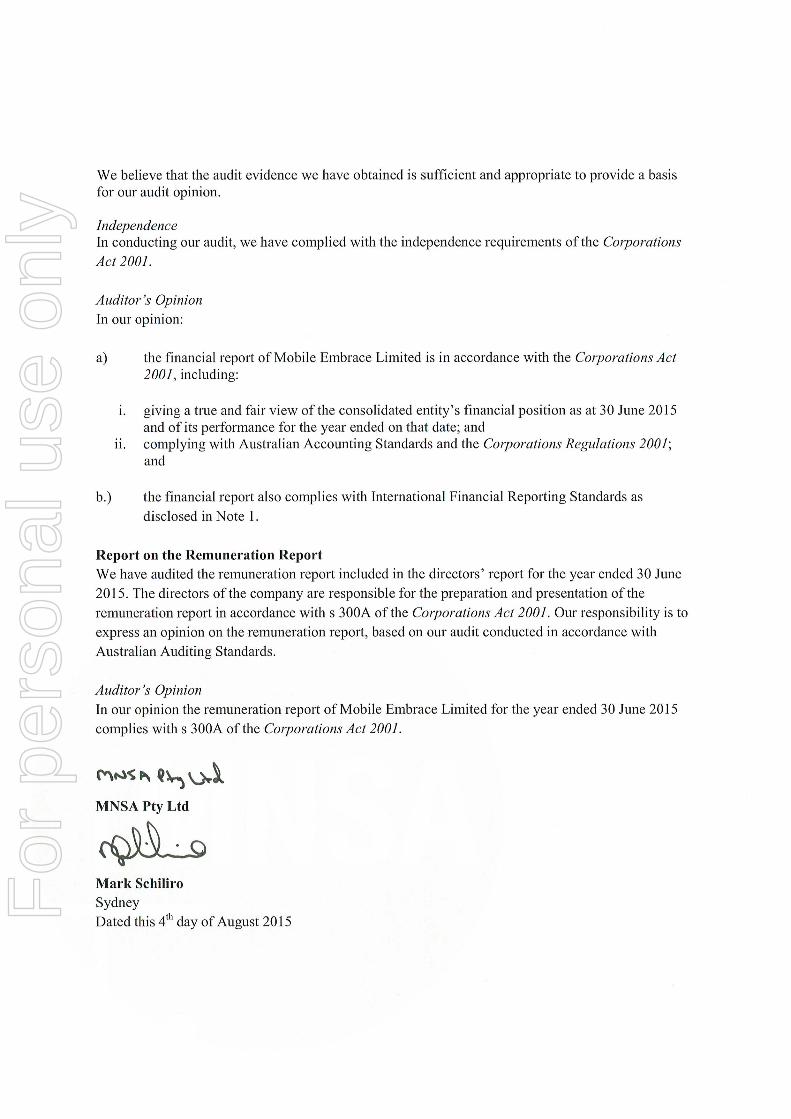
For
per
sona
l use
onl
y

Mobile Embrace Additional Investor Information
1. Shareholding Distribution of Shareholders as at 30 June 2015:
Category (size of holding) Total Holders Units
% Held of Issued
Ordinary Capital
1 - 1,000 97 28,650 0.01 1,001 - 5,000 460 1,657,026 0.43 5,001 - 10,000 472 4,071,795 1.05 10,001 - 100,000 1,553 62,602,564 16.20 100,001 - and over 453 318,069,728 82.31 3,035 386,429,763 100.00 The number of shareholdings held in less than marketable parcels is 159. The substantial shareholders listed in the holding company's register as at 30 June 2015 are: 20 Largest Shareholders - Ordinary Shares:
Number Ordinary Fully Paid
Shares Held
% Held of Issued
Ordinary Capital
1. NATIONAL NOMINEES LIMITED 24,744,605 6.40 2. WAUGHDOC PTY LTD 22,176,639 5.74 3. NEIL WILES 12,000,000 3.11 4. MR CAMERON DAVID NELSON 9,700,000 2.51 5. RBC INVESTOR SERVICES AUSTRALIA NOMINEES P/L <WAM ACCOUNT> 9,500,000 2.46 6. CONNAUGHT CONSULTANTS (FINANCE) PTY LTD <SUPER FUND A/C> 9,000,000 2.33 7. AUSTER CAPITAL PARTNERS LLC 8,338,890 2.16 8. MRS KRISTINE LOUISE LONG 8,000,000 2.07 9. COMMUNITEE PTY LIMITED 7,533,000 1.95 10. PANRON PTY LTD <NO 2 A/C> 6,960,800 1.80 11. CITYCORP NOMINNEES PTY LIMITED 6,790,852 1.76 12. BNP PARIBAS NOMS PTY LTD <DRP> 5,120,091 1.32 13. B & R JAMES INVESTMENTS PTY LTD <JAMES SUPERANNUATION A/C> 5,000,000 1.29 14. KILNORT PTY LTD <KILNORT FAMILY A/C> 4,000,000 1.04 15. THE TRUST COMPANY (AUST) LTD <KIS CLIPP SPECIAL PURPOSE AC> 4,000,000 1.04 16. MR ADRIAN QUILTER-HARVEY + MS VANESSA KRIVOGARD <HARVEY
FAMILY S/F A/C> 3,900,000 1.01
17. MR JEREMY STEVEN MARPLE 3,450,000 0.89 18. PANRON PTY LTD <R & J SUPER FUND A/C> 3,384,350 0.88 19. EQUITAS NOMINEES PTY LIMITED <3020270 A/C> 3,338,889 0.86 20. MR ALLAN ROBERTSON 2,977,265 0.77
Top 20 holders of FULLY PAID ORDINARY SHARES (TOTAL) 159,915,381 41.39 Total Remaining Holders Balance 226,514,382 58.61
Total Holders Balance 386,429,763 100.00
57
For
per
sona
l use
onl
y

Mobile Embrace Additional Investor Information (continued)
1. Shareholding (continued) Voting rights The voting rights attached to each class of equity security are as follows: At shareholders meetings each ordinary share is entitled to one vote when a poll is called, otherwise each shareholder has one vote on a show of hands. 2. Company Secretary Mr Simon Allison resigned as Company Secretary on the 1 August 2014. Mr Justin Clyne was appointed as Company Secretary on the 1 August 2014. 3. Address of Principal Registered Office Westfield Towers Level 10, 100 William Street EAST SYDNEY NSW 2011 Australia 4. Share Registry Registers of securities are held by Computershare Investor Services Pty Limited at the following address: Level 5, 115 Grenfell Street Adelaide SA 5000
Postal address: GPO Box 1903 Adelaide SA 5001
Enquiries within Australia: 1300 556 161 Enquiries outside Australia: +61 3 9415 4000 Email: [email protected] Website: www.computershare.com 5. Stock Exchange Listing Quotation has been granted for all the ordinary shares of the company on all Member Exchanges of the Australian Stock Exchange Listing. 6. Dividends No dividends have been paid by MBE for the year. 7. On Market Buy Back There is no on-market buy back at the date of this report. 8. Investor Support If you have any queries regarding your investment, please contact Computershare toll free on 1300 556 161 or visit their website at www.computershare.com. Please note there is a section of the website designed to provide shareholders with the forms necessary to initiate changes of the details held at the registry. This service is available from 8.30 to 17.30 (Sydney time) on all business days. Enquiries may also be emailed via Computershare's website. 9. Annual Report All shareholders are entitled to receive a copy of the Annual Report. If you do not require the Annual Report, or if you receive more copies than you require, please notify Computershare. The Annual Report and Financial Statements can also be downloaded from the company’s website www.mobileembrace.com. .
58
For
per
sona
l use
onl
y