PRELIMINARY FINAL REPORT - CIMIC Group · OUTLINE Results highlights ... New contracts, extensions...
46
PRELIMINARY FINAL REPORT PRELIMINARY FINAL REPORT AUGUST 2003 AUGUST 2003
Transcript of PRELIMINARY FINAL REPORT - CIMIC Group · OUTLINE Results highlights ... New contracts, extensions...

PRELIMINARY FINALREPORTPRELIMINARY FINALREPORT
AUGUST 2003AUGUST 2003

PRESENTATIONOUTLINE
Results highlightsFinancial statementsGroup strategyAustralian market outlookAsian market outlook
Results highlightsFinancial statementsGroup strategyAustralian market outlookAsian market outlook

RESULTSOVERVIEW

FINANCIALHIGHLIGHTS
Total revenue 5,620 5,275 7New contracts,extensions & variations 6,802 5,552 23Value of work in hand 9,662 8,371 15Operating profit before tax 209.8 227.3 (8)Operating profit after tax 140.0 169.2 (17)
Dividends per ord share 44¢ 42¢ 5
Total revenue 5,620 5,275 7New contracts,extensions & variations 6,802 5,552 23Value of work in hand 9,662 8,371 15Operating profit before tax 209.8 227.3 (8)Operating profit after tax 140.0 169.2 (17)
Dividends per ord share 44¢ 42¢ 5
Jun 03 Jun 02 %$m $m change
Jun 03 Jun 02 %$m $m change
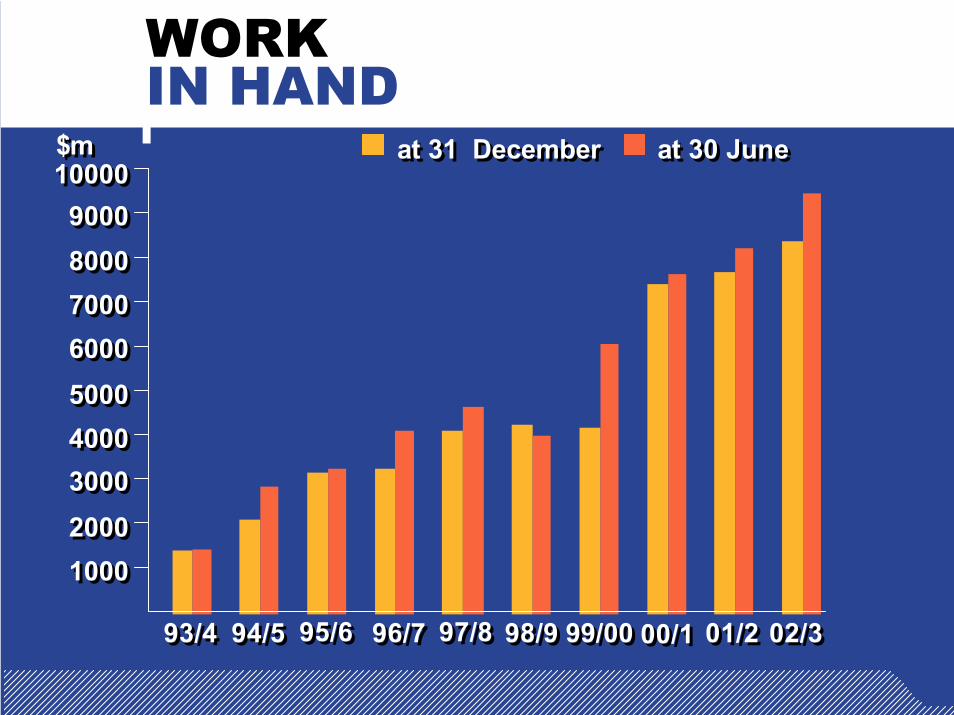
WORKIN HAND
1000010000
96/796/7 97/897/8 98/998/9 99/0099/00 00/100/1
$m$m
01/201/293/493/4 94/594/5 95/695/6
at 30 Juneat 30 Juneat 31 Decemberat 31 December
02/302/3
90009000
80008000
70007000
60006000
40004000
30003000
20002000
50005000
10001000

FINANCIALSTATEMENTS
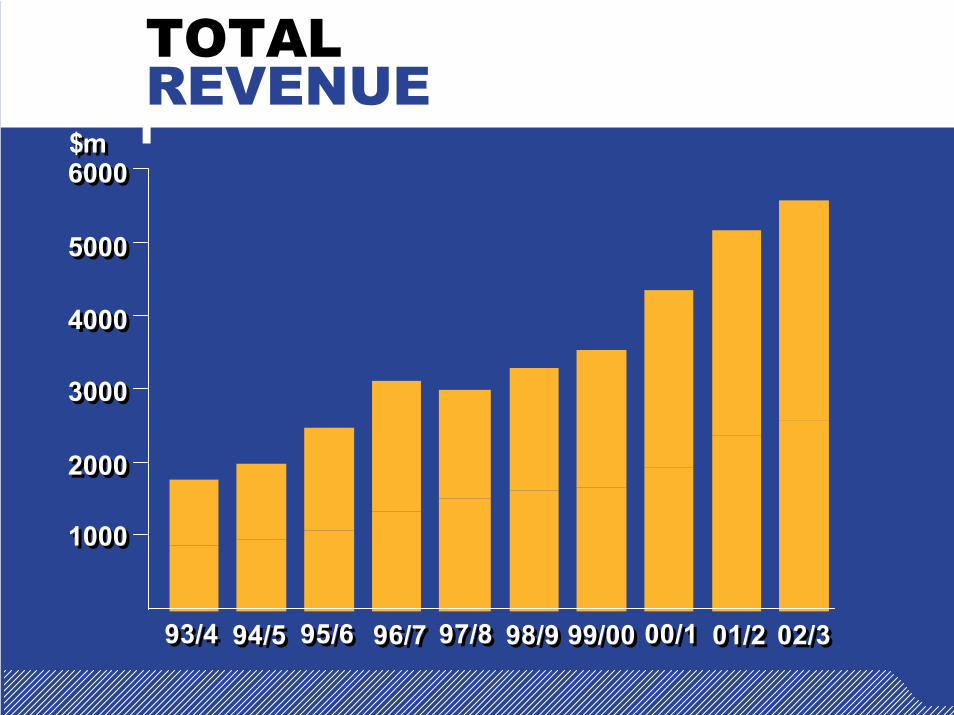
TOTALREVENUE
96/796/7 97/897/8 98/998/9 99/0099/00 00/100/1
60006000
20002000
10001000
$m$m
30003000
01/201/293/493/4 94/594/5 95/695/6 02/302/3
40004000
50005000

PROFITAFTER TAX
5050
$m$m
100100
200200
96/796/7 97/897/8 98/998/9 99/0099/00 00/100/1 01/201/293/493/4 94/594/5 95/695/6 02/302/3
150150

FINANCIALPOSITION
Cash ($m) 408 588Total assets ($m) 2,146 2,318Gross debt ($m) 21 64Net cash ($m) 387 524Members equity ($m) 856 789Return on equity (%) 17.0 21.4Return on assets (%) 6.5 7.3
Cash ($m) 408 588Total assets ($m) 2,146 2,318Gross debt ($m) 21 64Net cash ($m) 387 524Members equity ($m) 856 789Return on equity (%) 17.0 21.4Return on assets (%) 6.5 7.3
Jun 03 Jun 02Jun 03 Jun 02
OTHER KEYSTATISTICS
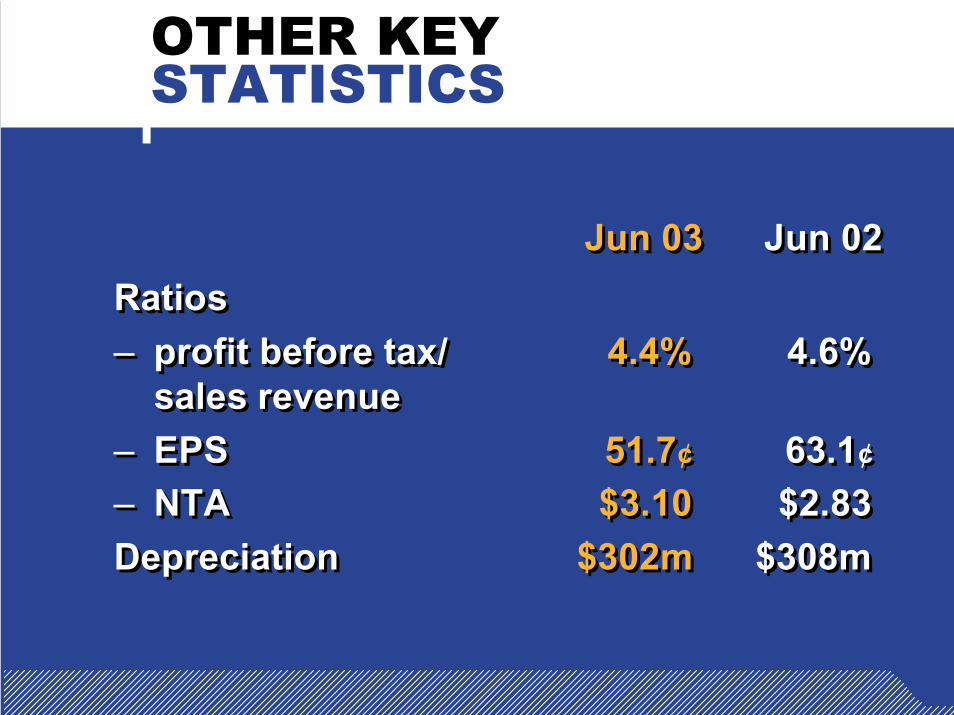
Ratios– profit before tax/ 4.4% 4.6%
sales revenue– EPS 51.7¢ 63.1¢
– NTA $3.10 $2.83Depreciation $302m $308m
Ratios– profit before tax/ 4.4% 4.6%
sales revenue– EPS 51.7¢ 63.1¢
– NTA $3.10 $2.83Depreciation $302m $308m
Jun 03 Jun 02Jun 03 Jun 02

GEOGRAPHICSPLIT
Total revenue– Australia/Pacific 4,577 3,964– Asia 996 1,225– Americas 46 86Profit before tax– Australia/Pacific 145 141– Asia 81 77– Americas (17) 9
Total revenue– Australia/Pacific 4,577 3,964– Asia 996 1,225– Americas 46 86Profit before tax– Australia/Pacific 145 141– Asia 81 77– Americas (17) 9
Jun 03 Jun 02$m $m
Jun 03 Jun 02$m $m

GROUPSTRATEGY

GROUPSTRATEGY
Markets/Products
Geography
DeliverySystems
Brands

LEIGHTON REVENUE VS AUST CONST MARKET
9797 9898 9999 0000 0101
60006000
20002000
10001000
$m$m
30003000
02029494 9595 9696 0303
40004000
50005000
$bn$bn3030
1515
2020
2525Thiesscoal projectsThiesscoal projects
Leighton starts Eastern Distributor Tollroad
Leighton starts Eastern Distributor Tollroad
John Holland acquisitionJohn Holland acquisition
Thiess Indonesiancoal projectsThiess Indonesiancoal projects
Leightontelco projectsLeightontelco projects
PRLWSOKENS
PRLWSOKENS
LeightonRevenueLeightonRevenue
Aust Const MarketAust Const Market

STRUCTUREDFOR GROWTH
LeightonContractors
Bob Merkenhof
LeightonPropertiesVyril Vella
John Holland*Bill Wild
ThiessRoger Trundle
LeightonAsia
(Northern)Will Hamilton
LeightonAsia
(Southern)David Savage
HOCHTIEF(50.3%)
HOCHTIEF(50.3%)
Other(49.7%)Other
(49.7%)Leighton Holdings
PT Thiess IndonesiaThiess ServicesHVESilcarBOS Australia
PT Thiess IndonesiaThiess ServicesHVESilcarBOS Australia
LeightonServices- Infocus- Visionstream- LSE TechnologyBroad
LeightonServices- Infocus- Visionstream- LSE TechnologyBroad
LuconInfratek NetworksDMMGridcomm- Quantum
LuconInfratek NetworksDMMGridcomm- Quantum
* Includes Transfield* Includes Transfield
100% owned 100% owned 100% owned100% owned 100% owned70% owned

OUTLOOK IN AUSTRALIA
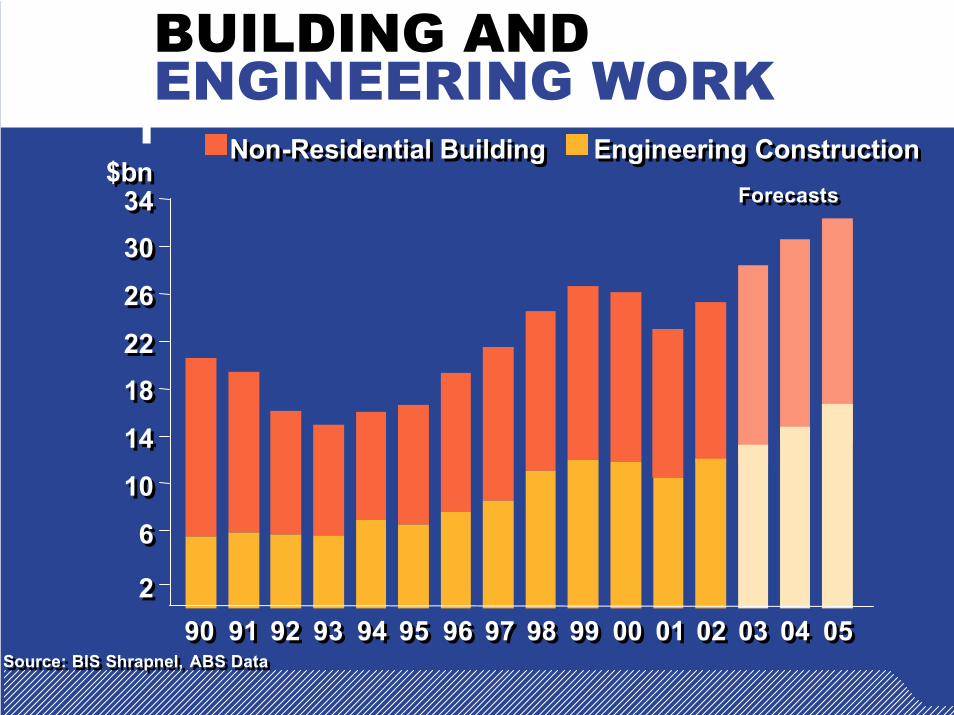
BUILDING AND ENGINEERING WORK
$bn$bn
Source: BIS Shrapnel, ABS DataSource: BIS Shrapnel, ABS Data
ForecastsForecasts
9090 9191 9292 9393 9494 9595 9696 9797 9898 9999 0000 0101 0303 0404 050522
66
1010
0202
1414
1818
2222
2626
3030
3434
Engineering ConstructionEngineering ConstructionNon-Residential BuildingNon-Residential Building
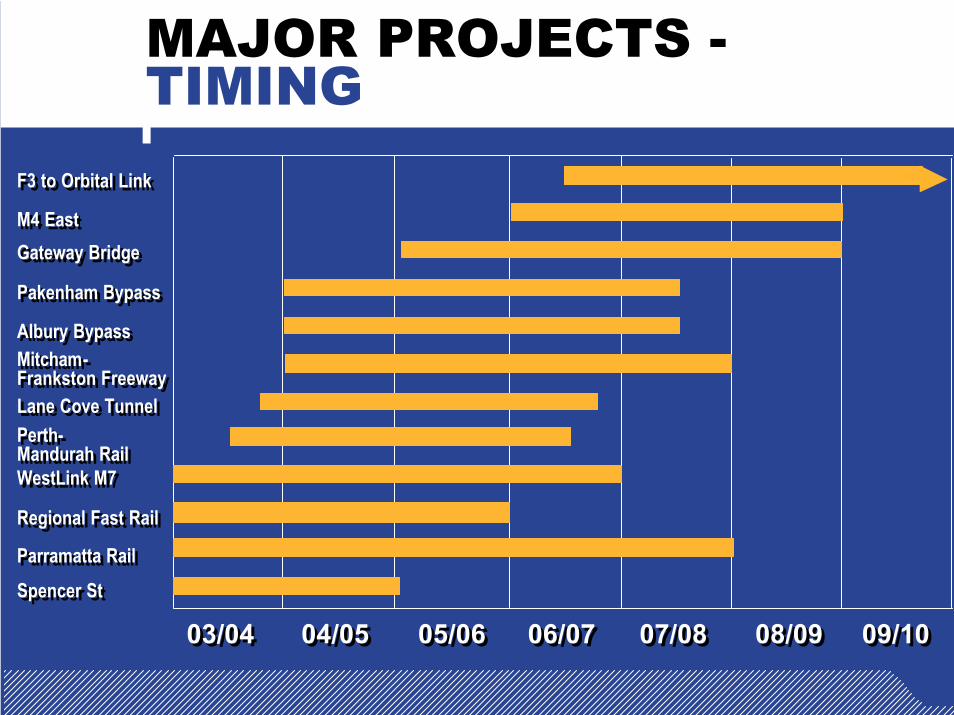
MAJOR PROJECTS -TIMING
03/0403/04 04/0504/05 05/0605/06 06/0706/07 07/0807/08
Spencer StSpencer StParramatta RailParramatta Rail
08/0908/09 09/1009/10
Regional Fast RailRegional Fast Rail
WestLink M7WestLink M7
Perth-Mandurah RailPerth-Mandurah Rail
Mitcham-Frankston FreewayMitcham-Frankston FreewayLane Cove TunnelLane Cove Tunnel
Albury BypassAlbury Bypass
Pakenham BypassPakenham Bypass
Gateway BridgeGateway BridgeM4 EastM4 East
F3 to Orbital LinkF3 to Orbital Link

Parramatta Rail Link, NSWThiess

WestLink M7, NSWLeighton Contractors
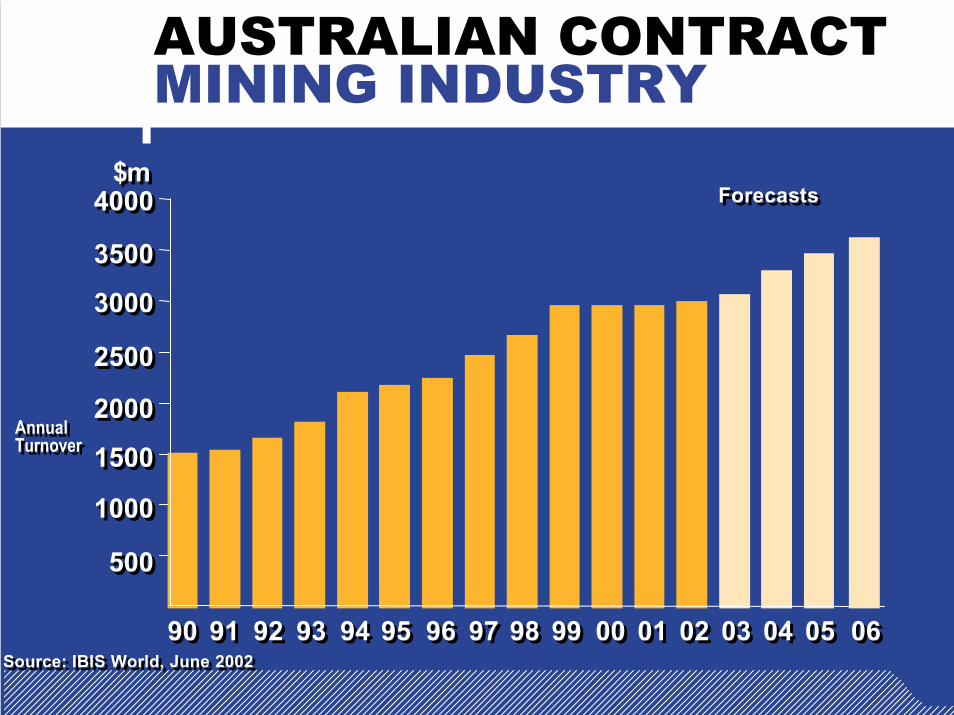
AUSTRALIAN CONTRACT MINING INDUSTRY
$m$mForecastsForecasts
9090 9191 9292 9393 9494 9595 9696 9797 9898 9999 0000 0101 0303 0404 05050202
40004000
Source: IBIS World, June 2002Source: IBIS World, June 2002
35003500
0606
30003000
25002500
20002000
15001500
10001000
500500
AnnualTurnoverAnnualTurnover

LONG TERM MINING CONTRACTS
Jun 05Jun 05 Jun 06Jun 06 Jun 07Jun 07Jun 03Jun 03 Jun 04Jun 04 Jun 08Jun 08
Sth WalkerSth Walker
LiddellLiddell
YarrieYarrie
SouthlandSouthland
Mt KeithMt Keith
CollinsvilleCollinsville
BurtonBurton
SenakinSenakin
SatuiSatui
Mt OwenMt Owen
In work in handIn work in hand
MoorvaleMoorvale
WestsideWestside
Future workFuture work

South Walker Creek Coal Mine, QldThiess

Comalco Alumina Refinery Project, Qld John Holland

Commercial and IndustrialCommercial and Industrial
AUSTRALIANPROPERTY MARKETS
1600016000
10000100007000700050005000
2000200015001500
10001000
200200
500500
05059090 9595 00009494939392929191 9696 9797 9898 9999 0101 0202 0303 0404Source: BIS Shrapnel, ABS DataSource: BIS Shrapnel, ABS Data
ForecastsForecasts$m$m
FactoriesFactoriesOfficesOffices
Total Value ofCommencementsTotal Value ofCommencements
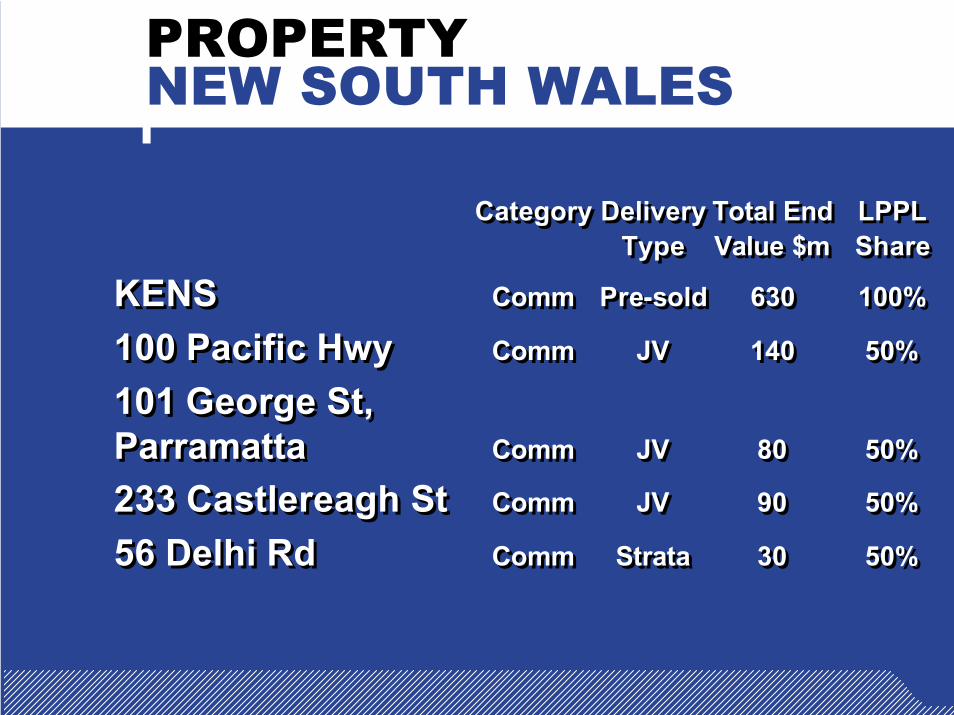
PROPERTYNEW SOUTH WALES
Category Delivery Total End LPPLType Value $m Share
KENS Comm Pre-sold 630 100%
100 Pacific Hwy Comm JV 140 50%
101 George St, Parramatta Comm JV 80 50%
233 Castlereagh St Comm JV 90 50%
56 Delhi Rd Comm Strata 30 50%
Category Delivery Total End LPPLType Value $m Share
KENS Comm Pre-sold 630 100%
100 Pacific Hwy Comm JV 140 50%
101 George St, Parramatta Comm JV 80 50%
233 Castlereagh St Comm JV 90 50%
56 Delhi Rd Comm Strata 30 50%
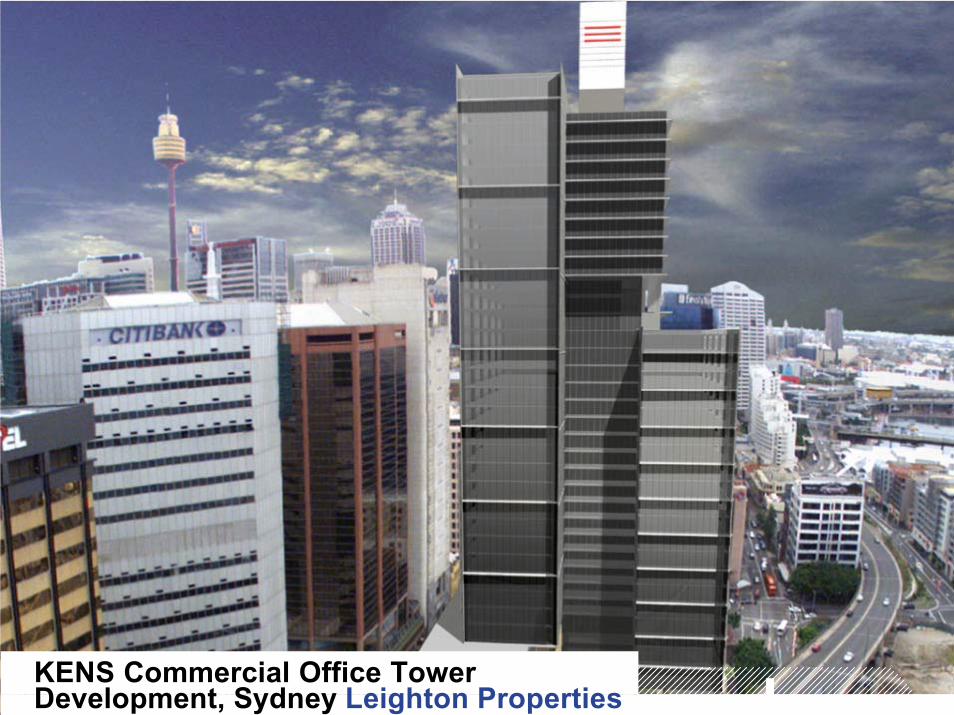
KENS Commercial Office Tower Development, Sydney Leighton Properties
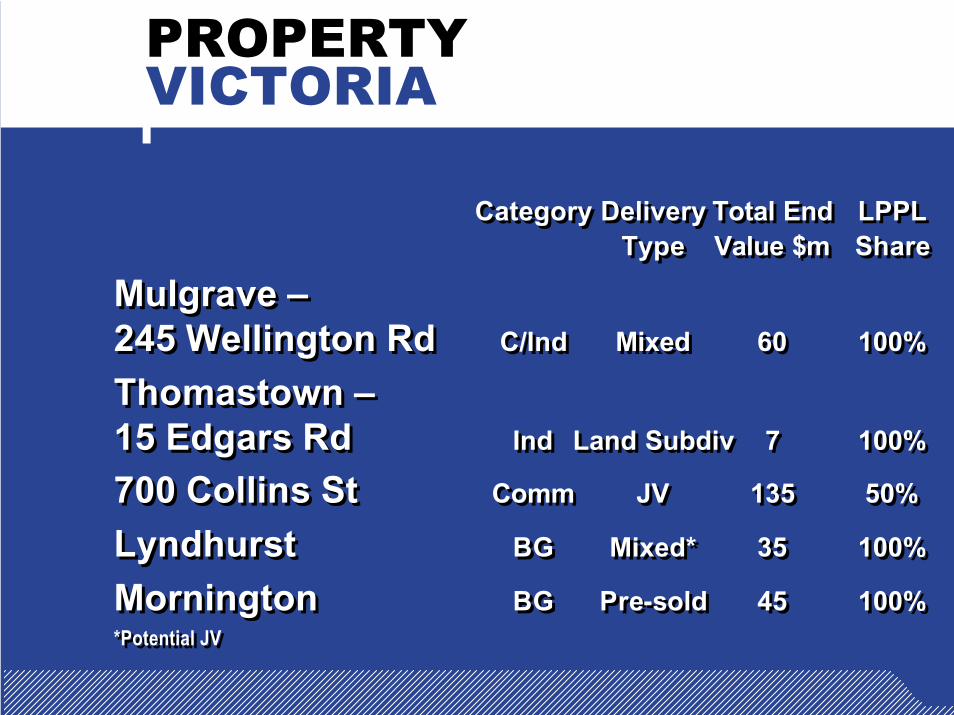
PROPERTYVICTORIA
Category Delivery Total End LPPLType Value $m Share
Mulgrave –245 Wellington Rd C/Ind Mixed 60 100%
Thomastown –15 Edgars Rd Ind Land Subdiv 7 100%
700 Collins St Comm JV 135 50%
Lyndhurst BG Mixed* 35 100%
Mornington BG Pre-sold 45 100%*Potential JV
Category Delivery Total End LPPLType Value $m Share
Mulgrave –245 Wellington Rd C/Ind Mixed 60 100%
Thomastown –15 Edgars Rd Ind Land Subdiv 7 100%
700 Collins St Comm JV 135 50%
Lyndhurst BG Mixed* 35 100%
Mornington BG Pre-sold 45 100%*Potential JV

PROPERTYQUEENSLAND
Category Delivery Total End LPPLType Value $m Share
Noosa Resort Resort JV 180 50%
MacArthur - Retail Retail JV 100 50%
MacArthur - Comm Comm JV 125 50%
Category Delivery Total End LPPLType Value $m Share
Noosa Resort Resort JV 180 50%
MacArthur - Retail Retail JV 100 50%
MacArthur - Comm Comm JV 125 50%

Amcor Wine Bottling Plant, South Australia Leighton Contractors

OPERATIONS &MAINTENANCE MARKET
Source: BIS Shrapnel ‘Maintenance in Australia 2001 2016’Source: BIS Shrapnel ‘Maintenance in Australia 2001 2016’0202 0303 0505 0606
1515
2020
2525$bn$bn
04040101
1998/99 Prices1998/99 Prices
1010
ForecastsForecasts

GROUP O&M REVENUE
$m$m600600
99/0099/00 00/100/198/998/9
104104
221221
353353
Engineering & infrastructureEngineering & infrastructureTelecommunicationsTelecommunicationsBuilding & propertyBuilding & property Mining & resourcesMining & resources EnvironmentalEnvironmental
01/201/2 02/302/3
503503 529529500500
400400
300300
200200
100100
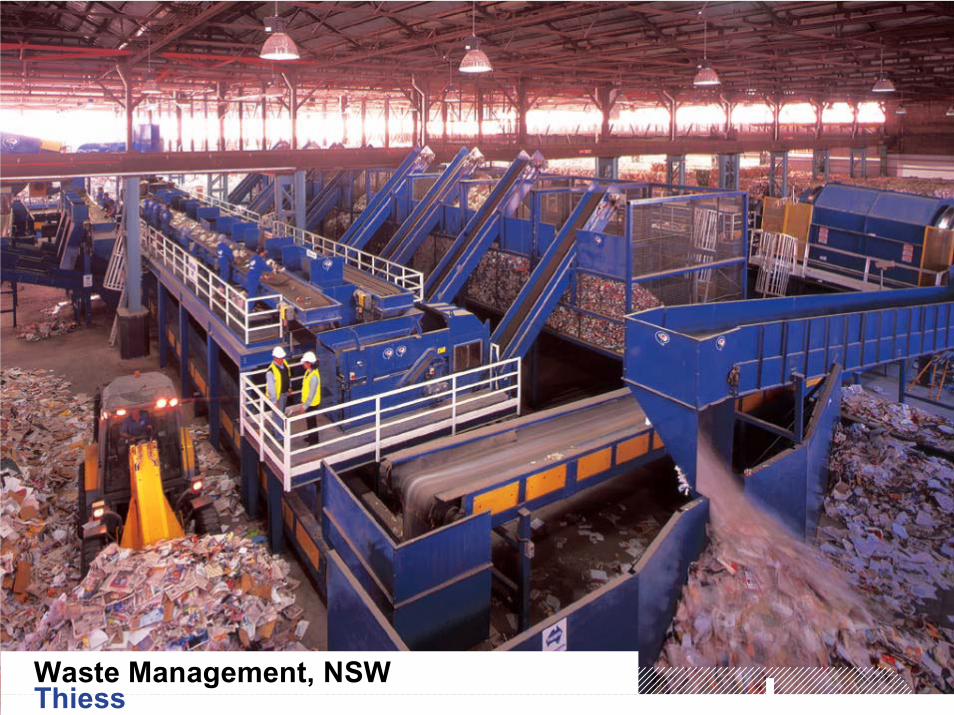
Waste Management, NSW Thiess

Telstra Network Rehabilitation, NSW & Vic Leighton Contractors

Defence Maintenance Management Contracts, NSW John Holland
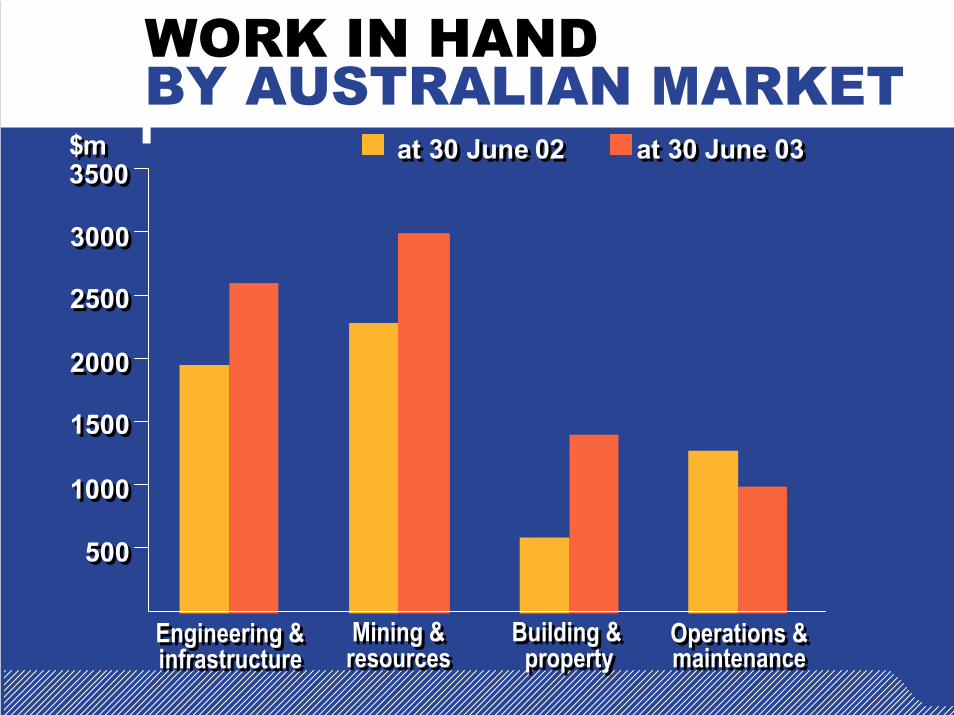
WORK IN HAND BY AUSTRALIAN MARKET
35003500
Building & property
Building & property
Operations &maintenanceOperations &maintenance
$m$m
Engineering &infrastructureEngineering &infrastructure
Mining &resourcesMining &resources
at 30 June 03at 30 June 03at 30 June 02at 30 June 02
30003000
25002500
20002000
15001500
10001000
500500

OUTLOOK IN ASIA

OVERVIEW OFREGION
Resources remains focus in Indonesia Solid civil workload in Hong Kong Pursuing other opportunities in Malaysia Philippines has reasonable activity levelsImproving investment climate in VietnamHopeful of further rail work in TaiwanSelect opportunities in Thailand
Resources remains focus in Indonesia Solid civil workload in Hong Kong Pursuing other opportunities in Malaysia Philippines has reasonable activity levelsImproving investment climate in VietnamHopeful of further rail work in TaiwanSelect opportunities in Thailand
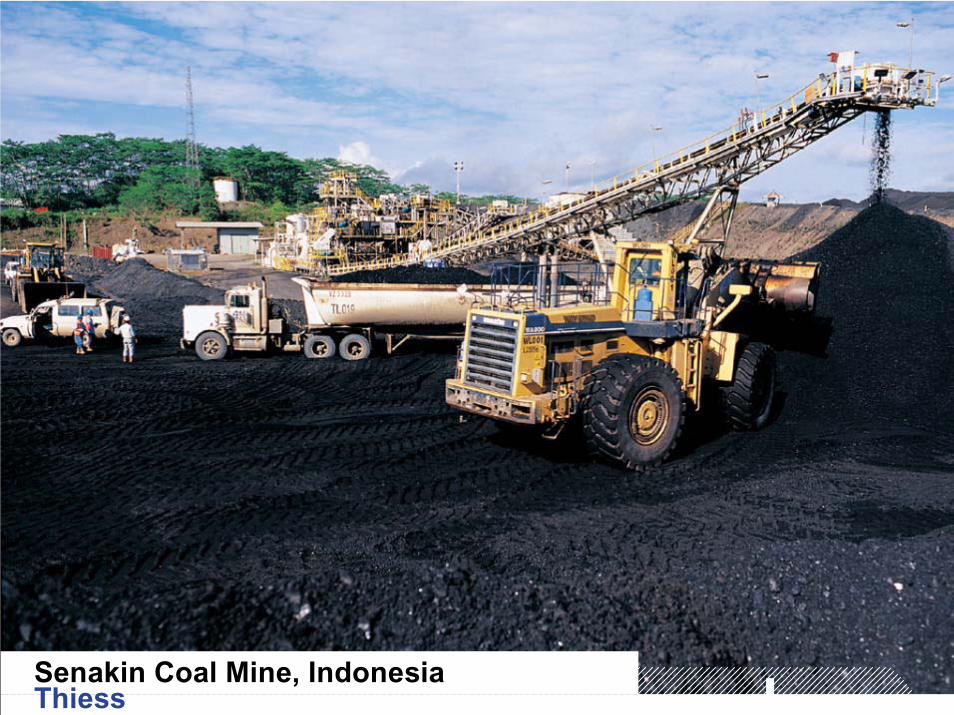
Senakin Coal Mine, Indonesia Thiess

Central Reclamation, Hong KongLeighton Asia

Duta Plaza Retail and Commercial Development, Malaysia Leighton Asia
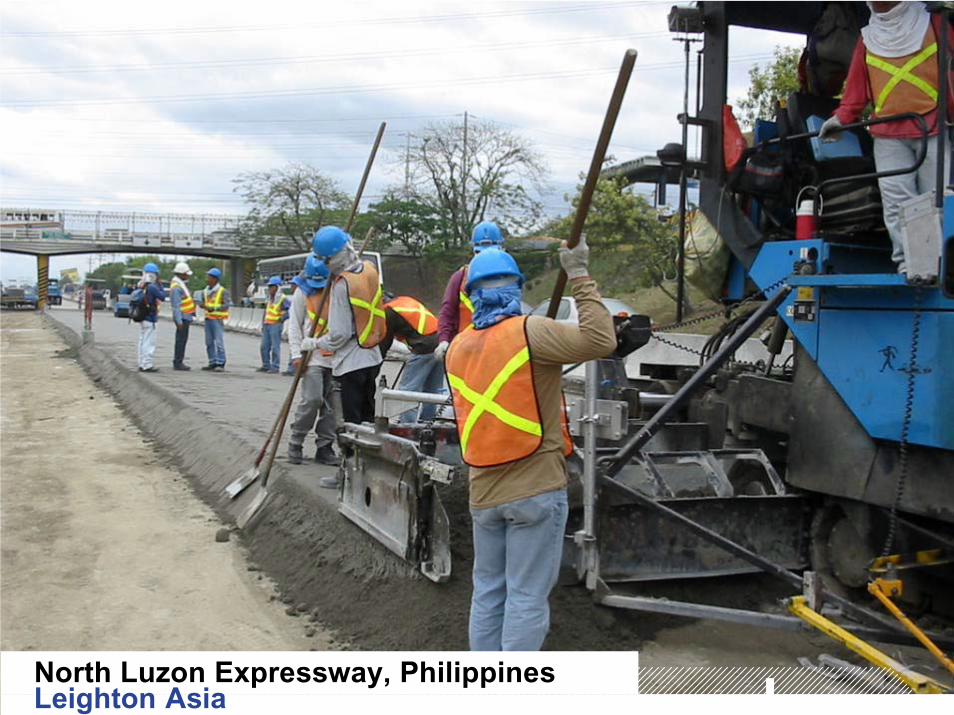
North Luzon Expressway, PhilippinesLeighton Asia

WORK IN HAND BY ASIAN COUNTRY
12001200
MalaysiaMalaysiaPhilippinesPhilippines
$m$m
OtherOtherIndonesiaIndonesiaHong KongHong Kong
at 30 June 03at 30 June 03at 30 June 02at 30 June 02
10001000
800800
600600
400400
200200

SUMMARY
SUMMARY
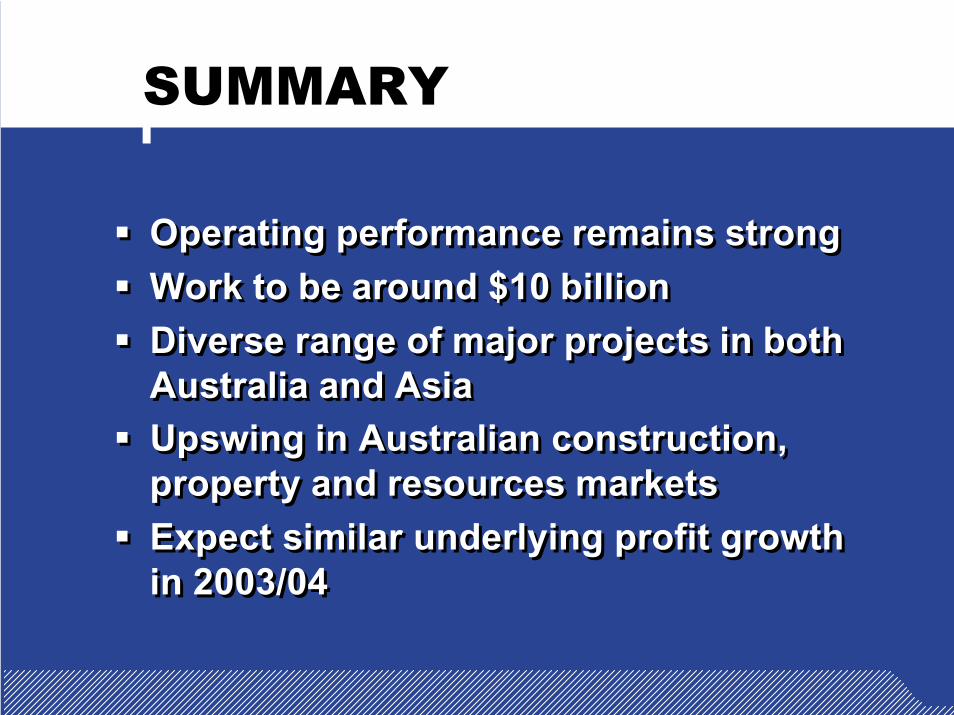
Operating performance remains strongWork to be around $10 billionDiverse range of major projects in both Australia and AsiaUpswing in Australian construction, property and resources marketsExpect similar underlying profit growth in 2003/04
Operating performance remains strongWork to be around $10 billionDiverse range of major projects in both Australia and AsiaUpswing in Australian construction, property and resources marketsExpect similar underlying profit growth in 2003/04
PRELIMINARY FINALREPORTPRELIMINARY FINALREPORT
AUGUST 2003AUGUST 2003