PRELIMINARY ECONOMIC ASSESSMENT - NHTSA ECONOMIC ASSESSMENT TIRE PRESSURE ... measurement systems...
118
U.S. Department Of Transportation PRELIMINARY ECONOMIC ASSESSMENT TIRE PRESSURE MONITORING SYSTEM FMVSS No. 138 Office of Regulatory Analysis and Evaluation Plans and Policy July 2001
Transcript of PRELIMINARY ECONOMIC ASSESSMENT - NHTSA ECONOMIC ASSESSMENT TIRE PRESSURE ... measurement systems...

U.S. Department Of Transportation
PRELIMINARY ECONOMIC ASSESSMENT
TIRE PRESSURE MONITORING SYSTEM
FMVSS No. 138
Office of Regulatory Analysis and Evaluation Plans and Policy
July 2001

Table of Contents
Executive Summary.................................................................................................................... i Introduction............................................................................................................................. I-1 Background and Alternatives ...............................................................................................II-1 Tire Pressure Survey and Test Results ................................................................................III-1 Target Population................................................................................................................. IV-1 Benefits ..................................................................................................................................V-1 Human Factors Issues ........................................................................................................V-1 Stopping Distance ..............................................................................................................V-3 Fuel Economy .................................................................................................................V-40 Tread Life .......................................................................................................................V-46 Unquantifiable Benefits ...................................................................................................V-53 Costs and Lead Times.......................................................................................................... VI-1 Cost Effectiveness ..............................................................................................................VII-1 Small Business Impacts ....................................................................................................VIII-1 Cumulative Impacts ............................................................................................................. IX-1

DRAFT – DELIBERATIVE DOCUMENT – DO NOT RELEASE i
Executive Summary As required by the Transportation Recall Enhancement, Accountability, and Documentation (TREAD) Act, the agency is proposing to require a Tire Pressure Monitoring System (TPMS) be installed in all passenger cars, multipurpose passenger vehicles, trucks and buses that have a Gross Vehicle Weight Rating of 10,000 pounds or less, effective in November 2003. Two alternatives are examined in this assessment: Alternative 1 would require that the driver be given a warning when tire pressure is 20 percent or more below the placard pressure for one to four tires. Alternative 2 would require that the driver be given a warning when tire pressure is 25 percent or more below the placard pressure for one to three tires. There are two basic types of TPMS, direct measurement systems that have a tire pressure sensor for each tire, and indirect measurement systems that determine tire inflation pressure from wheel speeds. We assume that a direct measurement system would be required to meet Alternative 1. The indirect measurement systems are designed for use with the anti-lock brake system (ABS) and compare the relative wheel speed of one wheel to another. Wheel speed correlates to tire pressure since the diameter of a tire goes down slightly with low tire pressure. Since the indirect measurement system compares relative wheel speed, it cannot determine when all four tires lose air at about the same rate, thus Alternative 2 would require a warning when one to three tires lose pressure. We assume that vehicles which currently have an ABS system would use an indirect measurement system and vehicles without ABS would use a direct measurement system to meet Alternative 2. The agency conducted a large study of tire pressure at 336 gasoline stations around the country and estimates that Alternative 1 would result in 38 percent of light vehicle operators being warned of low tire pressure, while Alternative 2 would result in 24 percent of light vehicle operators being warned. Low tire pressure may have an influence on any crash that involves braking, since low tire pressure can result in reduced stopping distance. The quantified benefits, based on reduced stopping distance, have been estimated using two sets of data. One set of data indicates that benefits would be zero or insignificant. The second set of data indicates that there would be significant benefits from reduced stopping distance. Mid-point estimates from these two sets of data are:
Annual Full Fleet Benefits of TPMS Injuries Reduced
(All AIS levels) Fatalities Reduced
Alternative 1 10,635 79 Alternative 2 6,585 49

DRAFT – DELIBERATIVE DOCUMENT – DO NOT RELEASE ii
There are unquantified benefits related to crashes caused by blowouts, stopped vehicles with flat tires, handling characteristics, and hydroplaning. An estimated 23,000 crashes and 535 fatal crashes annually involve blowouts or flat tires. Since the agency does not collect tire pressure during its crash investigations, the agency cannot estimate how many crashes are caused by the influence that low tire inflation has on blowouts, vehicle handling, and hydroplaning. Theory and limited testing show that low tire pressure has a significant impact on all of these. There are non-quantified costs and benefits that include the extra time it takes to inflate tires more frequently, the cost to replace batteries in some direct measurement systems, potential maintenance costs of TPMS, the property damage savings from avoiding crashes or reducing delta V in non-preventable crashes, and the savings in time and congestion from avoiding crashes. The estimated consumer cost increase for an average new vehicle would be $66.33 for Alternative 1 and $30.54 for Alternative 2. The net costs are estimated to be:
Net Costs per Vehicle (2001 Dollars)
Vehicle Costs
Present Value of Fuel Savings
Present Value of Tread Wear
Savings
Net Costs
Alternative 1 $66.33 $32.22 $11.03 $23.08 Alternative 2 $30.54 $16.40 $5.51 $8.63
The net costs per equivalent life saved are estimated at the 7 percent discount rate to be:
Net Cost per Equivalent Life Saved Alternative 1 $1.9 million Alternative 2 $1.1 million

DRAFT – DELIBERATIVE DOCUMENT – DO NOT RELEASE iii
These estimates are derived from the following:
Total Annual Costs for 16 Million Vehicles
(Millions of 2001 Dollars)
Vehicle Costs
Present Value of Fuel Savings
Present Value of Tread Wear
Savings
Net Costs
Alternative 1 $1,061 $516 $176 $369 Alternative 2 $489 $263 $88 $138
Present Discounted Value of Benefits Injuries Reduced
(All AIS levels) Fatalities Reduced
Alternative 1 7,038 52 Alternative 2 4,358 32

I-1
I. INTRODUCTION
The National Highway Traffic Safety Administration is evaluating a proposed new regulation
that would require a tire pressure monitoring system (TPMS) on all passenger cars, light trucks
(pickups, vans, and sport utility vehicles), and buses with a gross vehicle weight rating (GVWR)
of 10,000 pounds or less (collectively this group is called “passenger vehicles” throughout this
assessment). This is in accordance with the TREAD Act (H.R. 5164), Sec. 13. Tire Pressure
Warning: “Not later than 1 year after the date of the enactment of this Act, the Secretary of
Transportation shall complete a rulemaking for a regulation to require a warning system in new
motor vehicles to indicate to the operator when a tire is significantly under-inflated. Such
requirement shall become effective not later than 2 years after the date of the completion of such
rulemaking.” This means that the agency must issue a final rule by November 1, 2001 and the
effective date would be before November 1, 2003.

II-1
II. BACKGROUND and ALTERNATIVES
There are two types of Tire Pressure Monitoring Systems (TPMS) currently available that can
alert the driver while driving that the tire pressure is low: direct measurement systems and
indirect measurement systems. A direct measurement system measures tire pressure directly. A
variation of the direct measurement system (a direct measurement system with a pump) will soon
be available that can inflate the tire when it gets low, relieving the driver of that responsibility.
An indirect measurement system measures wheel speed or something other than tire pressure.
The current ABS-based systems are an indirect measurements system. They measure wheel
speed and then compare the variance in wheel speed from one wheel to another.
Direct measurement systems
Most direct measurement systems have pressure and temperature sensors in each tire, usually
attached to the inflation valve. They broadcast their data to a central receiver, or in some cases
to individual antennae that transmit the data to the control module, which analyzes them and
sends appropriate signals to a display). This display can be as simple as a single telltale, or as
complex as pressure and temperature displays for all four tires (or five including the spare).
Direct measurement systems advantages include: (1) much more sensitivity to small pressure
losses, with claims ranging from +/- 0.1 psi to 1 psi; (2) the ability to directly measure pressure
in any tire at any time, including before starting the vehicle, and including the spare tire. The
disadvantages include: (1) the higher cost; (2) possible maintenance problems when tires are
taken on and off the rim (sensors have been broken off). These systems have not been installed
on many vehicles, although they have been used on cars with run-flat tires and as accessories on
high-end luxury vehicles.

II-2
Direct measurement system with a pump
The direct measurement system with a pump has the same qualities as a pressure-sensor-based
system, except that it also has the ability to pump the tire back up to the placard tire pressure.
Each tire has a sensor and a pump. The current system display is designed to give a warning
when a particular tire needs to be continuously inflated and if the tire pressure gets too low,
indicating that a particular tire has a problem and needs servicing. Unless there is a catastrophic
failure or a rapid cost of pressure due to a nail or puncture, the pump can keep the tire inflated to
get the vehicle to its destination. However, once the vehicle stops, the pump stops, and the tire
may deflate. The advantages of this system include: (1) driver convenience, they only need to
worry about their tire inflation when they get a warning of a continuing problem that the pump
has to continue working to control; (2) better fuel economy, tread wear, and safety by keeping
tires up to correct pressure. The disadvantages include: (1) the higher cost; (2) maintenance
considerations - when rotating the tires, the pumps must stay on the same side of the car or taken
off and put back on the rotated tire. These systems have not been installed on any light vehicles,
although they have been used on a number of heavy trucks for several years.
Indirect measurement systems
The current indirect measurement system is based on Anti-lock Brakes (ABS). It takes
information from the ABS wheel-speed sensors and looks for small changes in wheel speed that
occur when a tire loses pressure. Low pressure results in a smaller wheel radius, which increases
the speed of that wheel relative to the others. The system works by comparing the relative speed
of one tire to the other tires on the same vehicle.

II-3
The advantages for this system include low cost and minor changes to the vehicle that has an
ABS system, including a new dashboard telltale and upgraded software in the electrical system.
Disadvantages include: (1) not all vehicles have ABS, so costs are significantly higher for
vehicles without ABS; (2) the indirect system cannot tell which tire is underinflated; (3) if all
tires lose pressure evenly, it cannot detect it, since it works on the relative wheel speed; (4) in
some current systems, some combinations of two tires being underinflated cannot be detected.
Regarding #3 and 4, current ABS systems cannot detect certain conditions of low tire pressure.
To meet Alternative 2 requirements, the ABS systems would need to be upgraded. (5) it cannot
check the spare tire; (6) the vehicle must be moving; (7) it requires significant time, sometimes
hours, to calibrate the system and several minutes, sometimes tens of minutes, to detect a
pressure loss; and (8) it cannot detect small pressure losses. Regarding #8, the best claim is that
they can detect a 20 percent relative pressure loss differential between tires, but others state they
can only detect a 30 percent loss, e.g. a tire properly inflated to 30 pounds per square inch (psi)
would have to deflate to 21 psi before the system would detect it. (9) some systems cannot
detect a pressure loss at vehicle speeds of 70 mph or higher.
Based on these technologies, NHTSA is proposing two different alternative requirements.
ALTERNATIVES
Alternative 1: Require activation of the tire pressure monitor system (TPMS) when one or more tires fall 20 percent or more below the recommended placard pressure, or as shown in Table II-1 below a minimum pressure activation floor (140 kPa or roughly 20 psi for p-metric tires), whichever is higher.
Alternative 2: Require activation of the TPMS when one, two, or three tires fall 25 percent or more below the recommended placard pressure, or as shown in Table II-1 below a

II-4
minimum pressure activation floor (140 kPa or roughly 20 psi for p-metric tires), whichever is higher.
Table II-1 LTPM lamp activation floor
Tire type Maximum
Inflation Pressure (kPa)
Maximum Inflation Pressure
(psi)
Activation
Floor (kPa)
Activation Floor (psi)
P-metric - Standard Load
240, 300, or 350 34.8, 43.5, or 50.8 140 20.3
P-metric – Extra Load
280 or 340 40.6 or 49.3 160 23.2
Load Range C 350 50.8 200 29.0 Load Range D 450 65.3 260 37.7 Load Range E 600 87.0 350 50.8
The activation floor shown in Table II-1 shows the level below or at which the warning must be
activated. The floor is different depending upon the tire type. All tires are required to have a
single maximum inflation pressure labeled on the sidewall and that pressure must be one of the
values above. If a vehicle has p-metric tires marked 240, 300, or 350 kPa, it is a standard load
tire that will be tested at 20 or 25 percent below placard, or 140 kPa, whichever is higher. If a
vehicle has a p-metric tire marked 280 or 340 kPa, it is an extra load tire that will be tested at 20
or 25 percent below placard, or 160 kPa, whichever is higher. (Extra load tires are marked XL or
extra load on the sidewall). LT-tires on light trucks have higher maximum inflation pressures
and therefore have been assigned a higher floor below which the warning has to be activated.
The values in Table II-1 are the only values that can be used for maximum inflation pressure.
Currently, the lowest P-metric tire recommended placard pressure is 26 psi; thus, in all cases
systems meeting Alternative 1’s 20 percent below placard requirement would be activated above

II-5
the 20 psi floor. However, for Alternative 2, the 20 psi floor would come into play for vehicles
with a 26 psi placard (26 psi x 0.75 = 19.5 psi).
Rationales
The rationales for these alternatives are:
1. A 140 kPa floor for p-metric tires is proposed because the agency believes that below that
level, safety in terms of vehicle handling, stability performance, and tire failure is an
issue. The agency ran a variety of p-metric tires at 20 psi with a load for 90 minutes on a
dynamometer. None of these tires failed. This leads the agency to believe that for safety,
in terms of tire failures, warnings provided above that level will allow consumers to fill
their tires back up before the tire fails.
The lowest inflation pressure used in the 2000 Tire & Rim Association Yearbook is 140
kPa for P-metric tires. In the 2001 Tire & Rim Association Yearbook, the 140 kPA
pressures have been deleted, apparently because the Association believes they are too low
for P-metric tires. The agency agrees that 140 kPA is too low and believes a floor is
needed to assure that drivers are warned when tire pressure gets to or below that level.
For the LT tires, we used the 2000 JATMA yearbook for the lower limits for Load Range
C, D, and E tires. For most cases, the floor is about 58 percent of the maximum inflation
pressure.
2. For Alternative 1, 20 percent below placard was chosen after considering several factors.
First, there was no bright line at which the agency could declare that loss of air pressure
definitely becomes a safety issue. The agency did not want to set the level so that the

II-6
warnings became a nuisance (the agency believes consumers would consider the warning
at a nuisance level at about 10 percent below placard). The nuisance level comes in when
consumers are warned too often. For example, a tire may lose air pressure due to cold
weather overnight. But this does not necessarily indicate a need to inflate the tire.
Frequent notifications for trivial reasons would lead consumers to disregard the warning.
Our assessment of current TPMSs leads us to conclude that direct TPMSs can detect 20
percent under-inflation while indirect TPMSs can not.
3. For Alternative 2, the agency considered whether it should propose a level that is 30
percent below placard. The agency looked at the available technology and found that the
current indirect measurement systems could not detect 30 percent below placard for all
combinations of one to four tires. Many current ABS-systems can determine when one
or three tires are 30 percent below the other tires, and can determine certain combinations
(but not all combinations) of two tires being low. None can detect when all four tires are
at equal under-inflation levels. The agency then used its judgment to estimate how good
an indirect ABS-system could perform. We wanted the system to do better, and decided
that one, two, or three tires that are 25 percent or more below the placard starting point in
our tests was a reasonable goal for these systems.
Analytical Assumptions
1) We assume that a direct measurement system would be required to meet Alternative 1
that requires the TPMS to activate at 20 percent below placard pressure for one to four
tires. The current indirect measurement system could not meet this criterion for all four
tires since it compares the relative wheel speed of one tire to the other tires.

II-7
2) None of the four current indirect measurement systems tested by NHTSA (see Chapter
III) could meet Alternative 2. Not all the systems activated the warning when the
pressure in one tire was reduced by 25 to 30 percent, nor did they activate the warning
when all of the different groups of two tires were low compared to the other two tires. In
addition, some pickup truck rear axle configurations have both rear tires using one ABS
sensor and cannot individually sense wheel speed. Thus, these pickup trucks are not
candidates for meeting the LTPM by using an ABS sensor, without changes that would
allow individual wheel sensing. In essence, the agency believes that Alternative 2 will
require an improvement in the indirect measurement systems that are currently in the
fleet. Comments are requested as to whether such an improvement is economically
feasible.
3) For Alternative 2, we assume an indirect measurement system would be provided for
vehicles that have ABS-systems currently (about two-thirds of the fleet). For vehicles
that don’t have an ABS-type system, we assume that a direct measurement system would
be supplied. A direct measurement system costs less than adding ABS to the vehicle. A
manufacturer could add ABS to the vehicle, but that is a marketing decision not brought
on by the TPMS requirements. Comments are requested on whether those pickup trucks
with ABS, but only one sensor on the rear axle, would add a direct sensor system rather
than change the ABS configuration.

III-1
III. TIRE PRESSURE SURVEY AND TEST RESULTS In February 2001, the agency conducted a tire pressure study to determine the extent to
which passenger vehicle operators are aware of the recommended air pressure for their
tires, if they monitor air pressure, and to what extent the actual tire pressure differs from
that recommended tire pressure by the vehicle manufacturer on the placard. The most
useful information for this analysis is the snap shot in time that tells us where the actual
tire pressure of the fleet is in comparison to the vehicle manufacturer’s recommended tire
pressure. Although this was not a nationally representative survey, it is being treated as
such in this analysis.
The field data collection was conducted through the infrastructure of 24 locations of the
National Automotive Sampling System Crashworthiness Data System (NASS CDS).
Data were collected on 11,530 vehicles that were inspected at a sample of 336 gas
stations. There were 6,442 passenger cars, 1,874 sport utility vehicles (SUVs), 1,376
vans, and 1,838 light conventional trucks. Data can be separated by passenger cars with
P-metric tires; trucks, SUVs and vans with P-metric tires; and trucks, SUVs, and vans
with either LT-type or high flotation tires. For this analysis we only compare the
passenger car tire pressures and the light truck tire pressures, without separating the light
trucks by type of tire. Complete data were collected on 5,967 passenger cars and 3,950
light trucks for a total of 9,917 vehicles.

III-2
The average placard pressure for passenger cars was about 30 psi, while the average
placard pressure for light trucks was about 35 psi, although the light trucks have a much
wider range of manufacturer recommended placard pressure.
The issue addressed is how often drivers would get a warning from a low tire pressure
monitoring system. Several scenarios were examined, as shown in Table III-1:
• Assume the driver would be warned anytime one or more tires fell 20%, 25%, or
30% below the placard recommended pressure, assuming a direct measurement
system
• Assume the driver would be warned anytime one or more tires fell 6 psi (or 10
psi) below the placard recommended pressure, assuming a direct measurement
system
Because of the wide range of placard pressure for light trucks, it was determined that it
would be best to propose a percentage reduction from the placard than a straight psi
reduction. For Alternative 1, an average of 38 percent of the passenger car and light
truck drivers in the tire pressure survey would get a warning with a direct measurement
system that activated at 20 percent or more below the placard pressure.
Table III-2 (a) shows, for example, the distribution of tire pressure when at least one tire
is 20 percent or more below placard in terms of whether one, two, three, or all four tires
were at least 20 percent below placard. Tables III-2 (b) and (c) show similar results for
25 percent and 30 percent below placard. The upgraded indirect measurement systems

III-3
that work on relative wheel speed would not be able to pick up when all four tires have
lost air at about the same rate.
Table III-3 shows that the tires on the rear axle are more likely to have a larger gap
between actual tire pressure and the recommended level on the placard.
Table III-4 provides an analysis of what percent of the drivers would get a warning with
an indirect measurement system that compares relative wheel speed of the four wheels.
An assumption was made that if wheel speed were measured in all four wheels (an
upgrade for some vehicles), then a comparison of wheel speed could be made for all
situations except when all four tires lose air at about the same rate. For analytical
purposes we used from our tire pressure survey (maximum tire pressure minus the
minimum tire pressure) divided by the maximum tire pressure to get an average
reduction. The maximum tire pressure was used as the denominator since supposedly
we are starting at placard tire pressure and decreasing tire pressure from there. Since the
indirect systems use a relative measurement, it cannot tell whether the tire pressure is
over placard or under placard. For the benefit analyses done in this assessment, cases
were not considered in which there were a relative differential in tire pressure of 25
percent or more, yet none of the tires were below placard. Thus, for example, if placard
pressure was 30 psi, and the four tire pressures were 30, 30, 30, and 60 psi, this case was
not included in the benefit calculations. For Alternative 2, an average of 24 percent of
the passenger car and light truck drivers in the tire pressure survey would get a warning

III-4
with an indirect measurement system that activated at 25 percent or more differential in
wheel speed.
The current indirect measurement systems (which can determine relative differential in
wheel speed of about 30%), give a warning less than 19 percent of the time. For this
scenario, we use “less than 19 percent of the time”, since the current systems do not
always provide a warning when two tires are high and two tires are low in pressure.
Without knowing the various algorithms used by the manufacturers, this estimate could
not be pinpointed closer.
In summary, based on the tire pressure survey the agency conducted:
Alternative 1: a direct measurement system would result in 38 percent of the light
vehicles operators being notified of low tire pressure.
Alternative 2: an upgraded indirect ABS-based measurement system would result in 24
percent of the light vehicles operators being notified of low tire pressure. The current
indirect ABS-based measurement systems being used today would result in less than 19
percent of the light vehicles operators being notified of low tire pressure. [Note that low
tire pressure is defined differently for each system.]

III-5
Table III-1 Percent of Vehicles That Would Get a Warning
Assuming a Direct Measurement System
Passenger Cars Light Trucks 20% or more Below Placard 36% 40% 25% or more Below Placard 26% 29% 30% or more Below Placard 20% 20%
6 psi or more Below Placard 39% 46% 10 psi or more Below Placard 20% 25%
Table III-2 (a) Distribution of the Number of Tires on Vehicles
That Have One or More Tires that are 20% or more Below Placard
Number of Tires 20% or more Below Placard
Passenger Cars
Percent
Light Trucks
Percent
1 994 46.5% 574 36.7% 2 548 25.7 440 28.1 3 275 12.9 223 14.3 4 319 14.9 327 20.9 Total 2,136 100% 1,564 100%
Table III-2 (b) Distribution of the Number of Tires on Vehicles
That Have One or More Tires that are 25% or more Below Placard
Number of Tires 25% or more Below Placard
Passenger Cars
Percent
Light Trucks
Percent
1 880 55.9% 542 47.2% 2 399 25.3 313 27.3 3 139 8.8 145 12.6 4 157 10.0 148 12.9 Total 1,575 100% 1,148 100%

III-6
Table III-2 (c) Distribution of the Number of Tires on Vehicles
That Have One or More Tires that are 30% or more Below Placard
Number of Tires 30% or more Below Placard
Passenger Cars
Percent
Light Trucks
Percent
1 793 66.1% 454 57.6% 2 266 22.2 199 25.2 3 88 7.4 72 9.1 4 52 4.3 64 8.1 Total 1,199 100% 789 100%
Table III-3 Front versus Rear Axle Differences
Vehicles with one or more tires below placard
Passenger Car Front Axle
Passenger Car Rear Axle
LT Front Axle LT Rear Axle
20% or more Below Placard
20% 30% 23% 35%
30% or more Below Placard
8% 16% 9% 17%
Table III-4 Percent of Vehicles That Would Get a Warning
Assuming an Indirect Measurement System
Passenger Cars Light Trucks 25% Differential 27% 21% 30% Differential 22% 16%
III-7
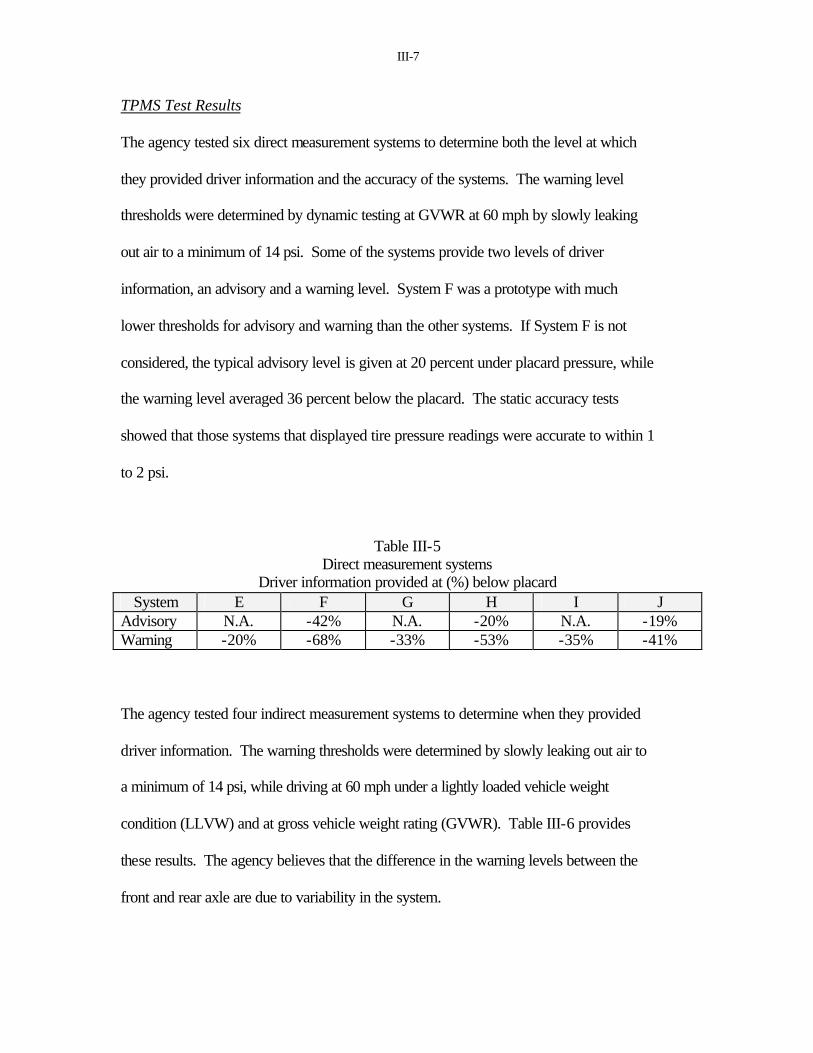
TPMS Test Results
The agency tested six direct measurement systems to determine both the level at which
they provided driver information and the accuracy of the systems. The warning level
thresholds were determined by dynamic testing at GVWR at 60 mph by slowly leaking
out air to a minimum of 14 psi. Some of the systems provide two levels of driver
information, an advisory and a warning level. System F was a prototype with much
lower thresholds for advisory and warning than the other systems. If System F is not
considered, the typical advisory level is given at 20 percent under placard pressure, while
the warning level averaged 36 percent below the placard. The static accuracy tests
showed that those systems that displayed tire pressure readings were accurate to within 1
to 2 psi.
Table III-5 Direct measurement systems
Driver information provided at (%) below placard System E F G H I J
Advisory N.A. -42% N.A. -20% N.A. -19% Warning -20% -68% -33% -53% -35% -41%
The agency tested four indirect measurement systems to determine when they provided
driver information. The warning thresholds were determined by slowly leaking out air to
a minimum of 14 psi, while driving at 60 mph under a lightly loaded vehicle weight
condition (LLVW) and at gross vehicle weight rating (GVWR). Table III-6 provides
these results. The agency believes that the difference in the warning levels between the
front and rear axle are due to variability in the system.

III-8
Table III-6 Indirect measurement systems
Driver warning provided at (%) below placard
Load Axle System A System B System C System D Ave. of 3 LLVW Front -31.4% No
Warning -46.0% -48.3% -41.9%
LLVW Rear -24.7% No Warning
-48.9% -32.2% -35.3%
GVWR Front -26.4% No Warning
-23.3% -41.4% -30.4%
GVWR Rear -17.8% No Warning
-31.8% -37.7% -29.1%
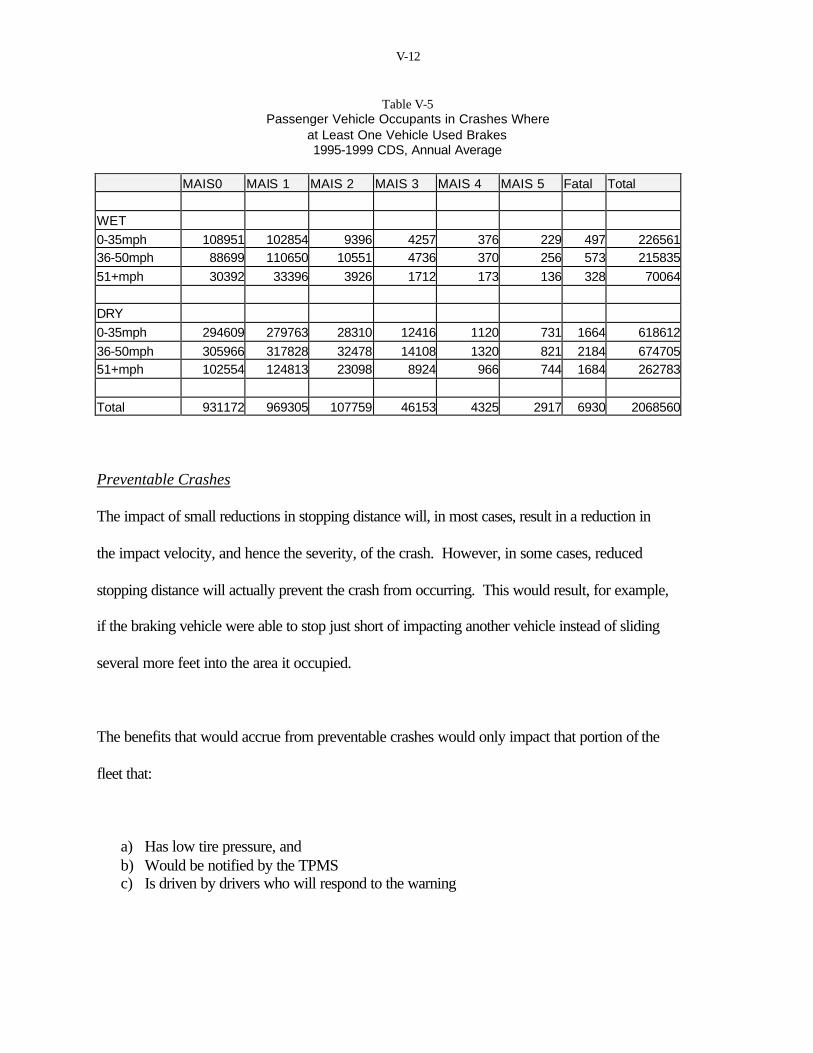
Vehicle Stopping Distance Tests
One of the potential safety benefits the agency is examining is the impact of low tire
pressure on vehicle stopping distance. Two sets of data are available from different
sources – Goodyear Tire and Rubber Company and NHTSA’s Vehicle Research and Test
Center (VRTC). The information provided by these sources do not lead to the same
conclusions.
Table III-7 shows data provided by Goodyear on an ABS vehicle. These wet stopping
distance data indicate:
1. Stopping distance generally increases with lower tire pressure. The only
exception was on concrete at 25 mph.
2. With fairly deep water on the road, (0.050 inches is equivalent to 1 inch of rain in
an hour) lowering inflation to 17 psi and increasing speed to 45 mph increases the
potential for hydroplaning and much longer stopping distances.

III-9
3. Except for 25 mph on macadam, the difference between 25 and 29 psi is relatively
small.
Goodyear provided test data to the agency on Mu values to calculate dry stopping
distances. This information is used in the benefits chapter later in this assessment.
Table III-7 Braking Distance (in feet) provided by Goodyear
Wet Stopping Distance (0.050” water depth)
Surface Speed 17 psi 25 psi 29 psi 35 psi Macadam 25 mph 32.4 30.8 29 27.4 Macadam 45 mph 107.6 101 100.8 98.6 Concrete 25 mph 47.4 48.2 48.2 48 Concrete 45 mph 182.6 167.2 167.4 163.6
Table III-8 shows test data from NHTSA - VRTC on stopping distance. Tests were
performed using a MY 2000 Grand Prix with ABS. Shown is the average stopping
distance based on five tests per psi level. The concrete can be described as a fairly rough
surface that has not been worn down like a typical road. The asphalt was built to Ohio
highway specifications, but again has not been worn down by traffic, so it is like a new
asphalt road. A wet road consists of wetting down the surface by making two passes with
a water truck, thus it has a much lower water depth than was used in the Goodyear tests.
Table III-8
Braking Distance (in feet) from NHTSA testing Stopping Distance from 60 mph
Surface 15 psi 20 psi 25 psi 30 psi 35 psi
Wet Concrete 148.8 147.5 145.9 144.3 146.5 Dry Concrete 142.0 143.0 140.5 140.4 139.8 Wet Asphalt 158.5 158.6 162.6 161.2 158.0 Dry Asphalt 144.0 143.9 146.5 148.2 144.0

III-10
These stopping distances indicate:
1. There is an increase in stopping distance as tire inflation decreases from the 30 psi
placard on this vehicle on both wet and dry concrete.
2. On wet and dry asphalt, the opposite occurs, stopping distance decreases as tire
inflation decreases from the 30 psi placard.
3. There is very little difference between the wet and dry stopping distance on the
concrete pad (about 4 feet at 30 psi), indicating the water depth was not enough to
make a noticeable difference on the rough concrete pad. There is a larger
difference between the wet and dry stopping distance on the asphalt pad (13 feet
at 30 psi).
4. No hydroplaning occurred in the NHTSA tests, even though they were conducted
at higher speed (60 mph vs. 45 mph in the Goodyear tests) and at lower tire
pressure (15 psi vs. 17 psi in the Goodyear tests). Again, this suggests that the
water depth in the VRTC tests was not nearly as deep as in the Goodyear testing.
In general, these data suggest that the road surface and depth of water on the road have a
large influence over stopping distance. Given a specific road condition, one can compare
the difference in stopping distance when the tire inflation level is varied. The Goodyear
test results imply that tire inflation can have a significant impact on stopping distance,
while the NHTSA testing implies these impacts would be minor or nonexistent on dry
surfaces and wet surfaces with very little water depth.

IV-1
IV. TARGET POPULATION
Safety Problems associated with Low Tire Pressure
There is no direct evidence in NHTSA’s crash files that points to low tire pressure as the
cause of a particular crash. This is because we have no measurements of tire pressure in
our data bases. The closest data element is “flat tire or blowout”. Even in these cases,
crash investigators cannot tell whether low tire pressure contributed to the tire failure.
Tire failures, especially blowouts, are associated with rollover crashes. Low tire pressure
is more likely to cause loss of control or a skid initially. Skids can lead to tripping and
then a rollover.
The 1977 Indiana Tri-level study associated low tire pressure with loss of control, on
both wet and dry pavements. They never identified it as a “definite” cause of any crash,
but did identify it as a “probable” cause of the crash in 1.4% of the 2258 crash
investigations.1 Note that more than one “probable cause” could be assigned to a crash.
However, at the time of the study, radial tires were on 12% of passenger vehicles, and
now they are on more than 90% of passenger vehicles, including all tires on new
automobiles. The 1977 results may not be applicable in today’s tire environment.
Low tire pressure probably causes crashes indirectly. Such tires wear prematurely and
unevenly, making them more vulnerable to belt failure, punctures and skidding. Severe
under-inflation coupled with an emergency steering maneuver could cause the tire to “de-
bead,” i.e., separate from the rim, which could “trip” the vehicle and cause it to roll over.
1 Tri-level Study of the Causes of Traffic Accidents: Executive Summary, Treat, J.R., Tumbas, N.S., McDonald, S.T., Shinar, D., Hume, R.D., Mayer, R.E., Stansifer, R.L., & Castellan, N.J. (1979). (Contract

IV-2
We will only be able to identify these indirect crashes after we can associate pre-crash
tire pressures with crash types.
The target population for general tire-related caused crashes
The agency examined its crash files to gather whatever information is available on tire-
related problems causing crashes. The National Automotive Sampling System -
Crashworthiness Data System (NASS-CDS) has trained investigators that collect data on
a sample of tow-away crashes around the country. These data can be weighted up to
national estimates. The NASS-CDS contains on its General Vehicle Form the following
information: a critical pre-crash event, vehicle loss of control due to a blowout or flat tire.
This category only includes part of the tire-related problems causing crashes. It does not
include cases where there was improper tire pressure in one or more tires that did not
allow the vehicle to handle as well as it should have in an emergency situation. This
coding would only be used when the tire went flat or there was a blowout and caused a
loss of control of the vehicle, resulting in a crash. However, as stated above, low tire
pressure may contribute directly to the crashes discussed in the paragraphs below. In
addition, there may be other crashes, not included in the paragraphs below, where low
tire pressure played a part.
NASS-CDS data for 1995 through 1998 were examined and average annual estimates are
provided below in Table IV-1. Table IV-1 shows that there are an estimated 23,464 tow-
No. DOT HS 034-3-535). DOT HS 805 099. Washington, DC: U.S. Department of Transportation, NHTSA.

IV-3
away crashes caused per year by blowouts or flat tires. Thus, about one half of a percent
of all crashes are caused by these tire problems. When these cases are broken down by
passenger car versus light truck, and compared to the total number of crashes for
passenger cars and light trucks individually, it is found that blowouts cause more than
three times the rate of crashes in light trucks (0.99 percent) than in passenger cars (0.31
percent). When the data are further divided into rollover versus non-rollover, blowouts
cause a much higher proportion of rollover crashes (4.81) than non-rollover crashes
(0.28); and again more than three times the rate in light trucks (6.88 percent) than in
passenger cars (1.87 percent).
Table IV-1
Estimated Annual Average Number and Rates of
Blowouts or Flat Tires Causing Tow-away Crashes Tire Related Cases Percent Tire Related Passenger Cars Total 10,170 0.31% Rollover 1,837 (18%) 1.87% Non-rollover 8,332 (82%) 0.26% Light Trucks Total 13,294 0.99% Rollover 9,577 (72%) 6.88% Non-rollover 3,717 (28%) 0.31% Light Vehicles Total 23,464 0.51% Rollover 11,414 (49%) 4.81% Non-rollover 12,049 (51%) 0.28%
The Fatality Analysis Reporting System (FARS) was also examined for evidence of tire
problems involved in fatal crashes. In the FARS system, tire problems are noted after the
crash, if they are noted at all, and are only considered as far as the existence of a

IV-4
condition. In other words, in the FARS file, we don’t know whether the tire problem
caused the crash, influenced the severity of the crash, or just occurred during the crash.
For example, (1) some crashes may be caused by a tire blowout, (2) in another crash, the
vehicle might have slid sideways and struck a curb, causing a flat tire which may or may
not have influenced whether the vehicle rolled over. Thus, while an indication of a tire
problem in the FARS file gives some clue as to the potential magnitude of the tire
problem in fatal crashes, it can neither be considered the lowest possible number of cases
nor the highest possible number of cases. In 1995 to 1998 FARS, 1.10 percent of all light
vehicles were coded with tire problems. Light trucks had slightly higher rates of tire
problems (1.20 percent) than passenger cars (1.04 percent). The annual average number
of vehicles with tire problems in FARS was 535 (313 in passenger cars and 222 in light
trucks).
Geographic and Seasonal Effects
The FARS data were further examined to determine whether heat is a factor in tire
problems (see Table IV-2). Two surrogates for heat were examined: (1) in what part of
the country the crash occurred, and (2) in what season the crash occurred. The highest
rates occurred in light trucks in southern states in the summer time, followed by light
trucks in northern states in the summer time, and by passenger cars in southern states in
the summertime. It thus appears that tire problems are heat related.

IV-5
Table IV-2
Geographic and Seasonal Analysis of Tire Problems
(Percent of Vehicles in) FARS with Tire Problems
Winter = December, January, February.
Spring = March, April, May
Summer = June, July, August
Fall = September, October, November.
Southern States = AZ, NM, OK, TX, AR, LA, KY, TN, NC, SC, GA., AL., MS, and FL.
Northern States = all others.
There are also crashes indirectly caused or indirectly involved with tire related problems.
If a vehicle stops on the side of the road due to a flat tire, there is the potential for curious
drivers to slow down to see what is going on. This can create congestion, potentially
resulting in a rear-end impact later in the line of vehicles when some driver isn’t paying
enough attention to the traffic in front of them. The agency has not attempted to estimate
how often a TPMS would give the driver enough warning of an impending flat tire that
they could have the tire repaired before they get stuck having to repair a flat tire in traffic.
However, it should be a very large number.
An indirectly involved crash relating to tire repairs on the road can occur when someone
is in the act of changing a tire on the shoulder of the road. Sometimes drivers repairing
tires are struck (as pedestrians) by other vehicles. This phenomena is not captured in
NHTSA’s data files, but there are three states (Pennsylvania, Washington, and Ohio)
Passenger Cars
Light Trucks
All Light Vehicles
Northern States
Winter 1.01% 0.80% 0.94% Spring 1.12% 1.01% 1.08% Summer 0.98% 1.46% 1.15% Fall 1.04% 0.93% 1.00% Southern States
Winter 0.87% 0.99% 0.92% Spring 1.09% 1.27% 1.16% Summer 1.31% 1.99% 1.59% Fall 0.89% 1.07% 1.00%

IV-6
which have variables in their state files which allow you to search for and combine codes
such as “Flat tire or blowout” with “Playing or working on a vehicle” with “Pedestrians”.
An examination of these files for calendar year 1999 for Ohio and Pennsylvania and for
1996 for Washington found the following information shown in Table IV-3.
Table IV-3 State data on tire problems and pedestrians
Ohio Washington Pennsylvania Pedestrians Injured 3,685 2,068 5,226 Pedestrians Injured While Playing or Working on Vehicle
50
(1.4%)
27
(1.3%)
56
(1.1%)
Pedestrians Injured While Working on Vehicle with Tire Problem
0
2
0
Total Crashes 385,704 140,215 144,169 Crashes with Tire Problems
862 (0.22%)
1,444 (1.03%)
794 (0.55%)
The combined percent of total crashes with tire problems of these three states
(3,100/670,088 = 0.46 percent) compares very favorably with the NASS-CDS data
presented in Table IV-1 of 0.51 percent. The number of pedestrians coded as being
injured while working on a vehicle with tire problems is 2/10,979 = 0.018 percent.
Applying this to the estimated number of pedestrians injured annually across the U.S.
(85,000 from NASS-GES), results in an estimated 15 pedestrians injured per year. It is
possible that these numbers could be much higher, if they were coded correctly. The

IV-7
agency is not going to estimate how many of the pedestrian injuries could be reduced
with a TPMS.

V-1
V. BENEFITS
Human Factors Issues
There are two human factors issues involved with Tire Pressure Monitoring Systems (TMPS).
The first is what information is presented to the driver and how it is presented, and the second is
whether the warning makes the driver pull into the next service area to check the pressure.
Regarding the information that the driver sees, the agency is proposing alternative display icons
for comment. Some testing has been done on the understandability of these icons. The indirect
measurement systems can only provide a warning light that tire pressure is low. The direct
measurement systems could display individual tire pressures and tell the driver which tire(s) are
low. Although individual tire pressures are not proposed to be required, this analysis assumes
that manufacturers of direct measurement systems will display individual tire pressures because
it will be helpful to drivers in terms of fuel economy, tread wear and safety.
We anticipate that drivers will react differently to the different amounts of information. Some
drivers will keep track of the individual tire pressures and will add pressure to their tires
whenever necessary, say at 10 percent below placard, even before the warning is given. These
drivers will accrue more safety benefits and more benefits in terms of fuel economy and tread
life than drivers that wait longer for a warning. On the other hand, some drivers who currently
check their own tires frequently enough to avoid significant underinflation may start to rely on
the TPMS to indicate underinflation, rather than checking their tires frequently and filling them
up whenever they were below the placard level. We believe this would happen more often for an

V-2
indirect system, where only a warning light comes on when tire pressure goes below a specified
threshold, rather than a direct system where individual tire pressures could be monitored
continuously. These drivers would actually accrue fewer safety, tread wear and fuel economy
benefits than they did without the TPMS. The agency has no information that would help it
estimate what percent of drivers would put to use the information on individual tire pressures.
The second question is whether drivers, given a warning, will stop and inflate their tires back to
the placard pressure. We do not expect driver compliance with the TMPS telltale, which is
amber or yellow, to be 100 percent. We have found no data with which we can predict
compliance levels. We assume more than 50 percent of drivers will want to make sure they
don’t get a flat tire and be stranded somewhere, so they will fill the low tire(s). Given just a
telltale, some drivers will try to just fill one low tire. Given a reading of tire pressure on all four
tires with a direct measurement system, the driver will know which tires are low and need to be
filled.
For this analysis, we will assume that the equivalent of 80 percent of the drivers will react to a
direct measurement system that gives them a continuous readout of tire pressure and to a
continuous warning light when their tires get 20 percent below the placard and will inflate their
tires the next time they refuel, given the gas station has the equipment. This takes into account
the group that will fill their tires more frequently because they have continuous information, than
those who would just fill their tires when given a warning. We assume that with an indirect
measurement system 60 percent of the drivers will inflate their tires back up to the placard level

V-3
when given a warning. Thus, for Alternative 1, we will be using 80 percent, and for Alternative
2, we will be using the weighted average of 66.6 percent (80% * 0.33 + 60% * .67).
Stopping Distance
Tires are designed to maximize their performance capabilities at a specific inflation pressure.
When tires are under-inflated, the shape of the tire’s footprint and the pressure it exerts on the
road surface are both altered. This degrades the tire’s ability to transmit braking force to the
road surface. There are a number of potential benefits from maintaining the proper tire inflation
level including reduced stopping distances, better handling of the vehicle in a curve or in a lane
change maneuver, and less chance of hydroplaning on a wet surface, which can affect both
stopping distance and skidding and/or loss of control. An estimate will be made of the impact of
TPMS on stopping distance, but other benefits from improved maneuverability cannot yet be
quantified.
The relationship of tire inflation to stopping distance is influenced by the road conditions (wet
versus dry), as well as by the road surface composition. Decreasing stopping distance is
beneficial in several ways. First, some crashes can be completely avoided by stopping quicker.
Second, some crashes will still occur, but they occur at a lower impact speed because the vehicle
is able to decelerate quicker during braking.
In Chapter III, a variety of stopping distance test results are discussed. In tests conducted by
Goodyear Tire and Rubber Company, significant increases were found in the stopping distance
of tires that were under-inflated. By contrast, tests conducted by NHTSA at their VRTC testing
V-4
ground found only minor differences in stopping distance, and in some cases these distances
actually decreased with lower inflation pressure. The NHTSA tests also found only minor
differences between wet and dry surface stopping distance. It is likely that some of these
differences are due to test track surface characteristics. The NHTSA track surface is considered
to be extremely aggressive in that it allows for maximum friction with tire surfaces. It is more
representative of a new road surface than the worn surfaces experienced by the vast majority of
road traffic. The Goodyear tests may also be biased in other ways. Their basic wet surface tests
were conducted on surfaces with .05” of standing water. This is more than would typically be
encountered under normal wet road driving conditions and may thus exaggerate the stopping
distances experienced under most circumstances. On the other hand, crashes are more likely to
occur under more hazardous conditions, which may mean the Goodyear data are less biased
when applied to the actual crash involved population. Generally speaking, the Goodyear test
results imply a significant impact on stopping distance from proper tire pressure, while the
NHTSA tests imply these impacts would be minor or nonexistent at lesser water depths. This
analysis will estimate stopping distance impacts using the Goodyear data to establish an upper
range of potential benefits. A lower range of no benefit is implied by the current NHTSA test
results.
Impact Speed/Injury Probability Model
In order to estimate the impact of improved stopping distance on vehicle safety, NASS-CDS data
were examined to derive a relationship between vehicle impact speed (delta-V) and the
probability of injury. Following is a description of the derivation of this model.

V-5
Data: From 1995-1999 CDS, all passenger vehicle occupants involved in crashes where at least
one passenger vehicle used brakes.
Methodology: (1) The percent probability risk of MAIS 0, MAIS 1+, MAIS 2+, MAIS3+,
MAIS4+, MAIS 5+, and fatal injuries was calculated for each delta-V between 0 and 77 mph.
The percent probability risk of each MAIS j+ injury level at each delta-V i mph is defined as the
number of MAIS j+ injury divided by the total number of occupants involved at i mph delta-V.
If j=0 represents MAIS 0 injuries and j=6 represents fatalities, the probability of injury risk can
be represented by the following formula:
i
ji,ji,
T
100.0xp =+ i = 0 to 77, j = 0 to 6
Where :
p+i,j = percent probability risk of MAIS j+ injuries at i mph delta-V,
I i,j = the number of j+ injuries (i.e., MAIS 0, MAIS 1+, MAIS 2+, …, fatal) at i
mph delta-V
Ti = total number of occupants at i mph delta-V
Note that p+i,0 = percent probability risk of MAIS 0 injuries at i mph delta-V and p+
i,6 = percent
probability risk of fatalities at i mph delta-V. Ii,0 = the number of MAIS 0 injuries and Ii,6 the
number of fatalities at i mph delta-V.
(2) The risk-prediction curve for each j injury level was derived using a mathematical modeling
process. The process used delta-V as the independent variable (i.e., predictor) and p+i,j as the
dependent variable and modeled all the data points (delta-V, percentage risk) for each j injury
level. For example, for MAIS 1+ injuries, the process used the data points: (0, p+0,1), (1, p+
1,1),

V-6
(2, p+2,1), …, (75, p+
75,1), (76, p+76,1), (77, p+
77,1) to derive the MAIS 1+ risk curve. Table V-1
shows all the risk-prediction formula. These formulas were developed under two assumptions:
a) no one was injured at 0 mph, i.e., P+0,0 = 100 percent, and P+
0,j = 0 percent for j=1…6, and b)
everyone was assumed to have at least MAIS 1 injuries for 36 mph and higher delta-V, i.e., p+i,0
= 0 , for i >=36 mph. This assumption was based on the injury distribution derived from 1995-
1999 CDS.
Table V-1 Injury Probability Risk Curve Formula
Injury Level Risk-Prediction Formula
MAIS 0
36i0,35i,e*100p i0.0807
i,0
≥=≤= ∗−+
MAIS 1+
36i100,35ii),*SIN(0.044993.2210p i,1
≥=≤∗=+
MAIS 2+ 5.0345i0.1683
5.0345i0.1683
i,2e1
e100p
−∗
−∗+
+∗=
MAIS 3+ 5.5337i0.1292
5.5337i0.1292
i,3e1
e*100p
−∗
−∗+
+=
MAIS 4+ 7.3675i0.1471
7.3675i0.1471
i,4e1
e*100p
−∗
−∗+
+=
MAIS 5+ 7.8345i0.1516
7.8345i0.1516
i,5e1
e100p
−∗
−∗+
+∗=
Fatal (j=6) 8.2629i0.1524
8.2629i0.1524
i,6e1
e100p
−∗
−∗+
+∗=
(3) The percent probability risk pi,j was calculated for individual MAIS level. For MAIS 0 (j=0)
and fatal injuries (j=6), pi,0 = p+i,0 and pi,6 = p+
i,6 . The percentage risk for each MAIS 1 to MAIS
5 injury level is the difference between the two predicted risks. Thus, pi,1 (risk of MAIS 1 at i
mph delta-V) = p+i,1 - p+
i,2, pi,2 = p+i,2 - p+
i,3, pi,3 = p+i,3 - p+
i,4, pi,4 = p+i,4 - p+
i,5, and pi,5 = p+i,5 - p+
i,6.

V-7
(4) Adjusted total row percent risk to 100 percent. Because of statistical measurement variation
and predicting errors, the row risk percentages at some delta-Vs do not add to 100 percent. To
adjust to a total of 100 percent for these delta-Vs, an adjustment factor (fi) is applied to every risk
probability. The adjustment factor is 100/(actual total percentage), i.e., ∑
=
jji,
i p100
f where j =
0…6.
The adjusted risk probabilities for i mph delta-V would be fi * pi,j. For example, at 10 mph delta-
V, f10 = 100/85 = 1.1765. The risk probability for MAIS 0 becomes 52.5 (= 44.6*1.1765) and
MAIS 1 becomes 43.5 (= 37.0*1.1765). These adjusted risk probabilities are higher than those
predicted by the original curves listed in Table V-1. However, the general shape of each curve
does not alter significantly. Table V-2 shows the adjusted percent probabilities of risk. Note that
cell probabilities were rounded to the nearest tenth. Therefore the sum of the individual cells
may not total exactly 100 percent.
Once this relationship was established, crash data from 1999 CDS and FARS were distributed
across this matrix to establish a “base case” injury distribution. This was done separately for 3
different groups of crashes stratified according to the speed limits on the roadways where crashes
occurred. The roadway stratification was selected because stopping distances are largely
dependent on initial pre-braking travel speed, and speed limits were assumed to provide a
reasonable stratification for this variable. However, actual travel speeds differ from speed limits.
For this analysis, it was assumed that actual travel speeds were 5 mph higher than the mean

V-8
speed limit in each category. The 3 speed limit categories were 0-35mph, 36-50mph, and 51
mph and over. The mean speed limits for each category were 30, 44, and 57. There were only
minor differences between speed limits for wet and dry surfaces, or for passenger cars and LTVs.
Therefore, the same average speed limit is used regardless of road surface or vehicle type.
Allowing for a 5 mph difference for travel speed, the three assumed average speeds that
represent the speed limit categories are 35, 49, and 62 mph.

V-9
Table V-2 Adjusted Percent Probabilities of Injury Risk
Delta-V (mph) MAIS0 MAIS 1 MAIS 2 MAIS 3 MAIS 4 MAIS 5 Fatal Total 0 100.0 0.0 0.0 0.0 0.0 0.0 0.0 100.01 95.6 3.5 0.4 0.3 0.1 0.0 0.0 99.92 91.0 8.0 0.4 0.4 0.0 0.1 0.0 99.93 86.3 12.5 0.5 0.5 0.0 0.1 0.0 99.94 81.3 17.2 0.7 0.7 0.0 0.1 0.0 100.05 76.3 21.9 0.9 0.7 0.0 0.0 0.1 99.96 71.3 26.6 1.0 0.8 0.1 0.0 0.1 99.97 66.4 31.2 1.3 0.9 0.1 0.0 0.1 100.08 61.5 35.7 1.5 1.1 0.1 0.0 0.1 100.09 56.9 39.6 2.0 1.2 0.0 0.1 0.1 99.9
10 52.5 43.5 2.4 1.3 0.1 0.1 0.1 100.011 48.2 47.1 2.8 1.5 0.1 0.1 0.1 99.912 44.3 50.2 3.4 1.6 0.2 0.0 0.2 99.913 40.5 53.1 3.9 2.0 0.1 0.1 0.2 99.914 37.1 55.6 4.6 2.2 0.2 0.1 0.2 100.015 33.9 57.6 5.5 2.4 0.2 0.1 0.3 100.016 31.0 59.1 6.5 2.6 0.3 0.1 0.3 99.917 28.3 60.4 7.6 2.9 0.3 0.2 0.3 100.018 25.8 61.1 8.8 3.3 0.3 0.2 0.4 99.919 23.5 61.5 10.1 3.7 0.3 0.2 0.5 99.820 21.4 61.4 11.7 4.1 0.4 0.3 0.5 99.821 19.6 61.0 13.4 4.5 0.5 0.3 0.6 99.922 17.8 60.1 15.4 5.0 0.5 0.4 0.7 99.923 16.3 58.8 17.4 5.6 0.5 0.4 0.9 99.924 14.9 57.1 19.6 6.2 0.6 0.5 1.0 99.925 13.7 55.1 21.9 6.9 0.7 0.5 1.2 100.026 12.6 52.7 24.4 7.6 0.8 0.7 1.3 100.127 11.5 50.0 26.9 8.4 0.9 0.7 1.6 100.028 10.5 47.1 29.5 9.2 1.0 0.9 1.8 100.029 9.6 43.9 32.1 10.1 1.2 1.0 2.1 100.030 8.9 40.6 34.5 11.0 1.4 1.2 2.4 100.031 8.2 37.1 36.8 12.1 1.5 1.4 2.8 99.932 7.6 33.7 38.9 13.3 1.7 1.5 3.3 100.033 7.0 30.2 40.9 14.4 1.9 1.8 3.8 100.034 6.4 26.7 42.5 15.7 2.2 2.0 4.4 99.935 6.0 23.2 43.9 17.1 2.4 2.3 5.1 100.036 0.0 26.4 44.3 18.1 2.7 2.6 5.9 100.037 0.0 23.3 44.7 19.3 2.9 3.0 6.8 100.038 0.0 20.4 44.7 20.4 3.3 3.4 7.8 100.039 0.0 17.8 44.3 21.5 3.6 3.8 9.0 100.040 0.0 15.5 43.5 22.5 4.0 4.2 10.3 100.041 0.0 13.4 42.5 23.3 4.3 4.7 11.8 100.042 0.0 11.6 41.1 24.0 4.6 5.3 13.4 100.043 0.0 10.0 39.5 24.4 4.9 5.9 15.3 100.044 0.0 8.5 37.7 24.8 5.2 6.4 17.4 100.045 0.0 7.3 35.7 24.9 5.5 6.9 19.7 100.0

V-10
Table V-2 Adjusted Percent Probabilities of Injury Risk, Cont.
46 0.0 6.3 33.6 24.7 5.7 7.5 22.2 100.047 0.0 5.3 31.5 24.4 5.8 8.0 25.0 100.048 0.0 4.5 29.4 23.7 6.0 8.5 27.9 100.049 0.0 3.9 27.2 22.9 6.0 8.9 31.1 100.050 0.0 3.3 25.1 21.9 6.0 9.2 34.5 100.051 0.0 2.8 23.0 20.8 6.0 9.4 38.0 100.052 0.0 2.4 21.0 19.6 5.8 9.6 41.6 100.053 0.0 2.0 19.2 18.2 5.6 9.6 45.4 100.054 0.0 1.7 17.4 16.9 5.3 9.5 49.2 100.055 0.0 1.4 15.8 15.5 5.0 9.3 53.0 100.056 0.0 1.2 14.2 14.1 4.7 9.1 56.7 100.057 0.0 1.0 12.8 12.8 4.3 8.7 60.4 100.058 0.0 0.9 11.4 11.5 3.9 8.3 64.0 100.059 0.0 0.7 10.3 10.2 3.6 7.7 67.5 100.060 0.0 0.6 9.2 9.1 3.2 7.2 70.7 100.061 0.0 0.5 8.2 8.0 2.9 6.6 73.8 100.062 0.0 0.4 7.4 7.0 2.5 6.1 76.6 100.063 0.0 0.4 6.5 6.1 2.2 5.6 79.2 100.064 0.0 0.3 5.8 5.3 2.0 5.0 81.6 100.065 0.0 0.3 5.1 4.6 1.7 4.5 83.8 100.066 0.0 0.2 4.6 4.0 1.4 4.0 85.8 100.067 0.0 0.2 4.0 3.5 1.2 3.6 87.5 100.068 0.0 0.2 3.5 3.0 1.1 3.1 89.1 100.069 0.0 0.1 3.2 2.5 0.9 2.8 90.5 100.070 0.0 0.1 2.8 2.2 0.8 2.4 91.7 100.071 0.0 0.1 2.5 1.8 0.7 2.1 92.8 100.072 0.0 0.1 2.2 1.5 0.6 1.8 93.8 100.073 0.0 0.1 1.9 1.3 0.5 1.6 94.6 100.074 0.0 0.1 1.7 1.1 0.4 1.4 95.3 100.075 0.0 0.1 1.4 1.0 0.3 1.2 96.0 100.076 0.0 0.0 1.4 0.8 0.2 1.1 96.5 100.077 0.0 0.0 1.2 0.7 0.2 0.9 97.0 100.0
Separate target populations were also derived for passenger cars and LTVs, and for crashes that
occur on wet and dry pavement. These distinctions were necessary because stopping distance is
strongly influenced by pavement conditions and vehicle characteristics. In addition, LTVs have
significantly different levels of under-inflation than passenger cars and this impacts calculations
of delta-V reductions. Note that the presence or absence of anti-lock brakes also has a

V-11
significant influence on stopping distance. However, because reliable data on the presence of
these systems is not included in crash databases, these differences will be accounted for at a
different stage of the analysis. A total of 12 separate target population cells were thus produced.
The fatalities and injuries for each cell are summarized in Table V- 3 for passenger cars and
Table V-4 for LTVs. Table V-5 summarizes the target populations across all passenger vehicles.
Table V-3 Passenger Vehicle Occupants in Crashes Where
at Least One Passenger Car Used Brakes 1995-1999 CDS, Annual Average
MAIS0 MAIS 1 MAIS 2 MAIS 3 MAIS 4 MAIS 5 Fatal Total WET 0-35mph 85606 75611 6775 3101 275 163 362 17189236-50mph 54150 68246 6886 3007 249 161 361 13306051+mph 22209 23586 2391 1064 94 70 146 49560 DRY 0-35mph 195969 180663 17018 7616 654 438 965 40332236-50mph 218895 219066 20463 9123 860 480 1273 47015851+mph 58407 73930 13700 5237 554 423 959 153208 Total 635236 641101 67233 29147 2685 1735 4064 1381201
Table V-4 Passenger Vehicle Occupants in Crashes Where
at Least One LTV Used Brakes 1995-1999 CDS, Annual Average
MAIS0 MAIS 1 MAIS 2 MAIS 3 MAIS 4 MAIS 5 Fatal Total WET 0-35mph 23345 27243 2621 1156 101 66 135 54668 36-50mph 34549 42404 3664 1729 121 95 212 82774 51+mph 8183 9810 1535 649 79 66 182 20503 DRY 0-35mph 98640 99100 11291 4800 466 293 699 215290 36-50mph 87072 98763 12016 4985 460 341 911 204547 51+mph 44147 50883 9399 3687 412 321 726 109575 Total 295936 328204 40526 17006 1639 1182 2865 687358
V-12
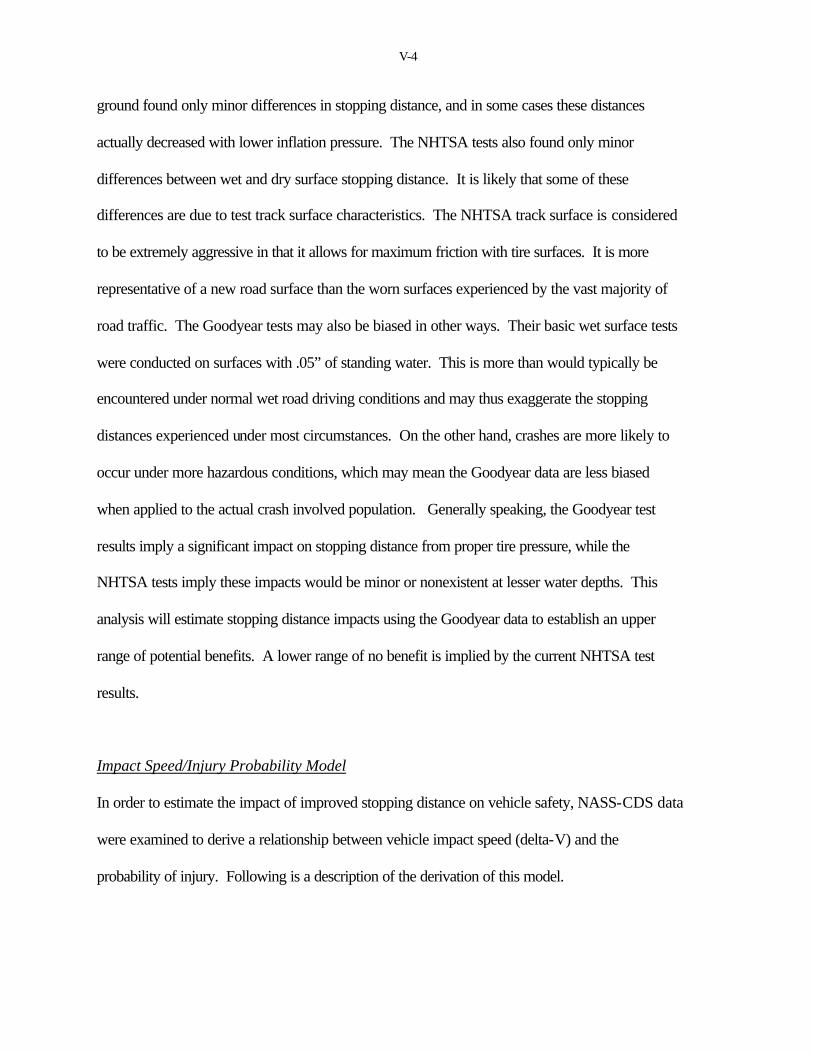
Table V-5 Passenger Vehicle Occupants in Crashes Where
at Least One Vehicle Used Brakes 1995-1999 CDS, Annual Average
MAIS0 MAIS 1 MAIS 2 MAIS 3 MAIS 4 MAIS 5 Fatal Total WET 0-35mph 108951 102854 9396 4257 376 229 497 22656136-50mph 88699 110650 10551 4736 370 256 573 21583551+mph 30392 33396 3926 1712 173 136 328 70064 DRY 0-35mph 294609 279763 28310 12416 1120 731 1664 61861236-50mph 305966 317828 32478 14108 1320 821 2184 67470551+mph 102554 124813 23098 8924 966 744 1684 262783 Total 931172 969305 107759 46153 4325 2917 6930 2068560 Preventable Crashes
The impact of small reductions in stopping distance will, in most cases, result in a reduction in
the impact velocity, and hence the severity, of the crash. However, in some cases, reduced
stopping distance will actually prevent the crash from occurring. This would result, for example,
if the braking vehicle were able to stop just short of impacting another vehicle instead of sliding
several more feet into the area it occupied.
The benefits that would accrue from preventable crashes would only impact that portion of the
fleet that:
a) Has low tire pressure, and b) Would be notified by the TPMS c) Is driven by drivers who will respond to the warning

V-13
Data from NHTSA’s tire pressure survey (discussed in Chapter III) indicate that 74 percent of
the on-road fleet has at least one tire that is under-inflated. For these vehicles, notification of this
under-inflation would not be given until the system is triggered. For example, under Alternative
1, it is estimated that direct TPMS will trigger at roughly 20% below placard pressure, or roughly
6 psi for passenger cars and 7 psi for trucks. The portion of the vehicle fleet that is below these
levels will potentially experience some reduction in crash incidence due to improved stopping
distance. Data from NHTSA’s tire pressure survey indicate that 36 percent of passenger cars
and 40 percent of LTVs have at least one tire that is 20 percent or more below recommended
placard pressure. However, in order to experience this reduction, the driver must respond to the
warning. NHTSA has no data to indicate what portion of drivers will take action in response to
this warning. For this analysis, it will be assumed that 80 percent would respond to direct
systems. Eighty percent is chosen to represent a level that reflects the heightened consumer
awareness that would come with systems that constantly monitor and display tire pressure levels.
A lower response rate of 60 percent is assumed for indirect systems, which only provide
information when the systems reach the warning level.
The portion of crashes that would actually be preventable is unknown. However, an estimate can
be derived from relative stopping distance calculations for vehicles that were involved in crashes.
The average stopping distance was calculated for the existing crash-involved vehicle fleet, and
for that fleet if they had correct tire inflation pressure. The method used to calculate these
stopping distances is described in a later section of this analysis. The results indicate that the
existing passenger car fleet would, on average, experience a stopping distance of 137 feet, while
the crash-involved LTV fleet experienced an average stopping distance of 131.5 feet. These

V-14
differences between passenger car and LTV stopping distances reflect the distribution of injuries
by speed and road conditions for each vehicle type. By contrast, the average stopping distance
for passenger cars with correctly inflated tires would be 132.1 feet, while for LTVs it would be
127.3 feet.
In theory, current crashes occur under a variety of stopping distances but if these distances were
shortened due to improved inflation pressure then a portion of these crashes would be prevented.
Crashes could be prevented over a variety of travel speeds and braking distances. For example, a
vehicle might be able to avoid an intersection crash by slowing quickly enough to miss a
speeding vehicle running a red light. In an angular head-on crash, better braking could reduce
the chance of two vehicles striking their corners, given that crash avoidance maneuvers are also
taking place. An example for rear impacts could involve sudden braking to avoid a vehicle
swerving to cross lanes on an interstate highway. We anticipate that a large portion of the
fatality and serious injury benefits for crash avoidance would occur in intersection crashes, since
both vehicles are moving at high speeds, and a small change in braking efficiency could result in
the avoidance of a high-impact crash.
NHTSA does not have data that indicate average stopping distance in crashes. Under these
circumstances, it is not unreasonable to assume that crashes are equally spread over the full range
of stopping distances. Under this assumption, the change in stopping distance under proper
inflation conditions can be used as a proxy for the portion of crashes that are preventable. With
equal distribution of crashes across all stopping distances, the portion of crashes that occur
within the existing stopping distance that exceeds the stopping distance with correct pressure

V-15
represents the portion of crashes that are preventable. For passenger cars, this portion is (137-
132.1)/137 or 3.6 percent of all current crashes. For LTVs, this portion is (131.5-127.3)/131.5 or
3.2 percent.
Benefits from preventable crashes were thus calculated as follows:
Ip(s)=Pp*I(s)*Pu*Pr
Where,
Ip(s) = Preventable injuries of severity (s)
Pp = portion of crashes that are preventable
I(s) = Existing injuries of severity (s)
Pu = portion of vehicles with under-inflated tires that will receive notification from TPMS
Pr = portion of drivers who will respond to the TPMS notification
The results of this analysis are shown for passenger cars under Alternative 1 in Table V-6 . The
combined results for all vehicles under Alternative 1 are shown in Table V-7, and for Alternative
2 in Table V-8. Note that these results have been adjusted to reflect a small amount of overlap
that occurred in the separate examination of passenger car and LTV crashes. An adjustment
factor of .968 was applied to account for this overlap. This factor was derived by comparing the
sum of the two separate crash counts to a total count based on all passenger vehicles.
The benefits from preventable crashes, shown in Tables V-6, 7, and 8, were assumed to occur
over all crash types and severities. This assumption recognizes that there are a variety of crash

V-16
circumstances for which marginal reductions in stopping distance may prevent the crash from
occurring. Crash prevention may be more likely under some circumstances than others. For
example, it is possible that a larger portion of side impacts might be prevented than head-on
collisions. In side impacts where vehicles are moving perpendicular to each other, improved
braking by one vehicle reduces the speed at which it enters the crash zone and potentially allows
the second vehicle to move through the crash zone, thus avoiding the impact. In a head-on
collision, both vehicles are moving toward the crash and a reduction in stopping distance for one
vehicle may be less likely to avoid a high-speed crash than in the case discussed above for side
impacts. Further, if a separate analysis were conducted for different crash types and severities,
the portion of crashes prevented would be greater for crashes at higher speeds. However,
NHTSA does not have sufficient information to conduct a separate analysis of each crash
circumstance and has used an overall estimate across all crash types instead. Comments are
requested on this assumption.
Table V-6 Potential Benefits from Preventable Crashes,
Passenger Cars Adjusted for Properly Inflated Vehicles, 20% Notification Level, 80% Response Rate, and Overlap
MAIS0 MAIS 1 MAIS 2 MAIS 3 MAIS 4 MAIS 5 Fatal
WET 0-35mph 856 -756 -68 -31 -3 -2 -436-50mph 541 -682 -69 -30 -2 -2 -451+mph 222 -236 -24 -11 -1 -1 -1 DRY 0-35mph 1959 -1806 -170 -76 -7 -4 -1036-50mph 2188 -2189 -205 -91 -9 -5 -1351+mph 584 -739 -137 -52 -6 -4 -10 Total 6349 -6407 -672 -291 -27 -17 -41NOTE: Negative signs indicate reductions in injury levels.

V-17
Table V-7
Potential Benefits from Preventable Crashes, All Passenger Vehicles Adjusted for Properly Inflated Vehicles,
Delta-V Distribution, 80% Response Rate, and Overlap Alternative 1
MAIS0 MAIS 1 MAIS 2 MAIS 3 MAIS 4 MAIS 5 Fatal WET 0-35mph 1086 -1024 -94 -42 -4 -2 -536-50mph 882 -1100 -105 -47 -4 -3 -651+mph 303 -332 -39 -17 -2 -1 -3 DRY 0-35mph 2932 -2783 -281 -123 -11 -7 -1736-50mph 3047 -3164 -323 -140 -13 -8 -2251+mph 1019 -1241 -230 -89 -10 -7 -17 Total 9268 -9645 -1072 -459 -43 -29 -69NOTE: Negative signs indicate reductions in injury levels.
Table V-8
Potential Benefits from Preventable Crashes, All Passenger Vehicles Adjusted for Properly Inflated Vehicles,
Delta-V Distribution, Response Rate, and Overlap Alternative 2
MAIS0 MAIS 1 MAIS 2 MAIS 3 MAIS 4 MAIS 5 Fatal WET 0-35mph 724 -672 -61 -28 -2 -1 -336-50mph 554 -693 -67 -30 -2 -2 -451+mph 198 -216 -25 -11 -1 -1 -2 DRY 0-35mph 1877 -1770 -176 -78 -7 -5 -1036-50mph 1984 -2042 -204 -89 -8 -5 -1451+mph 631 -774 -143 -55 -6 -5 -10 Total 5968 -6167 -676 -290 -27 -18 -43NOTE: Negative signs indicate reductions in injury levels.

V-18
Non-Preventable Crashes
In the vast majority of crashes, small changes in stopping distance will not prevent the crash, but
will reduce the speed at impact and thus the severity of the crash. As noted above, 3.6 percent of
braking passenger cars and 3.2 percent of braking trucks could have avoided crashes with proper
tire inflation. The remaining 96.4 percent of passenger car crashes and 96.8 percent of LTV
crashes would still occur, but at a reduced impact speed. To estimate the impact of reduced
crash speeds, changes in stopping distance will be estimated and used as inputs to recalculate
impact speeds for the population of non-preventable crashes. These changes in impact speeds
will then be used to redefine the injury profile of this crash population shown in Table V-2, and
safety benefits will be calculated as the difference between the existing and the revised injury
profiles.
Stopping Distance
Stopping distance can be computed as a function of initial velocity and tire friction. The formula
for computing stopping distance is as follows:
SD = Vi2/(2*g*Mu*E)
Where:
SD =Stopping Distance (in feet)
Vi = initial velocity (mean speed limit for specific data group + 5 mph)
g = gravity constant (32.2 ft/second squared)
Mu = tire friction constant (ratio of friction force/vertical load )
E = ABS braking efficiency (estimated @ 0.8)

V-19
About a third of all passenger vehicles sold in the U.S. do not have anti-lock brakes, although
the portion is higher in the on-road fleet. For these regular braking systems, the term for anti-
lock brake efficiency (E) would not be used.
Calculating Mu
The value of Mu is dependent on surface material (concrete, asphalt, etc.), surface condition (wet
vs. dry), inflation pressure, and initial velocity. The Goodyear Tire and Rubber Company
submitted a model they developed by testing tires under various circumstances that predicts Mu
based on Vi and inflation pressure. Separate models were developed for Mu at both peak (the
maximum level of Mu achieved while the tire still rotates under braking conditions) and slide
(the level of Mu achieved when tires cease to rotate while braking (i.e., skid)). The models are
as follows:
Ms = 0.2339537+(0.0034537*ip)+(0.0003625*Vi)-(0.000049*Vi2)
Mp = 0.4374907+(0.0024907*ip)+(0.003075*Vi)-(0.000095*Vi2)
Where:
Ms = Mu slide value
Mp = Mu peak value
ip = inflation pressure (psi)
Vi = initial vehicle speed (mph)

V-20
Mu Surface Adjustments
The above formulae were derived from tests conducted on a Traction Truck surface (this is a
specific surface calibrated to specifications of the companies OEM customers). In order to relate
them to real world surfaces, predicted values from the formulas were compared to actual test
results on 2 surface types (asphalt and concrete). From this, a surface adjustment factor was
obtained for each surface. For asphalt, the factor was 1.22. For Concrete, it was 2.00. Although
most road surfaces are asphalt, the test surfaces tend to be slicker than roads that have
experienced wear. NHTSA and Goodyear engineers both felt that the frictional qualities of the
concrete test surface are most like those encountered on actual roads. Therefore, calculations of
stopping distance will be based on the Concrete surface adjustment factor. The formulae thus
become:
Ms = (0.2339537+(0.0034537*ip)+(0.0003625*Vi)-(0.000049*Vi2))/2
Mp = (0.4374907+(0.0024907*ip)+(0.003075*Vi)-(0.000095*Vi2))/2
The models provided by Goodyear were developed using wet traction test data, and are thus
appropriate for wet surfaces only. Goodyear tested the tires with .05” of water on the track
surface. This is more than would typically be encountered under normal wet road driving
conditions and may thus exaggerate the stopping distances experienced under most
circumstances. On the other hand, crashes are more likely to occur under more hazardous
conditions, which may mean the Goodyear data are less biased when applied to the actual crash
involved population With these caveats, this analysis assumes the data to be representative of
the crash involved population on wet surfaces. To adjust for dry surfaces, NHTSA used data

V-21
provided by Goodyear to develop models that predict adjustment ratios for dry surface
conditions. The data on which these models are based is listed in Table V-9. The models take
the following form:
DFs = -0.022778*ip+.0485*Vi+1.437222
DFp = -0.0075*ip+0.03225*Vi+1.0575
Where:
DFs = slide dry surface adjustment factor
DFp = peak dry surface adjustment factor
The formula for Mu peak and slide on dry surfaces thus become:
Ms = ((0.2339537+(0.0034537*ip)+(0.0003625*Vi)-(0.000049*Vi2))/2)*DFs
Mp = ((0.4374907+(0.0024907*ip)+(0.003075*Vi)-(0.000095*Vi2))/2)*DFp
Table V-9
Measured Mu Values by Surface Condition, Speed and Inflation Pressure
Dry Wet Ratio Dry/Wet psi,speed Peak Slide Peak Slide Peak Slide
35,40 0.949 0.66 0.454 0.244 2.09 2.7035,60 0.936 0.646 0.343 0.182 2.73 3.5517,40 0.995 0.7 0.448 0.234 2.22 2.9935,40 1.036 0.7 0.499 0.285 2.08 2.46
Source: Goodyear Tire and Rubber Co.

V-22
Anti-lock and Normal Braking Systems
Roughly 2/3 of all passenger vehicles sold in the U.S. have anti-lock brakes, but the portion is
smaller in the on-road fleet. For vehicles with anti-lock brake systems, Mp is used to calculate
stopping distance because it represents the peak controlled braking force that anti-lock brakes
attempt to maintain. For vehicles with regular brake systems, Ms is used because it represents
the level of friction encountered under normal braking by most drivers without assistance from
anti-lock brakes. Also, for these regular braking systems, the term for anti-lock brake efficiency
(E) would not be used.
Delta-V
Changes in stopping distances were then used to calculate the decrease in crash forces (measured
by delta-V) that would occur due to the decrease in striking velocity of the vehicle. The formula
used to calculate striking velocity is:
V(d) = adVi 22 −
Where:
V(d) = velocity of vehicle at distance d after braking
a = deceleration
d = distance traveled during braking of vehicle
In this case, V(d) is a measure of the speed at which the vehicle with under-inflated tires would be
traveling when it reaches the distance at which it would have stopped had its tires been correctly

V-23
inflated (d). Deceleration (a) is calculated for the vehicle with under-inflated tires. The derived
formula for deceleration is:
a = (V(d)2-Vi2)/(2*d)
Since V = 0 at d, the formula becomes:
a = (Vi2)/(2*d) (the negative sign that would precede the formula indicates deceleration
and will be ignored from this point on)
The distance over which a is calculated is the stopping distance for the vehicle with under-
inflated tires. This will be designated as SDu. The formula thus becomes:
a = (Vi2)/(2*SDu)
Where:
SDu = stopping distance with under-inflated tires
The striking velocity is then expressed in mph by multiplying by 1/ 5280 ft.*3600 sec. hour. The
delta-V experienced by each vehicle would be dependent on vehicle mass. For this analysis, the
mass of each vehicle was assumed to be equal, giving a delta-V of 1/2 V(d) for each vehicle or:
DELTA-V = (V(d)*3600/5280)/2

V-24
Where:
DELTA-V = the change in velocity resulting from increased tire pressure.
The base case target population represents the injury profile that results from the fleet of
passenger vehicles that were on the road at that time. In order to determine the inflation pressure
that exists in that fleet, NHTSA conducted a survey of both recommended and actual inflation
pressures on vehicles. Details of that survey are discussed elsewhere in this analysis. The
results of the survey indicate that 74% of all passenger vehicles are driven with under-inflated
tires. However, because TPMS would not notify drivers of low pressure until it dropped 20% or
25% below placard, no stopping distance benefits would accrue to vehicles with smaller tire
pressure deficits. Weighting factors were derived from the tire pressure survey to represent the
affected population under each alternative. For Alternative 1, these weights were drawn from the
population that had at least one tire 20% or more under-inflated. For Alternative 2, these weights
were drawn from the population that had at least one tire 25% or more under-inflated. In the
case of Anti-lock Brake systems under Alternative 2, the population was also restricted to cases
where the maximum inflation pressure of any tire exceeded the minimum pressure by at least
25%. The distribution of each level of under-inflation is shown in Table V-10 for both
Alternatives.

V-25
Table V-10 Percent of Vehicles Under-inflated Within Notification Levels
Alternative 1 Alternative 2
20% or more below Placard pressure 25% or more below Placard pressure Anti-lock Brakes Non-Anti-lock Brakes Under-Inflated Percent Under-Inflated Percent Under-Inflated Percent Under-Inflated Pressure (psi) PCs LTVs PCs LTVs PCs LTVs
-1 3.5% 1.2% 19.0% 14.6% 0.2% 0.2%-2 8.8% 5.4% 13.1% 12.0% 7.4% 4.9%-3 13.1% 8.1% 14.4% 10.4% 11.2% 6.0%-4 13.5% 11.5% 12.0% 9.6% 11.8% 8.2%-5 15.3% 11.7% 10.5% 10.0% 13.7% 8.4%-6 12.2% 14.8% 7.5% 10.0% 12.3% 13.1%-7 10.3% 11.1% 6.7% 6.7% 12.2% 11.2%-8 7.4% 8.8% 4.9% 6.6% 9.7% 11.2%-9 5.4% 6.5% 3.7% 4.0% 7.4% 8.5%
-10 3.5% 5.6% 2.2% 4.0% 4.8% 7.6%-11 2.3% 3.8% 1.6% 3.6% 3.1% 5.1%-12 1.8% 2.6% 1.8% 2.2% 2.4% 3.5%-13 0.9% 1.6% 1.1% 1.3% 1.3% 2.2%-14 0.5% 1.2% 0.4% 1.2% 0.6% 1.6%-15 0.6% 0.7% 0.4% 0.4% 0.8% 0.9%-16 0.3% 1.2% 0.3% 0.7% 0.4% 1.7%-17 0.1% 0.7% 0.2% 0.4% 0.2% 1.0%-18 0.1% 0.5% 0.1% 0.1% 0.1% 0.7%-19 0.0% 0.3% 0.0% 0.1% 0.0% 0.4%-20 0.1% 0.3% 0.1% 0.2% 0.1% 0.4%-21 0.1% 0.3% 0.0% 0.2% 0.1% 0.4%-22 0.1% 0.2% 0.1% 0.1% 0.1% 0.3%-23 0.0% 0.3% 0.0% 0.4% 0.0% 0.4%-24 0.1% 0.3% 0.1% 0.1% 0.1% 0.4%-25 0.0% 0.2% 0.0% 0.1% 0.0% 0.3%-26 0.1% 0.1% 0.0% 0.1% 0.1% 0.2%-27 0.0% 0.2% 0.0% 0.1% 0.0% 0.3%-28 0.0% 0.1% 0.0% 0.0% 0.0% 0.1%-29 0.1% 1.0% 0.0% 0.7% 0.1% 1.3%
Total 100.0% 100.0% 100.0% 100.0% 100.0% 100.0%

V-26
As noted previously, the value of Mu in the formula for stopping distance is dependent on
inflation levels. For each speed limit category, a set of delta-Vs corresponding to each under-
inflation level was calculated. In each case, an average placard pressure of 30 psi was assumed
for passenger cars. For LTVs, an average pressure of 35 was assumed. The rates of under-
inflation in Table V-10 were used to weight the change in delta-V that results from each
corresponding psi under-inflation level to an overall weighted average change across all levels.
The resulting changes in delta-V are summarized in Table V-11 for each passenger car and LTV
target population category for ABS systems, non-ABS systems and combined systems, based on
weighting factors representing the relative portion of the vehicle fleet that has Anti-lock brakes.
Similar results are summarized for Alternative 2 in Table V-12. Note that these estimates do not
reflect any impact for vehicles with inflation levels that are less than the assumed set point for
the TPMS system. For Alternative 1, this analysis assumes a set point of 20 percent below the
placard pressure, or 6 psi based on the assumption of a 30 psi recommended pressure. Benefits
would only accrue to those tires that are more than 6 psi beneath their recommended pressure.
For LTVs, benefits would accrue for those tires that are more than 7 psi beneath their
recommended pressure. Alternative 2 assumes a set point of 25% below placard for non-anti-
lock brake systems and this results in higher average delta-V changes for these systems under
Alternative 2 than Alternative 1, due to the higher level of potential improvement within this
more limited population of vehicles. However, for vehicles with anti-lock brakes, the systems
would only operate in cases where the highest tire pressure exceeded the lowest tire pressure by
25% or more, and this less rigorous level of notification results in a lower average delta-V
change under Alternative 2 than under Alternative 1.

V-27
Table V-11 Weighted Average Reductions In Delta-V
from Improved Tire Inflation Pressure Alternative 1
Anti-lock Non-Anti-lock Combined Passenger Cars Wet Pavement 0-35mph 2.836 4.399 3.352 36-50mph 4.273 6.806 5.109 51+mph 6.135 10.132 7.454 Dry Pavement 0-35mph 1.424 2.325 1.721 36-50mph 2.953 5.032 3.639 51+mph 4.978 8.707 6.208 LTVs: Anti-lock Non-Anti-lock Combined Wet Pavement 0-35mph 3.156 4.813 3.703 36-50mph 4.745 7.400 5.621 51+mph 6.785 10.877 8.136 Dry Pavement 0-35mph 1.499 2.224 1.738 36-50mph 3.218 5.268 3.895 51+mph 5.043 9.176 6.407

V-28
Table V-12
Weighted Average Reductions In Delta-V from Improved Tire Inflation Pressure
Alternative 2
Anti-lock Non-Anti-lock Combined Passenger Cars: Wet Pavement 0-35mph 2.457 4.681 3.191 36-50mph 3.701 7.242 4.870 51+mph 5.314 10.782 7.118 Dry Pavement 0-35mph 1.225 2.499 1.646 36-50mph 2.551 5.377 3.484 51+mph 4.304 9.289 5.949 LTVs: Anti-lock Non-Anti-lock Combined Wet Pavement 0-35mph 2.711 5.125 3.507 36-50mph 4.076 7.880 5.331 51+mph 5.829 11.581 7.727 Dry Pavement 0-35mph 1.275 2.420 1.653 36-50mph 2.754 5.650 3.710 51+mph 4.322 9.812 6.134

V-29
Calculation of Safety Benefits
Safety benefits were calculated by reducing the delta-V for each injury by the appropriate level
for each specific target population category shown in Tables V-11 and V-12. Functionally, the
injury totals for each delta-V category were redistributed according to the injury probabilities of
the reduced delta-V level. This resulted in a new injury profile. Totals for each injury severity
category were then compared to the original injury totals to produce the net benefits from
reducing delta-Vs. An example of the original target population distribution and the revised
distribution is shown in Tables V-13 and V-14. Note that the revised distribution shown in
Table V-14 represents a whole number delta-V change (in this case, 8 delta-V). Since actual
average reductions were fractional, interpolation was used to calculate the results of the
fractional reductions. These interpolated results are reflected in Table V-15. Table V-15
summarizes the results for all scenarios for passenger cars under Alternative 1.
Adjustments to Non-Preventable Crash Safety Benefits
A number of adjustments must be made to the benefit estimates in Table V-15. These include:
1) Adjustment for crash braking distance distribution
2) Adjustment for portion of vehicle fleet with no under-inflation or under-inflation less
than notification level
3) Adjustment for driver response
4) Adjustment for target population overlap travel speeds would be about 11 percent of
those based on maximum impact for passenger cars, and 10 percent for LTVs.

V-30
Table V-13
Passenger Cars, Original Injury Distribution >=51 MPH Speed Limit, Wet Pavement
Delta-V MAIS0 MAIS 1 MAIS 2 MAIS 3 MAIS 4 MAIS 5 Fatal Total
1 0 0 0 0 0 0 0 02 0 0 0 0 0 0 0 03 0 0 0 0 0 0 0 04 274 58 2 2 0 0 0 3375 68 19 1 1 0 0 0 896 351 131 5 4 0 0 0 4927 900 423 18 12 1 0 1 13568 4065 2360 99 73 7 0 7 66109 3678 2559 129 78 0 6 6 6463
10 1088 902 50 27 2 2 2 207311 3802 3715 221 118 8 8 8 788712 1341 1520 103 48 6 0 6 302813 2947 3864 284 146 7 7 15 727814 539 808 67 32 3 1 3 145315 715 1214 116 51 4 2 6 210816 516 983 108 43 5 2 5 166417 1142 2438 307 117 12 8 12 403718 0 0 0 0 0 0 0 019 138 361 59 22 2 1 3 58720 79 226 43 15 1 1 2 36821 259 806 177 59 7 4 8 132122 157 532 136 44 4 4 6 88523 7 24 7 2 0 0 0 4124 1 2 1 0 0 0 0 425 16 66 26 8 1 1 1 12026 38 158 73 23 2 2 4 30027 29 128 69 22 2 2 4 25628 2 7 4 1 0 0 0 1429 50 227 166 52 6 5 11 51730 0 0 0 0 0 0 0 0
Etc. Total 22209 23586 2391 1064 94 70 146 49591
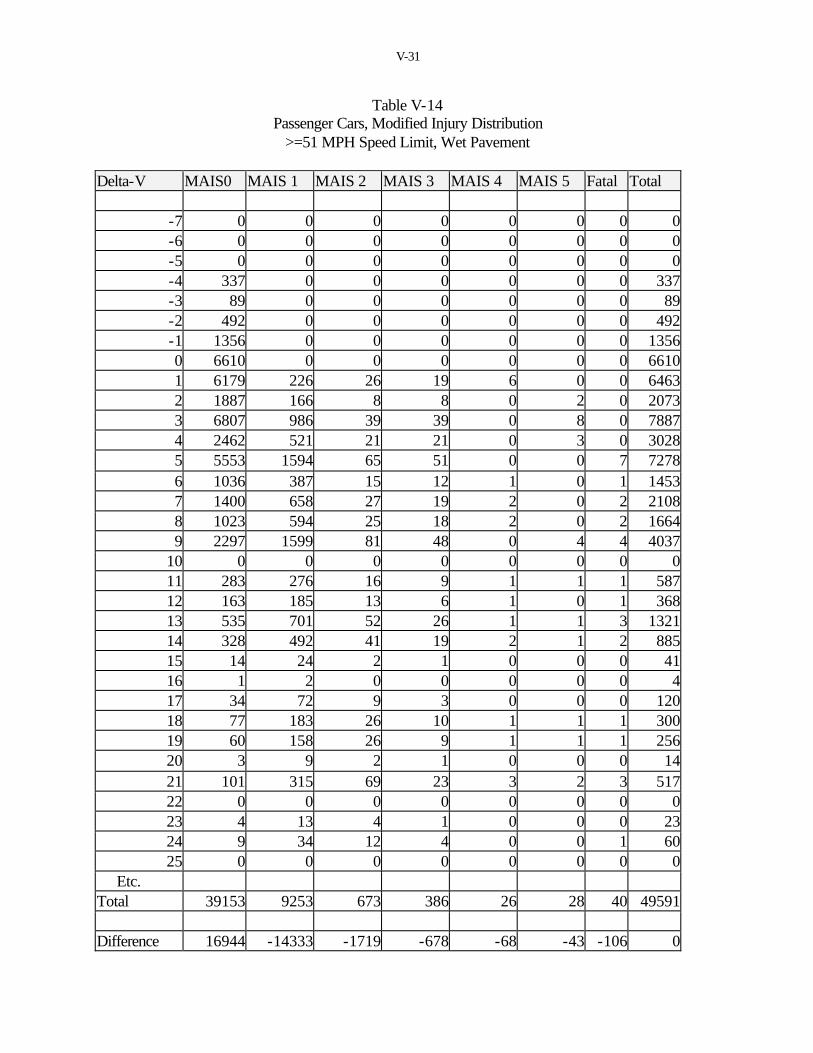
V-31
Table V-14 Passenger Cars, Modified Injury Distribution
>=51 MPH Speed Limit, Wet Pavement Delta-V MAIS0 MAIS 1 MAIS 2 MAIS 3 MAIS 4 MAIS 5 Fatal Total
-7 0 0 0 0 0 0 0 0-6 0 0 0 0 0 0 0 0-5 0 0 0 0 0 0 0 0-4 337 0 0 0 0 0 0 337-3 89 0 0 0 0 0 0 89-2 492 0 0 0 0 0 0 492-1 1356 0 0 0 0 0 0 13560 6610 0 0 0 0 0 0 66101 6179 226 26 19 6 0 0 64632 1887 166 8 8 0 2 0 20733 6807 986 39 39 0 8 0 78874 2462 521 21 21 0 3 0 30285 5553 1594 65 51 0 0 7 72786 1036 387 15 12 1 0 1 14537 1400 658 27 19 2 0 2 21088 1023 594 25 18 2 0 2 16649 2297 1599 81 48 0 4 4 4037
10 0 0 0 0 0 0 0 011 283 276 16 9 1 1 1 58712 163 185 13 6 1 0 1 36813 535 701 52 26 1 1 3 132114 328 492 41 19 2 1 2 88515 14 24 2 1 0 0 0 4116 1 2 0 0 0 0 0 417 34 72 9 3 0 0 0 12018 77 183 26 10 1 1 1 30019 60 158 26 9 1 1 1 25620 3 9 2 1 0 0 0 1421 101 315 69 23 3 2 3 51722 0 0 0 0 0 0 0 023 4 13 4 1 0 0 0 2324 9 34 12 4 0 0 1 6025 0 0 0 0 0 0 0 0
Etc. Total 39153 9253 673 386 26 28 40 49591 Difference 16944 -14333 -1719 -678 -68 -43 -106 0

V-32
Table V-15 Estimated Passenger Car Stopping Distance Impacts
Alternative 1, Unadjusted
MAIS0 MAIS 1 MAIS 2 MAIS 3 MAIS 4 MAIS 5 Fatal WET 0-35mph 24292 -20158 -2825 -1003 -117 -38 -15536-50mph 27196 -21495 -3908 -1352 -105 -92 -19851+mph 15759 -13277 -1644 -636 -61 -39 -102 DRY 0-35mph 28148 -22352 -3984 -1339 -149 -90 -19136-50mph 70450 -57226 -9097 -3062 -382 -148 -51851+mph 35016 -24082 -7303 -2531 -314 -238 -571 Total 200860 -158590 -28761 -9923 -1128 -645 -1734
Braking Distance Distribution
Table V-15 represents safety impacts that would occur from the reduced stopping distance of a
tire at the point where it would stop if pressure were corrected. It represents the maximum
change in delta-V that would occur in cases where the actual braking distance in the crash just
equals the correct stopping distance. In reality, crashes occur over a variety of braking distances,
and the change in delta-V is a direct function of this distance. This relationship is illustrated in
Figure V-1 below. The change in delta-V is virtually non-existent in crashes where braking
distance is minimal, but becomes significant as the distance traveled during braking increases.

V-33
Figure V-1
Generalized Relationship Between Change in Delta-V and Traveling Distance
Del
ta V
Cha
nge
(mile
/hou
r)
Traveling Distance (feet) After Braking
Stopping Distance
Del
ta V
Cha
nge
(mile
/hou
r)
Traveling Distance (feet) After Braking
Stopping Distance

V-34
To account for the variety of possible outcomes, a factor was calculated based on the relationship
between calculated delta-V changes and travel distance. The techniques used to calculate this
factor are fully described in Appendix A. The results indicate that the impacts over the variety of
travel speeds would be about 11 percent of those based on maximum impact for passenger cars
and 10 percent for LTV’s.
Properly Inflated Vehicles
As previously mentioned, 26 percent of all vehicles have no tires under-inflated. In addition,
many vehicles have a level of under-inflation that would not trigger a warning from the TPMS.
The target population used in the above calculations assumes a full fleet of under-inflated
vehicles and must be adjusted for the portion of the fleet that is not under-inflated, and that will
be notified of the problem. The portions differ by Alternative and vehicle type. Based on
NHTSA’s tire pressure survey under Alternative 1, only 36 percent of passenger cars and 40
percent of light trucks would potentially benefit from a TPMS. Under Alternative 2, 27 percent
of passenger cars with anti-lock brakes, 26 percent of passenger cars without anti-lock brakes, 21
percent of light trucks with anti-lock brakes, and 29 percent of LTVs without anti-lock brakes
would potentially benefit from a TPMS.
Driver Response
Table V-15 also represents the benefits that would accrue if all drivers responded immediately to
the TPMS and inflated their tires to the proper level. Since this is unlikely to occur, an
adjustment was made to represent the driver response rate. These rates vary for each alternative.
For direct systems, a response rate of 80 percent is assumed. Eighty percent is chosen to

V-35
represent a level that reflects the heightened consumer awareness that would come with systems
that constantly monitor and display tire pressure levels. A lower response rate of 60 percent is
assumed for indirect systems, which only provide information when the systems reach the set
point. Since Alternative 1 involves only direct systems, the factor for that alternative is 80
percent. Alternative 2 involves both direct systems on vehicles with conventional brakes, and
indirect systems on vehicles with anti-lock brakes. A weighted average of the two systems,
66.6%, was used for Alternative 2.
Overlapping Target Populations
As previously noted separate target populations were derived for passenger cars and light trucks
because the under-inflation profile is different for these vehicle types. These populations were
stratified based on the vehicle braking. However, a comparison of the two separate injury counts
to a single count done for any passenger vehicle indicated that a small amount of double
counting resulted from a simple addition of the two separate braking vehicle populations. Based
on this comparison, an adjustment factor of .9685 was applied to the benefit estimates to
eliminate the overlap.
The above 4 adjustments were accomplished by multiplying the results in Table 15 by factors of
.11, .36, .80, and .9685. Similar adjustments were made for each vehicle type and Alternative.
Table V-16 summarizes the total adjusted non-preventable crash benefits for passenger cars
under Alternative 1. Table V-17 summarizes the benefits from non-preventable crashes under
Alternative 1 for both passenger cars and LTVs. Table V-18 summarizes total benefits for all
crashes and vehicle types under Alternative 1. Table V-19 summarizes total safety benefits for

V-36
all crashes and vehicle types under Alternative 2. The results indicate a potential safety impact
under Alternative 1 of 158 fatalities eliminated and roughly 21,000 nonfatal injuries prevented or
reduced in severity from improved stopping distance. Under Alternative 2, an estimated 97
fatalities and 13,000 nonfatal injuries would be prevented or reduced in severity. Alternative 1
thus offers benefits that are potentially 60% higher than Alternative 2.
These estimates represent the upper bound of results based on the variety of test results currently
available. As previously mentioned, other test data from NHTSA’s VRTC indicate that stopping
distance impacts may be insignificant. A lower range estimate of no impact is implied by the
VRTC test results. Neither of these estimates can be considered to be a likely result because
both are derived from test data that may be inadequate to represent real world crash situations.
In Chapter III, the results from both Goodyear and VRTC tests are discussed. In tests conducted
by Goodyear, significant increases were found in the stopping distance of tires that were under-
inflated. By contrast, tests conducted by NHTSA at their VRTC testing ground found only
minor differences in stopping distance, and in some cases these distances actually decreased with
lower inflation pressure. The NHTSA tests also found only minor differences between wet and
dry surface stopping distance. It is likely that some of these differences are due to test track
surface characteristics. Moreover, the wet surface tests were conducted on a surface that was
only sprayed with water. Given the unworn condition of the track, these tests may not have
properly represented the slick conditions that result when road surfaces become wet. The
Goodyear tests may also be biased. Their basic wet surface tests were conducted on surfaces
with .05” of standing water. This is more than would typically be encountered under normal wet
road driving conditions and may thus exaggerate the stopping distances experienced under most
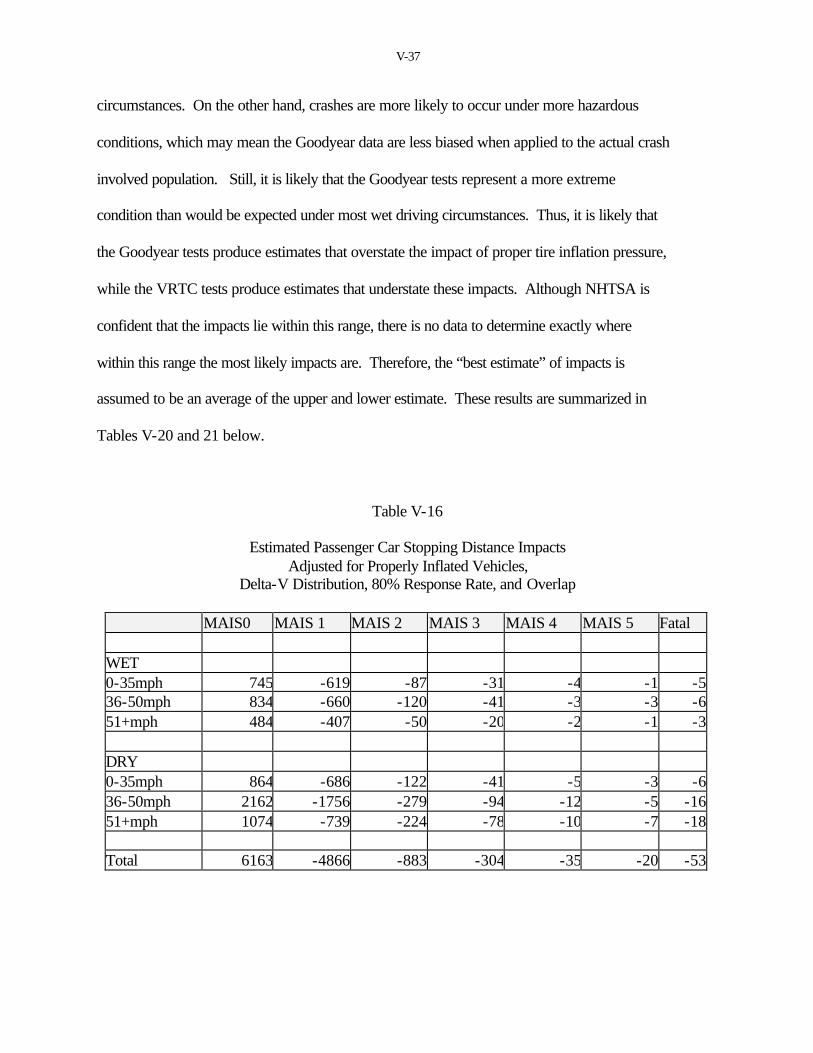
V-37
circumstances. On the other hand, crashes are more likely to occur under more hazardous
conditions, which may mean the Goodyear data are less biased when applied to the actual crash
involved population. Still, it is likely that the Goodyear tests represent a more extreme
condition than would be expected under most wet driving circumstances. Thus, it is likely that
the Goodyear tests produce estimates that overstate the impact of proper tire inflation pressure,
while the VRTC tests produce estimates that understate these impacts. Although NHTSA is
confident that the impacts lie within this range, there is no data to determine exactly where
within this range the most likely impacts are. Therefore, the “best estimate” of impacts is
assumed to be an average of the upper and lower estimate. These results are summarized in
Tables V-20 and 21 below.
Table V-16
Estimated Passenger Car Stopping Distance Impacts Adjusted for Properly Inflated Vehicles,
Delta-V Distribution, 80% Response Rate, and Overlap
MAIS0 MAIS 1 MAIS 2 MAIS 3 MAIS 4 MAIS 5 Fatal WET 0-35mph 745 -619 -87 -31 -4 -1 -536-50mph 834 -660 -120 -41 -3 -3 -651+mph 484 -407 -50 -20 -2 -1 -3 DRY 0-35mph 864 -686 -122 -41 -5 -3 -636-50mph 2162 -1756 -279 -94 -12 -5 -1651+mph 1074 -739 -224 -78 -10 -7 -18 Total 6163 -4866 -883 -304 -35 -20 -53

V-38
Table V-17 Estimated Non-Preventable Crash Stopping Distance Impacts, All Passenger Vehicles Adjusted for Properly Inflated Vehicles,
Delta-V Distribution, 80% Response Rate, and Overlap Alternative 1
MAIS0 MAIS 1 MAIS 2 MAIS 3 MAIS 4 MAIS 5 Fatal WET 0-35mph 997 -818 -123 -43 -5 -2 -636-50mph 1531 -1243 -196 -71 -5 -5 -1051+mph 572 -469 -68 -25 -3 -2 -5 DRY 0-35mph 2610 -2110 -339 -121 -13 -7 -2036-50mph 3123 -2484 -437 -148 -17 -9 -2651+mph 1281 -869 -273 -95 -13 -9 -22 Total 10113 -7992 -1435 -504 -56 -34 -89
Table V-18
Total Estimated Stopping Distance Impacts, All Passenger Vehicles Adjusted for Properly Inflated Vehicles,
Delta-V Distribution, 80% Response Rate, and Overlap Alternative 1 MAIS0 MAIS 1 MAIS 2 MAIS 3 MAIS 4 MAIS 5 Fatal WET 0-35mph 2083 -1842 -216 -86 -9 -4 -1136-50mph 2413 -2343 -301 -118 -8 -8 -1551+mph 875 -802 -107 -42 -4 -3 -9 DRY 0-35mph 5541 -4893 -620 -244 -25 -14 -3636-50mph 6169 -5648 -760 -288 -30 -17 -4851+mph 2300 -2109 -503 -184 -22 -17 -39 Total 19381 -17637 -2507 -963 -99 -63 -158

V-39
Table V-19 Total Estimated Stopping Distance Impacts,
All Passenger Vehicles Adjusted for Properly Inflated Vehicles, Delta-V Distribution, 67% Response Rate, and Overlap
Alternative 2
MAIS0 MAIS 1 MAIS 2 MAIS 3 MAIS 4 MAIS 5 Fatal WET 0-35mph 1346 -1182 -138 -55 -6 -3 -736-50mph 1446 -1409 -186 -72 -5 -5 -1051+mph 569 -521 -68 -27 -3 -2 -5 DRY 0-35mph 3288 -2905 -364 -144 -14 -8 -2136-50mph 3906 -3575 -471 -179 -19 -10 -2951+mph 1460 -1336 -322 -117 -14 -11 -25 Total 12014 -10929 -1548 -594 -61 -38 -97
Table V-20
Mid-Point Estimate Total Stopping Distance Impacts, All Passenger Vehicles Adjusted for Properly Inflated Vehicles,
Delta-V Distribution, 80% Response Rate, and Overlap Alternative 1 MAIS0 MAIS 1 MAIS 2 MAIS 3 MAIS 4 MAIS 5 Fatal WET 0-35mph 1041 -921 -108 -43 -4 -2 -636-50mph 1206 -1172 -150 -59 -4 -4 -851+mph 438 -401 -53 -21 -2 -2 -4 DRY 0-35mph 2771 -2446 -310 -122 -12 -7 -1836-50mph 3085 -2824 -380 -144 -15 -8 -2451+mph 1150 -1055 -251 -92 -11 -8 -19 Total 9690 -8818 -1253 -481 -49 -31 -79

V-40
Table V-21
Mid-Point Estimate Total Stopping Distance Impacts, All Passenger Vehicles Adjusted for Properly Inflated Vehicles,
Delta-V Distribution, 67% Response Rate, and Overlap Alternative 2 MAIS0 MAIS 1 MAIS 2 MAIS 3 MAIS 4 MAIS 5 Fatal WET 0-35mph 673 -591 -69 -27 -3 -1 -436-50mph 723 -705 -93 -36 -3 -2 -551+mph 284 -261 -34 -13 -1 -1 -3 DRY 0-35mph 1644 -1453 -182 -72 -7 -4 -1036-50mph 1953 -1788 -236 -89 -10 -5 -1551+mph 730 -668 -161 -59 -7 -5 -12 Total 6007 -5464 -774 -297 -31 -19 -49
Fuel Economy Benefits
Correct tire pressure will improve a vehicles’ fuel economy. Current radial tires are a vast
improvement over the old-fashioned bias-ply tires, yet they still use more fuel when they are run
under-inflated, although not as much as bias-ply tires. According to a 1978 report1, fuel
efficiency is reduced by one percent (1%) for every 3.3 pounds per square inch (psi). More
recent data provided by Goodyear indicates that fuel efficiency is reduced by one percent for
every 2.96 psi, fairly close to the 1978 estimate.
For this analysis, we assumed that there was no effect of tire over-inflation, and that savings only
started once the warning went on. In other words, if the placard pressure were 30 psi, and a
warning were given under Alternative 1 at 24 psi (20 percent below placard), no benefits are
1 Evaluation of Techniques for Reducing In-use Automotive Fuel Consumption; The Aerospace Corporation, June 1978. Original reference from Goodyear, pp 3-45.

V-41
assumed for those vehicles that have tires with lowest pressure above 24 psi. For Alternative 1
and 2, data from the tire pressure survey was used to estimate the average under-inflation of all 4
tires for those vehicles for which a warning would be given. Table V-22 provides the average
under-inflation and the percentage of the fleet that would get a warning by the TPMS by
alternative.
Table V-22
Analysis of Fleet Tire Pressure Survey
Passenger Cars
Average psi below placard of those vehicles warned
Percent of Fleet
Affected
Light Trucks
Average psi below placard of those vehicles warned
Percent of Fleet
Affected
Alternative 1 6.1 psi 36% 7.7 psi 40%
Alternative 2 Direct Measurement System
6.8 psi
26%
8.7 psi
29%
Alternative 2
Indirect Measurement -
ABS-based System
4.9 psi
27%
6.1 psi
21%
Tables V-23 and V-24 show the weighted vehicle miles traveled by age of vehicle for passenger
cars and light trucks. They also show the 7 percent discount rate and the assumed price of
gasoline. The projected price of gasoline was taken from a DOE projection from January 20012.
It excludes fuel taxes, at $0.38 per gallon, since these are a transfer payment and not a cost to
society. Year 1 for these gasoline prices is estimated to be 2004, when the TPMS requirements
2 DOE Energy Information Administration, Annual Energy Outlook 2001, Table A3, Energy Prices by Sector.

V-42
will be in place. Obviously, these gasoline prices are much lower than the current prices at the
pump ($1.70 in May 2001, or $1.32 excluding taxes). However, the projections are for gasoline
prices to steadily decline from 2001 through about 2005 when they will level off.
Table V-23
Passenger Cars Vehicle Miles Traveled, Discount Factor, and Assumed Price of Gasoline in (2001 Dollars)
Passenger Cars
Vehicle Age (years)
Vehicle Miles
Traveled
Survival Probability
Weighted Vehicle Miles
Traveled
Gasoline
Price, Excluding
Taxes
7 Percent Mid-Year Discount Factor
1 13,533 0.995 13,465.3 0.96 0.9667 2 12,989 0.988 12,833.1 0.95 0.9035 3 12,466 0.978 12,191.7 0.96 0.8444 4 11,964 0.962 11,509.4 0.97 0.7891 5 11,482 0.938 10,770.1 0.98 0.7375 6 11,020 0.908 10,006.2 0.98 0.6893 7 10,577 0.87 9,202.0 0.99 0.6442 8 10,151 0.825 8,374.6 0.98 0.602 9 9,742 0.775 7,550.1 0.98 0.5626
10 9,350 0.721 6,741.4 0.97 0.5258 11 8,974 0.644 5,779.3 0.97 0.4914 12 8,613 0.541 4,659.6 0.97 0.4593 13 8,266 0.445 3,678.4 0.96 0.4292 14 7,933 0.358 2,840.0 0.96 0.4012 15 7,614 0.285 2,170.0 0.96 0.3749 16 7,308 0.223 1,629.7 0.96 0.3504 17 7,014 0.174 1,220.4 0.96 0.3275 18 6,731 0.134 902.0 0.96 0.326 19 6,460 0.103 665.4 0.95 0.286 20 6,200 0.079 489.8 0.95 0.2673
126,678

V-43
Table V-24 Light Trucks Vehicle Miles Traveled, Discount Factor, and
Assumed Price of Gasoline in (2001 Dollars) Light Trucks Vehicle Age (years)
Vehicle Miles Traveled
Survival Probability
Weighted Vehicle Miles Traveled
Gasoline Price, Excluding Taxes
7 Percent Mid-Year Discount Factor
1 12,885 0.998 12,859 0.96 0.9667 2 12,469 0.995 12,407 0.95 0.9035 3 12,067 0.989 11,934 0.96 0.8444 4 11,678 0.980 11,444 0.97 0.7891 5 11,302 0.967 10,929 0.98 0.7375 6 10,938 0.949 10,380 0.98 0.6893 7 10,585 0.924 9,781 0.99 0.6442 8 10,244 0.894 9,158 0.98 0.602 9 9,914 0.857 8,496 0.98 0.5626
10 9,594 0.816 7,829 0.97 0.5258 11 9,285 0.795 7,382 0.97 0.4914 12 8,985 0.734 6,595 0.97 0.4593 13 8,696 0.669 5,818 0.96 0.4292 14 8,415 0.604 5,083 0.96 0.4012 15 8,144 0.539 4,390 0.96 0.3749 16 7,882 0.476 3,752 0.96 0.3504 17 7,628 0.418 3,189 0.96 0.3275 18 7,382 0.364 2,687 0.96 0.326 19 7,144 0.315 2,250 0.95 0.286 20 6,913 0.217 1,500 0.95 0.2673 21 6,691 0.232 1,552 0.95 0.2498 22 6,475 0.196 1,269 0.95 0.2335 23 6,266 0.169 1,059 0.95 0.2182 24 6,064 0.143 867 0.95 0.2039 25 5,869 0.121 710 0.94 0.1906
153,319
V-44
The baseline miles-per-gallon figure for cars was 27.5 mpg at perfect inflation, and for light
trucks was 20.7 mpg at perfect inflation. A sample calculation for passenger cars for Alternative
1 is:
The average of all four tires on a passenger car that would be warned based on our survey would
be 6.1 psi lower than placard. Since 1 percent fuel efficiency is equivalent to 2.96 psi lower, the
average passenger car with a warning would get 2.060811 percent higher fuel economy. With a
baseline of 27.5 mpg, the average fuel economy of those vehicles warned that increased their tire
pressure up to placard would be 27.5 * 1.02060811 = 28.0667 mpg. Based on our estimated
vehicle miles traveled by age, scrappage by age, a 7 percent present value discount rate and
estimated fuel costs per year, the baseline passenger car (at 27.5 mpg discounted by 15 percent to
account for real on-road mileage) would spend $3,631.32 present value for fuel over its lifetime.
Those drivers warned who filled up to placard pressure and achieved 28.0667 mpg (discounted
by 15 percent to account for real on-road mileage) would spend $3,558.00 for fuel over their
lifetime. The difference is $73.32. Since 36 percent of the fleet get a warning, and it is assumed
that 80 percent of the drivers would fill their tires to placard, the average benefit is $21.12
($73.32*0.36*0.80). The estimated benefit for each subgroup under the different alternatives is
shown in Table V-25.
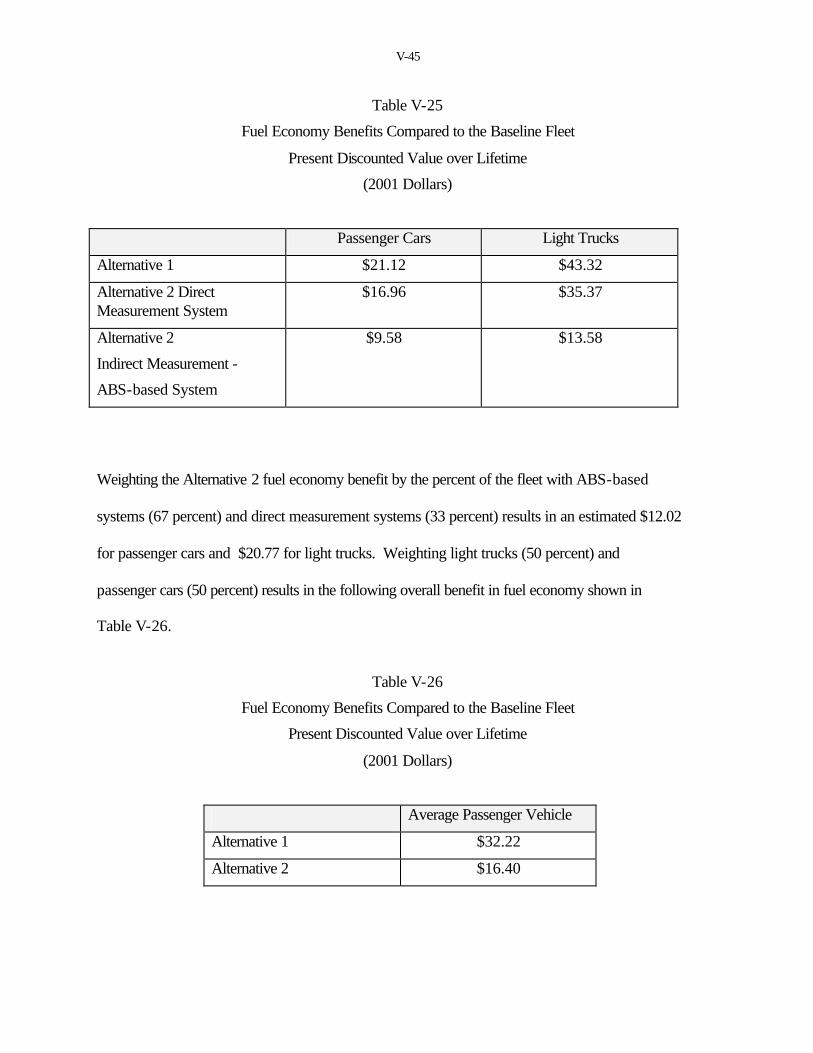
V-45
Table V-25
Fuel Economy Benefits Compared to the Baseline Fleet
Present Discounted Value over Lifetime
(2001 Dollars)
Passenger Cars Light Trucks
Alternative 1 $21.12 $43.32
Alternative 2 Direct Measurement System
$16.96 $35.37
Alternative 2
Indirect Measurement -
ABS-based System
$9.58 $13.58
Weighting the Alternative 2 fuel economy benefit by the percent of the fleet with ABS-based
systems (67 percent) and direct measurement systems (33 percent) results in an estimated $12.02
for passenger cars and $20.77 for light trucks. Weighting light trucks (50 percent) and
passenger cars (50 percent) results in the following overall benefit in fuel economy shown in
Table V-26.
Table V-26
Fuel Economy Benefits Compared to the Baseline Fleet
Present Discounted Value over Lifetime
(2001 Dollars)
Average Passenger Vehicle
Alternative 1 $32.22
Alternative 2 $16.40

V-46
Tread Life
Driving at lower inflation pressure impacts the rate of tread wear on tires. This will cause tires to
wear out earlier than necessary and decrease tire life. When a tire is under-inflated, it puts more
pressure on the shoulders of the tire and does not wear correctly. This analysis will attempt to
quantify the impact of increased tread wear on consumer costs.
Based on data provided by Goodyear (see Docket No. NHTSA-2000-8572-26), the average tread
life of tires is 45,000 miles and the average costs is $61 per tire (in 2001 dollars).
For Alternative 1
Assuming a direct measurement system, the TPMS warns the driver anytime a tire is 20 percent
or more below the placard and the driver inflates all of the tires back to the placard levels, then
we can estimate the impact on tread life using the following calculations.
Goodyear provided data estimating that the average tread wear dropped to 68 percent of the
original tread wear if tire pressure dropped from 35 psi to 17 psi. Goodyear also assumed that
this relationship was linear. Thus, for every 1 psi drop in inflation pressure, tread wear would
decrease by 1.78 percent [(100-68%)/(35-17psi)]. These effects would take place over the
lifetime of the tire. In other words, if the tire remained under-inflated by 1 psi over its lifetime,
the tread wear would decrease by 1.78 percent or about 800 miles (45,000*0.178).
Data from our tire pressure survey indicated that 2,136 out of 5,967 passenger car tires (36
percent) had at least one tire under-inflated by 20 percent or more below the placard level. The
average under-inflation of the 4 tires for these vehicles was 6.1 psi. Thus, on average, passenger
V-47
cars lose an estimated 4,880 miles (6.1 * 800 miles) of tread life for each tire due to the way they
are currently under-inflated that could be remedied under Alternative 1 if everyone filled all their
tires back up to the placard pressure when they were notified by a TPMS. If we assume that 80
percent of the people actually inflate their tires properly, then on average about 3,900 miles of
tread life would be saved per tire.
If the average current lifetime of tires is 45,000 miles at current inflation levels, the average
lifetime could be 48,900 miles with a TPMS. The agency estimates that the average lifetime per
passenger car is 126,678 miles. Thus, currently the average car would have 3 sets of tires on
their car over its lifetime (new, at 45,000 miles, and at 90,000 miles) and with TPMS the average
car would have 3 sets of tires purchased (new, at 48,900 miles, and at 97,800 miles). The benefit
to consumers is the delay in purchasing those tires and getting interest on that money at an
assumed 7 percent rate of return. Using a mid-year 7 percent discount rate, the discounted
present value of these delayed tire purchases is estimated to be $14.62 for those passenger cars
that would be notified by a TPMS that they are under-inflated. Since 36 percent would be
notified, the present discounted benefits are $5.26 ($14.62 * 0.36) and 1,404 miles (3,900 * 0.36)
of tread life.
For light trucks, data from our tire pressure survey indicated that 1,564 of 3,950 light truck tires
(40 percent) had at least one tire under-inflated by 20 percent or more compared to the placard.
The average under-inflation of the 4 tires for these vehicles was 7.7 psi. Thus, on average, light
trucks lose an estimated 6,160 miles (7.7*800) of tread life for each tire due to the way they are
currently under-inflated that could be remedied if everyone filled all their tires back up to the

V-48
placard pressure when they were notified by a TPMS. If we assume that 80 percent of the people
actually inflate their tires properly, then on average 4,930 miles of tread life would be saved per
tire.
If the average current lifetime of tires is 45,000 miles at current inflation levels, the average
lifetime could be 49,930 miles with a TPMS. The agency estimates that the average lifetime per
light truck is 153,706 miles. Thus, the average light truck would have 4 sets of tires on their
truck over its lifetime (new, at 45,000 miles, at 90,000 miles, and at 135,000 miles) and with a
TPMS the average light truck would have four sets purchased (new, at 49,930 miles, at 99,860,
and at 149,790 miles). Using the same methodology as for passenger car tires, the benefit in
delaying purchasing tires is estimated to be a present discounted benefit of $42.00. Since in 40
percent of the vehicles at least one tire is under-inflated by 20 percent or more, the average
benefit for light trucks is estimated to be $16.80 ($42.00 * 0.40) and 1,972 miles (4,930 * 0.40)
of tread life.
For Alternative 2
We have to consider both ABS-based vehicles and non-ABS-based vehicles since they are
represented by a different group of vehicles in the tire pressure survey. For Alternative 2, we
assume that two-thirds (67%) of the vehicles would have ABS-based indirect measurement
systems and one-third of the vehicles (33%) would have a direct measurement system. For the
ABS-based vehicles we assume the TPMS warns the driver anytime there is a 25 percent or more
psi differential between tires. For the non-ABS-based vehicles, we assume a direct measurement
system will provide a driver warning anytime one or more tires is 25 percent or more below

V-49
placard. If we assume the driver inflates all of the tires back to the placard levels, then we can
estimate the impact on tread life using the following calculations.
For direct measurement systems
Data from our tire pressure survey indicated that 1,575 out of 5,967 passenger car tires (26
percent) had at least one tire under-inflated by 25 percent or more below the placard level. The
average under-inflation of the 4 tires for these vehicles was 6.8 psi. Thus, on average, passenger
cars lose an estimated 5,440 miles (6.8 * 800 miles) of tread life for each tire due to the way they
are currently under-inflated that could be remedied if everyone filled all their tires back up to the
placard pressure when they were notified by a TPMS. If we assume that 80 percent of the people
actually inflate their tires properly, then on average 4,350 miles of tread life would be saved per
tire.
If the average current lifetime of tires is 45,000 miles at current inflation levels, the average
lifetime could be 49,350 miles with a TPMS. The agency estimates that the average lifetime per
passenger car is 126,678 miles. Thus, currently the average car would have 3 sets of tires on
their car over its lifetime (new, at 45,000 miles, and at 90,000 miles) and with TPMS the average
car would have 3 sets of tires purchased (new, at 49,350 miles, and at 98,700 miles). The benefit
to consumers is the delay in purchasing those tires and getting interest on that money at an
assumed 7 percent rate of return. Using a mid-year 7 percent discount rate, the discounted
present value of these delayed tire purchases is estimated to be $16.30 for those passenger cars
that would be notified by a TPMS that they are under-inflated. Since 26 percent would be

V-50
notified, the present discounted benefits are $4.24 ($16.30 * .26) and 1,131 miles (4,350 * 0.26)
of tread life.
For light trucks, data from our tire pressure survey indicated that 1,148 of 3,950 light truck tires
(29 percent) had at least one tire under-inflated by 25 percent or more compared to the placard.
The average under-inflation of the 4 tires for these vehicles was 8.7 psi. Thus, on average, light
trucks lose an estimated 6,960 miles (8.7*800) of tread life for each tire due to the way they are
currently under-inflated that could be remedied if everyone filled all their tires back up to the
placard pressure when they were notified by a TPMS. If we assume that 80 percent of the people
actually inflate their tires properly, then on average 5,570 miles of tread life would be saved per
tire.
If the average current lifetime of tires is 45,000 miles at current inflation levels, the average
lifetime could be 50,570 miles with a TPMS. The agency estimates that the average lifetime per
light truck is 153,706 miles. Thus, the average light truck would have 4 sets of tires on their
truck over its lifetime (new, at 45,000 miles, at 90,000 miles, and at 135,000 miles) and with a
TPMS the average light truck would have four sets purchased (new, at 50,570 miles, at 101,140,
and at 150,710 miles). Using the same methodology as for passenger car tires, the benefit in
delaying purchasing tires is estimated to be a present discounted benefit of $47.71. Since in 29
percent of the vehicles at least one tire is under-inflated by 25 percent or more, the average
benefit for light trucks is estimated to be $13.84 ($47.71 * 0.29) and 1,615 miles (5,570 * 0.29)
of tread life.
V-51
For ABS-based systems
Data from our tire pressure survey indicated that 1,622 out of 5,967 passenger car tires (27
percent) had a 25 percent or more tire pressure differential. The average under-inflation of the 4
tires for these vehicles was 4.9 psi. Thus, on average, passenger cars lose an estimated 3,920
miles (4.9 * 800 miles) of tread life for each tire due to the way they are currently under-inflated
that could be remedied if everyone filled all their tires back up to the placard pressure when they
were notified by a TPMS. If we assume that 60 percent of the people actually inflate their tires
properly, then on average 2,350 miles of tread life would be saved per tire.
If the average current lifetime of tires is 45,000 miles at current inflation levels, the average
lifetime could be 47,350 miles with a TPMS. The agency estimates that the average lifetime per
passenger car is 126,678 miles. Thus, currently the average car would have 3 sets of tires on
their car over its lifetime (new, at 45,000 miles, and at 90,000 miles) and with TPMS the average
car would have 3 sets of tires purchased (new, at 47,350 miles, and at 94,700 miles). The benefit
to consumers is the delay in purchasing those tires and getting interest on that money at an
assumed 7 percent rate of return. Using a mid-year 7 percent discount rate, the discounted
present value of these delayed tire purchases is estimated to be $8.84 for those passenger cars
that would be notified by a TPMS that they are under-inflated. Since 27 percent would be
notified, the present discounted benefits are $2.39 ($8.84 * 0.27) and 635 miles (2,350 * 0.27) of
tread life.
For light trucks, data from our tire pressure survey indicated that 831 of 3,950 light truck tires
(21 percent) had a 25 percent or more tire pressure differential. The average under-inflation of
V-52
the 4 tires for these vehicles was 6.1 psi. Thus, on average, light trucks lose an estimated 4,880
miles (6.1*800) of tread life for each tire due to the way they are currently under-inflated that
could be remedied if everyone filled all their tires back up to the placard pressure when they
were notified by a TPMS. If we assume that 60 percent of the people actually inflate their tires
properly (some of them might only fill some tires and not all of their tires), then on average
2,930 miles of tread life would be saved per tire.
If the average current lifetime of tires is 45,000 miles at current inflation levels, the average
lifetime could be 47,930 miles with a TPMS. The agency estimates that the average lifetime per
light truck is 153,706 miles. Thus, the average light truck would have 4 sets of tires on their
truck over its lifetime (new, at 45,000 miles, at 90,000 miles, and at 135,000 miles) and with a
TPMS the average light truck would have four sets purchased (new, at 47,930 miles, at 95,860,
and at 143,790 miles). Using the same methodology as for passenger car tires, the benefit in
delaying purchasing tires is estimated to be a present discounted benefit of $24.63. Since in 21
percent of the vehicles there is a tire pressure differential of 25 percent or more, the average
benefit for light trucks is estimated to be $5.17 ($24.63 * 0.21) and 615 miles (2,930 * 0.21) of
tread life.
In summary, assuming that half of the vehicle sales in the future are passenger cars and half of
the sales are light trucks, the average present discounted value benefit for tread wear savings for
Alternative 1 is $11.03 ([$5.26 + $16.80]/2) and 1,688 miles ([1,404 + 1,972]/2) of tread life.
For Alternative 2, the average benefit for tread wear savings for direct measurement systems is
$9.04 ([$4.24 + $13.84]/2) and 1,373 miles ([1,131 + 1,615]/2) of tread life. The average benefit

V-53
for tread wear savings for the ABS-based indirect measurement system is $3.78 ([$2.39 +
$5.17]/2) and 625 miles ([635 + 615]/2) of tread life. Assuming that 33 percent of the fleet uses
the direct measurement system and 67 percent of the fleet has ABS, the average present
discounted value benefit for tread wear for Alternative 2 is $5.51 ($9.04*0.33 + $3.78*.67) and
872 miles (1,373*.33 + 625*.67) of tread life.
There are other potential unquantified benefits of increasing tread wear. Some people would not
have to purchase the last set of tires for a vehicle if they were going to scrap the vehicle soon, or
if it were totaled in a crash shortly before they were going to purchase new tires. So, there will
be cases where the total purchase price of tires $244 ($61 per tire * 4) will be saved. However,
we can’t estimate the frequency of that occurrence.
Unquantifiable Benefits Under-inflation affects many different types of crashes. These include crashes which result
from:
1. an increase in stopping distance, 2. flat tires and blowouts 3. skidding and/or a loss of control of the vehicle in a curve, like an off-ramp maneuver
coming off of a highway at high speed, or simply taking a curve at high speed 4. skidding and/or loss of control of the vehicle in a lane change maneuver, 5. hydroplaning on a wet surface, which can affect both stopping distance and skidding
and/or loss of control. 6. overloading the vehicle
The agency can quantify the effects of under-inflation in a crash involving the reduction in
stopping distance. However, it cannot quantify the effects of under-inflation in the five other
types of crashes. The primary reason that the agency can’t quantify these benefits is the lack of

V-54
crash data indicating tire pressure and how large of a problem these conditions represent by
themselves, or how often they are contributing factors to a crash. The agency does not collect
tire pressure in its crash data investigations.
There are many factors that influence crashes of these types. For blowouts, there is speed, tire
pressure, and the load on the vehicle. Blowouts to the front tire can cause roadway departure, or
can cause a lane change resulting in a head-on crash. Blowouts in a rear tire can cause spinning
out and loss of control. As discussed in the target population section, a target population can be
estimated for tire problems, but the agency doesn’t know the tire pressure and doesn’t know
whether these blowouts occur before the crash or during the crash.
For loss of control crashes, speed is the most critical factor. Excessive speed alone can cause a
loss of control in a curve or in a lane change maneuver. Tread depth, inflation pressure of the
tires, and road surface condition are the most notable of a long list of factors including vehicle
steering characteristics and tire cornering capabilities that affect the vehicle/tire interface with
the road. So, when under-inflation is a contributing factor to a crash, it is hard to know whether
correcting this one problem area could result in the collision being avoided or reduced in
severity. Certainly, reducing under-inflation is an important area and a move in the right
direction. The following discussions describe how inflation pressure affects these crash types to
the extent known.

V-55
Skidding and/or loss of control in a curve
Low tire pressure, as a result of under-inflation, generates lower cornering stiffness because of
reduced tire stiffness. When the tire pressure is low, the vehicle wants to go straight and requires
a greater steering angle to generate the same cornering force in a curve. The maximum speed at
which an off-ramp can be driven while staying in the lane is reduced by a few mph as tire
inflation pressure is decreased. An example provided by Goodyear shows that when all four tires
are at 30 psi the maximum speed on the ramp was 38 mph, at 27 psi the maximum speed was 37
mph, and at 20 psi the maximum speed was 35 mph while staying in the lane. Having only one
front tire under-inflated by the same amount resulted in about the same impact on maximum
speed. But, the influence of having only one rear tire under-inflated by the same amount was
only about one-half of the impact on maximum speed (a 1.5 mph difference from 30 psi to 20
psi).
The agency also has run a series of tests to examine the issue of decreases in tire pressure on
vehicle handling. A 2001 Toyota 4-Runner was run through 50 mph constant speed/decreasing
radius circles to see the effects of inflation pressure on lateral road holding. Figure V-2 shows
the results of lefthand turns plotted from 0 to 90 degrees handwheel angle for tire inflation
pressures varied from 15 to 35 psi. The data indicate to us that in on-ramps/off ramps, tire
inflation pressure is a critical factor in vehicle handling. The graph shows how much friction the
vehicle can utilize, in terms of lateral acceleration (g’s), before it slides off the road. The more
lateral g’s the vehicle can utilize, the better it stays on the road. So, if you are going around an
off-ramp and need to turn the wheel 50 degrees at 50 mph, you can utilize 0.27 g’s at 15 psi, or
you can utilize 0.35 g’s at 30 psi.

V-56
Skidding and/or loss of control in a lane change maneuver
In a quick lane change maneuver, under-inflated tires result in a loss of stiffness, causing poor
handling. Depending upon whether the low tire(s) are on the front or rear axle impacts the
vehicle’s sensitivity to steering inputs, directional stability, and could result in a spin out and/or
loss of control of the vehicle.
Skidding and/or loss of control from hydroplaning
The conditions that influence hydroplaning include speed, tire design, tread depth, water depth
on the road, load on the tires, and inflation pressure. At low speeds (less than about 50 mph), if
your tires are under-inflated, you actually have more tire touching the road. However,
hydroplaning does not occur very often at speeds below 50 mph, unless there is deep water
(usually standing water) on the road. As you get to about 55 mph and the water pressure going
under the tire increases, an under-inflated tire has less pressure in it pushing down on the road
and you have less tire-to-road contact than a properly inflated tire as the center portion of the
tread gets lifted out of contact with the road. As speed increases to 70 mph and above and water
depth increases due to a severe local storm with poor drainage, the under-inflated tire could lose
40 percent of the tire-to-road contact area compared to a properly inflated tire. The higher the
speed (above 50 mph) and the more under-inflated the tire is, then the lower the tire-to-road
contact and the higher is the chance of hydroplaning.
Tread depth has a substantial impact on the probability of hydroplaning. If you make a
simplifying assumption that the water depth exceeds the capability of the tread design to remove
water (which most likely would occur with very worn tires), then an approximation of the speed
at which hydroplaning can occur can be estimated by the following formula:

V-57
Figure V-2

V-58
Hydroplaning speed = 10.35 x inflation pressure3
Under this assumption of water depth exceeding the capability of the tread design to remove
water:
At 30 psi, hydroplaning could occur at 56.7 mph
At 25 psi, hydroplaning could occur at 51.8 mph
At 20 psi, hydroplaning could occur at 46.3 mph.
This is presented to show the relative effect of inflation pressure on the possibility of
hydroplaning.
Overloading the vehicle
When a vehicle is overloaded, (too much weight is added for the suspension, axle, and tire
systems to carry) and the tires are under-inflated, there is an increased risk of tire failures. This
can result in a loss of control of the vehicle.
Non-quantified benefits
Property Damage and Travel Delay
TPMS will impact safety by reducing both the incidence and severity of crashes. When crashes
are prevented, the property damage and travel delay that would have occurred are prevented as
well. In a 1996 report4, NHTSA estimated that property damage costs averaged over $3000 per
crash and travel delay averaged $260 per crash ($1994). These savings would accrue to crashes
3 “Mechanics of Pneumatic Tires” edited by Samuel K. Clark of the University of Michigan, published by NHTSA, printed by the Government Printing Office in 1981. 4 “The Economic Cost of Motor Vehicle Crashes”, 1994, DOT HS 808 425, NHTSA, July 1996.

VI-1
VI. COSTS and LEAD TIMES Systems Costs
These preliminary estimates are NHTSA-derived estimates mainly based on confidential
discussions with a variety of suppliers and manufacturers about how their systems work
and the various components in their systems. In addition, NHTSA has the preliminary
results of a tear-down study of costs by a contractor of two direct measurement systems.
All costs provided here are consumer costs. Variable cost estimates received from
suppliers were multiplied times 1.51 to mark them up to consumer cost levels. These
cost estimates assume high production volumes, since these systems will be required to
go on 16 million vehicles. For this analysis, we estimate there will be sales volumes of
16 million light vehicles per year, 8 million passenger cars and 8 million light trucks.
Indirect measurement systems:
There are different ways of using indirect measurement systems for a Tire Pressure
Monitoring Systems (TPMS). The first assumes that the vehicle has an existing ABS
system and that manufacturers will add the capability to monitor the wheel speed sensors,
make changes to the algorithms, add the ability to display the information and a reset
button. The incremental cost of adding these features to an existing ABS vehicle is
estimated to be approximately $12 per vehicle. Currently about two-thirds of all new
light trucks and passenger cars have ABS systems. NHTSA tested four current ABS-
indirect measurement systems and none of the four met the proposed requirements to
provide a driver warning at 25 percent below placard and to detect “one, two, or three

VI-2
tires” being low. They had problems detecting two tires low on the same axle or when
two tires on the same side of the vehicle were low. The agency anticipates changes in the
algorithms at a cost of $2 per vehicle to compare relative wheel speeds could be used to
determine when one, two, or three tires are different from the others. However, the
system wouldn’t be able to detect when all four tires slowly lose air at about the same
time and are low. The agency does not know whether there will be additional costs to
improve the accuracy of the current ABS indirect measurement systems from roughly 30
percent below placard to the proposed upgraded 25 percent below placard. Comments
are requested on the cost estimates.
If the agency decides it is important to also measure when all four tires are low, then the
current ABS indirect measurement system would have to add another feature to
independently determine vehicle speed (independent of the speedometer that works off
wheel speed), so that individual tire speeds could be compared to vehicle speed.
Although the agency has not tried it to determine its accuracy, a GPS system is the least
costly possible method of independently determining vehicle speed. Other measures the
agency could think of, adding a fifth wheel or a radar system, are either impractical or too
costly.
Pickup trucks comprise about 40 percent of light truck sales. Some proportion of pickup
trucks (comments are requested on this percent) that have ABS, have only one wheel
speed sensor for the rear axle. In order to pass the proposal that the system be able to
detect when one, two, or three tires are low, the agency believes these trucks would have

VI-3
to add a fourth wheel detector at a cost of $20 per vehicle. The agency assumes for this
analysis that about 10 percent of all light trucks, or 7.5 percent of all light vehicles with
ABS, would be in this category.
For those vehicles without ABS, there are two ABS-based indirect measurement choices.
The first is not adding a full ABS system, but just those parts of the system needed for a
TPMS system. Essentially, this would require adding TPMS and wheel speed sensors,
which will cost approximately $130 per vehicle. (The agency won’t discuss this option
further, since it is more costly than a direct measurement system.)
To add the full ABS system (a manufacturer’s marketing decision, not a NHTSA
requirement) and a TPMS will cost approximately $240 per vehicle. (Again, the agency
won’t discuss this option further, since it is more costly than a direct measurement
system, and it is a marketing decision by the manufacturer to spend more money to get a
full ABS-system.)
Direct measurement systems:
A direct measurement system has a pressure sensor inside each tire that broadcasts tire
pressure, and in some systems internal air temperature, to a central receiver on the vehicle
(or in some cases to four separate antennae on the vehicle which relay the data to a
central processor). It sends the information to a central processor that in turn displays a
VI-4
low-pressure warning when appropriate. Thus, there can be two main costs of these
systems (sensors and a receiver/central processor).
There is a wide disparity in costs for the sensors depending upon what type of
information is sensed. Providing just the information proposed to be required by the
NPRM (tire pressure) would cost in the range of $5 to $10 per wheel (or $20-40 per
vehicle for this analysis). Some systems can sense tire pressure and air temperature
inside the tire.
The cost for the receiver/central processor depends upon whether the current vehicle
already has a receiver capable of receiving/processing the information coming from the
sensors or not. It is estimated that about 60 percent of vehicles currently have the
capability to receive the information (some in the form of a keyless remote entry system)
and process the information. With some software changes and adding a display, showing
tire pressure for all four tires individually, at a cost of about $25 per vehicle, these
systems with the added cost of sensors could meet the proposal. Other vehicles that
currently don’t have a receiver/central processor (about 40 percent of the vehicles),
would have to add them and the software and a display at an estimated cost of about $40
to $50 per vehicle.
An additional cost is the installation of the direct measurement system to the vehicle,
which is estimated to cost about $4 per vehicle.

VI-5
The agency also has a teardown study in progress performed by its contractor Ludtke &
Associates.1 Two direct measurement systems, the Beru tire pressure warning system
and the Johnson Controls system, have been torn down and costed out to date.
The Beru system is an expensive system that goes beyond the bare minimum needed to
pass the alternative. The Beru system is capable of providing a “soft warning” with an
amber telltale lamp when the inflation pressure drops 2.8 or more psi below the
recommended pressure, and a “hard warning” with a red telltale lamp when the under-
inflation is 5.7 psi or greater below the recommended inflation pressure.
The costs of the Beru direct measurement system are broken into the following categories
(1 control unit at $130, 4 wheels electronic modules to measure tire pressure and transmit
the data at $33, 4 reception antenna at $26, 4 valves at $1, assembly at $4, and
miscellaneous costs at $6, for a total of $200).
The costs of the Johnson Controls direct measurement system are broken into the
following categories (1 control unit at $31, 4 wheels electronic modules to measure tire
pressure and transmit the data at $33, 1 reception antenna at $1, 4 valves at $1, assembly
at $2, for a total of $68).
A direct measurement system with a pump:
1 Beru Tire Pressure Warning System, for No. DTNH22-00-C-02008 Task Order No. Three (3).

VI-6
Cycloid Company makes a pump based system that uses 4 wheel electronic modules, like
a direct measurement system, as well as a pump to inflate the tires to proper pressure
while the vehicle is being driven. Each tire has a sensor and a pump. The pump is
attached under the hubcap. The display is designed to give a warning to the driver when
a particular tire has a problem and needs servicing. For slow leaks, the pump can keep
inflating the tire enough to get the vehicle to its destination. However, once the vehicle
stops, the pump stops, and the tire will deflate. The cost of this system is estimated to be
the same as a sensor-based system, except that there is the addition of a pump at an
estimated cost of $10 per wheel, or $40 per vehicle. The benefit of this system is that it
eliminates the need for the driver to stop for air for normal tire pressure loss conditions.

VI-7
Table VI-1 shows the estimated incremental costs for the different types of systems
Table VI-1
Cost Summary of TPMS Costs
(2001 Dollars)
Indirect Measurement System
Add to Existing ABS $12
Adding Wheel Sensors $130
Adding Full ABS $240
Changing Algorithms of Current ABS-TPMS
$2
Adding Fourth Wheel Speed Sensor Capability for Some Pickups
$20
Direct Measurement System
With Current Receiver/central processor
$49 to $69 (we will use the mid-point $59)
Without Current Receiver/central processor
$64 to $94 (we will use the mid-point $79)
With a Pump, with current receiver/central processor
$89 to $109
With a Pump, without current receiver/central processor
$114 to $134

VI-8
Current TPMS Systems in New Vehicles
Current use of TPMS in new vehicles was determined by using the calendar year 2000
sales, a model year 2001 list of the make/models with each type of system, and an
estimate that 2 percent of sales were purchased as an option for those optional systems, to
estimate the percent of the year 2000 sales that had each type of system. The resulting
estimates are that 4 percent of the model year 2001 light vehicle fleet has an ABS-type
indirect measurement TPMS, or 6 percent of the ABS fleet has a TPMS, and 1 percent of
the fleet has a direct measurement system. While there are cost implication to make the
current indirect TPMS comply with Alternative 2 (estimated at $2), the agency believes
the direct systems could be changed at no cost to meet Alternative 1.
System Cost Summary by Alternative
Alternative 1: Assuming a direct measurement system is required, the incremental cost
would be an estimated $66 per vehicle ($59 with current receiver/central processor * 60
percent with receiver/central processor + $79 without receiver/central processor * 40
percent without receiver/central processor = $67 per vehicle * 99 percent to account for
the 1 percent of sales in the current fleet = $66.33)
Alternative 2: An indirect measurement system for all passenger cars and light trucks
with ABS, is estimated to cost an average ABS-equipped light vehicle $12.90 per vehicle
($12*0.94 + $2*.06 + $20 *0.075 = $12.90). This accounts for 94 percent of the ABS
systems have no TPMS, 6 percent have TPMS and 7.5 percent need a fourth wheel
sensor. The overall cost for Alternative 2 assuming that an indirect system would be

VI-9
provided for the 67 percent of the fleet that is already equipped with ABS, and that a
direct measurement system will be installed in the remaining 33 percent of the fleet is
estimated to be $30.54 ($12.90 * .67 + $66.33*.33).
Non-Quantified Costs
Maintenance Costs
The agency anticipates that there will be maintenance costs associated with both a direct
and an indirect measurement system. Most notable to consumers for most ABS-type
indirect systems is a reset button that must be pushed whenever the tires have been
rotated and perhaps when tires have been inflated. There is the potential for the reset
button to be misused, just to get the warning light to go out, before inflating the tires and
then forgetting to inflate the tires. In addition, the agency is aware of problems with
wheel speed sensors with mis-adjustment, maintenance, and component failures.
The direct measurement systems also have maintenance concerns. Because there are
sensors in the wheel, they can be damaged when tires are changed, etc. Furthermore,
there is a battery in the sensor in most systems, which has a finite life of about 10 years
currently, that will have to be eventually replaced to keep the system functioning.
The agency has not attempted to estimate these maintenance costs and requests comments
on them. These costs are real, but they will decrease as improvements keep being made
to the systems.

VI-10
More frequent tire inflation costs
In order to benefit from the TPMS, drivers must respond by maintaining the air pressure
in their tires. To accomplish this, they must either make a separate trip to a service
station to get the air, or spend additional time to fill their tires when they are at the station
getting gasoline. The process of checking and filling tires is relatively simple and would
probably take from 3-5 minutes. The time it takes to make a separate trip to a gas station
would vary depending on the driver’s proximity to a station at the time they were
notified. Presumably, the greater the distance to the station, the less likely the driver
would be to make a separate trip.
It is likely that drivers who take action to fill their tires would consider this extra time to
be fairly trivial. Since the action is voluntary, by definition, they would consider it to be
worth the potential benefits they derive from properly inflated tires. However, when
tallied across the entire driving population, the total effort involved in terms of man hours
may be significant. Tires lose an estimated 1 psi per month, which means they lose 6 psi
every 6 months. Therefore, people who otherwise would never fill their tires would be
notified about twice a year. However, since many people do check their tires more
frequently than that, the average number of extra fill ups would be considerably less than
2 per year. NHTSA has no data to indicate what portion of drivers would make a
separate trip, or wait to fill their tires when they next filled their gas tanks.
VI-11
Testing Costs
The test to show compliance may be broken down into the following sets of tests.
Initially the vehicle would be set up for the test with each of the four wheels being
instrumented. The vehicle would be run for a specified time to check out the system.
Then, one tire would be deflated and the vehicle driven for 10 minutes to determine the
response. Each of the other three tires would be deflated separately and the response of
the system checked. Then, different combinations of two tires would be deflated at a
time and the vehicle driven for ten minutes, different combinations of three tires would
be deflated at the same time and finally all four tires would be deflated at the same time.
Before and during these tests, the system may need to be calibrated. The agency has not
worked out the calibration procedure yet, but for these estimation purposes, assumes it
would take several hours. Finally, the agency is considering running a system failure
test, if required by the standard, where some part of the system would be disconnected to
determine whether there was an indication of system failure. The data must be collected,
analyzed and a test report written.
Assuming one set of tires on one vehicle at one vehicle load, the man-hours for the test
are 6 hours for a manager, 30 hours for a test engineer and 30 hours for a test
technician/driver.
Labor costs are estimated to be $75 per hour for a manager, $53 per hour for a test
engineer and $31 per hour for technicians. Total testing costs are thus estimated to be

VI-12
$2,970 ($75 * 6 + $30 * 53 + $31 * 30). If for light trucks, it is necessary to test the
vehicle unloaded and fully loaded, the test costs for light trucks would essentially double.
Lead Time
The act requires that the effective date of the rule be two years after the final rule. If
Alternative 1 is selected then the manufacturers would be required to provide direct
measurement systems in all vehicles. Comments are requested on whether there would
be enough supply of direct measurement systems for 16 million vehicles at one time.
However, if Alternative 2 is selected for the final rule, the agency believes that both
suppliers and vehicle manufacturers can be ready to provide TPMS given the two-year
lead time.

VII-1
VII. COST EFFECTIVENESS This section combines costs and benefits to provide a comparison of the estimated injuries and
lives saved per net cost. Costs occur when the vehicle is purchased, but the benefits accrue over
the lifetime of the vehicle. Benefits must therefore be discounted to express their present value
and put them on a common basis with costs.
In some instances, costs may exceed economic benefits, and in these cases, it is necessary to
derive a net cost per equivalent fatality prevented. An equivalent fatality is defined as the sum
of fatalities and nonfatal injuries prevented converted into fatality equivalents. This conversion
is accomplished using the relative values of fatalities and injuries measured using a Awillingness
to pay@ approach. This approach measures individuals= willingness to pay to avoid the risk of
death or injury based on societal behavioral measures, such as pay differentials for more risky
jobs.
Table VII-1 presents the relative estimated rational investment level to prevent one injury, by
maximum injury severity. Thus, one MAIS 1 injury is equivalent to 0.0038 fatalities. The data
represent average costs for crash victims of all ages. The Abbreviated Injury Scale (AIS) is an
anatomically based system that classifies individual injuries by body region on a six point ordinal
scale of risk to life. The AIS does not assess the combined effects of multiple injuries. The
maximum AIS (MAIS) is the highest single AIS code for an occupant with multiple injuries.

VII-2
Table VII-1
Comprehensive Fatality and Injury Relative Values
Injury Severity
1994 Relative Value* per injury
MAIS 1
.0038
MAIS 2
.0468
MAIS 3
.1655
MAIS 4
.4182
MAIS 5
.8791
Fatals
1.000 * includes the economic cost components and valuation for reduced quality of life
Source: AThe Economic Cost of Motor Vehicle Crashes, 1994", NHTSA, 1996.
Table VII-2 shows the estimated equivalent fatalities for the two different alternatives. The
injuries from Chapter V are weighted by the corresponding values in Table VII-1, added to the
fatalities, and then summed.
Table VII-2 Equivalent Fatalities
Fatality Benefits
Injury Benefits
Equivalent Fatalities
Alternative 1 79 10,635 300
Alternative 2 49 6,585 184
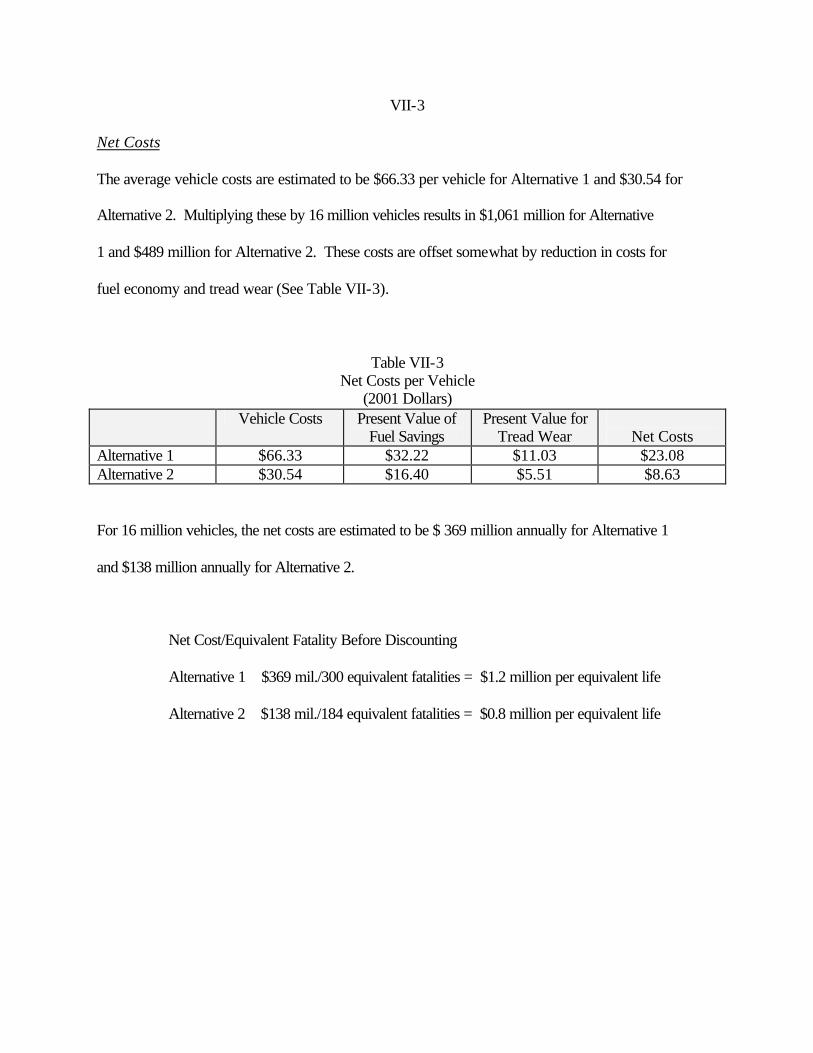
VII-3
Net Costs
The average vehicle costs are estimated to be $66.33 per vehicle for Alternative 1 and $30.54 for
Alternative 2. Multiplying these by 16 million vehicles results in $1,061 million for Alternative
1 and $489 million for Alternative 2. These costs are offset somewhat by reduction in costs for
fuel economy and tread wear (See Table VII-3).
Table VII-3 Net Costs per Vehicle
(2001 Dollars) Vehicle Costs Present Value of
Fuel Savings Present Value for
Tread Wear
Net Costs Alternative 1 $66.33 $32.22 $11.03 $23.08 Alternative 2 $30.54 $16.40 $5.51 $8.63
For 16 million vehicles, the net costs are estimated to be $ 369 million annually for Alternative 1
and $138 million annually for Alternative 2.
Net Cost/Equivalent Fatality Before Discounting
Alternative 1 $369 mil./300 equivalent fatalities = $1.2 million per equivalent life
Alternative 2 $138 mil./184 equivalent fatalities = $0.8 million per equivalent life

VII-4
Appendix V of the "Regulatory Program of the United States Government", April 1, 1990 -
March 31, 1991, sets out guidance for regulatory impact analyses. One of the guidelines deals
with discounting the monetary values of benefits and costs occurring in different years to their
present value so that they are comparable. Historically, the agency has discounted future
benefits and costs when they were monetary in nature. For example, the agency has discounted
future increases in fuel consumption due to the increased weight caused by safety
countermeasures, or decreases in property damage crash costs when a crash avoidance standard
reduced the incidence of crashes, such as with center high-mounted stop lamps. The agency has
not assigned dollar values to the reduction in fatalities and injuries, thus those benefits have not
been discounted. The agency performs a cost-effectiveness analysis resulting in an estimate of
the cost per equivalent life saved, as shown on the previous pages. The guidelines state, "An
attempt should be made to quantify all potential real incremental benefits to society in monetary
terms of the maximum extent possible." For the purposes of the cost-effectiveness analysis, the
Office of Management and Budget (OMB) has requested that the agency compound costs or
discount the benefits to account for the different points in time that they occur.
There is general agreement within the economic community that the appropriate basis for
determining discount rates is the marginal opportunity costs of lost or displaced funds. When
these funds involve capital investment, the marginal, real rate of return on capital must be
considered. However, when these funds represent lost consumption, the appropriate measure is
the rate at which society is willing to trade-off future for current consumption. This is referred to
as the "social rate of time preference," and it is generally assumed that the consumption rate of

VII-5
interest, i.e. the real, after-tax rate of return on widely available savings instruments or
investment opportunities, is the appropriate measure of its value.
Estimates of the social rate of time preference have been made by a number of authors. Robert
Lind1 estimated that the social rate of time preference is between zero and 6 percent, reflecting
the rates of return on Treasury bills and stock market portfolios. Kolb and Sheraga2 put the rate
at between one and five percent, based on returns to stocks and three-month Treasury bills.
Moore and Viscusi3 calculated a two percent real time rate of time preference for health, which
they characterize as being consistent with financial market rates for the period covered by their
study. Moore and Viscusi's estimate was derived by estimating the implicit discount rate for
deferred health benefits exhibited by workers in their choice of job risk.
Four different discount values are shown as a sensitivity analysis. The 2 and 4 percent rates
represent different estimates of the social rate of time preference for health and consumption.
The 10 percent figure was required by OMB Circular A-94, until October 29, 1992. The 7
percent figure is the current OMB requirement, which represents the marginal pretax rate of
return on an average investment in the private sector in recent years.
1Lind, R.C., "A Primer on the Major Issues Relating to the Discount Rate for Evaluating National Energy Options," in Discounting for Time and Risks in Energy Policy, 1982, (Washington, D.C., Resources for the Future, Inc.).
2J. Kolb and J.D. Sheraga, "A Suggested Approach for Discounting the Benefits and Costs of Environmental Regulations,: unpublished working papers.
3Moore, M.J. and Viscusi, W.K., "Discounting Environmental Health Risks: New Evidence and Policy Implications," Journal of Environmental Economics and Management, V. 18, No. 2, March 1990, part 2 of 2.

VII-6
Safety benefits can occur at any time during the vehicle's lifetime. For this analysis, the agency
assumes that the distribution of weighted yearly vehicle miles traveled are appropriate proxy
measures for the distribution of such crashes over the vehicle's lifetime. Multiplying the percent
of a vehicle's total lifetime mileage that occurs in each year by the discount factor and summing
these percentages over the 20 or 25 years of the vehicle's operating life, results in the following
multipliers for the average passenger car and light truck as shown in Table VII-4. These values
are multiplied by the equivalent lives saved to determine their present value (e.g., in Table VII-5
(300 x .8766 = 263). The net costs per equivalent life saved for passenger cars and light trucks
are then recomputed and shown in Table VII-6 using the net cost figures from Table VII-3 times
16 million vehicles and the discounted equivalent lives saved from Table VII-5 (e.g., for
Alternative 1 @ 2 percent discount rate; $369 million/263 equivalent lives saved = $1.4 million
per life saved).
Table VII-4 Discounting Multipliers
2 Percent
4 Percent
7 Percent
10 Percent
Passenger Cars
0.8906
0.8004
0.6921
0.6078
Light Trucks
0.8625
0.7545
0.6315
.05409
PC/LT Average
0.8766
0.7775
0.6618
0.5744

VII-7
Table VII-5 Discounting of Equivalent Lives Saved
Base Equivalent
2 Percent
4 Percent
7 Percent
10 Percent
Alternative 1 300 263 233 199 172
Alternative 2 184 161 143 122 106
x .8766
x .7775
x .6618
x .5744
Table VII-6 Net Costs per Discounted Equivalent Life Saved
($millions)
2 Percent
4 Percent
7 Percent
10 Percent
Alternative 1 $1.4 $1.6 $1.9 $2.1
Alternative 2 $0.9 $1.0 $1.1 $1.3

VIII-1 VIII. SMALL BUSINESS IMPACTS
A. Regulatory Flexibility Act
The Regulatory Flexibility Act of 1980 (5 U.S.C. §601 et seq.) requires agencies to evaluate the
potential effects of their proposed and final rules on small businesses, small organizations and
small governmental jurisdictions.
Small Vehicle Manufacturers
Currently, there are about 4 small motor vehicle manufacturers in the United States. As with
other systems in the vehicle, these manufacturers will have to rely on suppliers to provide the
hardware, and then they would have to integrate the system into their vehicles. The agency is
not considering any alternatives for the small vehicle manufacturers.
There are a few recreational vehicles made which are under 10,000 pounds GVWR, which would
have to comply with the standard. Most of these vehicles use van chassis supplied by the larger
manufacturers (GM, Ford, or Daimler Chrysler) and could use the systems supplied with the
chassis. To demonstrate compliance with FMVSS 107, a final stage manufacturer would
primarily rely upon the chassis manufacturer’s incomplete vehicle document.
Low Tire Pressure Monitoring System Suppliers
There are several suppliers of radio frequency transmission technology (Beru, Johnson Controls,
Schrader-Bridgeport, Pacific Industrial Company, SmarTire, Rayovac, and Fleet Specialties
Company). Suppliers of ABS integrated technology include Continental Teves, Bosch, Eaton,
and Toyota. There is one company that supplies a system that monitors the tires and puts air into
the tire, Cycloid Company.

VIII-2
The Regulatory Flexibility Act requires the agency to make a determination on whether the
proposal could have a significant economic impact on a substantial number of small businesses.
A small business is defined by the Small Business Administration, for purposes of receiving
Small Business Administration assistance. The criteria for determining size, as stated in 13 CFR
121.201, is the number of employees in the firm. The suppliers would fall under either
Subsection 336340 Motor Vehicle Brake System Manufacturers or Subsection 336322 Other
Motor Vehicle Electrical and Electronic Equipment Manufacturers. A company under these
subsections must have less than 750 employees to be considered a small business. Only three of
these companies could have less than 750 employees (SmarTire, Fleet Specialties Company, and
Cycloid Company). The agency does not have employee data on SmarTire and Fleet Specialties
Company. Cycloid Company has less than 10 employees and outsources the manufacturing of
their products. However, to be considered in the substantial number of small businesses, the
business headquarters should be in the United States. SmarTire is located in the United
Kingdom and Canada.
In conclusion, the agency believes that this proposal will not affect a substantial number of small
businesses.
B. Unfunded Mandates Reform Act
The Unfunded Mandates Reform Act of 1995 (Public Law 104-4) requires agencies to prepare a
written assessment of the costs, benefits, and other effects of proposed or final rules that include
a Federal mandate likely to result in the expenditures by State, local or tribal governments, in the
aggregate, or by the private sector, of more than $100 million annually (adjusted annually for
inflation with base year of 1995). The assessment may be included in conjunction with other
assessments, as it is here.

VIII-3
This proposal is not likely to result in expenditures by State, local or tribal governments of more
than $100 million annually. However, it is estimated to result in the expenditure by automobile
manufacturers and/or their suppliers of more than $100 million annually. The agency has
estimated that compliance with this proposed rule would cost from $30.54 to $66.33 per vehicle.
Since approximately 16 million vehicles are produced for the United States market each year,
this proposal will have a greater than a $100 million effect (16 million * $30.54 = $489 million).
The final cost will depend on choices made by the automobile manufacturers.
These effects have been discussed in the Preliminary Economic Assessment; see for example the
chapters on Cost, Benefits and the previous discussion in this chapter on the Regulatory
Flexibility Act.

IX-1
IX. CUMULATIVE IMPACTS
Section 1(b) II of Executive Order 12866 Regulatory Planning and Review requires the
agencies to take into account to the extent practicable "the costs of cumulative
regulations". To adhere to this requirement, the agency has decided to examine both the
costs and benefits by vehicle type of all substantial final rules with a cost or benefit
impact effective from MY 1990 or later. In addition, proposed rules are also identified
and preliminary cost and benefit estimates provided.
Costs include primary cost, secondary weight costs and the lifetime discounted fuel costs
for both primary and secondary weight. Costs will be presented in two ways, the cost per
affected vehicle and the average cost over all vehicles. The cost per affected vehicle
includes the range of costs that any vehicle might incur. For example, if two different
vehicles need different countermeasures to meet the standard, a range will show the cost
for both vehicles. The average cost over all vehicles takes into account voluntary
compliance before the rule was promulgated or planned voluntary compliance before the
rule was effective and the percent of the fleet for which the rule is applicable. Costs are
provided in 2000 dollars, using the implicit GNP deflator to inflate previous estimates to
2000 dollars.
Benefits are provided on an annual basis for the fleet once all vehicles in the fleet meet
the rule. Benefit and cost per average vehicle estimates take into account voluntary
compliance.

IX-2
Table IX-1
COSTS OF RECENT PASSENGER CAR RULEMAKINGS (Includes Secondary Weight and Fuel Impacts)
(2000 Dollars)
Description
Effective Model Year
Cost Per Affected Vehicle $
Cost Per Average Vehicle $
FMVSS 114, Key Locking System to Prevent Child- Caused Rollaway
1993 $9.44 – 19.58 $0.53 - 1.08
FMVSS 214, Dynamic Side Impact Test
1994 - 10% phase-in 1995 - 25% 1996 - 40% 1997 – 100%
$69.06 – 672.59 $62.52
FMVSS 208, Locking Latch Plate for Child Restraints
1996 $0.89 – 17.93 $2.40
FMVSS 208, Belt Fit 1998 $3.41 – 17.09 $1.26 - 1.82
FMVSS 208, Air Bags Required 1997 - 95% 1998 – 100
$503.50 – 608.39 $503.50 – 608.39
FMVSS 201, Upper Interior Head Protection
1999 - 10% 2000 - 25% 2001 - 40% 2002 - 70% 2003 – 100%
$37.76 $37.76
FMVSS 225, Child Restraint Anchorage Systems
2001 - 20% 2002 - 50% 2003 - 100%
$3.01 - $7.08 $6.07
FMVSS 208, Advanced Air Bags
two phases 2003 to 2010
$24.15 to 134.40 Depends on method chosen to comply

IX-3
Table IX-2
BENEFITS OF RECENT PASSENGER CAR RULEMAKINGS (Annual benefits when all vehicles meet the standard)
Description
Fatalities Prevented
Injuries Reduced Property Damage
Savings $
FMVSS 114, Key Locking System to Prevent Child Caused Rollaway
None 50-99 Injuries Not Estimated
FMVSS 214, Dynamic Side Impact Test 512 2,626 AIS 2-5 None
FMVSS 208, Locking Latch Plate for Child Restraints
Not estimated Not estimated None
FMVSS 208, Air Bags Required Compared to 12.5% Usage in 1983 Compared to 46.1% Usage in 1991
4,570 - 9,110 2,842 - 4,505
AIS 2-5 85,930 - 155,090 63,000 - 105,000
None
FMVSS 201, Upper Interior Head Protection
575 - 711
251 - 465 AIS 2-5
None
FMVSS 225, Child Restraint Anchorage Systems – Benefits include changes to Child Restraints in FMVSS 213
36 to 50* 1,231 to 2,929* None
FMVSS 208, Advanced Air Bags
117 to 215** 584 to 1,043 AIS 2-5**
Up to $85 per vehicle*
* Total benefits for passenger cars and light trucks ** Total benefits for passenger cars and light trucks, does not count potential loss in benefits if air bags are significantly depowered.

IX-4
Table IX-3
COSTS OF PROPOSED PASSENGER CAR RULES (Includes Secondary Weight and Fuel Impacts)
(2000 Dollars)
Description
Effective Model Year
Cost Per Affected Vehicle $
Cost Per Average Vehicle $
FMVSS 301, Fuel Tank Integrity Upgrade
TBD – first model year starting 3 years after final rule
$5.00 $2.30
FMVSS 202, Head Restraint Upgrade
TBD – first model year starting 3 years after final rule
$8.10 to $17.15 $10.70
Table IX-4
BENEFITS OF PROPOSED PASSENGER CAR RULES (Annual benefits when all vehicles meet the standard)
Description
Fatalities Prevented
Injuries Reduced Property Damage
Savings $
FMVSS 301, Fuel Tank Integrity Upgrade 4 to 11 none none
FMVSS 202, Head Restraint Upgrade none 12,395 None
* Total benefits for passenger cars and light trucks ** Total benefits for passenger cars and light trucks, does not count potential loss in benefits if air bags are significantly depowered.

IX-5
Table IX-5 COSTS OF RECENT LIGHT TRUCK RULEMAKINGS
(Includes Secondary Weight and Fuel Impacts) (2000 Dollars)
Description
Effective Model Year
Cost Per Affected Vehicle $
Cost Per Average Vehicle $
FMVSS 202, Head Restraints 1992 $46.87 – 113.70 $5.54
FMVSS 204, Steering Wheel Rearward Displacement for 4,000 to 5,500 lbs. unloaded
1992 $6.05 – 29.95 $1.07 – 2.03
FMVSS 208, Rear Seat Lap/Shoulder Belts
1992 $69.25 $0.41
FMVSS 114, Key Locking System to Prevent Child- Caused Rollaway
1993 $9.44 – 19.58 $0.01 - 0.03
FMVSS 208, Locking Latch Plate for Child Restraints
1996 $0.89 - 17.92 $2.40
FMVSS 108, Center High-Mounted Stop Lamp
1994 $15.06 – 22.76 $15.53
FMVSS 214, Quasi-Static Test (side door beams)
1994 - 90% 1995 – 100
$67.38 – 84.50 $62.45 – 78.45
FMVSS 216, Roof Crush for 6,000 lbs. GVWR or less
1995 $24.81 – 222.65 $0.89 – 8.82
FMVSS 208, Belt Fit 1998 $3.77 – 17.83 $6.44 - 8.68
FMVSS 208, Air Bags Required
1998 - 90% 1999 – 100
$503.50 – 608.39 dual air bags
$503.50 – 608.39 dual air bags
FMVSS 201, Upper Interior Head Protection
1999 - 10% 2000 - 25% 2002 - 70% 2003 - 100%
$37.40 – 81.90 $57.72
FMVSS 225, Child Restraint Anchorage Systems
2001 - 20% 2002 - 50% 2003 - 100%
$3.01 - $7.08 $6.07
FMVSS 208, Advanced Air Bags
two phases 2003 to 2010
$24.15 to 134.40 Depends on method chosen to comply

IX-6
Table IX-6 BENEFITS OF RECENT LIGHT TRUCK RULEMAKINGS
(Annual benefits when all vehicles meet the standard)
Description Fatalities Prevented
Injuries Reduced
Property Damage Savings $
FMVSS 202, Head Restraints None 470 - 835 AIS 1 20 - 35 AIS 2
None
FMVSS 204, Steering Wheel Rearward Displacement for 4,000 to 5,500 lbs. Unloaded
12 – 23 146 - 275 AIS 2-5 None
FMVSS 208, Rear Seat Lap/Shoulder Belts
None 2 AIS 2-5 None
FMVSS 114, Key Locking System to Prevent Child Caused Rollaway
None 1 Injury Not Estimated
FMVSS 208, Locking Latch Plate for Child Restraint
Not estimated Not estimated None
FMVSS 108, Center High Mounted Stop Lamp
None 19,200 to 27,400 Any AIS Level
$119 to 164 Million
FMVSS 214, Quasi-Static Test (side door beams )
58 – 82 1,569 to 1,889 hospitalizations
None
FMVSS 216, Roof Crush for 6,000 lbs. GVWR or less
2 – 5 25-54 AIS 2-5 None
FMVSS 208, Belt Fit 9 102 AIS 2-5 None
FMVSS 208, Air Bags Required Compared to 27.3% Usage in 1991
1,082 – 2,000 21,000 - 29,000 AIS 2-5
None
FMVSS 201, Upper Interior Head Protection
298 – 334 303 - 424 None
FMVSS 225, Child Restraint Anchorage Systems – Benefits include changes to Child Restraints in FMVSS 213
36 to 50* 1,231 to 2,929* None
FMVSS 208, Advanced Air Bags
117 to 215** 584 to 1,043 AIS 2-5**
Up to $85 per vehicle*
* Total benefits for passenger cars and light trucks ** Total benefits for passenger cars and light trucks, does not count potential loss in benefits if air bags are significantly depowered.

IX-7
Table IX-7 COSTS OF PROPOSED LIGHT TRUCK RULES (Includes Secondary Weight and Fuel Impacts)
(2000 Dollars)
Description Effective Model
Year Cost Per Affected
Vehicle $ Cost Per Average
Vehicle $
FMVSS 301, Fuel Tank Integrity Upgrade
TBD – 3 years after final rule
$5.00 $2.30
FMVSS 202, Head Restraint Upgrade
TBD - $8.10 to $17.15 $10.70
Table IX-8
BENEFITS OF PROPOSED LIGHT TRUCK RULES (Annual benefits when all vehicles meet the standard)
Description
Fatalities Prevented
Injuries Reduced Property Damage
Savings $
FMVSS 301, Fuel Tank Integrity Upgrade 4 to 10 none none
FMVSS 202, Head Restraint Upgrade none 1,852 None

V-59
prevented by TPMS. However, most benefits from TPMS would accrue from crashes that still
occur but with a reduced severity. It is unclear what the impact would be on travel delay and
property damage from these reductions.