Absorbed dose estimation to cohabitants and co-travelers ...
☢Preliminary dose estimation from the nuclear accident after the 2011 Great East Japan Earthquake and Tsunami

WHO Library Cataloguing-in-Publication Data
Preliminary dose estimation from the nuclear accident after the 2011 Great East Japan earthquake and tsunami.
1.Radiation injuries. 2.Accidents, Radiation. 3.Radiation dosage. 4.Radiation monitor-ing. 5.Risk assessment. 6.Nuclear power plants. 7.Earthquakes. 8.Tsunamis. 9.Japan I.World Health Organization.
ISBN 978 92 4 150366 2 (NLM classification: WN 665)
This report contains the collective views of an international group of experts, and does not necessarily represent the decisions or the stated policy of the World Health Organization.
© World Health Organization 2012
All rights reserved. Publications of the World Health Organization are available on the WHO web site (www.who.int) or can be purchased from WHO Press, World Health Orga-nization, 20 Avenue Appia, 1211 Geneva 27, Switzerland (tel.: +41 22 791 3264; fax: +41 22 791 4857; e-mail: [email protected]).
Requests for permission to reproduce or translate WHO publications – whether for sale or for noncommercial distribution – should be addressed to WHO Press through the WHO web site (http://www.who.int/about/licensing/copyright_form/en/index.html).
The designations employed and the presentation of the material in this publication do not imply the expression of any opinion whatsoever on the part of the World Health Organiza-tion concerning the legal status of any country, territory, city or area or of its authorities, or concerning the delimitation of its frontiers or boundaries. Dotted lines on maps represent approximate border lines for which there may not yet be full agreement.
The mention of specific companies or of certain manufacturers’ products does not imply that they are endorsed or recommended by the World Health Organization in preference to others of a similar nature that are not mentioned. Errors and omissions excepted, the names of proprietary products are distinguished by initial capital letters.
All reasonable precautions have been taken by the World Health Organization to verify the information contained in this publication. However, the published material is being distributed without warranty of any kind, either expressed or implied. The responsibility for the interpretation and use of the material lies with the reader. In no event shall the World Health Organization be liable for damages arising from its use.

preliminary dose estimation from the nuclear accident after the 2011 Great east Japan earthquake and tsunami / 1
ACKNOWLEDGEMENTS
AcknowledgementsThis report on the initial evaluation of radiation exposure from the nuclear accident after the 2011 Great East Japan Earthquake and Tsunami is the result of the work of an International Expert Panel convened by the World Health Organization (WHO). The work relied on the contribution of more than 30 scientists, some of whom participated in expert panel meetings to develop this document and some of whom contributed within their institutions.
WHO is particularly grateful to Ms Jane Simmonds (Health Protection Agency, HPA, United Kingdom) for her efficient and instrumental contribution as Chair of the expert panel. A scientific editorial group was part of the production and reviewing process for the preparation of this report, and their assistance is gratefully acknowledged: Dr Stephanie Haywood (Health Protection Agency, United Kingdom), Dr Philippe Verger (WHO), Dr Maria del Rosario Pérez (WHO) and Dr Emilie van Deventer (WHO).
Thanks are expressed to all the participants and contributors, with special gratitude for their major contributions to the following panel members:
Lynn Anspaugh Mikhail Balonov Carl BlackburnFlorian Gering Stephanie Haywood (Rapporteur)Gerhard Proehl Shin Saigusa Jane Simmonds (Chair) Ichiro Yamaguchi
WHO also acknowledges the contribution of other experts from the Food and Agriculture Organization of the United Nations, the International Atomic Energy Agency, and the International Agency for Research on Cancer as members of the panel; and the partici-pation of representatives of the United Nations Scientific Committee on the Effects of Atomic Radiation and representatives of the Government of Japan, as observers.
The WHO Cluster of Health Security and Environment financially supported the develop-ment of this report.

2 / preliminary dose estimation from the nuclear accident after the 2011 Great east Japan earthquake and tsunami
ContributorsDr Lynn Anspaugh3 University of Utah, USA
Dr Mikhail Balonov1,2,3 Institute of Radiation Hygiene, Russia
Mr Peter Bedwell Health Protection Agency, United Kingdom
Mr Antony Bexon Health Protection Agency, United Kingdom
Dr Carl Blackburn2 Food and Agriculture Organization of the United Nations, Austria
Dr Volodymyr Berkovskyy1 International Atomic Energy Agency, Austria
Mr David Byron1 Food and Agriculture Organization of the United Nations, Austria
Dr Tom Charnock Health Protection Agency, United Kingdom
Dr Michael Dinovi Food and Drug Administration, USA
Dr Sergey Fesenko Food and Agriculture Organization of the United Nations, Austria
Ms Brigitte Gerich3 Federal Office of Radiation Protection, Germany
Dr Florian Gering1,2,3 Federal Office of Radiation Protection, Germany
Dr Vladislav Golikov Institute of Radiation Hygiene, Russia
Dr Stephanie Haywood1,2,3 Health Protection Agency, United Kingdom
Dr Jean-René Jourdain1,2 Institut de Radioprotection et de Sûreté Nucléaire, France
Dr Catherine Leclercq, Istituto Nazionale di Ricerca per gli Alimenti e la Nutrizione, Italy
Dr Lionel Mabit3 Food and Agriculture Organization of the United Nations, Austria
Dr Gerhard Proehl1,2 International Atomic Energy Agency, Austria
Mr Jonathan Sherwood Health Protection Agency, United Kingdom
Dr Shin Saigusa1,2,3 National Institute of Radiological Sciences, Japan
Dr Kazuo Sakai1 National Institute of Radiological Sciences, Japan
Ms Jane Simmonds2,3 Health Protection Agency, United Kingdom
Dr Diego Telleria1,3 International Atomic Energy Agency, Austria
Mr Joseph Wellings Health Protection Agency, United Kingdom
Dr Ichiro Yamaguchi2 National Institute of Public Health, Japan
Dr Irina Zvonova Institute of Radiation Hygiene, Russia
ObserversMr Malcolm Crick3 United Nations Scientific Committee on the Effects of Atomic Radiation Secretariat
Mr Takashi Kiyoura1 Permanent Mission of Japan in Vienna, Austria
Mr Ichiro Ogasawara1 Permanent Mission of Japan in Vienna, Austria
Mr Yuji Otake2,3 Permanent Mission of Japan to the International Organizations in Geneva, Switzerland
Dr Ferid Shannoun1,2 United Nations Scientific Committee on the Effects of Atomic Radiation Secretariat
Dr Wolfgang Weiss1 United Nations Scientific Committee on the Effects of Atomic Radiation
World Health OrganizationDr Emilie van Deventer2,3 WHO headquarters
Dr Kazuko Fukushima2,3 WHO headquarters
Dr Dominique Maison2 WHO headquarters
Ms. Asiya Odugleh-Kolev WHO headquarters
Dr Maria del Rosario Perez1,2,3 WHO headquarters
Dr Isabelle Thierry-Chef3 International Agency for Research on Cancer. France
Dr Angelika Tritscher2,3 WHO headquarters
Dr Philippe Verger1,2,3 WHO headquarters
1 Participant in the International Expert Pa-nel meeting in Vienna, June 2011
2 Participant in the International Expert Pa-nel meeting in Geneva, September 2011
3 Participant in the International Expert Pa-nel meeting in Geneva, October 2011

preliminary dose estimation from the nuclear accident after the 2011 Great east Japan earthquake and tsunami / 3
CONTENTS
Acknowledgement . . . . . . . . . . . . . . . . . . . . . . . . . . . . . . . . . . . . . . . . . . . . . . . . . . . . . . . . . . 1Contributors . . . . . . . . . . . . . . . . . . . . . . . . . . . . . . . . . . . . . . . . . . . . . . . . . . . . . . . . . . . 2Observers . . . . . . . . . . . . . . . . . . . . . . . . . . . . . . . . . . . . . . . . . . . . . . . . . . . . . . . . . . . . . 2World Health Organization . . . . . . . . . . . . . . . . . . . . . . . . . . . . . . . . . . . . . . . . . . . . . . . . . 2
Executive summary . . . . . . . . . . . . . . . . . . . . . . . . . . . . . . . . . . . . . . . . . . . . . . . . . . . . . . . . . 7
Preface . . . . . . . . . . . . . . . . . . . . . . . . . . . . . . . . . . . . . . . . . . . . . . . . . . . . . . . . . . . . . . . . 10
1. Introduction . . . . . . . . . . . . . . . . . . . . . . . . . . . . . . . . . . . . . . . . . . . . . . . . . . . . . . . . . . . 121.1 Background . . . . . . . . . . . . . . . . . . . . . . . . . . . . . . . . . . . . . . . . . . . . . . . . . . . . . . . . 121.2 Purpose and audience . . . . . . . . . . . . . . . . . . . . . . . . . . . . . . . . . . . . . . . . . . . . . . . . 131.3 Scope . . . . . . . . . . . . . . . . . . . . . . . . . . . . . . . . . . . . . . . . . . . . . . . . . . . . . . . . . . . . 151.4 Overview of the methodology . . . . . . . . . . . . . . . . . . . . . . . . . . . . . . . . . . . . . . . . . . . . 151.5 Endpoints and scenarios . . . . . . . . . . . . . . . . . . . . . . . . . . . . . . . . . . . . . . . . . . . . . . . 16
1.5.1 Dosimetric endpoints . . . . . . . . . . . . . . . . . . . . . . . . . . . . . . . . . . . . . . . . . . . 161.5.2 Age groups considered . . . . . . . . . . . . . . . . . . . . . . . . . . . . . . . . . . . . . . . . . . 181.5.3 Geographical coverage . . . . . . . . . . . . . . . . . . . . . . . . . . . . . . . . . . . . . . . . . . . 181.5.4 Time frame. . . . . . . . . . . . . . . . . . . . . . . . . . . . . . . . . . . . . . . . . . . . . . . . . . . 191.5.5 Protective actions . . . . . . . . . . . . . . . . . . . . . . . . . . . . . . . . . . . . . . . . . . . . . 20
1.6 Procedures . . . . . . . . . . . . . . . . . . . . . . . . . . . . . . . . . . . . . . . . . . . . . . . . . . . . . . . . 22
2. Methodology . . . . . . . . . . . . . . . . . . . . . . . . . . . . . . . . . . . . . . . . . . . . . . . . . . . . . . . . . . 242.1 Approaches . . . . . . . . . . . . . . . . . . . . . . . . . . . . . . . . . . . . . . . . . . . . . . . . . . . . . . . . 242.2 Input data . . . . . . . . . . . . . . . . . . . . . . . . . . . . . . . . . . . . . . . . . . . . . . . . . . . . . . . . . 24
2.2.1 Radionuclide composition and deposition . . . . . . . . . . . . . . . . . . . . . . . . . . . . . 242.2.2 Environmental monitoring data . . . . . . . . . . . . . . . . . . . . . . . . . . . . . . . . . . . . 262.2.3 Food monitoring and consumption data . . . . . . . . . . . . . . . . . . . . . . . . . . . . . . 26
2.3 External radiation doses from radionuclides deposited on the ground (groundshine) . . . . . 272.3.1 Inside Japan . . . . . . . . . . . . . . . . . . . . . . . . . . . . . . . . . . . . . . . . . . . . . . . . . 272.3.2 Outside Japan . . . . . . . . . . . . . . . . . . . . . . . . . . . . . . . . . . . . . . . . . . . . . . . . 28
2.4 External radiation doses from the radioactive cloud (cloudshine) . . . . . . . . . . . . . . . . . . . 282.4.1 Inside Japan . . . . . . . . . . . . . . . . . . . . . . . . . . . . . . . . . . . . . . . . . . . . . . . . . 282.4.2 Outside Japan . . . . . . . . . . . . . . . . . . . . . . . . . . . . . . . . . . . . . . . . . . . . . . . . 29
2.5 Internal radiation doses from inhalation . . . . . . . . . . . . . . . . . . . . . . . . . . . . . . . . . . . . 302.5.1 Inside Japan . . . . . . . . . . . . . . . . . . . . . . . . . . . . . . . . . . . . . . . . . . . . . . . . . 302.5.2 Outside Japan . . . . . . . . . . . . . . . . . . . . . . . . . . . . . . . . . . . . . . . . . . . . . . . . 30
2.6 Internal radiation doses from ingestion of food . . . . . . . . . . . . . . . . . . . . . . . . . . . . . . . 312.6.1 Ingestion doses inside Japan . . . . . . . . . . . . . . . . . . . . . . . . . . . . . . . . . . . . . . 312.6.2 Monitoring of Japanese food outside Japan . . . . . . . . . . . . . . . . . . . . . . . . . . . . 352.6.3 Ingestion doses outside Japan . . . . . . . . . . . . . . . . . . . . . . . . . . . . . . . . . . . . . 36
2.7 Internal doses from ingestion of tap water . . . . . . . . . . . . . . . . . . . . . . . . . . . . . . . . . . 372.8 Doses due to the releases of radionuclides to the sea . . . . . . . . . . . . . . . . . . . . . . . . . . . 372.9 Summary of key assumptions . . . . . . . . . . . . . . . . . . . . . . . . . . . . . . . . . . . . . . . . . . . 37
Contents

4 / preliminary dose estimation from the nuclear accident after the 2011 Great east Japan earthquake and tsunami
3. Results . . . . . . . . . . . . . . . . . . . . . . . . . . . . . . . . . . . . . . . . . . . . . . . . . . . . . . . . . . . . . . 403.1 Presentation of results . . . . . . . . . . . . . . . . . . . . . . . . . . . . . . . . . . . . . . . . . . . . . . . . 403.2 Age dependence of dose estimates . . . . . . . . . . . . . . . . . . . . . . . . . . . . . . . . . . . . . . . 403.3 Geographical distribution of doses . . . . . . . . . . . . . . . . . . . . . . . . . . . . . . . . . . . . . . . 41
3.3.1 Estimated effective doses . . . . . . . . . . . . . . . . . . . . . . . . . . . . . . . . . . . . . . . . 413.3.2 Estimated thyroid doses . . . . . . . . . . . . . . . . . . . . . . . . . . . . . . . . . . . . . . . . . 423.3.3 Doses to the southern hemisphere . . . . . . . . . . . . . . . . . . . . . . . . . . . . . . . . . . 42
3.4 Results for food ingestion doses in Japan . . . . . . . . . . . . . . . . . . . . . . . . . . . . . . . . . . . 433.5 Results for tap water . . . . . . . . . . . . . . . . . . . . . . . . . . . . . . . . . . . . . . . . . . . . . . . . . 43
4. Discussion . . . . . . . . . . . . . . . . . . . . . . . . . . . . . . . . . . . . . . . . . . . . . . . . . . . . . . . . . . . . 484.1 Temporal distribution of the dose . . . . . . . . . . . . . . . . . . . . . . . . . . . . . . . . . . . . . . . . . 484.2 Influence of protective actions on the dose . . . . . . . . . . . . . . . . . . . . . . . . . . . . . . . . . . 484.3 Contribution of the different exposure pathways . . . . . . . . . . . . . . . . . . . . . . . . . . . . . . 514.4 Comparison to doses from other radiation sources . . . . . . . . . . . . . . . . . . . . . . . . . . . . . 514.5 Comparison of different methodologies . . . . . . . . . . . . . . . . . . . . . . . . . . . . . . . . . . . . . 544.6 Comparison with in vivo human measurements . . . . . . . . . . . . . . . . . . . . . . . . . . . . . . . 55
4.6.1 Monitoring in Japan . . . . . . . . . . . . . . . . . . . . . . . . . . . . . . . . . . . . . . . . . . . . 564.6.2 Monitoring outside Japan . . . . . . . . . . . . . . . . . . . . . . . . . . . . . . . . . . . . . . . . 57
4.7 Main sources of uncertainty and limitations . . . . . . . . . . . . . . . . . . . . . . . . . . . . . . . . . 604.7.1 Estimating time-integrated air concentrations based on deposition measurements 604.7.2 Assumed radionuclide composition in Japanese locations . . . . . . . . . . . . . . . . . . 614.7.3 Location factor . . . . . . . . . . . . . . . . . . . . . . . . . . . . . . . . . . . . . . . . . . . . . . . . 614.7.4 Use of ICRP dose coefficients for Japan . . . . . . . . . . . . . . . . . . . . . . . . . . . . . . 614.7.5 Source term . . . . . . . . . . . . . . . . . . . . . . . . . . . . . . . . . . . . . . . . . . . . . . . . . . 614.7.6 Dispersion modelling . . . . . . . . . . . . . . . . . . . . . . . . . . . . . . . . . . . . . . . . . . . . 624.7.7 Ingestion doses in Japan . . . . . . . . . . . . . . . . . . . . . . . . . . . . . . . . . . . . . . . . . 62
5. Summary and conclusions . . . . . . . . . . . . . . . . . . . . . . . . . . . . . . . . . . . . . . . . . . . . . . . . . 63
References . . . . . . . . . . . . . . . . . . . . . . . . . . . . . . . . . . . . . . . . . . . . . . . . . . . . . . . . . . . . . . 67
Glossary . . . . . . . . . . . . . . . . . . . . . . . . . . . . . . . . . . . . . . . . . . . . . . . . . . . . . . . . . . . . . . . . 71
Abbreviations . . . . . . . . . . . . . . . . . . . . . . . . . . . . . . . . . . . . . . . . . . . . . . . . . . . . . . . . . . . . 77
Annex 1. Declaration of interests statement . . . . . . . . . . . . . . . . . . . . . . . . . . . . . . . . . . . . . . 78
Annex 2. Examples of doses from different sources of exposure . . . . . . . . . . . . . . . . . . . . . . . . 79
Annex 3. Input parameters for the dose assessment . . . . . . . . . . . . . . . . . . . . . . . . . . . . . . . . 801. Inhalation dose coefficients . . . . . . . . . . . . . . . . . . . . . . . . . . . . . . . . . . . . . . . . . . . . . . 802. Ingestion dose coefficients . . . . . . . . . . . . . . . . . . . . . . . . . . . . . . . . . . . . . . . . . . . . . . 823. Inhalation rates . . . . . . . . . . . . . . . . . . . . . . . . . . . . . . . . . . . . . . . . . . . . . . . . . . . . . . 834. External dose per unit deposit . . . . . . . . . . . . . . . . . . . . . . . . . . . . . . . . . . . . . . . . . . . . 845. Dose reduction factor: external dose from radioactive material in air . . . . . . . . . . . . . . . . . 86
Annex 4. Source term for use in dispersion-based calculations . . . . . . . . . . . . . . . . . . . . . . . . . 87
Annex 5. Example of input monitoring data from Japan . . . . . . . . . . . . . . . . . . . . . . . . . . . . . . 90

preliminary dose estimation from the nuclear accident after the 2011 Great east Japan earthquake and tsunami / 5
CONTENTS
Annex 6. Models for external and inhalation doses in Japan (Approach A and Approach B) . . . . . 951. Model for external dose from nuclides deposited on soil . . . . . . . . . . . . . . . . . . . . . . . . . 95
1.1 Effective dose . . . . . . . . . . . . . . . . . . . . . . . . . . . . . . . . . . . . . . . . . . . . . . . . . . 951.2 Thyroid dose . . . . . . . . . . . . . . . . . . . . . . . . . . . . . . . . . . . . . . . . . . . . . . . . . . . 96
2. Model for external dose from radioactive cloud . . . . . . . . . . . . . . . . . . . . . . . . . . . . . . . . 962.1 Effective dose . . . . . . . . . . . . . . . . . . . . . . . . . . . . . . . . . . . . . . . . . . . . . . . . . . 962.2 Thyroid dose . . . . . . . . . . . . . . . . . . . . . . . . . . . . . . . . . . . . . . . . . . . . . . . . . . . 97
3. Model for internal dose from inhalation . . . . . . . . . . . . . . . . . . . . . . . . . . . . . . . . . . . . . 973.1 Effective dose . . . . . . . . . . . . . . . . . . . . . . . . . . . . . . . . . . . . . . . . . . . . . . . . . . 97
4. Input data . . . . . . . . . . . . . . . . . . . . . . . . . . . . . . . . . . . . . . . . . . . . . . . . . . . . . . . . . 984.1 Surface activity density of 137Cs (ACs137) . . . . . . . . . . . . . . . . . . . . . . . . . . . . . . . . 984.2 Surface activity density of other nuclides (Am) . . . . . . . . . . . . . . . . . . . . . . . . . . . 98
References to Annex 6 . . . . . . . . . . . . . . . . . . . . . . . . . . . . . . . . . . . . . . . . . . . . . . . . . . . 99
Annex 7. Models for external and inhalation doses outside Japan (Approach C). . . . . . . . . . . . . 1011. Model for external dose estimation for radionuclides deposited on the ground . . . . . . . . . 1012. Model for external dose estimation for radionuclides in the radioactive cloud . . . . . . . . . . 1013. Model for internal dose from inhalation . . . . . . . . . . . . . . . . . . . . . . . . . . . . . . . . . . . . 102References to Annex 7 . . . . . . . . . . . . . . . . . . . . . . . . . . . . . . . . . . . . . . . . . . . . . . . . . . 102
Annex 8. Model for ingestion doses in Japan (Approach D) . . . . . . . . . . . . . . . . . . . . . . . . . . . 1031. Model for dose calculation . . . . . . . . . . . . . . . . . . . . . . . . . . . . . . . . . . . . . . . . . . . . . 1032. Input data . . . . . . . . . . . . . . . . . . . . . . . . . . . . . . . . . . . . . . . . . . . . . . . . . . . . . . . . . 1043. Assumptions . . . . . . . . . . . . . . . . . . . . . . . . . . . . . . . . . . . . . . . . . . . . . . . . . . . . . . . 116
Annex 9. Model for ingestion doses outside Japan (Approach E) . . . . . . . . . . . . . . . . . . . . . . . 1171. Model for dose estimation . . . . . . . . . . . . . . . . . . . . . . . . . . . . . . . . . . . . . . . . . . . . . 1172. Input data . . . . . . . . . . . . . . . . . . . . . . . . . . . . . . . . . . . . . . . . . . . . . . . . . . . . . . . . 1173. Assumptions . . . . . . . . . . . . . . . . . . . . . . . . . . . . . . . . . . . . . . . . . . . . . . . . . . . . . . . 120References to Annex 9 . . . . . . . . . . . . . . . . . . . . . . . . . . . . . . . . . . . . . . . . . . . . . . . . . . 120

6 / preliminary dose estimation from the nuclear accident after the 2011 Great east Japan earthquake and tsunami

preliminary dose estimation from the nuclear accident after the 2011 Great east Japan earthquake and tsunami / 7
EXECUTIVE SUMMARY
Executive summary
The earthquake and tsunami in Japan on 11 March 2011 led to releases of radioactive material into the environment from the Tokyo Electric Power Company’s Fukushima Dai-ichi nuclear power station. This report describes an initial estimate of radiation doses re-sulting from this accident to characteristic members of the public in populations around the world.
In line with its defined role in radiation emergency response among international or-ganizations, the World Health Organization (WHO) is responsible for public health risk assessment and response. Therefore soon after the accident, WHO initiated a health risk assessment to support the identification of needs and priorities for public health action and to inform Member States and the public.
The aim of the health risk assessment is to estimate at global level the potential health consequences of human exposure to radiation during the first year after the Fukushima Daiichi nuclear power plant accident. The assessment covers infants, children and adults living in the Fukushima prefecture, nearby prefectures, the rest of Japan, neighbouring countries, and the rest of the world.
Because the health risk assessment requires an estimation of radiation doses delivered to the population, WHO established an International Expert Panel to make an initial evaluation of radiation exposure of people both inside Japan and beyond, as a result of the accident. The panel members were required to sign a declaration of interests, and no conflicts of interest were identified for any of them. The dose assessment was conducted by more than 30 experts who served in their individual capacities, either participating in the Expert Panel meetings or providing technical contributions from their respective institutions. All participating experts were selected on the basis of their scientific com-petence and experience.
Additionally, the panel included representatives of the International Atomic Energy Agency, the Food and Agriculture Organization of the United Nations and WHO in view of the relevance of their areas of expertise. The United Nations Scientific Committee on the Effects of Atomic Radiation, which has initiated a two-year assessment of the expo-sure levels and effects that will be submitted to the United Nations General Assembly in 2013, participated as an observer in the WHO assessments to ensure compatible approaches and data sources for the two United Nations activities. The Government of Japan also designated representatives to attend the meetings of the panel as observers. Three panel meetings were convened in June, September and October 2011.
This report provides data on effective doses and equivalent doses to the thyroid in mem-bers of the public resulting from exposure over the first year after the accident for differ-ent regions of the world, with greater spatial detail for the estimated doses inside Japan and, in particular, in the Fukushima prefecture.

8 / preliminary dose estimation from the nuclear accident after the 2011 Great east Japan earthquake and tsunami
The assessment was designed to provide preliminary dose estimates and was based on information publicly available from relevant Japanese government institutions, collected up to mid-September 2011. To validate the results of the dose estimates, the panel used a variety of dosimetric approaches and made comparisons with existing data on human in-vivo monitoring measurements (e.g. whole body counting and thyroid measurement).
As far as possible, the input data were measurements of levels of radioactive material in the environment (e.g. levels of different radionuclides on the ground) and levels of activity concentration in foodstuffs. When direct monitoring data were not available, es-timates based on simulations were used as input for the dose models.
The methodology used to calculate the doses relies on the most recent dosimetric and biokinetic models for different population subgroups (i.e. infants, children and adults). It considers all major routes of exposure – i.e. external exposure (from cloudshine and groundshine) and internal exposure (from ingestion of foodstuffs and inhalation).
The estimated doses are presented in order-of-magnitude dose bands of “characteristic” individual doses for each region considered. These are not the full ranges on the doses that may be received by all individuals within each region. The main sources of uncer-tainty in the dose estimates are discussed in the report.
This assessment is intended to be realistic. However, given the limited information avail-able to the panel during the time frame of its work, the assessment contains a number of assumptions (e.g. radioactive cloud composition and dispersion, time spent indoors/outdoors, and consumption levels). In particular, some assumptions regarding the imple-mentation of protective measures are conservative (e.g. the assumption that people in the most affected areas outside the 20-kilometre radius continued to live there for four months after the accident) and some possible dose overestimation may have occurred. All efforts were made to avoid any underestimation of doses.
In this context, using conservative assumptions, the assessment shows that the total effective dose received by characteristic individuals in two locations of relatively high exposure in Fukushima prefecture as a result of their exposure during the first year after the accident is within a dose band of 10 to 50 mSv. In these most affected locations, external exposure is the major contributor to the effective dose. In the rest of Fukushima prefecture the effective dose was estimated to be within a dose band of 1 to 10 mSv. Effective doses in most of Japan were estimated to be within a dose band of 0.1 to 1 mSv and in the rest of the world all the doses are below 0.01 mSv and usually far below this level.
The characteristic thyroid doses in the most exposed locations of Fukushima prefecture were estimated to be within a dose band of 10 to 100 mSv. In one particular location the assessment indicated that the characteristic thyroid dose to one-year-old infants would be within a dose band between 100 and 200 mSv, with the inhalation pathway being the main contributor to the dose. Thyroid doses in the rest of Japan were within a dose band of 1 to 10 mSv and in the rest of the world doses are estimated to be below 0.01 mSv and usually far below this level.
Outside the most affected areas of Fukushima prefecture, the exposure from food is the dominant pathway. Due to the assumptions applied the dose from ingestion may be over-

preliminary dose estimation from the nuclear accident after the 2011 Great east Japan earthquake and tsunami / 9
EXECUTIVE SUMMARY
estimated, especially in locations outside Fukushima and its neighbouring prefectures, and the reasons are discussed in the report.
This report represents the first international effort to assess global radiation doses from the Fukushima Daiichi nuclear power plant accident considering all major exposure pathways. It provides timely and authoritative information on the anticipated scale of doses in members of the public for the first year after the accident, based on input data available to the International Expert Panel within the time frame. Nevertheless, this dose assessment should be considered as preliminary. The availability of further monitoring data and more detailed information about implementation of protective measures will allow for more refined assessments in the future.

10 / preliminary dose estimation from the nuclear accident after the 2011 Great east Japan earthquake and tsunami
Preface
The World Health Organization (WHO) conducts a programme on radiation and health which aims to promote safe and appropriate use of radiation to protect patients, work-ers and members of the public in planned, existing and emergency exposure situations. WHO's involvement in radiation and health began within a decade of its founding, and the International Commission on Radiological Protection has been in official relations with WHO since 1956. In 1972 the World Health Assembly requested the Director-General to cooperate with the International Atomic Energy Agency, the United Nations Scientific Committee on the Effects of Atomic Radiation, and other international orga-nizations in evaluating the world situation regarding the medical use of ionizing radia-tion and the effects of radiation on populations.1
Global public health security is one of the key priorities of WHO’s agenda. The World Health Assembly requested the Director-General in 2005 to enhance WHO’s capacity to implement health-related emergency preparedness plans, and to prepare for disasters and crises through timely and reliable assessments.2 The nature of WHO’s work on emer-gencies – whether resulting from natural, intentional or accidental events – requires a high level of coordination with a variety of partners within the United Nations system, as well as with other external partners. One of the lessons from the 1986 Chernobyl nuclear accident was the need to strengthen international cooperation in radiation emergencies. The Joint Radiation Emergency Management Plan of the International Organizations, last published in 2010, establishes the mechanisms for implementing a coordinated response and defines the roles of each party. Within this joint plan, WHO is responsible for the coordination of public health risk assessment and response.
The decentralized structure of WHO – with its headquarters in Geneva, Switzerland, six regional offices and 149 country offices – provides optimal conditions for interact-ing with the Organization’s 194 Member States. After the 11 March 2011 Great East Japan Earthquake and Tsunami, TEPCO's Fukushima Daiichi nuclear power station was severely damaged and a significant amount of radioactive material was released into the environment. The potential risks of human exposure to radiation resulting from this ac-cident received priority attention around the world. As the United Nations directing and coordinating authority on international public health issues, WHO was directly engaged in assessing and communicating public health risks. Since the onset of the accident, WHO's response has been articulated through the Organization’s Western Pacific Re-gional Office, based in Manila, Philippines, assisted by WHO headquarters and the WHO Centre for Health Development in Kobe, Japan.
1. See World Health Assembly resolution WHA25.57.
2. See World Health Assembly resolution WHA58.1.

preliminary dose estimation from the nuclear accident after the 2011 Great east Japan earthquake and tsunami / 11
PREFACE
Assessment of the health risks arising from this accident requires knowledge of the radiation doses delivered to populations within Japan and beyond. To that end, WHO established an International Expert Panel to undertake an initial assessment of radia-tion doses received by populations inside and outside Japan as a consequence of the Fukushima Daiichi accident. The panel consisted of independent scientific experts and representatives of WHO, the International Atomic Energy Agency and the Food and Agri-culture Organization of the United Nations. The United Nations Scientific Committee on the Effects of Atomic Radiation and the Government of Japan participated as observers. This report summarizes the results of the dose assessment conducted by the panel. It represents the first international effort to estimate radiation doses from this accident at the global level, taking into account all the significant exposure pathways. This report is primarily intended for use by the WHO Health Risk Assessment Group to inform an initial assessment of health risks incurred as a consequence of the Fukushima Daiichi accident. It provides information to Member States and the public on the anticipated scale of doses for the first year after the accident.
12 / preliminary dose estimation from the nuclear accident after the 2011 Great east Japan earthquake and tsunami
The earthquake and tsunami in Japan on 11 March 2011 led to releases of radioactive material into the environment from the Tokyo Electric Power Company’s Fukushima Dai-ichi nuclear power station. This report describes an estimate of radiation doses to the public resulting from this accident. These doses, characteristic of the average doses, and presented in this report as "characteristic doses", are assessed for different age groups in locations around the world, using a set of assumptions described in the text.
The dose assessment described in this report was undertaken by an International Expert Panel convened by WHO in June 2011 with the aim of completing its work within a short timescale and is therefore preliminary in nature.
This dose evaluation forms one part of the overall health risk assessment of the global impact of the accident at the Fukushima Daiichi nuclear power plant, which is being carried out by WHO. This health risk assessment is the subject of a separate WHO report that is intended to inform public health actions.
The present assessment will form one input into a two-year scientific study to assess the radiological consequences of the Fukushima Daiichi nuclear power accident that is to be published by the United Nations Scientific Committee on the Effects of Atomic Radia-tion (UNSCEAR) in 2013. More refined assessments will no doubt be conducted and reported in the future as additional data become available.
The panel agreed to concentrate on the most important contributors to dose rather than attempting to analyse all aspects comprehensively. As this assessment is intended to be realistic, the panel made conservative assumptions only when data were insufficient (e.g. with regard to the timeline of implemented protective actions). The dose estimates were based primarily on the best input data available up to mid-September 2011. The results are presented in a level of detail commensurate with the availability of data and the preliminary nature of the assessment. The report is the first study to present an esti-mate of the doses around the world, incorporating all exposure pathways that contribute significantly to radiation dose.
1.1 BackgroundOn 11 March 2011 Japan suffered a magnitude 9 earthquake, the largest ever re-corded in the country. The epicentre was just over 180 km from the site of the Fu-kushima Daiichi nuclear power plant that had six nuclear reactors, each with its own fuel storage pond. At the time of the accident, three of the site’s nuclear reactor units (reactors 1−3) were operating at power. Reactor 4 was refuelling, and reactors 5 and 6 were shut down for maintenance. Reactors 1−3 were automatically shut down when the earthquake occurred. However, less than one hour after the earthquake a massive
1. Introduction

preliminary dose estimation from the nuclear accident after the 2011 Great east Japan earthquake and tsunami / 13
1. INTRODUCTION
tsunami generated by the earthquake inundated the nuclear site at Fukushima Daiichi with seawater.
The damage caused by the flooding of the site resulted in loss of cooling to the three reactor units. This led to eventual overheating, hydrogen explosions and a probable partial melting of the core of the three reactors. As a consequence, major releases of radioactive material to the environment occurred. These releases were initially to the air, but subsequently there were also radioactive releases to the sea through discharge of water used to cool the reactors and the spent fuel ponds (1). The nuclear accident was eventually classified at Level 7, the highest on the International Nuclear and Ra-diological Event Scale (INES) (2).
Measures were taken by national authorities to protect their populations from the con-sequences of the nuclear accident. In Japan, initially a three-kilometre evacuation zone was put in place around the site, which was soon increased to a 20-kilometre evacuation zone with a 30-kilometre sheltering zone. As the availability of environmental monitoring data increased, other protective actions were implemented to reduce doses in the longer term, including the relocation of people in some areas (designated by the Japanese au-thorities as “deliberate evacuation areas”) (Figure 1). Stable iodine for thyroid blocking was pre-distributed. Provisional regulatory limits for the radioactive content of food were established quickly after the accident, and monitoring was conducted by local govern-ments based on testing guidelines prepared by the Government of Japan. Foods were to be tested before going to the market in early harvest season and the foods found to contain higher concentration of radioactive nuclides than the provisional regulatory lim-its were subject to appropriate measures. Furthermore, in the case that the contamina-tion was spread over an area, distribution restrictions were implemented for the foods in that area. Similarly, monitoring of tap water was conducted, both by central and local government and by the water supply utilities, with especial emphasis in Fukushima and neighbouring prefectures.
Around the world, governments considered steps to protect their citizens. The primary concern was for those residing in or visiting the most affected regions of Japan in the days and weeks after the earthquake, but there was also consideration of whether any steps were needed within their own countries (such as restrictions on food imports from Japan).
By mid-2011 detailed information was provided in authoritative reports relating to the nuclear accident issued by the Japanese government (3,4,5) and the IAEA (6).
1.2 Purpose and audienceThe purpose of this study is to estimate radiation exposure for populations around the world in the first year following the Fukushima Daiichi nuclear power plant accident. The study focuses on radiation exposure of members of the public.
This report is primarily intended for use by the WHO Health Risk Assessment Group to inform an initial assessment of health risks incurred as a consequence of the Fukushima Daiichi accident. It also provides information to Member States and the public on the anticipated scale of radiation doses. Ultimately, the report is expected to serve as sup-port for policy-makers and decision-makers.

14 / preliminary dose estimation from the nuclear accident after the 2011 Great east Japan earthquake and tsunami
Hirono TownHirono Town
Iwaki City
Kawbuchi Village
Ono Town
Koriyama City
20 km
30 km
Katsurao Village
Minami Soma City
Motomiya City
Nihonmatsu City
Fukushima City
Date City
Hobaramachi-Tomizawa
Tsukudatemachi-Tsukidate
Ryozenmachi-Shimooguni
Ryozenmachi-Kamioguni
Ryozenmachi-Ishida
Jisbara, Kashima Ward
Ohara, Haramachi Ward
Ogai, Haramachi Ward
Takanokura, Haramachi Ward
Oshigama, Haramachi WardBaba, Haramachi WardKatakura, Haramachi Ward
Itate Village
Soma City
Kawamata Town
MiharuTown
Hirata Village
Naraha Town
Tomioka Town
Okuma Town
Futaba Town
FukushimaDai-ichi NPS
FukushimaDai-ni NPS
Namie Town
Restricted areaDeliberate evacuation areaEvacuation-prepared area in case of emergencyRegions including specific spots recommended for evacuation
Restricted area, deliberate evacuation area and regions including specific spots recommended for evacuation (as of november 25, 2011)
Restricted area
Deliberate evacuation
area
© 2010 Zenringo.,LTD.
Tamura City
Evacuation-prepared
area in case of
emergency
Shimokawauchi
Figure 1. Restricted area, deliberate evacuation area and regions including specific spots recommended for evacuation (as of November 25, 2011)
Source: Adapted from http://www.meti.go.jp/english/earthquake/nuclear/roadmap/pdf/evacuation_map_111125.pdf (reproduced with permission).

preliminary dose estimation from the nuclear accident after the 2011 Great east Japan earthquake and tsunami / 15
1. INTRODUCTION
1.3 ScopeThis report provides a preliminary estimate of radiation doses to the public resulting from the accident at the Fukushima Daiichi nuclear power plant. The doses are characteristic of the average doses, and are assessed for different age groups in locations around the world.
This report does not include:
■ doses within 20 km of the Fukushima site, since most people in the area were rapidly evacuated. While some dose may have been received prior to evacuation, such assess-ment would have required more precise data than were available to the panel.
■ doses to workers, because the evaluation of occupational radiation exposure requires a dosimetric approach different from the one used for members of the public. The assessment conducted by the WHO Health Risk Assessment (HRA) Expert Working Group will incorporate information on workers’ exposure provided by the Government of Japan.
■ health risks and possible public health actions, since the doses calculated here will serve as input to a subsequent analysis by the HRA Expert Working Group which will evaluate the health risks due to the radiation exposure resulting from the accident.
1.4 Overview of the methodologyAn assessment of the doses received following a release of radioactive material to the environment requires data on a number of aspects, such as measured levels of radionuclides in the environment, in tap water and in foodstuffs, estimated amounts of radioactive material released, atmospheric dispersion and deposition patterns, the nature of subsequent transfer in the environment, and the location and habits of the population for whom doses are being assessed.
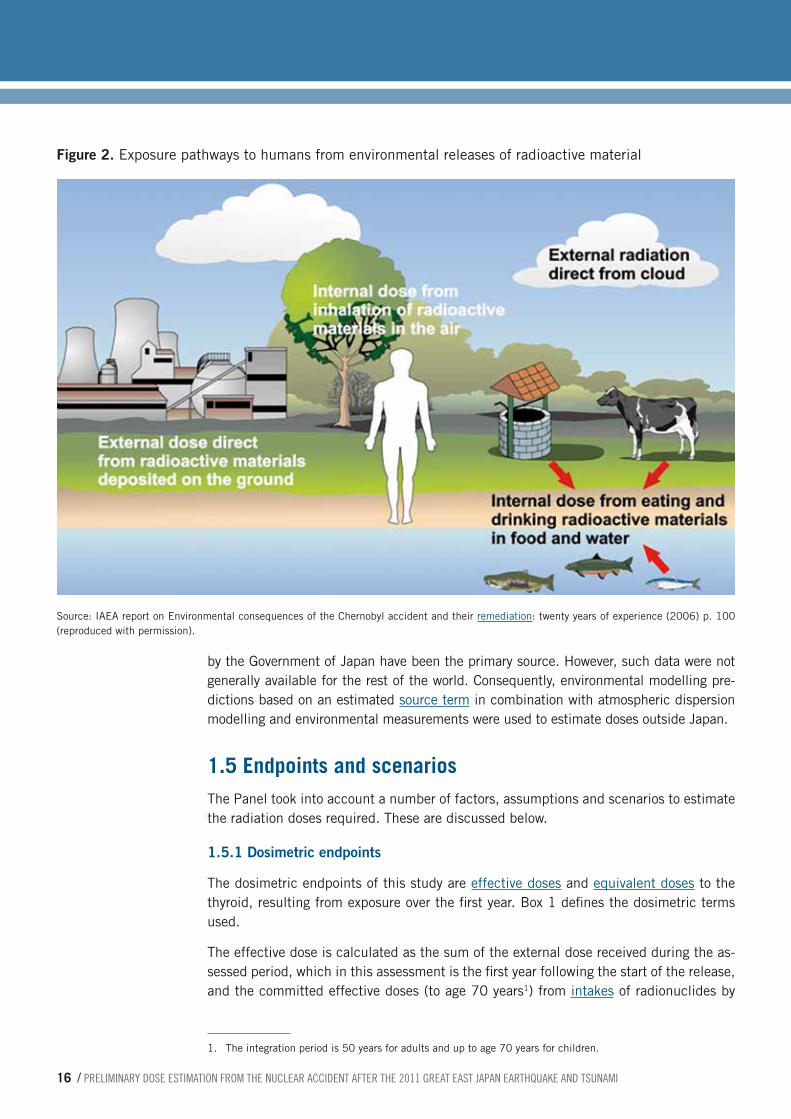
Following the Fukushima accident, humans were exposed to radioactive material by sev-eral pathways (Figure 2). The major exposure pathways were:
■ external exposure from radionuclides deposited on the ground (groundshine);
■ external exposure from radionuclides in the radioactive cloud (cloudshine);
■ internal exposure from inhalation of radionuclides in the radioactive cloud (inhala-tion);
■ internal exposure from ingestion of radionuclides in food and water (ingestion).
All of these exposure pathways were considered in the assessment. The expert panel also considered the relative importance of additional pathways, such as external radiation from material deposited on skin and clothing. The panel agreed that these additional pathways would be of much lower importance and therefore not included in this preliminary study.
As far as possible, the assessment described in this report has been based directly on mea-surements of levels of radioactive material in the environment, such as levels of different radionuclides deposited on the ground or in soil, or found in foodstuffs. This has been the approach to the estimates of dose in Japan, where official measurement data published
16 / preliminary dose estimation from the nuclear accident after the 2011 Great east Japan earthquake and tsunami
by the Government of Japan have been the primary source. However, such data were not generally available for the rest of the world. Consequently, environmental modelling pre-dictions based on an estimated source term in combination with atmospheric dispersion modelling and environmental measurements were used to estimate doses outside Japan.
1.5 Endpoints and scenariosThe Panel took into account a number of factors, assumptions and scenarios to estimate the radiation doses required. These are discussed below.
1.5.1 Dosimetric endpoints
The dosimetric endpoints of this study are effective doses and equivalent doses to the thyroid, resulting from exposure over the first year. Box 1 defines the dosimetric terms used.
The effective dose is calculated as the sum of the external dose received during the as-sessed period, which in this assessment is the first year following the start of the release, and the committed effective doses (to age 70 years1) from intakes of radionuclides by
1. The integration period is 50 years for adults and up to age 70 years for children.
Figure 2. Exposure pathways to humans from environmental releases of radioactive material
Source: IAEA report on Environmental consequences of the Chernobyl accident and their remediation: twenty years of experience (2006) p. 100 (reproduced with permission).

preliminary dose estimation from the nuclear accident after the 2011 Great east Japan earthquake and tsunami / 17
1. INTRODUCTION
ingestion and inhalation over the same period (Box 2). The effective dose in this report includes the contribution from dose to the thyroid.
In considering the radiological consequences of the Fukushima accident, the panel agreed that the use of effective dose would be an appropriate quantity for this dose as-sessment. The concept of effective dose enables external and internal exposures from different types of radiation to be combined (7). It is particularly appropriate to use ef-fective dose for external gamma radiation that irradiates the whole body more or less uniformly. Radioactive isotopes of caesium are likely to be significant in terms of health consequences and environmental impact after a major nuclear accident. For internal exposures, an important contribution to the committed dose is likely to be due to the ingestion and inhalation of isotopes of caesium (8). Since the bio-distribution of caesium in the body is quite homogeneous, all organs are irradiated, and hence the effective dose is a good indicator of the impact of such intakes.
In addition to effective dose, the Panel agreed to assess thyroid doses because the intake of iodine-131 (131I) is also likely to be an important contributor to overall exposure. In this case the distribution in the body is far from uniform, with the thyroid being the most exposed organ. After the Chernobyl accident in 1986, elevated incidence of thyroid can-cer was found in people who were children at the time of the accident (see, for instance, WHO’s 2006 report on health effects of the Chernobyl accident (9).
The thyroid doses were assessed in terms of equivalent dose, which is the dose delivered to an organ allowing for the biological effectiveness of different types of radiation. The
Dosimetric quantities are needed to assess human radiation exposures in a quantitative way. The International Commission on Radiological Protection (ICRP) provides a system of protection against the risks from exposure to ionizing radiation, including recommended dosimetric quantities.
The fundamental measure of radiation dose to an organ or tissue is the absorbed dose, which is the amount of energy absorbed by that organ or tissue divided by its weight. The international unit of absorbed dose is the gray (Gy), which is equal to one joule per kilogram.
The response of tissues and organs varies for different types of radiation. Also, tissues and organs have different radiosensitivity to radiation. The equivalent dose in a tissue or organ is the absorbed dose averaged over that tissue or organ, further applying a radiation weighting factor that varies by radiation type and is related to the density
of ionization created. The international unit of equivalent dose is the sievert (Sv).
An additional and frequently used concept is the effective dose, which is the sum of the products of absorbed dose to each organ multiplied by the radiation weighting factor mentioned above and a tissue weighting factor that takes into account the radiosensitivity of tissues and organs. The international unit of effective dose is also the sievert (Sv).
The radioactivity of a substance (also called "activity") is the rate at which the radioactive decay processes take place. It is measured in becquerels (Bq), defined as one disintegration per second. The ICRP has developed a set of dose coefficients for use in assessing the exposures resulting from inhalation or ingestion of radionuclides. These dose coefficients, expressed as Sv/Bq, have been specified for a range of body organs.
Source: Adapted from Ref. 10
Box 1. Dosimetric quantities

18 / preliminary dose estimation from the nuclear accident after the 2011 Great east Japan earthquake and tsunami
thyroid dose is the sum of external dose to the thyroid in the first year and the committed equivalent doses to the thyroid (to age 70 years2) from intakes by ingestion and inhala-tion over the first year following the start of the release.
It should be noted that, although the units are the same, thyroid doses and effective doses are two different quantities that cannot be compared. Thyroid doses are organ-specific equivalent doses, while the effective doses represent the sum of the products of the absorbed doses to each organ multiplied by the respective tissue weighting factors (see Box 1). Effective doses were estimated using ICRP dose coefficients which incorpo-rate tissue weighting factors as specified in ICRP publication 60 (7). Based on this, the tissue weighting factor used for thyroid is 0.05.
1.5.2 Age groups considered
For the purposes of this assessment, three age groups were considered: adults, children aged 10 years, and infants aged one year. These age groups are judged to be sufficient to ensure consideration of younger, more sensitive members of the population (11). Doses to the fetus and breastfed infant were also considered (see section 3.2) but were not evaluated separately. Doses to six-month-old infants have been considered for the consumption of formula milk made up with tap water.
2. The integration period is 50 years for adults and from time of intake up to age 70 years for children.
The physical half-life is the period of time for one-half of the atoms of a radionuclide to disintegrate. Physical half-lives can range from a few microseconds to billions of years. The biological half-life is the period of time required to eliminate one-half of the radioactivity from the body. The actual rate of halving the radioactivity in a living organism is determined by a combination of both the physical and biological half-lives of the radionuclide, called the effective half-life. While for certain radionuclides the biological processes are dominant, for others physical decay is the dominant influence. For instance, the physical half-life of 134Cs and 137Cs is 2 years and 30 years respectively, but their biological half-life is much shorter (several months). In adults, 10% is excreted in the first few days after the intake and the rest leaves the body with a biological half-life of about a hundred days. The biological half-life of cesium increases as a function of body mass and age, which means that it leaves the
body quicker in children and adolescents compared to adults (e.g. data from urinary assays and whole-body counting suggested that the biological half-life of 137Cs in children is around 50 days).
In assessing radiological exposures arising from inhalation and ingestion, there is a distinction between the time period over which the intake occurs and the time over which the exposure (the radiation dose) to the body ensues. For example, intake from inhalation on a single day may give rise to the body being internally exposed to radiation over a period of days and months, and possibly over a much longer period, depending on the effective half-life.
The committed dose (effective or equivalent) is the dose that an individual will receive once a radionuclide intake has taken place. When it is not specified, the integration period considered for the assessment is 50 years for adults and the period of time needed to reach the age of 70 years for children.
Box 2. Temporal distribution of the exposure after intake of radionuclides
preliminary dose estimation from the nuclear accident after the 2011 Great east Japan earthquake and tsunami / 19
1. INTRODUCTION
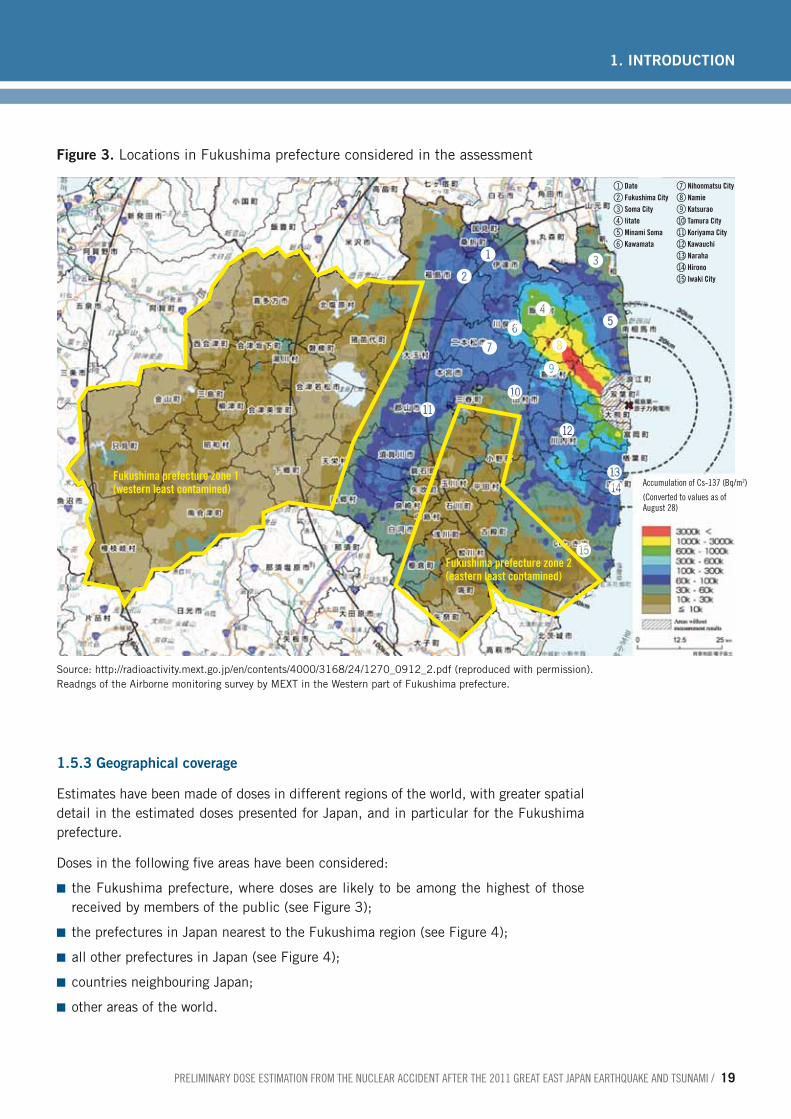
1.5.3 Geographical coverage
Estimates have been made of doses in different regions of the world, with greater spatial detail in the estimated doses presented for Japan, and in particular for the Fukushima prefecture.
Doses in the following five areas have been considered:
■ the Fukushima prefecture, where doses are likely to be among the highest of those received by members of the public (see Figure 3);
■ the prefectures in Japan nearest to the Fukushima region (see Figure 4);
■ all other prefectures in Japan (see Figure 4);
■ countries neighbouring Japan;
■ other areas of the world.
!
1 Date2 Fukushima City3 Soma City4 Iitate5 Minami Soma6 Kawamata
7 Nihonmatsu City8 Namie9 Katsuraobl Tamura Citybm Koriyama Citybn Kawauchibo Narahabp Hironobq Iwaki City@
#
$%
^
& *
(
BLBM
BN
BOBP
BQ
Fukushima prefecture zone 1(western least contamined)
Fukushima prefecture zone 2(eastern least contamined)
accumulation of cs-137 (Bq/m2)
(converted to values as of august 28)
Figure 3. Locations in Fukushima prefecture considered in the assessment
Source: http://radioactivity.mext.go.jp/en/contents/4000/3168/24/1270_0912_2.pdf (reproduced with permission).Readngs of the Airborne monitoring survey by MEXT in the Western part of Fukushima prefecture.

20 / preliminary dose estimation from the nuclear accident after the 2011 Great east Japan earthquake and tsunami
1.5.4 Time frame
The estimated doses rely on measurements available until mid-September 2011. The doses estimated are those resulting from intakes and external exposures during the first year after the accident. Extrapolation beyond this time frame on the basis of the input data used for this preliminary assessment would be uncertain and therefore was not per-formed. While intakes are considered over the first year, some of the exposures resulting from the intake will continue beyond that period (see Box 2).
For the radionuclides released in the Fukushima accident, the great majority of the committed doses from inhalation and ingestion are expected in the first year. This is particularly the case for the isotopes of iodine due to their short physical half-life. For caesium isotopes, although the physical half-life is longer, the biological half-life is not long, particularly in children (see Box 2) (8).
1.5.5 Protective actions
During the Fukushima Daiichi nuclear power plant emergency, public health protective actions were implemented at different times. In the early phase, urgent protective ac-tions aimed at preventing the short-term radiation exposure included evacuation, shelter-ing, pre-distribution of stable iodine, and food and water restrictions. As the availability of environmental monitoring data increased, other protective actions were implemented,
Hokkaido
Aomori
Akira
Yamagata
Niigata
Nagano
Toyama
Gifu
Aichi
MieNara
ShigaKyoto
OitaSaga
Hyogo
Totori
OkayamaShimane
Hiroshima
Yamaguchi
Fukuoka
NaoasakiKumamoto
MiyazakiKagoshima
Kagawa
Ehime Kochi WakayamaTokushima
Shizuka
Ishikawa
Fukui
Fukushima
Ibaraki
Tokyo Chiba
TochigiGunma
SaitamaYamanashi
Kanagawa
Miyagi
Iwate
Figure 4. Neighbouring prefectures considered in the assessment
2
1 Yamagata2 Miyagi 1 northern3 Miyagi 2 southern4 Fukushima 1 western5 Fukushima 36 Fukushima 2 southern7 Tochigi 1 northern8 Tochigi 2 southern9 Gunma 1 northernbl Gunma 2 southernbm Ibaraki 1 northernbn Ibaraki 2 centralbo Ibaraki 3 southernbp Saitamabq Tokyobr Chiba 1 westernbs Chiba 2 central
1
3
45
6
7
89
bl
bm
bn
bobp
bqbr
bs
preliminary dose estimation from the nuclear accident after the 2011 Great east Japan earthquake and tsunami / 21
1. INTRODUCTION
including relocation of people to reduce doses in the long term. Protective actions are discussed below together with the modelling approach adopted to account for each.
Movement of people
Evacuation – Most people within 20 kilometres of the nuclear power plant were rapidly evacuated. Therefore, the panel chose not to estimate doses in this area. Some dose may have been received prior to evacuation but the assessment of this required more precise data than were available to the panel at the time of the assessment, including detailed information about the implementation of protective actions (see Box 3).
Sheltering – Sheltering was implemented in the short term for residents within a zone be-tween 20 and 30 kilometres radius from the plant (see Box 3). It is possible that in some locations sheltering was prolonged (i.e. beyond the first few days) and in such cases it could not be observed as stringently as a very short-term measure. People would, for example, have to leave the house for at least short periods to obtain food supplies if the measure was in place for periods in excess of a few days. The panel had no access to de-tailed information on the stringency with which this countermeasure was implemented, nor the timing of the introduction of the countermeasure and its duration. Therefore, the effect of sheltering in reducing dose during the early phase of the emergency has not been considered for the present dose assessment.
However, the first year doses account for the shielding provided by buildings, resulting in reduced external radiation dose during the period of time people are assumed to be
Movement of people in the early phase of the response
In the early phase of a nuclear emergency (within the first few hours/days), urgent protective actions regarding movement of people may be implemented to prevent radiation exposure, taking into account projected doses that people may received in the short-term (e.g. effective dose within 2-7 days, thyroid dose within one week). Decisions are based on nuclear power plant conditions, amount of radioactivity actually or potentially released into the atmosphere, prevailing meteorological conditions (e.g. wind speed and direction, precipitation), and other factors. Evacuation is the urgent removal of populations within a radius around the event site, which is most effective when used as a precautionary action before an airborne release takes place. Sheltering is an urgent protective action implemented primarily to provide shielding against external exposure and by using a structure for protection from an airborne plume and/or deposited radionuclides (e.g. people being advised to remain permanently indoors with the doors and windows sealed). In contrast to sheltering, which is
an urgent action in the early phase of the emergency, people spend a proportion of time indoors as part of their normal lifestyle. The shielding provided by the building while people are indoors would reduce external exposure compared to outdoor doses, but the protection against inhalation exposure would be much less due to air exchange between the indoor and outdoor environments.
Movement of people in a later phase of the response
As environmental and human monitoring data increases, other protective actions may be implemented, taking into account the doses that a population may receive over the long-term (e.g. effective dose during one year). Temporary relocation is a non-urgent movement of people from a contaminated area to a temporary housing to avoid chronic radiation exposure. It may be a continuation of the urgent protective action of evacuation (as a longer-term action). If return after relocation is not foreseeable within one or two years, relocation is considered as permanent and is often called re-settlement.
Box 3. Movement of people
22 / preliminary dose estimation from the nuclear accident after the 2011 Great east Japan earthquake and tsunami
indoors as part of a normal lifestyle. No protection from inhalation doses for such normal indoor residency has been assumed since, in the longer term, radioactivity concentra-tions in indoor air are expected to become similar to those outdoors and the protection provided against inhalation doses would be small.
Relocation – Outside the 20 kilometre radius, inhabitants of the most affected area, coined the “deliberate evacuation area” (Figure 1), were subject to relocation at different times after the accident. For the assessment of doses in this area, only doses in the first four months of the first year have been estimated, with the assumption that relocation took place at four months, and therefore that no doses were received beyond the first four months. Information provided by the Government of Japan indicates that in parts of this zone the relocation occurred before four months.
Stable iodine uptake
Stable iodine was pre-distributed but it is thought that only a small number of persons in specific locations in Japan actually consumed stable iodine as actual consumption (as opposed to distribution) of stable iodine was not officially recommended in most places. Therefore, the Panel assumed that stable iodine tablets were not taken by members of the public, either in Japan or elsewhere.
Food and water restrictions
The assessment of ingestion doses was based on the results of all monitoring tests, in-cluding food on the market, food before shipment and food produced in the distribution-restricted areas. The assessment does not explicitly model the effect of the imposition of food restrictions.
It is known that restrictions on tap water were applied in several villages. The assessment of doses from ingestion of water in this study is cautious and is based on official data on levels of radioactivity measured in tap water not assuming any water restrictions.
1.6 ProceduresAn International Expert Panel was established to make an initial assessment of the pos-sible range of radiation doses produced as a consequence of the accident in populations inside and outside Japan. The panel consisted of independent experts, selected on the basis of their scientific competence and experience, and representatives from WHO, the International Atomic Energy Agency (IAEA) and the Food and Agriculture Organization of the United Nations (FAO). The participation of technical staff from these three United Nations agencies was essential, given the relevance of the assessment to the agencies’ respective roles, mandates and expertise.
The experts were selected on the basis of their scientific competence and experience in the assessment of human exposures arising from radioactive material in the environment. The panel included experts on internal and external dosimetry, food and water safety, public health, and radioecological modelling. The experts were required to disclose any interests. No conflicts of interest were identified for any of the participants.
preliminary dose estimation from the nuclear accident after the 2011 Great east Japan earthquake and tsunami / 23
1. INTRODUCTION
UNSCEAR has initiated a two-year assessment of the exposure levels and effects of the Fukushima accident, and its main scientific report will be submitted to the United Nations General Assembly in 2013. UNSCEAR participated in the panel as observer to ensure that approaches and data sources for the two United Nations assessments were compatible. Close cooperation was maintained while the two assessments were in progress.
Collaboration with the Government of Japan and relevant Japanese institutions was deemed to be crucial for the successful completion of the work as they provided much of the official data for the dose assessment.
The panel met on three occasions during 2011 (on 30 June in Vienna, 5−6 September in Geneva, and 13−14 October in Geneva) and chiefly worked electronically. The detailed dose calculations, not included in this report, have been shared with the participating organizations in order to inform their respective activities.
The technical work was distributed between the experts. There were three components to the dose assessment, namely:
■ Doses in Japan from external irradiation and from inhalation were assessed on the basis of measurements by both the Institute of Radiation Hygiene in Russia and the Federal Office of Radiation Protection in Germany. The two institutes used similar but not identical assumptions. These are presented in chapter 2, sections 2.3.1, 2.4.1 and 2.5.1, and are further explained in Annex 6.
■ On the basis on food monitoring data, WHO assessed estimates of dose to the Japa-nese people from ingestion of food produced in certain regions of Japan. This as-sessment also included consideration of the doses outside Japan from consumption of food produced in Japan and exported. This assessment is presented in chapter 2, section 2.6, and is further explained in Annex 8.
■ Doses in the rest of the world were assessed by the United Kingdom’s Health Protec-tion Agency on the basis of assumed source terms combined with dispersion model-ling and environmental measurement data from around the world.3 Where appropriate, this assessment assumed a methodology and input data consistent with those used in the measurement-based assessments. This assessment is presented in chapter 2, sections 2.3.2, 2.4.2 and 2.5.2, and is further explained in Annex 7 and Annex 9.
3. For the ingestion pathway outside Japan, consumption of locally-produced food was considered.
24 / preliminary dose estimation from the nuclear accident after the 2011 Great east Japan earthquake and tsunami
This chapter summarizes the approaches and input data used in the estimation of doses to population groups living in particular locations. The different exposure pathway mod-els and related assumptions are presented (see Figure 5).
2.1 ApproachesAs described in section 1.4. the dose contribution from the following four pathways was taken into account in different geographical locations within and outside Japan:
■ external exposure from radionuclides deposited on the ground (groundshine);
■ external exposure from radionuclides in the radioactive cloud (cloudshine);
■ internal exposure from inhalation of radionuclides in the radioactive cloud (inhala-tion);
■ internal exposure from ingestion of radionuclides in food and tap water (ingestion).
Several approaches were used to calculate the doses to corroborate the results. For the external radiation and inhalation pathways inside Japan, two approaches were developed using different assumptions (Approach A and Approach B), providing a range of results and a validation mechanism for the chosen methods. Outside Japan, an approach based on an atmospheric dispersion model was used (Approach C). For the ingestion pathway within Japan, a model (Approach D) based on food measurements (mainly around the Fukushima prefecture) was developed, while outside Japan an environmental model es-timating radionuclide concentrations in locally-produced food from an assumed source term (Approach E) provided the relevant data
2.2 Input dataAll the available radiological measurement data used in this assessment are publicly available on the web sites of Japan’s Ministry of Education, Culture, Sports, Science and Technology (12) and Ministry of Health, Labour and Welfare (13). The Government of Japan has provided this information to the Incident and Emergency Centre of the IAEA in Vienna on a regular and frequent basis since the Fukushima accident. The informa-tion has been collated by IAEA into a database. Relevant information available within the timescale of the assessment has been shared with the panel for the purpose of this study.
2.2.1 Radionuclide composition and deposition
Assessment of the impact of the accident requires consideration of the spectrum of all significant radionuclides released. In this assessment, this has been done through as-sumed radionuclide compositions and assumed source terms.
2. Methodology

preliminary dose estimation from the nuclear accident after the 2011 Great east Japan earthquake and tsunami / 25
2. METHODOLOGY
External and inhalation
inside Japan (Approach A, B)
External and inhalation
outside Japan (Approach C)
Ingestion inside Japan (Approach D)
Ingestion outside Japan (Approach E)
Dose model
(Annex 9)
Dose (Sv)Effective and thyroid (all ages together)
Measured food radionuclide concentration
(Bq/kg)
Dose model
(Annex 8)
Dose (Sv)Effective and thyroid
Source term
Atmospheric dispersion
model
Calculated surface activity density (Bq/m2)
and air activity density (Bq/m3)
Dose model
(Annex 7)
Dose (Sv)Effective and thyroid
Measured surface activity density
(Bq/m2)
Dose model
(Annex 6)
Dose (Sv)Effective and thyroid
Calculated food radionuclide concentration
(Bq/kg)
Calculated surface activity density
(Bq/m2)
Atmospheric dispersion
model
Source term
Figure 5. Approaches used in the assessment
Environmental model

26 / preliminary dose estimation from the nuclear accident after the 2011 Great east Japan earthquake and tsunami
Measurements of radionuclides in the environment, which form the basis of the dose as-sessment for Japan, are available for only a subset of radionuclides released in the acci-dent. Fortunately, the radionuclides that contribute most significantly to dose are repre-sented in those measurements. In this study, different radionuclides were accounted for in the various exposure pathways. The assessment of doses from inhalation and external radiation in Japan assumed a radionuclide composition for the releases which covered nine key radionuclides (see Annex 6). For the rest of the world, up to 16 radionuclides were specified in the estimated released source terms used in the study (see table A4.1 and more detailed information in Annex 4). The assessment of doses from ingestion of food in Japan was based on the measured levels of iodine-131 (131I), caesium-134 (134Cs) and caesium-137 (137Cs) in food samples reported by the Government of Japan.
At present, source term estimation for the Fukushima accident is associated with con-siderable uncertainty. The source terms used in this assessment are applied only to esti-mation of doses outside Japan. Two source terms were used as input to an atmospheric dispersion model, which are similar in terms of the overall magnitude of the main radio-nuclides released but differ in the time dependence of the releases (see Annex 4).
2.2.2 Environmental monitoring data
Environmental monitoring data for Japan include measurements of radionuclides in air, soil, foodstuffs, drinking-water and fresh water. More data are available for the areas with higher levels of radioactive material than for the less affected areas.
The environmental measurement data used as primary input to the assessment are sur-face activity densities. Measured levels of deposited radionuclides are available for all 47 Japanese prefectures, and levels in Fukushima prefecture show significant variation with location. These measurements include a very small component from the global fallout from nuclear weapons-testing.
Gamma dose rates are available from a wide range of monitoring locations in Fukushima prefecture and show considerable variation with location. Gamma dose rates are also available for the other 46 Japanese prefectures and, by September 2011, they indicated levels which were within the background range for Japan (the natural background range reported to the panel was 30–100 nSv/h, which is consistent with the data reported by the Fukushima prefecture authorities) (14).
The data on radioactivity concentrations in air are very limited. This is partly due to the failure of equipment in many locations close to the nuclear power plant as a result of the earthquake and tsunami. Where data do exist there is insufficient coverage for the early days of the release to enable the data to be used in this assessment. For this reason, ra-dioactivity concentrations in air in Japan have been derived from modelling on the basis of the measured levels of radioactivity deposition on the ground.
2.2.3 Food monitoring and consumption data
To assess exposure from radionuclides in food the International Expert Panel decided to use measurements rather than modelling wherever possible. The monitoring of food

preliminary dose estimation from the nuclear accident after the 2011 Great east Japan earthquake and tsunami / 27
2. METHODOLOGY
produced in Japan was published on the Japan's Ministry of Health Labour and Welfare web site (13). The monitoring data included the results of foods that were not distributed on the market such as marine products from Fukushima prefecture and other foods from distribution-restricted areas.
The results of food radionuclide concentration monitoring around the world have been received by the International Food Safety Authorities Network (INFOSAN)1 and compiled in a comprehensive database. Data from monitoring of food exported from Japan is gen-erally available on the web sites of the corresponding authorities.
Regarding food consumption in Japan, the Japanese National Institute for Health and Nutrition (NIHN) provided data based on the 2009 National Health and Nutrition Survey Outside Japan, food consumption data were taken from the WHO GEMS/Food consump-tion cluster diet G (15).
2.3 External radiation doses from radionuclides deposited on the ground (groundshine)
External radiation doses from radionuclides deposited on the ground (groundshine) rep-resent a significant long-term exposure pathway. For the purposes of this assessment, the external gamma dose integrated over the first year following the accident was calculated for locations both in Japan and in the rest of the world.
2.3.1 Inside Japan
In the study, two slightly different approaches (A and B) were applied to estimate the external effective and thyroid doses from radionuclides on the ground. The full details of the model are given in Annex 6 and the input parameters are provided in Annex 3.
The doses in Japan have been estimated on the basis of the measured ground deposition levels (surface activity densities). In Approach A the dose calculations were performed using dose rate coefficients, representing the values of gamma dose rate in the air (at one metre above the ground) normalized to a unit deposit of each radionuclide in com-bination with dose conversion factors to convert these to effective and thyroid doses. Approach B directly used both effective and thyroid dose coefficients per unit deposit of each radionuclide. Unlike Approach B, Approach A accounted for the shielding effect from radionuclide penetration in soil, leading to a small (approximately 5%) reduction in the estimated external doses in the first year. Finally, small differences were assumed in the composition of the deposited radionuclides, based on alternative sources for the soil contamination measurements used (see Annex 6 for references on this issue). Both approaches took into account the radioactive decay over the period for which the dose was calculated.
External doses can be significantly lower indoors than outdoors due to the shielding ef-fects of the building. This was taken into account by using a location factor of 0.4 for building type and an assumed occupancy factor of 66% (i.e. two thirds of the time per day spent indoors). Details of the method are presented in Annex 3 (Table A3.9).
1. The International Food Safety Authorities Network (INFOSAN) is a joint initiative of FAO and WHO.

28 / preliminary dose estimation from the nuclear accident after the 2011 Great east Japan earthquake and tsunami
2.3.2 Outside Japan
For the rest of the world, very few data were available on the levels of ground deposition as a result of the accident. Therefore, instead of a measurement-based approach, a mod-elling approach (Approach C) was adopted to estimate the global ground depositions re-quired to assess external doses. The calculations were undertaken with estimated source terms (Annex 4) and using atmospheric dispersion modelling to predict depositions and hence external doses using the dose coefficients (see Tables A3.6 and A3.7 in Annex 3) as in the measurement-based approach.
The doses outside Japan were based on an atmospheric dispersion model utilizing global weather data for the period of dispersion and recirculation. The United Kingdom Met Of-fice’s NAME III (Numerical Atmospheric dispersion Modelling Environment, version 5.2) dispersion model (16) was used. NAME III is a complex model used to estimate disper-sion and deposition of gases and particulates. It incorporates both radioactive decay pro-cesses and estimates of the external dose from the radioactive cloud. Input data for this model include time-varying three-dimensional meteorological data and estimations from radar-measured rainfall data and the Met Office’s numerical weather prediction unified model (17). The output represents time-averaged and time-integrated activity concentra-tions in air, and in wet, dry and total ground depositions of radionuclides.
The panel was aware that international experience using complex dispersion models such as NAME III to predict the global dispersion arising from Fukushima indicates that, at far distances, model predictions are in general substantially lower than measurements. To ensure that doses in the rest of the world are not consistently underestimated, the pre-dictions of the NAME III model for two different source terms (see Annex 4) were used in conjunction with measured concentrations of radionuclides from around the world,2 to obtain global distributions of activity concentrations in air and ground depositions for input into the dose calculations. As a result of this combined approach, the estimations of the NAME III model showed good agreement with the radiological measurements and were considered to form a sound basis for the subsequent dose estimation.
2.4 External radiation doses from the radioactive cloud (cloudshine)
2.4.1 Inside Japan
In the context of this accident, external exposure from cloudshine is of secondary impor-tance to external exposures arising from groundshine. However, it is the only pathway of relevance for noble gases, which do not deposit on the ground and for which any inhala-tion doses are negligible. Most releases of noble gases from the Fukushima site would have occurred early in the release and are not expected to provide a significant contribu-
2. These data include locations in Austria, Denmark, France, Germany, Sweden, Philippines, North America, and Alaska, but at November 2011 they were still largely unpublished. Published examples are in: (Prepara-tory Commission for the Comprehensive Nuclear-Test-Ban Organization, or CTBTO) air monitoring station data published on the web site of the Philippines Nuclear Research Institute. The United States’ Environmental Protection Agency’s RadNet data can be seen at: http://www.epa.gov/japan2011/.

preliminary dose estimation from the nuclear accident after the 2011 Great east Japan earthquake and tsunami / 29
2. METHODOLOGY
tion to radiation exposure inside Japan and thus, this exposure to noble gases has not been included in this estimation of doses inside Japan.
Because measured external dose rates were not available in sufficient locations in the first few days after the release started, it was not possible to use measurements for the assessment of external exposure from cloudshine. Instead, external doses from cloud-shine were reconstructed by modelling.
To calculate the external dose from radionuclides in the cloud, it was necessary to con-vert ground deposition levels to time-integrated activity concentrations in air. The full details of the method for estimating time-integrated activity concentrations in air from the ground deposition levels is given in Annex 6 section 2.
Two slightly different approaches were applied to estimate the external effective and thyroid doses from radionuclides in the air. In Approach A, the calculations were per-formed using dose rate coefficients representing the values of gamma dose rate in air (at one metre above the ground), normalized to a unit radionuclide concentration in the radioactive cloud in combination with factors to convert these to effective and thyroid doses. Approach B directly used effective and thyroid dose coefficients per unit air concentration. These calculations were undertaken for each radionuclide. As for deposited activity, small differences were assumed in the composition of the deposited radionuclides.
In Approach A, two different sets of radionuclide deposition velocities were applied, de-pending on the surface activity density of 137Cs, while in Approach B a single deposition velocity was assumed for all radionuclides and in all areas (assuming predominantly wet deposition).
The shielding effects of buildings in reducing external doses from radionuclides in the air was accounted for in the same way as for external radiation from radionuclides deposited on the ground (see Annex 3, Table A3.8 and Table A3.9).
The full details of the method for estimating external effective and thyroid doses from radionuclides in air are given in Annex 6.
2.4.2 Outside Japan
Outside Japan, a modelling approach to reconstruct external doses from radionuclides in the atmosphere was adopted. This modelling was based on the predictions of the NAME III model (see section 2.3.2). This was necessary because there are very few suit-able measurement data available outside Japan. The calculations were undertaken with estimated source terms (discussed in Annex 4), using atmospheric dispersion modelling to estimate concentrations in air and the semi-infinite cloud approach to assess external doses (18). The details of the method for estimating external effective and thyroid doses from radionuclides in air outside Japan are given in Annex 7.

30 / preliminary dose estimation from the nuclear accident after the 2011 Great east Japan earthquake and tsunami
2.5 Internal radiation doses from inhalationThis section summarizes the assessment methodology for the inhalation exposure path-ways. The model is described in Annex 6, and input parameters are presented in Annex 3 (Tables A3.1, A3.2 and A3.5).
2.5.1 Inside Japan
Intakes by inhalation occur during the passage of the radioactive cloud resulting from a release. There is also the possibility of additional inhalation later of material resus-pended from the ground. For the radionuclides released in the Fukushima accident, the panel agreed that resuspension is not expected to provide a significant contribu-tion to radiation exposure and this pathway was therefore not considered in this initial assessment.
Ideally, estimates of inhalation dose should be based on measurements of concentra-tions of radionuclides in air during the period of time for which the radioactive cloud is present over each location. Instantaneous measurements are not helpful unless they form part of a detailed time-series, as integrated concentrations in air are required. How-ever, because there were insufficient measurements taken in Japan of concentrations in air internal doses had to be reconstructed by modelling. To calculate the internal dose from inhalation, it was necessary to convert ground deposition levels to time-integrated activity concentrations in air, as described in Annex 6, section 3. The full details of the method for estimating internal doses from inhalation using the two approaches A and B are given in Annex 6.
The calculations in approaches A and B differ in the estimation of activity concentra-tions in air from ground deposits. As described above, for Japan the measured ground depositions have been used to estimate activity concentrations in air, taking into account generic information available on precipitation and other key factors to obtain the best scaling factor.
Most air samplers measure only particulate material, whereas radioactive iodine will have been in the atmosphere in both vapour and particulate forms. Additional assumptions are therefore required on the ratio of the different chemical forms of iodine to enable the measurements to be used in an assessment. In Approach A, a ratio of 50:50 is assumed for vapour and particulate forms of iodine, while approach B assumes 100% vapour iodine. In each case, doses have been estimated using standard ICRP dose coefficients and inhalation rates for the three age groups of interest (see Annex 3).
Neither Approach A nor Approach B assumed any protection due to being indoors for a portion of the time. Generally, sheltering indoors provides a reduction in the intakes of radioactive material through inhalation. However, to be cautious, no account has been taken here of any reduction in the indoor air compared to outdoor.
2.5.2 Outside Japan
Outside Japan, a modelling approach was adopted to reconstruct internal doses from radionuclides in the atmosphere as there are relatively few locations where a compre-hensive time-series of air concentrations is available and for which the levels are mostly

preliminary dose estimation from the nuclear accident after the 2011 Great east Japan earthquake and tsunami / 31
2. METHODOLOGY
above limits of detection. This modelling was based on the predictions of the NAME III model presented in section 2.3.2. Atmospheric dispersion calculations based on estimates of the amount of radionuclides released at different times, together with mea-sured concentrations of radionuclides around the world, have been used to estimate time-integrated activity concentrations in air at relevant locations outside Japan. These estimated time-integrated activity concentrations in air are scaled by ICRP dose coef-ficients and inhalation rates (as detailed in Annex 3) to estimate inhalation doses. More details of the method for estimating internal effective and thyroid doses from inhalation of radionuclides in air are given in Annex 7.
2.6 Internal radiation doses from ingestion of foodThis section summarizes the models for the ingestion exposure pathway. The models for calculating doses inside and outside Japan are described in Annex 8 and Annex 9 respectively. The input parameters for assessment of ingestion dose outside Japan are presented in Annex 3 (Table A.3.3 and Table A3.4).
The assessment of doses resulting from the ingestion of food containing radionuclides requires estimates of activity concentrations in food as a function of time, together with levels of consumption of the various foods for different age groups. As for the external dose and inhalation pathways, several scenarios have been used in this assessment to estimate the dose from food consumed during the first year.
2.6.1 Ingestion doses inside Japan
The results of the Japanese national food consumption survey, which provides the mean and the high consumption of some 20 food categories, were made available by the Japa-nese National Institute for Health and Nutrition (see Annex 8 for details). Due to the lack of information regarding the mean consumption of one-year-old children, the mean consumption of children aged 1−6 years was used. Over 31 000 food samples were col-lected in various areas of Japan between March and September 2011 and were moni-tored for the following three radionuclides: 131I, 134Cs and 137Cs. The results were made available through the INFOSAN network. The majority of data were from food produced in Fukushima and neighbouring prefectures.
Important assumptions were made in this estimate of food ingestion dose, as described below:
1. It was assumed that consumers only consumed food produced in the area where monitoring was implemented (i.e. in Fukushima and neighbouring prefectures). The consumption of food produced in other areas of Japan not affected by the accident would have decreased the exposure to radionuclides. Similarly, the total food self-sufficiency ratio of Japan is about 70% on a production-value basis (40% on a calorie basis) with the other 30% being imported. However, the proportion of food monitored compared with the total food on the Japanese market is not known and therefore it was decided not to use an uncertain correction factor but to assume that all food consumed was produced in the area where monitoring was implemented. Moreover the possibility cannot be excluded that a fraction of the Japanese population ate only food produced in these areas even if such a popula-

32 / preliminary dose estimation from the nuclear accident after the 2011 Great east Japan earthquake and tsunami
tion cannot be quantified. Regarding doses in Japan from food consumption, the International Expert Panel was also aware that food sourcing and normal food dis-tribution practices would additionally have been significantly altered by the impact of the tsunami, the earthquake and public protection measures, as well as by pos-sible reduced levels of consumption due to concerns over radiation. At present this effect cannot be clarified, but it results in some uncertainty in the assessment of food doses.
2. No delay between harvesting and production of foodstuffs and their consumption was considered. Although the measurements of radioactive material in foods used in this assessment were not taken at the actual time of consumption, losses due to radioactive decay between the point of "harvesting" or “marketing” and the time of consumption are not reflected in the dose estimates, nor are losses due to home preparation.
3. It was assumed that the measured radioactivity concentrations are representative of the whole food market for Fukushima and neighbouring prefectures. It has to be noted that:
a) The average radioactivity concentrations in each food category used for the estima-tion is not proportional to the consumption level of each food included in the food category. Monitoring tests have been conducted giving priority to the foods which are likely to be contaminated by radioactive material. For example, many tests were conducted on non-headed leaf vegetables which showed high level radioac-tive contamination. The proportion of tests for non-headed leaf vegetables is about 50% and that for spinach is about 25% of tests for vegetables in the first month. On the other hand, the total consumption of non-headed leaf vegetables is only about 7% among total consumption of all vegetables. This is potentially a source of overestimation.
b) Similarly foods which are not expected to be contaminated (e.g. candies, soft drinks) were not monitored. Therefore, the total average food consumption con-sidered in this assessment represents 800−900 grams (see Annex 7, Table A7.1), whereas the total average daily consumption is about 2000 grams. This is poten-tially a source of underestimation.
c) It was assumed that all the food monitored was on the market although the dataset included the results of food samples collected just for monitoring purpose (e.g. fish caught in the no-fishing areas). The food monitoring data submitted to the INFOSAN network and used in this study reflect the concentrations of activity in food mainly from Fukushima and neighbouring prefectures. Food restrictions were introduced in Japan with the aim of banning from the market those food commodi-ties produced in highly contaminated areas. However, because it is not possible to test each and every food before going to the market, the dataset includes a limited number of samples which are in excess of the food restriction levels and which were not eliminated by the enforcement measures (19, 20).
4. For both iodine and caesium radionuclides, analytical results reported to be below the level of detection were assumed to be 10 Bq/kg for each radionuclide, except
preliminary dose estimation from the nuclear accident after the 2011 Great east Japan earthquake and tsunami / 33
2. METHODOLOGY
for iodine levels after four months which were considered to be 0. For most of the measurements recorded as being below the limit of detection, the individual limits of detection were not provided. This assumption is conservative if one considers the possibilities of analytical techniques available for radionuclides for which the limit of detection (LOD) can be considerably lower than 10 Bq/kg. However, due to the need for the throughput of a large number of samples in a short time frame, less sensi-tive techniques have also been used. Overall, this assumption is considered to be a realistic estimate.
5. The contribution from iodine to the total exposure was considered to be zero from four months after the start of the release. For 131I, all samples collected after 15 July 2011 were reported to be below the limit of detection or below 10 Bq/kg. Due to the short half-life of iodine, it is appropriate to consider the levels of iodine after four months as zero (i.e. the values used are 0 rather than 10 Bq/kg).
6. The calculated effective dose and thyroid ingestion doses over the first year were es-timated by summing the doses for each of the first six months and then extrapolating the exposure of the sixth month to the remaining six months of the first year.
Staple foods (rice, fish and seafood)
As rice is a staple food in Japan, potential doses arising from the consumption of rice were specifically considered by the panel. Japanese members of the panel advised that rice is harvested in Japan annually in September, with consumption of the year’s harvest occurring throughout the subsequent 12 months (and beyond). Measured levels of activ-ity in marketed rice harvested in 2011 were available in August and September 2011 and none of the reported levels was above the limit of detection. Ingestion doses from the consumption of rice would therefore be anticipated to be very low. However, this as-sumption should be verified once further monitoring data on rice are available.
Doses from ingestion of seafood in Japan have been taken into account on the basis of measured data. The approach described for ingestion of terrestrial foods based on mea-surements was also used for seafood.
Tea leaves and spices
Radionuclides were measured in tea leaves, but not in prepared tea ready to drink, and this beverage was therefore not included in the dose estimation. At international level it is generally assumed that two grams of tea leaves are used for 100 ml of tea and that 100% of chemicals present in the leaves are migrating into the liquid. These assump-tions were not verified for the present case and were therefore not introduced in the dose assessment to avoid adding uncertainty.
Similarly, analytical results for spices, herbs and other condiments consumed in small amounts were not used in the assessment.
Several scenarios for the estimation of ingestion dose in Japan have been taken into account to cover the variability of dietary exposure within the population. These are sum-marized in Table 1 and are further described below.
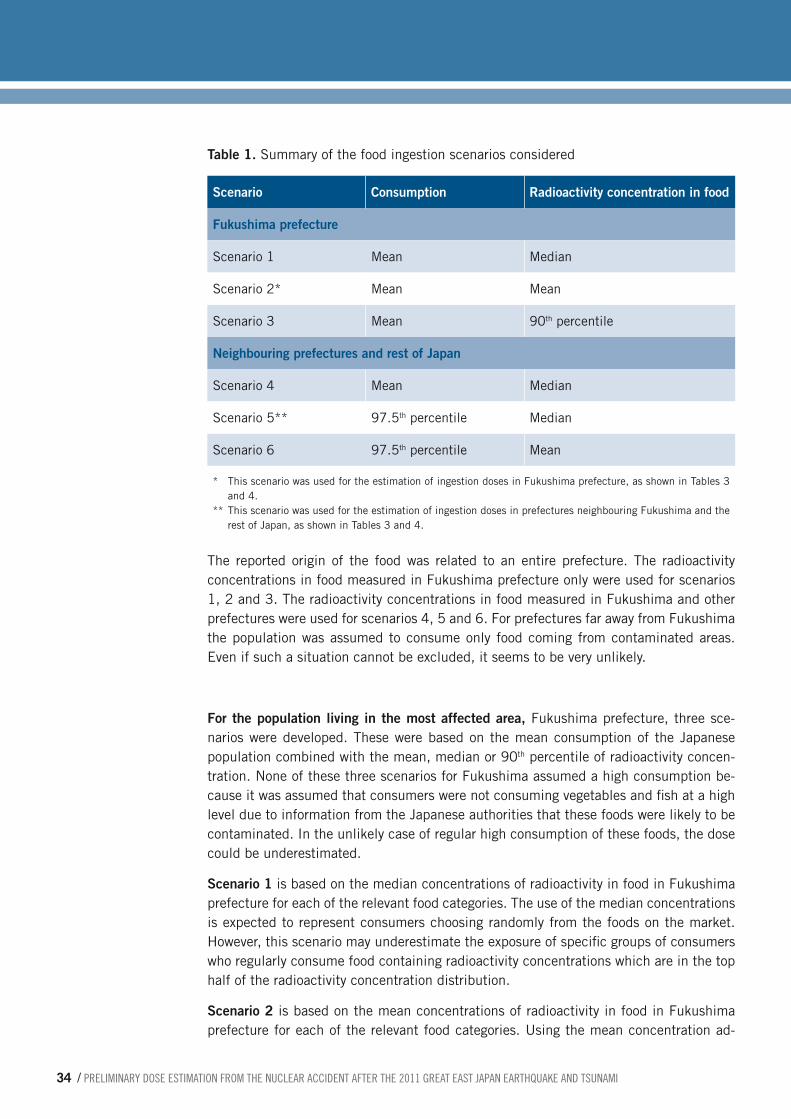
34 / preliminary dose estimation from the nuclear accident after the 2011 Great east Japan earthquake and tsunami
Table 1. Summary of the food ingestion scenarios considered
Scenario Consumption Radioactivity concentration in food
Fukushima prefecture
Scenario 1 Mean Median
Scenario 2* Mean Mean
Scenario 3 Mean 90th percentile
Neighbouring prefectures and rest of Japan
Scenario 4 Mean Median
Scenario 5** 97.5th percentile Median
Scenario 6 97.5th percentile Mean
* This scenario was used for the estimation of ingestion doses in Fukushima prefecture, as shown in Tables 3 and 4.
** This scenario was used for the estimation of ingestion doses in prefectures neighbouring Fukushima and the rest of Japan, as shown in Tables 3 and 4.
The reported origin of the food was related to an entire prefecture. The radioactivity concentrations in food measured in Fukushima prefecture only were used for scenarios 1, 2 and 3. The radioactivity concentrations in food measured in Fukushima and other prefectures were used for scenarios 4, 5 and 6. For prefectures far away from Fukushima the population was assumed to consume only food coming from contaminated areas. Even if such a situation cannot be excluded, it seems to be very unlikely.
For the population living in the most affected area, Fukushima prefecture, three sce-narios were developed. These were based on the mean consumption of the Japanese population combined with the mean, median or 90th percentile of radioactivity concen-tration. None of these three scenarios for Fukushima assumed a high consumption be-cause it was assumed that consumers were not consuming vegetables and fish at a high level due to information from the Japanese authorities that these foods were likely to be contaminated. In the unlikely case of regular high consumption of these foods, the dose could be underestimated.
Scenario 1 is based on the median concentrations of radioactivity in food in Fukushima prefecture for each of the relevant food categories. The use of the median concentrations is expected to represent consumers choosing randomly from the foods on the market. However, this scenario may underestimate the exposure of specific groups of consumers who regularly consume food containing radioactivity concentrations which are in the top half of the radioactivity concentration distribution.
Scenario 2 is based on the mean concentrations of radioactivity in food in Fukushima prefecture for each of the relevant food categories. Using the mean concentration ad-
preliminary dose estimation from the nuclear accident after the 2011 Great east Japan earthquake and tsunami / 35
2. METHODOLOGY
dresses the potential underestimation from using the median concentration (scenario 1), considering that the occurrence of radioactivity is not normally distributed. The use of the mean concentrations is still a conservative estimate since it assumes that foods containing higher-than-median levels of radioactivity are consumed regularly.
Scenario 3 is based on the 90th percentile of the distribution of the concentrations of radioactivity in food in Fukushima prefecture for each of the relevant food categories. The assumption that a consumer could consume the highest 10% of contaminated food from all food categories during a month is conservative even in the case of poten-tial hot spots.
For the populations living in neighbouring prefectures and in the rest of Japan, three scenarios were developed which combine the median or the mean concentration of ra-dioactivity in food with the mean of a high level of consumption. The high level of con-sumption is defined according to international guidance (21) as the consumption at the 97.5th percentile of the two main food contributors to radionuclide exposure and the mean consumption of other food categories. All the contributions are combined with the levels of radioactivity concentration in all samples collected in various prefectures for the corresponding food categories and are then summed. The two main contributors to ingestion doses in Japan have been identified as vegetables and fish based on the as-sumptions listed above. This scenario assumes that high consumers consume at a high level every day during a year and is therefore likely to be conservative.
Scenario 4 is based on the mean level of consumption and the median concentrations of radioactivity in food for each of the relevant food categories. The use of median con-centrations is expected to represent consumers choosing randomly from foods on the Japanese market and assumes that available results are representative of the whole Japanese food market.
Scenario 5 is based on a high level of consumption and median concentrations of radio-activity in food for each of the relevant food categories.
Scenario 6 is based on a high level of consumption and mean concentrations of radioac-tivity for all relevant food categories. The use of the mean concentrations of radioactivity is a conservative estimate for consumers eating only foods on the market and assumes that available results are representative of the whole food market. It is expected to cover the uncertainty about analytical results reported to be below the levels of detection/quantification.
2.6.2 Monitoring of Japanese food outside Japan
Several countries around the world analysed food imported from Japan, and submitted information to INFOSAN.
For countries neighbouring Japan: Information was submitted to INFOSAN regarding Japanese food exported to Australia, to China, to Hong Kong Special Administrative Re-gion (SAR), and to Indonesia. For Hong Kong SAR, 43 487 samples were tested and only three of them were higher than 100 Bq /kg for 131I on 23 March 2011. For Australia, 82
36 / preliminary dose estimation from the nuclear accident after the 2011 Great east Japan earthquake and tsunami
samples of food imported from Japan were analysed for 131I, 134Cs and/or 137Cs; all results were found to be below 2 Bq /kg. For Indonesia, 619 samples of food imported from Ja-pan were analysed for 131I, 134Cs and/or 137Cs and all results were found to be below 0.2, 0.13 and 0.8 Bq /kg respectively.
For the rest of the world: Information was submitted to INFOSAN by Austria, Canada, Germany, Greece and Lithuania. For Canada, 165 samples of food imported from Japan, 34 samples of domestic milk products and 14 pooled samples of domestic wild fishes were analysed for 131I, 134Cs and/or 137Cs; all results were below the minimum detectable concentration of about 2 Bq /kg. For the European countries, 550 samples were analysed and, with the exception of three green tea samples, all the measurements were either non-detectable or (in a few cases only) at levels close to the detection limit.
In view of these data, no further assessment was done regarding ingestion doses arising from the consumption of foods originating in Japan and exported to other countries.
2.6.3 Ingestion doses outside Japan
In the rest of the world, the ingestion doses from food produced outside Japan were calculated on the basis of assumed food consumption levels and calculation of food radionuclide concentrations by a modelling approach.
The modelling approach used to reconstruct ingestion doses was based on the predic-tions of the NAME III atmospheric dispersion model presented in section 2.3.2. As shown in Figure 5, the results of atmospheric dispersion modelling were used to estimate average doses from consumption of terrestrial foods produced in the country/region of interest in the first year following the releases. Models exist which estimate the concen-trations of radionuclides that would arise in food following a deposition on the land where the food is produced. Such models also indicate the time dependence in the build-up and fall-off of concentrations in food over time. The concentrations of radionuclides in food following an accidental release would vary rapidly as a function of time and this needs to be taken into account in estimating the doses from intakes integrated over the first year following the releases. The model used in this assessment was the FARMLAND model (22). FARMLAND was developed to represent conditions and practices in the United Kingdom and was applied in this assessment to the world. Ingestion doses for the rest of the world from locally produced food were based on food-chain model predictions, assuming agricultural practices typical of early summer. While this is a cautious assump-tion for those parts of the world where the practices at the time of the accident were more typical of cool spring conditions, it will be less conservative for warmer regions, and the assessment covers countries that span the equator and those in the northern hemisphere. However, given the overall uncertainties in the assessment, the use of such a model in other areas around the world was considered adequate to give an estimate of ingestion dose due to consumption of food from domestic production. Only doses from terrestrial foods were estimated by this method. Doses from seafood consumption in the rest of the world were considered by the International Expert Panel to be low and were not considered further.
Food consumption levels as used in the estimate of food doses outside Japan were selected from WHO’s GEMS/food data (15). For the assessment, Cluster diet G was se-
preliminary dose estimation from the nuclear accident after the 2011 Great east Japan earthquake and tsunami / 37
2. METHODOLOGY
lected, and the details are shown in Annex 9. The food consumption is based on average consumption weighted for the total population and so represents the average across all age groups; for this reason, the same consumption was applied to all age groups.
2.7 Internal doses from ingestion of tap waterTap water has many uses. Only the ingestion of tap water was taken into account in this assessment as the panel considered other uses (bathing, heating, etc) to have low radio-logical significance.
Estimates of radiation doses from the ingestion of tap water have been made based on measured activity concentrations. Doses have been estimated for the three age groups considered in the report and, additionally, for six-month-old infants drinking formula milk made with tap water. Daily per capita ingestion rates of 2 litres, 1 litre, 0.75 litre and 1.2 litres were assumed, respectively, for the age groups of adults3, 10-year-old children 3, 1-year-old infants 3 and infants fed exclusively on formula milk prepared using tap water.
Activity concentrations for 131I and 137Cs levels in tap water, as reported by each prefec-ture and published by the Japanese Ministry of Education, Culture, Sports, Science and Technology, were used for the assessment. It was cautiously assumed that consumption of tap water occurred during the whole period when activity concentration values were found. Levels were detectable only for a limited period of a few days 3 and have been as-sumed to be negligible at other times.
2.8 Doses due to the releases of radionuclides to the seaSignificant quantities of radionuclides were released to the sea following the accident. For such releases, the potentially important exposure pathways would be internal irradia-tion from the intake of radionuclides in seafood and external irradiation from radionu-clides on sand and sediment on the shore.
The external exposure pathways were not included in the assessment because the panel considered that dilution of levels in seawater would result in the doses being of signifi-cance only close to the release point, and access to this area was not permitted since it was within the exclusion zone. Other pathways such as exposure through swimming in the sea, inadvertent ingestion of sand/sediment and inhalation of resuspended material were also considered by the panel to be insignificant exposure routes and are not con-sidered further.
2.9 Summary of key assumptionsTable 2 summarizes the key assumptions made in the assessment, and indicates areas where conservative approaches have been adopted.
3. Restrictions on tap water were applied in several villages for a few days at the end of March, with the exception of Iitate where the restriction was in place until 10 May.

38 / preliminary dose estimation from the nuclear accident after the 2011 Great east Japan earthquake and tsunami
Table 2. Assumptions made in calculations
General assumptions
Source term for use in dispersion-based calculations
Two different source terms based on different approaches were used in the calculations of atmospheric dispersion (Annex 4). At the time of the assessment, source estimation for the Fukushima accident was associated with considerable uncertainty. There is a view that the releases may be somewhat underestimated (23). However, the source terms used here are considered by the panel to be the most appropriate for use at the current time. The source terms are applied in this assessment only to estimate doses in the world beyond Japan, and these estimated doses are below 0.01 mSv, the level of dose cut-off used here to present the results. An underestimate, or an overestimate, in the source terms used would therefore have little or no effect on the majority of the doses presented.
The source terms do not include information on chemical form or deposition velocity. In the absence of this information, subsequent parts of the assessment have made further assumptions that are described in Annex 4.
Assumed nuclide composition used in conjunction with measurements
The dose assessment based on ground measurements of 137Cs required an assumption about the radionuclide composition (Annex 6, Table A6.1). Values in Approach A and Approach B are similar for the key radionuclides but are not identical. The radionuclide compositions which have been measured are varying, and it is possible that in some areas the 131I to 137Cs ratio in soil may have been higher than the average value assumed here; this is an uncertainty in the assessment.
External and inhalation calculation assumptions
Reduction factor for external dose from radionuclides in air and from ground deposits
A reduction factor to represent the saving in external dose from radioactivity in the air and from ground deposits, due to being indoors for a proportion of the time, has been applied in the assessment on the basis of a location factor and building occupancy factor. On the basis of information provided by the Japanese experts and observers, the reduction effect of wooden buildings (0.4) when staying outdoors for eight hours and indoors for 16 hours was considered, giving a final reduction factor of 0.6 (Annex 3). This assumption is thought to be cautious for Japan and for much of the rest of the world.
Reduction factor for inhalation dose
No protection from inhalation dose due to being indoors for a proportion of the time has been assumed in the assessment. The factor is very uncertain, and would not in any case alter the doses significantly. However, as the reduction has been ignored, the early doses from inhalation are likely to be overestimated.
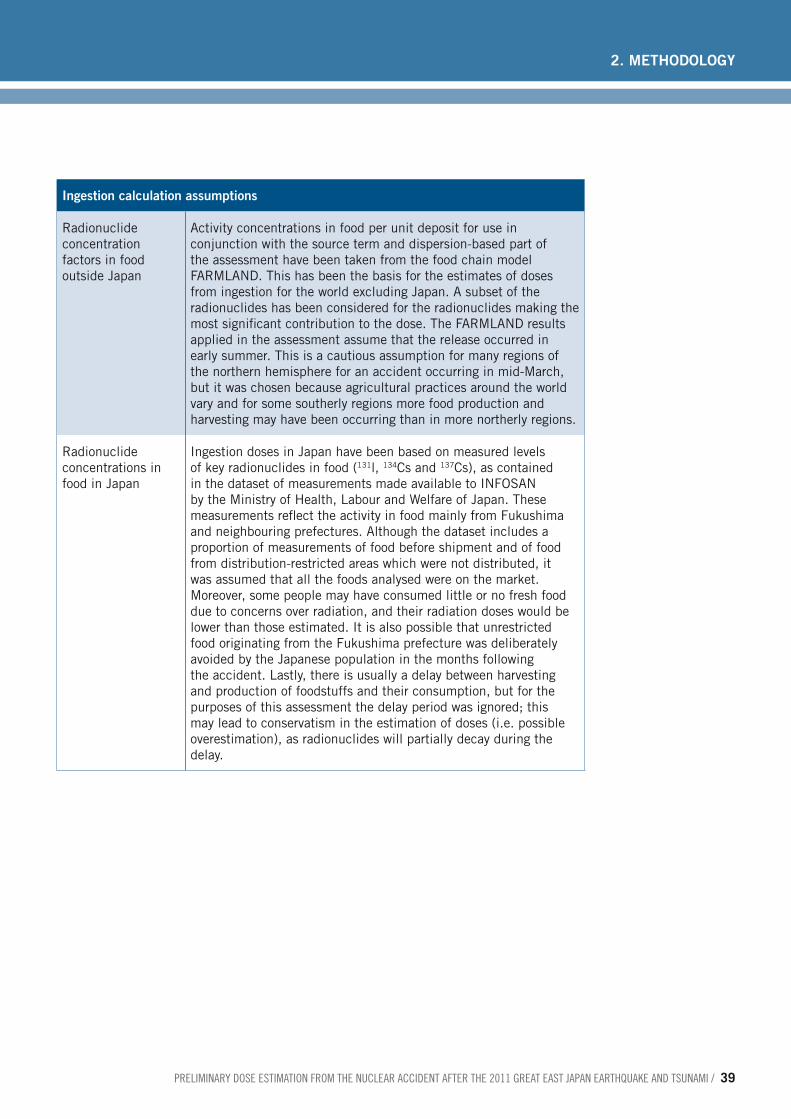
preliminary dose estimation from the nuclear accident after the 2011 Great east Japan earthquake and tsunami / 39
2. METHODOLOGY
Ingestion calculation assumptions
Radionuclide concentration factors in food outside Japan
Activity concentrations in food per unit deposit for use in conjunction with the source term and dispersion-based part of the assessment have been taken from the food chain model FARMLAND. This has been the basis for the estimates of doses from ingestion for the world excluding Japan. A subset of the radionuclides has been considered for the radionuclides making the most significant contribution to the dose. The FARMLAND results applied in the assessment assume that the release occurred in early summer. This is a cautious assumption for many regions of the northern hemisphere for an accident occurring in mid-March, but it was chosen because agricultural practices around the world vary and for some southerly regions more food production and harvesting may have been occurring than in more northerly regions.
Radionuclide concentrations in food in Japan
Ingestion doses in Japan have been based on measured levels of key radionuclides in food (131l, 134Cs and 137Cs), as contained in the dataset of measurements made available to INFOSAN by the Ministry of Health, Labour and Welfare of Japan. These measurements reflect the activity in food mainly from Fukushima and neighbouring prefectures. Although the dataset includes a proportion of measurements of food before shipment and of food from distribution-restricted areas which were not distributed, it was assumed that all the foods analysed were on the market. Moreover, some people may have consumed little or no fresh food due to concerns over radiation, and their radiation doses would be lower than those estimated. It is also possible that unrestricted food originating from the Fukushima prefecture was deliberately avoided by the Japanese population in the months following the accident. Lastly, there is usually a delay between harvesting and production of foodstuffs and their consumption, but for the purposes of this assessment the delay period was ignored; this may lead to conservatism in the estimation of doses (i.e. possible overestimation), as radionuclides will partially decay during the delay.
40 / preliminary dose estimation from the nuclear accident after the 2011 Great east Japan earthquake and tsunami
The results of the dose assessment presented in this chapter are estimated to arise as a direct result of the Fukushima Daiichi nuclear power plant accident.
3.1 Presentation of resultsResults for effective doses (Table 3) and thyroid doses (Table 4) are presented for the standard three age groups considered. The tables show the estimated individual doses for each region considered and include some example locations in the most affected part of Fukushima prefecture (see Figure 3). It should be noted that the example loca-tions considered in Fukushima prefecture are not located exactly at the positions shown in Figure 3. Dose assessment was based on input data averaged over the whole area of each town, as shown in Annex 5 for some example locations. Measurements from parts of towns located inside the evacuation zone – which stretches up to 20 km – were not considered.
The dose estimates are principally shown in order-of-magnitude dose bands, with de-creased band width at the higher levels of estimated dose. The presentation of doses to greater levels of numerical accuracy was considered by the panel to be inappropriate for this report given the inherent uncertainty of the assessment and its preliminary nature. However, the calculated values for the different scenarios were provided to the expert group working on the health risk assessment.
The dose bands simply indicate the scale of the estimate to a characteristic individual, representative of the average dose to a person living in the region or location of interest. The characteristic doses presented as dose bands are not intended to span the spread of exposures that may be received by the population of the area, as such a calculation would have required distributions of input data parameters (e.g. ranges of dietary con-sumption of population groups, types of building occupied) not available to the panel within the time frame of this preliminary assessment.
In general, the dose assessment has considered the committed doses resulting from be-ing resident in the area for one year after the accident. This is with the exception of a few locations in the most affected part of Fukushima prefecture (in the deliberate evacuation zone, outside the 20-kilometre immediate evacuation zone) where the dose was calculated for the first four months after the accident, thus taking into account relocation measures.
3.2 Age dependence of dose estimates For both effective and thyroid doses, the age dependence was accounted for through the use of appropriate age-dependent inhalation and ingestion dose coefficients, inhalation rates and external doses per unit deposit (Annex 3). For younger children, the dose coef-
3. Results

preliminary dose estimation from the nuclear accident after the 2011 Great east Japan earthquake and tsunami / 41
3. RESULTS
ficients tend to be higher due to their smaller size and hence the effective and thyroid dose can also be higher for infants and children. However this does not invariably lead to the predicted doses to infants and children being higher due to other factors, such as lower intake rates.
Doses to the fetus and breastfed infant have also been considered in this assessment. It was recognized that, in general, doses to the embryo, fetus and breastfed infant need to be calculated explicitly only when the unborn child or breastfed infant could receive higher doses than children or adults. Doses in Japan, as a result of inhalation and inges-tion, are dominated by isotopes of caesium and iodine. For both inhalation and ingestion of isotopes of caesium, the fetus and breastfed infant will receive lower doses than the mother. For inhalation and ingestion of isotopes of iodine, the fetus will receive doses similar to or less than the dose to the mother. For isotopes of iodine, including 131I, the breastfed infant may receive doses of up to a factor of 2 higher than the mother. Dose coefficients for the embryo, fetus and breastfed infant have been issued by ICRP (24, 25, 26, 27) and guidance on their application has been published (28). The panel con-cluded that, overall, the differences in dose between the fetus, the breastfed infant and the mother are small and that the differences are insignificant in terms of the overall accuracy of this preliminary assessment.
3.3 Geographical distribution of doses In this section, the results for estimated effective doses and thyroid doses are summa-rized for different areas of the world. The relative contribution of the different pathways is provided in Tables 3 and 4.
3.3.1 Estimated effective doses
■ Of the example locations considered in Fukushima prefecture, several are in the area 20–30 km from the site where characteristic effective doses in the first year, to all age groups, are estimated to be in the dose band of 10–50 mSv. The dominant pathway in these locations is estimated to be external dose from ground deposits but there are also contributions from the other exposure pathways. In these locations, only the first four months of exposure from external dose have been included as it has been as-sumed that relocation would have occurred at that time.
■ At other locations considered as examples in Fukushima prefecture, the characteristic effective doses in the first year, to all age groups, are estimated to be in the range 1−10 mSv. In these locations the major exposure pathways are external dose from ground deposition and ingestion doses.
■ In prefectures neighbouring Fukushima, characteristic effective doses in the first year, to all age groups, are estimated to be in the dose band of 0.1–10 mSv. This wider range of dose band for these neighbouring prefectures reflects the wide variation in deposition levels across these areas. The dominant pathway here is estimated to be external dose from ground deposits.
■ In other Japanese prefectures, characteristic effective doses in the first year, to all age groups, are estimated to be in the dose band of 0.1–1 mSv, with the dominant pathway being food ingestion.

42 / preliminary dose estimation from the nuclear accident after the 2011 Great east Japan earthquake and tsunami
■ In countries neighbouring Japan, characteristic effective doses in the first year, to all age groups, are estimated to be less than 0.01 mSv, with the dominant pathway being ingestion of locally-produced food.
■ For the rest of the world, characteristic effective doses in the first year, to all age groups, are also estimated to be less than 0.01 mSv, and are usually far below this level. Again, the dominant pathway is ingestion of locally produced food.
3.3.2 Estimated thyroid doses
■ For most of Fukushima prefecture, the estimated characteristic thyroid doses in the first year, to all age groups, are in the dose band of 10–100 mSv. The exception is Namie town in Futaba county, which lies partially within the 20km restricted area and the deliberate evacuation area (Figure 1). Dose estimates were calculated for the part of the town located in the area 20–30 km from the site, showing thyroid doses to in-fants within the dose band of 100−200 mSv. In several of the most affected locations, the doses were estimated only for the first four months, as relocation was assumed to have occurred at that time. It should be noted that a significant contributor to thyroid dose in some of these locations is inhalation1 of the early radioactive cloud. Earlier relocation, at for example two months, would not have reduced thyroid doses signifi-cantly. Such reduction would only have been obtained if early evacuation had occurred prior to the arrival of the radioactive cloud.
■ In the locations in Fukushima prefecture that are further away from the site, the domi-nant contributor to thyroid dose is food ingestion .
■ In other Japanese prefectures the characteristic thyroid doses in the first year, to all age groups, are estimated to be in the dose band of 1–10 mSv. The dominant pathway here is estimated to be food ingestion .
■ For the rest of the world, characteristic thyroid doses in the first year, to all age groups, are estimated to be less than 0.01 mSv and are usually far below this level. The domi-nant pathway is ingestion of locally produced food.
The numerical values of the estimated doses to the thyroid are higher than the estimated effective doses. Although the units are the same, these are two different quantities that cannot be compared (see section 1.5.1 and Box 1) .
3.3.3 Doses to the southern hemisphere
The dose assessment for the world apart from Japan, which has been based on atmo-spheric dispersion modelling, has not included consideration of regions in the southern hemisphere (with the exception of countries which span the equator) because doses in the southern hemisphere are expected to be considerably smaller than those in the northern hemisphere and extensive time would have be required to model full global dispersion in both hemispheres over the period considered in this assessment.
Global circulation models for krypton-85 suggest that after one year the integrated ac-tivity in the southern hemisphere (from a release in the northern hemisphere) is ap-proximately 15% of the average activity over the northern hemisphere. For Fukushima
1. Since protection from inhalation exposure due to being indoors for a proportion of the time has not been gene-rally assumed in this assessment, the early doses from inhalation are likely to be somewhat overestimated.

preliminary dose estimation from the nuclear accident after the 2011 Great east Japan earthquake and tsunami / 43
3. RESULTS
radionuclides this value is cautious because it was derived for a noble gas which does not deposit and also assumes that the gas is dispersed uniformly and instantaneously throughout the northern hemisphere.
It was noted that, for the first four weeks after the start of the release, the radioactive ma-terials remained confined to the northern hemisphere, with the equator initially acting as a dividing line between the northern and southern air masses. From mid-April radioactive material was detected at stations located in Australia, Fiji, Malaysia and Papua New Guin-ea, indicating some spread to the southern hemisphere of the Asia Pacific region (29).
The panel therefore considered that doses in the southern hemisphere in the first year after a release in the northern hemisphere are likely to be considerably lower – of the order of one fifth and probably less − than those in the northern hemisphere.
3.4 Results for food ingestion doses in JapanThe estimation of doses from food is an important factor in the assessment of overall doses, especially outside Fukushima prefecture. For Fukushima prefecture the estimated effective dose from food per month was highest in month 1 and decreased until month 6. The highest estimated exposures using the assumptions applied in this study are to infants aged one year.
To provide a single estimate of the food contribution, the doses in Table 3 and Table 4 include the estimate described as scenario 2 and 5 in Table 1 (section 2.6.1). The es-timated effective dose to all age groups in Fukushima prefecture from one year’s intake of radionuclides in food is less than 2 mSv, while the estimated thyroid dose from food to all age groups in Fukushima prefecture from one year's intake is less than 40 mSv. Based on the selected scenarios described above, the dietary exposure assessment for other prefectures is about two times lower than those estimated for Fukushima prefec-ture. Doses from ingestion of food estimated using the other scenarios outlined in sec-tion 2.6.1 would remain of the same order of magnitude both for Fukushima prefecture and all other prefectures. It should be noted that the dietary exposure assessment is for a Japanese consumer consuming exclusively food produced in areas where the food moni-toring was implemented. Therefore, assuming that the monitoring data do not underes-timate the food radioactivity concentration, the more conservative scenario (i.e. scenario 3 and scenario 6) should be seen as an absolute upper bound of the dietary exposure.
3.5 Results for tap waterThe panel’s assessment indicated that the doses from tap water were low in comparison with doses from other pathways. Also, the assessment undertaken was a simple scoping calculation based on maximum detected levels in tap water. Therefore, the estimated doses from drinking tap water have not been incorporated into the dose estimates pre-sented here. Even if cautiously assessed, the highest effective doses were estimated to be less than 0.1 mSv and the highest thyroid doses were estimated to be at most about 2 mSv (in both cases the maximum dose was estimated to be for 6-month-old infants fed on formula milk prepared using tap water).
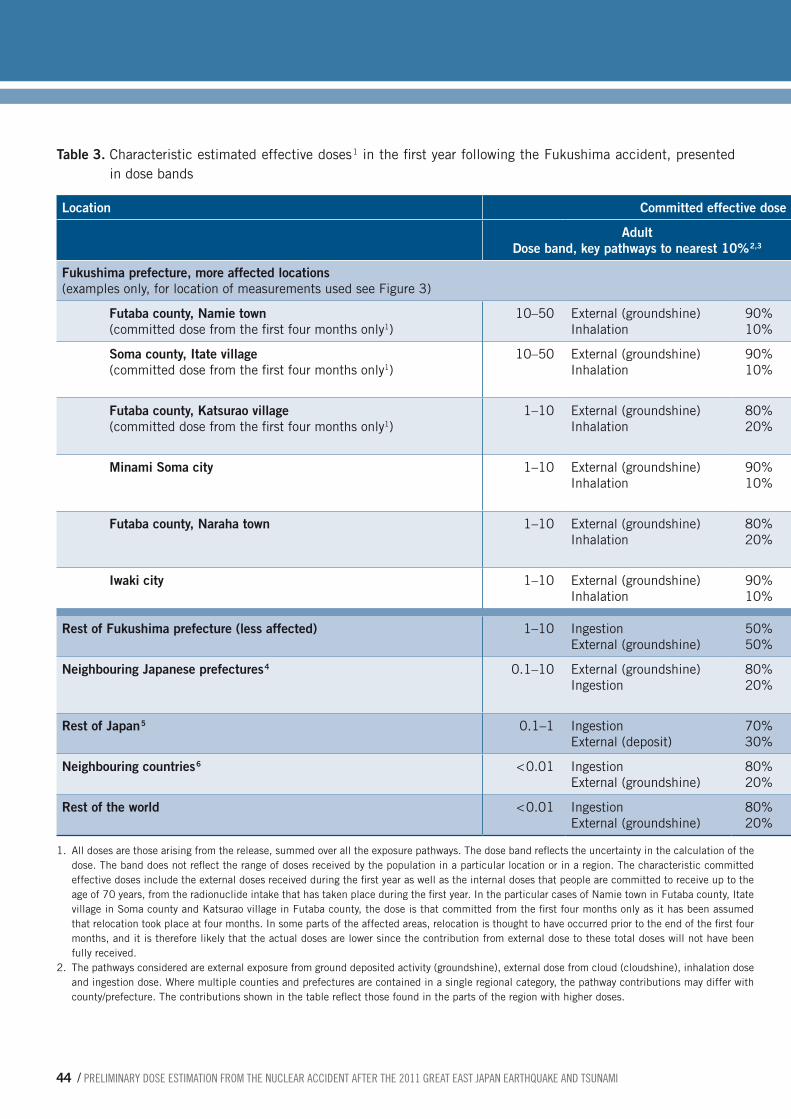
44 / preliminary dose estimation from the nuclear accident after the 2011 Great east Japan earthquake and tsunami
Table 3. Characteristic estimated effective doses 1 in the first year following the Fukushima accident, presented in dose bands
Location Committed effective dose in first year following accident, mSv
Adult Dose band, key pathways to nearest 10% 2,3
Child (10 years) Dose band, key pathways to nearest 10% 2,3
Infant (1 year) Dose band, key pathways to nearest 10% 2,3
Fukushima prefecture, more affected locations (examples only, for location of measurements used see Figure 3)
Futaba county, Namie town (committed dose from the first four months only1)
10–50 External (groundshine) Inhalation
90% 10%
10–50 External (groundshine) Inhalation
90% 10%
10–50 External (groundshine) Inhalation
90% 10%
Soma county, Itate village (committed dose from the first four months only1)
10–50 External (groundshine) Inhalation
90% 10%
10–50 External (groundshine) Inhalation Ingestion
80% 10% 10%
10–50 External (groundshine) Inhalation Ingestion
80% 10% 10%
Futaba county, Katsurao village (committed dose from the first four months only1)
1–10 External (groundshine) Inhalation
80% 20%
1–10 External (groundshine) Inhalation Ingestion
80% 10% 10%
1–10 External (groundshine) Inhalation Ingestion
70% 20% 10%
Minami Soma city 1–10 External (groundshine) Inhalation
90% 10%
1–10 External (groundshine) Ingestion Inhalation
80% 10% 10%
1–10 External (groundshine) Ingestion Inhalation
80% 10% 10%
Futaba county, Naraha town 1–10 External (groundshine) Inhalation
80% 20%
1–10 External (groundshine) Ingestion Inhalation
80% 10% 10%
1–10 External (groundshine) Ingestion Inhalation
80% 10% 10%
Iwaki city 1–10 External (groundshine) Inhalation
90% 10%
1–10 External (groundshine) Ingestion
60% 40%
1–10 External (groundshine) Ingestion
60% 40%
Rest of Fukushima prefecture (less affected) 1–10 Ingestion External (groundshine)
50% 50%
1–10 Ingestion External (groundshine)
50% 50%
1–10 Ingestion External (groundshine)
80% 20%
Neighbouring Japanese prefectures 4 0.1–10 External (groundshine) Ingestion
80% 20%
0.1–10 External (groundshine) Ingestion Inhalation
80% 10% 10%
0.1–10 External (groundshine) Ingestion
80% 20%
Rest of Japan 5 0.1–1 Ingestion External (deposit)
70% 30%
0.1–1 Ingestion External (groundshine)
70% 30%
0.1–1 Ingestion External (groundshine)
80% 20%
Neighbouring countries 6 < 0.01 Ingestion External (groundshine)
80% 20%
< 0.01 Ingestion External (groundshine)
80% 20%
< 0.01 Ingestion External (groundshine)
80% 20%
Rest of the world < 0.01 Ingestion External (groundshine)
80% 20%
< 0.01 Ingestion External (groundshine)
80% 20%
< 0.01 Ingestion External (groundshine)
80% 20%
1. All doses are those arising from the release, summed over all the exposure pathways. The dose band reflects the uncertainty in the calculation of the dose. The band does not reflect the range of doses received by the population in a particular location or in a region. The characteristic committed effective doses include the external doses received during the first year as well as the internal doses that people are committed to receive up to the age of 70 years, from the radionuclide intake that has taken place during the first year. In the particular cases of Namie town in Futaba county, Itate village in Soma county and Katsurao village in Futaba county, the dose is that committed from the first four months only as it has been assumed that relocation took place at four months. In some parts of the affected areas, relocation is thought to have occurred prior to the end of the first four months, and it is therefore likely that the actual doses are lower since the contribution from external dose to these total doses will not have been fully received.
2. The pathways considered are external exposure from ground deposited activity (groundshine), external dose from cloud (cloudshine), inhalation dose and ingestion dose. Where multiple counties and prefectures are contained in a single regional category, the pathway contributions may differ with county/prefecture. The contributions shown in the table reflect those found in the parts of the region with higher doses.
3. The food dose for Fukushima prefecture is based on scenario 2 (see Table 1 on mean intakes and mean food radioacti-vity concentrations). The food dose for neighbouring prefectures and the rest of Japan is based on scenario 5 (see Table 1 on high intakes and median food radioactivity concentrations). The estimation was conducted by using all the results of monitoring tests, including tests for food which were not distributed. For the rest of the world, food doses were based on the predictions of the FARMLAND model, and the food consumption from WHO’s GEMS database Cluster diet G.
4. The neighbouring Japanese prefectures considered were Chiba, Gunma, Ibaraki, Miyagi and Tochigi. A larger dose band is seen for these neighbouring prefectures, reflecting a wide variation on deposition levels across these areas.
5. For the rest of Japan, exposure from food is the dominant pathway. In this location where food was not monitored, it was assumed that people consumed only food coming from Fukushima and neighbouring prefectures, which is a very conservative assumption. Therefore, for the rest of Japan the doses are clearly overestimated.
6. The neighbouring countries and regions to Japan considered in this table were Far Eastern Russia, Indonesia, Philip-pines, Republic of Korea, and South-East Asia.

preliminary dose estimation from the nuclear accident after the 2011 Great east Japan earthquake and tsunami / 45
3. RESULTS
Table 3. Characteristic estimated effective doses 1 in the first year following the Fukushima accident, presented in dose bands
Location Committed effective dose in first year following accident, mSv
Adult Dose band, key pathways to nearest 10% 2,3
Child (10 years) Dose band, key pathways to nearest 10% 2,3
Infant (1 year) Dose band, key pathways to nearest 10% 2,3
Fukushima prefecture, more affected locations (examples only, for location of measurements used see Figure 3)
Futaba county, Namie town (committed dose from the first four months only1)
10–50 External (groundshine) Inhalation
90% 10%
10–50 External (groundshine) Inhalation
90% 10%
10–50 External (groundshine) Inhalation
90% 10%
Soma county, Itate village (committed dose from the first four months only1)
10–50 External (groundshine) Inhalation
90% 10%
10–50 External (groundshine) Inhalation Ingestion
80% 10% 10%
10–50 External (groundshine) Inhalation Ingestion
80% 10% 10%
Futaba county, Katsurao village (committed dose from the first four months only1)
1–10 External (groundshine) Inhalation
80% 20%
1–10 External (groundshine) Inhalation Ingestion
80% 10% 10%
1–10 External (groundshine) Inhalation Ingestion
70% 20% 10%
Minami Soma city 1–10 External (groundshine) Inhalation
90% 10%
1–10 External (groundshine) Ingestion Inhalation
80% 10% 10%
1–10 External (groundshine) Ingestion Inhalation
80% 10% 10%
Futaba county, Naraha town 1–10 External (groundshine) Inhalation
80% 20%
1–10 External (groundshine) Ingestion Inhalation
80% 10% 10%
1–10 External (groundshine) Ingestion Inhalation
80% 10% 10%
Iwaki city 1–10 External (groundshine) Inhalation
90% 10%
1–10 External (groundshine) Ingestion
60% 40%
1–10 External (groundshine) Ingestion
60% 40%
Rest of Fukushima prefecture (less affected) 1–10 Ingestion External (groundshine)
50% 50%
1–10 Ingestion External (groundshine)
50% 50%
1–10 Ingestion External (groundshine)
80% 20%
Neighbouring Japanese prefectures 4 0.1–10 External (groundshine) Ingestion
80% 20%
0.1–10 External (groundshine) Ingestion Inhalation
80% 10% 10%
0.1–10 External (groundshine) Ingestion
80% 20%
Rest of Japan 5 0.1–1 Ingestion External (deposit)
70% 30%
0.1–1 Ingestion External (groundshine)
70% 30%
0.1–1 Ingestion External (groundshine)
80% 20%
Neighbouring countries 6 < 0.01 Ingestion External (groundshine)
80% 20%
< 0.01 Ingestion External (groundshine)
80% 20%
< 0.01 Ingestion External (groundshine)
80% 20%
Rest of the world < 0.01 Ingestion External (groundshine)
80% 20%
< 0.01 Ingestion External (groundshine)
80% 20%
< 0.01 Ingestion External (groundshine)
80% 20%
1. All doses are those arising from the release, summed over all the exposure pathways. The dose band reflects the uncertainty in the calculation of the dose. The band does not reflect the range of doses received by the population in a particular location or in a region. The characteristic committed effective doses include the external doses received during the first year as well as the internal doses that people are committed to receive up to the age of 70 years, from the radionuclide intake that has taken place during the first year. In the particular cases of Namie town in Futaba county, Itate village in Soma county and Katsurao village in Futaba county, the dose is that committed from the first four months only as it has been assumed that relocation took place at four months. In some parts of the affected areas, relocation is thought to have occurred prior to the end of the first four months, and it is therefore likely that the actual doses are lower since the contribution from external dose to these total doses will not have been fully received.
2. The pathways considered are external exposure from ground deposited activity (groundshine), external dose from cloud (cloudshine), inhalation dose and ingestion dose. Where multiple counties and prefectures are contained in a single regional category, the pathway contributions may differ with county/prefecture. The contributions shown in the table reflect those found in the parts of the region with higher doses.
3. The food dose for Fukushima prefecture is based on scenario 2 (see Table 1 on mean intakes and mean food radioacti-vity concentrations). The food dose for neighbouring prefectures and the rest of Japan is based on scenario 5 (see Table 1 on high intakes and median food radioactivity concentrations). The estimation was conducted by using all the results of monitoring tests, including tests for food which were not distributed. For the rest of the world, food doses were based on the predictions of the FARMLAND model, and the food consumption from WHO’s GEMS database Cluster diet G.
4. The neighbouring Japanese prefectures considered were Chiba, Gunma, Ibaraki, Miyagi and Tochigi. A larger dose band is seen for these neighbouring prefectures, reflecting a wide variation on deposition levels across these areas.
5. For the rest of Japan, exposure from food is the dominant pathway. In this location where food was not monitored, it was assumed that people consumed only food coming from Fukushima and neighbouring prefectures, which is a very conservative assumption. Therefore, for the rest of Japan the doses are clearly overestimated.
6. The neighbouring countries and regions to Japan considered in this table were Far Eastern Russia, Indonesia, Philip-pines, Republic of Korea, and South-East Asia.

46 / preliminary dose estimation from the nuclear accident after the 2011 Great east Japan earthquake and tsunami
Table 4. Characteristic estimated thyroid doses 1 in the first year following the Fukushima accident, in dose bands
Location Committed equivalent dose to thyroid in first year following accident, mSv
Adult Dose band, key pathways to nearest 10% 2,3
Child (10 years) Dose band, key pathways to nearest 10% 2,3
Infant (1 year) Dose band, key pathways to nearest 10% 2,3
Fukushima prefecture, more affected locations (examples only, for location of measurements used see Figure 3)
Futaba county, Namie town (committed dose from the first four months only1)
10–100 Inhalation External (groundshine) Ingestion
50% 40% 10%
10–100 Inhalation External (groundshine) Ingestion
60% 30% 10%
100–200 Inhalation External (groundshine) Ingestion
50% 30% 20%
Soma county, Itate village (committed dose from the first four months only1)
10–100 Inhalation External (groundshine) Ingestion
40% 40% 20%
10–100 Inhalation External (groundshine) Ingestion
50% 30% 20%
10–100 Inhalation Ingestion External (groundshine)
40% 40% 20%
Futaba county, Katsurao village (committed dose from the first four months only1),
10–100 Ingestion Inhalation External (groundshine)
40% 40% 30%
10–100 Ingestion Inhalation External (groundshine)
50% 30% 20%
10–100 Ingestion Inhalation External (groundshine)
60% 30% 10%
Minami Soma city 10–100 External (groundshine) Ingestion Inhalation
40% 40% 20%
10–100 Ingestion External (groundshine) Inhalation
50% 30% 20%
10–100 Ingestion External (groundshine) Inhalation
60% 20% 20%
Futaba county, Naraha town 10–100 Ingestion External (groundshine) Inhalation
40% 40% 20%
10–100 Ingestion External (groundshine) Inhalation
50% 30% 20%
10–100 Ingestion External (groundshine) Inhalation
70% 20% 10%
Iwaki city 1–10 Ingestion External (groundshine)
80% 20%
10–100 Ingestion External (groundshine) Inhalation
80% 10% 10%
10–100 Ingestion External (groundshine)
90% 10%
Rest of Fukushima prefecture (less affected) 1–10 Ingestion External (groundshine) Inhalation
80% 10% 10%
10–100 Ingestion External (groundshine)
90% 10%
10–100 Ingestion External (groundshine)
90% 10%
Neighbouring Japanese prefectures 4 1–10 External (groundshine) Ingestion Inhalation
40% 30% 30%
1–10 Ingestion External (groundshine) Inhalation
40% 30% 30%
1–10 Ingestion External (groundshine) Inhalation
60% 20% 20%
Rest of Japan 5 1–10 Ingestion External (groundshine)
90% 10%
1–10 Ingestion 100% 1–10 Ingestion 100%
Neighbouring countries 6 < 0.01 Ingestion External (groundshine)
90% 10%
< 0.01 Ingestion External (groundshine)
90% 10%
< 0.01 Ingestion 100%
Rest of the world < 0.01 Ingestion Inhalation External (groundshine)
70% 20% 10%
< 0.01 Ingestion Inhalation External (groundshine)
70% 20% 10%
< 0.01 Ingestion Inhalation External (groundshine)
80% 10% 10%
1. All doses are those arising from the release, summed over all the exposure pathways. The dose band reflects the uncertainty in the calculation of the dose. The band does not reflect the range of doses received by the population in a particular location or in a region. The characteristic committed thyroid doses include the external doses received during the first year as well as the internal doses that people are committed to receive up to the age of 70 years, from the radionuclide intake that has taken place during the first year. In the particular cases of Namie town in Futaba county, Itate village in Soma county and Katsurao village in Futaba county, the dose is that committed from the first four months only as it has been assumed that relocation took place at four months. In some parts of the affected areas, relocation is thought to have occurred prior to the end of the first four months, and it is therefore likely that the actual doses are lower since the contribution from external dose to these total doses will not have been fully received.
2. The pathways considered are external exposure from ground deposited activity (groundshine), external dose from cloud (cloudshine), inhalation dose and ingestion dose. Where multiple counties and prefectures are contained in a single regional category, the pathway contributions may differ with county/prefecture. The contributions shown in the table reflect those found in the parts of the region with higher doses.
3. The food dose for Fukushima prefecture is based on scenario 2 (see Table 1 on mean intakes and mean food radioactivity concentrations). The food dose for neighbouring prefectures and the rest of Japan is based on scenario 5 (see Table 1 on high intakes and median food radioactivity concentrations). The estimation was conducted by using all the results of monitoring tests, including tests for food which were not distributed. For the rest of the world, food doses were based on the predictions of the FARMLAND model, and the food consumption from WHO’s GEMS database Cluster diet G.
4. The neighbouring Japanese prefectures considered were Chiba, Gunma, Ibaraki, Miyagi and Tochigi. A larger dose band is seen for these neighbouring prefectures, reflecting a wide variation on deposition levels across these areas.
5. For the rest of Japan, exposure from food is the dominant pathway. In this location where food was not monitored, it was assumed that people consumed only food coming from Fukushima and neighbouring prefectures, which is a very conserva-tive assumption. Therefore, for the rest of Japan the doses are clearly overestimated.
6. The neighbouring countries and regions to Japan considered in this table were Far Eastern Russia, Indonesia, Philippines, Republic of Korea, and South-East Asia.

preliminary dose estimation from the nuclear accident after the 2011 Great east Japan earthquake and tsunami / 47
3. RESULTS
Table 4. Characteristic estimated thyroid doses 1 in the first year following the Fukushima accident, in dose bands
Location Committed equivalent dose to thyroid in first year following accident, mSv
Adult Dose band, key pathways to nearest 10% 2,3
Child (10 years) Dose band, key pathways to nearest 10% 2,3
Infant (1 year) Dose band, key pathways to nearest 10% 2,3
Fukushima prefecture, more affected locations (examples only, for location of measurements used see Figure 3)
Futaba county, Namie town (committed dose from the first four months only1)
10–100 Inhalation External (groundshine) Ingestion
50% 40% 10%
10–100 Inhalation External (groundshine) Ingestion
60% 30% 10%
100–200 Inhalation External (groundshine) Ingestion
50% 30% 20%
Soma county, Itate village (committed dose from the first four months only1)
10–100 Inhalation External (groundshine) Ingestion
40% 40% 20%
10–100 Inhalation External (groundshine) Ingestion
50% 30% 20%
10–100 Inhalation Ingestion External (groundshine)
40% 40% 20%
Futaba county, Katsurao village (committed dose from the first four months only1),
10–100 Ingestion Inhalation External (groundshine)
40% 40% 30%
10–100 Ingestion Inhalation External (groundshine)
50% 30% 20%
10–100 Ingestion Inhalation External (groundshine)
60% 30% 10%
Minami Soma city 10–100 External (groundshine) Ingestion Inhalation
40% 40% 20%
10–100 Ingestion External (groundshine) Inhalation
50% 30% 20%
10–100 Ingestion External (groundshine) Inhalation
60% 20% 20%
Futaba county, Naraha town 10–100 Ingestion External (groundshine) Inhalation
40% 40% 20%
10–100 Ingestion External (groundshine) Inhalation
50% 30% 20%
10–100 Ingestion External (groundshine) Inhalation
70% 20% 10%
Iwaki city 1–10 Ingestion External (groundshine)
80% 20%
10–100 Ingestion External (groundshine) Inhalation
80% 10% 10%
10–100 Ingestion External (groundshine)
90% 10%
Rest of Fukushima prefecture (less affected) 1–10 Ingestion External (groundshine) Inhalation
80% 10% 10%
10–100 Ingestion External (groundshine)
90% 10%
10–100 Ingestion External (groundshine)
90% 10%
Neighbouring Japanese prefectures 4 1–10 External (groundshine) Ingestion Inhalation
40% 30% 30%
1–10 Ingestion External (groundshine) Inhalation
40% 30% 30%
1–10 Ingestion External (groundshine) Inhalation
60% 20% 20%
Rest of Japan 5 1–10 Ingestion External (groundshine)
90% 10%
1–10 Ingestion 100% 1–10 Ingestion 100%
Neighbouring countries 6 < 0.01 Ingestion External (groundshine)
90% 10%
< 0.01 Ingestion External (groundshine)
90% 10%
< 0.01 Ingestion 100%
Rest of the world < 0.01 Ingestion Inhalation External (groundshine)
70% 20% 10%
< 0.01 Ingestion Inhalation External (groundshine)
70% 20% 10%
< 0.01 Ingestion Inhalation External (groundshine)
80% 10% 10%
1. All doses are those arising from the release, summed over all the exposure pathways. The dose band reflects the uncertainty in the calculation of the dose. The band does not reflect the range of doses received by the population in a particular location or in a region. The characteristic committed thyroid doses include the external doses received during the first year as well as the internal doses that people are committed to receive up to the age of 70 years, from the radionuclide intake that has taken place during the first year. In the particular cases of Namie town in Futaba county, Itate village in Soma county and Katsurao village in Futaba county, the dose is that committed from the first four months only as it has been assumed that relocation took place at four months. In some parts of the affected areas, relocation is thought to have occurred prior to the end of the first four months, and it is therefore likely that the actual doses are lower since the contribution from external dose to these total doses will not have been fully received.
2. The pathways considered are external exposure from ground deposited activity (groundshine), external dose from cloud (cloudshine), inhalation dose and ingestion dose. Where multiple counties and prefectures are contained in a single regional category, the pathway contributions may differ with county/prefecture. The contributions shown in the table reflect those found in the parts of the region with higher doses.
3. The food dose for Fukushima prefecture is based on scenario 2 (see Table 1 on mean intakes and mean food radioactivity concentrations). The food dose for neighbouring prefectures and the rest of Japan is based on scenario 5 (see Table 1 on high intakes and median food radioactivity concentrations). The estimation was conducted by using all the results of monitoring tests, including tests for food which were not distributed. For the rest of the world, food doses were based on the predictions of the FARMLAND model, and the food consumption from WHO’s GEMS database Cluster diet G.
4. The neighbouring Japanese prefectures considered were Chiba, Gunma, Ibaraki, Miyagi and Tochigi. A larger dose band is seen for these neighbouring prefectures, reflecting a wide variation on deposition levels across these areas.
5. For the rest of Japan, exposure from food is the dominant pathway. In this location where food was not monitored, it was assumed that people consumed only food coming from Fukushima and neighbouring prefectures, which is a very conserva-tive assumption. Therefore, for the rest of Japan the doses are clearly overestimated.
6. The neighbouring countries and regions to Japan considered in this table were Far Eastern Russia, Indonesia, Philippines, Republic of Korea, and South-East Asia.

48 / preliminary dose estimation from the nuclear accident after the 2011 Great east Japan earthquake and tsunami
4.1 Temporal distribution of the doseThe pattern of radionuclide deposition shortly after a nuclear accident depends on the composition of the release and the prevailing meteorological conditions, particularly wind direction and occurrence of precipitations (e.g. rain, snow) during the passage of the cloud. Short-lived radionuclides, such as I131 (eight days half-life), are the main contributors to human exposure in the short term while in the longer term, only a few ra-dionuclides dominate, such as 134Cs (two-year half-life) and 137Cs (30-year half-life) (30).
The experience of the Chernobyl accident shows that the effective dose rate decreased within the first year after the accident mainly due to radioactive decay of short-lived ra-dionuclides (e.g. iodine), but during the following decade the decrease was due mainly to radioactive decay of caesium and its migration into the soil (8,31). The shielding effect of this radionuclide migration in the soil was an important factor in reducing lifetime doses. About 30% of the lifetime effective dose was delivered during the first year and about 70% during the first 15 years (31).
In the Chernobyl accident, 137Cs was the dominant radionuclide in the longer term, with a ratio between 134Cs and 137Cs of around 0.5. In contrast, in the Fukushima Daiichi nuclear power plant accident this ratio is close to 1 (32) and this will influence the tem-poral distribution of the lifetime dose. Indeed, the ratio between the shorter-lived 134Cs and 137Cs observed in Fukushima indicates that the fraction of the lifetime dose to be delivered beyond the first year would be lower than in Chernobyl.
This report presents effective doses and thyroid doses committed in the first year after the Fukushima accident, based on data available to the International Expert Panel up to mid-September 2011. Therefore, it includes extrapolations to estimate one-year doses.
The radiation doses received in the second and subsequent years after a nuclear acci-dent are expected to be considerably less than in the first year, even without application of remedial actions (33). In the present assessment, an estimation of doses beyond the first year was not performed as it would have resulted in a great degree of uncertainty. Besides the natural mechanisms mentioned above, the projection of doses has to take into consideration a number of other factors such as the implementation of long-term remedial actions which would further reduce radiation exposure.
4.2 Influence of protective actions on the doseDoses have not been estimated for the zone within 20 kilometres from the Fukushima Daiichi site because most people in the area were evacuated rapidly and an accurate es-
4. Discussion

preliminary dose estimation from the nuclear accident after the 2011 Great east Japan earthquake and tsunami / 49
4. DISCUSSION
timation of dose to these individuals would require more precise data than were available to the panel at the time of this assessment.
Outside the 20-kilometre radius, several example locations in the deliberate evacua-tion area were considered, for which only doses in the first four months of the first year were estimated1. On the basis of information provided by the Government of Japan (34), relocation occurred earlier in some areas and the effective doses and thyroid doses to relocated people in such areas would be expected to be lower than those presented here. Examples of the temporal distribution of effective dose and thyroid dose during the first four months are presented in Figure 6. For instance, in areas where relocation occurred at two months instead of four months as assumed, the external doses from groundshine would be reduced by about one third but the dose from early pathways (inhalation2 and external dose from cloudshine) would remain unchanged. The contribution to the dose from those early pathways would only be reduced in case of evacuation prior to the arrival of the radioactive cloud.
In the zone between 20 and 30 kilometres from the Fukushima Daiichi site the effect of sheltering in reducing dose during the early phase of the emergency was not accounted for, as discussed in 1.5.5. Sheltering can reduce external doses significantly, and inhala-tion doses to some extent. It is estimated that, for a typical Japanese house, this effect would be about a factor of 2−3 during the time of sheltering (35) which can typically be applied only for a few days. The influence of this protective action on the estimated dose over the first year would be very small.
The assessment has assumed that no stable iodine was taken, either in Japan or else-where. Therefore the estimated equivalent thyroid doses are higher than those expected in people who have undergone thyroid blocking to reduce the uptake of radioactive io-dine.
The food monitoring data used in this study reflect the concentrations of activity in food mainly from Fukushima and neighbouring prefectures. It was assumed that all the foods analysed were available on the market though results of monitoring tests for foods which were not distributed were included. A small percentage of food as monitored had radio-activity levels exceeding the food restriction levels that were implemented. However, since total control of all foods and complete enforcement cannot be assumed, these higher levels were not excluded from the analysis.
Further protective measures (e.g. more stringent regulatory standards) as well as reme-dial actions (e.g. clean-up of buildings, remediation of soils and vegetation, treatment of agricultural fields, waste management) may be taken in the future to significantly decrease dose rates and therefore reduce longer-term doses.
1. The example locations considered in the assessment (all in the deliberate evacuation area) where the doses were calculated only from zero to four months after the accident rather than for the full first year were Namie town in Futaba county, Itate village in Soma county, and Katsurao village in Futaba county.
2. Since protection from inhalation exposure due to being indoors for a proportion of the time has not been assu-med in this assessment, the early doses from inhalation are likely to be somewhat overestimated.

50 / preliminary dose estimation from the nuclear accident after the 2011 Great east Japan earthquake and tsunami
Figure 6. Temporal distribution of the dose to a child aged 10 years living in the most affected locations of the Fu-kushima prefecture over the first 4 months following the accident: (a) effective dose and (b) thyroid dose
6a. Cumulative effective dose, including relative pathway contribution
6b. Cumulative thyroid dose, including relative pathway contribution
100%
80%
60%
40%
20%
0%
57%
79%5%
15%
0.8%
98.3%
1.7%
98.8%
1.2%
99.2%
0.8%
16%
Month 2
14%
Month 3Month 1
13%
Month 4
Effe
ctiv
e do
se (%
)
Cloudshine
Inhalation
Ingestion
Groundshine
100%
80%
60%
40%
20%
0%
79%
51% 87%
13%
92%
8%
93%
7%25%
23%
Month 2 Month 3Month 1 Month 4
Thyr
oid
dose
(%)
Cloudshine
Inhalation
Ingestion
Groundshine
8%
7%6%

preliminary dose estimation from the nuclear accident after the 2011 Great east Japan earthquake and tsunami / 51
4. DISCUSSION
4.3 Contribution of the different exposure pathways The exposure pathways that contribute most to the effective dose vary with location and distance from the site. In the most affected regions of Fukushima prefecture, external exposure from groundshine is by far the dominant pathway contributing to effective dose, but with increasing distance from the site the ingestion pathway becomes the main con-tributor to the effective dose.
The exposure pathways that contribute most to the thyroid doses also vary with location and distance from the site. Internal exposure from inhalation and external exposure from groundshine are the most important contributors to the thyroid dose in the most affected areas of Fukushima prefecture. With increasing distance from the site (e.g. less affected areas of Fukushima), the ingestion pathway becomes dominant for thyroid doses. This relative dominance can be related to the fact that estimated thyroid doses from inges-tion are the same in all the prefectures, whereas the other two pathways (i.e. inhalation and external exposure from groundshine) are very dependent on the specific location and significantly decrease with distance. The relative contribution of ingestion to the thyroid doses is therefore higher in locations with relatively low contamination and vice versa.
4.4 Comparison to doses from other radiation sourcesThe doses calculated give an indication of the impact of the accident in different parts the world. To put these results in perspective, the estimated doses are compared with exposures arising from other sources (see Figures 7 and 8 and Annex 2).
Cosmic rays
Terrestrial radioactivity
Radioactivity in air
(mainly radon)
Contribution to the total
annual average dose
OthersMedical sources
Contribution to the total
annual average dose
Radioactivity in food and
drinking water
100%
42%
16%13%
9%
100%
20%
<0.01%
Natural sources
Artificialsources
Figure 7. Relative contribution of different sources to the annual average effective dose, worldwide.

52 / preliminary dose estimation from the nuclear accident after the 2011 Great east Japan earthquake and tsunami
Comparison with examples of levels of effective dose
Exposure to natural sources of radiation
Effective dose due to medical exposures
Regulations/guidance
0.005 mSv Dental X-ray
0.02 mSv Chest X-ray
0.7 mSv abdomen/pelvis X-ray
1.0 mSv lumbar spine X-ray
2.0 mSv head CT scan
15 mSv abdomen/pelvis CT scan
0.3–20 mSv usual average effective doses for nuclear medicine imaging procedures
5–70 mSv usual average effective doses for interventional procedures
1.0 mSv is the annual effective dose limit established for members of the public in planned exposure situations (limits do not apply to existing or emergency exposure situations)
10 mSv is approximately the annual effective dose corresponding to the reference level of radon concentration in air of residential dwellings
20 mSv per year is the maximum effective dose proposed as reference level for planning long term protective actions after an emergency is over (i.e. during an existing exposure situation).
100 mSv is the maximum effective dose proposed as a reference level recommended for urgent protective actions during emergency exposure situations. 20-100 mSv
is the recommended range in emergency planning of annual residual effective dose after urgent protective actions have been taken.
100 mSv per year is the annual average effective dose in very high background radiation areas in Iran.
500 mSv is the highest effective dose adopted as a guidance value for restricting exposure of emergency workers under exceptional circumstances (i.e. lifesaving actions, prevention of catastrophic conditions that could significantly affect people and the environment).
50 mSv effective dose in a single year is the limit for occupational exposure of workers, provided that the total dose over five consecutive years does not exceed 100 mSv (i.e. this means an average effective dose of 20 mSv per year).
0.01 mSv would be the level of effective dose for a visitor who stay one hour inside an archaeological site (e.g. Egyptian tomb) due to external exposure from rocks and internal exposure from radon inhalation
0.01 mSv is the level of effective dose below which radioactive sources can be exempted from regulatory control
0.1 mSv is the effective dose due to exposure to cosmic rays during some transoceanic flights (may be higher in transpolar flights during solar flares).One stop Seoul-Montreal or NY-Tokyo 0.1 mSvNonstop NY- Tokyo: 0.07 mSvNonstop Buenos Aires-Paris; London-NY: 0.035 mSv
2.4 mSv is the worldwide annual average effective dose from natural sources
3–15 mSv is the annual average effective dose in some high background radiation areas in the world (e.g. Brazil, China, India, Iran).
0.1 mSv is the individual dose criterion (IDC) to establish guidance levels of radionuclides in drinking water in normal situations (i.e. not applicable in emergency exposure situations)
10-20 mSv per year is the range of effective dose proposed as reference level for protective actions in the emergency aftermath (i.e. during an existing exposure situation).
Figure 8. Comparative radiation effective dose levels in different contexts

preliminary dose estimation from the nuclear accident after the 2011 Great east Japan earthquake and tsunami / 53
4. DISCUSSION
According to the radiation protection system recommended by the ICRP, individuals can be exposed to radiation as members of the public (public exposures), for medical purpos-es (medical exposures), or as a result of their work (occupational exposures). Moreover, people can be exposed to radiation sources in different situations:
■ Planned exposure situations that arise from the planned operation of a radiation source or from any planned activity that results in an exposure to a radiation source (e.g. a radiological medical procedure);
■ Existing exposure situations which already exist when a decision on the need for con-trol has to be taken (e.g. radon in dwellings, chronic exposures in the recovery phase after an accident).
■ Emergency exposure situations that arise as a result of an accident, a malicious act, or any other unexpected event (e.g. a nuclear emergency)
The doses to members of the public calculated in this report for the first year after the Fukushima Daiichi nuclear power plant accident can be compared with the levels of hu-man exposure to radiation in other emergency exposure situations such as the Chernobyl nuclear power plant accident (8,36).
The doses calculated in this report can be also compared with the levels of human ex-posure under planned and existing exposure situations. When making such comparisons it should be taken into account that exposures resulting from the Fukushima Daiichi nuclear power plant accident were received under unique/exceptional circumstances (a nuclear accident combined with other disasters) while planned and existing radiation exposures are radiation exposures occur in the daily life under normal conditions.
On a daily basis people are exposed to radiation from natural and man-made sources in the environment (see Box 4). There can be large variability in the dose received by individual members of the population depending on where they live, their dietary preferences and oth-er lifestyle conditions. A worldwide average annual dose from natural background radiation is about 2.4 mSv, with a typical range of 1–10 mSv in various regions of the world (37).
The International Basic Safety Standards (BSS) for Protection Against Ionizing Radiation and for the Safety of Radiation Sources (38) provide the requirements for protection and
People are exposed to radiation on a daily basis. UNSCEAR has estimated that the global average effective dose per person from all natural and manmade sources of radiation in the environment is approximately 3.0 mSv/year. Annual average doses and typical ranges of individual doses are presented in Table A2.1 in Annex 2 (37).].
About 80% of the annual radiation dose that a person receives is due to natural radiation coming from the cosmos, the earth and naturally-occurring radioactive materials in food and drink. People receive a radiation
dose of several millisieverts every year through this natural exposure (on average, 2.4 mSv) (37). Due to geological differences, several parts of the world have high natural background radiation areas where people can receive annual effective doses significantly higher than the global average.
Human exposure to ionizing radiation also comes from industrial and medical applications. Today, the most significant manmade sources of human exposure to ionizing radiation are radiological medical investigations and treatment (40).
Box 4. Background radiation exposure

54 / preliminary dose estimation from the nuclear accident after the 2011 Great east Japan earthquake and tsunami
safety that serve as a basis for the development of a regulatory framework, including dose limits and reference levels such as the following ones:
■ An effective dose of 50 mSv in a single year is the dose limit for occupational expo-sure of workers, provided that the annual effective dose averaged over five consecutive years does not exceed 20 mSv (i.e. not more than 100 mSv in five years) (38).
■ The internationally agreed reference level of 300 Bq/m3 of radon concentration in air of residential dwellings represents approximately an annual effective dose of 10 mSv (38,39).
■ An annual effective dose of 1 mSv is the dose limit for public exposure (38).
The International Commission on Radiological Protection (ICRP) provides reference levels to be applied after an accident. During the emergency phase, a reference level between 20 and 100 mSv per year is proposed to implement protective actions driven by urgency, taking into account the prevailing conditions. Once the emergency is over, a reference level for existing exposure situations between 1 and 20 mSv per year is proposed (30).
Doses below 10 μSv (0.01 mSv) are regarded by the international radiological protection community as small. An annual dose of 10 μSv corresponds to the radiological criteria for exemption3 of materials from the need of regulatory control and for clearance4 of ma-terials from any further regulatory control as described in the International Basic Safety Standards (BSS) for Protection Against Ionizing Radiation and for the Safety of Radiation Sources (38).
4.5 Comparison of different methodologiesIn this report the dose estimates for Japan, based entirely on monitoring data (Ap-proach A, B), have been compared to the dispersion modelling approach (Approach C). The estimates of doses based on the predictions of the NAME III model for Japan are broadly consistent with the doses based on measured levels.
Similarly, the dose estimates outside Japan, based entirely on the dispersion modelling approach, were validated against an approach based on monitoring data for dose assess-ment of external exposure for population of the Russian Far East. Dose reduction factors averaged for the first year after deposition were calculated on the basis of Russian loca-tion factors depending on the time since deposition and Russian seasonal occupancy factors based on the Chernobyl experience, as follows:
■ rural environment 0.27−0.43;
■ settlements, small towns 0.17−0.37;
■ urban environment (cities, towns) 0.15−0.32.
3. In the context of BSS, exemption is the determination by a regulatory body that a source or practice need not be subject to some or all aspects of regulatory control on the basis that the exposure and the potential exposure due to the source or practice are too small to warrant the application of those aspects, or that this is the optimum option for protection irrespective of the actual level of the doses or risks.
4. In the context of BSS, "clearance" means the removal of regulatory control by the regulatory body from radioac-tive material or radioactive objects within notified or authorized practices.

preliminary dose estimation from the nuclear accident after the 2011 Great east Japan earthquake and tsunami / 55
4. DISCUSSION
The estimations using the two different approaches showed some discrepancies that may be linked to the modelling of deposition processes or to the assumed magnitude and temporal variability of the source terms.
4.6 Comparison with in vivo human measurementsAfter the Fukushima accident, levels of radioactivity in humans have been measured both in Japan and elsewhere. Both thyroid monitoring and whole body monitoring were undertaken in Japan. In addition to Japanese human monitoring, measurements were taken in France and Germany on people returning to these countries after a stay in Ja-pan, and measurements were undertaken on Russian citizens in Tokyo. These in vivo human measurements are important as they enable some comparison between doses estimated on the basis of measured levels of radioactivity in individuals and the assessed doses presented in this report in Tables 3 and 4.
However, there are significant differences in the nature of the doses estimated by the two methods which should be borne in mind when the estimated doses are compared:
■ The in vivo human measurements are a snapshot of the levels in the human body at a particular time, and therefore obviously do not include intakes that may take place later over the first year. The doses derived from these measurements reflect this tim-ing. The thyroid/whole body monitoring results include the contribution to thyroid/whole body content from intakes into the body only up to the time of the measurement In contrast, the estimated doses in this assessment include intakes for the whole first year.
■ The results of the thyroid/whole body monitoring may not consider the contribution of short-lived radionuclides, depending on the time when the monitoring was performed. In contrast, all the estimated doses in this assessment include the contribution from 131I, a short-lived radionuclide that may significantly contribute to thyroid doses.
■ The measurements reflect only radioactivity incorporated into the body by internal exposure. In contrast, the estimated doses in this assessment include the dose to the thyroid/whole body arising from both internal exposure (inhalation and/or ingestion) and external exposure (from groundshine and cloudshine). It should be noted that ex-ternal exposure is a significant contributor to the thyroid/whole body dose in the most affected areas (see Section 4.3).
■ The monitored individuals are not necessarily representative of the population char-acterized by the assumptions adopted in this report. The exact locations of the indi-viduals on whom the measurements were taken, their habits and behaviour, as well as detailed information on the protective actions taken by those individuals (e.g. whether they were in affected locations at the time the radioactive cloud was present) can sig-nificantly influence the levels of exposure, resulting in an heterogeneous distribution of individual exposures. Thus the extent to which the assumptions made in this study are relevant to the monitored individuals is unclear.
It is therefore anticipated that the estimated doses based on in vivo human monitoring will in general be smaller than the doses assessed in this study, which are estimated for the full first year and include both internal and external exposures

56 / preliminary dose estimation from the nuclear accident after the 2011 Great east Japan earthquake and tsunami
4.6.1 Monitoring in Japan
Thyroid monitoring of children in Japan
The panel had access to the results of the thyroid monitoring of 1080 children living5 in Iitate village, Kawamata town and Iwaki city in Fukushima prefecture. The monitor-ing was undertaken between 24 and 30 March 2011. No detectable radioactive iodine was found in 60% of those measured. The Japanese authorities estimated thyroid doses based on these measurements, indicating that 93% of the children monitored had re-ceived thyroid doses less than 10 mSv and estimating that the maximum value from these measurements indicated a dose to the thyroid of around 50 mSv in the first year.
Thyroid monitoring in Japan by Russian researchers
Preliminary results of a dose estimate based on thyroid measurements of 131I for Russian citizens in Tokyo have indicated that the maximum estimate of equivalent dose to the thyroid reached a few millisieverts for the period of interest, assuming that all intake was by inhalation during the first day of fallout in Tokyo on 15 March 2011 (41). The dose estimate based on these monitoring results excludes the external irradiation contribution to dose and the long-term ingestion doses. The characteristic thyroid doses estimated in this study for non-neighbouring prefectures in Japan, for all age groups, range from 1 to 10 mSv. These doses are not directly comparable with the doses assessed by the Russian researchers on the basis of thyroid monitoring, as the doses based on monitoring results exclude the external irradiation contribution to dose and the longer-term ingestion doses whereas the estimated dose ranges from the study presented in this report include the external irradiation contribution to dose and ingestion doses from the first year’s intake. The total first year thyroid dose in this study, for non-neighbouring prefectures, is domi-nated by the contribution from the ingestion pathway; a proportion of the ingestion dose will be included in the Russian dose estimates based on thyroid monitoring, but not all.
Whole body measurements in Japan
Whole body measurements undertaken in Japan were also made available to the panel. The individuals monitored are understood by the panel to be inhabitants of the “restrict-ed area” and the “deliberate evacuation area” – mostly residents of Iitate, Kawamata and Namie.6 In total, the results of monitoring on 3373 residents were available to the panel by mid-September. On the basis of these data, it was concluded by the Japanese authori-ties that the internal effective radiation exposure doses for 134Cs and 137Cs were less than 2 mSv in total in all individuals monitored, and the great majority (99.8%) were less than 1 mSv, assuming that the intake of radioactivity into the body occurred by inhalation on 12 March 2011. As for the thyroid doses, these estimated effective doses assessed by the Japanese authorities on the basis of whole body monitoring are not directly compa-
5. The precise evacuation status of the children was not known to the panel at the time of the assessment (e.g. whether they had been resident in the locations at the time the radioactive cloud was present, whether they had been evacuated prior to the monitoring being undertaken, or whether they were still in the locations at the time of monitoring).
6. As for the thyroid monitoring results, the precise evacuation status of the individuals for whom whole body monitoring was undertaken was not known to the panel (e.g. whether they had been resident in the locations at the time the radioactive cloud was present, whether they had been evacuated prior to the monitoring being undertaken, or whether they were still in the locations at the time of monitoring).

preliminary dose estimation from the nuclear accident after the 2011 Great east Japan earthquake and tsunami / 57
4. DISCUSSION
rable with the effective doses assessed in the study presented in this report. The doses based on monitoring results exclude the external irradiation contribution to dose and the longer-term ingestion doses, whereas the estimated dose ranges from the study pre-sented in this report include the external irradiation contribution to dose and ingestion doses from the first year’s intake, and are dominated (with a contribution of 80−90%) by the external dose from deposited activity, which is not included in the whole body mea-surements. Doses from internal contamination are estimated to contribute only 10−20% of the total first-year effective dose, and are estimated to be of the order of a few mSv.
4.6.2 Monitoring outside Japan
Data from France are for areas less than 100 kilometres from the site of release and include detailed travel information for each individual (42). For Germany, the results are for people returning to Germany from Japan and do not include travel information (43).
In vivo measurements performed in Germany after the Fukushima accident
Between 14 March and 13 September 2011, 360 in vivo measurements – whole body, thyroid measurements or both – were performed in Germany for people (mostly adults) returning from Japan. For some of the returning people, the location of residence in Ja-pan after the accident is known. This includes people returning from the prefectures of Chiba, Fukushima, Miyagi and Tokyo.
In 63 people (20% of all those examined), radionuclides above the detection limit were detected, most of them in March 2011. In April, measurable amounts of radionuclides were detected in six people, in May measurable amounts were detected in three peo-ple, and between June and September measurable amounts were detected in another 15 people. The detected radionuclides include 131I, 132Te, 132I, 134Cs and 137Cs.
The maximum amount of radionuclides reported for the whole body were 980 Bq for 131I, 280 Bq for 132Te and 132I, 550 Bq for 137Cs and 640 Bq for 134Cs. The maximum amount of 131I found in the thyroid was 500 Bq.
Dose assessments were made for some of the measurements above the detection limit. These indicated a maximum value of effective dose of about 0.5 mSv, and a maximum value for thyroid dose of about 1 mSv. The assessed doses based on these monitoring results exclude the external irradiation contribution to dose and the ingestion doses from intakes after the time of measurement.
In vivo measurements performed in France after the Fukushima accident
The French data are for areas relatively close to the site of release, and include detailed travel information for each individual (42). From 14 March to 30 August 2011, 250 whole body measurements and 250 thyroid measurements were taken on 250 people, mostly adults, returning from areas 80 kilometres around the Fukushima site. In addi-tion, 90 urine measurements were performed.
Among the 250 people who were measured, 146 were examined in March, 32 in April, 20 in May, 12 in June, 25 in July, and 21 in August. The radionuclides for which detec-tion was attempted were: 54Mn, 58Co, 60Co, 110mAg, 124Sb, 131I, 132I, 132Te, 134Cs, 137Cs and 90Sr. The detected radionuclides were 131I in 99 persons, 132Te in 19 persons, 137Cs in

58 / preliminary dose estimation from the nuclear accident after the 2011 Great east Japan earthquake and tsunami
12 persons, 132I in nine persons, 134Cs in two persons, 125I in one person and 129I in one person. All the urine measurements were below the limit of detection.
Dose calculations were performed for those people in whom measureable activity was found. The average effective dose was estimated to be 0.006 mSv (range 0.0003–0.09 mSv) and the average thyroid equivalent dose was estimated to be 0.098 mSv (range 0.005–1.4 mSv). The doses based on these monitoring results exclude the external ir-radiation contribution to dose and the longer-term ingestion doses.
The characteristic thyroid doses estimated in this study for the less affected parts of Fu-kushima prefecture and for neighbouring and non-neighbouring prefectures range from 1−10 mSv for adults. These doses are not directly comparable with the doses assessed by the French and German researchers on the basis of thyroid monitoring. The doses based on monitoring results exclude the external irradiation contribution to dose and the longer-term ingestion doses, whereas the estimated dose ranges from the study presented in this report include the external irradiation contribution to dose and ingestion doses from the first year’s intake. For adults in the less affected parts of Fukushima prefecture and in neighbouring and non-neighbouring prefectures, the contribution to the total first-year thyroid dose from external irradiation is approximately 10–40% and the contribution of ingestion doses from the first year’s intake to the total first-year thyroid dose is 30−90%, depending on location. A proportion of the ingestion dose will be included in the French and German dose estimates based on thyroid monitoring, but not all.
The characteristic effective doses estimated in this study for the less affected parts of Fukushima prefecture and for neighbouring and non-neighbouring prefectures range from 0.1 to 10 mSv for adults. These doses are not directly comparable with the doses assessed by the French and German researchers on the basis of whole body monitor-ing. The doses based on monitoring results exclude the external irradiation contribution to dose and the longer-term ingestion doses, whereas the estimated dose ranges from the study presented in this report include the external irradiation contribution to dose and ingestion doses from the first year’s intake. For adults in the less affected parts of Fukushima prefecture and in neighbouring and non-neighbouring prefectures, the con-tribution to the total first-year effective dose from external irradiation is approximately 30–80% and the contribution of ingestion doses from the first year’s intake to the total first-year effective dose is 20−70%, depending on location. A proportion of the ingestion dose will be included in the French and German dose estimates based on whole body monitoring, but not all.
The doses from internal contamination are estimated to be of the order of 1 mSv or less.
The estimates of both effective and thyroid doses assume generic anatomical and physi-ological human data based on the reference person as defined by the ICRP and through the use of the ICRP values of the inhalation and ingestion dose coefficients. Ingestion and inhalation dose estimates presented in this report remain based on the standard ICRP dosimetry, but it is recognized that these coefficients may result in some overesti-mation of doses arising from inhaled and ingested intakes for the Japanese population (see section 4.7.4).
preliminary dose estimation from the nuclear accident after the 2011 Great east Japan earthquake and tsunami / 59
4. DISCUSSION
In summary, taking into consideration the assumptions applied, the doses implied by both the thyroid measurements and the whole body measurements may be regarded as broadly in accordance with the doses estimated in the assessment. The apparent discrepancies reflect the distinction between the estimated doses in this study being an attempt to assess the full dose commitment arising from the first year after the accident, and the doses assessed on the basis of in vivo human monitoring which only reflect the internal exposure pathways at the time of the monitoring. It can be concluded that the comparison gives confidence that the estimated results in this study are neither underes-timating nor very significantly overestimating the doses in Japan, and that the methodol-ogy and data used are robust.
Box 5 describes an ongoing study in Fukushima prefecture that includes calculation of external doses and compares its preliminary findings to those of the International Expert Panel. The dose band reported in this study is of the same order of magnitude as the dose band of 1−10 mSv estimated in this report for the most affected area of Fukushima prefecture, with the exception of two example locations where the effective doses were estimated to be in a dose band of 10−50 mSv. Given the conservative assumptions adopted by the International Expert Panel when detailed information was not available, both assessments may be regarded as broadly in accordance.
Fukushima prefecture and Fukushima Medical University have begun a health management survey of some 2 million Fukushima residents, in cooperation with the National Institute of Radiological Sciences (NIRS). This survey includes questions on the actions of the residents for the period 11 March to 11 July 2011 (four months), including information about individuals' behaviours, movements, habits, and intakes of locally produced food and milk. NIRS developed an external dose calculation system based on the information collected through the survey and developed dose rate maps using data calculated by the System for Prediction of Environmental Emergency Dose Information (SPEEDI) and environmental monitoring data reported by the Ministry of Education, Culture, Sports, Science and Technology. Before estimating individual doses for each resident, NIRS carried out an initial estimation of exposures based on the identification of 18 evacuation patterns for residents from the area within 20 kilometres of the Fukushima Daiichi nuclear power plant (patterns 1−12) and for residents from the "deliberate evacuation area" (patterns 13−18). As this report was being finalized, first estimated doses for 1727
residents in Kawamata town, Namie town and Iitate village were published by Fukushima prefecture, indicating external dose estimations in a dose band of 0−15 mSv. New data for 9747 residents became available, indicating estimated external doses of less than 1 mSv for 57.8% of the residents, with a maximum external dose of 23 mSv (44, 45). This external dose estimation is not directly comparable to the characteristic effective doses estimated in this report for these example locations because:
■ input data includes modelling by SPEEDI and dose rate maps;
■ it is based on an actual survey among residents that provided more detailed information about the timing of the implementation of protective measures;
■ it includes residents from inside and outside the 20 kilometre zone;
■ it includes external exposure pathways which in these locations are the major contributors to the ef-fective dose, and it excludes the internal exposure pathways (inhalation and ingestion) which are less relevant in these locations.
Box 5. Survey of 2 million Fukushima prefecture residents
60 / preliminary dose estimation from the nuclear accident after the 2011 Great east Japan earthquake and tsunami
4.7 Main sources of uncertainty and limitationsAn earlier section has summarized the key assumptions made in the assessment, with an indication of where conservative but realistic assumptions have been made, although in some places it has been necessary to adopt a cautious position because of the lack of information. The assessment has been based on the best data available to the Inter-national Expert Panel at the time of the assessment. Several methods and assumptions have been used to assess doses, and for validation purposes the assessment results have been compared with human monitoring data. However, a quantitative uncertainty analy-sis has not been possible due to the early nature of this study and the lack of statistical input distributions. As a result of these multiple approaches, the panel considers the assessment to be as robust as possible at this time.
While estimated doses are presented mostly in order-of-magnitude dose bands of char-acteristic individual doses for each region considered, it cannot be expected that doses to all individuals within each region will necessarily lie within the order-of-magnitude dose bands presented here. Considerable variations occur in the results of environmental monitoring (e.g. in levels of radionuclides on the ground) within a region. In general, dose rates decline with increasing distance from the nuclear power plant, but in the north-westerly direction some increase is observed with distance, reflecting the significance of precipitation in the area at the time of radioactive cloud passage. In addition, other fac-tors will vary from one individual to another (e.g. human behaviour patterns and precise locations). The main sources of uncertainty in the dose estimates are summarized below.
4.7.1 Estimating time-integrated air concentrations based on deposition measurements
Where measurements of concentrations in air are not available, it is theoretically pos-sible to estimate activity concentrations in air from the measured activity on the ground. However, there is no simple and consistent relationship between activity concentration in air and either the amount of activity that is deposited on the ground or the external dose rates. Much depends on the radionuclide and its chemical form. For example, the chemical form of iodine influences the deposition rates, and thus the assumption about the chemical form of iodine (i.e. particulate or vapour) has a significant influence on the inhalation dose assessment. The effect of precipitation is also very important as it can significantly enhance the deposition of radionuclides and again lead to differences in the ratio of concentration in air and in the deposit.
For the reasons mentioned above, the estimated doses based on these data are associ-ated with significant uncertainties. However, it is of interest to note that the approach based on dispersion modelling, when applied to the area of Japan outside the Fukushima prefecture (for validation purposes), gives similar predicted doses to those based on deposition measurements. In this approach, the deposition levels are predicted from modelled air concentrations stemming from a source term, taking into account dry and wet deposition processes and actual weather in the area at the time. Hence, although there are still significant uncertainties in this approach they are to some extent of a dif-ferent origin from those in the measurement-based approach, giving some confidence in the doses estimated on the basis of both approaches.

preliminary dose estimation from the nuclear accident after the 2011 Great east Japan earthquake and tsunami / 61
4. DISCUSSION
4.7.2 Assumed radionuclide composition in Japanese locations
Measurements show great variability in the radionuclide composition in different loca-tions in Japan, such as in the ratio between 131I and 137Cs in ground deposits. For the dose assessment in Japan, two alternative assumptions in the radionuclide composition have been used in approaches A and B (see Annex 6, Table A6.1) in conjunction with measured levels of deposited activity. This will have some impact on the doses predicted to arise from external and inhalation pathways, but the use of two alternative radionu-clide compositions in this assessment provides reassurance that the impact of this un-certainty has not been overlooked. Since the chemical form of iodine (i.e. particulate or vapour) has significant influence on the inhalation dose, the inhalation dose estimates in the assessment cautiously assumed that the iodine was in elemental vapour form.
4.7.3 Location factor
The assessment assumes a location factor that represents the degree of shielding from external radiation provided by wooden housing, which may be regarded as a cautious value. However, the use of a less cautious number would only reduce the total dose from external irradiation by no more than a factor of two (35).
4.7.4 Use of ICRP dose coefficients for Japan
As mentioned in the previous section, in this study both effective and thyroid doses were assessed using the dose coefficients recommended by ICRP. These estimates use the ICRP values of the inhalation and ingestion dose coefficients. They assume generic anatomical and physiological human data based on the reference person as defined by ICRP, and as such are not intended to be the inhabitants of any particular region. The use of these dose coefficients may result in some overestimation of equivalent doses to the thyroid for Japanese individuals because the high iodine content of the Japanese diet (e.g. from sea fish, shellfish and seaweed) may reduce the uptake of radioactive iodine by the thyroid. The panel was not aware of thyroid dose coefficients developed specifi-cally for the Japanese or for a population with an iodine-rich diet. However, not all diets in Japan are rich in iodine (46), so protection afforded by high levels of natural iodine may not apply to all. It has also been noted that iodine-rich food does not in itself appear effective as a countermeasure after a release of radioactive iodine (47).
4.7.5 Source term
The definition of what radionuclides were released and the timing of the release, together with information on chemical form, particle size and release height/energy, must be regarded as highly uncertain. In the assessment, this uncertainty is linked to another, discussed above, which is how the released radionuclides deposit during precipitation and how this changes over distance from the release. However, source terms are applied in this assessment only to estimate doses in the world beyond Japan, and the majority of these estimated doses are below the low level of dose used here as a cut-off value in the presentation of results. Hence an underestimation or an overestimation in the source terms used would have little or no effect on the majority of the doses presented.

62 / preliminary dose estimation from the nuclear accident after the 2011 Great east Japan earthquake and tsunami
4.7.6 Dispersion modelling
The panel is aware that, internationally, the use of complex dispersion models, such as the one used in this assessment to estimate the global dispersion arising from the Fuku-shima accident, generally results in model estimates substantially lower than measure-ments at far distances. This is thought to arise from either a complex situation regarding wet deposition or from inaccuracies in the current source term estimates, or from a combination of these factors. The estimates of the NAME III model around the northern hemisphere for Xe-133 are also in good agreement with measurements, suggesting that the global dispersion modelling is fundamentally correct. Comparison between the esti-mates of the NAME model of time-integrated activity concentrations in air and measured air concentrations for 131I and 137Cs taken in various parts of the world in March and April has indicated an increasing trend with distance from the release site for the estimates to be lower than the measurements. Unlike 133Xe, 131I and 137Cs are radionuclides that deposit, lending support to the possibility that the discrepancy may in part be linked to the modelling of deposition processes, although the possibility of some inaccuracy in the magnitude and temporal variability of the source terms cannot be eliminated. On the timescale of this preliminary study it is an issue that cannot be resolved.
4.7.7 Ingestion doses in Japan
The estimation of ingestion doses in Japan incorporated into the total doses (as pre-sented in Tables 3 and 4), is generally considered to be conservative on the basis of the assumptions listed in Section 2.6.

preliminary dose estimation from the nuclear accident after the 2011 Great east Japan earthquake and tsunami / 63
5. SUMMARY AND CONCLUSIONS
5. Summary and conclusions
The radiation doses in this report represent a preliminary assessment of doses for the first year after the Fukushima accident based on data available to the panel up to September 2011. Doses are provided for different populations by age and geographical location.
Effective doses and equivalent doses to the thyroid have been estimated for three age groups: 1-year-old infants, 10-year-old children, and adults. These age groups were cho-sen to enable the characterization of the radiological impact on younger and more sensi-tive populations. The estimated doses are those received by a characteristic person living in the region or location of interest, and are mostly reported as bands of one order of magnitude, providing a level of accuracy commensurate with the preliminary nature of the assessment. The bands do not indicate the range of doses in the population in the area, which would have required distributions of input data not available to the panel within the time frame of this assessment1.
In general, the doses assessed are the committed doses for residents staying in a given region or location during the full first year after the accident. However, in a few locations in the most affected part of Fukushima prefecture, doses were calculated for the first four months after the accident as relocation took place at some time during the first few months.
On the basis of the input data used for this assessment, extrapolation of doses beyond the first year was not performed because of uncertainties that may influence long-term exposure, including future protective and remedial actions, that will further reduce ra-diation exposure (48, 49). The experience of the Chernobyl accident was that about 30% of the lifetime dose was delivered during the first year and about 70% during the first 15 years (31). On the basis of environmental activity concentration data, it can be expected that the fraction of the lifetime dose beyond the first year will be lower for the Fukushima Daiichi nuclear power plant accident than for the Chernobyl accident, due to the greater influence of the shorter-lived 134CS (half-life two years) compared to 137CS (half-life 30 years).
In summary, the key features of the assessed doses are as follows.
For the estimated effective doses:
■ In Fukushima prefecture the estimated effective doses are within a dose band of 1−10 mSv, except in two of the example locations where the effective doses are estimated to be within a dose band of 10–50 mSv.
■ In prefectures neighbouring Fukushima, the estimated effective doses are within a dose band of 0.1−10 mSv, and in all other prefectures the effective doses are esti-mated to be within a dose band of 0.1−1 mSv.
1. The Independent Expert Panel worked from June to November 2011.

64 / preliminary dose estimation from the nuclear accident after the 2011 Great east Japan earthquake and tsunami
■ In the rest of the world estimated effective doses are less than 0.01 mSv, and are usually far below this level.
■ The exposure pathways that contribute most to effective dose vary with location and distance from the site. In the most affected regions the external dose from ground-shine is important, but with increasing distance from the site the ingestion of food becomes the main contributor.
For the estimated thyroid doses:
■ In the most affected area of Fukushima prefecture the estimated thyroid doses are within the dose band of 10−100 mSv, with the exception of one example location where estimated thyroid doses to adults are within a dose band of 1−10 mSv and an-other example location where the estimated thyroid doses to infants are within a dose band of 100–200 mSv.
■ In the rest of Fukushima prefecture the estimated thyroid doses are within a dose band of 1−10 mSv to adults and 10−100 mSv to children and infants.
■ In the rest of Japan the estimated thyroid doses are within a dose band of 1−10 mSv.
■ In the rest of the world, estimated thyroid doses are less than 0.01 mSv, and are usu-ally far below this level.
■ The exposure pathways that contribute most to thyroid dose vary with location and distance from the site. In the most affected regions, inhalation from the cloud and the external dose from groundshine are important, but with increasing distance from the site the ingestion of food becomes the main contributor.
It can be concluded that the estimated effective doses outside Japan from the Fuku-shima Daiichi nuclear power plant accident are below (and often far below) the dose levels regarded by the international radiological protection community as very small. An annual dose of 0.01 mSv (10 μSv) corresponds to the radiological criterion for exemp-tion of materials from need of regulatory control and for clearance of materials from any further control, as established in the International Basic Safety Standards for Protection Against Ionizing Radiation and for the Safety of Radiation Sources (38). This level of dose is comparable to the average population dose resulting from 1.5 days of exposure to natural background radiation/natural sources of radiation (37).
It can also be concluded that low effective doses are estimated in much of Japan. To put this into context, and keeping in mind that dose limits do not apply in emergency exposure situations, it could be noted that estimated effective doses outside Fukushima and neighbouring prefectures are below the annual limit for public exposure in planned exposure situations (1 mSv) (10,38).
In the Fukushima prefecture and in neighbouring prefectures the estimated effective doses are below the internationally agreed reference level for public exposure due to ra-don in dwellings (annual effective dose of about 10 mSv (39)), except in two locations in the most affected part of Fukushima prefecture where the effective doses were estimated to be within a dose band of 10–50 mSv. To put this into context, the ICRP recommends reference levels for planned residual dose in emergency exposure situations (the dose that remains after protective actions have been taken) in the band of 20–100 mSv an-nual or acute effective dose (48).

preliminary dose estimation from the nuclear accident after the 2011 Great east Japan earthquake and tsunami / 65
5. SUMMARY AND CONCLUSIONS
In view of the time frame of the assessment, a number of assumptions were taken to calculate the doses, which mostly provide conservative estimates. In particular the panel was aware of some protective measures taken by the Government of Japan in relocating residents of certain areas (i.e. in the “deliberate evacuation area”). Because of lack of the necessary detailed information, it has been assumed that the relocation of residents in these areas took place at least four months after the accident, whereas a proportion of the population was relocated earlier. Therefore, the doses estimated in the example locations considered for the most affected areas of Fukushima prefecture may be over-estimated.
Moreover, the protective effects of sheltering may not also have been fully taken into account due to lack of more detailed information. This being said, the dominant con-tributors to the total effective dose in these locations were the inhalation2 and external exposure pathways. While evacuation prior to the arrival of the radioactive cloud would be effective in reducing inhalation and external exposure from cloudshine, relocation af-ter the radioactive release (e.g. at two months instead of four months as assumed) would not significantly reduce the overall dose as the early exposure pathways would remain unchanged.
For prefectures far away from Fukushima included under the scenario for the rest of Japan, food appears to be the main exposure source. In these locations, food was not monitored and it assumed that consumers only ate food coming from Fukushima and neighbouring prefectures. The doses are therefore clearly overestimated.
Comparison between the estimated doses for Japan in this report and those estimated from direct measurements of radionuclides in Japanese residents and travellers returning from Japan gives confidence that the estimated doses in this report do not underestimate the actual doses in Japan. The doses estimated from in vivo human measurements are similar, and in some cases lower, than those estimated in the assessment using envi-ronmental data, although a direct correlation between the quantities cannot be made. As discussed, cautious assumptions have been made where data are lacking. However, the panel considers that the doses presented here are unlikely to be very significantly overestimated.
The Independent Expert Panel considers that the dose estimates are robust on the basis of knowledge and information on hand at the time of the study. The data used as input to this assessment are considered by the panel to be the most appropriate available on the timescale required (September 2011) and to be fit-for-purpose.
The long-term priority in radiological protection after a nuclear accident is to protect people with the highest exposures, and to reduce all individual exposures associated with the event to as low as reasonably achievable (30). This requires the knowledge of the dose distribution for the subsequent optimization of protection.
It has been reported that a number of remedial actions have been taken by the Govern-ment of Japan, municipal authorities and residents to lower radiation exposure (49). At
2. Since protection from inhalation exposure due to being indoors for a proportion of the time has not generally been taken into account in this assessment, the early doses from inhalation are likely to be somewhat overesti-mated.

66 / preliminary dose estimation from the nuclear accident after the 2011 Great east Japan earthquake and tsunami
the time of publication of this report, additional protective and remedial actions are be-ing implemented3. Such measures that will further lower exposure can be accounted for in future studies, such as the upcoming two-year UNSCEAR assessment.4
In addition to the UNSCEAR study, a major initiative initiated in the Fukushima prefec-ture will inform future more detailed dose assessments. This unprecedented initiative, the Fukushima Health Survey, includes a survey to determine the whereabouts of every prefectural resident from the time of the March 11 nuclear accident onwards (a so-called “record of movement”) and to provide the basis for estimating the level of radiation ex-posure, which will assist in future health effect assessments.
3. Remedial actions have been planned by the Government of Japan through the Act on Special Measures concerning the Handling of Environment Pollution by Radioactive Materials Discharged by the NPS Accident Associated with the Tohoku District -Off the Pacific Ocean Earthquake That Occurred on March 11, 2011 (Act No. 110 of 2011), and through the Guidelines for Decontamination in a Specific Area for Decontamination (Decontamination Roadmap) ( January 26, 2012, Ministry of the Environment). Moreover, additional protective actions have been taken such as the establishment of stricter New Standard Limits for Radionuclides in Foods (April 1, 2012, Ministry of Health Labour and Welfare).
4. More information is available at: http://www.unis.unvienna.org/unis/pressrels/2011/unisous102.html.

preliminary dose estimation from the nuclear accident after the 2011 Great east Japan earthquake and tsunami / 67
REFERENCES
References
1. Ohnishi T. The disaster at Japan's Fukushima-Daiichi nuclear power plant after the March 11, 2011 earthquake and tsunami, and the resulting spread of radioisotope contamination. Radiation Research, 2012, 177:1−14.
2. INES: the International Nuclear and Radiological Event Scale (leaflet). Vienna, In-ternational Atomic Energy Agency (http://www.iaea.org/Publications/Factsheets/Eng-lish/ines.pdf, accessed 13 May 2012).
3. Report of the Japanese Government to the IAEA Ministerial Conference on Nuclear Safety. The accident at TEPCO’s Fukushima nuclear power stations. Nuclear Emer-gency Response Headquarters of the Government of Japan, June 2011 (www.iaea.org/newscenter/focus/fukushima/japan-report/, accessed 13 May 2012).
4. Additional Report of the Japanese Government to the IAEA. The accident at TEPCO's Fukushima nuclear power stations, second report, September 2011 (http://www.meti.go.jp/english/earthquake/nuclear/iaea/iaea_110911.html, accessed 13 May 2012).
5. Revisions to the summary of the Additional Report of the Japanese Government to the IAEA. The accident at TEPCO’s Fukushima nuclear power stations, second re-port. Nuclear Emergency Response Headquarters of the Government of Japan, Tokyo (www.iaea.org/newscenter/focus/fukushima/japan-report2/revisions.pdf, accessed 13 May 2012).
6. Mission report. IAEA international fact finding expert mission of the Fukushima Dai-ichi NPP accident following the Great East Japan earthquake and tsunami. Tokyo, Fukushima Dai-ichi NPP, Fukushima Dai-ni NPP and Tokai Dai-ni NPP, Japan 24 May–2 June 2011. Vienna, International Atomic Energy Agency, 2012 http://www.iaea.org/newscenter/focus/fukushima/, accessed 13 May 2012).
7. The 1990 recommendations of the International Commission on Radiological Pro-tection. ICRP Publication 60. Annals of the ICRP, 1991, 21:1–3.
8. Environmental consequences of the Chernobyl accident and their remediation: twenty years of experience. Vienna, International Atomic Energy Agency, 2006 (http://www-pub.iaea.org/mtcd/publications/pdf/pub1239_web.pdf, accessed 13 May 2012).
9. Health effects of the Chernobyl accident and special care programmes. Geneva, World Health Organization, 2006 (http://www.who.int/ionizing_radiation/chernobyl/assessment_mitigation/en/index.html accessed 13 May 2012).
10. The 2007 recommendations of the International Commission on Radiological Pro-tection. ICRP Publication 103. Annals of the ICRP, 2007, 37:2–4.

68 / preliminary dose estimation from the nuclear accident after the 2011 Great east Japan earthquake and tsunami
11. Assessing Dose of the Representative Person for the Purpose of the Radiation Pro-tection of the Public and the Optimisation of Radiological Protection. ICRP Publica-tion 101a. Annals of the ICRP, 2006, 36:3.
12. Monitoring information of environmental radioactivity level. Tokyo, Ministry of Edu-cation, Culture, Sports, Science and Technology (http://radioactivity.mext.go.jp/en/, accessed 13 May 2012).
13. Information on the Great East Japan earthquake. Tokyo, Ministry of Health, La-bour and Welfare (http://www.mhlw.go.jp/english/topics/2011eq/, accessed 13 May 2012).
14. Monitoring of radioactivity in the environment (http://www.pref.fukushima.jp/nucle-ar, accessed 13 May 2012) (in Japanese).
15. Global Environmental Monitoring System. Food contamination monitoring and as-sessment programme. GEMS/Food consumption cluster diets. Geneva, World Health Organization, 2006 (http://www.who.int/foodsafety/chem/gems/en/index1.html, ac-cessed 13 May 2012).
16. Jones AR et al. The U.K. Met Office's next-generation atmospheric dispersion model, NAME III. In: Borrego C, Norman A-L, eds. Air pollution modeling and its applica-tion XVII (Proceedings of the 27th NATO/CCMS International Technical Meeting on Air Pollution Modelling and its Application). New York, NY, Springer, 2007 (pages 580−589).
17. Cullen MJP. The unified forecast/climate model. Meteorological Magazine, 1993, 122:81–94.
18. Simmonds JR, Lawson G, Mayall A. Methodology for assessing the radiological con-sequences of routine releases of radionuclides to the environment. Radiation Protec-tion, 72, European Commission Report EUR 15760 EN, 1995.
19. Handling of provisional regulation values for radioactive iodine in fishery products. Press release from the Ministry of Health, Labour and Welfare, 5 April, 2011 (http://www.mhlw.go.jp/english/topics/2011eq/dl/food-110405.pdf, accessed 13 May 2012).
20. Sum up of radionuclide test results carried out since 19 March 2011 (http://www.mhlw.go.jp/english/topics/2011eq/dl/29Sep2011_Sum_up.pdf, accessed 13 May 2012).
21. Principles and methods for the risk assessment of chemicals in food. Environmental Health Criteria 240. Geneva, World Health Organization, 2009.
22. Brown J, Simmonds JR. FARMLAND: a dynamic model for the transfer of radionu-clides through terrestrial foodchains. (NRPB-R273). Chilton, UK National Radio-logical Protection Board, 1995.
23. Stohl et al. Xenon-133 and caesium-137 releases into the atmosphere from the Fukushima Dai-ichi nuclear power plant: determination of the source term, atmo-spheric dispersion, and deposition. Atmospheric Chemistry and Physics, 2011, 11:28319 28394.

preliminary dose estimation from the nuclear accident after the 2011 Great east Japan earthquake and tsunami / 69
REFERENCES
24. Doses to infants from ingestion of radionuclides in mothers' milk. ICRP publication 95. Annals of the ICRP, 2004, 34:3–4.
25. ICRP CD 3: Database for Dose Coefficients: Doses to Infants from Mothers' Milk. Support to ICRP Publication 95. Ottawa, International Commission on Radiological Protection, 2007.
26. Doses to the embryo and fetus from intakes of radionuclides by the mother. ICRP Publication 88. Annals of the ICRP, 2001, 31:1–3.
27. ICRP CD 3: Database of Dose Coefficients: Embryo and Foetus. Supports to ICRP Publication 88. Ottawa, International Commission on Radiological Protection, 2002.
28. Guidance on the application of dose coefficients for the embryo, fetus and breastfed infant in dose assessments for members of the public. Chilton, UK Health Protec-tion Agency, 2008.
29. CTBTO web site (http://www.ctbto.org/press-centre/highlights/2011/fukushima-related-measurements-by-the-ctbto/fukushima-related-measurements-by-the-ctbto-page-1/, accessed 13 May 2012).
30. Application of the Commission's recommendations to the protection of people living in long-term contaminated areas after a nuclear accident or a radiation emergency. ICRP Publication 111. Annals of the ICRP, 2009, 39:3.
31. Golikov V, Balonov M, Jacob P. External exposure of the population living in areas of Russia contaminated due to the Chernobyl accident. Radiation and Environmental Biophysics, 2002, 41:183−193.
32. Chino M et al. Preliminary estimation of release amounts of 131I and 137Cs acci-dentally discharged from the Fukushima Daiichi nuclear power plant into the atmo-sphere. Journal of Nuclear Science and Technology, 2011, 48(7):1129−1134.
33. Derived intervention levels for radionuclides in food. Guidelines for application after widespread radioactive contamination resulting from a major radiation acci-dent. Geneva, World Health Organization, 1988 (http://whqlibdoc.who.int/publica-tions/1988/9241542330_eng.pdf, accessed 13 May 2012).
34. Report of the briefing session on the results of survey on radiation exposure to thyroid for children, http://www.nsc.go.jp/anzen/shidai/genan2011/genan067/siryo1.pdf, ac-cessed 13 May 2012) (in Japanese).
35. Jacob P, Golikov V, Gering F. Gamma-ray spectrometry in the environment and mod-elling of external exposures. Proceedings of the Ninth Congress of the International Radiation Protection Association, Vienna, Austria, 1996 (http://www.irpa.net/irpa9/cdrom/VOL.1/V1_21.PDF, accessed 13 May 2012).
36. Sources and effects of ionizing radiation. UNSCEAR 2008 Report to the General Assembly with scientific annexes. Vol. 2, Annex D. Health Effects due to radiation from the Chernobyl Accident. New York, United Nations, 2011.

70 / preliminary dose estimation from the nuclear accident after the 2011 Great east Japan earthquake and tsunami
37. Sources and effects of ionizing radiation. UNSCEAR 2008 Report to the General As-sembly with scientific annexes. Vol. 1, Annex B. Exposures of the public and workers from various sources of radiation. New York, United Nations, 2010.
38. Radiation protection and safety of radiation sources: International Basic Safety Stan-dards (BSS), Interim edition. Vienna, International Atomic Energy Agency, 2011 (http://www-pub.iaea.org/MTCD/publications/PDF/p1531interim_web.pdf, accessed 13 May 2012).
39. Handbook on indoor radon: a public health perspective. Geneva, World Health Or-ganization, 2009 (http://www.who.int/ionizing_radiation/env/radon/en/index1.html, accessed 13 May 2012).
40. Sources and effects of ionizing radiation. UNSCEAR 2008 Report to the General Assembly with scientific annexes. Vol. 1, Annex A. Medical radiation exposures. New York, United Nations, 2010.
41. Personal communication from Dr. Sergey Shinkarev of Burnasyan, Federal Medical Biophysical Centre, Russian Federation, November 2011.
42. Personal communication from Dr. Jean-René Jourdain, L'Institut de Radioprotection et de Sûreté Nucléaire (IRSN), France, October 2011.
43. Personal communication from Dr. Florian Gering of the Federal Office of Radiation Protection, Germany, October 2011.
44. K. Akahane, et al. The Fukushima Nuclear Power Plant accident and exposures in the environment. The Environmentalist, 2012, 32-2:136-143.
45. Website of the Fukushima prefecture (http://wwwcms.pref.fukushima.jp/pcp_portal/PortalServlet?DISPLAY_ID=DIRECT&NEXT_DISPLAY_ID=U000004&CONTENTS_ID=24809, accessed 13 May 2012).
46. Zava TT and Zava DT. Assessment of Japanese iodine intake based on seaweed con-sumption in Japan: a literature-based analysis. Thyroid Research, 2011, 4(14): 1-7 (http://www.thyroidresearchjournal.com/content/4/1/14, accessed 13 May 2012).
47. Takamura N et al. Urinary iodine kinetics after oral loading of potassium iodine. Endocrine Journal, 2003, 50(5):589–593.
48. Application of the Commission's Recommendations for the Protection of People in Emergency Exposure Situations. ICRP Publication 109. Annals of the ICRP, 2009, 39:1.
49. Final report of the International Mission on remediation of large contaminated ar-eas off-site the Fukushima Daiichi NPP, 7−15 October 2011. Vienna, International Atomic Energy Agency, 2011 (http://www.iaea.org/newscenter/focus/fukushima/fi-nal_report151111.pdf, accessed 13 May 2012).
preliminary dose estimation from the nuclear accident after the 2011 Great east Japan earthquake and tsunami / 71
GLOSSARY
Glossary
Absorbed doseMean energy imparted by ionizing radiation to an irradiated medium per unit mass, ex-pressed in grays (Gy). Amount of energy absorbed by that organ or tissue divided by its weight. The international unit of absorbed dose is the gray (Gy), which is equal to one joule per kilogram.
Activity: see radioactivity.
Alpha particlesTwo neutrons and two protons bound as a single particle that is emitted from the nucleus of certain radioactive isotopes in the process of decay or disintegration; a positively charged particle indistinguishable from the nucleus of a helium atom.
Activity median aerodynamic diameter (AMAD)The value of aerodynamic diameter such that 50% of the airborne activity in a specified aerosol is associated with particles smaller than the AMAD, and 50% of the activity is associated with particles larger than the AMAD.
Atmospheric dispersionThe spreading of radionuclides in air resulting mainly from physical processes affecting the velocity of different molecules in the medium.
AtomThe smallest particle of an element that cannot be divided or broken up by chemical means. It consists of a central core of protons and neutrons, called the nucleus, and of electrons which revolve in orbits in the region surrounding the nucleus.
Background radiationAmount of radiation to which a population is exposed from natural sources, such as ter-restrial radiation due to naturally occurring radionuclides in the soil, cosmic radiation originating in outer space, and naturally occurring radionuclides deposited in the human body.
Becquerel In the International System, a unit of activity equal to one disintegration per second.
Beta particlesA negatively charged particle emitted from the nucleus of an atom, with mass equal to those of an electron.
Biodistribution Result of the transfer of compounds of interest in the body.

72 / preliminary dose estimation from the nuclear accident after the 2011 Great east Japan earthquake and tsunami
ClearanceThe removal by the regulatory body of regulatory control from radioactive material or radioactive objects within notified or authorized practices.
Committed doseThe lifetime dose expected to result from a radionuclide intake.
Consumption level Amount of food ingested per day, per person.
CloudMass of air and vapour in the atmosphere carrying radioactive material released from a nuclear explosion.
CloudshineGamma radiation from radionuclides in an airborne radioactive plume (i.e. radioactive cloud).
Deposition: see deposition density.
Deposition densityActivity of a radionuclide per unit area of ground. Reported in the International System as becquerels per square meter (Bq/m2) or curies per square meter.
Deterministic effectsHealth effects, the severity of which varies with dose and for which typically there is a threshold below which they will not occur (e.g. acute radiation syndrome). Deterministic effects are also referred to as “tissue reactions” or non-stochastic effects.
Deterministic approach/analysisApproach or analysis using single numerical values (taken to have a probability of 1), leading to a single value for the result. In the context of exposure assessment this is typi-cally used with either ‘best estimate’ or ‘conservative’ values, based on expert judgment and knowledge of the phenomena being modeled. Contrasting/opposite terms: probabi-listic analysis or stochastic analysis.
Dose A general term denoting the quantity of radiation or energy absorbed in a target.
Dose assessment Assessment of the dose(s) to an individual or group of people.
Dose coefficients Factors used to convert the amount of incorporated radioactive substances (radionuclide intake) to the dose in tissues/organs, and/or the whole body dose. These factors (also called "dose conversion factors") may depend on the radionuclide, the incorporation route (e.g. inhalation, ingestion), the chemical compound and the age of the person. Usually expressed as dose per unit intake (e.g. sieverts per becquerel (e.g. sieverts per becquerel, Sv/Bq).
Dose conversion factor: see dose coefficients.
preliminary dose estimation from the nuclear accident after the 2011 Great east Japan earthquake and tsunami / 73
GLOSSARY
Dose limitIn planned exposure situations, the value of the individual effective dose or equivalent that is not to be exceeded. Dose limits do not apply to existing exposure situation or emergency exposure situations.
Dose rateAbsorbed dose delivered per unit time.
Effective dose Sum of the products of absorbed dose to each organ multiplied by a radiation weighting factor and a tissue weighting factor that takes into account the radiosensitivity of tissues and organs.
Environmental monitoringThe measurement of external dose rates due to sources in the environment or of radionu-clide concentrations in environmental media.
Equivalent doseAbsorbed dose averaged over a tissue or organ, further applying a radiation weighting factor that varies by radiation type and is related to the density of ionization created.
EvacuationThe rapid, temporary removal of people from an area to avoid or reduce short-term radia-tion exposure in an emergency.
ExemptionThe determination by a regulatory body that a source or practice need not be subject to some or all aspects of regulatory control on the basis that the exposure and the potential exposure due to the source or practice are too small to warrant the application of those aspects or that this is the optimum option for protection irrespective of the actual level of the doses or risks.
Exposure The state or condition of being subject to irradiation from a source that is outside the body (i.e. external exposure) or within the body (i.e. internal exposure).
Exposure pathway A route by which radiation or radionuclides can reach humans and cause exposure.
External exposure: see exposure.
Fallout (nuclear) Minute radioactive particles that descend slowly from the atmosphere after a nuclear explosion.
Food self-sufficiencyThe food self-sufficiency ratio is calculated as the domestic food production divided by the food supply for domestic consumption.
Gamma raysShort-wavelength electromagnetic radiation (i.e. photons) of nuclear origin; similar to X-radiation but emitted at very specific energies characteristic of the decaying atoms.

74 / preliminary dose estimation from the nuclear accident after the 2011 Great east Japan earthquake and tsunami
Ground deposition: see deposition density.
GroundshineGamma radiation from radionuclides deposited on the ground.
Half-lifeThe time taken for the quantity of a specified material (e.g. a radionuclide) in a specified place to decrease by half as a result of any specified process or processes that follow similar exponential patterns to radioactive decay. The radioactive half-life for a radionu-clide is the time required for the activity to decrease, by a radioactive decay process, by half. The biological half-life is the time taken for the quantity of a material in a speci-fied tissue, organ or region of the body to halve as a result of biological processes. The effective half-life is the time taken for the activity of a radionuclide in a specified place to halve as a result of all relevant processes (e.g. radioactive decay, biological half-life).
IngestionConsumption of a substance by a living organism.
InhalationMovement of air from the external environment, through the airways, and into the pul-monar alveoli.
Inhalation rateNumber of breaths taken within a given amount of time, typically one minute.
IntakeThe activity of a radionuclide taken into the body (by inhalation or ingestion or through the skin) in a given time period or as a result of a given event.
Internal exposure: see exposure.
IonizationProcess by which a neutral atom or molecule acquires a positive or negative charge.
Ionizing radiationFor the purposes of radiation protection, radiation capable of producing ion pairs in bio-logical material(s).
Kerma (kinetic energy released in matter) Unit of exposure that represents the kinetic energy transferred to charged particles per unit mass of irradiated medium when indirectly ionizing (uncharged) particles, such as photons or neutrons, traverse the medium. If all of the kinetic energy is absorbed “lo-cally”, the kerma is equal to the absorbed dose. The quantity (K) is expressed in μGy/h at 1 m.
Location factor The ratio of the dose rate in air at a point inside a settlement to a similar value above a plot of undisturbed soil.
Natural background: see background radiation.

preliminary dose estimation from the nuclear accident after the 2011 Great east Japan earthquake and tsunami / 75
GLOSSARY
Noble gasAn inert radioactive gas that does not readily enter into chemical combination with other elements. Examples are helium, argon, krypton, xenon and radon.
Occupancy factor: A typical fraction of the time for which a location is occupied by an individual or group.
Radioactive decayThe decrease in the amount of any radioactive material with the passage of time due to the spontaneous emission from the atomic nuclei of either alpha or beta particles, often accompanied by gamma radiation.
Radioactive materialThe "scientific" meaning of radioactive, as in radioactive substance, refers only to the presence of radioactivity, and gives no indication of the magnitude of the hazard in-volved. In its “regulatory” meaning, it refers to a material designated in national law or by a regulatory body as being subject to regulatory control because of its radioactivity.
Radioactivity (also called "activity")The amount of radioactivity of a radionuclide defined as the mean number of decays per unit time. The unit of activity in the International System (SI) is the reciprocal second (s–1), termed the becquerel (Bq).
RadionuclideRadioactive species of an atom characterized by the constitution of its nucleus.
Reference levelIn an emergency exposure situation or an existing exposure situation, the level of dose , risk or activity concentration above which it is not appropriate to plan to allow exposures to occur and below which optimization of protection and safety would continue to be implemented.
RelocationNon-urgent movement of people from a contaminated area to avoid chronic exposure. It is a longer-term protective action that may be a continuation of the urgent protective action of evacuation. It may be permanent relocation (sometimes termed resettlement) if it continues for more than a year or two and return is not foreseeable; otherwise it is temporary relocation.
Remedial action: see remediation.
Remediation Any measures that may be carried out to reduce the radiation exposure from existing con-tamination of land areas through actions applied to the contamination itself (the source) or to the exposure pathways to humans.
Risk Hazard, danger or chance of harmful consequences associated with exposures or poten-tial exposures. It relates to quantities such as the probability that specific deleterious consequences may arise and to the magnitude and character of such consequences. It refers to detrimental health effects of exposure to radiation (including the likelihood of

76 / preliminary dose estimation from the nuclear accident after the 2011 Great east Japan earthquake and tsunami
such effects occurring) as well as to any other safety-related risks, including those to ecosystems in the environment, that might arise as a direct consequence of exposure to radiation.
ShelteringAn urgent protective action, used during nuclear emergencies to provide shielding against external exposure and to reduce the intake of airborne radionuclides by inhalation by us-ing a structure for protection from an airborne plume and/or deposited radionuclides (e.g. recommending people to stay indoors).
ShieldingPhysical barriers that provide protection against exposure to radiation. Radiation shield-ing (see also Shielding factor) is the reduction of radiation by interposing a physical barrier (i.e. a shield) of absorbing material between any radioactive source and a person, work area or radiation-sensitive device.
Shielding factorA measure of the effectiveness of the shield expressed as the ratio between the radiation level at a location behind a shield on which radiation is incident and the radiation level at the same location without the presence of the shield.
SievertThe SI unit of equivalent dose and effective dose, equal to 1 J/kg.
SourceAnything that may cause radiation exposure by emitting ionizing radiation or by releasing radioactive substances or material, and that can be treated as a single entity for protec-tion and safety purposes.
Source termThe amount and isotopic composition of material released (or postulated to be released) from a facility. Used in modeling releases of radionuclides to the environment, particu-larly in the context of accidents at nuclear installations or releases from radioactive waste in repositories.
Threshold (or "threshold dose")Minimal absorbed radiation dose that will produce a detectable degree of any given effect.
Organ doseThe mean absorbed dose in a specified tissue or organ of the human body. Sometimes called tissue dose.
Tissue reactions: see deterministic effects.
X-rays (or X-radiation)Penetrating electromagnetic radiation (i.e. photons) whose wavelength is shorter than that of visible light. It is usually produced by bombarding a metallic target with fast electrons in a high vacuum. In nuclear reactions, it is customary to refer to photons originating in the nucleus as gamma-radiation and those originating in the extranuclear part of the atom as X-radiation.

preliminary dose estimation from the nuclear accident after the 2011 Great east Japan earthquake and tsunami / 77
ABBREVIATIONS
Ag silver
AMAD Activity Median Aerodynamic Diameter
BfS Bundesamt für Strahlenschutz (Federal Office of Radiation Protection), Germany
BSS Basic Safety Standards
Co cobalt
Cs caesium
FAO Food and Agriculture Organization
GEMS Global Environmental Monitoring System
HPA Health Protection Agency
I iodine
IAEA International Atomic Energy Agency
IARC International Agency for Research on Cancer
ICRP International Commission on Radiological Protection
INES International Nuclear Event Scale
INFOSAN International Food Safety Authorities Network
IRH Institute of Radiation and Hygiene, Russia
IRSN Institut de Radioprotection et Sureté Nucléaire, France
LOD Limit Of Detection
LOQ Limit Of Quantification
Mn manganese
NAME Numerical Atmospheric dispersion Modelling Environment
NIRS National Institute of Radiological Sciences, Japan
Sb antimony
SPEEDI System for Prediction of Environmental Emergency Dose Information
Te tellurium
TEPCO Tokyo Electric Power Company
UNSCEAR United Nations Scientific Committee on the Effects of Atomic Radiation
WHO World Health Organization
Xe xenon
Abbreviations

78 / preliminary dose estimation from the nuclear accident after the 2011 Great east Japan earthquake and tsunami
Annex 1. Declaration of interests statement
The independent experts who participated in the meetings of the International Expert Panel on the initial evaluation of radiation exposure from the nuclear accident after the 2011 Great East Japan Earthquake and Tsunami were asked to inform WHO if at any time a conflict of interest, whether actual or potential, could be perceived in their work and they were required to sign a conflict-of-interest statement. There was no conflict of interest for any Panel members who contributed to the preparation of this document.
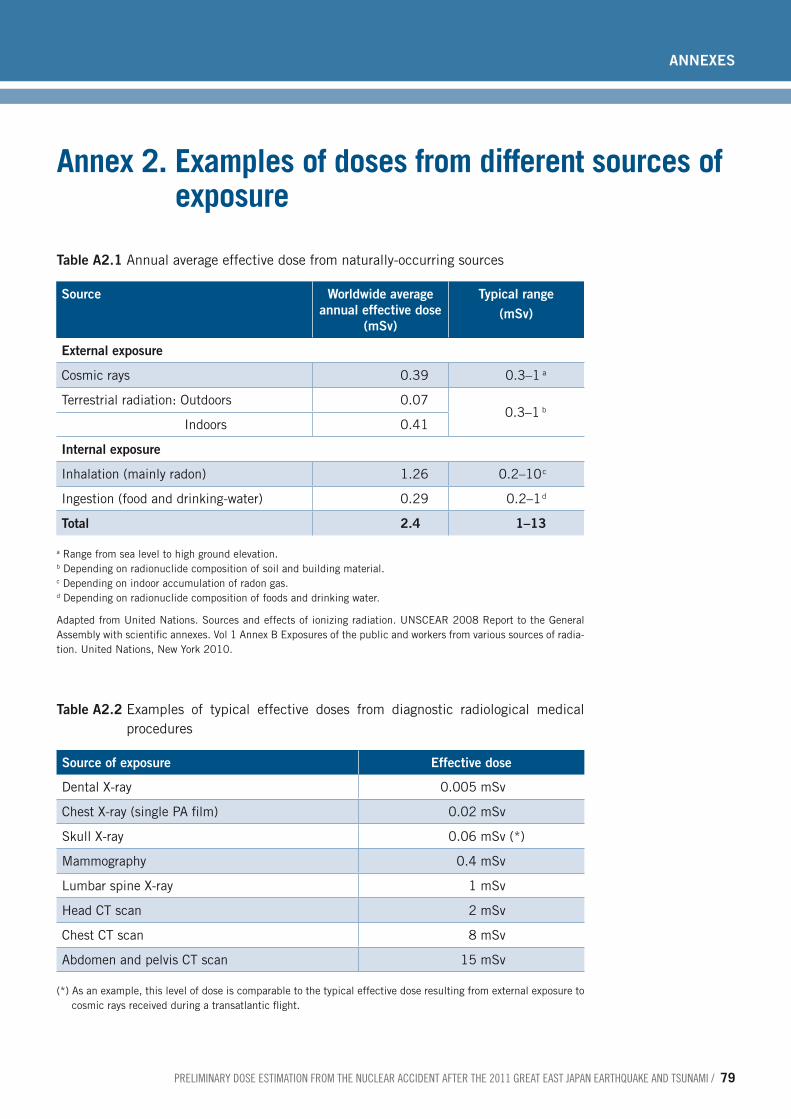
preliminary dose estimation from the nuclear accident after the 2011 Great east Japan earthquake and tsunami / 79
annexes
Table A2.1 Annual average effective dose from naturally-occurring sources
Source Worldwide average annual effective dose
(mSv)
Typical range (mSv)
External exposure
Cosmic rays 0.39 0.3–1 a
Terrestrial radiation: Outdoors 0.07 0.3–1 b
Indoors 0.41
Internal exposure
Inhalation (mainly radon) 1.26 0.2–10 c
Ingestion (food and drinking-water) 0.29 0.2–1 d
Total 2.4 1–13
a Range from sea level to high ground elevation.b Depending on radionuclide composition of soil and building material.c Depending on indoor accumulation of radon gas.d Depending on radionuclide composition of foods and drinking water.
Adapted from United Nations. Sources and effects of ionizing radiation. UNSCEAR 2008 Report to the General Assembly with scientific annexes. Vol 1 Annex B Exposures of the public and workers from various sources of radia-tion. United Nations, New York 2010.
Table A2.2 Examples of typical effective doses from diagnostic radiological medical procedures
Source of exposure Effective dose
Dental X-ray 0.005 mSv
Chest X-ray (single PA film) 0.02 mSv
Skull X-ray 0.06 mSv (*)
Mammography 0.4 mSv
Lumbar spine X-ray 1 mSv
Head CT scan 2 mSv
Chest CT scan 8 mSv
Abdomen and pelvis CT scan 15 mSv
(*) As an example, this level of dose is comparable to the typical effective dose resulting from external exposure to cosmic rays received during a transatlantic flight.
Annex 2. Examples of doses from different sources of exposure

80 / preliminary dose estimation from the nuclear accident after the 2011 Great east Japan earthquake and tsunami
1. Inhalation dose coefficients
Table A3.1 Effective inhalation dose coefficients for members of the public: adults, children, and infants
Radionuclide Radionuclide form
Lung absorption type
Committed effective dose coefficient –
adult (Sv/Bq)
Committed effective dose coefficient –
10-year-old child (Sv/Bq)
Committed effective dose coefficient –
1-year-old infant (Sv/Bq)
103Ru Particulate aerosol M 2.4 10-9 3.5 10-9 8.4 10-9
106Ru Particulate aerosol M 2.8 10-8 4.1 10-8 1.1 10-7
127mTe Particulate aerosol M 7.4 10-9 1.1 10-8 2.6 10-8
129mTe Particulate aerosol M 6.6 10-9 9.8 10-9 2.6 10-8
131mTe Particulate aerosol M 9.4 10-10 1.9 10-9 5.8 10-9
132Te Particulate aerosol M 2.0 10-9 4.0 10-9 1.3 10-8
131I Elemental vapour F 2.0 10-8 4.8 10-8 1.6 10-7
Particulate aerosol F 7.4 10-9 1.9 10-8 7.2 10-8
132I Elemental vapour F 3.1 10-10 6.4 10-10 2.3 10-9
Particulate aerosol F 9.4 10-11 2.2 10-10 9.6 10-10
133I Elemental vapour F 4.0 10-9 9.7 10-9 4.1 10-8
Particulate aerosol F 1.5 10-9 3.8 10-9 1.8 10-8
135I Elemental vapour F 9.2 10-10 2.1 10-9 8.5 10-9
Particulate aerosol F 3.2 10-10 7.9 10-10 3.7 10-9
134Cs Particulate aerosol F 6.6 10-9 5.3 10-9 7.3 10-9
137Cs Particulate aerosol F 4.6 10-9 3.7 10-9 5.4 10-9
137mBa – – – – –
140Ba Particulate aerosol M 5.1 10-9 7.6 10-9 2.0 10-8
141Ce Particulate aerosol M 3.2 10-9 4.6 10-9 1.1 10-8
144Ce Particulate aerosol M 3.6 10-8 5.5 10-8 1.6 10-7
Source: ICRP database of dose coefficients: workers and members of the public (v2.0.1).Note: For the purposes of the assessment it has been assumed that the iodine was in elemental vapour form.Data are for particle sizes of AMAD = 1.0 micron unless stated otherwise.
Annex 3. Input parameters for the dose assessment
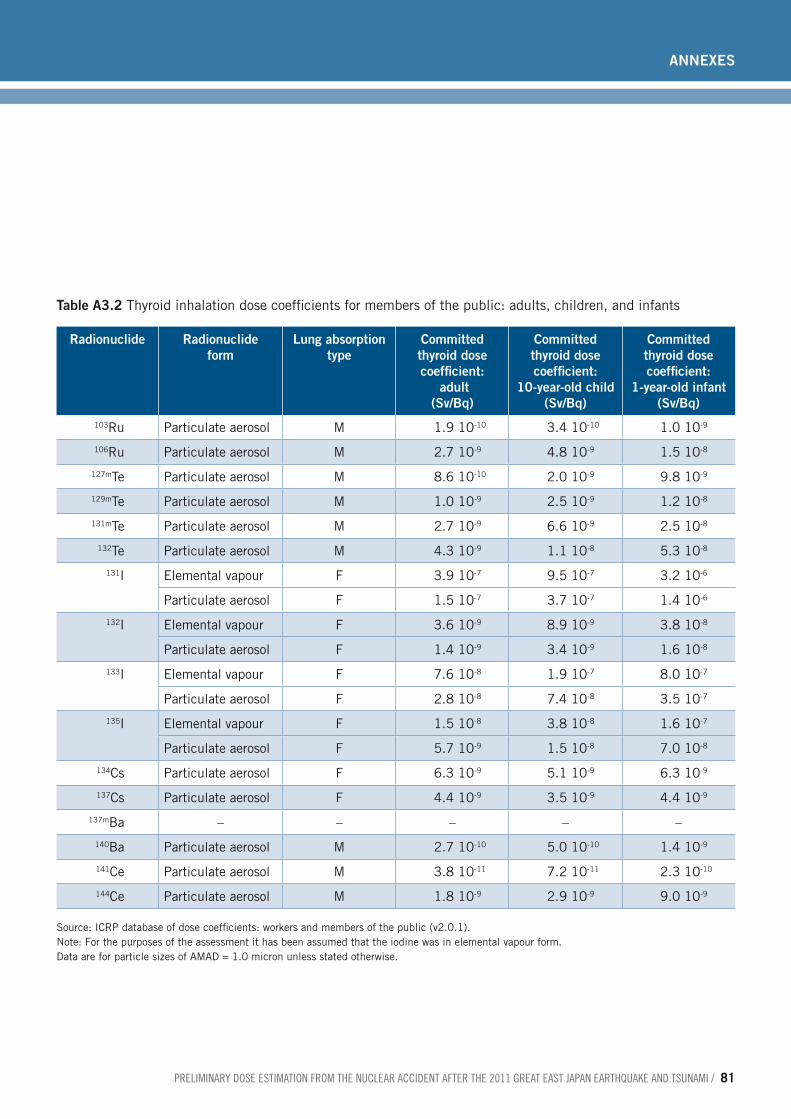
preliminary dose estimation from the nuclear accident after the 2011 Great east Japan earthquake and tsunami / 81
annexes
Table A3.2 Thyroid inhalation dose coefficients for members of the public: adults, children, and infants
Radionuclide Radionuclide form
Lung absorption type
Committed thyroid dose coefficient:
adult (Sv/Bq)
Committed thyroid dose coefficient:
10-year-old child (Sv/Bq)
Committed thyroid dose coefficient:
1-year-old infant (Sv/Bq)
103Ru Particulate aerosol M 1.9 10-10 3.4 10-10 1.0 10-9
106Ru Particulate aerosol M 2.7 10-9 4.8 10-9 1.5 10-8
127mTe Particulate aerosol M 8.6 10-10 2.0 10-9 9.8 10-9
129mTe Particulate aerosol M 1.0 10-9 2.5 10-9 1.2 10-8
131mTe Particulate aerosol M 2.7 10-9 6.6 10-9 2.5 10-8
132Te Particulate aerosol M 4.3 10-9 1.1 10-8 5.3 10-8
131I Elemental vapour F 3.9 10-7 9.5 10-7 3.2 10-6
Particulate aerosol F 1.5 10-7 3.7 10-7 1.4 10-6
132I Elemental vapour F 3.6 10-9 8.9 10-9 3.8 10-8
Particulate aerosol F 1.4 10-9 3.4 10-9 1.6 10-8
133I Elemental vapour F 7.6 10-8 1.9 10-7 8.0 10-7
Particulate aerosol F 2.8 10-8 7.4 10-8 3.5 10-7
135I Elemental vapour F 1.5 10-8 3.8 10-8 1.6 10-7
Particulate aerosol F 5.7 10-9 1.5 10-8 7.0 10-8
134Cs Particulate aerosol F 6.3 10-9 5.1 10-9 6.3 10-9
137Cs Particulate aerosol F 4.4 10-9 3.5 10-9 4.4 10-9
137mBa – – – – –
140Ba Particulate aerosol M 2.7 10-10 5.0 10-10 1.4 10-9
141Ce Particulate aerosol M 3.8 10-11 7.2 10-11 2.3 10-10
144Ce Particulate aerosol M 1.8 10-9 2.9 10-9 9.0 10-9
Source: ICRP database of dose coefficients: workers and members of the public (v2.0.1).Note: For the purposes of the assessment it has been assumed that the iodine was in elemental vapour form.Data are for particle sizes of AMAD = 1.0 micron unless stated otherwise.
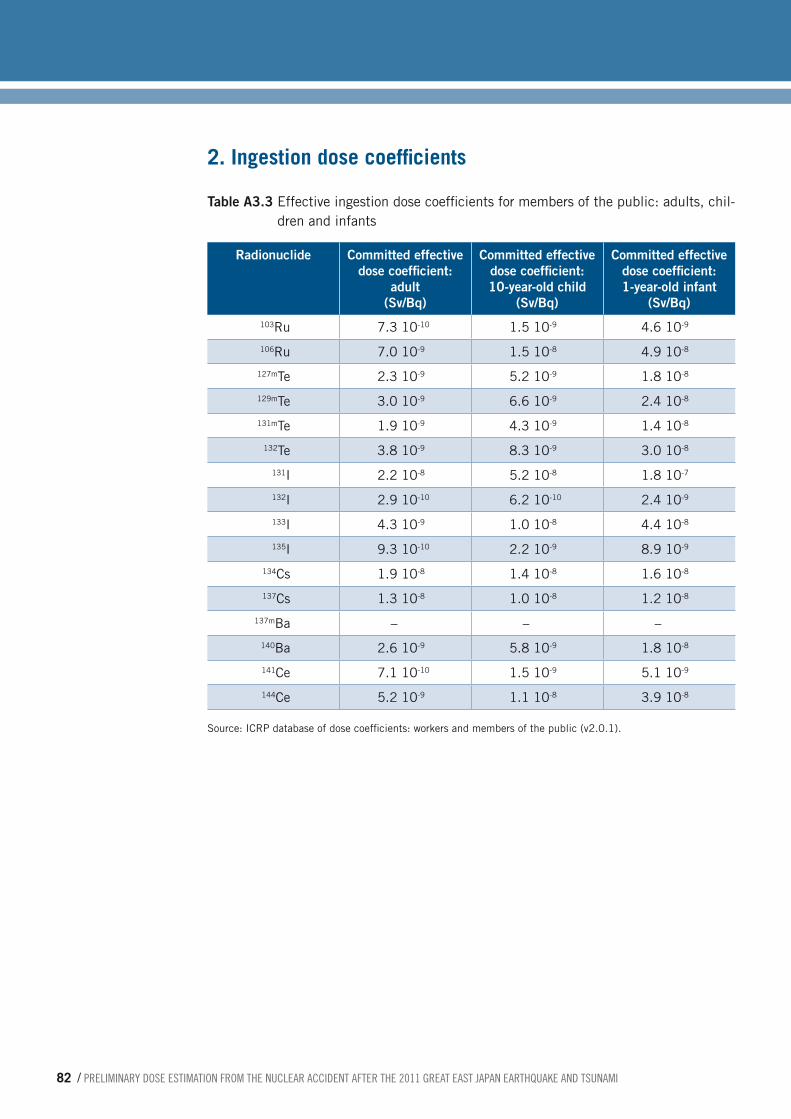
82 / preliminary dose estimation from the nuclear accident after the 2011 Great east Japan earthquake and tsunami
2. Ingestion dose coefficients
Table A3.3 Effective ingestion dose coefficients for members of the public: adults, chil-dren and infants
Radionuclide Committed effective dose coefficient:
adult (Sv/Bq)
Committed effective dose coefficient: 10-year-old child
(Sv/Bq)
Committed effective dose coefficient: 1-year-old infant
(Sv/Bq)103Ru 7.3 10-10 1.5 10-9 4.6 10-9
106Ru 7.0 10-9 1.5 10-8 4.9 10-8
127mTe 2.3 10-9 5.2 10-9 1.8 10-8
129mTe 3.0 10-9 6.6 10-9 2.4 10-8
131mTe 1.9 10-9 4.3 10-9 1.4 10-8
132Te 3.8 10-9 8.3 10-9 3.0 10-8
131I 2.2 10-8 5.2 10-8 1.8 10-7
132I 2.9 10-10 6.2 10-10 2.4 10-9
133I 4.3 10-9 1.0 10-8 4.4 10-8
135I 9.3 10-10 2.2 10-9 8.9 10-9
134Cs 1.9 10-8 1.4 10-8 1.6 10-8
137Cs 1.3 10-8 1.0 10-8 1.2 10-8
137mBa – – –
140Ba 2.6 10-9 5.8 10-9 1.8 10-8
141Ce 7.1 10-10 1.5 10-9 5.1 10-9
144Ce 5.2 10-9 1.1 10-8 3.9 10-8
Source: ICRP database of dose coefficients: workers and members of the public (v2.0.1).

preliminary dose estimation from the nuclear accident after the 2011 Great east Japan earthquake and tsunami / 83
annexes
Table A3.4 Thyroid ingestion dose coefficients for members of the public: adults, chil-dren and infants
Radionuclide Committed thyroid dose coefficient:
adult (Sv/Bq)
Committed thyroid dose coefficient: 10-year-old child
(Sv/Bq)
Committed thyroid dose coefficient: 1-year-old infant
(Sv/Bq)103Ru 6.7 10-11 1.3 10-10 4.1 10-10
106Ru 1.4 10-9 2.8 10-9 8.7 10-9
127mTe 3.1 10-9 7.7 10-9 3.4 10-8
129mTe 4.6 10-9 1.1 10-8 5.1 10-8
131mTe 1.8 10-8 4.5 10-8 1.5 10-7
132Te 3.1 10-8 7.5 10-8 3.2 10-7
131I 4.3 10-7 1.0 10-6 3.6 10-6
132I 3.4 10-9 8.3 10-9 3.5 10-8
133I 8.2 10-8 2.0 10-7 8.6 10-7
135I 1.6 10-8 3.9 10-8 1.7 10-7
134Cs 1.8 10-8 1.4 10-8 1.6 10-8
137Cs 1.3 10-8 9.7 10-9 1.1 10-8
137mBa – – –
140Ba 8.7 10-11 4.2 10-10 8.3 10-10
141Ce 3.0 10-13 8.6 10-13 4.5 10-12
144Ce 1.2 10-11 2.2 10-11 6.8 10-11
Source: ICRP database of dose coefficients: workers and members of the public (v2.0.1).
3. Inhalation ratesThe inhalation rates applied are the average rates over a day from the ICRP model of the respiratory tract and include time spent sleeping, at home and at work, and hence they are suitable for someone exposed for 24 hours a day. For time spent at work, the inhala-tion rate is modelled on the male sedentary worker.
Table A3.5 Inhalation rates for adults, children and infants (average over a day)
Age group Inhalation rate (m3/d) Inhalation rate (m3/s)
Adult (sedentary worker) 22.18 2.57 10-4
Child (10-year-old) 15.28 1.77 10-4
Infant (1-year-old) 5.20 6.02 10-5
Source: Human respiratory tract model for radiological protection. ICRP Publication 66, Ann. ICRP 24 (1-3), 1994.

84 / preliminary dose estimation from the nuclear accident after the 2011 Great east Japan earthquake and tsunami
4. External dose per unit depositExternal dose coefficients per unit deposit for members of the public (adults, children and infants) were used for both effective dose and thyroid dose. The values were data used in the European decision support system RODOS, and are taken from Jacob P et al (see Source below tables). The values shown in Tables A3.6 and A3.7 were applied in this assessment.
Table A3.6 External dose coefficients per unit deposit for members of the public: adults, children and infants (effective dose, exposure over 1 year)
Radionuclide Effective dose coefficient:
adult (Sv per Bq/m2)
Effective dose coefficient:
10-year-old child (Sv per Bq/m2)
Effective dose coefficient :
1-year-old infant (Sv per Bq/m2)
103Ru 1.5 10-9 1.6 10-9 2.0 10-9
106Ru 3.0 10-9 3.3 10-9 4.0 10-9
127mTe 2.1 10-11 2.5 10-11 4.4 10-11
129mTe 1.8 10-10 2.0 10-10 2.5 10-10
131mTe 1.3 10-10 1.5 10-10 1.8 10-10
132Te 6.5 10-10 7.2 10-10 8.6 10-10
131I 2.5 10-10 2.7 10-10 3.3 10-10
132I 1.7 10-11 1.9 10-11 2.3 10-11
133I 4.2 10-11 4.5 10-11 5.7 10-11
135I 3.2 10-11 3.5 10-11 4.2 10-11
134Cs 2.7 10-8 3.0 10-8 3.6 10-8
137Cs 1.2 10-8 1.2 10-8 1.6 10-8
137mBa # # #
140Ba 2.8 10-9 3.0 10-9 3.6 10-9
141Ce 1.8 10-10 2.0 10-10 2.5 10-10
144Ce 6.4 10-10 7.1 10-10 8.5 10-10
Source: Jacob P et al. Calculation of organ doses from environmental gamma rays using human phantoms and Monte-Carlo methods. Part 2: Radionuclides distributed in air or deposited on the ground. (GSF-Report 12/90). Neuherberg, GSF National Research Center on Environment and Health, 1990.
# 137mBa is already included in the dose factor of mother nuclide 137Cs.

preliminary dose estimation from the nuclear accident after the 2011 Great east Japan earthquake and tsunami / 85
annexes
Table A3.7 External dose coefficients per unit deposit for members of the public: adults, children and infants (thyroid dose, exposure over 1 year)
Radionuclide Thyroid dose coefficient:
adult (Sv per Bq/m2)
Thyroid dose coefficient: 1
0-year-old child (Sv per Bq/m2)
Thyroid dose coefficient :
1-year-old infant (Sv per Bq/m2)
103Ru 1.6 10-9 1.8 10-9 1.9 10-9
106Ru 3.3 10-9 3.6 10-9 3.9 10-9
127mTe 1.8 10-11 2.4 10-11 3.7 10-11
129mTe 2.0 10-10 2.2 10-10 2.4 10-10
131mTe 1.4 10-10 1.6 10-10 1.8 10-10
132Te 7.1 10-10 7.8 10-10 8.8 10-10
131I 2.7 10-10 2.8 10-10 3.3 10-10
132I 1.9 10-11 2.1 10-11 2.3 10-11
133I 4.5 10-11 5.1 10-11 5.4 10-11
135I 3.5 10-11 4.0 10-11 4.3 10-11
134Cs 2.9 10-8 3.2 10-8 3.6 10-8
137Cs 1.2 10-8 1.4 10-8 1.6 10-8
137mBa # # #
140Ba 3.0 10-9 3.4 10-9 3.7 10-9
141Ce 1.9 10-10 2.1 10-10 2.5 10-10
144Ce 6.8 10-10 7.5 10-10 8.5 10-10
Source: Jacob P et al. Calculation of organ doses from environmental gamma rays using human phantoms and Monte-Carlo methods. Part 2: Radionuclides distributed in air or deposited on the ground. (GSF-Report 12/90). Neuherberg, GSF National Research Center on Environment and Health, 1990.
# 137mBa is already included in the dose factor of mother nuclide 137Cs.

86 / preliminary dose estimation from the nuclear accident after the 2011 Great east Japan earthquake and tsunami
5. Dose reduction factor: external dose from radioactive material in airA dose reduction factor to represent the saving in external dose from radioactive material in the air due to being indoors has been applied in the assessment, based on an assumed location factor and building occupancy factor.
Table A3.8 Dose reduction factor for external dose from radioactive material in air (from http://radioactivity.mext.go.jp/en/1750/2011/04/1305904_0424e.pdf)
Cloud gamma location factor (indoors) 0.4
Occupancy factor 66%
Cloud gamma dose reduction factor 0.60 [0.66 x 0.4 + (1 - 0.66) x 1]
Table A3.9 Dose reduction factor for external dose from ground deposits (from http://radioactivity.mext.go.jp/en/1750/2011/04/1305904_0424e.pdf)
Deposited gamma location factor (indoors) 0.4
Occupancy factor 66%
Deposited gamma dose reduction factor 0.60 [0.66 x 0.4 + (1 - 0.66) x 1]

preliminary dose estimation from the nuclear accident after the 2011 Great east Japan earthquake and tsunami / 87
annexes
Annex 4. Source term for use in dispersion-based calculations
The assessment of doses outside Japan, which was based on atmospheric dispersion modelling, required an assumed source term as input data. As defined here, a source term is the amount of each radionuclide released (or postulated to be released), and the timing of the releases of each radionuclide. Using both environmental monitoring data and computer simulation based on atmospheric dispersion modelling of radioactive ma-terials, the Japan Atomic Energy Agency (JAEA) provided estimates of the source term of iodine and caesium discharged from the Fukushima Daiichi nuclear power plant into the atmosphere.
In this report, two source terms have been used to assess doses to countries outside Japan.
Source term S1, was based on Bannai, 2011 and revised to take account of the correc-tions (to 132I, 133I, 135I, 131mTe and 132Te), as reported by personal communication with Yuji Otake, representative from the Ministry of Foreign Affairs of Japan (MOFA)1. The source term is a function of time and spans the period 12−18 March 2011. The basis for the source term was operational records, observed parameters and the chronology of events at the site.
Source term S2, was based on
■ releases of 131I and 137Cs: based on Chino et al, 2011 revised to account for the greater detail given in the report by the Government of Japan, 2011, and further revised in agreement with Dr Chino’s suggested changes to duration of the release;
■ releases of 133Xe: based on Bannai, 2011;
■ releases of 134Cs: based on a 137Cs/134Cs scaling factor derived from Bannai, 2011 and applied to the Chino et al, 2011 137Cs source term.
Source term S2 spans a longer period from 12 March to 6 April 2011. Chino et al, 2011 estimated release rates using a “reverse estimation method” by coupling environmental monitoring data with atmospheric dispersion simulations. This involved dividing mea-sured air concentrations of 131I and 137Cs into modelled ones at sampling points and using this ratio to scale the modelled source term.
1. Personal communication and subsequent press release of the Government of Japan, on 20 October 2011, of which the English translation is: http://translate.google.co.uk/translate?sl=auto&tl=en&js=n&prev=_t&hl=en&ie=UTF-8&layout=2&eotf=1&u=http%3A%2F%2Fwww.meti.go.jp%2Fpress%2F2011%2F10%2F20111020001%2F20111020001.html

88 / preliminary dose estimation from the nuclear accident after the 2011 Great east Japan earthquake and tsunami
Table A4.1 Source terms S1 and S2 (Bq)
Source Term S1 Source Term S2
140Ba 3.13E+15 –
134Cs 1.76E+16 1.13E+16
137Cs 1.53E+16 9.66E+15
141Ce 1.77E+13 –
144Ce 1.15E+13 –
131I 1.59E+17 1.24E+17
132I 1.30E+13 –
133I 4.21E+16 –
135I 2.27E+15 –
103Ru 7.50E+09 –
106Ru 2.14E+09 –
127mTe 1.09E+15 –
129mTe 3.33E+15 –
131mTe 4.95E+15 –
132Te 8.80E+16 –
133Xe 1.13E+19 1.13E+19
Other relevant information
Other elements are relevant to the source term – particularly the elevation of the release and the particle size of the dispersing material. In the absence of specific information, a release spread along the vertical from 0 metres to 100 metres has been assumed. No information on the size distribution of the particles released was available. It was as-sumed that all particles were 1 µm AMAD for all non-noble gas radionuclides (i.e. every radionuclide other than 133Xe). 133Xe was modelled as a gas. Deposition velocities of 1 10-2 m s-1 for isotopes of iodine (elemental iodine vapour) and 1 10-3 m s-1 for all other depositing radionuclides were applied.
References to Annex 4Additional Report of the Japanese Government to the IAEA. The accident at TEPCO's Fukushima nuclear power stations, second report., September 2011 (http://www.meti.go.jp/english/earthquake/nuclear/iaea/iaea_110911.html, accessed 30 March 2012).
Bannai T. Regarding the evaluation of the conditions on reactor cores of Units 1, 2 and 3 related to the accident at Fukushima Dai-ichi nuclear power station. Tokyo Electric Power Co. Inc. Tokyo, Nuclear and Industrial Safety Agency, 2011.

preliminary dose estimation from the nuclear accident after the 2011 Great east Japan earthquake and tsunami / 89
annexes
Chino M et al. Preliminary estimation of release amounts of 131I and 137Cs acciden-tally discharged from the Fukushima Daiichi nuclear power plant into the atmosphere. Journal of Nuclear Science and Technology, 2011, 48(7):1129−1134.
Stohl A et al. Xenon-133 and caesium-137 releases into the atmosphere from the Fuku-shima Dai-ichi nuclear power plant: determination of the source term, atmospheric dis-persion, and deposition. Atmospheric Chemistry and Physics, 2011, 11:28319−28394 (http://www.atmos-chem-phys.net/12/2313/2012/acp-12-2313-2012.pdf, accessed 130 May 2012).

90 / preliminary dose estimation from the nuclear accident after the 2011 Great east Japan earthquake and tsunami
This annex lists some of the basic input data used in the dose assessment for three settlements − IItate, Katsurao and Namie − in the deliberate evacuation area. The doses were estimated on the basis of the average values (for each settlement) of monitoring data for the surface activity density of 137Cs.
Figure A5.1 Monitoring sites of data used as input for dose assessment for IItate, Kat-surao and Namie. GDR: Gamma Dose Rates
Annex 5. Example of input monitoring data from Japan
Ryozen
Itsudate
Kawamata
Katsurao
Itate
Soma
Kashima
Haramashi
Odaka
Namie
Futaba
Okuma
Tomioka
Naraha
Hirono
Kawaichi
0.0 – 0.1 μSv/h0.1 – 0.20.2 – 0.50.5 – 11 – 1.91.9 – 3.83.8 – 9.59.5 – 1919 –
GDR at Aug 8,2011

preliminary dose estimation from the nuclear accident after the 2011 Great east Japan earthquake and tsunami / 91
annexes
Table A5.1 Monitoring data for the surface activity density of 137Cs used as input for dose assessment for IItate town
Latitude LongitudeACs137
(Bq/m2)
37.613556 140.80025 979939
37.603028 140.785278 1592481
37.607583 140.766556 1345789
37.60975 140.731111 455527
37.615917 140.708056 664481
37.625389 140.810528 1354264
37.618917 140.797056 597467
37.628806 140.773111 1274462
37.618417 140.749361 993816
37.63305 140.720871 851040
37.618611 140.703556 1087038
37.619306 140.694944 965700
37.644583 140.808778 621607
37.638056 140.798167 1527598
37.639389 140.763472 956600
37.645744 140.735016 740202
37.646611 140.680667 715162
37.656444 140.783167 254377
37.658028 140.768472 1289455
37.664222 140.732806 753436
37.664028 140.721028 881912
37.661361 140.697194 281150
37.677417 140.806861 345334
37.681222 140.780194 794992
37.679147 140.773328 484259
37.679194 140.738 956620
37.675694 140.70425 738168
37.668056 140.683806 490616
37.688111 140.80225 500720
37.693472 140.777528 370842
37.693642 140.757438 848547
37.690611 140.733944 379905

92 / preliminary dose estimation from the nuclear accident after the 2011 Great east Japan earthquake and tsunami
Latitude LongitudeACs137
(Bq/m2)
37.689806 140.720083 1038643
37.694472 140.6975 403758
37.6845 140.659333 273571
37.704389 140.80575 390523
37.704111 140.780194 634331
37.707972 140.758528 945709
37.707 140.741139 485533
37.70425 140.713139 804183
37.715694 140.694722 739814
37.726783 140.834833 142509
37.731917 140.808278 335451
37.725028 140.787278 327865
37.717518 140.76332 302717
37.728611 140.734028 616293
37.720194 140.720972 420757
37.722528 140.688139 751964
37.738703 140.805588 116758
37.737083 140.756972 299710
37.736 140.745083 549939
37.746778 140.713889 587715
37.735528 140.697833 880765
Average 701000
Source: extracted from http://www.mext.go.jp/b_menu/shingi/chousa/gijyutu/017/shiryo/__icsFiles/afieldfile/2011/ 09/02/1310688_1.pdf.
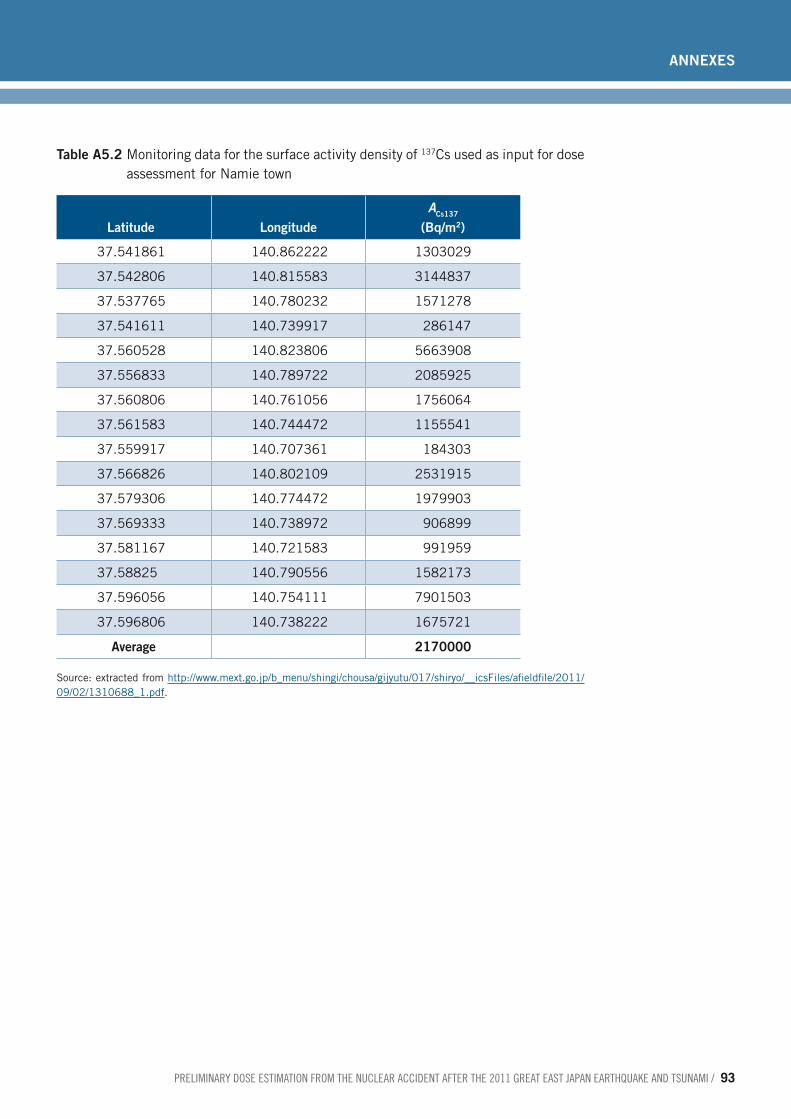
preliminary dose estimation from the nuclear accident after the 2011 Great east Japan earthquake and tsunami / 93
annexes
Table A5.2 Monitoring data for the surface activity density of 137Cs used as input for dose assessment for Namie town
Latitude LongitudeACs137
(Bq/m2)
37.541861 140.862222 1303029
37.542806 140.815583 3144837
37.537765 140.780232 1571278
37.541611 140.739917 286147
37.560528 140.823806 5663908
37.556833 140.789722 2085925
37.560806 140.761056 1756064
37.561583 140.744472 1155541
37.559917 140.707361 184303
37.566826 140.802109 2531915
37.579306 140.774472 1979903
37.569333 140.738972 906899
37.581167 140.721583 991959
37.58825 140.790556 1582173
37.596056 140.754111 7901503
37.596806 140.738222 1675721
Average 2170000
Source: extracted from http://www.mext.go.jp/b_menu/shingi/chousa/gijyutu/017/shiryo/__icsFiles/afieldfile/2011/ 09/02/1310688_1.pdf.

94 / preliminary dose estimation from the nuclear accident after the 2011 Great east Japan earthquake and tsunami
Table A5.3 Monitoring data for the surface activity density of 137Cs used as input for dose assessment for Katsurao
Latitude LongitudeACs137
(Bq/m2)
37.48 140.803417 201006
37.481917 140.777861 363009
37.48575 140.807722 158117
37.49375 140.787917 224726
37.488 140.764833 131903
37.506972 140.815056 406894
37.506833 140.79075 299681
37.504111 140.764444 393280
37.504694 140.742639 190366
37.508944 140.716222 220665
37.52575 140.806 1236706
37.522333 140.77775 310008
37.526306 140.76075 384797
37.52875 140.735222 57320
37.533111 140.714 267997
37.537222 140.701444 134859
37.535 140.698417 191129
Average 304000
Source: extracted from http://www.mext.go.jp/b_menu/shingi/chousa/gijyutu/017/shiryo/__icsFiles/afieldfile/2011/ 09/02/1310688_1.pdf.

preliminary dose estimation from the nuclear accident after the 2011 Great east Japan earthquake and tsunami / 95
annexes
Annex 6. Models for external and inhalation doses in Japan (Approach A and Approach B)
In the assessment of external and inhalation doses in Japan, two approaches were de-veloped to calculate the effective and thyroid doses for three age groups. This annex describes the mathematical models and input data used in the calculations.
1. Model for external dose from nuclides deposited on soil
1.1 Effective dose
Approach A: the effective dose Eidep and effective dose rate Ei
dep (t) of the population group i from deposited radionuclides were calculated by means of computational model developed after the Chernobyl accident (1−4):
E E t dtidep
idep= ∫ ( ) E t K t k RFi
depair i i( ) ( )= ⋅ ⋅ (1)
K t r t A AA
dairm
mmdep( ) ( ) ( ) exp(.
= ⋅ ⋅ ⋅ ⋅ −∑Cs137Cs137
λλm t⋅ ) (2)
where:
■ the summation index m is for deposited radionuclides;
■■ λm is the decay constant of radionuclide m;
■ dmdep is the dose rate coefficient from surface activity density to kerma rate in free air K tair ( ) for height of 1 m above ground due to initial distribution of radionuclide m in
the ground (5 [Table 1]);
■ Am is the surface activity density of radionuclide m on the ground;
■ RFi is a reduction factor for population group i (assumed to be 0.6 for all population groups in Japan, Table A3.9 in Annex 3);
■ ki is a conversion factor from kerma in free air to the effective dose, independent of location and time after the accident: 0.75 Sv Gy-1 for adults, 0.80 Sv Gy-1 for children (10 years) and 0.90 Sv Gy-1 for infants (1 year) (6);
■ r(t) is a time dependent attenuation function1 that accounts for radionuclide penetra-tion in the soil (2−4).
Approach B differs from approach A in:
■ using dose coefficients per unit deposit (5, see Table A3.6 in Annex 3) instead of dose rate coefficients and conversion factors ki ;
■ using slightly different nuclide ratios Am / ACs137 (see Table A6.1);
1. This attenuation function r(t) represents the influence of the radionuclide migration into the soil on the gamma dose rate and was fitted in the form: r t p
Tt p
Tt( ) exp ln exp ln
= ⋅ − ⋅
+ ⋅ − ⋅
1
12
2
2 2 where p1=0.34, p2=0.66, T1=1.5 years and T2=50 years.
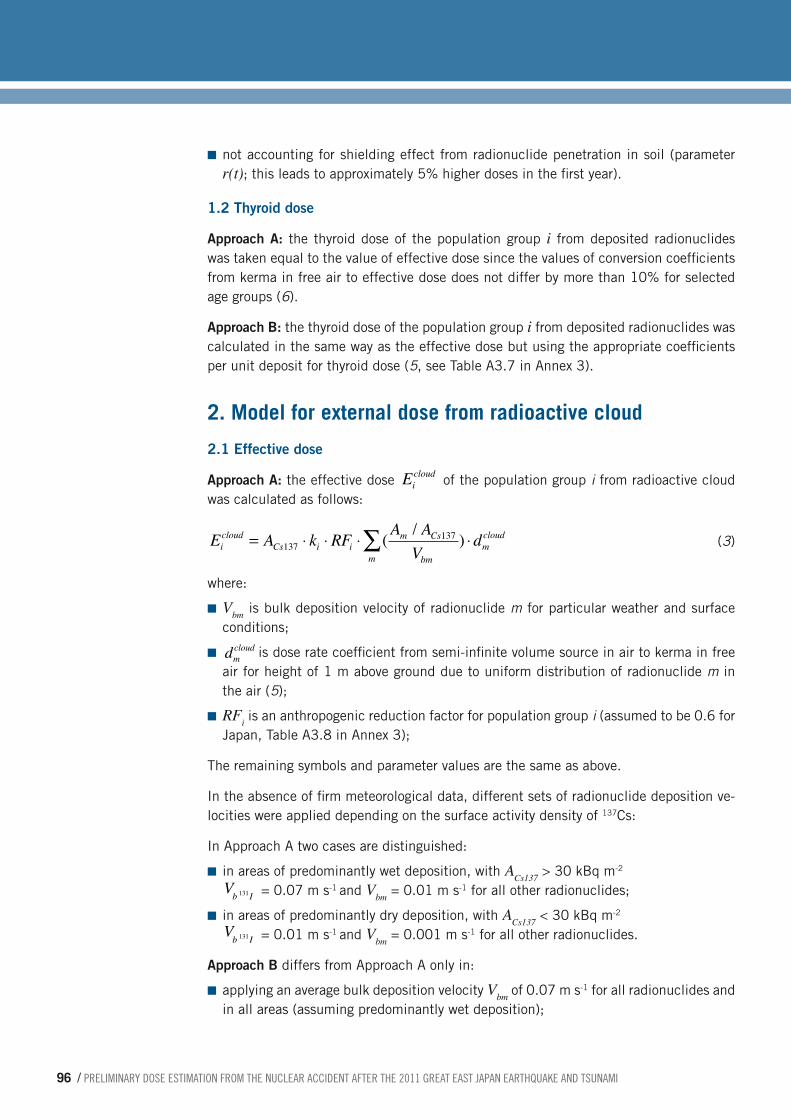
96 / preliminary dose estimation from the nuclear accident after the 2011 Great east Japan earthquake and tsunami
■ not accounting for shielding effect from radionuclide penetration in soil (parameter r(t); this leads to approximately 5% higher doses in the first year).
1.2 Thyroid dose
Approach A: the thyroid dose of the population group i from deposited radionuclides was taken equal to the value of effective dose since the values of conversion coefficients from kerma in free air to effective dose does not differ by more than 10% for selected age groups (6).
Approach B: the thyroid dose of the population group i from deposited radionuclides was calculated in the same way as the effective dose but using the appropriate coefficients per unit deposit for thyroid dose (5, see Table A3.7 in Annex 3).
2. Model for external dose from radioactive cloud
2.1 Effective dose
Approach A: the effective dose Eicloud of the population group i from radioactive cloud
was calculated as follows:
E A k RF A AV
dicloud
Cs i im Cs
bmmmcloud= ⋅ ⋅ ⋅ ⋅∑137
137( / ) (3)
where:
■ Vbm is bulk deposition velocity of radionuclide m for particular weather and surface conditions;
■ dmcloud is dose rate coefficient from semi-infinite volume source in air to kerma in free air for height of 1 m above ground due to uniform distribution of radionuclide m in the air (5);
■ RFi is an anthropogenic reduction factor for population group i (assumed to be 0.6 for Japan, Table A3.8 in Annex 3);
The remaining symbols and parameter values are the same as above.
In the absence of firm meteorological data, different sets of radionuclide deposition ve-locities were applied depending on the surface activity density of 137Cs:
In Approach A two cases are distinguished:
■ in areas of predominantly wet deposition, with ACs137 > 30 kBq m-2 Vb I131 = 0.07 m s-1 and Vbm = 0.01 m s-1 for all other radionuclides;
■ in areas of predominantly dry deposition, with ACs137 < 30 kBq m-2
Vb I131 = 0.01 m s-1 and Vbm = 0.001 m s-1 for all other radionuclides.
Approach B differs from Approach A only in:
■ applying an average bulk deposition velocity Vbm of 0.07 m s-1 for all radionuclides and in all areas (assuming predominantly wet deposition);

preliminary dose estimation from the nuclear accident after the 2011 Great east Japan earthquake and tsunami / 97
annexes
■ using effective dose coefficients per unit air concentration [5] instead of dose rate coefficients in air and conversion factors ki ;
■ using slightly different nuclide ratios Am / ACs137 (see Table A6.1).
2.2 Thyroid dose
Approach A: the thyroid dose of the population group i from radioactive cloud was taken equal to the value of effective dose as in the case of deposited radionuclides.
Approach B: the thyroid dose of the population group i from radioactive cloud was cal-culated in the same way as the effective dose but using the appropriate coefficients per unit air concentration for thyroid dose (5).
3. Model for internal dose from inhalation
3.1 Effective dose
Approach A: the effective dose Eiinh of the population group i from inhalation of radioac-
tive materials was calculated according to:
E A I A AV
diinh
Cs im Cs
bmmmiinh= ⋅ ⋅ ⋅∑137
137( / ) (4)
where:
■ Vbm is the bulk deposition velocity of radionuclide m;
■ Ii is the breathing rate for population group (Table A3.5 in Annex 3);
■ dmiinh is the effective dose inhalation coefficient for population group i and radionuclide m (Tables A3.1 in Annex 3).
The remaining symbols and parameter values are the same as above.
No protection is assumed due to being indoors for a proportion of the time.
Approach B differs from approach A only in:
■ using different sets of radionuclide deposition velocities (as in the case of dose assess-ment from the radioactive cloud);
■ using slightly different nuclide ratios Am / ACs137 (see Table A6.1).
3.2 Thyroid dose
Thyroid equivalent dose was also calculated by equation (4); however, a different set of dose coefficient values was applied (see Table A3.2 in Annex 3).
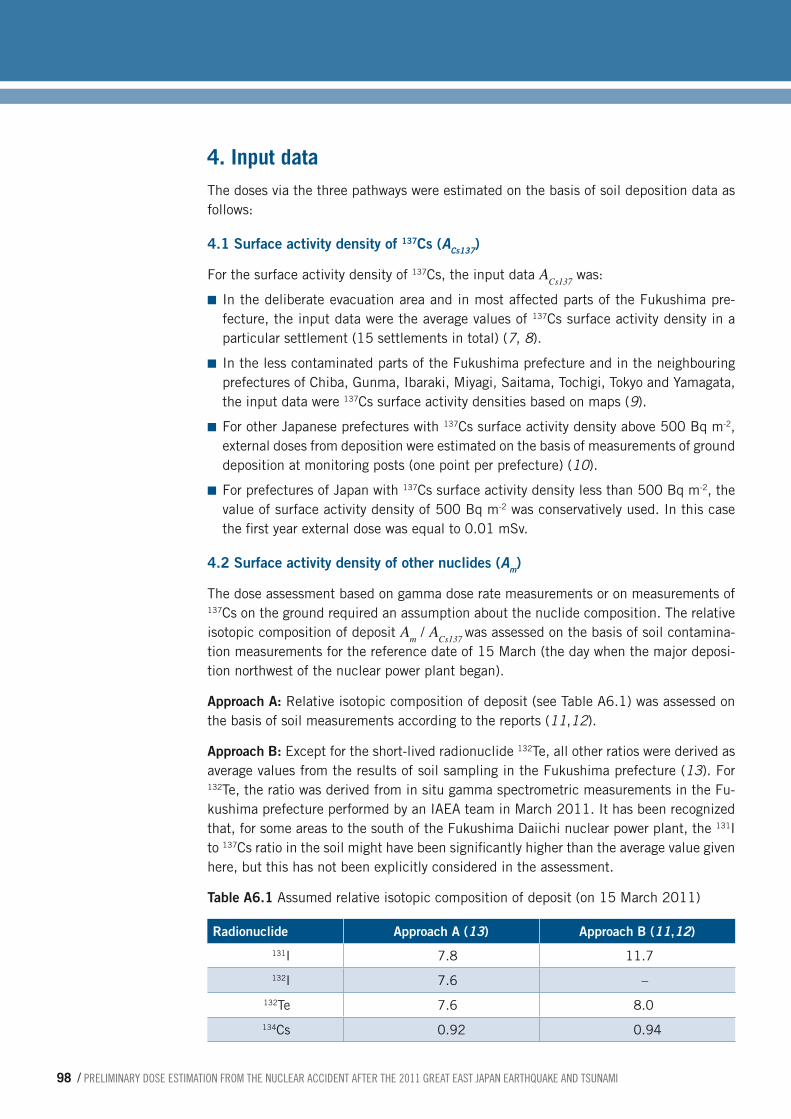
98 / preliminary dose estimation from the nuclear accident after the 2011 Great east Japan earthquake and tsunami
4. Input data The doses via the three pathways were estimated on the basis of soil deposition data as follows:
4.1 Surface activity density of 137Cs (Acs137)
For the surface activity density of 137Cs, the input data ACs137 was:
■ In the deliberate evacuation area and in most affected parts of the Fukushima pre-fecture, the input data were the average values of 137Cs surface activity density in a particular settlement (15 settlements in total) (7, 8).
■ In the less contaminated parts of the Fukushima prefecture and in the neighbouring prefectures of Chiba, Gunma, Ibaraki, Miyagi, Saitama, Tochigi, Tokyo and Yamagata, the input data were 137Cs surface activity densities based on maps (9).
■ For other Japanese prefectures with 137Cs surface activity density above 500 Bq m-2, external doses from deposition were estimated on the basis of measurements of ground deposition at monitoring posts (one point per prefecture) (10).
■ For prefectures of Japan with 137Cs surface activity density less than 500 Bq m-2, the value of surface activity density of 500 Bq m-2 was conservatively used. In this case the first year external dose was equal to 0.01 mSv.
4.2 Surface activity density of other nuclides (Am)
The dose assessment based on gamma dose rate measurements or on measurements of 137Cs on the ground required an assumption about the nuclide composition. The relative isotopic composition of deposit Am / ACs137 was assessed on the basis of soil contamina-tion measurements for the reference date of 15 March (the day when the major deposi-tion northwest of the nuclear power plant began).
Approach A: Relative isotopic composition of deposit (see Table A6.1) was assessed on the basis of soil measurements according to the reports (11,12).
Approach B: Except for the short-lived radionuclide 132Te, all other ratios were derived as average values from the results of soil sampling in the Fukushima prefecture (13). For 132Te, the ratio was derived from in situ gamma spectrometric measurements in the Fu-kushima prefecture performed by an IAEA team in March 2011. It has been recognized that, for some areas to the south of the Fukushima Daiichi nuclear power plant, the 131I to 137Cs ratio in the soil might have been significantly higher than the average value given here, but this has not been explicitly considered in the assessment.
Table A6.1 Assumed relative isotopic composition of deposit (on 15 March 2011)
Radionuclide Approach A (13) Approach B (11,12)131I 7.8 11.7
132I 7.6 –
132Te 7.6 8.0
134Cs 0.92 0.94

preliminary dose estimation from the nuclear accident after the 2011 Great east Japan earthquake and tsunami / 99
annexes
Radionuclide Approach A (13) Approach B (11,12)136Cs 0.16 0.2
137Cs 1 1
140Ba – 0.1
110mAg – 0.01
129mTe – 1.5
Source: Dose readings and estimates of the Ministry of Education, Culture, Sports, Science and Technology, at: http://radioactivity.mext.go.jp/en/1750/2011/04/1305904_0424e.pdf, accessed 30 March 2012.
References to Annex 61. Golikov VYu, Balonov MI, Ponomarev AV. Estimation of external gamma radiation
doses to the population after the Chernobyl accident. In: Merwin SE, Balonov MI, eds. The Chernobyl papers, Vol. 1. Richland, WA, Research Enterprises Publishing Segment, 1993 (pp. 247−288).
2. Jacob P et al. Pathway analysis and dose distributions. (Report EUR 16541 EN). Brussels, European Commission, 1996.
3. Golikov V, Balonov M, Erkin V, Jacob P. Model validation for external doses due to environmental contamination by the Chernobyl accident. Health Physics, 1999, 77(6):654−661.
4. Golikov VYu, Balonov MI, Jacob P. External exposure of the population living in areas of Russia contaminated due to the Chernobyl accident. Radiation and Environmen-tal Biophysics, 2002, 41(10):185−193.
5. Jacob P et al. Calculation of organ doses from environmental gamma rays using hu-man phantoms and Monte-Carlo methods. Part 2: Radionuclides distributed in air or deposited on the ground. (GSF-Report 12/90). Neuherberg, GSF National Research Center on Environment and Health, 1990.
6. Golikov V et al. Evaluation of conversion coefficients from measurable to risk quanti-ties for external exposure over contaminated soil by use of physical human phan-toms. Radiation and Environmental Biophysics, 2007, 46(4):375−382.
7. Data from the Ministry of Education, Culture, Sports, Science and Technology (http://www.mext.go.jp/b_menu/shingi/chousa/gijyutu/017/shiryo/__icsFiles/afield-file/2011/09/02/1310688_1.pdf, accessed 13 May 2012) (in Japanese).
8. Data from the Ministry of Education, Culture, Sports, Science and Technology (http://www.mext.go.jp/component/english/__icsFiles/afieldfile/2011/08/05/1305904_0720.pdf, accessed 13 May 2012.
9. Data from the Ministry of Education, Culture, Sports, Science and Technology (http://ramap.jaea.go.jp/map/map.html, accessed 13 May 2012) (data obtained on 19 September 2011, in Japanese).
100 / preliminary dose estimation from the nuclear accident after the 2011 Great east Japan earthquake and tsunami
10. Monitoring information of environmental radioactivity level. Tokyo, Ministry of Ed-ucation, Culture, Sports, Science and Technology, March 2011 (ongoing) (http://radioactivity.mext.go.jp/en/monitoring_by_prefecture_fallout, accessed 30 March 2012) (data obtained on 28 September 2011).
11. Synthèse des informations disponibles sur la contamination radioactive de l'environnement terrestre japonais provoquée par l'accident de Fukushima Daiichi. Paris, L'Institut de Radioprotection et de Sûreté Nucléaire, 13 juillet 2011.
12. Iitate Village Area Radioactive Contamination Investigation Team: IMANAKA Tet-suji (Representative), Research Reactor Institute, Kyoto University, ENDO Satori Hiroshima University, Graduate School of Engineering, SHIZUMA Kiyoshi Hiroshi-ma University, Graduate School of Engineering, SUGAI Masuro Kokugakuin Uni-versity, OZAWA Shoji Nihon University, College of Bioresources Sciences. Interim report on radiation survey in Iitate village area conducted on March 28th and 29th. 4 April 2011 (http://www.rri.kyoto-u.ac.jp/NSRG/seminar/No110/Iitate-interim-re-port110404.pdf, accessed 13 May 2012).
13. Readings of soil monitoring around Fukushima NPP. Ministry of Education, Culture, Sports, Science and Technology (http://radioactivity.mext.go.jp/en/ accessed 13 May 2012).
preliminary dose estimation from the nuclear accident after the 2011 Great east Japan earthquake and tsunami / 101
annexes
Annex 7. Models for external and inhalation doses outside Japan (Approach C)
1. Model for external dose from radionuclides deposited on soil
The effective dose Eidep for the population age group i from deposited radionuclides, in
Sv, was calculated as follows:
Eidep = RF
mm m i
depA de∑ ⋅ ,
.
where:
■ Am is the total surface activity density of radionuclide m on the ground, in Bq m-2, estimated by the NAME model;
■ dem idep,
.
is the effective external dose coefficient per unit deposit of radionuclide m for age group i, in Sv per Bq m-2;
■ RF is the dose reduction factor (assumed to be 0.6 for Japan, see Table A3.9 in An-nex 3);
■ m is the summation index over the radionuclides considered.
The thyroid dose Tidep for the population age group i from deposited radionuclides, in Sv, was calculated as follows:
Tidep = RF m
m m idepA de∑ ⋅ ,
.
where:
■ dem idep,
.
is the thyroid external dose coefficient per unit deposit of radionuclide m for age group i, in Sv per Bq m-2.
The remaining symbols and parameter values are the same as above.
2. Model for external dose from radioactive cloudThe external doses from exposure to the radioactive cloud are estimated within the NAME model. NAME uses a combination of a Lagrangian particle approach, which sums the contribution to dose at each receptor point from each individual model particle, and a semi-infinite cloud model, which assumes that all the air in a hemisphere around the person is uniformly contaminated to a radius sufficient to account for the range of the radiation in air. The approaches are summarized in the reference (1).
The estimated doses were modified by the dose reduction factor (assumed to be 0.6 for Japan, see Table A3.9 in Annex 3).

102 / preliminary dose estimation from the nuclear accident after the 2011 Great east Japan earthquake and tsunami
3. Model for internal dose from inhalationThe effective dose Ei
inh of population age group i from inhalation of radioactive materials was calculated according to:
where:
■ Tm is the time-integrated activity concentration in air during cloud passage of radionu-clide m in Bq y m-3, estimated by the NAME model;
■ Ii is the breathing rate for age group i in m3 y-1 (from Table A3.5 in Annex 3);
■ demiinh is the effective inhalation dose coefficient for age group i and radionuclide m in Sv Bq-1 (from Table A3.1 in Annex 3).
The thyroid dose Tiinh of population age group i from inhalation of radioactive materials was calculated according to:
where:
■ dtmiinh is the thyroid inhalation dose coefficient for age group i and radionuclide m in Sv Bq-1 (from Table A3.1 in Annex 3).
The remaining symbols and parameter values are the same as above.
No protection is assumed due to being indoors for a proportion of the time.
References to Annex 71. Bedwell P et al. Cloud gamma modelling in the UK Met Office’s NAME III model.
Proceedings of the 13th Conference on Harmonisation within Atmospheric Disper-sion Modelling for Regulatory Purposes (HARMO13), 1−4 June 2010, Paris, France, H13−17.

preliminary dose estimation from the nuclear accident after the 2011 Great east Japan earthquake and tsunami / 103
annexes
Annex 8. Model for ingestion doses in Japan (Approach D)
1. Model for dose calculationBoth the effective and the thyroid doses were calculated by using the same approaches.
The effective dose Eiing of the population group i from ingestion of radioactive materials
was calculated according to:
E E Eiing
TTiing
iing= +
=∑1
5
67
and the monthly dose ETiing for month T is described by
E F C dTiing
fif
mmfT mi
ing= ∑ ∑where
■ the summation index m is for deposited radionuclides 134Cs, 137Cs and 131I;
■ the summation index f is for food groups;
■ the summation T represents the month;
■ the summation is done over the first five months, and the calculation for the sixth month is summed seven times to achieve the estimated first-year dose;
■ Fif is the food consumption per month for population i and food group f (Table A8.1);
■ CmfT is the concentration of radionuclide m for food group f and month T (based on Table A8.2);
■ dmiing is the effective dose coefficient from ingestion for population group i and radio-nuclide m (Table A3.3 in Annex 3).
The thyroid dose was calculated using a similar equation, but replacing dmiing by the thyroid dose coefficient from ingestion for population group i and radionuclide m (Table A3.4 in Annex 3).
Because the panel did not have the full distribution of food consumption, a deterministic approach was chosen with three scenarios detailed for each of the two following locations:
■ Locations in Fukushima prefectures:
1. Mean consumption * median radioactivity concentration
2. Mean consumption * mean radioactivity concentration
3. Mean consumption * 90th percentile radioactivity concentration.
■ Locations in Japanese prefectures excluding Fukushima prefecture:
4. Mean consumption * median radioactivity concentration
5. 97.5th percentile consumption * median radioactivity concentration
6. 97.5th percentile consumption * mean radioactivity concentration.

104 / preliminary dose estimation from the nuclear accident after the 2011 Great east Japan earthquake and tsunami
Food consumption (g/pers/day)
■ Mean, standard deviation and 97.5th percentile were systematically extracted for each of the three age groups.
■ Due to the lack of information regarding the mean consumption of one-year-old chil-dren, the mean consumption of children aged 1−6 years was used.
Radioactivity concentration (Bq/kg food)
■ Mean, median, 90th percentile and maximum were systematically calculated for each of nine main food categories, each of the two locations (Fukushima prefecture and other prefectures) and each of the six months.
■ Analytical results for food categories other than the nine main ones (e.g. spices, tea) were not used.
2. Input dataFood consumption data (g/pers/day)
The food consumption data are based on the 2009 National Health and Nutrition survey. The data were provided by the Japanese National Institute for Health and Nutrition, a national institution recognized by WHO.1 It is given by age groups (see Table A8.1).
Table A8.1 Food consumption for the food groups considered in the assessment2
Per capita whole population Consumers only
Age (years) 1–6 7–14 20 and over 15 and over
Food group (g/pers/day)
Mean SD Mean SD Mean SD 97.5th percentile
Eggs 27 28 35 32 35 35 122
Fish and shellfish 36 40 53 52 87 80 275
Fruit 109 117 95 124 115 142 543
Meat 62 48 102 69 79 74 270
Milk 199 171 307 182 97 129 500
Mushrooms 8 15 13 19 17 29 121
Vegetables 140 95 244 121 290 171 696
Wheat/wheat products 71 72 107 98 100 109 396
1. According to the regulations for collaboration with national institutions recognized by WHO (accessible at http://apps.who.int/gb/bd/).
2. Food radioactivity concentration data (Bq/kg food)

preliminary dose estimation from the nuclear accident after the 2011 Great east Japan earthquake and tsunami / 105
annexes
Food radioactivity concentration data (Bq/kg food)
The food radioactivity concentration data was provided by Japan to INFOSAN,3 a joint initiative of WHO and the FAO. This global network comprises 177 member states, in-cluding Japan.
Data on radioactivity concentration of 131I, 134Cs and 137Cs were sorted into nine types of foodstuffs and tabulated with the following information:
■ about 31 000 analytical results;
■ food name;
■ place of sampling (prefecture);
■ date of sampling.
No information about analytical method/LOD4 was provided.
3. For further information on the International Food Safety Authorities Network (INFOSAN), see: http://www.who.int/foodsafety/fs_management/infosan/en/.
4. LOD: limit of detection.

106 / preliminary dose estimation from the nuclear accident after the 2011 Great east Japan earthquake and tsunami
Table A8.2 Summary of radioactivity concentration for the first four months for 131I in food (Bq/kg) (nd: not detected = < 10 Bq /kg)
Fukushima All prefectures
Month N samples Median Mean 90th Max N samples Median Mean 90th Max
Food Bq/kg Bq/kg Bq/kg Bq/kg Bq/kg Bq/kg Bq/kg Bq/kg
Cereals excluding rice 1 no data no data no data no data no data no data no data no data no data no data
Eggs 1 17.00 nd 15.77 34.40 45.00 18.00 10 15.45 32.80 45.00
Fish and other sea-foods 1 13.00 13.00 1374.05 1660.00 12000.00 98.00 nd 351.64 911.00 12000.00
Fruits 1 40.00 nd 60.54 67.70 1400.00 89.00 nd 38.69 59.75 1400.00
Meats 1 42.00 nd 10.31 nd 19.00 45.00 10 10.30 10.00 19.00
Milks 1 150.00 34.00 207.86 372.00 5300.00 239.00 20.00 166.30 300.00 5300.00
Mushrooms 1 89.00 16.00 290.21 332.00 12000.00 96.00 nd 269.78 300.00 12000.00
Vegetables 1 293.00 66.00 990.03 2480.00 22000.00 1013.00 56.00 852.54 2080.00 54100.00
Cereals excluding rice 2 no data no data no data no data no data no data no data no data no data no data
Eggs 2 11.00 nd nd nd nd 12.00 nd nd nd nd
Fish and other sea-foods 2 28.00 nd 216.77 354.00 3900.00 192.00 nd 52.45 19.00 3900.00
Fruits 2 16.00 nd 10.34 nd 20.00 44.00 nd 10.12 nd 20.00
Meats 2 38.00 nd nd nd nd 40.00 nd nd nd nd
Milks 2 46.00 nd 10.34 nd 18.50 135.00 nd 9.20 nd 18.50
Mushrooms 2 92.00 nd 28.18 56.70 440.00 159.00 nd 20.43 26.60 440.00
Vegetables 2 428.00 nd 17.32 18.30 750.00 1016.00 nd 16.52 22.50 750.00
Cereals excluding rice 3 no data no data no data no data no data 5.00 nd nd nd nd
Eggs 3 no data no data no data no data no data 7.00 nd nd nd nd
Fish and other sea-foods 3 164.00 nd 16.27 nd 820.00 339.00 nd 13.22 nd 820.00
Fruits 3 70.00 nd nd nd nd 112.00 nd nd nd nd
Meats 3 28.00 nd nd nd nd 37.00 nd nd nd nd
Milks 3 68.00 nd nd nd nd 156.00 nd nd nd nd
Mushrooms 3 26.00 nd nd nd nd 36.00 nd nd nd nd
Vegetables 3 543.00 nd 22.01 nd 2200.00 1164.00 nd 15.70 nd 2200.00
Cereals excluding rice 4 58.00 nd nd nd nd 158.00 nd nd nd nd
Eggs 4 11.00 nd nd nd nd 21.00 nd nd nd nd
Fish and other sea-foods 4 370.00 nd nd nd nd 566.00 nd nd nd nd
Fruits 4 201.00 nd nd nd nd 264.00 nd nd nd nd
Meats 4 296.00 nd nd nd nd 610.00 nd nd nd nd
Milks 4 63.00 nd nd nd nd 197.00 nd nd nd nd
Mushrooms 4 60.00 nd nd nd nd 71.00 nd nd nd nd
Vegetables 4 723.00 nd 10.11 nd 47.00 1435.00 nd 10.05 nd 47.00

preliminary dose estimation from the nuclear accident after the 2011 Great east Japan earthquake and tsunami / 107
annexes
Fukushima All prefectures
Month N samples Median Mean 90th Max N samples Median Mean 90th Max
Food Bq/kg Bq/kg Bq/kg Bq/kg Bq/kg Bq/kg Bq/kg Bq/kg
Cereals excluding rice 1 no data no data no data no data no data no data no data no data no data no data
Eggs 1 17.00 nd 15.77 34.40 45.00 18.00 10 15.45 32.80 45.00
Fish and other sea-foods 1 13.00 13.00 1374.05 1660.00 12000.00 98.00 nd 351.64 911.00 12000.00
Fruits 1 40.00 nd 60.54 67.70 1400.00 89.00 nd 38.69 59.75 1400.00
Meats 1 42.00 nd 10.31 nd 19.00 45.00 10 10.30 10.00 19.00
Milks 1 150.00 34.00 207.86 372.00 5300.00 239.00 20.00 166.30 300.00 5300.00
Mushrooms 1 89.00 16.00 290.21 332.00 12000.00 96.00 nd 269.78 300.00 12000.00
Vegetables 1 293.00 66.00 990.03 2480.00 22000.00 1013.00 56.00 852.54 2080.00 54100.00
Cereals excluding rice 2 no data no data no data no data no data no data no data no data no data no data
Eggs 2 11.00 nd nd nd nd 12.00 nd nd nd nd
Fish and other sea-foods 2 28.00 nd 216.77 354.00 3900.00 192.00 nd 52.45 19.00 3900.00
Fruits 2 16.00 nd 10.34 nd 20.00 44.00 nd 10.12 nd 20.00
Meats 2 38.00 nd nd nd nd 40.00 nd nd nd nd
Milks 2 46.00 nd 10.34 nd 18.50 135.00 nd 9.20 nd 18.50
Mushrooms 2 92.00 nd 28.18 56.70 440.00 159.00 nd 20.43 26.60 440.00
Vegetables 2 428.00 nd 17.32 18.30 750.00 1016.00 nd 16.52 22.50 750.00
Cereals excluding rice 3 no data no data no data no data no data 5.00 nd nd nd nd
Eggs 3 no data no data no data no data no data 7.00 nd nd nd nd
Fish and other sea-foods 3 164.00 nd 16.27 nd 820.00 339.00 nd 13.22 nd 820.00
Fruits 3 70.00 nd nd nd nd 112.00 nd nd nd nd
Meats 3 28.00 nd nd nd nd 37.00 nd nd nd nd
Milks 3 68.00 nd nd nd nd 156.00 nd nd nd nd
Mushrooms 3 26.00 nd nd nd nd 36.00 nd nd nd nd
Vegetables 3 543.00 nd 22.01 nd 2200.00 1164.00 nd 15.70 nd 2200.00
Cereals excluding rice 4 58.00 nd nd nd nd 158.00 nd nd nd nd
Eggs 4 11.00 nd nd nd nd 21.00 nd nd nd nd
Fish and other sea-foods 4 370.00 nd nd nd nd 566.00 nd nd nd nd
Fruits 4 201.00 nd nd nd nd 264.00 nd nd nd nd
Meats 4 296.00 nd nd nd nd 610.00 nd nd nd nd
Milks 4 63.00 nd nd nd nd 197.00 nd nd nd nd
Mushrooms 4 60.00 nd nd nd nd 71.00 nd nd nd nd
Vegetables 4 723.00 nd 10.11 nd 47.00 1435.00 nd 10.05 nd 47.00
Notes: • Whenmorethan50%ofsampleswerebelowthelimitof
detection, the median is reported as “not detected” (nd) in the tables.
• Whenmorethan90%ofsampleswerebelowthelimitofdetection, the 90th percentile is reported as “not detec-ted” (nd) in the tables.
• Whenall thesampleswerebelowthelimitofdetection,the mean and the maximum are reported as “not detec-ted” (nd) in the tables.

108 / preliminary dose estimation from the nuclear accident after the 2011 Great east Japan earthquake and tsunami
Table A8.3 Summary of radioactivity concentration for the first 6 months for 134Cs and 137Cs in food for all prefectures
134Cs 137Cs
Month N samples Median Mean 90th Max Median Mean 90th Max
Food Bq/kg Bq/kg Bq/kg Bq/kg Bq/kg Bq/kg Bq/kg Bq/kg
Cereals excluding rice 1 no data no data no data no data no data no data no data no data no data
Eggs 1 17 nd nd nd nd nd nd nd nd
Fish and other sea-foods 1 14 nd 533 268 6200 nd 544 281 6300
Fruits 1 44 nd 19 19 170 nd 19 31 170
Meats 1 24 nd 10 11 19 nd 10 11 18
Milks 1 167 nd 11 nd 210 nd 11 nd 210
Mushrooms 1 89 nd 166 198 6400 nd 169 210 6600
Rice 1 no data no data no data no data no data no data no data no data no data
Vegetables 1 359 17 855 1720 41000 17 864 1820 41000
Cereals excluding rice 2 no data no data no data no data no data no data no data no data no data
Eggs 2 11 nd nd nd nd nd nd nd nd
Fish and other sea-foods 2 35 71 409 944 7100 62 421 964 7300
Fruits 2 16 nd 13 19 37 nd 13 19 46
Meats 2 22 42 58 124 187 39 63 134 208
Milks 2 71 nd 11 nd 105 nd 15 nd 106
Mushrooms 2 97 51 194 474 3600 54 204 518 3600
Rice 2 no data no data no data no data no data no data no data no data no data
Vegetables 2 481 nd 65 170 2600 nd 68 170 2800
Cereals excluding rice 3 2 nd nd nd nd nd nd nd nd
Eggs 3 no data no data no data no data no data no data no data no data no data
Fish and other sea-foods 3 174 65 134 327 1400 69 145 367 1500
Fruits 3 72 75 107 289 360 89 115 326 400
Meats 3 12 14 43 123 124 22 50 119 146
Milks 3 81 nd nd nd nd nd nd nd nd
Mushrooms 3 26 68 237 680 1300 67 254 730 1400
Rice 3 no data no data no data no data no data no data no data no data no data
Vegetables 3 550 nd 44 77 1500 nd 46 83 1600
Cereals excluding rice 4 102 nd 18 20 310 nd 19 25 320
Eggs 4 14 nd nd nd nd nd nd nd nd
Fish and other sea-foods 4 382 36 95 190 2100 39 106 210 2300
Fruits 4 213 20 39 89 330 20 42 93 370
Meats 4 185 nd 49 59 1510 nd 54 63 1730
Milks 4 82 nd nd nd nd nd nd nd nd
Mushrooms 4 60 nd 65 191 820 nd 73 231 950
Rice 4 no data no data no data no data no data no data no data no data no data
Vegetables 4 849 nd 19 nd 1300 nd 20 nd 1500
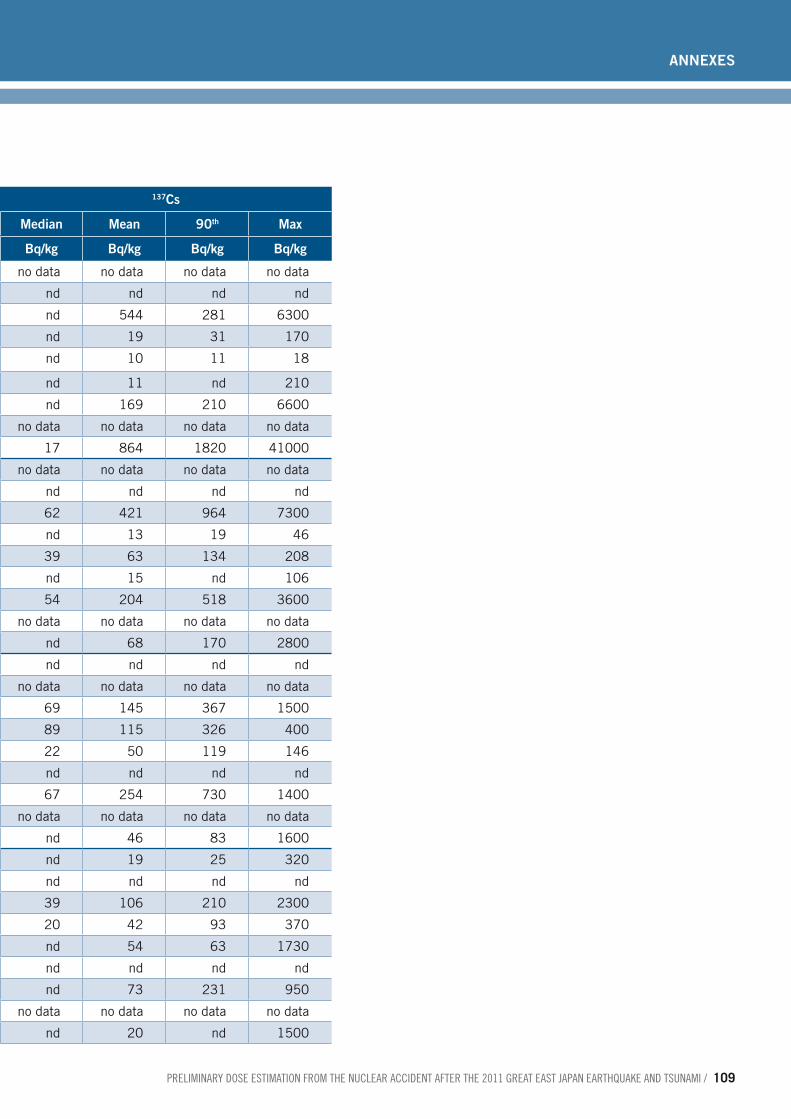
preliminary dose estimation from the nuclear accident after the 2011 Great east Japan earthquake and tsunami / 109
annexes
Table A8.3 Summary of radioactivity concentration for the first 6 months for 134Cs and 137Cs in food for all prefectures
134Cs 137Cs
Month N samples Median Mean 90th Max Median Mean 90th Max
Food Bq/kg Bq/kg Bq/kg Bq/kg Bq/kg Bq/kg Bq/kg Bq/kg
Cereals excluding rice 1 no data no data no data no data no data no data no data no data no data
Eggs 1 17 nd nd nd nd nd nd nd nd
Fish and other sea-foods 1 14 nd 533 268 6200 nd 544 281 6300
Fruits 1 44 nd 19 19 170 nd 19 31 170
Meats 1 24 nd 10 11 19 nd 10 11 18
Milks 1 167 nd 11 nd 210 nd 11 nd 210
Mushrooms 1 89 nd 166 198 6400 nd 169 210 6600
Rice 1 no data no data no data no data no data no data no data no data no data
Vegetables 1 359 17 855 1720 41000 17 864 1820 41000
Cereals excluding rice 2 no data no data no data no data no data no data no data no data no data
Eggs 2 11 nd nd nd nd nd nd nd nd
Fish and other sea-foods 2 35 71 409 944 7100 62 421 964 7300
Fruits 2 16 nd 13 19 37 nd 13 19 46
Meats 2 22 42 58 124 187 39 63 134 208
Milks 2 71 nd 11 nd 105 nd 15 nd 106
Mushrooms 2 97 51 194 474 3600 54 204 518 3600
Rice 2 no data no data no data no data no data no data no data no data no data
Vegetables 2 481 nd 65 170 2600 nd 68 170 2800
Cereals excluding rice 3 2 nd nd nd nd nd nd nd nd
Eggs 3 no data no data no data no data no data no data no data no data no data
Fish and other sea-foods 3 174 65 134 327 1400 69 145 367 1500
Fruits 3 72 75 107 289 360 89 115 326 400
Meats 3 12 14 43 123 124 22 50 119 146
Milks 3 81 nd nd nd nd nd nd nd nd
Mushrooms 3 26 68 237 680 1300 67 254 730 1400
Rice 3 no data no data no data no data no data no data no data no data no data
Vegetables 3 550 nd 44 77 1500 nd 46 83 1600
Cereals excluding rice 4 102 nd 18 20 310 nd 19 25 320
Eggs 4 14 nd nd nd nd nd nd nd nd
Fish and other sea-foods 4 382 36 95 190 2100 39 106 210 2300
Fruits 4 213 20 39 89 330 20 42 93 370
Meats 4 185 nd 49 59 1510 nd 54 63 1730
Milks 4 82 nd nd nd nd nd nd nd nd
Mushrooms 4 60 nd 65 191 820 nd 73 231 950
Rice 4 no data no data no data no data no data no data no data no data no data
Vegetables 4 849 nd 19 nd 1300 nd 20 nd 1500

110 / preliminary dose estimation from the nuclear accident after the 2011 Great east Japan earthquake and tsunami
134Cs 137Cs
Month N samples Median Mean 90th Max Median Mean 90th Max
Food Bq/kg Bq/kg Bq/kg Bq/kg Bq/kg Bq/kg Bq/kg Bq/kg
Cereals excluding rice 5 79 nd 19 42 120 nd 21 48 150
Eggs 5 5 13 nd nd nd nd nd nd nd
Fish and other sea-foods 5 294 30 66 180 830 34 75 190 940
Fruits 5 337 nd 25 23 1500 nd 28 28 1700
Meats 5 1293 nd 21 29 630 nd 24 35 710
Milks 5 5 76 nd 9 nd nd 8 nd nd
Mushrooms 5 72 nd 59 88 2200 nd 68 136 2400
Rice 5 592 nd 10 nd 27 nd 10 nd 33
Vegetables 5 405 nd 12 nd 390 nd 12 nd 410
Cereals excluding rice 6 114 nd 12 nd 150 nd 13 nd 170
Eggs 6 18 nd nd nd nd nd nd nd nd
Fish and other sea-foods 6 798 12 42 89 1000 13 50 110 1200
Fruits 6 558 nd 68 37 13000 nd 80 51 13000
Meats 6 4334 nd 13 nd 615 nd 14 nd 790
Milks 6 161 nd 9 nd 15 nd 9 nd 20
Mushrooms 6 495 nd 68 76 8900 nd 82 100 11000
Rice 6 2145 nd 11 nd 301 nd 11 nd 367
Vegetables 6 1121 nd 14 nd 943 nd 15 11 1100

preliminary dose estimation from the nuclear accident after the 2011 Great east Japan earthquake and tsunami / 111
annexes
134Cs 137Cs
Month N samples Median Mean 90th Max Median Mean 90th Max
Food Bq/kg Bq/kg Bq/kg Bq/kg Bq/kg Bq/kg Bq/kg Bq/kg
Cereals excluding rice 5 79 nd 19 42 120 nd 21 48 150
Eggs 5 5 13 nd nd nd nd nd nd nd
Fish and other sea-foods 5 294 30 66 180 830 34 75 190 940
Fruits 5 337 nd 25 23 1500 nd 28 28 1700
Meats 5 1293 nd 21 29 630 nd 24 35 710
Milks 5 5 76 nd 9 nd nd 8 nd nd
Mushrooms 5 72 nd 59 88 2200 nd 68 136 2400
Rice 5 592 nd 10 nd 27 nd 10 nd 33
Vegetables 5 405 nd 12 nd 390 nd 12 nd 410
Cereals excluding rice 6 114 nd 12 nd 150 nd 13 nd 170
Eggs 6 18 nd nd nd nd nd nd nd nd
Fish and other sea-foods 6 798 12 42 89 1000 13 50 110 1200
Fruits 6 558 nd 68 37 13000 nd 80 51 13000
Meats 6 4334 nd 13 nd 615 nd 14 nd 790
Milks 6 161 nd 9 nd 15 nd 9 nd 20
Mushrooms 6 495 nd 68 76 8900 nd 82 100 11000
Rice 6 2145 nd 11 nd 301 nd 11 nd 367
Vegetables 6 1121 nd 14 nd 943 nd 15 11 1100

112 / preliminary dose estimation from the nuclear accident after the 2011 Great east Japan earthquake and tsunami
Table A8.4 Summary of radioactivity concentration for the first 6 months for 134Cs and 137Cs in food for Fukushima prefecture
134Cs 137Cs
Month N samples Median Mean 90th Max Median Mean 90th Max
Food Bq/kg Bq/kg Bq/kg Bq/kg Bq/kg Bq/kg Bq/kg Bq/kg
Cereals excluding rice 1 no data no data no data no data no data no data no data no data no data
Eggs 1 17 nd nd nd nd nd nd nd nd
Fish and other sea-foods 1 13 nd 574 272 6200 nd 585 284 6300
Fruits 1 40 nd 20 21 170 nd 20 32 170
Meats 1 24 nd 10 11 19 nd 10 11 18
Milks 1 150 nd 12 nd 210 nd 12 nd 210
Mushrooms 1 89 nd 166 198 6400 nd 169 210 6600
Rice 1 no data no data no data no data no data no data no data no data no data
Vegetables 1 290 23 1022 2320 41000 19 1032 2330 41000
Cereals excluding rice 2 no data no data no data no data no data no data no data no data no data
Eggs 2 11 nd nd nd nd nd nd nd nd
Fish and other sea-foods 2 28 97 510 1330 7100 98 524 1360 7300
Fruits 2 15 nd 13 20 37 nd 13 21 46
Meats 2 22 42 58 124 187 39 63 134 208
Milks 2 44 nd nd nd nd nd nd nd nd
Mushrooms 2 92 59 204 504 3600 63 214 528 3600
Rice 2 no data no data no data no data no data no data no data no data no data
Vegetables 2 428 nd 72 180 2600 nd 75 193 2800
Cereals excluding rice 3 no data no data no data no data no data no data no data no data no data
Eggs 3 no data no data no data no data no data no data no data no data no data
Fish and other sea-foods 3 164 68 142 330 1400 77 153 377 1500
Fruits 3 70 79 110 291 360 89 118 330 400
Meats 3 12 14 43 123 124 22 50 119 146
Milks 3 64 nd nd nd nd nd nd nd nd
Mushrooms 3 26 68 237 680 1300 67 254 730 1400
Rice 3 no data no data no data no data no data no data no data no data no data
Vegetables 3 516 nd 46 115 1500 nd 48 108 1600
Cereals excluding rice 4 58 nd 21 28 310 nd 23 27 320
Eggs 11 nd nd nd nd nd nd nd nd nd
Fish and other sea-foods 4 364 38 100 200 2100 42 111 220 2300
Fruits 4 201 21 41 91 330 22 44 99 370
Meats 4 138 nd 56 65 1510 nd 62 77 1730
Milks 4 55 nd nd nd nd nd nd nd nd
Mushrooms 4 60 nd 65 191 820 nd 73 231 950
Rice 4 no data no data no data no data no data no data no data no data no data
Vegetables 4 718 nd 19 nd 1300 nd 21 nd 1500
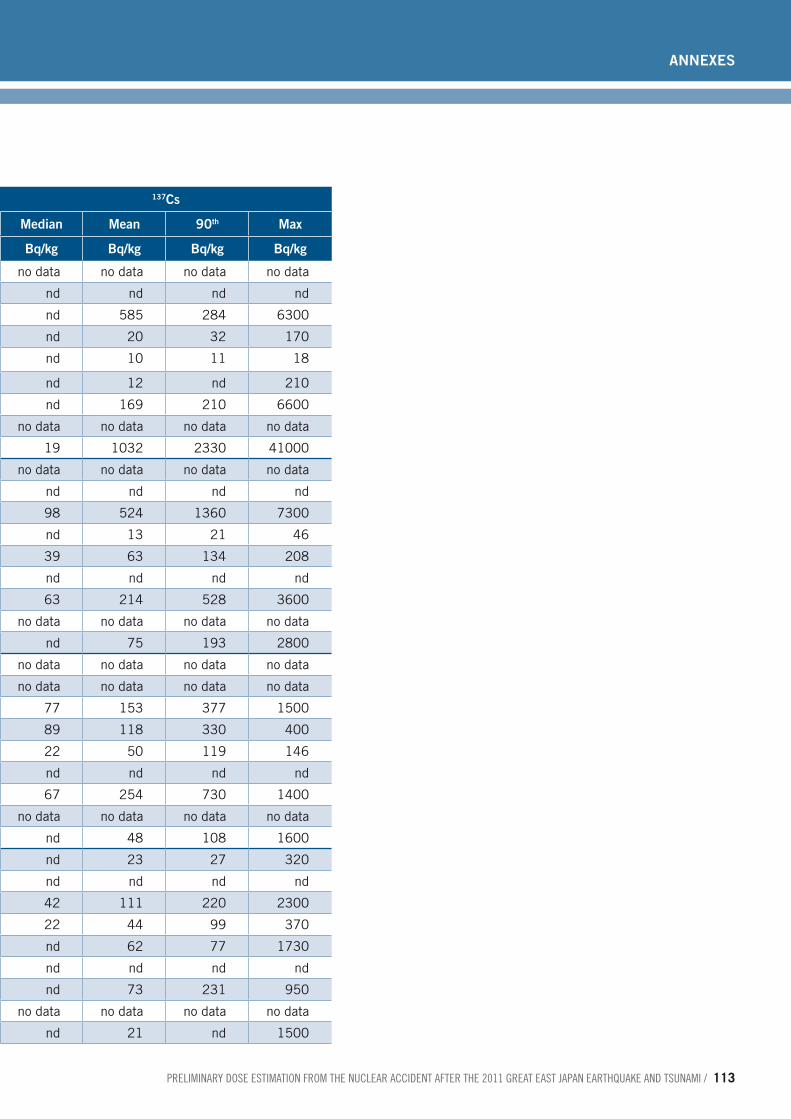
preliminary dose estimation from the nuclear accident after the 2011 Great east Japan earthquake and tsunami / 113
annexes
134Cs 137Cs
Month N samples Median Mean 90th Max Median Mean 90th Max
Food Bq/kg Bq/kg Bq/kg Bq/kg Bq/kg Bq/kg Bq/kg Bq/kg
Cereals excluding rice 1 no data no data no data no data no data no data no data no data no data
Eggs 1 17 nd nd nd nd nd nd nd nd
Fish and other sea-foods 1 13 nd 574 272 6200 nd 585 284 6300
Fruits 1 40 nd 20 21 170 nd 20 32 170
Meats 1 24 nd 10 11 19 nd 10 11 18
Milks 1 150 nd 12 nd 210 nd 12 nd 210
Mushrooms 1 89 nd 166 198 6400 nd 169 210 6600
Rice 1 no data no data no data no data no data no data no data no data no data
Vegetables 1 290 23 1022 2320 41000 19 1032 2330 41000
Cereals excluding rice 2 no data no data no data no data no data no data no data no data no data
Eggs 2 11 nd nd nd nd nd nd nd nd
Fish and other sea-foods 2 28 97 510 1330 7100 98 524 1360 7300
Fruits 2 15 nd 13 20 37 nd 13 21 46
Meats 2 22 42 58 124 187 39 63 134 208
Milks 2 44 nd nd nd nd nd nd nd nd
Mushrooms 2 92 59 204 504 3600 63 214 528 3600
Rice 2 no data no data no data no data no data no data no data no data no data
Vegetables 2 428 nd 72 180 2600 nd 75 193 2800
Cereals excluding rice 3 no data no data no data no data no data no data no data no data no data
Eggs 3 no data no data no data no data no data no data no data no data no data
Fish and other sea-foods 3 164 68 142 330 1400 77 153 377 1500
Fruits 3 70 79 110 291 360 89 118 330 400
Meats 3 12 14 43 123 124 22 50 119 146
Milks 3 64 nd nd nd nd nd nd nd nd
Mushrooms 3 26 68 237 680 1300 67 254 730 1400
Rice 3 no data no data no data no data no data no data no data no data no data
Vegetables 3 516 nd 46 115 1500 nd 48 108 1600
Cereals excluding rice 4 58 nd 21 28 310 nd 23 27 320
Eggs 11 nd nd nd nd nd nd nd nd nd
Fish and other sea-foods 4 364 38 100 200 2100 42 111 220 2300
Fruits 4 201 21 41 91 330 22 44 99 370
Meats 4 138 nd 56 65 1510 nd 62 77 1730
Milks 4 55 nd nd nd nd nd nd nd nd
Mushrooms 4 60 nd 65 191 820 nd 73 231 950
Rice 4 no data no data no data no data no data no data no data no data no data
Vegetables 4 718 nd 19 nd 1300 nd 21 nd 1500

114 / preliminary dose estimation from the nuclear accident after the 2011 Great east Japan earthquake and tsunami
134Cs 137Cs
Month N samples Median Mean 90th Max Median Mean 90th Max
Food Bq/kg Bq/kg Bq/kg Bq/kg Bq/kg Bq/kg Bq/kg Bq/kg
Cereals excluding rice 5 64 nd 21 52 120 nd 23 58 150
Eggs 5 11 nd nd nd nd nd nd nd nd
Fish and other sea-foods 5 261 38 74 190 830 42 83 200 940
Fruits 5 290 nd 27 24 1500 nd 31 31 1700
Meats 5 83 nd 30 59 412 nd 34 66 496
Milks 5 40 nd nd nd nd nd nd nd nd
Mushrooms 5 71 nd 60 89 2200 nd 69 140 2400
Rice 5 37 nd 10 nd 11 nd 10 nd.4 12
Vegetables 5 327 nd 13 nd 390 nd 13 nd 410
Cereals excluding rice 6 108 nd 13 nd 150 nd 13 nd.3 170
Eggs 6 11 nd nd nd nd nd nd nd nd
Fish and other sea-foods 6 491 26 60 120 1000 32 72 140 1200
Fruits 6 463 nd 80 50 13000 nd 94 60 15000
Meats 6 1024 nd 14 12 610 nd 15 14 790
Milks 6 50 nd nd nd nd nd nd nd nd
Mushrooms 6 338 nd 84 72 8900 nd 102 96 11000
Rice 6 1189 nd 11 11 220 nd 12 12 250
Vegetables 6 781 nd 16 17 940 nd 17 17 1100
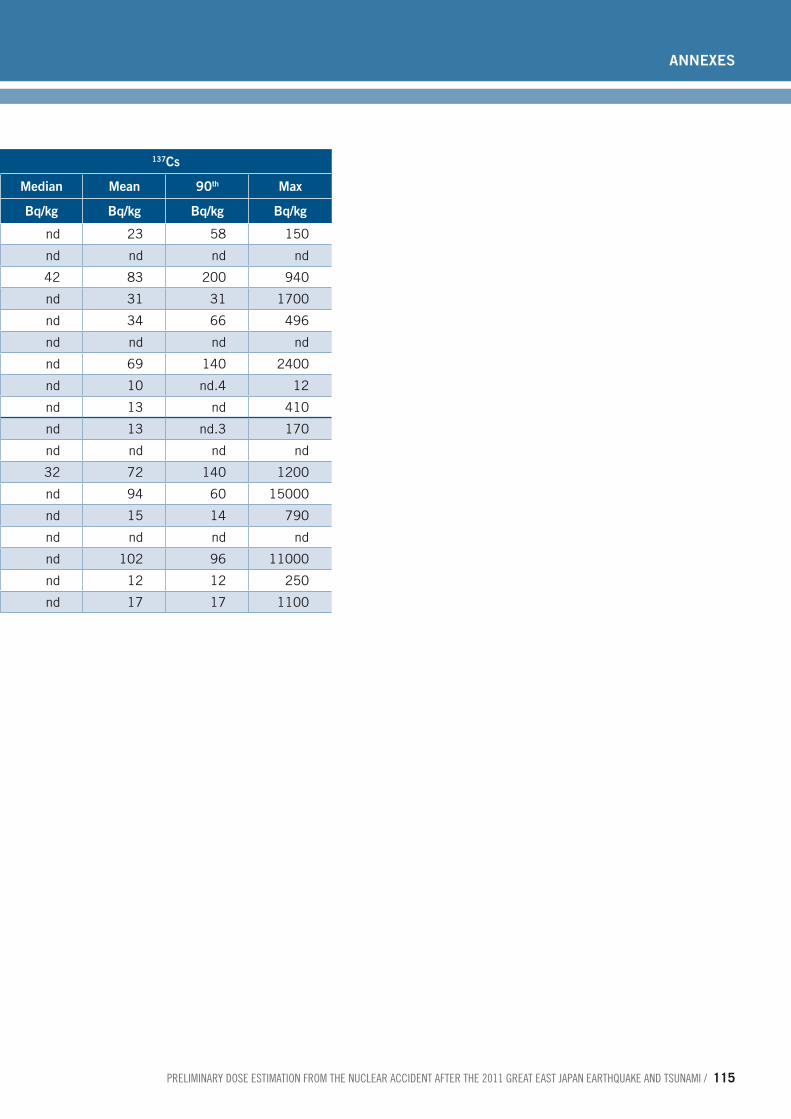
preliminary dose estimation from the nuclear accident after the 2011 Great east Japan earthquake and tsunami / 115
annexes
134Cs 137Cs
Month N samples Median Mean 90th Max Median Mean 90th Max
Food Bq/kg Bq/kg Bq/kg Bq/kg Bq/kg Bq/kg Bq/kg Bq/kg
Cereals excluding rice 5 64 nd 21 52 120 nd 23 58 150
Eggs 5 11 nd nd nd nd nd nd nd nd
Fish and other sea-foods 5 261 38 74 190 830 42 83 200 940
Fruits 5 290 nd 27 24 1500 nd 31 31 1700
Meats 5 83 nd 30 59 412 nd 34 66 496
Milks 5 40 nd nd nd nd nd nd nd nd
Mushrooms 5 71 nd 60 89 2200 nd 69 140 2400
Rice 5 37 nd 10 nd 11 nd 10 nd.4 12
Vegetables 5 327 nd 13 nd 390 nd 13 nd 410
Cereals excluding rice 6 108 nd 13 nd 150 nd 13 nd.3 170
Eggs 6 11 nd nd nd nd nd nd nd nd
Fish and other sea-foods 6 491 26 60 120 1000 32 72 140 1200
Fruits 6 463 nd 80 50 13000 nd 94 60 15000
Meats 6 1024 nd 14 12 610 nd 15 14 790
Milks 6 50 nd nd nd nd nd nd nd nd
Mushrooms 6 338 nd 84 72 8900 nd 102 96 11000
Rice 6 1189 nd 11 11 220 nd 12 12 250
Vegetables 6 781 nd 16 17 940 nd 17 17 1100
116 / preliminary dose estimation from the nuclear accident after the 2011 Great east Japan earthquake and tsunami
3. Assumptions ■ For calculations, results below limits of quantification were replaced by 10 Bq/kg.
■ Dose coefficients (for converting Bq into mSv) were standard ICRP values based on the default chemical form.
■ Total effective dose and thyroid dose were calculated for six months and extrapolated to one year.
For children of 1 and 10 years of age, the 97.5th percentiles for consumption were not available and the average +2 standard deviation value of the two highest contributing food categories, which were fish and vegetables, plus the mean of other food categories were used as a surrogate. The calculated values were compared with the 97.5th per-centile of consumption of children less than 15 years of age reported in the Japanese national survey and consistency between them was confirmed.
For fish, the calculated high consumption at 1 and 10 years of age and the reported high consumption of children less than 15 years are respectively 116, 157 and 177 g d-1.
For vegetables, the calculated high consumption at 1 and 10 years of age and the re-ported high consumption of children below 15 are respectively 330, 486 and 500 g d-1.

preliminary dose estimation from the nuclear accident after the 2011 Great east Japan earthquake and tsunami / 117
annexes
1. Model for dose estimation The effective dose Ei
ing of the population age group i from ingestion of radioactive ma-terials was calculated according to:
E F A c deiing
ffm
m mf miing= ∑ ∑
where
■ the summation index m is for deposited radionuclides;
■ the summation index f is for food categories;
■ Ff is the annual food consumption rate for food category f (Table A9.1);
■ Am is the surface activity density of radionuclide m on the ground;
■ Cmf is the radionuclide concentration factor for food category f of radionuclide m (based on Table A9.2 and Table A9.3 in Annex 9);
■ demiing is the effective ingestion dose coefficient for population age group i and radio-nuclide m (Table A3.3 in Annex 3).
Note that the food consumption Ff is based on average consumption weighted for total population and so represents the average over all age groups. For this reason, the same consumption was applied to all age groups.
The estimates of surface activity densities were derived from the NAME model (1), and the radionuclide concentration factors were derived from the food chain model FARM-LAND (2).
The thyroid dose Tiing for the population age group i from deposited radionuclides, in Sv, was calculated as follows:
T F A c dtiing
ffm
m mf miing= ∑ ∑
where
■ dtmiing is the thyroid ingestion dose coefficient for population age group i and radionu-clide m (Table A3.4 in Annex 3).
The remaining symbols and parameter values are the same as above.
2. Input data Food consumption
The food consumption for the assessment of food doses in the rest of the world exclud-ing Japan (used in conjunction with the source term and dispersion-based part of the assessment) were selected from the WHO GEMS data (3). Cluster diet G was selected
Annex 9. Model for ingestion doses outside Japan (Approach E)

118 / preliminary dose estimation from the nuclear accident after the 2011 Great east Japan earthquake and tsunami
and the details are shown below in Table A9.1. The food consumption is based on aver-age consumption weighted for total population and so represents the average over all age groups. For this reason, the same consumption was applied to all age groups.
Table A9.1 Food consumption for the world outside Japan
Food category Average consumption for cluster diet G (kg per person per year)
Cereals 225.2
Green vegetables 114.2
Root vegetables 43.7
Orchard fruit 53.1
Soft fruit 1.0
Milk 15.3
Beef 2.5
Lamb 0.7
Source: WHO GEMS/Food consumption cluster diets, August 2006 (3).
Note: The precision to which these numbers are quoted is based on the precision of the source data.
Food radioactivity concentration
Activity concentrations in food per unit deposit were used in conjunction with the source term and dispersion-based part of the assessment. A subset of the radionuclides has been considered for the radionuclides making the most significant contribution to the dose.
Food concentration factors have been taken from the food chain model FARMLAND. These data are based on unit deposition (per Bq m-2) in early summer which is consid-ered to be cautious. The FARMLAND factors are representative of United Kingdom an-nual average conditions (somewhere between “wet” and “dry” deposition). The radionu-clides included below are those which are, in general, potentially of significance for the ingestion dose pathway. However, in the case of the Fukushima release, most of these will make only very small contributions as the great majority of the ingestion dose will derive from the radionuclides of iodine and caesium.

preliminary dose estimation from the nuclear accident after the 2011 Great east Japan earthquake and tsunami / 119
annexes
Table A9.2 Time-integrated activity concentration factors in food to 1 year
Radionuclide Cereals (Bq y /kg per
Bq m-2)
Green vegetables (Bq y /kg per
Bq m-2)
Root vegetables (Bq y /kg per
Bq m-2)
Orchard fruit (Bq y /kg per
Bq m-2)103Ru 1.78 10-6 2.27 10-3 2.54 10-6 1.05 10-6
106Ru 2.88 10-5 2.91 10-3 1.49 10-5 2.05 10-5
127mTe 3.54 10-3 3.24 10-3 3.21 10-3 1.99 10-3
129mTe 3.55 10-4 2.52 10-3 1.47 10-3 1.67 10-4
131mTe 2.02 10-12 6.37 10-4 1.11 10-5 6.28 10-14
131I 2.06 10-7 1.25 10-3 1.79 10-4 1.79 10-3
132I 2.25 10-32 2.26 10-5 3.70 10-43 8.59 10-34
133I 1.73 10-19 1.94 10-4 9.13 10-10 5.53 10-9
135I 3.58 10-27 6.42 10-5 1.36 10-35 2.08 10-28
134Cs 1.09 10-2 3.66 10-3 5.57 10-3 6.43 10-3
137Cs 1.32 10-2 3.74 10-3 6.23 10-3 7.85 10-3
140Ba 1.56 10-7 1.52 10-3 4.04 10-7 1.28 10-7
144Ce 1.68 10-5 2.87 10-3 1.35 10-6 9.98 10-6
Source: data from implementation of the FARMLAND model (2) by the UK’s Health Protection Agency.
Table A9.3 Time-integrated activity concentration factors in food to 1 year
Radionuclide Soft fruit (Bq y /kg per
Bq m-2)
Milk (Bq y /kg per
Bq m-2)
Beef (Bq y /kg per
Bq m-2)
Lamb (Bq y /kg per
Bq m-2)103Ru 1.02 10-4 7.74 10-7 1.01 10-4 1.63 10-4
106Ru 1.75 10-4 1.76 10-6 6.16 10-4 6.33 10-4
127mTe 2.59 10-2 5.74 10-4 4.85 10-3 6.79 10-3
129mTe 1.38 10-2 3.69 10-4 2.37 10-3 4.09 10-3
131mTe 1.17 10-4 1.20 10-4 1.82 10-4 2.42 10-4
131I 3.86 10-8 1.84 10-3 7.84 10-4 1.00 10-3
132I 0.00 100 5.18 10-7 1.15 10-7 5.23 10-8
133I 4.10 10-21 1.20 10-4 3.51 10-5 2.15 10-5
135I 0.00 100 9.77 10-6 2.48 10-6 1.21 10-6
134Cs 3.42 10-2 9.86 10-3 4.76 10-2 4.36 10-2
137Cs 3.58 10-2 1.12 10-2 5.52 10-2 4.59 10-2
140Ba 1.75 10-4 2.74 10-4 7.59 10-5 1.20 10-4
144Ce 1.56 10-4 1.61 10-4 5.08 10-5 5.41 10-5
Source: data from implementation of the FARMLAND model (2) by the UK’s Health Protection Agency.

120 / preliminary dose estimation from the nuclear accident after the 2011 Great east Japan earthquake and tsunami
3. Assumptions The FARMLAND results applied in the assessment assume that the release occurred in early summer. This is a cautious assumption for many regions of the northern hemi-sphere for an accident occurring in mid-March, but it was chosen because agricultural practices around the world vary; in some southerly regions more food production and harvesting may have occurred than in more northerly regions.
References to Annex 91. Jones AR et al. The UK Met Office's next-generation atmospheric dispersion model,
NAME III. In: Borrego C, Norman A-L, eds. Air pollution modeling and its applica-tion XVII (Proceedings of the 27th NATO/CCMS International Technical Meeting on Air Pollution Modelling and its Application). New York, NY, Springer, 2007 (pages 580−589).
2. Brown J, Simmonds JR. FARMLAND: a dynamic model for the transfer of radionu-clides through terrestrial foodchains. (NRPB-R273). Chilton, UK National Radio-logical Protection Board, 1995.
3. Global Environmental Monitoring System. Food contamination monitoring and as-sessment programme. GEMS/Food consumption cluster diets. Geneva, World Health Organization, 2006 (http://www.who.int/foodsafety/chem/gems/en/index1.html, ac-cessed 13 May 2012).

☢PRElIMInARy DOSE ESTIMATIOn
Public Health and Environment Department (PHE)Health Security and Environment Cluster (HSE)World Health Organization (WHO)Avenue Appia 20 – CH-1211 Geneva 27 Switzerlandwww.who.int/phe
ISBN 978 92 4 150366 2
The earthquake and tsunami in Japan on 11 March 2011 led to releases of radioactive material into the environment from the Tokyo Electric Power Company’s Fukushima Daiichi nuclear power station. This report provides a preliminary estimation of the anticipated scale of doses received by members of the public around the world for the first year after the accident.It represents the first international effort to assess global radiation doses from the Fukushima Daiichi nuclear power plant accident considering all major exposure pathways.