Preliminary design and multi-criteria analysis of ...441438/FULLTEXT01.pdf · Preliminary design...
126
Preliminary design and multi-criteria analysis of solutions for widening an existing concrete bridge Case of the Bridge of Chaillot in Vierzon (France) PIERRE FLINE Master of Science Thesis Stockholm, Sweden 2011
Transcript of Preliminary design and multi-criteria analysis of ...441438/FULLTEXT01.pdf · Preliminary design...

i
Preliminary design and multi-criteria analysis of solutions for widening
an existing concrete bridge
Case of the Bridge of Chaillot in Vierzon (France)
PIERRE FLINE
Master of Science Thesis Stockholm, Sweden 2011


Preliminary design and multi- criteria analysis of solutions for widening an existing concrete bridge
Case of the Bridge of Chaillot in Vierzon (France)
Pierre FLINE
TRITA-BKN. Master Thesis 324 Structural Design and Bridges, 2011 ISSN 1103-4297 ISRN KTH/BKN/EX-324-SE

©Pierre FLINE, 2011 Royal Institute of Technology (KTH) Department of Civil and Architectural Engineering Division of Structural Design and Bridges Stockholm, Sweden, 2011

i
Preface
This work was carried out at the Royal Institute of Technology (KTH), in the Department of Civil and Architectural Engineering, in the Division of Structural Design and Bridges. It was performed under the supervision of Professor Håkan Sundquist whom I would like to thank for his very valuable advices and guidance all along during the project.
I also would like to warmly thank Cyril Ehmke and Bruno Rat, from the Conseil Général du Cher in Bourges (France), for providing me the data and drawings necessary to conduct this study.
I am finally very grateful to a number of master students who helped me in any way to complete this work: an opinion, an interesting discussion, an advice, or simply the smile of everyday in the master thesis room. The list is of course not exhaustive: Ahmad J., Ahmed A., Ahmed B., Benoît D., Carmen C., Davide M., Dazhou T., Ehsan R., Eleonora M., Huan F., Irina S., Luca, Majid S., Maral O., Marjan S., Maxime V., Michele B., Mo T., Nahom K., Patryk W., Paul-Antoine D., Rasoul N., Rodrigo V., Sam J., Sayed S., Sen L., Shahbaz B., Stellan A., Yashar D., Zeinab T, and all the others.
Stockholm, August 2011
Pierre FLINE


iii
Abstract
Europe experienced the destruction of numerous infrastructures during World War II, followed by a reflation and a strong economic growth during the next two decades allowing a more perennial and durable situation. A classical bridge lasting in general around 80 years, one should observe that these constructions built after the war will have to be either replaced either seriously strengthened in a few years. Besides, since the needs also vary over time, transportation infrastructures built during those years might not be adapted to the actual needs anymore – some bridges might thus have to be widened.
A case study has been chosen in order to simulate under which conditions the widening of such a bridge can be performed. This road bridge, located in Vierzon in France, is rather simple since it is made of simply supported prestressed concrete beams and of reinforced concrete piers. It has been chosen in particular for its reduced size – three spans of 30 m each and two road lanes – that corresponded well to this project. Based on some data provided when the bridge was initially built and on a visual inspection, this project suggests six technical solutions to double the actual amount of lanes. An evaluation of the performance of the solutions according to three criteria – durations of works, cost of the works, and environmental impact – is made in order to give recommendations regarding the optimal solution.
The results show that in spite of being installed quickly, adding steel beams is more expensive and has a greater impact on the environment than adding prestressed concrete beams. Regarding the modification of piers, the solution suggesting widening the existing piers is preferable than adding new extra piers according to all the criteria. Consequently, among all the solutions analysed, the optimal one is also the simplest one. Finally, the limits of the study and some suggestions for improvements are indicated.
Keywords: prestressed concrete bridge, modernization, rehabilitation, widening, multi-criteria analysis, Life Cycle Assessment, LCA, Life Cycle Cost, LCC


v
Résumé
L’Europe a été marquée durant la seconde guerre mondiale par la destruction de nombreuses infrastructures, puis durant les deux décennies suivantes par une relance et une forte croissance économique permettant de rétablir une situation plus pérenne et durable. Un pont classique durant en général autour de 80 ans, force est de constater que les ouvrages d’arts construits durant l’après-guerre devront être remplacés ou sérieusement renforcés d’ici quelques années. Par ailleurs, les besoins évoluant eux aussi avec le temps, les infrastructures de transport construites à l’époque ne sont plus forcément adaptées aux besoins actuels, d’où la nécessité d’élargir certains ponts.
Un cas d’étude a été choisi afin de simuler les conditions sous lesquelles l’élargissement d’un pont peut s’effectuer. Ce pont-route, situé à Vierzon en France, est relativement simple puisqu’il est constitué de poutres isostatiques en béton précontraint et de piles en béton armé. Il a été choisi principalement en raison de sa taille réduite – trois portées de 30 m et deux voies de circulation – qui convenait bien à ce projet. Basé sur des données fournies lors de la construction initiale de l’ouvrage et sur une inspection visuelle, ce projet propose six solutions techniques permettant de doubler le nombre actuel de voies. Une évaluation de la performance des solutions selon trois critères – durée des travaux, coût des travaux, et impact environnemental – permet enfin d’établir des recommandations quant au choix de la solution optimale, à l’instar d’une Etude Préliminaire d’Ouvrage d’Art (EPOA).
Les résultats montrent qu’en dépit d’une rapidité de construction appréciable, l’ajout de poutres en acier présente l’inconvénient de coûter plus cher et d’avoir une empreinte environnementale plus conséquente que l’ajout de poutres en béton précontraint. Concernant la modification des piles, la solution proposant l’élargissement des piles existantes est préférable à l’ajout de piles supplémentaires sur tous les points de vue. Par conséquent, parmi toutes les solutions analysées, la solution optimale est également la solution la plus simple. Pour terminer, les limites de l’étude et des suggestions d’amélioration sont indiquées.
Mots-clés: pont en béton précontraint, modernisation, réhabilitation, élargissement, analyse multicritères, Analyse du Cycle de Vie, ACV, Coût du Cycle de Vie, CCV


vii
Contents
Preface .................................................................................................................................. i
Abstract............................................................................................................................... iii
Résumé ..................................................................................................................................v
1 Introduction ..................................................................................................................1
1.1 Background ..........................................................................................................1
1.2 Aim ......................................................................................................................2
1.3 Scope of work ......................................................................................................3
2 Description of the bridge and its environment ............................................................5
2.1 Bridge location and history ...................................................................................5
2.2 Bridge geometry ...................................................................................................8
2.2.1 Superstructure ..........................................................................................8
2.2.1.1 Elevation ................................................................................................8
2.2.1.2 Planar geometry .....................................................................................9
2.2.1.3 Deck .................................................................................................... 10
2.2.1.4 Beams .................................................................................................. 11
2.2.1.5 Expansion joints ................................................................................... 12
2.2.1.6 Bearings ............................................................................................... 13
2.2.1.7 Drainage system ................................................................................... 13
2.2.2 Substructure ........................................................................................... 14
2.2.2.1 Piers ..................................................................................................... 14
2.2.2.2 Abutments ............................................................................................ 16
2.2.2.3 Soil and foundations ............................................................................. 18
2.3 Material strengths ............................................................................................... 22
2.3.1 Remarks about assessments on material strengths .................................. 22
2.3.1.1 Evolution with benefits ........................................................................ 22
2.3.1.2 Harmful evolutions............................................................................... 23

viii
2.3.2 Results of measurements realised on samples after the bridge construction 25
2.3.3 Report of the visual inspection realised in January 2011 ........................ 26
2.3.4 Materials strengths considered in the calculations .................................. 32
2.4 Loads ................................................................................................................. 34
2.4.1 Original and new designs ....................................................................... 34
2.4.1.1 Calculation of resistance....................................................................... 34
2.4.1.2 Calculation of solicitations ................................................................... 35
2.4.2 Loads considered in our calculations ...................................................... 37
2.4.3 Loads not considered in our calculations ................................................ 38
3 Technical solutions to widen the bridge .................................................................... 39
3.1 Review of some common methods to widen a bridge.......................................... 39
3.2 Review of some common methods to strengthen a concrete bridge ..................... 40
3.2.1 Strengthening of concrete superstructures .............................................. 41
3.2.1.1 Active methods .................................................................................... 41
3.2.1.2 Passive methods ................................................................................... 44
3.2.2 Strengthening of concrete piers .............................................................. 46
3.2.3 Strengthening of foundations ................................................................. 47
3.3 Design process ................................................................................................... 47
3.3.1 Standards used ....................................................................................... 47
3.3.2 Assumed simplifications ........................................................................ 48
3.3.3 Method followed ................................................................................... 48
3.4 Check of the actual bridge .................................................................................. 55
3.5 Widening of the deck with extra beams .............................................................. 59
3.5.1 Solution DA: extra prestressed beams .................................................... 60
3.5.1.1 Strengthening of the side beams ........................................................... 62
3.5.2 Solution DB: extra composite beams ..................................................... 63
3.6 Modification of the piers .................................................................................... 65
3.6.1 Solution PA: extra cantilever piers (clamped-free) ................................. 68
3.6.2 Solution PB: extra clamped-simply supported piers ............................... 71
3.6.3 Solution PC: widening of the existing pier ............................................. 74
3.7 Modification of the piles..................................................................................... 77
3.8 Discussion about other possible solutions ........................................................... 78
3.8.1 Add a prestressing bar in the cantilevers ................................................ 78
3.8.2 Add a cable stay system ......................................................................... 79
ix
3.8.3 Add one or several arches ...................................................................... 80
4 Assessment of a solution performance ....................................................................... 81
4.1 Introduction ........................................................................................................ 81
4.2 Methods and duration of works .......................................................................... 81
4.2.1 Introduction ........................................................................................... 81
4.2.2 Application to the widening of the Bridge of Chaillot ............................ 82
4.3 Costs .................................................................................................................. 85
4.3.1 Methodology ......................................................................................... 85
4.3.2 Application to the widening of the Bridge of Chaillot ............................ 87
4.4 Environmental impact ........................................................................................ 89
4.4.1 Methodology ......................................................................................... 89
4.4.2 Application to the widening of the Bridge of Chaillot ............................ 93
5 Comparison of the solutions ....................................................................................... 95
5.1 Principle of a multi-criteria analysis ................................................................... 95
5.2 Choice of the best solution ................................................................................. 96
6 Conclusions and further research .............................................................................. 99
6.1 Conclusions ........................................................................................................ 99
6.2 Further research and suggestions for improvement ........................................... 100
Bibliography ..................................................................................................................... 103
A Gantt diagrams ......................................................................................................... 107
A.1 Solution DA-PAPB .......................................................................................... 108
A.2 Solution DA-PC ............................................................................................... 109
A.3 Solution DB-PAPB .......................................................................................... 110
A.4 Solution DB-PC ............................................................................................... 111


1.1. BACKGROUND
1
1 Introduction
1.1 Background
The period following the end of the Second World War was characterized by an important increase of infrastructures in Europe. In a first step, during about fifteen years, the governments spent lots of money to rebuild what had been destroyed during the war. In a second step, during the 60’s and the beginning of the 70’s, the vehicles traffic increased a lot with the democratization of cars and the good economic development, still maintaining the needs for infrastructures networks in Europe. Infrastructures like bridges are in general designed to last between 80 and 120 years. Sooner or later, some works must however be performed before their end of life in order to guarantee or increase their safety and functionality. In other cases, some works can also be required to extend their life span. Since we continuously build new infrastructures, the need to modify existing bridges to satisfy new demands and the evolution of standards is for sure intended to increase over time.
Some works on an existing bridge can be required for two main reasons:
- If the bridge is said to be structurally deficient, i.e. if at least one of its components is too deteriorated to guarantee the functionality initially intended
- If the bridge is said to be functionally obsolete, i.e. if the utilization of the bridge has significantly changed since the bridge was built (e.g. heavier loads, heavier traffic…) leading to a need of modifications to satisfy the new needs.
Some bridges can experience a combination of both structural deficiency and functional obsolescence, but in general bridges in need of modification are more functionally obsolete than structurally deficient. Table 1.1 shows a distribution of the reasons why bridges are closed in a couple of European countries.
Belgium Denmark Holland Sweden
Structurally deficient (%)
40 27 10 47
Functionally obsolete (%)
60 73 90 53
Table 1.1: Distribution of the reasons for bridge closures in some European countries (adapted from Radomski, 2002)
Chapter

CHAPTER 1
2
Depending on these reasons, the bridge can be repaired, replaced, rehabilitated, strengthened, or modernized. Most of the following definitions are taken from the lecture notes of the Bridge Design, Advanced Course 2010, given by R. Karoumi. Repairs are measures to re-establish the functionality of non-damaged or degraded structures. Replace consists in changing undamaged or damaged structures to new ones. Rehabilitate means to restore the functionality of the bridge to its initial state. Strengthen stands for an increase of the load-carrying capacity of the bridge with the help of additional components. Finally, modernize, or upgrade, signifies that the functionality of a structure is improved. Apart from all these measures that are rather exceptional, bridges need to be maintained on a regular basis, e.g. repaint steel beam or change the expansion joints, in order to maintain its functionality and safety. This is called maintenance. Widening a bridge in good shape is a modernization.
Most of bridges in Europe are made of concrete. Between 60 and 70 % of bridges are made either of mass concrete, reinforced concrete or prestressed concrete. In spite of the fact that they need much less maintenance than steel structures, concrete is subject to numerous pathologies due to environmental action and external loading, such as spalling or cracking, which can affect its functionality. Specific methods have been developed since the last century in order to fix these problems, and this field is still under development due to the great needs: some studies showed that about 50 % of bridges on national roads in France are to be repaired (Radomski, 2002).
The main challenges are to develop suitable, durable, and economical solutions. Modifications of existing bridges are not always expected a long time before to notice the need, and the cheaper the better. Saving money can also lead to save time before to start the works. In addition, some projects may have particular constraints such as completing the works under a limited time for not disturbing too much the traffic, or the parts to modify can be difficult to access (case of a very high bridge for example). Suitable solutions should always be found to alleviate this and perform works of quality and safely. Another criterion, rather recent and taking a more and more important place in our society, is the environmental impact. If its main consequences are experienced by the whole society, the client and the company can take advantage of choosing green solutions by getting eco-labels.
1.2 Aim
Engineers spend lots of time making decisions. Even though they must follow some regulations, they must decide which path they take; the one they suppose is the best and fits the most with the expectations of a project. Very often, the experience and know-how helps to make the best decisions. However, one cannot always predict everything from the beginning, given the amount of criteria that can have to be considered.
In order to make better choices, it is thus often common, especially for large projects, to complete several preliminary designs in order to get a more accurate idea of their characteristics before to make the final choice. This can in particular save money and time.
This thesis aims to perform a case study to widen an existing concrete bridge, from the design of several technical solutions to a discussion to assess the best one according to selected criteria. Some general information is also provided about modification of existing bridges and

1.3. SCOPE OF WORK
3
some usual techniques to widen a bridge. It is realized on a real bridge, the Bridge of Chaillot in Vierzon (France) initially built in 1972. The work is performed under real conditions, with standards into force and with the help of as much data, measures, and samples as available.
The original bridge is a road bridge with two lanes for vehicles and two sidewalks on its side. The widening must comprise four lanes and sidewalks of the same size as the existing ones. The final choice should be justified and argued.
1.3 Scope of work
The design of the solutions will be preliminary, and should be sufficient to ensure that each solution is realistic and can solve the problem of the widening. The designs will be based on the final stage, i.e. when the bridge is open to traffic. In particular, loads during construction will not be considered. A number of loads such as wind, snow, earthquakes, terrorism, military loads, fire action, settlements, vehicles brakes and acceleration, collision of boats against piers, fatigue, and accidental forces, will be disregarded. No dynamics analysis will be performed. No lateral forces, torsion, and shear effect will be considered, and the structural analysis will be based on a 2D model.
The actual state of the different bridge components will be reviewed but will not be considered in the calculations of the solutions: some measurements tools should have been performed on the bridge (tests…) to do so. Common techniques to evaluate the deterioration and functionality of the bridge components will however be presented. All the design calculations will be based on the data provided after the construction of the bridge, i.e. as if we were in 1972. Remarks from the visual inspection realized in January 2011 will also be provided.
Finally, abutments and rip-raps will be disregarded, and foundations will only be considered in a conceptual way.


2.1. BRIDGE LOCATION AND HISTORY
5
2 Description of the bridge and its environment
2.1 Bridge location and history
The Bridge of Chaillot is located in the centre France, in the close surroundings of a city called Vierzon. Vierzon is the second main city of the Cher district with about 28,000 inhabitants.
Figure 2.1: France and the European countries1 Figure 2.2: Location of Vierzon in France2
1 European Union – Audiovisual Services. http://ec.europa.eu. Visited on 03/03/2011.
2 Cher (department) – Wikipedia, the free encyclopedia. http://en.wikipedia.org/wiki/Cher_%28department%29. Visited on 03/03/2011.
Chapter

CHAPTER 2
6
The location is a strategic one since it is a node of both national highways and railways. It is located on the Lyon-Nantes and Paris-Toulouse (through Brive-la-gaillarde) axes of railway transportation, and benefits of highways in the directions of Paris, Nantes, Toulouse and Lyon.
Figure 2.3: Vierzon, railway junction3 Figure 2.4: Vierzon, highway junction4
These infrastructures are a serious asset for the economic health of the city. Vierzon also benefits from the influence of the Parisian activity, as it is only located one hour an half either by car or by train from this worldwide hub.
Vierzon grew mainly thanks to its industrial activity in the XIXth and XXth centuries, especially in the field of agricultural mechanization. In 1937, the city expands while it groups with three smaller cities of its surroundings. At that time, exportations were made in all over the world until the relocation of the main industries occurred in the 90’s. Some important factories like Fulmen or CASE, not profitable enough, closed. Since then the city is restructuring its activity in the tertiary sector like tourism and care of old people, taking advantage of its location but also of its natural resources like the forest and the rivers.
3 Cher (department) – Wikipedia, the free encyclopedia. http://en.wikipedia.org/wiki/Cher_%28department%29. Visited on 03/03/2011.
4 Cher (department) – Wikipedia, the free encyclopedia. http://en.wikipedia.org/wiki/Cher_%28department%29. Visited on 03/03/2011.

2.1. BRIDGE LOCATION AND HISTORY
7
Figure 2.5: Evolution of the population in Vierzon from 1800 to 20085
Figure 2.6: Location of the bridge in the main road network of Vierzon6
The Bridge of Chaillot was built in 1972 as part of a new bypass to reduce the congested traffic in the city centre. This part of the city ring road is called the D82 and links the two mains roads D2076 and D27 in the South-East of the city. Figure 2.6 shows the location of the bridge in the network of the main roads.
Since the city is split into several parts on account of the two rivers, the traffic is inevitably concentrated on the few bridges allowing the vehicles to go from one part to another. The D82, of which our bridge is a part, allowed the vehicles that do not need to go through the city centre to bypass it and reach the West, South and East directions in an easier way. The close surroundings of the bridge are fields and a forest.
1972, the year when the bridge was born, corresponds to the period of the highest industrial activity of the city with 35,000 local inhabitants. Those latter gradually decreased since that
5 Vierzon – Wikipedia, the free encyclopedia. http://fr.wikipedia.org/wiki/Vierzon. Visited on 21/03/2011.
6 Vierzon – Google Maps. http://maps.google.com/. Visited on 04/03/2011.
Time/years
Popu
latio
n/In
habi
tant
s
CHAPTER 2
8
time, until the city started its restructuring. Today there is a great hope since the city benefits more and more from the influence of Paris and since the new sectors (tourism, shops, care of old people...) are now increasing.
In a long-term view, Vierzon is intended to welcome an increasing population with a higher level of life than in the 70’s, who will need to move around in the city. The capacity of the actual Bridge of Chaillot may then be questioned and the solutions to widen it should be investigated.
2.2 Bridge geometry
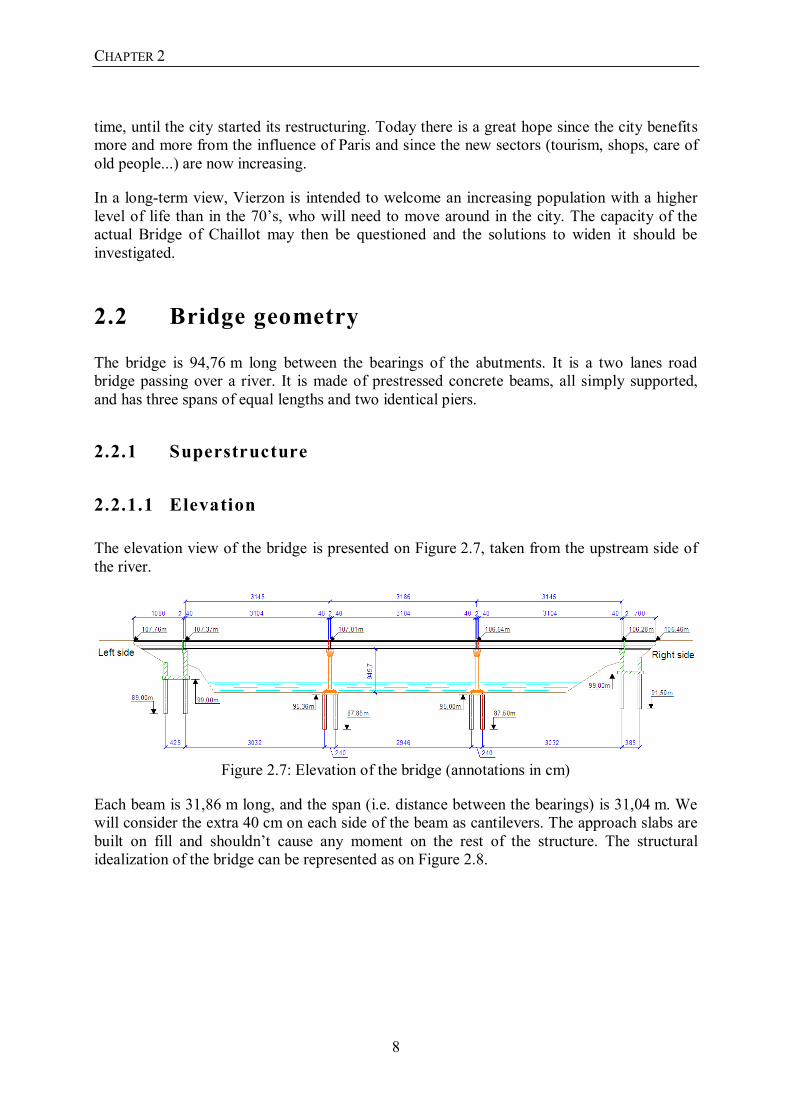
The bridge is 94,76 m long between the bearings of the abutments. It is a two lanes road bridge passing over a river. It is made of prestressed concrete beams, all simply supported, and has three spans of equal lengths and two identical piers.
2.2.1 Superstructure
2.2.1.1 Elevation
The elevation view of the bridge is presented on Figure 2.7, taken from the upstream side of the river.
Figure 2.7: Elevation of the bridge (annotations in cm)
Each beam is 31,86 m long, and the span (i.e. distance between the bearings) is 31,04 m. We will consider the extra 40 cm on each side of the beam as cantilevers. The approach slabs are built on fill and shouldn’t cause any moment on the rest of the structure. The structural idealization of the bridge can be represented as on Figure 2.8.

2.2. BRIDGE GEOMETRY
9
Figure 2.8: Structural idealization of the bridge
The end of the beams are separated between each other by joints of about 2 cm width.
Since the embankment on the left side is higher (+107,76 m) than the one on the right side (+106,46 m), there is an average slope of 1,15 % along the deck.
2.2.1.2 Planar geometry
Each span is supported by three identical simply supported beams. The planar geometries on one span between two piers and between a pier and an abutment are respectively given on Figure 2.9 and Figure 2.10. The two road lanes are straight.
Figure 2.9: Planar geometry of the deck between the two piers (annotations in cm)
Pier left side Pier right side Abutment left side
Abutment right side
3104 40 40 3104 40 40 40 3104 40
CHAPTER 2
10
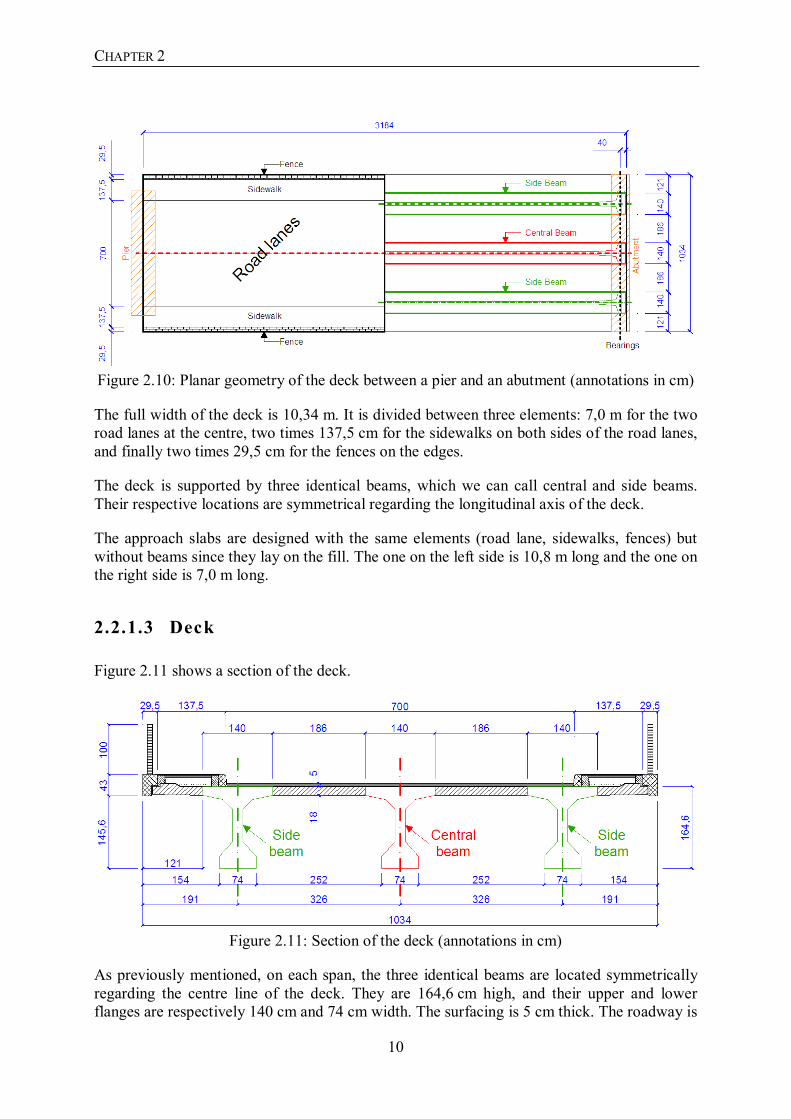
Figure 2.10: Planar geometry of the deck between a pier and an abutment (annotations in cm)
The full width of the deck is 10,34 m. It is divided between three elements: 7,0 m for the two road lanes at the centre, two times 137,5 cm for the sidewalks on both sides of the road lanes, and finally two times 29,5 cm for the fences on the edges.
The deck is supported by three identical beams, which we can call central and side beams. Their respective locations are symmetrical regarding the longitudinal axis of the deck.
The approach slabs are designed with the same elements (road lane, sidewalks, fences) but without beams since they lay on the fill. The one on the left side is 10,8 m long and the one on the right side is 7,0 m long.
2.2.1.3 Deck
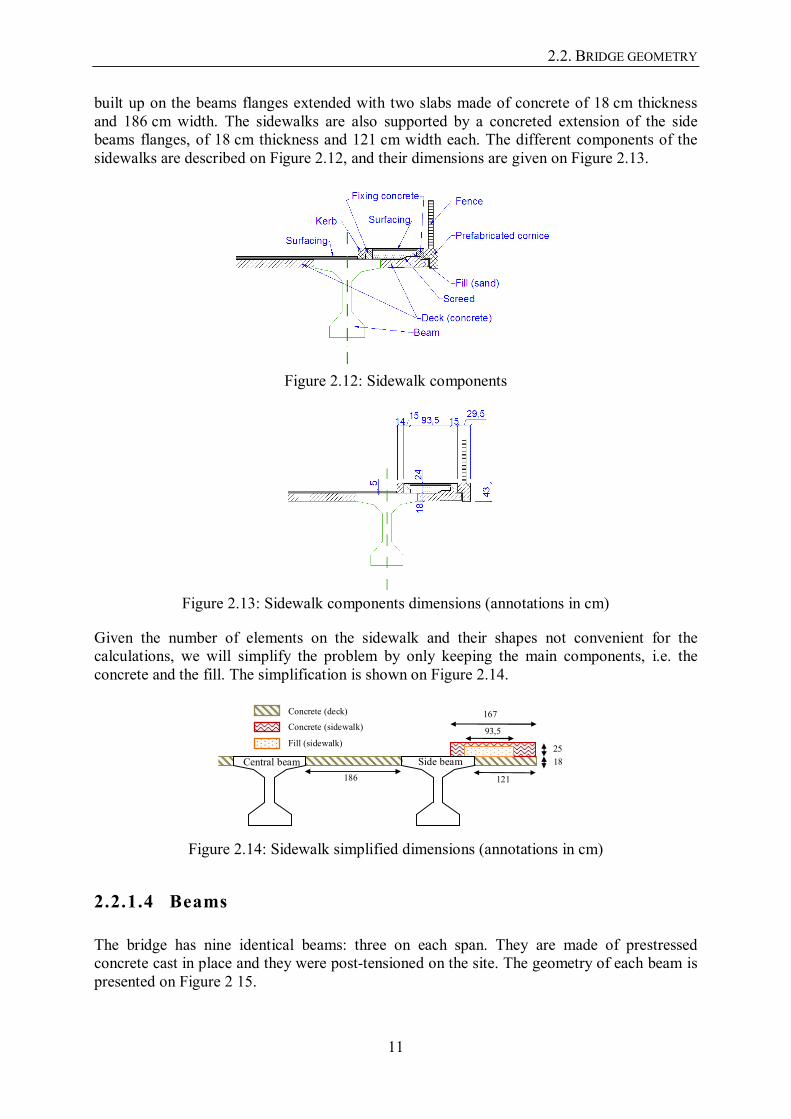
Figure 2.11 shows a section of the deck.
Figure 2.11: Section of the deck (annotations in cm)
As previously mentioned, on each span, the three identical beams are located symmetrically regarding the centre line of the deck. They are 164,6 cm high, and their upper and lower flanges are respectively 140 cm and 74 cm width. The surfacing is 5 cm thick. The roadway is
2.2. BRIDGE GEOMETRY
11
built up on the beams flanges extended with two slabs made of concrete of 18 cm thickness and 186 cm width. The sidewalks are also supported by a concreted extension of the side beams flanges, of 18 cm thickness and 121 cm width each. The different components of the sidewalks are described on Figure 2.12, and their dimensions are given on Figure 2.13.
Figure 2.12: Sidewalk components
Figure 2.13: Sidewalk components dimensions (annotations in cm)
Given the number of elements on the sidewalk and their shapes not convenient for the calculations, we will simplify the problem by only keeping the main components, i.e. the concrete and the fill. The simplification is shown on Figure 2.14.
Figure 2.14: Sidewalk simplified dimensions (annotations in cm)
2.2.1.4 Beams
The bridge has nine identical beams: three on each span. They are made of prestressed concrete cast in place and they were post-tensioned on the site. The geometry of each beam is presented on Figure 2 15.
Fill (sidewalk)
Concrete (sidewalk)
Concrete (deck)
25
18
93,5
167
186 121
Side beam Central beam

CHAPTER 2
12
Figure 2.15: Dimensions of each beam (annotations in cm)
Each beam is tensioned with seven cables, each one being made of 61 wires with diameter 5 mm. Figure 2.16 shows a section of a beam with the location of the reinforcements at midspan.
Figure 2.16: Location of the reinforcements at midspan for each beam (annotations in cm)
The prestressing cables are not continuous between the beams of the different spans, i.e. there are seven cables for each beam. Each beam is prestressed with a normal force of Ps.Initial=182,4 tons (this value includes the immediate losses after prestressing).
2.2.1.5 Expansion joints
No information was provided about expansion joints. However their physical appearance on Figure 2.17 shows clearly that they are made of two steel profiles supported by concrete blocks casted transversally. The material between the steel profiles seems to be made of metal: maybe steel, or aluminium. This type of joints is very classical.

2.2. BRIDGE GEOMETRY
13
Figure 2.17: Picture of an expansion joint7
2.2.1.6 Bearings
No information was provided about bearings. However their physical appearance on Figure 2.18 shows that they should be made of an elastomeric rubber, or a synthetic material. This type of bearings is usually made of several layers with some steel plates to reinforce them and limit their deformations.
Figure 2.18: Picture of a bearing on an abutment8
2.2.1.7 Drainage system
Rainwater, de-icing liquids and other eventual liquids are evacuated through holes located on the upstream side of the deck. The diameter of each one is 10 cm and there are two holes per span. The liquids are then directly rejected in the river.
7 Pierre FLINE, January 2011
8 Pierre FLINE, January 2011

CHAPTER 2
14
2.2.2 Substructure
2.2.2.1 Piers
The description of the piers and their annotations is given on Figure 2.19.
Figure 2.19: Dimensions of the piers (annotations in cm)
The two piers are 982,7 m high. They include a base, a trunk, and a head, which are respectively 130 cm, 702,7 cm, and 150 cm high. They all have a variable geometry depending on the height of the considered section. The dimensions of the base range from

2.2. BRIDGE GEOMETRY
15
360x590 cm2 to 325x125 cm2, those of the trunk from 325x65 cm2 to 510x65 cm2, and finally those of the head from 580x65 cm2 to 820x160 cm2. The shape of the trunk is not squared but rounded, the problem will however be simplified assuming the shape is as a rectangle with the above-mentioned dimensions.
The piers are made of reinforced concrete. As in most of the designs, a number of reinforcements are introduced more for design considerations than for increasing the capacity of the section, for example the shear reinforcements can hold the longitudinal one in place and vice-versa. The amount of reinforcements in the trunk that we will consider in this thesis is represented on Figure 2.20 and Figure 2.21. The lengths dBase and dTop correspond to the location of the centre of the left hand reinforcements from the opposite edge of the section, and d2Base and d2Top correspond to the location of the centre of the right hand reinforcements from the same edge. Since the sections are both horizontally and vertically symmetrical, those lengths would be the same on the opposite side.
h=0,65 m
bBase=3,25 m
dBase=3,0 m
d2Base=0,25 m
Figure 2.20: Longitudinal reinforcements at the base of the trunk
The reinforcements AsP1 and AsP2 are equal and each made of five bars of diameter 10 mm. AsP3 and AsP4 are also equal, and each made of 16 bars of diameter 10 mm.
h=0,65 m
bTop=5,1 m
dTop=4,85 m
d2Top=0,25 m
Figure 2.21: Longitudinal reinforcements at the top of the trunk
The reinforcements AsP5 and AsP6 are equal and each made of 27 bars of diameter 10 mm.
The head part of the pier is made of two identical cantilevers 1,55 m longs in reinforced concrete. Figure 2.22 shows the shape of the full section (i.e. closest to the trunk) and its reinforcements.

CHAPTER 2
16
Figure 2.22: Shape and location of the reinforcements of the full section of the cantilevers (annotations in cm)
Each reinforcements has a diameter of 10 mm. As1 is made of ten bars, all the others are made of two bars only. Observe that this structure is designed to resist especially to the sagging moment, with most of the reinforcements on the top edge of the section.
2.2.2.2 Abutments
The description of abutments and their annotations is given on Figure 2.23 and Figure 2.24.
Figure 2.23: Dimensions of the abutment on the left side (annotations in cm)

2.2. BRIDGE GEOMETRY
17
Figure 2.24: Dimensions of the abutment on the right side (annotations in cm)
Both abutments are 11,24 m wide. The one on the left side is 8,63 m high and the one on the right side is 7,54 m high. The three beams are not exactly horizontal in order to create a small transversal slope of 2 % on the deck, as indicated by the three supports that are not exactly on the same height on the abutments. It contributes to the evacuation of rainwater (made through the holes located on the upstream side of the bridge), and makes the driving more comfortable since the bridge is followed by a bend on the left side of the bridge.
The abutments contain no wing walls but two ripraps each to support the lateral earth pressure on their sides. Those ripraps are circular and supported by a beam and sheet piles. Their description is given on Figure 2.25 and Figure 2.26.

CHAPTER 2
18
Figure 2.25: Description of the ripraps downstream from the river (annotations in cm)
Figure 2.26: Description of the ripraps base (annotations in cm)
2.2.2.3 Soil and foundations
Figure 1.27 describes the dimensions and relative positions of the bored piles.

2.2. BRIDGE GEOMETRY
19
Figure 2.27: Dimensions and relative positions of the piles (annotations in m)
The piles are all made of reinforced concrete. The longitudinal reinforcements consist of eight bars of diameter 20 mm, evenly located around the centre of the pile and 8 cm from its outer
2,335 2,335 2,335 2,335
3,85
2,4 2,4
2,4
2,4 2,4
2,4
2,335 2,335 2,335 2,335
3,85
Abutment, left side
Pier, left side
Pier, right side
Abutment, right side
29,46
30,32
all Φ=80 cm
30,32

CHAPTER 2
20
edge. The transversal reinforcements are made of steel circles of diameter 72 cm and 8 mm thickness, every 20 cm along the pile. Figure 2.28 shows a representation of one pile section.
Figure 2.28: Description of one single pile (annotations in cm)
The length of the piles under the left side abutment is 10 m, the one for those under the piers and the right side abutment is 7,5 m.
The composition of the soil can be divided into one layer and one semi-infinite volume, as indicated on Figure 2.29. All the piles reach the second layer.
Figure 2.29: Description of the soil under the bridge (annotations in cm)
A number of tests were also performed at the location of each foundation before the original construction in order to determine the oedometric modulus (E) and the limiting pressure (Pl). The results provided are presented on Table 2.1. The blue boxes indicate the measures realised below the water table, and the red ones indicate that the measure was higher than 25 bars, the maximum value the device could quantify. The red lines specify the limit between the two layers in the soil.

2.2. BRIDGE GEOMETRY
21
Abutment left side Pier left side Pier right side Abutment right side
Depth/m E4/bar Pl4/bar Depth/m E3/bar Pl3/bar Depth/m E2/bar Pl2/bar Depth/m) E1/bar Pl1/bar
1,0 45 4,5 1,25 30 1,4 1,0 35 5,1 1,0 400 9,8
2,0 110 11 2,25 275 14,7 2,0 240 20,1 2,0 115 10,9
3,5 95 12,5 3,5 60 10,5 3,0 300 18 3,0 80 10,4
4,5 65 13 4,5 45 14,4 4,0 200 17,6 4,0 100 11,5
5,5 105 20,8 5,5 30 9,5 5,5 35 8,8 5,0 20 5,9
6,5 265 25 6,5 165 18,6 6,5 175 13,5 6,0 30 7,9
7,5 420 18,1 7,5 105 12 7,5 85 16,3 6,75 20 5,7
8,5 195 16,1 8,5 320 14,3 8,5 535 25 8,0 60 10,2
9,8 95 18,3 9,25 207 25 9,5 310 25 9,0 25 7,8
10,8 50 11,6 10,5 120 21,8 10,5 135 25 10,0 85 13,3
11,8 25 10,6 11,5 100 15,8 11,5 160 25 11,0 60 14
12,5 45 10,5 12,5 115 25 12,25 85 13,5
13,8 135 15,6 13,5 150 16 13,25 140 22
14,5 45 9,5 14,25 45 10,9
15,5 35 8,7 15,25 230 23
16,5 190 21,2 16,25 35 10,9
18,0 110 21,6 17,5 210 25
18,25 140 25
Table 2.1: Oedometric modulus (E) and limiting pressure (Pl) in the soil at the location of the foundations before the construction
The variations of those quantities with the depth are illustrated on the diagrams below, see Figure 2.30.
Figure 2.30: Variations of the oedometric modulus and of the limiting pressure in the soil for
the different groups piles
Depth/m Depth/m
Depth/m Depth/m
E 4/b
ar
E 3/b
ar
E 1/b
ar
E 2/b
ar
Pl2/b
ar
Pl1/b
ar
Pl3/b
ar
Pl4/b
ar
E4 Limit Pl4 E3
E1 E2 Limit
Limit
Limit Pl2
Pl3
Pl1

CHAPTER 2
22
We see that the limiting pressure is somewhat higher in the clay than in the sand, which is probably the reason why all the piles were designed to reach the second layer. In the preliminary calculations provided by the French authorities, the following design value of friction strengths of the piles were used:
s1=1,2 bar (along 3D of the pile length, cf. Section 3.2.3) (2.1)
s2=0,6 bar (along the pile length minus 3D, cf. Section 3.2.3) (2.2)
where D is the full diameter of the pile.
These values were reused for our preliminary calculations, in Section 3.7.
2.3 Material strengths
2.3.1 Remarks about assessments on material strengths
Most of material properties vary over time due to different actions and the result can be either beneficial or harmful on the structure. In any case, an existing structure should be measured and analysed before to conduct any study in order to assess its strength and possible performance. If necessary, the reasons of any deterioration should be investigated in order to understand the behaviour of the structure and anticipate better its possible evolutions.
In case of a deterioration of the structure, the owner should observe it as soon as possible and consider the repair. Even though the deterioration still did not propagate enough to alter the serviceability of the bridge, the repair might cost much more money if too much time passes before the repair starts. Figure 2.31 shows for example a schematic representation of damage over time. Usually, the sooner the deterioration is fixed, the more cost efficient it is. However the funds are not always available immediately to make repairs.
Figure 2.31: Schematic representation of bridge technical service life (Radomski, 2002)
2.3.1.1 Evolution with benefits
The chemical reaction of concrete lasts during the whole life of the structural elements, and the concrete strength still increases over time if the material is not injured by external actions.

2.3. MATERIAL STRENGTHS
23
Most of the strength is gained during the 28 first days after casting (cf. Figure 2.32) and then the phenomenon is somewhat slower.
Figure 2.32: Evolution of compressive concrete strength with time (according to Eurocode2 for a concrete C25/30 at a mean temperature of 20 °C)
The frictional strength of the piles usually increases over time too, due to the lateral forces of the earth applied on the piles.
2.3.1.2 Harmful evolutions
Harmful actions are unfortunately more important than beneficial ones. In prestressed concrete, prestressed reinforcements always experience a reduction of their tensile stresses due to time dependent losses caused by creep, shrinkage, and temperature variations. Those losses are supposed to be considered in the original design of the structure. Since it is not really possible to measure the strength of a reinforcement in concrete, there is no other way to assess it than theoretically.
Apart from the prestressing losses that are always expected, most common damages on concrete structures are (PIARC, 2005):
- Concrete cracking, either induced by internal corrosion of reinforcements that increase their volume, by an important deflection, by shrinkage effect, or simply by concrete ageing. Cracking is a natural process, but it can become unsafe if it becomes too significant. Cracks are generally acceptable until they reach a width of about 0,3 mm
- Corrosion, either due to concrete cracking, to carbonation (penetration of carbon dioxide from the air into the concrete) or to salts containing chloride ions brought from the sea, from the construction materials, or from de-icing salts in particular. In any case, corrosion leads to a swelling of corroded products which in turns provokes cracking and/or spalling
- Spalling, which can be worst than cracking since concrete flakes are missing, are generally produced for the same reasons as concrete cracking
Time/days
f cc/M
Pa

CHAPTER 2
24
- Deflection, mostly caused by overloading, structure deterioration, or fatigue consequence
- Deformation, provoked either by external loading or by internal loading (creep, shrinkage, temperature variations), that can also lead to cracking if it is too excessive.
The main causes of these damages are:
- Presence of salts containing chloride ions causing steel corrosion
- Freeze and thaw cycles (especially large in Nordic countries such as Canada or Scandinavia) that provoke cracking, spalling and reduction of the section’s performance
- Carbonation that causes corrosion as well
- Alkali-aggregate reaction, which is a chemical reaction between alkali components in the cement of the concrete and silica minerals contained in some aggregates. This reaction creates gel that absorbs water and expands, leading to concrete cracking
- Sulfate ions reaction, present in a limited number of environments such as chemical plants, sewage facilities, or polluted soils. The reaction between sulfate and concrete creates, through a particular process, ettringite, which leads to swelling and then deterioration of concrete.
- Bad execution, when the original works were not completed in an appropriate way to ensure the durability of the works. Characteristic reasons are:
o inadequate cover o rock pockets, that are concentrations of big aggregates in the concrete
facilitating carbon dioxide and water penetration to corrode the reinforcements
o cold joints, that are a discontinuity between two layers of concrete which were not cast on the same time
o incomplete duct grouting (for prestressed concrete), when not enough grouting was inserted in the duct, which allows place for water infiltration and a risk of corrosion of the reinforcements
- Overloading compared to the original design, giving rise to cracks and risk of corrosion
- Fatigue, which is the consequence of the repetition of a given loading over time. It generates cracks, cover scaling, and steel failure
- Inadequate drainage, which allows water to flow on materials and can produce corrosion, especially if they contain de-icing salts
- Deterioration of expansion joints and bearings, provoked by water leakage or poor drainage.

2.3. MATERIAL STRENGTHS
25
Each damage is likely to reduce the strength of at least one of the materials and would injure the structure. For this reason it is always helpful to conduct some measurements in order to assess their real strength.
2.3.2 Results of measurements realised on samples after the bridge construction
When the bridge was built, some samples of concrete used for the beams and the deck were kept in order to assess their properties over time. Measurements of unit weight, compressive and tensile strengths, and sound speed were made after 2, 3, 7, 28, 90 and 360 days Table 2.2 presents the strengths and unit weights of concrete used for the beams and the deck, measured one year after casting:
Elements Compression Tension
σcc/bar σcc/MPa Unit weight/kg.m-3 σct/bar σct/MPa Unit weight/kg.m-3
Beams
1 404 40,4 2,324 (Missing data)
2 295 29,5 2,408 23,4 2,34 2,363
3 328 32,8 2,399 28,0 2,8 2,358
4 344 34,4 3,379 28,8 2,88 2,377
5 304 30,4 2,366 20,7 2,07 2,379
6 365 36,5 2,411 26,9 2,69 2,376
7 367 36,7 2,374 30,9 3,09 2,390
8 412 41,2 2,400 28,2 2,82 2,388
9 374 37,4 2,413 32,0 3,2 2,397
min 295 29,5 2,324 20,7 2,07 2,358
average 355 35,5 2,497 27,36 2,74 2,379
max 412 41,2 3,379 32 3,2 2,397
Deck
Right side span 359 35,9 2,406 23,9 2,39 2,384
Central span 396 39,6 2,403 27,9 2,79 2,395
Left side span 419 41,9 2,391 31,8 3,18 2,376
min 359 35,9 2,391 23,9 2,39 2,376
average 391 39,1 2,400 27,9 2,79 2,385
max 419 41,9 2,406 31,8 3,18 2,395
Table 2.2: Strengths of beams and deck measured one year after the bridge construction. (Beams 1 to 3 are on the right side span ; 4 to 6 on the central one ; 7 to 9 on the left side one) The average values of this table have been considered in the design, i.e.:
σccd.Beams=35,5 MPa σctd.Beams=2,74 MPa γd.Beams= 32,497+2,379 =2,438 kg/m2
σccd.Deck=39,1 MPa σctd.Deck=2,79 MPa γd.Deck= 32,400+2,385 =2,393 kg/m2

CHAPTER 2
26
2.3.3 Report of the visual inspection realised in January 2011
Different kinds of inspections can be carried out on a bridge. Even during the natural life cycle of the bridge, inspections are achieved regularly in order to ensure the proper and safe functioning of the bridge and to follow up the evolution of its behaviour. Table 2.3 summarizes the common intervals between inspections in a few developed countries.
Country Inspection intervals for
General inspection Major inspection
Belgium 1 year 3 years
Denmark 1 to 6 years depending on previous inspection results
France 1 year 5 years
Italy 3 months 1 year
Canada (Ontario) Defined by the owner (2 years is recommended)
Switzerland 15 months 5 years
Sweden 1 year 3 years
Germany 3 months 3 years
USA (national bridges) 2 years
Table 2.3: Inspection intervals in a few developed countries (Karoumi, 2010)
A general inspection is usually brief and mostly consists to ensure that the bridge stands and nothing is obviously wrong (no excessive deflection or cracking...). It is essentially visual, and some equipment such as borescope or periscope may be used to inspect hardly accessible areas. A major inspection is more thorough and may include to analyse the state of the reinforcements, or to measure the cracks for example. In addition, special inspections might be required depending on the results of the major inspections, or more regularly in some countries (every six year in Sweden and Germany for example). A special inspection includes advanced accurate measurement tools.
When making measurements on an existing bridge, non-destructive techniques should be used in order to preserve the structure. They usually consist in an artificial solicitation of the bridge, and the measurement of its response. Some of the most common tools are (Nowak, 1990):
- Strain and deflection gauges - Response of the propagation of electromagnetic waves - Measurement of electrical resistances and potentials to estimate moisture content
and corrosion rate

2.3. MATERIAL STRENGTHS
27
- Magnetic methods to gauge the position of reinforcements with a cover meter or a pachometer
- Sonic (with hammer blows) and ultra-sonic (with electronically induced mechanical pulses) methods to assess the Young modulus of the material
- Infrared thermography, radiography and radiometry to evaluate the shape of concrete inside the structural elements.
The cheapest device is of course the gauges, even though the information provided is quite limited and restricted to only external and accessible surfaces. Radiometry and radiography are the most recent tools of the list. The results of such an investigation should allow not only to weigh up the actual strength of the structure but also to analyze the causes of damages in order to foresee the possible further degradations if they are not fixed.
Foundations are rather difficult to inspect because of their location in the soil, and also because they are covered either by a pier or an abutment which makes them difficult to move or vibrate and assess the response behaviour. Some methods to test the foundations can be (Ginger CEBTP, 2007):
- Mechanical impedance method to establish the geometric profile of the foundation
- Sonic sampling method to verify the quality of the concrete of a deep foundation - Seismic and parallel method to define the anchorage length of an existing
foundation - Dynamic loading test to determine the load bearing capacity of a deep
foundation.
A visual inspection has been carried out on the Bridge of Chaillot in January 2011. All the pictures in this section have been taken by Pierre FLINE at this time. Only the parts of the bridges above the water level could be observed. This inspection revealed no excessive deflection when the cars were passing. It should be observed that the surfaces above the rivers could not be investigated as accurately as the others due to their distance from the land.
Road: the road presented an important cracking of asphalt. Big cracks can cause discomfort for passengers and the surface not smooth can alter the tires. Cracks can also allow water infiltrations to the base layer, provoking its deterioration.
Figure 2.33: Road damages
Sidewalks and fences: cracking was observed on sidewalks edges. Apart from bad aesthetics, this can in turn be harmful for maintaining the fences.

CHAPTER 2
28
Figure 2.34: Cracked external side of a sidewalk and its fence
Drainage system: gutters were apparently in a fit state, nothing blocked the possible water flow. The rainwater exits on the side of the bridge were also free of any blocking objects (waste, wood…). Some vegetation tends to grow up but they should not by a problem yet.
Figure 2.35: One of the rainwater exits, on the left and upstream side of the bridge
On the contrary, drainage holes on the upstream side of the bridge were not all in a good state. Out of six holes, four are totally blocked and one is partially blocked (cf. Figure 2.36).
Figure 2.36: Drainage holes

2.3. MATERIAL STRENGTHS
29
Expansion joints: expansion joints were still present and none of them was torn. Bolts and cover plates were still in place. Some debris were found on the edge, that might reduce the joints freedom of movements (linear and rotation as well). Asphalt in the vicinity of joints was also lightly cracked.
Figure 2.37: An expansion joint
Deck and beams: cracks were observed under the deck all around the structural elements. One can easily make out the limits between the beams flanges and the deck between the flanges. This might be because of a too important time delay between the different concrete castings, i.e. a small “cold joint” due to a poor execution, as previously defined. Other small cracks were also noticed on the sides of the deck, especially close to the approach slabs.
Figure 2.38: Cold joints between beams flanges and deck
Some black stains are also present on the edges of the deck and of the beams. Since they are strictly vertical, they are probably due to a reaction with rainwater flow, probably acid rains.

CHAPTER 2
30
Figure 2.39: Black stains on beams (left) and deck (right)
Finally, other stains were found on the flanges of the beams, with a rather bright colour, probably due to shrinkage effect or to water leakage.
Figure 2.40: Bright stains on a beam flange
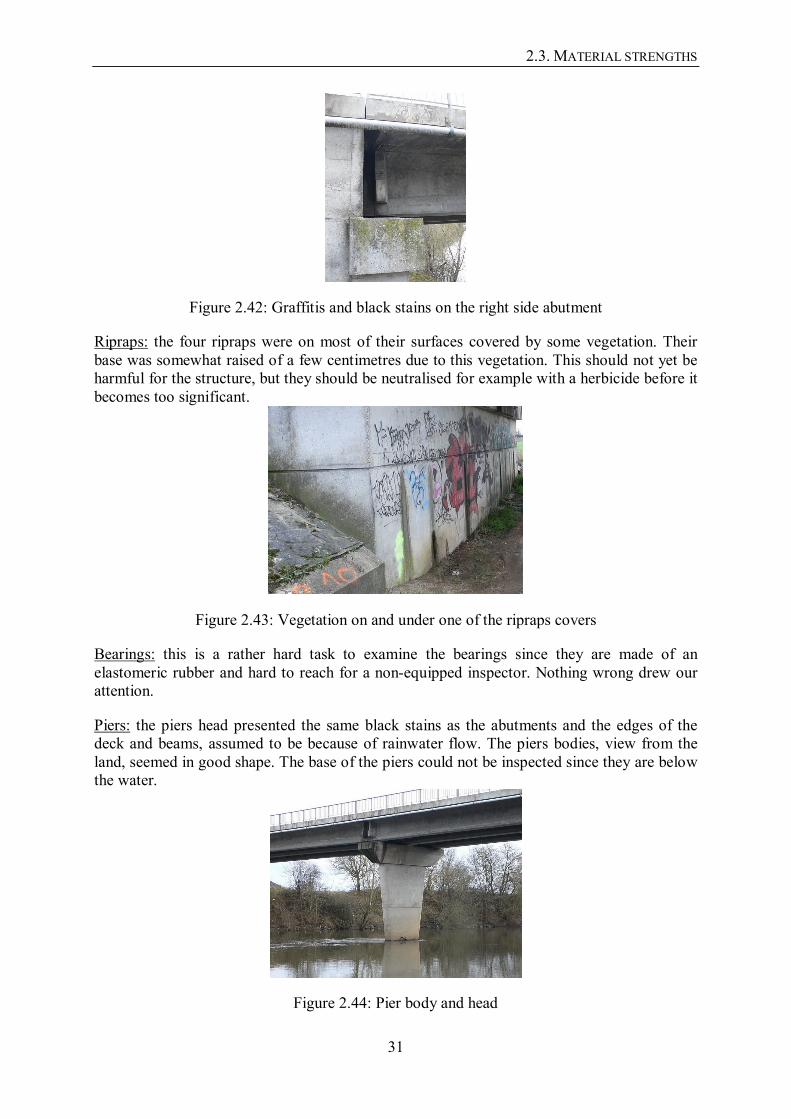
Abutments: abutments obviously experienced graffitis, that should not alter their structural functionality but hurt the visual aspect (aesthetics). They also have the same black stains the deck edges have.
Figure 2.41: Graffitis and black stains on the right side abutment
At last, some moisture was noticed on the seats of the abutments, were water might not have been properly evacuated. Moisture is however only superficial and does not seem to affect the use of the abutments.
2.3. MATERIAL STRENGTHS
31
Figure 2.42: Graffitis and black stains on the right side abutment
Ripraps: the four ripraps were on most of their surfaces covered by some vegetation. Their base was somewhat raised of a few centimetres due to this vegetation. This should not yet be harmful for the structure, but they should be neutralised for example with a herbicide before it becomes too significant.
Figure 2.43: Vegetation on and under one of the ripraps covers
Bearings: this is a rather hard task to examine the bearings since they are made of an elastomeric rubber and hard to reach for a non-equipped inspector. Nothing wrong drew our attention.
Piers: the piers head presented the same black stains as the abutments and the edges of the deck and beams, assumed to be because of rainwater flow. The piers bodies, view from the land, seemed in good shape. The base of the piers could not be inspected since they are below the water.
Figure 2.44: Pier body and head

CHAPTER 2
32
Foundations: foundations could not be inspected since they are located below the water. The piers did not show any significant inclination.
Some measures of rehabilitation for the previously mentioned damages could be:
- For road cracks: remove the pavement and install a new one. If cracks were localized on a part of the road only, we could install a patch, but they are spread on the whole road so patching is not enough
- For concrete cracks on sidewalks, deck edges and cold joints: cement or epoxy grout. If cracks were too important (e.g. more than 1 cm) and deeper, more efficient techniques would be required, like removing the existing concrete until the reinforcements (without deteriorating them), and then cast new fresh concrete on it. Existing concrete can be removed by water jetting, saw cutting, or with a pneumatic hammer depending on the location of the concrete to remove. The operation must stay safe for the workers. A good advantage of this operation is that reinforcements can be reached, and an anti-corrosion painting can be applied on it on the same time. Another technique can be to apply a surface coating, i.e. add a new layer on the existing cracked one. This new layer can be made of concrete or another strengthening material like carbon fibre strips
- For vegetation on ripraps and on the drainage system, herbicide should be employed
- For expansion joints, debris should be removed
- For surfaces with black stains and moisture, those latter can be removed simply by hand washing, air jet blast or water jet blast for locations difficult to reach. However, the origin of this damage is hard to reduce since rainwater is intended to flow on any surface exposed to the air
- Graffitis should be cleaned with the same techniques as black stains and moisture, unless the owner (inhabitants) like it and wish to keep them. If they are removed, there are not many solutions to avoid new graffitis to be drawn since the surroundings are on a public path and since tall fences would be required to stop people access the abutment. Depending on what the owner prefers, a reasonable solution could be to paint graffitis without swear words in order to prevent new ones.
Of course each measure does not need to be taken as soon as possible since there is no high risk of serviceability harm, but if funds are available, the owner should consider them. The deteriorations were not taken into account in our study when designing the widening, since we did not have the equipment to make a sufficiently significant evaluation.
2.3.4 Materials strengths considered in the calculations
Apart from the results of the data measured on samples and presented in Section 2.3.2. (concrete in beams and deck), the values considered in the design of the widening of the

2.3. MATERIAL STRENGTHS
33
bridge were the ones considered in the original design or assumed with the help of the Eurocode, i.e.:
Prestressing reinforcements in beams
fOriginalBeams.pk=1600 MPa fOriginalBeams.p0,1k=1500 MPa EOriginalBeams.pk=205 GPa
εuk=50 ‰ (class B)
Figure 2.45: Mechanical behaviour in tension of prestressing reinforcements – typical real curve (on the left) and idealized curve (on the right) with characteristic values (according to
Eurocode2).
Failure limit for the top inclined branch is (εuk, fOriginalBeams.pk). For steel reinforcements, the Eurocode2 lets to the designer the choice of considering either the top inclined branch or the top horizontal one.
Concrete in piers and beams
fOriginalBeams.ck=27,0 MPa EOriginalBeams.cm=31 GPa εcu=3,5 ‰
Reinforcements in piers and beams
fOriginalBeams.yk=420 MPa EOriginalBeams.sk=210 GPa εuk=50 ‰ (class B)
Ductility coefficient was assumed to be k=1,0.
An exception was made when evaluating the prestressing long-term losses, where the original strength of concrete was considered instead of the measured one since this is a time dependent process and we cannot guarantee that the measured strength (higher than the theoretical one) was the same in the past. This is a conservative decision since shrinkage and creep effects, and consequently losses, increase if the concrete strength is lower.
ε
σ/M
Pa

CHAPTER 2
34
2.4 Loads
2.4.1 Original and new designs
2.4.1.1 Calculation of resistance
The bridge, built in 1972, was originally designed according to the national French codes BA68 (reinforced concrete) and IP1 (prestressed concrete). Table 2.4 and Table 2.5 summarize the main French design regulations for prestressed and reinforced concrete design respectively.
Year of application 1965 1973 1983 1991 2002
Acronym IP1 IP2 BPEL83 BPEL91 Eurocode2
Name (French)
Instruction Provisoire relative à l’emploi du béton
précontraint 1
Instruction Provisoire relative à l’emploi du béton
précontraint 2
Règles du Béton Précontraint suivant la méthode des Etats
Limites
Règles du Béton Précontraint suivant la méthode des Etats
Limites
Eurocode2
Name (translated in English)
Provisional Instruction
concerning the use of Prestressed
Concrete 1
Provisional Instruction
concerning the use of Prestressed
Concrete 2
Rules of Prestressed Concrete according to the Limit States
method
Rules of Prestressed Concrete according to the Limit States
method
Eurocode2
Material behaviour
model Elastic Elastic-plastic
Security approach Deterministic Semi-
probabilist
Table 2.4: Main design rules or codes into force in France for prestressed concrete design

2.4. LOADS
35
Year of application 1906 1934 1968 1982 1992 2002
Acronym BA06 BA34 BA68 BAEL82 BAEL92 Eurocode2
Name (French)
Règles du Béton Armé
Règles du Béton Armé
Règles du Béton Armé
Règles du Béton Armé
suivant la méthode des Etats Limites
Règles du Béton Armé
suivant la méthode des Etats Limites
Eurocode2
Name (translated in
English)
Rules of Reinforced Concrete
Rules of Reinforced Concrete
Rules of Reinforced Concrete
Rules of Reinforced Concrete
according to the Limit
States method
Rules of Reinforced Concrete
according to the Limit
States method
Eurocode2
Material behaviour
model Elastic Elastic-plastic
Security approach Deterministic Semi-
probabilist
Table 2.5: Main design rules or codes into force in France for reinforced concrete design
Two main changes happened so far:
- In 1982 and 1983 came into force the BAEL82 and BPEL83 respectively. Before this, the codes assumed the materials had only a linear behaviour, i.e. Hooke’s law was always valid (method based on “allowable stresses”). This model obviously leads to an underestimation of the materials capacity and had to be adapted to their real behaviour, assuming elastic-plastic models in BAEL and BPEL and considering the different limit stages of the structure (Ultimate Limit State and Serviceability Limit States)
- In 2002 when the Eurocode2 came into force. The main change concerns the assessment of security. The BAEL and BPEL were based on a determinist model, in other words each material capacity calculated was assumed to be the real one, and security coefficients were applied in order to get a security margin. However, one knows that the “no risk” does not exist: there is always a chance, even with low probability, that the material has for example a much lower strength than assumed, or that a device used to make a measurement was malfunctioning… The Eurocode2 is based on the awareness of risk probabilities and assumes that these probabilities are low enough (order between 10-3 and 10-7) to make the structure sufficiently safe during its lifetime. The Eurocode2 is however said to be a semi-probabilistic model since its application is in reality made through security coefficients for more simplicity.
2.4.1.2 Calculation of solicitations
The Fascicule 61, titre II of the “Cahier des Clauses Techniques Générales” (translated in English as Part 61, title II of the “Book of General Technical Clauses”) issued in 1971,

CHAPTER 2
36
originally ruled in France the calculation of solicitations on bridges. Since 2002 the Eurocode1 is the new regulation on this topic, and in particular the Eurocode1-Part2 rules the traffic loads on bridges.
In both codes, several load cases should be considered corresponding to various effects. These load cases are summarized in Table 2.6.
Eurocode1-Part2 French national code
Name Load case Name Load case
LM1 Traffic jam with high percentage of trucks
(distributed loading+2 axles)
A Distributed loading
LM2 Single axle load
(two wheels of 200 kN each)
Bc Trucks jam (trucks line of 3 axles)
LM3 Special vehicles
(military equipment, exceptional trucks…)
Bt Trucks jam (trucks line of 2x2 axles)
LM4 Crowd loading (strikes…) Br
single wheel of 100 kN distributed loading may be omitted if the effect is more
harmful)
Table 2.6: Traffic loading cases in the French national code and in the Eurocode Load case LM1 consists in two types of loading combined together:
- A uniform one, called Uniformly Distributed Loads (UDL) in the Eurocode - A concentrated one, called Tandem System (TS) in the Eurocode.
It should be noted that all lanes are equally loaded in the load case A in the French code, whereas in LM1 the external lanes are more heavily loaded since these vehicles (trucks in particular) are supposed to run primarily on those lanes. This remark is also valid for concentrated loadings Bc and Br, and a consequence is that LM1 considers a torsion effect whereas A, Bc and Bt do not.
The distributed loading in LM1 is a bit lower than in the French code (modified in 1980). Figure 2.46 shows the distributed loading in kN/m2 to consider depending on the loaded length in meters until 200 m for a four lanes bridge, according to the French code. The uniform loading is greater than 2,5 kN/m2.

2.4. LOADS
37
Figure 2.46: Distributed loading depending on the loaded length (French code: case A)
In the LM1 case, the most external lane is loaded with 9 kN/m2 whereas all the others are loaded with 2,5 kN/m2. It is difficult to compare the two uniform loadings since they are not loaded the same way, but for long bridges the Eurocode tends to be more harmful since the external lane is much more loaded. If we add that LM1 also includes a concentrated loading to its uniform one, the Eurocode is then for sure more harmful than the French code. For information, in comparison with the previous Swedish national code, the distributed loading according to Bro2004 is roughly the same as the Eurocode on internal lanes (3 kN/m2 and 2 kN/m2 compared to 2,5 kN/m2) but the external lane was much less loaded (4 kN/m2 compared to 9 kN/m2 with the Eurocode).
Concentrated loadings are heavier in the French code, considering that all trucks are 300 kN (Bc) or 320 kN (Bt) whereas once again the Eurocode considers the location of the lane: the external one is loaded with 300 kN, the second one with 200 kN, the third one with 100 kN and the others are not loaded with concentrated loads. In the Swedish national code, the external lane was loaded with 250 kN, the second one with 170 kN and the others were not loaded with concentrated loads.
Pedestrian loads in the French regulations were 450 kg/m2 i.e. around 4,5 kN/m2. The Eurocode recommends 5 kN/m2, which is comparable but slightly heavier.
In conclusion, bridges built in the pass might not to fulfil the Eurocode loading recommendations today.
2.4.2 Loads considered in our calculations
The goal of this work was, given the existing structure, to design a number of solutions to widen the bridge from two to four lanes. Not all the loads were considered in our calculations since they would either not be relevant enough or either too time consuming to consider, without a significant interest in the scope of this thesis. It should be mentioned that only the bending effect was considered in the designs, the shear one was disregarded.
The permanent loads that were considered are the following: - dead weight of the structure, surfacing, and sidewalk - prestressing tendons eccentricity
Loaded length/m
UD
L/kN
.m-2

CHAPTER 2
38
- shrinkage - creep.
The temporary loads that were considered are the following: - traffic loading - pedestrian loads on the sidewalk - temperature variations.
The whole of these loads has been considered to be representative enough of what the bridge should experience during its life span.
2.4.3 Loads not considered in our calculations
A more thorough study could have included the following effects: - Action of fire - Snow - Lateral forces like wind and earthquake (even though earthquakes happen very
seldom in Vierzon) or cars changing to another lane - Actions during execution of works - Terrorism, war attacks, explosions (ex: chemicals in a truck…), car accidents - Collision forces on piles/decks, even though no big boats are supposed to sail on
this river - Exceptional traffic loading (military equipment, exceptional truck) - Longitudinal forces such as vehicles acceleration or braking - Differential settlements of piers.

3.1. REVIEW OF SOME COMMON METHODS TO WIDEN A BRIDGE
39
3 Technical solutions to widen the bridge
3.1 Review of some common methods to widen a bridge
Widening a bridge is performed in order to allow a more important traffic at a time, either for vehicles, pedestrians, or both. The most obvious mean is to widen the existing deck and carry out any other widening or strengthening of elements to support the increased loading. However one can also, for some reasons, build a new bridge next to the existing one. This was for example the case for the Söderkullabron next to Växholm, where a cable-stayed pedestrian bridge stands next to a two road lanes arched bridge, as shown on Figure 3.1.
Figure 3.1: Pictures of the Söderkullabron, next to Växholm. Elevation9 (on the left) and transversal10 (on the right) views.
9 Pierre FLINE, October 2010
10 Soderkullabron, Vaxholm – Pedestrian Suspension Bridges on Waymarking.com, http://www.waymarking.com/waymarks/WM1AMN_Soderkullabron_Vaxholm. Visited on 12/06/2011.
Chapter

CHAPTER 3
40
Building a new bridge next to an existing one can be justified for example if the existing bridge is historical, if its aesthetics should remain as it is, or simply if its structural system does not fit for directly widening the existing structure. Nevertheless, this doesn’t mean it should not be rehabilitated.
When the existing bridge itself is enlarged, to keep only one single bridge, the other structural components might have to be modified. For a classic beam bridge, the loads are transmitted to the deck, then from the deck to the piers, from the piers to the foundations, and from the foundations to the soil. Four cases can occur:
- Widening of the deck with no need to modify the beams (no strengthening or extra beams required)
- Widening of the deck with significant modification of the beams (strengthening or extra beams required)
- Widening of the deck with significant modification of the beams and of the piers
- Widening of the deck with significant modification of the beams, the piers, and the foundations and/or the soil.
The first case is mainly for small widening, for example to slightly increase the width of the sidewalks by increasing the length of the transversal cantilevers. One can imagine adding an arch or a cable-stay system to support the heavier loading of an enlarged structure, but consistent piers and/or foundations should be designed to do so.
Of course the cheapest, fastest, and easiest case is when only the deck has to be modified. However, only the fact to add one extra lane often leads to the need to strengthen at least some other elements of the structure, unless it was originally overdesigned.
3.2 Review of some common methods to strengthen a concrete bridge
The method used should of course be adapted to the existing shape of the structure and to the needs. For this reason, an extensive inspection should be performed before each study and the requirements to be met on the new structure should be clearly defined. A large number of technical solutions have been developed since the last century and new methods are continuously being developed in order to be more technically, economically, or even environmentally efficient, and to cover the increasing needs. This section intends to present some common methods and a few new ones.
Bridges are usually modified for one of those two reasons (Radomski, 2002):
- It is structurally deficient, i.e. it is too deteriorated and it might be dangerous to make use of it (large cracks, large deflections...)

3.2. REVIEW OF SOME COMMON METHODS TO STRENGTHEN A CONCRETE BRIDGE
41
- It is functionally obsolete, i.e. it is in a good shape to be used but it does not meet the requirements of its functionality anymore. This is for example the case when the traffic has increased a lot and the bridge is not anymore large enough.
In both cases the structure may have to be strengthened, and the second case (functionally obsolete) might require more important works since the original design itself is no more adapted to the present situation. One can classify the strengthening methods in two groups (Radomski, 2002):
- Active methods, i.e. when the strengthening is based on an intentionally redistribution of internal forces in the structure. This is usually made by adding or removing one or several structural elements
- Passive methods, i.e. when the strengthening can also lead to a redistribution of internal forces, but it is not the first goal.
Often when a bridge is to be enlarged, some concrete is to be cast again an existing one. The common method for this is to remove the existing concrete until the reinforcements, for example by water jetting, and then introduce some reinforcements to make the continuity between the existing structure and the future new one. Finally the new concrete is casted against the old one. In general for this type of action, the effect of shrinkage of both elements that were not casted on the same time is summed. When such technique is performed, the existing reinforcements should as much as possible not be hit by the water jet in order to preserve their performance. It is also strongly recommended to take advantage of reaching the existing reinforcements to apply some anti-corrosion paintings.
Figure 3.2: Sketch of a method to cast new concrete against existing one
Last but not least, a designer should also keep in mind that strengthening a structure might not always be the best solution, sometimes is may be preferable to destroy the existing structure and build a new one (more durable, simpler, maybe cheaper, maybe faster…).
3.2.1 Strengthening of concrete superstructures
3.2.1.1 Active methods
Active methods lead to a redistribution of internal forces. When choosing a method of this kind, the bridge designer should keep in mind that the overall load effects might be modified on the different structural components, and the whole structure should be studied in
Water jet
New reinforcements Existing reinforcements
Existing concrete
Anti-corrosion painting
New concrete
CHAPTER 3
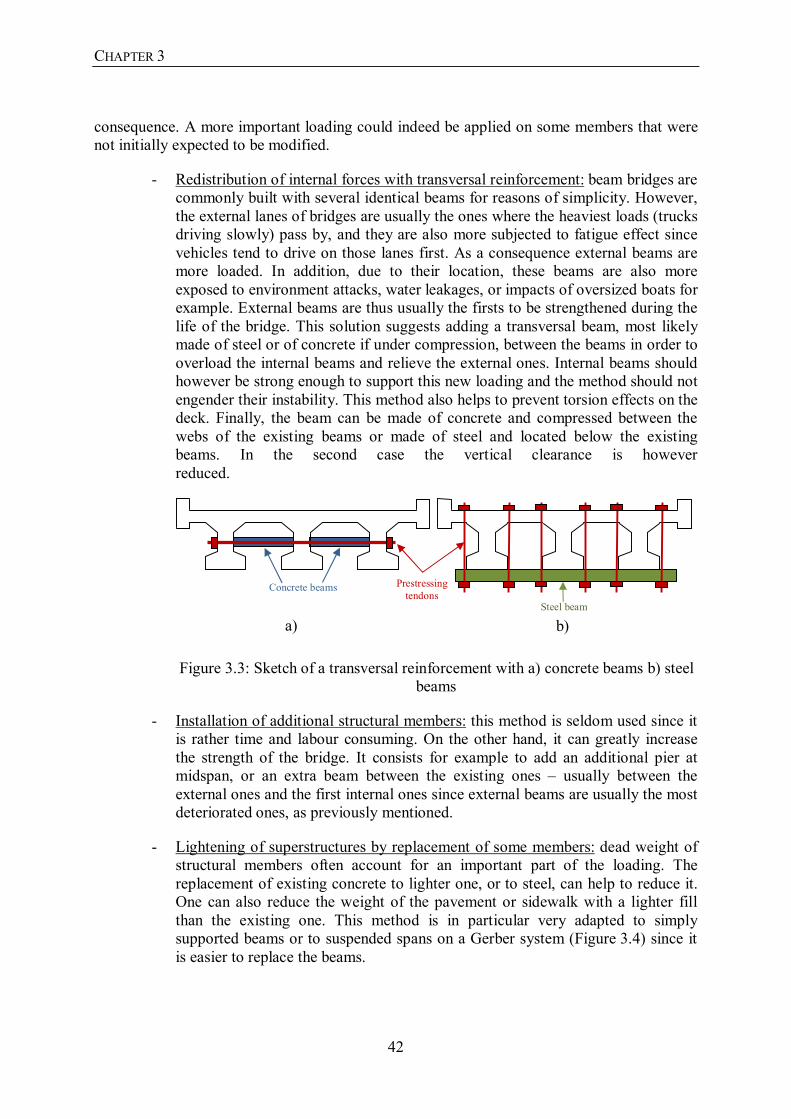
42
consequence. A more important loading could indeed be applied on some members that were not initially expected to be modified.
- Redistribution of internal forces with transversal reinforcement: beam bridges are commonly built with several identical beams for reasons of simplicity. However, the external lanes of bridges are usually the ones where the heaviest loads (trucks driving slowly) pass by, and they are also more subjected to fatigue effect since vehicles tend to drive on those lanes first. As a consequence external beams are more loaded. In addition, due to their location, these beams are also more exposed to environment attacks, water leakages, or impacts of oversized boats for example. External beams are thus usually the firsts to be strengthened during the life of the bridge. This solution suggests adding a transversal beam, most likely made of steel or of concrete if under compression, between the beams in order to overload the internal beams and relieve the external ones. Internal beams should however be strong enough to support this new loading and the method should not engender their instability. This method also helps to prevent torsion effects on the deck. Finally, the beam can be made of concrete and compressed between the webs of the existing beams or made of steel and located below the existing beams. In the second case the vertical clearance is however reduced.
Figure 3.3: Sketch of a transversal reinforcement with a) concrete beams b) steel beams
- Installation of additional structural members: this method is seldom used since it is rather time and labour consuming. On the other hand, it can greatly increase the strength of the bridge. It consists for example to add an additional pier at midspan, or an extra beam between the existing ones – usually between the external ones and the first internal ones since external beams are usually the most deteriorated ones, as previously mentioned.
- Lightening of superstructures by replacement of some members: dead weight of structural members often account for an important part of the loading. The replacement of existing concrete to lighter one, or to steel, can help to reduce it. One can also reduce the weight of the pavement or sidewalk with a lighter fill than the existing one. This method is in particular very adapted to simply supported beams or to suspended spans on a Gerber system (Figure 3.4) since it is easier to replace the beams.
Prestressing tendons
Concrete beams
Steel beam
a) b)

3.2. REVIEW OF SOME COMMON METHODS TO STRENGTHEN A CONCRETE BRIDGE
43
Figure 3.4: Sketch of a Gerber system
- Prestressing with additional tendons: here again, the beams that are usually in need of strengthening are the external ones. The great advantage of this technique is that it is not too difficult to apply, and it can fit with any kind of beam (steel, reinforced concrete, prestressed concrete, wood...) since tendons are external, as long as the beam can support the anchorages of the tendons. The idea is to fix external prestressing tendons on the edges of the beams, or more rarely on their bottom. They should always remain symmetrical on both sides of the beams in order to avoid any unexpected torsion effect. Anchorages can be fixed to the beams with the help of transversally prestressed bars. This method does not add any dead weight and has also the advantage of being able to be carried out without stopping the traffic of vehicles during the works. It can be used to counteract either sagging moment if tendons are on the lower side of the beams, or hogging moment if applicable, if tendons are located on the upper side. If needed some deviators can be used to obtain the intended shape. Such a system can also be implemented to transform a hinged connection to a clamped one, i.e. to transform a determinate system (simply supported beams, Gerber system) into an indeterminate one, that is more durable and easier to maintain. Attention should be paid on the protection of external tendons against environmental attacks (air, rainwater, chemicals...) that could in particular lead to corrosion. Some anti-corrosion painting should be used on the tendons, and if possible, a protection should be arranged around them, like for example a plastic tube. A disadvantage of this technique is that it is not very aesthetical, and the risk of an oversized boat or truck hitting the tendons should be considered.
Figure 3.5: Sketch of the principle of external prestressing on a) simply supported beams b) continuous beams
Reinforcement Prestressing
tendon
Section C-C Section B-B
Section A-A Sections A-A and B-B
Section C-C
Deviators
Anchorage
Protection
a)
b)
Cantilever arm
Suspended span
Cantilever arm
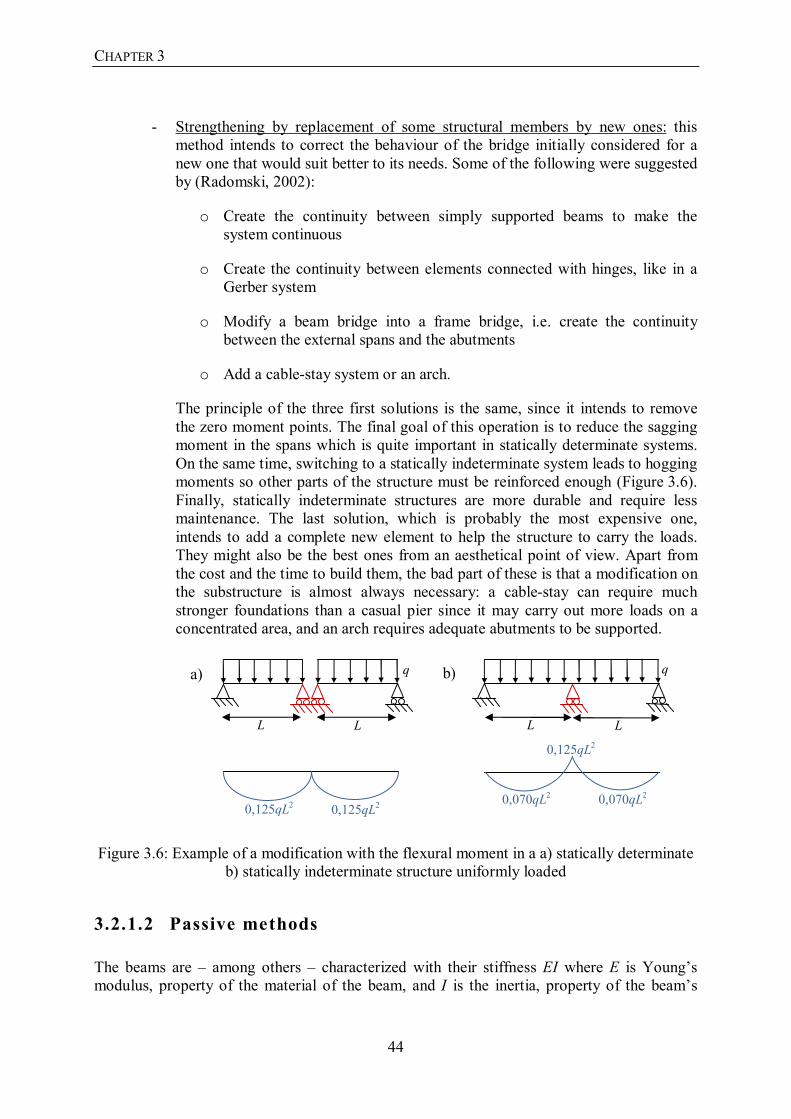
CHAPTER 3
44
- Strengthening by replacement of some structural members by new ones: this method intends to correct the behaviour of the bridge initially considered for a new one that would suit better to its needs. Some of the following were suggested by (Radomski, 2002):
o Create the continuity between simply supported beams to make the system continuous
o Create the continuity between elements connected with hinges, like in a Gerber system
o Modify a beam bridge into a frame bridge, i.e. create the continuity between the external spans and the abutments
o Add a cable-stay system or an arch.
The principle of the three first solutions is the same, since it intends to remove the zero moment points. The final goal of this operation is to reduce the sagging moment in the spans which is quite important in statically determinate systems. On the same time, switching to a statically indeterminate system leads to hogging moments so other parts of the structure must be reinforced enough (Figure 3.6). Finally, statically indeterminate structures are more durable and require less maintenance. The last solution, which is probably the most expensive one, intends to add a complete new element to help the structure to carry the loads. They might also be the best ones from an aesthetical point of view. Apart from the cost and the time to build them, the bad part of these is that a modification on the substructure is almost always necessary: a cable-stay can require much stronger foundations than a casual pier since it may carry out more loads on a concentrated area, and an arch requires adequate abutments to be supported.
Figure 3.6: Example of a modification with the flexural moment in a a) statically determinate b) statically indeterminate structure uniformly loaded
3.2.1.2 Passive methods
The beams are – among others – characterized with their stiffness EI where E is Young’s modulus, property of the material of the beam, and I is the inertia, property of the beam’s
0,125qL2
0,125qL2
0,070qL2 0,070qL2
a) b)
L L L L
0,125qL2
q q

3.2. REVIEW OF SOME COMMON METHODS TO STRENGTHEN A CONCRETE BRIDGE
45
geometry. The idea of passive methods is to increase either E or I or both E and I on the existing structures.
- Strengthening by enlargement of cross-sections with concrete: One can increase the stiffness by increasing the size of the flanges with a new layer of concrete either above, below, or above and below the existing beams sections. Even though the capacity of the beams cannot be tremendously increased, this solution still suits for reasonable needs of repair or increase of strength. In any case this methods leads to either a reduction of vertical clearance (i.e. space under the bridge for boats or vehicles) or an elevation of the level or the pavement if the layer is added above the beams. It should also be noted that it is much easier and safer to cast the new concrete layer above the existing beams than below since the formworks can be put in place and stand in an easier way. On the same time, traffic is disturbed. If the concrete layer is to be added below the lower flanges, solutions such as shotcrete should be considered. Casting concrete below an existing element usually costs more money and is less safe for workers. Depending on the needs and the location of the new layer, some reinforcements may be inserted in the new concrete in order to strengthen even more the structure and limit the future eventual cracks.
- Strengthening by external plating: this method consists of adding a steel plate or steel flat bars on the surface of the existing concrete. The surface of the existing concrete should be sound enough and not cracked so that the steel can be fixed to the concrete in a proper, stable, and durable way. This fixing is usually performed by bonding with the help of epoxy resin adhesives, or with additional prestressed bars. The steel can be applied either on the tensile part of concrete to increase the bending strength or on the web for increasing its shear strength. Once again, since the steel will be on the surface and not protected by concrete cover, an anti-corrosion painting should be applied on it and an eventual additional protection should also be considered to prevent the possible troubles it may experience.
Figure 3.7: Example of shear strengthening by external plating
- Strengthening by Carbon Fibre Reinforced Polymers (or CFRP) strips: this technique is rather modern and was only used in the last years. The principle itself is basically the same as strengthening with external plating, but CFRP materials have a much higher tensile strength (usually at least 1000 MPa) and fatigue resistance than steel plates. Their performance is thus intended to be more efficient, given that they are also lighter than steel, and don’t experience corrosion problems. On the other side, CFRP strips are not isotropic materials and carry the load on their longitudinal direction only, which might somewhat
Steel plate Prestressing bars and anchorages to hold the plates
Concrete beam

CHAPTER 3
46
reduce the possible applications. This method was used for example to strengthen the Alvik Bridge in Stockholm, which experienced unexpected cracks a few years after its inauguration. Figure 3.8 shows the CFRP strips fixed with epoxy on the web of the bridge, from inside.
Figure 3.8: CFRP strips on the web inside the Alvik Bridge11
3.2.2 Strengthening of concrete piers
Strengthening of piers is much easier on dry surfaces, i.e. either above the water level if a river passes below the bridge or either on a pier that does not stand on a water flow. If at least a part of the strengthening has to be performed in the water, some experienced divers should be required or some sheet pile walls should be bored around the piers and the water be pumped in order to work on a dry surface.
Two main methods are usually achieved to strengthen a pier (Radomski, 2002):
- Locally, a strengthening band made of reinforced concrete can be applied on the pier, especially where large cracks can be observed. This acts like a strengthening dressing. The band can be anchored to the existing pier with anchorage of at least 0,3 m depth.
- If a more important strengthening is required, a jacket made of reinforced concrete can be arranged around the existing pier, in order to increase its size and consequently its strength. Stronger concrete than the existing one can also be used.
For both of these methods, if existing cracks are noticed, they should be filled by injection of mortar, concrete, or any other material before to apply the band or the jacket. The first one is
11 Pierre FLINE, May 2010

3.3. DESIGN PROCESS
47
more adapted for small needs of increase of strength, on the other hand it is less aesthetical than the jacket.
Some other techniques might also be used, like for example steel plates of CFRP strips instead of reinforced concrete bands. Attentions should however be paid if the pier lays on water: steel should not be in direct contact with water for avoiding corrosion troubles.
3.2.3 Strengthening of foundations
Actions on piles are rather difficult to perform due to their location in the soil, and because they are in general clamped to a pier or an abutment. One can increase the load-carrying capacity of pile groups foundations by two means: by increasing the strength of the pile group itself (direct method), and/or by strengthening the soil supporting the piles (indirect method).
As a direct method, one can add more piles, or increase the size of the slab carrying the piles group in order to raise its contact area with the soil and consequently decrease the stresses applied on the soil to reach allowable ones.
Indirect methods can be to bore sheet pile walls in the vicinity of the existing piles in order to take up part of the loads they must carry. One can also strengthen the soil by injecting cement grouting in it, either through the base slab of the pile group by drilling holes in it, or externally though the soil itself. Cement grouting can be injected in the soil only below the piles, or it can also include the end bearing parts of the piles.
3.3 Design process
3.3.1 Standards used
The original bridge has two lanes. The goal of this thesis is to design a number of solutions to increase the width of the bridge to four lanes, while keeping the same widths for the sidewalks. The original design was performed according to the French old regulations: BA68 for reinforced concrete, IP1 for prestressed concrete, and the Part 61, title II of the “Cahier des Clauses Techniques Générales” for the acting loads. The design of the widening had to be done in accordance to the new codes into force, that are now the Eurocode2 for concrete structures, and Eurocode1 for acting loading. In particular the regulations used were:
- EN 1991-2 (Eurocode1-Part2): Actions on structures-Traffic loads on bridges
- EN 1992-1-1 (Eurocode2-Part1.1): Design of concrete structures-General rules and rules for buildings
- EN 1994-1-1 (Eurocode4-Part1.1): Design of composite steel and concrete structures-General rules and rules for buildings.
The Eurocode2-Part2 (Design of concrete structures-Concrete bridges, design and detailing rules) was not considered in this thesis. This part of the Eurocode is complementary to the Eurocode2-Part1.1 since it adds or removes some rules to be more specific to bridge

CHAPTER 3
48
structures. In particular, new considerations are made on the bridge stability, failure due to excessive deflection, and failure due to fatigue effect.
The design of composite structures was performed according to the textbook “Steel Concrete Composite Bridges” (Collin P., Johansson B., Sundquist H., 2008). The design is preliminary.
3.3.2 Assumed simplifications
Reference is made to the previously mentioned restrictions, in particular in Section 1.3, Section 2.3.4, and Section 2.4.3. The difference of shrinkage between old and new concrete was disregarded.
Piles were also considered only on a preliminary basis, based on the end-bearing capacity and on the rough values of soil friction given in the preliminary calculations of the original bridge. No exact value was provided concerning the friction strength of the soil.
3.3.3 Method followed
We limited the structural analysis to the deck and the piers only. The foundations under the piers were analyzed on a preliminary basis. On the deck, the beams were either verified or designed according to their most harmful section which is at midspan since they are all simply supported. Piers were verified or designed according to their smallest section, which is the one on the base for the original one for example.
Since a new code is to be considered, the original bridge had first to be verified with the Eurocode in order to detect some eventual weak parts of the structure under the new (and heavier) loading. Depending on the result, if the original structure was really too weak, a complete replacement of the bridge could have been considered (destruction of the original bridge and complete construction of the new one with four lanes). As described in Section 3.4, the original bridge could support the new loading in accordance to the Eurocode, within our scope of work.
The second step was to define and design different technical solutions to widen the bridge, as simple and as cheap as possible. They are presented in Section 3.5, and since all of them also required a modification of the piers, Section 3.6 also presents some technical solutions for the piers. Finally, after a few words in Section 3.7 about the consequences these modifications could imply on the piles, Section 3.8 discusses some other solutions that might have been interesting to consider.
Reference is made to the standards mentioned in Section 3.1.1 for the calculation details. At the Serviceability Limit State, only the stresses in the reinforcements and in the concrete were considered for the design, the deflection and the crack widths were disregarded for reasons of simplicity. All the calculations were performed with the help of the software MathCad V15.0 and some hyperstatic problems were solved with RDM6, a license free software of structural analysis. No slab elements were modelled but only beams (either for girders, piers, or cantilevers on the pier heads). Ordinary reinforcements on the prestressed beams were

3.3. DESIGN PROCESS
49
disregarded. The coefficients used to make the design combinations are presented in Table 3.1.
Loads γ ψ1 ψ2 ψ3
Permanent loads
Dead weights 1,35/1
Tendons 1,3/1
Shrinkage 1/0 Creep 1/0
Variable loads Temperature 1,5/0 0,6 0,6 0,5
Traffic 1,45/0 0,8 0,8 0 Pedestrians 1,45/0 0,8 0,8 0
Table 3.1: Combinations coefficients used in the calculations, according to the Eurocode
Creep effect was considered with the help of the creep coefficient, which can be estimated on Figure 3.9 found in Eurocode2. Since the concrete used in our bridge was of compressive strength 27 MPa, the class used to handle the creep was the closest one on the figure, i.e. C25/30. No information was provided concerning the cement class, so we assumed it was a normal one (class N). On the figure, h0 is the wet perimeter of the section (i.e. the perimeter in contact with the air) and φ(∞,t0) is the creep coefficient.
Figure 3.9: Diagrams to assess a creep coefficient under normal environmental conditions (outside) (Eurocode2, 2004)
The effective creep coefficient was defined as:
φeff=φ(∞,t0) SLS.Quasi-permanent
ULS
(3.1)
where MSLS.Quasi-permanent and MULS are the combinations of moments in a quasi-permanent state and at ULS respectively. The creep coefficient was used in the calculation of time-dependent prestressing losses. The effective creep coefficient was used for reducing the Young modulus at SLS.
The same assumption as for creep was made for shrinkage on concrete strength (we assumed a class C20/25, which was the closest from the theoretical compressive strength of 27 MPa). Both autogeneous and drying shrinkage were considered, and the relative humidity was assumed 80 %.
M M

CHAPTER 3
50
Figure 3.10: Table to assess the unrestrained drying shrinkage, part of the calculation process (Eurocode2, 2004)
Since a 3D analysis was not performed, the influence of the beams deflections on the loading was considered with the lane factor method (Sundquist, 2007). This method, rather simple, consists in slightly overestimating the loads on the beams depending on the distance between the beams themselves. The design loads are multiplied by a so-called lane factor, defined as:
f=c/3 (3.2)
where c is the distance between axes of the beams divided by 1 m.
The calculation of piers was performed with the method of the interaction diagrams. Piers have the particularity to support large normal loads compared to beams, and the normal and bending effects directly depend one on each other. The method of interaction diagram allows visualizing the influence of both parameters (normal effect and bending moment) on the same time in order to assess the capacity of a given pier. It should be added that piers are in general only considered at Ultimate Limit States since they are subject to important normal loading, and consequently they do not crack much (Nilson & Winter, 1991).
Figure 3.11 shows the structural analysis of a rectangular section of a pier in reinforced concrete with its external loading. Sketches a) and b) are statically equivalent since the normal load and the bending moment are exactly the same. Sketch c) shows the strain diagram of a cracked section of the pier and sketch d) shows the stresses diagram. In accordance with most of the standards, since the compressed height of concrete is not uniformly stressed, it is assumed that only 0,8 of this height is uniformly compressed.

3.3. DESIGN PROCESS
51
Figure 3.11: Section of a reinforced concrete pier and its external loading (adapted from Nilson & Winter, 1991)
Legend of Figure 3.11: P: normal loading e: eccentricity M: bending moment on the top of the pier h: section height b: section width d: effective width of the section (distance from the compressed edge of concrete to the
tensile reinforcements) d2: distance from the compressed edge of concrete to the compressed reinforcements x: distance from the compressed edge of concrete to the neutral axis εs: strain of tensile reinforcements εs2: strain of compressed reinforcements εcu: strain of compressed concrete fs: stress in tensile reinforcements fs2: stress in compressed reinforcements fcc: stress in concrete, assumed uniform along 0,8x As: area of tensile reinforcements As2: area of compressed reinforcements
The sum of forces and moments leads to the following equations:
P(x)=fcc(0,8xb)+As2fs2-Asfs (3.3)
M(x)=fcc(0,8xb)(2h - 0,8
2x )+As2fs2(
2h -d2)+Asfs(d-
2h ) (3.4)
To be exact, the area of concrete replaced by reinforcements (As and As2) should have to be deduced of the total area of concrete in these equations. This has been neglected for reasons of simplicity. Also, the sections of our piers are not exactly rectangular since the corners are rounded, but they were considered to be so for reasons of simplicity.
h 0,8x h h

CHAPTER 3
52
By varying the distance x between the compressed edge and the neutral axis, one can draw the so-called interaction diagram with the normal allowable loading on one axis and the bending one on the other axis. An example of such a diagram is shown on Figure 3.12. In general, piers are designed symmetrically and the tensile and compressed reinforcements have both the same area and same strength.
Figure 3.12: Example of an interaction diagram
The interaction curve represents the limit of which loading the section can support. Above this line, the loading is too important and a failure may occur if the safety margins are exceeded. The shape of this line is similar to a parabola that would have a negative coefficient applied to the second order variable. Two modes of failure can be distinguished: for a low normal loading but a too high eccentricity, or for a high normal loading and a low eccentricity. The first case corresponds to a tensile failure in the reinforcements, and the second one to a compression failure. The ideal limit between those two is the balanced failure, i.e. when both the tensile and compressive strengths are exceeded on the same time. Of course an optimal design should be close to the line of the interaction diagram, but it might also be reasonable to keep more safety margin and to foresee an eventual increase of loading during the life of the bridge (heavier trucks, widening of the bridge, modification of a lane for cars to make it for a tramway…).
Eccentricity e is defined as the ratio between the moment and the normal loading, as shown on sketches a) and b) on Figure 3.11. When there is no eccentricity this means there is no moment and we are in pure compression. When eccentricity if infinite, which is an ideal case, the bending moment is so high that the pier cannot even support a normal load (P is null, it is pure bending). Numerical computations for this case lead to a corresponding moment of:
Compression failure
Tensile failure
Balanced failure
P/MN
M/M
Nm
atan(e) e=∞
e=0
ΔP ΔM

3.3. DESIGN PROCESS
53
MPureBending=2
s s s2
cc
(A f A )2f b +Asfsd-As2fs2d2 (3.5)
And for symmetrical reinforcements, which is usually the case:
MPureBending=Asfs(d-d2) (3.6)
This allowable moment in pure bending does not depend on the concrete properties when the reinforcements are exactly symmetrical.
Buckling of piers was considered according to Euler’s formula:
PBuckling=2
2Buckling
π ×EI L
(3.7)
where the buckling length LBuckling depends on the pier length L:
For one free end and one clamped end (cantilever): LBuckling=L
For two simply supported ends: LBuckling=0,5L
For one simply supported end and one clamped end: LBuckling=0,7L
For one rotation prevented end and one clamped end: LBuckling=2L
The buckling was only considered around the longitudinal axis of the bridge since it is the only one where the piers should support some moments, due to torsion of the deck. There should in fact not be any moment around the transversal axis since the beams are simply supported. An approximation was made here since Euler’s formula considers that the stiffness EI is the same all along the pier, whereas it is not our case. We simplified assuming the pier has the stiffness of its base section (i.e. the smallest one) all along its length, in order to be on the safe side. In order to be more accurate, a model could be done with the help of a computer software.
The calculation of the foundations was performed on a preliminary basis, according to the rough data provided. Each single pile was assumed to have the following bearing capacity:
QPile=QLateral1+QLateral2+QEndBearing (3.8)
where QLateral1 and QLateral2 are the lateral resistances along 3D and (L-3D) of the length of the pile respectively, D is the pile diameter and L its length.
QLateral1=P.3D 1s2
(3.9)
QLateral2=P.(L-3D) 2s2
(3.10)
2fccb (Asfs-As2fs2)2
(LBuckling)2 π2.EI
s
s

CHAPTER 3
54
QEndBearing=Pl π×D4
(3.11)
P is the area around the pile for 1m length of the pile. The security coefficients are assumed to be included in the value of s1 and s2 (friction strengths). The lateral friction was supposed slightly lower along a length of 3D than along the rest of the pile.
Figure 3.13: Resistance of a single pile
The bearing capacity of a pile group with identical piles was considered according to the following formula provided by (Gervreau, 2000):
QPilesGroup=fGroup.NPiles
.QPile (3.12)
with: fGroup: efficiency coefficient NPiles: number of piles in the group QPile: bearing capacity of one single pile
The efficiency coefficient depends on the geometrical properties of the group:
fGroup=D m(n-1)+n(m-1)+ 2(m-1)(n-1)1-L π×m×n
(3.13)
with: D: diameter of the piles L: distance between two consecutive piles centres in a given row m: number of piles per row n: number of piles per column
QPile
s1 3D
QEndBearing
s2
D
L
.D2
L π.m.n D m(n-1)+n(m-1)+√2(m-1)(n-1)

3.4. CHECK OF THE ACTUAL BRIDGE
55
3.4 Check of the actual bridge
Figure 3.14 and Figure 3.15 respectively show a transversal cut of the actual bridge with the new traffic loading and with the distribution of the pedestrian loading to consider.
Figure 3.14: Traffic loading on the actual bridge (annotations in cm)
A1=300 kN A2=200 kN
p=2,5 kN/m2 p1=9 kN/m2
Figure 3.15: Pedestrian loading on the actual bridge (annotations in cm)
qSidewalk=5 kN/m2
The pedestrian loading was also assumed to be distributed on the location of the fences, which could correspond for example to a case with people sitting on the fences for any particular event (public show, intense strike…).
The non-weighted mid-span moments of each load are presented in Table 3.2.

CHAPTER 3
56
Central Beam Side Beam Permanent loads
Moment MCentralBeam/MNm MSideBeam/MNm Beam weight 3,44 3,44 Deck weight 0 0
Sidewalk weight 0 1,17 Surfacing 1,38 0,79
Tendons eccentricity -1,40 -1,20 Shrinkage 0 0
Temporary loads Moment MCentralBeam/MNm MSideBeam/MNm
Temperature 0 0 Traffic 7,63 4,54
Pedestrians 0 1,01
Table 3.2: Mid-span moments acting on the beams of the original bridge The line evaluating the beam weight comprises the effective sections of the beams, i.e. the part of the deck that can participate in the compressive strength of the beams. Since the effective beams widths are bigger than the width of the deck between the beams flanges, the moment due to the deck weight is set to zero.
Shrinkage and temperature effects are also set to zero since the beams are all simply supported. Indeed the beams can turn freely on their edges thus these effects do not give rise to any moment (Rüsch et al., 1982).
Only the side beams have to support the weight of the sidewalk and the pedestrian loads.
Finally, the moment due to tendons eccentricity in the central beam is more important than on the side beams whereas they are all identical. This is mainly due to the fact that the side beams are a bit more loaded than the central ones because of the sidewalks and pedestrians loads. This overloading increases the creep effect and thus the prestressing losses, reducing the final action of tendons.
The non-weighted loading acting on the pier is presented in Table 3.3.
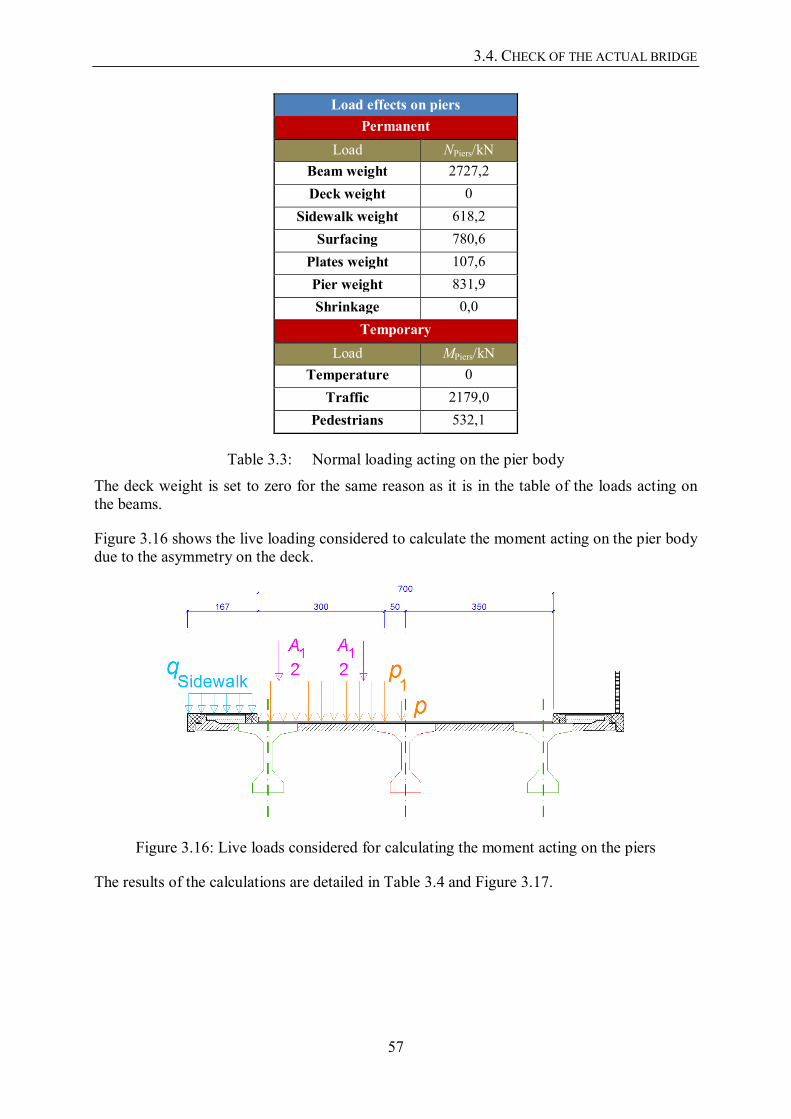
3.4. CHECK OF THE ACTUAL BRIDGE
57
Load effects on piers Permanent
Load NPiers/kN Beam weight 2727,2 Deck weight 0
Sidewalk weight 618,2 Surfacing 780,6
Plates weight 107,6 Pier weight 831,9 Shrinkage 0,0
Temporary Load MPiers/kN
Temperature 0 Traffic 2179,0
Pedestrians 532,1
Table 3.3: Normal loading acting on the pier body
The deck weight is set to zero for the same reason as it is in the table of the loads acting on the beams.
Figure 3.16 shows the live loading considered to calculate the moment acting on the pier body due to the asymmetry on the deck.
Figure 3.16: Live loads considered for calculating the moment acting on the piers
The results of the calculations are detailed in Table 3.4 and Figure 3.17.

CHAPTER 3
58
Capacity / Eurocode limit Loading OK?
BEAMS
ULS MCentralBeam/MNm 16,5 16,2 OK
MSideBeam/MNm 13,8 OK
SLS - concrete σcc.CentralBeam/MPa 12,2 9,4 OK
σcc.SideBeam/MPa 10,8 OK
SLS - reinforcements σst.CentralBeam/MPa 978,3 531,1 OK
σst.SideBeam/MPa 391,1 OK
PIERS - Cantilevers ULS MCantilevers/MNm 7,9 2,3 OK
SLS - concrete MCantilevers/MNm 7,2 1,4 OK
SLS - reinforcements MCantilevers/MNm 1,9 1,6 OK
PIERS - Body ULS Interaction diagram Cf. Figure 3.17 OK
FOUNDATIONS ULS NUnderPiers/MN 19,3 11,3 OK
Table 3.4: Results of the calculation of the original structure with actual standards
For each element, the loading is lower than the capacity, so there is no risk for the structure to collapse or to experience any functional or aesthetical trouble. The verification at SLS was made regarding the stresses for the beams and regarding the moments for the cantilevers. The reason for this is that it was simpler when designing the technical solutions to compare moments than stresses with the structural analysis software RDM6.
A remark should also be made concerning piers cantilevers where the allowable characteristic moment to satisfy the stresses in the reinforcements is much lower (1,9 MNm) than the other moments (7,9 MNm at ULS and 7,2 MNm at SLS quasi-permanent). This is the consequence of a high distance between the location of the neutral axis and the location of the reinforcements that are closest to the upper edge of the cantilevers (about 1,1 m for a whole height of the beam of 1,40 m). One could wonder what is the reason of this high distance, but reinforcements are often necessary close to edges for a number of reasons, e.g. to hold the transversal reinforcements, to limit the torsion effect, or even to limit concrete cracking.

3.5. WIDENING OF THE DECK WITH EXTRA BEAMS
59
Figure 3.17: Interaction diagram for the base and top sections of the original piers with the new loading
Acting loads on the pier sections:
Top section: NTopSection=9,5 MN MTopSection=5,6 MNm (3.14)
Base section: NBaseSection=10,6 MN MBaseSection=5,9 MNm (3.15)
The two points on Figure 3.17 are respectively below the interaction curves of their corresponding section, which means that the pier can support the loading on the two sections. It also clearly shows that even though the loading is not exactly the same (but still very close) on the top and on the base sections of the piers, the designing section is the base one since its amplitude is much lower. In the design of the technical solutions to widen the bridge we will thus only focus on the interaction diagram of the base sections. Even if one can imagine that the loading of the top section has a smaller normal loading that could bring it up outside and on the left side of its interaction curve, the margin is still very big between the two curves to be safe enough.
3.5 Widening of the deck with extra beams
When analyzing a modified structure the next step should be to investigate the first elements that will support the new loading, i.e. the deck first and the piers after. In the new design of the deck, the sidewalks remain the same size as originally. The two new lanes are designed with the same width as the existing ones, i.e. 3,5 m each. A solution can be to add two extra beams on both sides of the transversal section, their distance from the existing side beams should then be 3,50 m from axis to axis (instead of 3,26 m from axis to axis between the existing side beams and the central beams). Figure 3.18 shows for example a sketch with two extra beams with the same shapes as the existing ones.
N/MN
M/M
Nm

CHAPTER 3
60
Figure 3.18: Principle of adding extra beams on the section
One can wonder whether this extra deck can support the loading, especially since the new transversal span is higher than the original one (3,50 m compared to 3,26 m). This is a rather complicated question to answer since the deck would need to be analyzed in two dimensions, i.e. as a slab, and more efficient software would be required. A quick calculation can however be made assuming the deck is 1meter width and modelling it as a transversal beam. Analysis at ULS gave the following result for allowable and acting moments:
MULS.Allowable=289,0 kNm (sagging and hogging) (3.16)
MULS.Sagging=131,4 kNm MULS.Hogging=154,9 kNm (3.17)
Thus the actual thickness of the deck (18 cm) does not seem to be such a problem for its structural stability. Verification at SLS could not be performed since the calculation of the reduced inertia is not directly proportional to the width of a beam. Consequently the simplification of modelling the beam as 1m width beams does not stand here.
Two models have been investigated: one with extra prestressed beams, and another one with extra steel beams and a concrete deck (composite design). These models are discussed in the following sections.
3.5.1 Solution DA: extra prestressed beams
This solution can seem to be the most natural one since the existing beams are already made of prestressed concrete. The design was made with beams of same dimensions, same concrete, same reinforcements and same initial prestressing as the existing beams. Figure 3.19 and Figure 3.20 show the section with the traffic and pedestrian loadings.
sroad=14 m=4x3,5 m
sextra-side=3,5 m
Extra beams
Extra deck
sside-central=3,26 m sextra-side=3,5 m sside-central=3,26 m

3.5. WIDENING OF THE DECK WITH EXTRA BEAMS
61
Figure 3.19: Traffic loading on the enlarged bridge with solution DA (annotations in cm)
A1=300 kN A2=200 kN A3=100 kN
p=2,5 kN/m2 p1=9 kN/m2
Figure 3.20: Pedestrian loading on the enlarged bridge with solution DA (annotations in cm)
qSidewalk=5 kN/m2
The non-weighted mid-span moments of each load are presented in Table 3.5.
Central Beam Side Beam Extra Beam Permanent loads
Moment MCentralBeam/MNm MSideBeam/MNm MExtraBeam/MNmBeam weight 3,44 3,50 3,51 Deck weight 0 0,01 0,01
Sidewalk weight 0 0 1,14 Surfacing 1,38 1,43 0,84
Tendons eccentricity -1,60 -1,59 -1,50 Shrinkage 0 0 0
Temporary loads Moment MCentralBeam/MNm MSideBeam/MNm MExtraBeam/MNm
Temperature 0 0 0 Traffic 2,62 8,18 5,18
Pedestrians 0 0 1,01
Table 3.5: Mid-span moments acting on the beams of the enlarged bridge with solution DA

CHAPTER 3
62
Similar remarks can be made compared to the results of the analysis on the original bridge. This time the deck weight is not systematically set equal to zero since the length of the extra deck is longer than the effective widths of the beams. Most of the load effects on the central and side beams are comparable to those on the original central beam, and the loading on the extra beams is comparable with the one on the original side beams. An exception can however be made concerning the traffic loading on the central beam which is much lower on the enlarged bridge than originally (2,62 MNm compared to 7,63 MNm), since traffic loading is much more important on external lanes than on internal ones. One can also notice that the weight of the sidewalk is slightly lower than the original one. The reason for this is that the effective width of the extra beams is a bit more important than the one of the original side beams, leading to a reduction of the “pure” sidewalk weight. Anyhow this does not change the results since they are all dead weights combined with the same coefficients in the load combinations. Finally, the most loaded beams are the side ones.
The results of the calculations are detailed in Table 3.6.
Capacity/Eurocode limit Loading OK?
BEAMS
ULS MCentralBeam/MNm
16,5 8,7 OK
MSideBeam/MNm 16,9 NOT OK MExtraBeam/MNm 14,6 OK
SLS - concrete σcc.CentralBeam/MPa
12,2 8,6 OK
σcc.SideBeam/MPa 9,2 OK σcc.ExtraBeam/MPa 10,4 OK
SLS - reinforcements σst.CentralBeam/MPa
978,3 111,7 OK
σst.SideBeam/MPa 559,1 OK σst.ExtraBeam/MPa 409,2 OK
Table 3.6: Results of the calculation of the deck for the enlarged bridge with solution DA Central and extra beams do not experience any problem but the side beams do not fulfil the requirements at ULS. They need to be strengthened.
3.5.1.1 Strengthening of the side beams
A number of solutions could have been considered to increase the capacity of the side beams. Adding a concrete layer on the top of the beam to increase the compressive capacity would not be a very good option since the surfacing would have to be removed, and the level of the road would have to be slightly lifted on the whole bridge to keep it flat. This option would also create extra dead weight, and the bridge should have to be analyzed once again.
Some suitable and easy solutions could be the strengthening of the beams with external plating, CFRP strips, or external prestressing. The external prestressing method has been kept since it has been largely used over the last years and is a quite known method. Also, the bridge is rather in the periphery of the city, so there are not many constraints about the aesthetics of the structure. External prestressing design is in principle ruled by the XP ENV-
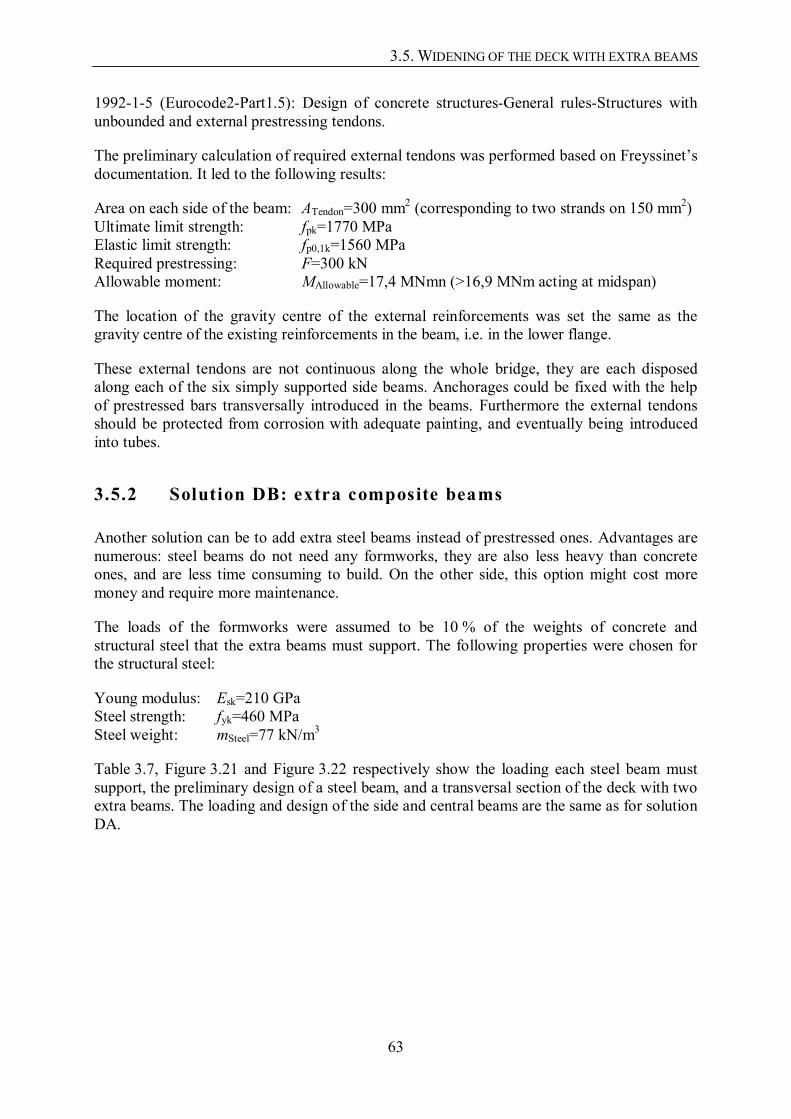
3.5. WIDENING OF THE DECK WITH EXTRA BEAMS
63
1992-1-5 (Eurocode2-Part1.5): Design of concrete structures-General rules-Structures with unbounded and external prestressing tendons.
The preliminary calculation of required external tendons was performed based on Freyssinet’s documentation. It led to the following results:
Area on each side of the beam: ATendon=300 mm2 (corresponding to two strands on 150 mm2) Ultimate limit strength: fpk=1770 MPa Elastic limit strength: fp0,1k=1560 MPa Required prestressing: F=300 kN Allowable moment: MAllowable=17,4 MNmn (>16,9 MNm acting at midspan)
The location of the gravity centre of the external reinforcements was set the same as the gravity centre of the existing reinforcements in the beam, i.e. in the lower flange.
These external tendons are not continuous along the whole bridge, they are each disposed along each of the six simply supported side beams. Anchorages could be fixed with the help of prestressed bars transversally introduced in the beams. Furthermore the external tendons should be protected from corrosion with adequate painting, and eventually being introduced into tubes.
3.5.2 Solution DB: extra composite beams
Another solution can be to add extra steel beams instead of prestressed ones. Advantages are numerous: steel beams do not need any formworks, they are also less heavy than concrete ones, and are less time consuming to build. On the other side, this option might cost more money and require more maintenance.
The loads of the formworks were assumed to be 10 % of the weights of concrete and structural steel that the extra beams must support. The following properties were chosen for the structural steel:
Young modulus: Esk=210 GPa Steel strength: fyk=460 MPa Steel weight: mSteel=77 kN/m3
Table 3.7, Figure 3.21 and Figure 3.22 respectively show the loading each steel beam must support, the preliminary design of a steel beam, and a transversal section of the deck with two extra beams. The loading and design of the side and central beams are the same as for solution DA.

CHAPTER 3
64
Extra Beam Permanent loads
Action (moment/shear load) MExtraBeam/MNm TExtraBeam/kN Reinforced concrete weight 1,77 228,37
Steel weight 0,48 62,18 Sidewalk weight 1,14 146,42
Surfacing 0,84 108,17 Shrinkage 0 0
Temporary loads Action (moment/shear load) MExtraBeam/MNm TExtraBeam/kN
Temperature 0 0 Traffic 5,18 664,85
People sidewalk 1,01 129,68
Table 3.7: Loading on each steel beam
Figure 3.21: Cross section of an extra steel beam (annotations in cm)
Figure 3.22: Cross section of the deck with two extra steel beams (annotations in cm)
It should be mentioned that the web of the steel section seems somewhat slender. The structural capacity of the section should be checked regarding buckling, but also in some particular cases like just after the concreting stage when the weight of concrete is applied but there is not yet connection between the steel beam and the concrete, and also because the effective width of concrete still does not have its final stiffness. The load case in the long term regarding creep effect should also be considered.
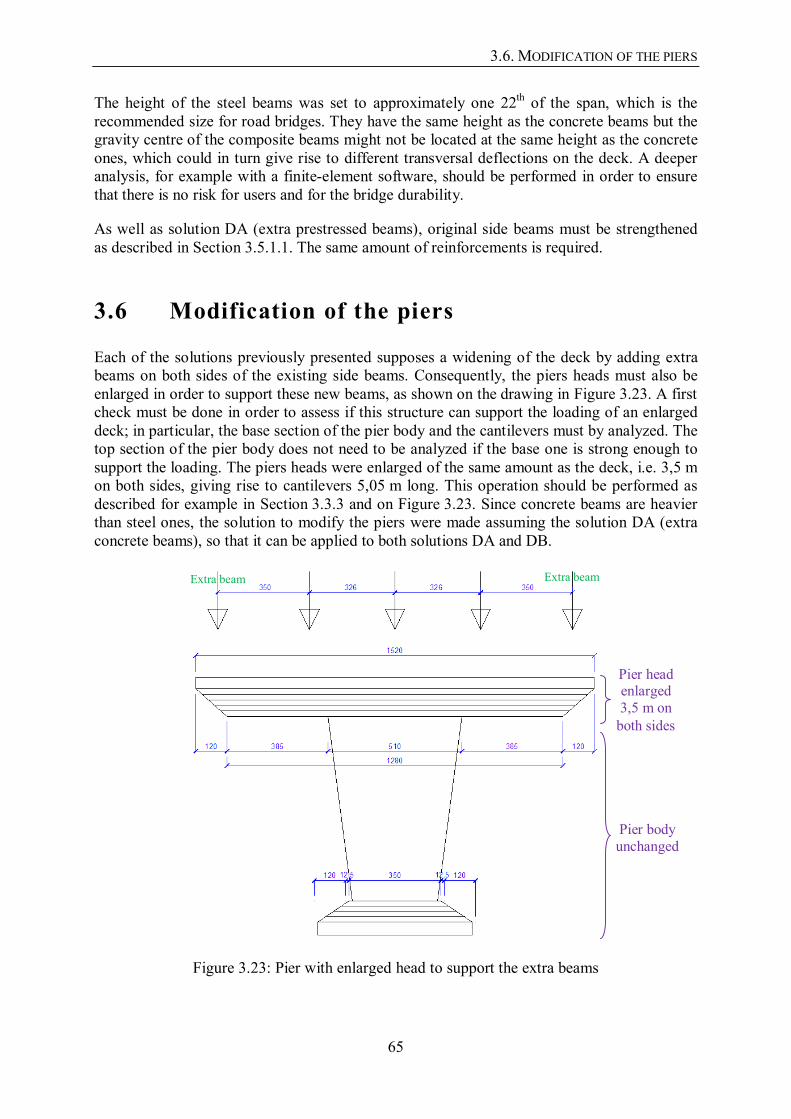
3.6. MODIFICATION OF THE PIERS
65
The height of the steel beams was set to approximately one 22th of the span, which is the recommended size for road bridges. They have the same height as the concrete beams but the gravity centre of the composite beams might not be located at the same height as the concrete ones, which could in turn give rise to different transversal deflections on the deck. A deeper analysis, for example with a finite-element software, should be performed in order to ensure that there is no risk for users and for the bridge durability.
As well as solution DA (extra prestressed beams), original side beams must be strengthened as described in Section 3.5.1.1. The same amount of reinforcements is required.
3.6 Modification of the piers
Each of the solutions previously presented supposes a widening of the deck by adding extra beams on both sides of the existing side beams. Consequently, the piers heads must also be enlarged in order to support these new beams, as shown on the drawing in Figure 3.23. A first check must be done in order to assess if this structure can support the loading of an enlarged deck; in particular, the base section of the pier body and the cantilevers must by analyzed. The top section of the pier body does not need to be analyzed if the base one is strong enough to support the loading. The piers heads were enlarged of the same amount as the deck, i.e. 3,5 m on both sides, giving rise to cantilevers 5,05 m long. This operation should be performed as described for example in Section 3.3.3 and on Figure 3.23. Since concrete beams are heavier than steel ones, the solution to modify the piers were made assuming the solution DA (extra concrete beams), so that it can be applied to both solutions DA and DB.
Figure 3.23: Pier with enlarged head to support the extra beams
Extra beam Extra beam
Pier body unchanged
Pier head enlarged 3,5 m on
both sides

CHAPTER 3
66
The non-weighted loading acting on the pier base is presented in Table 3.8.
Load effects on piers Permanent
Load NPiers/kN
Beam weight 4619,0
Deck weight 14,8
Sidewalk weight 600,8
Surfacing 1561,0
Plates weight 179,4
Pier weight 1168,0
Shrinkage 0
Temporary
Load NPiers/kN
Temperature 0
Traffic 2936,0
Pedestrians 532,1
Table 3.8: Normal loading acting on the pier body for the enlarged deck
Since piers are not restrained on their top, there are no shrinkage and temperature effects (piers are statically determinate).
Figure 3.24 shows the live loading considered to calculate the moment acting on the pier body due to the asymmetry on the deck.
Figure 3.24: Live loads considered for calculating the moment acting on the piers for the enlarged bridge with solutions PA, PB and PC
All the live loads are kept on one side and removed on the other side. Only half of the concentrated load A3 was kept. This would by no means represent a car tire on the road since they are designed with two tires per lane, but one can still imagine a motorbike for example. This is a conservative measure.
The calculated buckling load, assuming the pier would have the same section as the one of the base all along its height, is:

3.6. MODIFICATION OF THE PIERS
67
NBuckling.OriginalPier=25,781 MN (3.18)
The results of the calculations are detailed in Table 3.9 and Figure 3.25.
Capacity / Eurocode limit Loading OK?
Enlarged piers
with no solution
Can
tilev
er
Sagg
ing
ULS MCantilevers/MNm 7,9 22,15 NOT OK
SLS – concrete MCantilevers/MNm 7,2 14,3 NOT OK
SLS - reinforcements MCantilevers/MNm 1,9 15,8 NOT OK
Ori
gina
l pi
er
body
ULS Interaction diagram Cf. Figure 3.25 OK
Table 3.9: Results of the calculation for an enlarged bridge with no strengthening solution
Figure 3.25: Interaction diagram for the base section of the piers body for an enlarged bridge with no solution
Acting loads on the base:
NBaseSection=15,9 MN MBaseSection=11,9 MNm (3.19)
Figure 3.25 clearly shows that the base section is still adequate to support the new loading. However the cantilevers are definitely not strong enough to support the new loading, with their given spans, since they do not fulfil either the Ultimate Limit State or the Serviceability Limit State criteria. There is a high risk that the section closest to the piers bodies will fail, either by concrete crushing or by reinforcements failure.
N/MN
M/M
Nm

CHAPTER 3
68
Later on will be presented three technical solutions, namely solutions PA, PB and PC, to make the cantilevers of the piers heads able to support de new loading with their given spans. Attention was paid on the simplicity of the solutions, to build and design them. Some more complicated structures could have been imagined, as discussed in Section 3.8.
3.6.1 Solution PA: extra cantilever piers (clamped-free)
The main reason why the cantilever beams are too weak is their span which is too long. Solution PA suggests reducing this span with the help of extra cantilever columns under each cantilever beam, with a clamping at the base and a free end at the top of the new columns (leading to a simple support for the cantilever beams). The consequence is naturally a reduction of the acting sagging moment on the cantilever beams, but also the appearance of a hogging moment above these new supports that the beams must be able to carry.
Figure 3.26: Model used for solution PA
In addition to add a new support, these columns must be able to carry themselves the corresponding normal loading and moment effect, and they should not buckle. There is no need for these new piers to have a different section on the top and on the base since they should be designed only regarding the two criteria of the acting normal load and bending moment. This was not the case of the existing piers bodies whose base sections were also designed on those two criteria, but the top sections were larger in order to reduce the span of the cantilevers heads. In our actual case the optimal location of the new piers was found 2,75 m from the existing piers bodies, and the corresponding required thickness is 80 cm (for a depth of 65 cm, the same as the existing piers), not to support the loading but to resist the buckling. The new piers must be made of reinforced concrete and not in steel since their base lay in the river, and should be protected from corrosion. The buckling load capacity of the new piers is:
NBuckling.NewPier.PA=5,948 MN (3.20)
The base slab of the existing piers must also be enlarged in order to support the three piers. In order to avoid differential settlements that might occur between the piers, it is preferable to keep one common base slab instead of having three different ones.
Figure 3.27 shows a drawing of the solution, and Table 3.10 shows the results of the acting loads and their limits according to the standards. Figure 3.28 and Figure 3.29 show the
Cantilever beam with added support New pier clamped at the base and free at the top
F
F

3.6. MODIFICATION OF THE PIERS
69
interaction diagrams of the base sections for the original piers and for the new piers respectively.
Figure 3.27: Drawing of solution PA for piers (annotations in cm)
Capacity / Eurocode limit Loading OK?
Enlarged piers
with Solution PA
Can
tilev
er
Sagg
ing
ULS MCantilevers/MNm 7,9 2,5 OK
SLS – concrete MCantilevers/MNm 7,2 1,6 OK
SLS - reinforcements MCantilevers/MNm 1,9 1,7 OK
Can
tilev
er
Hog
ging
ULS MCantilevers/MNm 7,4 1,24 OK
SLS – concrete MCantilevers/MNm 7,0 0,78 OK
SLS - reinforcements MCantilevers/MNm 1,0 0,88 OK
Ori
gina
l pi
er
body
ULS Interaction diagram Cf. Figure 3.28 OK
New
pi
ers ULS Interaction diagram Cf. Figure 3.29 OK
Table 3.10: Results of the calculation for an enlarged bridge with solution PA

CHAPTER 3
70
Figure 3.28: Interaction diagram of the original pier with solution PA
Acting loading on the original piers:
NBaseSection=7,568 MN MBaseSection=7,422 MNm (3.21)
As expected, the original piers support a loading less important than without the new piers. There should not be any risk for them to fail.
Figure 3.29: Interaction diagram of the new piers with solution PA
Acting loading on the new piers with solution PA:
NBaseSection=5,706 MN MBaseSection=0,163 MNm (3.22)
N/MN
M/M
Nm
N/MN
M/M
Nm

3.6. MODIFICATION OF THE PIERS
71
Figure 3.29 shows a selection of different widths b for the news piers. The smallest one allowable would be 60 cm. This width was unfortunately too low to prevent buckling of the column, the designing width had thus been chosen to 80 cm.
It should be noted that the original structure is isostatic whereas the new one is hyperstatic with the new supports between the beams and the new piers. Apart from their own dead weights, the new piers do not carry any other loads until their connection with the beams is made. Since they should experience deformations, even small, due to their own loading, they might take up a more important loading than what is expected. For this reason, when building the new structure, the exact force applied on the top of the new piers should be measured for example with jacks in order to ensure that the applied loading is still acceptable compared to the expected one.
Finally, since the connection between the new piers and the beams is intended to turn around two directions (longitudinally and transversally), and since it was modelled as a free end, the recommended bearings would be those made of elastomeric layers or another synthetic material.
3.6.2 Solution PB: extra clamped-simply supported piers
Solution PB is very similar to solution PA, and the new piers are also made of reinforced concrete and not in steel since their base will stand in the river. The idea here was to replace the free connection of PA by a simply supported one in order to let the new piers take up more of the loading. This connection can be made simply with reinforcements introduced in both elements (new pier and beam) when casting the concrete. The simplest way to realize it seems to introduce them first when casting the concrete of the new piers, and then let the other part of the reinforcements in the air until the beams are casted on them. A sufficient amount of reinforcements should be planned in order to ensure the connection, otherwise the model would not be designed in an adequate way. We could point out that the stiffness of the beams can help to prevent the rotation of the top of the new piers. However this depend on the properties of the beams, and they cannot completely prevent the rotation. The most adequate (because safest) model for the top of the new piers is thus the simply supported connection.
Figure 3.30: Model used for solution PB
If this solution might take more time than PA one to build, it is however more convenient for maintenance purposes since there is no element between the new piers and the beams to take care about in order to keep an efficient connection. It should also be noted that it would not be
Cantilever beam with added pier New pier clamped at the base and simply supported at the top
F Full connection made with steel

CHAPTER 3
72
possible to measure the real loading of the beams on the piers to check the validity of the expected loading on the piers, since the concrete of the beams is casted directly on the top of the new piers in order to be anchored with the steel of the column.
The optimal design found was to locate these new piers at the same location as in solution PA, i.e. 2,75 m away from the existing piers bodies. Their necessary thickness was also found the same as in solution PA, i.e. 80 cm, still for the same width as the original piers (65 cm). It should however be remarked that this time the designing criteria was not the buckling load but the interaction diagram. The buckling load capacity of these new piers is:
NBuckling.NewPier.PB=46,292 MN (3.23)
Figure 3.31 shows a drawing of solution PB.
Figure 3.31: Drawing of solution PB for piers (annotations in cm)
As for solution PA, the base slab of the original piers has been enlarged to support the two new piers on the same slab in order to considerably limit the differential settlements. The transversal shape of the piers still remains the same as originally, as shown on the right part of the drawing. Table 3.11 shows the results of the acting loads and their limits according to the standards. Figure 3.32 and Figure 3.33 show the interaction diagrams of the base sections for the original piers and for the new piers respectively.

3.6. MODIFICATION OF THE PIERS
73
Capacity / Eurocode limit Loading OK?
Enlarged piers
with Solution PB
Cantilever Sagging
ULS MCantilevers/MNm 7,9 2,39 OK
SLS – concrete MCantilevers/MNm 7,2 1,55 OK
SLS – reinforcements MCantilevers/MNm 1,9 1,7 OK
Cantilever Hogging
ULS MCantilevers/MNm 7,4 1,12 OK
SLS – concrete MCantilevers/MNm 7,0 0,704 OK
SLS - reinforcements MCantilevers/MNm 1,0 0,797 OK
Original pier body
ULS Interaction diagram Cf. Figure 3.32 OK
New piers ULS Interaction diagram Cf. Figure 3.33 OK
Table 3.11: Results of the calculation for an enlarged bridge with solution PB
Figure 3.32: Interaction diagram of the original pier with solution PB
Acting loading on the original piers:
NBaseSection=7,844 MN MBaseSection=7,873 MNm (3.24)
The new loading supported by the original piers is very close to the one on solution PA (7,568 MN and 7,744 MNm for the normal loading and bending effect respectively). This is not a hazard since the configurations are quite similar: both piers support the beams at the same location. The connection between the piers heads and the new piers does not seem to
N/MN
M/M
Nm

CHAPTER 3
74
make an important difference in our results, but we must remember that it is not the same criterion that designed the piers (buckling load for PA, interaction diagram for PB).
Figure 3.33: Interaction diagram of the new piers with solution PB
Acting loading on the new piers with solution PB:
NBaseSection=5,546 MN MBaseSection=0,681 MNm (3.25)
As previously mentioned, the necessary width for the new piers twice clamped is 80 cm to support the normal loading and the bending effect. For this given width, there is no risk of buckling.
Solutions PA and PB are quite similar in the design, but also in the solicitations results. The best of these two should be rather assessed depending on whether one prefers the simpler to build (solution PA) or to maintain (solution PB).
3.6.3 Solution PC: widening of the existing pier
The final goal of solution PC is the same as solutions PA and PB: reduce the span of the cantilevers in order to reduce the load they must support. The method used here was, instead of adding new supports, to increase the width of the existing central piers. Figure 3.34 shows the allowable moments for the different limit states and the acting ones depending on the span of the cantilevers, assuming the span supports only its dead weight and the load transmitted by one extra beam (cf. sketch on Figure 3.35). Indeed, given the capacity of the beams, it would not be conceivable to support one extra beam and one side beam, the moment effect would definitively be too important because of both the increased loading and span. Figure 3.34 clearly shows that the designing criterion is the Serviceability Limit State characteristic, in other words the stress in the steel reinforcements. Allowable moments are those given in Table 3.10 (all sagging moments).
N/MN
M/M
Nm
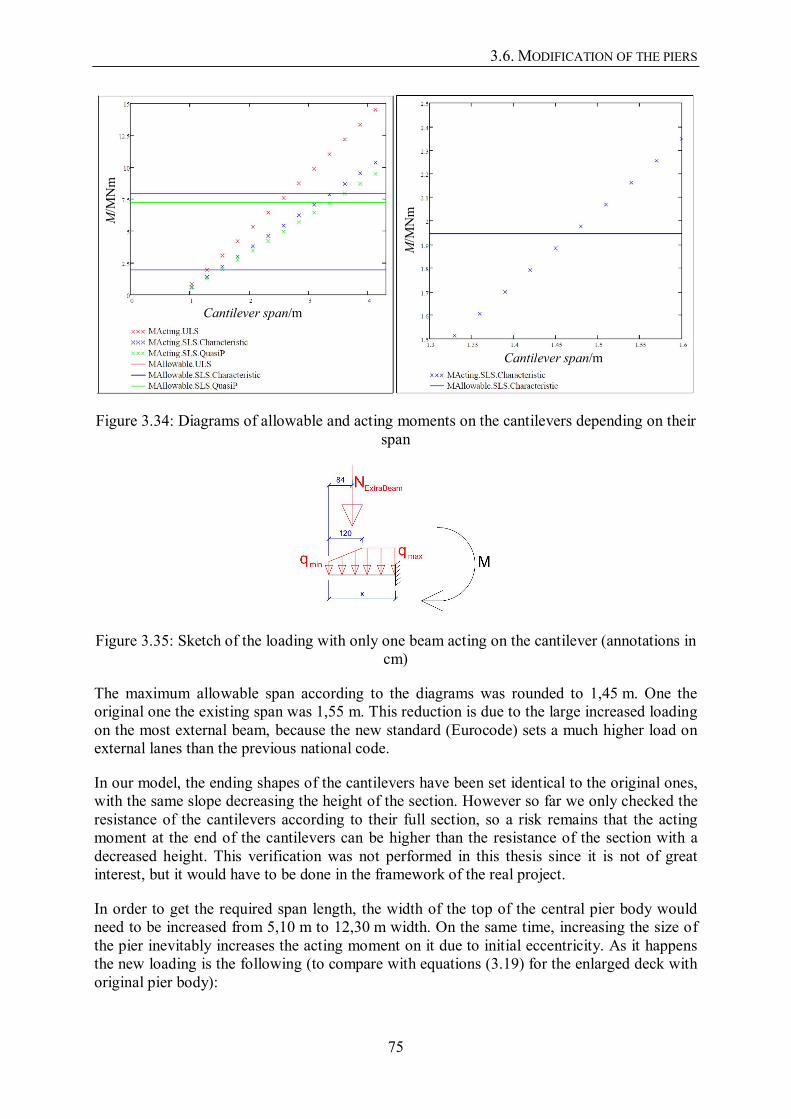
3.6. MODIFICATION OF THE PIERS
75
Figure 3.34: Diagrams of allowable and acting moments on the cantilevers depending on their span
Figure 3.35: Sketch of the loading with only one beam acting on the cantilever (annotations in cm)
The maximum allowable span according to the diagrams was rounded to 1,45 m. One the original one the existing span was 1,55 m. This reduction is due to the large increased loading on the most external beam, because the new standard (Eurocode) sets a much higher load on external lanes than the previous national code.
In our model, the ending shapes of the cantilevers have been set identical to the original ones, with the same slope decreasing the height of the section. However so far we only checked the resistance of the cantilevers according to their full section, so a risk remains that the acting moment at the end of the cantilevers can be higher than the resistance of the section with a decreased height. This verification was not performed in this thesis since it is not of great interest, but it would have to be done in the framework of the real project.
In order to get the required span length, the width of the top of the central pier body would need to be increased from 5,10 m to 12,30 m width. On the same time, increasing the size of the pier inevitably increases the acting moment on it due to initial eccentricity. As it happens the new loading is the following (to compare with equations (3.19) for the enlarged deck with original pier body):
M/M
Nm
M/M
Nm
Cantilever span/m
Cantilever span/m

CHAPTER 3
76
NBaseSection=16,6 MN MBaseSection=16,3 MNm (3.26)
As this level of loading the base section is not anymore strong enough. It must be enlarged to the minimum rounded value of 350 cm, as indicated on the interaction diagram in Figure 3.36.
Figure 3.36: Interaction diagram for the base section of the piers body for an enlarged bridge
The base slab of the pier must also be enlarged to support the new given loading. It might also be necessary to widen it more than only to support the new width of the section, since more piles might be necessary. This topic is discussed in Section 3.7. In the mean time, Figure 3.37 shows a drawing of solution PC with the base slab enlarged only to fit with the pier body (influence of the need of piles being disregarded).
Figure 3.37: Drawing of solution PC for piers (annotations in cm)
N/MN
M/M
Nm

3.7. MODIFICATION OF THE PILES
77
3.7 Modification of the piles
Before to start, it should be one more time specified that our data about piles are very rough, and consequently these calculations are very preliminary. Most of the interest in this section is the eventual modifications one should realise on the piles groups: whether it is or not necessary to add piles, and if yes, how much and how. We assumed that the actual strength of the piles is the same as the original one. This is a reasonable assumption since piles strength usually (but not always) increases over time due to the horizontal pressure of earth. However, some tests should be performed to ensure it and increase the accuracy of the study.
The modifications on the piles mainly depend on the loads transmitted by the piers. For solutions PA and PB, the loads are distributed through three piers and a base slab. For solution PC, which only contains one pier, the loads are however much more concentrated. If we only consider the normal loading transmitted to the piles and the one they can support, the results are shown on Table 3.37.
Capacity Loading OK?
FOUNDATIONS Solution PA
ULS NUnderPiers/MN 19,3 17,7 OK
Solution PB OK
Solution PC 17,9 OK
Figure 3.38: Results of the calculations of the original piles with the enlarged bridge, only considering the normal loading
The actual piles can support the new normal loadings, at least as long as our previous assumptions are valid. However we should consider that the moments on the enlarged structure are more important than on the original one (5,9 MNm originally, 7,422 MNm for PA, 7,873 MNm for PB and 16,3 MNm for PC at the base of the central piers), so piles should also be checked to prevent overturning of the base slab. This is valid for PA, PB and PC as well since all of them give rise to an increased moment due to widening.
Some extra piles could prevent overturning effects. In particular on solutions PA and PB, since the size of the base slab should be enlarged to support the new piers, one can add extra piles closer to the edges of the base slab than the existing ones that are all concentrated on its centre. On solution PC however, the base slab does not need to be that much enlarged for supporting the pier, but if more piles are necessary, then this widening would have to be considered. Figure 3.39 shows a drawing of possible extra piles added for solutions PA and PB. Their number and locations are arbitrary.

CHAPTER 3
78
Figure 3.39: Example of drawing of extra piles for solution PA
In any case, more accurate geotechnical data are required and a deeper study should be performed to get valuable results.
3.8 Discussion about other possible solutions
The solutions presented on the previous sections are only a few of all the possible ones. We can also imagine some other designs, more complicated and probably more expensive, but that could have better aesthetics, better durability and/or better respect to the environment. The amount of solutions presented in the following sections is not exhaustive.
3.8.1 Add a prestressing bar in the cantilevers
The enlarged piers heads, without extra piers or enlarged central piers, have too large cantilevers to be able to stand (cf. Section 3.6). We could imagine installing external prestressing tendons along those piers heads in order to strengthen them, as indicated on Figure 3.40.
Existing piles Extra pile Extra pile

3.8. DISCUSSION ABOUT OTHER POSSIBLE SOLUTIONS
79
Figure 3.40: External tendon to strengthen the enlarged piers heads
The advantages of such a solution would be to operate in a much quicker way than solutions PA, PB and PC. It would also probably be cheaper since much less material would be used. The environmental impact (cf. Section 4.3) would also be lower, for this same reason of less materials consumption.
However, this solution is not possible with the actual techniques and materials. Indeed, when widening the piers heads, the moments to be supported change from 5,9 MNm to 11,9 MNm at ULS, which is much higher (almost twice the loading). Even with two extra steel beam on both sides of the cantilevers to reduce the acting moment on the concrete ones, they would be too much oversized leading to high dead weighs, bad aesthetics, and probably high risks of buckling of the web or of the compression flange.
3.8.2 Add a cable stay system
Another solution could be to install a cable stay system, in order to support the enlarged deck. This may avoid to widen the existing central piers or to build new ones. The simplest design could be to build one pylon above each existing pier in order to get a symmetrical shape and equally distribute the loads. Since each pylon would transmit the new loads to the existing piers, the compressive strength of those latter would have to be verified and some extra piles would probably be required under the piers. It should however be remarked that due to the actual configuration of the spans and piers, adding two symmetrical pylons above the piers would not cover half of each of the external spans. It might thus be necessary to add two more pylons above the abutments. Installing unsymmetrical pylons above the piers, in order to cover in a better way the external spans, seems difficult for this reason that the piers are straight. In order to face the moments induced by unsymmetrical pylons, the piers should indeed be inclined and strongly strengthened, including the piles.
Figure 3.41: Sketch of pylons and cables (fan system) to increase the load carrying capacity

CHAPTER 3
80
A very important unknown in this problem is the transversal stability of such a system. Usually, cable-stayed structures typically support box girders. In our case, we only have a large deck and three beams in the middle. Two solutions could be investigated:
- The supporting cables could be divided in two groups holding the deck transversally on its two borders, in order to counteract any disequilibrium
- The deck could be transformed into a kind of box girder, by adding additional concrete to link the borders of the deck to the prestressed concrete beams, and closing the girder between the beams.
In any case, a much deeper study should be performed in order to determinate if it is possible or not, and if yes, under which conditions. The usage of a finite-element software to consider in particular torsion moments is almost mandatory.
3.8.3 Add one or several arches
Arches can be added to a structure in order to participate to carry the loads. We can add arches below each span (compression) or above (traction). It might be interesting to install arches with lower stiffness by pairs on both sides of the bridge with braces to counteract the effect of the wind, this would distribute the loads in a better way and avoid cantilevers with high moments. Given the actual configuration of the bridge, it is more advisable to build the arches below than above the deck, so that they can directly stand on the soil instead of transmitting the loads via the structure. Building one or several arch(es) for the whole bridge length would be somewhat more complicated because a part of the loads would be acting on the arch by compression and another part by tension, so the deck would be crossed by the arch(es).
Figure 3.42: Sketch of three arches below the deck to increase the load carrying capacity
Given the geotechnical conditions (soil), two hinges arches should be the most economical solution. Zero-hinges arches would require mass concrete blocks on their extremities, and three-hinges ones would not suit for these spans. Figure 3.42 is a sketch for arches with no hinges below each span (eventual geotechnical supplements are not drawn).
A solution with arches would be aesthetic. On the other side, it would probably be more expensive than the other solutions, and might require more time. Building arches below the bridge has the advantage to disturb less the traffic.

4.1. INTRODUCTION
81
4 Assessment of a solution performance
4.1 Introduction
The performance of a solution can be assessed in numerous ways and according to many criteria. These are in general defined by the client before to start any design, even preliminary, in order to guarantee its objectivity. It is important to keep in mind that several criteria should be considered to get a global assessment. Indeed, the cheapest solution might be very nasty for the environment or might last several years when it is possible to choose another solution which is much faster.
The most common criteria considered in such an analysis are in general the price (always considered), the intended duration of the works, the technical quality of the solution, the aesthetics and the safety. The environmental impact is a rather new criterion, and is not yet very often considered. However, it is intended to get more and more importance in the coming decades. Each solution must be evaluated depending on each criterion on a given scale, and then a global grade should be attributed to each solution with a multi-criteria analysis.
In our case, three criteria were considered: the duration of the works, the global price, and the environmental impact. This chapter deals with the evaluation of the solutions according to each one of these three criteria. Chapter 5 deals with the multi-criteria analysis.
4.2 Methods and duration of works
4.2.1 Introduction
The duration of the works is an important criterion for a client. Often, when the need of works is noticed, it takes time to find the funds, choose the consultants, make the preliminary designs, the project, choose the contractor who will complete the works, write and sign the tenders... The construction comes after all of this, and the need of the infrastructure is still there. The question is how much is the client ready to pay in order to get the works done in a limited amount of time: the faster the more expensive, and vice-versa. According to the French regulations (Journal Officiel de la République Française, Cahier des Clauses
Chapter

CHAPTER 4
82
Administratives Générales Travaux, 2009), if a contractor fails to complete the works of a public contract before the deadline, he is required to pay an extra fee of one 3000th of the whole price for each working day of delay, with no limit. For a private contract, the extra fee is one 1000th of the whole price per working day of delay, with a limit of 5 % of the whole price.
Unexpected events can always happen: floods, excessive rain, discovery of historical heritage… in these cases, there is no charge for the contractors. The works of the contractor must be supervised and reported on a regular basis to the client to ensure that everyone knows what is going on and where are the works regarding the initial schedule.
In general, simplest solutions are also the fastest ones to build. Steel constructions are also known for being faster than concrete, masonry, and wooden constructions since the main actions on these are to assemble the members (flanges and web, beams and columns…). On the other side, steel is usually more expensive than the other types of construction.
Making a rough estimation of the duration of the works for the different solutions is a relevant stage to help the decision makers to make the best choice.
4.2.2 Application to the widening of the Bridge of Chaillot
A simulation was performed in the case of the Bridge of Chaillot, with the help of the software GanttProject12 to draw one Gantt diagram for each technical solution to widen the bridge. In the simulation, it was assumed that works are not completed during the weekends (Saturdays and Sundays). The works were assumed to start from Monday, the 5th of September 2011, arbitrary chosen. The main constraint is to keep the road open to the vehicles, otherwise the shortest deviation would bring them to the city centre leading to very important traffic congestion, pollution, and noise, that citizens would for sure not appreciate. To do so, since the workers will sooner or later need to use a part of the bridge lanes, the traffic will have to be reduced to only one lane and will be alternated with traffic lights on both sides of the bridge. In order to ensure the safety of the workers, the vehicles speed limit will be reduced from 70 km/h to 40 km/h.
A first choice must be made concerning the lane kept for the vehicles. It can be alternatively one lane and the other one, or we can let them run in the middle of the bridge, taking the internal half of each lane. Since the pavement is not in such a good shape and is planned to be replaced, the vehicles will anyway have to take at least two paths during the works in order to let the workers change the whole pavement. On the same time the vehicles should not pass on one lane if the workers are removing the ripraps or widening the abutment to avoid any turning or collapse. The second solution was thus chosen during the works on the ripraps and abutments (assuming there is no risk for the embankment), and the first one was chosen for the works on the piers and deck: one lane for the workers and one lane for the vehicles, and vice-versa when the workers need to replace the pavement of the other lane. Contrary to the existing screed which is continuous on each single span, the new bridge will have one screed
12 Available on the address: http://www.ganttproject.biz/

4.2. METHODS AND DURATION OF WORKS
83
for each road direction. They should overlay of at least 10 cm in the middle of the road in order to ensure a satisfactory protection of the concrete.
The Gantt diagrams are presented in Annex A. They were designed for two teams of four workers each, plus one leader. One crane is also required to carry the heavy loads. If the crane is on the earth, it should be very long in order to reach the three spans of the bridge without transferring it to the other bank, so this may not be the simplest solution. It might be easier to install it in the river, approximately in the middle of the bridge central span and about 10 m from the bridge. It can be supported by a boat or directly on the river depth (about 3 m deep during very rainy times). Figure 4.1 describes some notations used in the diagrams. For example, the beam called Beam 2_1 is located on the span 2 and on the side of the lane 1.
Figure 4.1: Position of the notations used in the Gantt diagrams13
The schedules are divided into three main parts, successively:
- The works on the abutments and ripraps (traffic on the central lane): the material of the existing ripraps is of good quality and can be kept. It will just be moved from their actual location to the new one in order to be able to bore the extra piles, to widen the abutments, and to install the enlarged embankment. The abutments are enlarged with the common method of water jetting and reinforced concrete cast on the existing structure. The piles are bored.
- The works on the piers (traffic on lane 1 or lane 2): they will be performed on dry surfaces with the help of sheet pile walls bored around each pile, and by pumping the water in it. This is a cheaper solution than using divers to do the works under the water, and also safer regarding the existing reinforcements in the piers that must be protected from any source of water and covered with some anti-corrosion painting. First the extra piles are bored, then the piers bases are enlarged, and either the extra piers or the enlarged piers are built. Finally, the piers heads are enlarged. In the case of solution PB, some reinforcements of the extra piers must be kept in the air and concreted in the enlarged piers heads in
13 Vierzon – Google Maps. http://maps.google.com/. Visited on 02/07/2011

CHAPTER 4
84
order to make the full connection. A sufficient amount of steel should be installed, and the connection should be performed in a limited amount of time to avoid as much as possible the risks of corrosion due to the contact with the air. In the case of solution PC, less formwork is required since the enlarged central pier supports most of the enlarged head. Some reinforcements should however be installed in the same way as in solution PB.
- The works on the superstructures (traffic on one lane): as previously mentioned, the existing sidewalks need to be changed for new ones in order to ensure their full functionality and so that they can be expected to last the next 100 years in better conditions. They must be removed with caution with the help of the crane, and the material that cannot be used should be sent to a recycling centre. The external prestressing tendons are installed on the side beams as most as possible on the same time for a given span in order to limit the eventual effect of a dissymmetry and discomfort for the vehicles. They should be installed before to cast the concrete of the enlarged deck so that the workers have more space and it is safer for them. It is also safer for this reason that we strengthen the side beams before to apply the new (and heavier) loading on them due to the dead weight of the enlarged deck, and we are sure that they will be strong enough. The large formworks, like those to cast the extra beams and enlarged deck, should be installed with the help of the crane. If they are not strong enough to support the weight of the concrete, some scaffolding should be installed, for example standing in the river, with an adequate signalization to avoid any collision with the boats.
Each time we remove some concrete cover by water jet in order to widen a structural member, this should be performed as late as possible before to install the formworks and cast the concrete of the enlarged part to prevent air contact and corrosion.
The results of the simulation with Gantt diagrams are presented on Table 4.1.
DA DB
PA/PB 137 128
PC 135 126
Table 4.1: Estimation of the worked time needed for each solution, in working days
Solutions PA and PB were treated together since there is no much difference of time. PA only requires more time to install the bearings, but this is rather fast. The difference between the four solutions is not very important, only 11 working days between the extremes, which corresponds to barely 2 weeks. Anyway, the fastest solution appears to be DB-PC.
As expected, the composite deck is faster to build than the concrete one (9 working days of difference) and building two extra piers (PA/PB) takes more time than simply widening the existing pier (2 working days of difference). This difference of two days is not important because even though it is faster to install the formworks and cast the concrete in the case of solution PC, this solution also needs to water jet the concrete cover of the central piers and to apply an anti-corrosion painting on the existing reinforcements.
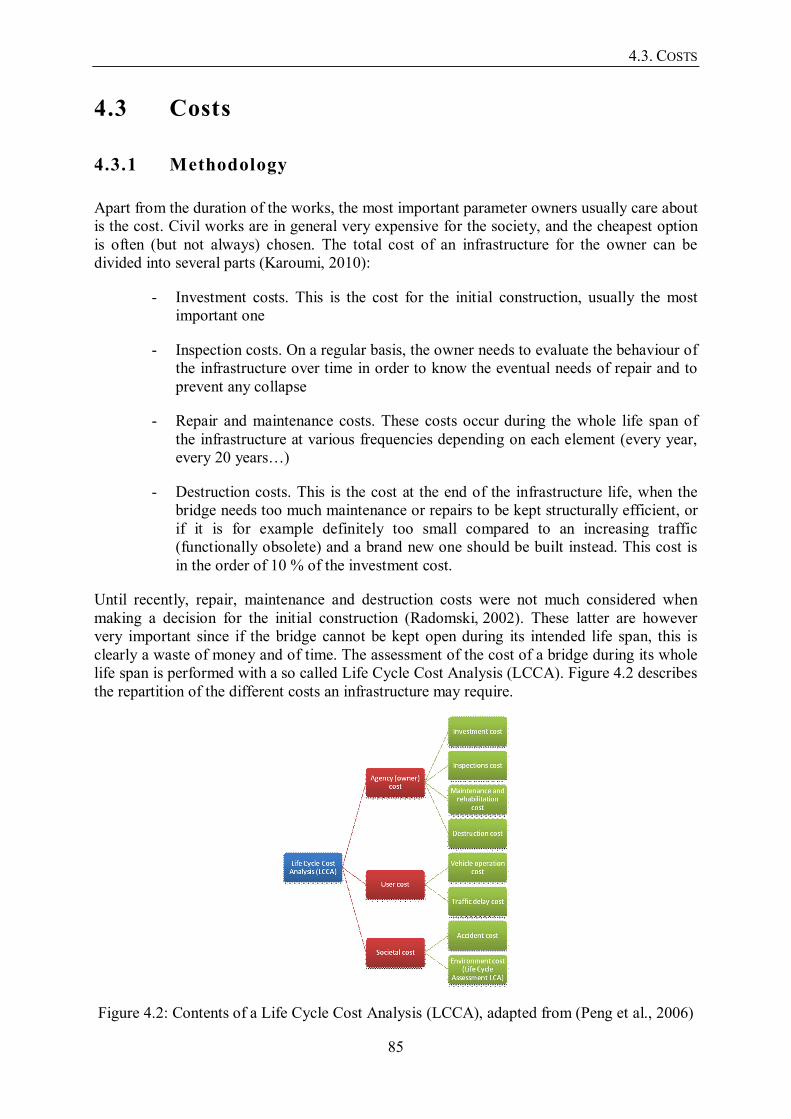
4.3. COSTS
85
4.3 Costs
4.3.1 Methodology
Apart from the duration of the works, the most important parameter owners usually care about is the cost. Civil works are in general very expensive for the society, and the cheapest option is often (but not always) chosen. The total cost of an infrastructure for the owner can be divided into several parts (Karoumi, 2010):
- Investment costs. This is the cost for the initial construction, usually the most important one
- Inspection costs. On a regular basis, the owner needs to evaluate the behaviour of the infrastructure over time in order to know the eventual needs of repair and to prevent any collapse
- Repair and maintenance costs. These costs occur during the whole life span of the infrastructure at various frequencies depending on each element (every year, every 20 years…)
- Destruction costs. This is the cost at the end of the infrastructure life, when the bridge needs too much maintenance or repairs to be kept structurally efficient, or if it is for example definitely too small compared to an increasing traffic (functionally obsolete) and a brand new one should be built instead. This cost is in the order of 10 % of the investment cost.
Until recently, repair, maintenance and destruction costs were not much considered when making a decision for the initial construction (Radomski, 2002). These latter are however very important since if the bridge cannot be kept open during its intended life span, this is clearly a waste of money and of time. The assessment of the cost of a bridge during its whole life span is performed with a so called Life Cycle Cost Analysis (LCCA). Figure 4.2 describes the repartition of the different costs an infrastructure may require.
Figure 4.2: Contents of a Life Cycle Cost Analysis (LCCA), adapted from (Peng et al., 2006)

CHAPTER 4
86
The user cost is the cost paid by those who own or drive the vehicles passing on the bridge. Vehicles operation cost is how much money is spent for the vehicles to be able to travel in good conditions (e.g. fuel consumption, mechanical maintenance…), and the traffic delay cost is how much money the vehicle owner or the driver loses during traffic congestion or works on the bridge implying a reduction of the speed or a deviation. Those two can be calculated according to the following formulas (Sundquist and Karoumi, 2009):
LCCuser,operation=T
t=0 r n
L L( - )v v ADTt
.Nt .[rL(oL+oG)+(1-rL)oD] (4.1)
LCCuser,delay= T
t L L L D tt=0 r n
L L 1( - )ADT × r w +(1-r )wv v (1+r) (4.2)
with: t: given year T: intended life span of the bridge L: length of the bridge with reduced speed, or extra distance in case of a deviation vr: traffic speed limit during the works on the bridge vn: traffic speed limit under normal conditions ADTt: Average Daily Traffic at the time t Nt: number of days of works reducing the traffic speed at time t rL: amount of commercial traffic (trucks) related to the total amount of vehicles wL: hourly time value for commercial traffic wD: hourly time value for drivers (cars) r: real interest rate, depending on the economy of each country oL: operating cost for trucks oG: operating cost for transported goods oD: operating cost for cars
The societal cost is paid by the whole society. It includes the cost of accidents and the cost due to environmental impacts. The accident cost is how much the society will have to pay when an accident occur. This implies for example the costs of doctors, hospitals, ambulances… It can be calculated with the following formula (Sundquist and Karoumi, 2009):
LCCsociety,accident=T
r n t acc tt=0
1(A -A )ADT ×C(1+r) (4.3)
with: Ar: accident rate per vehicle-kilometers during the works An: accident rate per vehicle-kilometers under normal conditions Cacc: cost of each accident for the society
All the other values are the same as in equations (4.1) and (4.2).
The environment cost is not always obvious, but it always exists. Since it is not quantified like the other costs in terms of money, it is described in another part, see Section 4.4.
vr vn L L
t=0
T
ADTt .Nt
.[rLwL+(1-rL)wD] L L vr vn
1 (1+r)t t=0
T
(Ar-An)ADTt.Nt
.Cacc 1
(1+r)t T
t=0

4.3. COSTS
87
4.3.2 Application to the widening of the Bridge of Chaillot
The costs were estimated with the help of the software BroLCC, version 1.2 released in 2003 by R. Karoumi and the Swedish road administration (Vägverket). The unit costs for repair and maintenance were obtained from the Swedish Transport Administration (Trafikverket), actualized in January 2011.
The simulation was performed for a life span of 100 years. The real interest rate for France was taken as 4,2 %14. The average daily traffic, as provided by the French road administration, is 6972 vehicles per day with a percentage of trucks of 6,8 %. The actual speed limit is 70 km/h and was assumed to be reduced to 40 km/h during the works, in order to maintain a reasonable safety for the workers. The hourly time value for the drivers was set to 85 SEK/h and the one for commercial traffic to 400 SEK/h.
The estimations were performed depending on both the choice of the extra beams (concrete or steel, i.e. DA or DB respectively) and the choice to strengthen the piers. Since the difference between the solutions PA and PB cannot be made in BroLCC, those two solutions were grouped as if they were only one solution. Four estimations were thus performed: PAPB-DA, PAPB-DB, PC-DA, and PC-DB. However, PA should be more expensive to maintain, and cheaper to build initially, than PB.
The costs provided by the Swedish Transport Administration were is Swedish currency (SEK). The conversion to the European currency was achieved with the help of the conversion rate provided by Forex15 the 1st of July 2011 (1 SEK=0,108 €) and of the price levels for investments in 2011 to take into account the difference of economies in both countries. The price levels for investments were 155 for the Swedish currency and 129 for the
European one. The cost in SEK was thus multiplied by the ratio 1290,108× 0,0899155
to get
the estimation in Euros.
Table 4.2 and Figure 4.3 show a comparison of the agency costs for each solution.
Solutions PAPB-DA PAPB-DB PC-DA PC-DB Investment/SEK 8 771 825 9 371 104 8 646 549 9 138 290 Demolition/SEK 27 851 29 754 27 454 29 015
Maintenance/SEK 4 200 599 4 536 319 4 200 599 4 536 552 Sum/SEK 13 000 275 13 937 177 12 874 602 13 703 857
Sum/€ 1 168 515 1 252 727 1 157 219 1 231 756
Table 4.2: Comparison of the agency costs (coloured cells are the cheapest amounts)
14 Obtained from the French National Institute of Statistics and Economic Studies (INSEE) on the web address: http://www.insee.fr/fr/themes/tableau.asp?ref_id=CMPTEF08205®_id=98
15 http://www.forex.com

CHAPTER 4
88
Figure 4.3: Comparison of the agency costs (in SEK)
The comparison of these results can be roughly verified with the following statements: - Steel beams are more expensive than prestressed concrete ones - Building two extra piers next to the existing ones is more expensive than
widening the existing piers - Maintenance is mostly required for the deck. Steel beams are more expensive to
maintain than prestressed concrete ones.
The costs for demolition are very low compared to the others because they are supposed to occur at the end of the bridge life, i.e. in 100 years. At that time, the costs will be much smaller than if they were occurring now due to the real interest rate.
The cheapest solution for the agency is PC-DA, i.e. by widening the existing pier and adding prestressed concrete beams, for a total cost of 1,16 million Euros.
Table 4.3 and Figure 4.4 show the user delay cost during the life span of the bridge due to maintenance. Calculated with BroLCC, these estimations only depend on the type of the deck (i.e. with extra concrete or steel beams).
PAPB-DA PAPB-DB PC-DA PC-DB 29 263 30 475 29 263 30 475
Table 4.3: Comparison of the user delay costs (in SEK) due to bridge maintenance (coloured cells are the cheapest amounts)

4.4. ENVIRONMENTAL IMPACT
89
Figure 4.4: Comparison of the user delay costs (in SEK) due to bridge maintenance
Steel beams require more maintenance than concrete ones, leading to more traffic disturbance. However the difference between the costs is rather low (less than 4 %), so this result doesn’t constitute a highly significant criterion for making a decision.
4.4 Environmental impact
So far, the environmental impact was not considered as an extremely significant criterion. Environmental impact studies are rather new, and if their consequences concern the whole society, it doesn’t influence much the decisions of a client. Actually the main reason why one should take into account the environmental impacts when making a decision is to get for instance eco-labels, in order to get a green reputation or to get tax discounts (Boulenger, 2011).
4.4.1 Methodology
The evaluation of the environmental impact of the solutions is performed through a Life Cycle Assessment, also called LCA. Each step of the life of the infrastructure has an impact on the environment, “from cradle to grave”. The life of the infrastructure can be divided into four phases, chronologically: products phase, construction phase, use phase and disposal phase. Figure 4.5 shows the phases and their steps impacting the environment.
Figure 4.5: Phases of the life cycle of an infrastructure (adapted from
García San Martín, 2011)
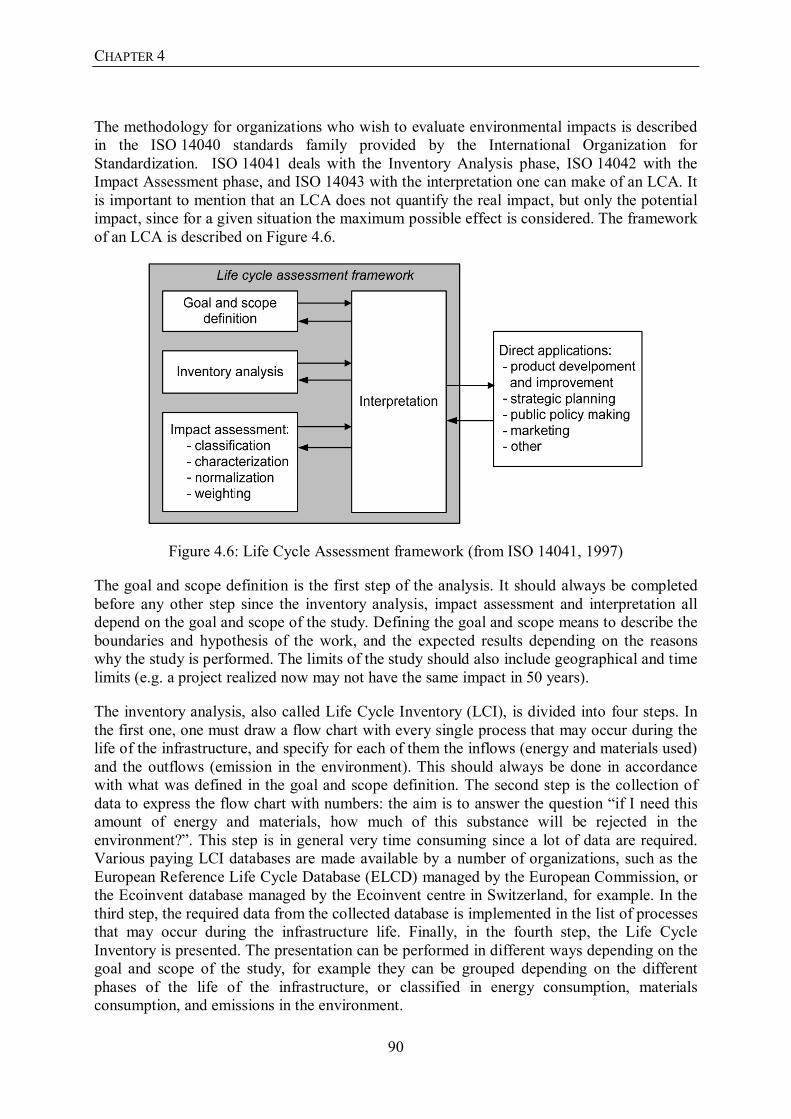
CHAPTER 4
90
The methodology for organizations who wish to evaluate environmental impacts is described in the ISO 14040 standards family provided by the International Organization for Standardization. ISO 14041 deals with the Inventory Analysis phase, ISO 14042 with the Impact Assessment phase, and ISO 14043 with the interpretation one can make of an LCA. It is important to mention that an LCA does not quantify the real impact, but only the potential impact, since for a given situation the maximum possible effect is considered. The framework of an LCA is described on Figure 4.6.
Figure 4.6: Life Cycle Assessment framework (from ISO 14041, 1997)
The goal and scope definition is the first step of the analysis. It should always be completed before any other step since the inventory analysis, impact assessment and interpretation all depend on the goal and scope of the study. Defining the goal and scope means to describe the boundaries and hypothesis of the work, and the expected results depending on the reasons why the study is performed. The limits of the study should also include geographical and time limits (e.g. a project realized now may not have the same impact in 50 years).
The inventory analysis, also called Life Cycle Inventory (LCI), is divided into four steps. In the first one, one must draw a flow chart with every single process that may occur during the life of the infrastructure, and specify for each of them the inflows (energy and materials used) and the outflows (emission in the environment). This should always be done in accordance with what was defined in the goal and scope definition. The second step is the collection of data to express the flow chart with numbers: the aim is to answer the question “if I need this amount of energy and materials, how much of this substance will be rejected in the environment?”. This step is in general very time consuming since a lot of data are required. Various paying LCI databases are made available by a number of organizations, such as the European Reference Life Cycle Database (ELCD) managed by the European Commission, or the Ecoinvent database managed by the Ecoinvent centre in Switzerland, for example. In the third step, the required data from the collected database is implemented in the list of processes that may occur during the infrastructure life. Finally, in the fourth step, the Life Cycle Inventory is presented. The presentation can be performed in different ways depending on the goal and scope of the study, for example they can be grouped depending on the different phases of the life of the infrastructure, or classified in energy consumption, materials consumption, and emissions in the environment.

4.4. ENVIRONMENTAL IMPACT
91
The impact assessment, also called Life Cycle Impact Assessment (LCIA), is the calculative part of the impact assessment process, and aims at quantifying the impact. Since different kinds of impacts with different units can occur, the final result has no units. The LCIA stage is performed in four main steps: classification, characterization, normalization, and weighting.
- Classification: depending on the LCI, the different flows are assigned to each impact category. Various impact categories exist according to their effect on the environment, and their impact is characterized by their own indicator. The mains ones are presented on Table 4.4.
Impact category Indicator (initial) Indicator (namely) Substance of reference
Abiotic Depletion ADP Abiotic Depletion Potential
Sb
Climate change GWP Global Warming Potential
CO2
Acidification AP Acidification Potential
SO2
Eutrophication EP Eutrophication Potential
PO4
Photo-Oxidant formation POCP Photo-Oxidant Creation Potential
C2H4
Stratospheric Ozone Depletion
ODP Ozone Depletion Potential
CFC11
Table 4.4: Main impact categories and their corresponding indicator (from García San Martín, 2011)
- Characterization: since various substances can affect the same impact category (e.g. carbon dioxide CO2 and methane CH4 both participate to the climate change), there is a need to characterize all the substances under the same dimension, in order to quantify the scale of the resulting effect. For this reason, each impact category is characterized by the amount of one substance of reference, and all the other substances participating to the impact are related to the substance of reference with the help of so-called characterization factors. For example, the emission of 1 kg of methane is considered to have the same impact as 24 kg of CO2, the carbon dioxide being the substance of reference for the climate change for example.
- Normalization: this step aims at converting the quantified impacts in quantities with no units, in order to compare an eventually sum the impacts of different categories. This is done by dividing the impacts by so-called normalization factors, representing the impact over a given time and on a given area. Normalization factors for Western Europe in 1995 are often used when normalizing. These factors are shown on Table 4.5.
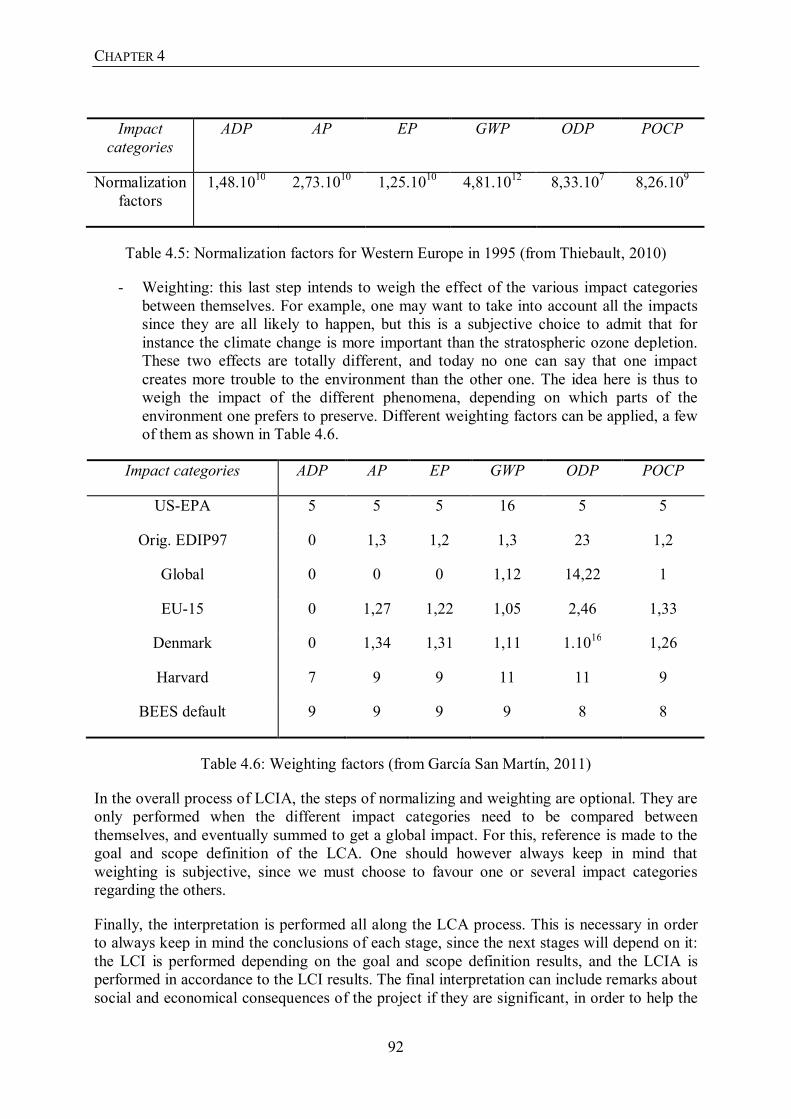
CHAPTER 4
92
Impact categories
ADP AP EP GWP ODP POCP
Normalization factors
1,48.1010 2,73.1010 1,25.1010 4,81.1012 8,33.107 8,26.109
Table 4.5: Normalization factors for Western Europe in 1995 (from Thiebault, 2010)
- Weighting: this last step intends to weigh the effect of the various impact categories between themselves. For example, one may want to take into account all the impacts since they are all likely to happen, but this is a subjective choice to admit that for instance the climate change is more important than the stratospheric ozone depletion. These two effects are totally different, and today no one can say that one impact creates more trouble to the environment than the other one. The idea here is thus to weigh the impact of the different phenomena, depending on which parts of the environment one prefers to preserve. Different weighting factors can be applied, a few of them as shown in Table 4.6.
Impact categories ADP AP EP GWP ODP POCP
US-EPA 5 5 5 16 5 5
Orig. EDIP97 0 1,3 1,2 1,3 23 1,2
Global 0 0 0 1,12 14,22 1
EU-15 0 1,27 1,22 1,05 2,46 1,33
Denmark 0 1,34 1,31 1,11 1.1016 1,26
Harvard 7 9 9 11 11 9
BEES default 9 9 9 9 8 8
Table 4.6: Weighting factors (from García San Martín, 2011)
In the overall process of LCIA, the steps of normalizing and weighting are optional. They are only performed when the different impact categories need to be compared between themselves, and eventually summed to get a global impact. For this, reference is made to the goal and scope definition of the LCA. One should however always keep in mind that weighting is subjective, since we must choose to favour one or several impact categories regarding the others.
Finally, the interpretation is performed all along the LCA process. This is necessary in order to always keep in mind the conclusions of each stage, since the next stages will depend on it: the LCI is performed depending on the goal and scope definition results, and the LCIA is performed in accordance to the LCI results. The final interpretation can include remarks about social and economical consequences of the project if they are significant, in order to help the

4.4. ENVIRONMENTAL IMPACT
93
decision makers. The accuracy of the final results should also be verified in order to assess the quality of the LCA study. For example, one can perform a sensitivity analysis. In any case, the final results should be coherent with the initial expectations described in the goal and scope definition, and if it doesn’t, it should be mentioned the reason(s) and some recommendations.
Once again, in a LCA study, it should always be remembered that the impact calculated is only potential, it is not the real impact (which can only be equal or lower than the potential impact, given that the LCA study is accurate enough).
4.4.2 Application to the widening of the Bridge of Chaillot
The environmental impacts were estimated with the help of the software BridgeLCA, released in 2009 by J. Hammervold, M. Reenaas, and H. Brattebø from the Department of Hydraulics and Environmental Engineering of the Norwegian University of Science and Technology (NTNU). The simplified version was used for this master thesis, for this reason that only few data are available about the bridge and its environment. As a consequence, we did not perform a full LCA analysis, we only considered the environmental impact of energy and material consumption for the initial construction (“from cradle to construction”). The environmental impact of operation, maintenance and disposal were disregarded. Some data, unknown at this stage of the project, are also general and should be set to more accurate values during the next stages of the project.
BridgeLCA has the advantage of being available for free on the web16. More advanced software for making LCA studies have been developed, like for example SimaPro, but they are rather expensive (about 3300 € for a single user professional license SimaPro during one year, and about 2500 € for an educational license). BridgeLCA has been developed to provide an environmental assessment tool to the Road Administrations of Nordic countries (Norway, Sweden, Finland, and Denmark). The impact categories considered are the six ones mentioned in Table 4.5, and the weighting factors integrated in the software are those of the US-EPA. The software has been designed with the help of the Ecoinvent database and SimaPro software. BridgeLCA is primarily designed for new constructions, but if we enter the new parts of the bridge (i.e. the widening parts) in the input data, we can get an assessment of the environmental impacts of the widening.
Two simulations were performed: one for widening the deck with extra concrete beams (DA) and one for widening the deck with extra steel beams (DB). The different solutions designed for the piers could not be taken into account since BridgeLCA Simplified only considers the average height of the piers, whatever their shape, width and thickness.
Figure 4.7 shows, for both cases, the repartition of weighted impacts due to each impact category. Considering the US-EPA weighting factors, solution DA has a smaller impact (3,71.10-6) on the environment than solution DB (4,36.10-6). Each impact category has a greater impact with solution DB than with solution DA. We can also mention that the effect of Ozone Depletion Potential (ODP) is totally negligible compared to the other impacts.
16 Available on the address : http://folk.ntnu.no/johanham/BridgeLCA/

CHAPTER 4
94
Figure 4.7: weighted potential environmental impacts for solutions DA (left) and DB (right)
For both solutions, the main impact on the environment is the climate change (GWP). Figure 4.8 shows, for each impact category of the two solutions, the different contributors.
Figure 4.8: contributions to the environmental impact categories for solutions DA (left) and DB (right)
The structural materials have the most important impacts, for any impact category. In solution DA, the concrete and reinforcing steel are clearly the most important ones, and in solution DB, structural steel is also the most important contributor. The impact of steel on the environment is in particular important due to high CO2 emissions when heating the furnaces to produce steel.
In spite of being characterized by different substances, the six bars on each diagram are rather similar in each impact category with more or less the same repartition. A given action can thus be intended to have a relative impact of the same scale on the different impact categories. Finally, in order to reduce the environmental impact, the most efficient measures would be to reduce the structural materials consumption. Choosing a closer location for collecting the steel and concrete in order to reduce the impact of transportation by car would have a very limited interest.

5.1. PRINCIPLE OF A MULTI-CRITERIA ANALYSIS
95
5 Comparison of the solutions
5.1 Principle of a multi-criteria analysis
A multi-criteria analysis is a tool to compare at least two options that are characterized by at least two criteria. It allows one to make a more rational choice. To perform it in the scope of this thesis, two main steps are required17:
- Grade the performance of each option according to each criterion, and on the same scale (e.g. grade out of 100 or out of 1, or on a relative scale like +2 / +1 / 0 / -1 / -2)
- Weight the different criteria depending on their relative importance for the decision-maker. This part is rather subjective and should be sufficiently discussed before to be approved.
Then a global grade is assigned to each option by summing the multiplication of each grade with its corresponding weight. A ranking can finally be provided to assess the global performance of each solution.
Table 5.1 summarizes the principle with three options characterized by three criteria.
Weights Option 1 Option 2 Option 3 Criterion A α A1 A2 A3 Criterion B β B1 B2 B3 Criterion C γ C1 C2 C3
Global grade 1 1 1 1αA +βB +γCα+β+γ
2 2 2αA +βB +γCα+β+γ
3 3 3αA +βB +γCα+β+γ
Table 5.1: Summary of the principle of a multi-criteria analysis
17 EuropeAid, L’analyse multicritère. http://ec.europa.eu/europeaid/evaluation/methodology/examples/too_cri_res_fr.pdf
Chapter

CHAPTER 5
96
5.2 Choice of the best solution
First of all, since we have two solutions for the deck (DA and DB) and three for the piers (PA, PB and PC), we have to compare six solutions: DA-PA, DA-PB, DA-PC, DB-PA, DB-PB, and DB-PC.
To do so, we have previously considered three different criteria: the duration of the works, the total cost, and the environmental impact. Before to start any comparison, we need to grade these solutions according to the three criteria on the same scale. Table 5.2 summarizes the results of the evaluations previously performed.
Solution DA DB
PA PB PC PA PB PC
Duration of works (days) 137 135 128 126
Cost of the works (€) 1 168 515 1 157 219 1 252 727 1 231 756
Environmental impact (/) 3,71.10-6 4,36.10-6
Table 5.2: Summary of the results of the evaluations
The cost of delay for users is disregarded since it is not paid by the road administration and since the difference between the solutions was not very significant. Our studies were not accurate enough to make significant differences between solutions PA and PB, consequently they are considered as if they were the same solution. The main difference however remains in the fact that PA requires more maintenance than PB.
The grading should be performed in accordance with the size of the gaps between the values. In particular, for a given deck (DA or DB), the differences of costs and the durations of works are very low, and it should not be that significant to give very different grades whether the cost is for example 1 168 515 € or 1 157 219 €, since the relative difference is less than 1 %. Different grades should however be attributed to significant gaps in order to make the comparison. The chosen scale is from 0 to 5. Table 5.3 shows the grades and the weighting.
Solution Weighting DA DB
PA PB PC PA PB PC
Duration of works/days 15 2,75 3 3,75 4
Cost of the works/€ 80 3,75 4 2,5 2,75
Environmental impact/No units 5 4 2
Global grade 1 3,61 3,85 2,66 2,90
Table 5.3: Grading, weighting and global grades of the solutions

5.2. CHOICE OF THE BEST SOLUTION
97
The most important criterion is obviously the cost of the works, which is usually the dominant factor when making this kind of decisions. A weight of 80 is thus attributed to it. Then the rest is shared between the duration of works (15) and the environmental impact (5), which is, at least today, not that important for the road administration since there is no direct return on it and no particular incitation to perform environmental friendly works on this project.
According to the global grades, the most efficient solution is DA-PC and then DA-PAPB. Given the importance of the cost of the works, the deck DA is clearly more interesting than the deck DB.
These results should however be put in perspective. Not all the relevant criteria have been considered, only those assumed as the most interesting and significant for this thesis. Some other criteria such as aesthetics, or the security of the methods for the workers, could also have been considered. Finally, our estimations are rough, performed with automatic softwares. These could still be improved.
In spite of their different design, our solutions remain similar. They all suppose to add extra beams and slightly different methods for widening the existing piers. Considering a radically different solution, like those proposed in Section 3.8, could have given really different grades.


6.1. CONCLUSIONS
99
6 Conclusions and further research
6.1 Conclusions
The preliminary design allowed us to establish six different technical solutions to widen the bridge: two different solutions for the deck (extra prestressed concrete beams and extra steel beams) and three different solutions for the piers (extra piers with bearings, extra piers without bearings, and widening the existing piers). Table 6.1 sums up the constitution of the solutions.
Solutions DA-PA DA-PB DA-PC DB-PA DB-PB DB-PC
Deck DA: extra prestressed concrete beams DB: extra steel beams
Piers PA: extra piers with bearings
PB: extra piers
without bearings
PC: widen existing
piers
PA: extra piers with bearings
PB: extra piers
without bearings
PC: widen existing
piers
Table 6.1: Constitution of the solutions
The performance of each solution was assessed according to three different criteria: the cost of the works, the duration of the works, and the environmental impact. Finally, each performance was graded on a given scale and a global grade was attributed to each solution (Chapter 5). There is no difference between solutions whether they imply PA or PB since the way we assessed the performance of the solutions was not accurate enough to pretend to make this difference on a serious basis. The evaluation of the environmental impacts was performed only based on the type of deck whatever the piers, to fulfil the data to input in the software used. The final grades are showed on Table 5.3.
From this case study, it has to be remarked that steel structures have a more important environmental impact than concrete ones. This is mainly due to the CO2 emissions produced when heating the furnaces to very high temperatures in order to make steel. As expected, steel structures are also more expensive than concrete ones, but they are faster to install. The
Chapter
CHAPTER 6
100
difference of time is rather small though, barely 10 days, and the difference of costs is more important by reaching 7 % of the total price. Concerning the piers, widening existing ones is faster and cheaper than building new ones to support the enlarged deck. It requires in particular less formwork.
Solutions implying DA are globally better graded than solutions implying DB, since the only criterion where they are worse is the duration of the works, which has a small weigh compared to the reunion of the other criteria (15 compared to 85). The solution one should thus recommend for the real project would be solution DA-PC.
However, as previously mentioned, it could have been interesting to analyze more fancy solutions, like those presented in Section 3.8. This has not been possible due to a lack of time. One should also keep in mind that all the analysis has been performed with the restrictions and simplifications mentioned in the Scope of work (Section 1.3) and in Section 3.3.2. Finally, more criteria such as the security or aesthetics could also have been considered, but were disregarded in order to delimit the work of this thesis. Considering other criteria could have changed the results. In particular, the best graded solution included PC which is, according to the author’s opinion, less beautiful to see than solutions PA and PB.
6.2 Further research and suggestions for improvement
The aim of this thesis was to perform a case study on an existing concrete bridge in order to design and compare different solutions for increasing its width. Chapter 2 describes the existing bridge, its environment, its geometrical data, the characteristics of the materials, and the loads to consider. Chapter 3 deals with techniques to modify and widen a bridge and presents the results of two techniques to modify the deck and three techniques to modify the piers. Some suggestions are made to modify the piles. Since the new regulations (Eurocodes) are stricter than the original ones, the design is different than what it could have been 40 years ago. Chapter 4 explains how to assess the performance of a solution according to three criteria and applies it to our bridge. Chapter 5 describes how to compare objects with the help of different criteria, and makes a multi-criteria comparison of the previously designed solutions in order to sort out the one we would recommend the most and why. Weights are subjective but realistic. The cost is often – for not saying always – the most important criterion. Assessments also depend on each engineer, but they are based on rational and numerical values.
The bridge chosen is very state-of-the-art. It is made of simply supported prestressed concrete beams, with reinforced concrete deck and piers. This type of bridge is rather simple to analyze and its principle is quite common. Apart from this bridge, the results of this thesis can serve as reference to other projects of the same type in order to anticipate the possible designs and get an idea of the results of their performance.
The design was preliminary. The more advanced the design, the more accurate the assessments of the performance and the more relevant the final choice. On the other time, doing advanced designs requires more time, more resources, and thus more money. The good compromise should then be kept for saving both time and money.

6.2. FURTHER RESEARCH AND SUGGESTIONS FOR IMPROVEMENT
101
When assessing the performance of the solutions, different programs have been used for each performance: GanttProjet for the diagrams of Gantt, BroLCC for the costs, and BridgeLCA for the environmental impact. For each one of these criteria, a certain amount of data was introduced in the three softwares separately. Time could be saved if the three softwares were grouped in the same one that would automatically set, for example, the total amount of required concrete in the LCA part when it has been already set in the costs part. By entering the weights, the grading of the different solutions could also be produced. The disadvantage of such a software is that all the criteria one wants to consider must be introduced in the software, and on the contrary if the software contains many criteria, it could cost too much money and might be superfluous if only a few are needed. This kind of software could also include a database of previously completed similar projects, like the one discussed in this thesis, to help the user put in perspective the results and/or get more ideas.
Concerning the LCC analysis itself, more costs could be considered, e.g. the vehicles operation costs and the accidental costs. Even though their interest is clearly of second order for a road administration, it can always be interesting to know the consequences of given choices in order to make people or other administrations aware of it.
A number of improvements could also be performed on the LCA analysis. First of all, performing for example a sensitivity analysis could help to verify the accuracy of the results. A sensitivity analysis consists in making small variations of the input data of a program and check that the results of this program do not vary much compared to those variations. Secondly, it could also have been interesting to perform the LCA analysis with other weighting factors like EU-15 or the Denmark ones, and see the magnitude of the difference we would have in the results. Finally, using a licensed software like SimaPro for the LCA analysis would probably have given more accurate results.


BIBLIOGRAPHY
103
Bibliography
Boulenger M., 27/05/2011, Stockholm. Recommendations for the LCA of bridges and tunnels. Master of Science Thesis presentation, Royal Institute of Technology, division of Structural Design and Bridges.
Centre Scientifique et Technique du Bâtiment (CSTB), 1992. Règles BAEL.145p. Centre Scientifique et Technique du Bâtiment (CSTB). ISBN 2-86891-213-3
Centre Scientifique et Technique du Bâtiment (CSTB), 1992. Règles BPEL.150p. Centre Scientifique et Technique du Bâtiment (CSTB). ISBN 2-86891-214-1
Collin P., Johansson B., Sundquist H., 2008. Steel Concrete Composite bridges. Report 121, Royal Institute of Technology, division of Structural Design and Bridges and Luleå University of Technology, division of Structural Engineering.
Das B. M., 1999. Principles of Foundation Engineering. 862p. Brooks/Cole Publishing Company. ISBN 0-534-95403-0
Eurocodes, codes de construction en Europe, http://www.eurocode1.com Visited on 18/05/2001.
Eurocode (2004). Eurocode 2: Design of Concrete Structures – Part 1-1: General Rules and Rules for Buildings. European Committee for Standardization (CEN), Brussels.
EuropeAid. L’analyse multicritère. http://ec.europa.eu/europeaid/evaluation/methodology/examples/too_cri_res_fr.pdf Visited on 01/06/2011
Fascicules du CCTG en téléchargement, http://www.developpement-durable.gouv.fr/spip.php?page=article&id_article=15900 Visited on 09/05/2011.
García San Martín, L., 2011. Life Cycle Assessment of Railway Bridges, Developing a LCA tool for evaluating Railway Bridges. 154p. Master of Science Thesis 323, Royal Institute of Technology, division of Structural Design and Bridges. ISSN 1103-4297
Gervreau E., 2000. Géotechnique, calcul des ouvrages. 168p. Gaëtan Morin éditeur. ISBN 2-910749-29-0

BIBLIOGRAPHY
104
Ginger CEBTP, 2007. Contrôle des fondations. 2p. http://www.gingergroupe.com/FR/documentation/CEBTP/2009/controle_fondation.pdf Visited on 02/07/11
Glasson J., Therivel R., Chadwick A., 2005. Introduction to environmental impact assessment. 423 p. Abingdon, United Kingdom: Oxford Brookes University. ISBN 0-415-33837-9
Hammervold J., Reenaas M., Brattebø, 2009. BridgeLCA, Documentation, Methodologies and Data Documentation. Norwegian University of Science and Technology (NTNU), Department of Hydraulic and Environmental Engineering.
Highways Agency (HA), Transport Research Laboratory (TRL), Service d’Etudes Techniques des Routes et Autoroutes (SETRA), Laboratoire Central des Ponts et Chaussées (LCPC), 1999. Post-tensioned concrete bridges. 154p. Thomas Telford books. ISBN 0-7277-2760-5
Holmgren J., Lagerblad B., Westerberg B., 2007. Reinforced Concrete Structures, Compendium on structural design of bridges. Report 115, Royal Institute of Technology, division of Structural Design and Bridges.
INSEE – Populations légales 2008 – 18279 Vierzon. http://www.insee.fr/fr/ppp/bases-de-donnees/recensement/populations-legales/commune.asp?depcom=18279&annee=2008. Visited on 04/03/2011.
Jutila A., Sundquist H., 2007. ETSI Project (stage1), Bridge Life Cycle Optimisation. 158p. Helsinki University of Technology, Laboratory of Bridge Engineering. ISBN 978-951-22-8645-4
Karoumi R., 2010. Lecture notes of the Bridge Design, Advanced Course. Royal Institute of Technology, division of Structural Design and Bridges.
Lassere, E. Bases du béton armé. 17p. http://www.coinduprojeteur.com/ Visited on 07/04/11
Nilson A.H., Winter G., 1991. Design of concrete structures. 904p. Mc Graw Hill, Inc. ISBN 0-0704-6567-3
Nowak A.S., 1990. Bridge Evaluation, Repair and Rehabilitation. 632p. Kluwer Academic Publishers. ISBN: 0-7923-0999-5
Peng J., Shao X., Jin X., 2006. Research on lifetime performance-based bridge design method. Bridge Maintenance, Safety, Management, Life-Cycle Performance and Cost. Taylor & Francis Group, London ISBN 0-41540-315-4
PIARC Technical Committee on Road Bridges and other Structures (C11), 2005. Study on Rehabilitation Actions on Concrete Bridges. 146p.
Radomski W., 2002. Bridge rehabilitation. 476 p. London, United Kingdom: Imperial College Press.

BIBLIOGRAPHY
105
ISBN 1-86094-122-2
Raina V.K., 1988. Concrete Bridge Practice, Construction, Maintenance and Rehabilitation. 605p. Tata McGraw-Hill.
Rüsch H., Jungwirth D., Hilsdorf H., 1983. Creep and shrinkage, their effect on the behavior of concrete structures. 284p. New-York, United States of America: Springer-Verlag.
Ryall M.J., Parke, G.A.R., Harding, J.E., 2000. Manual of Bridge Engineering. 1012p. Thomas Telford Books. ISBN 0-7277-2774-5
Silfwerbrand J., Sundquist H., 2008. Prestressed Concrete Structures, Compendium on structural design of bridges. Report 107, Royal Institute of Technology, division of Structural Design and Bridges.
Salokangas L., 2009. ETSI Project (Stage2), Bridge Life Cycle Optimisation. 140p. Helsinki University of Technology, Department of Structural Engineering and Building Technology. ISBN 978-951-22-9828-0
Service d’Etudes Technique des Routes et Autoroutes (SETRA). Béton précontraint. http://www.piles.setra.equipement.gouv.fr/IMG/pdf/beton_precontraint_cle5afebd-1.pdf Visited on 21/05/11
Sundquist H., 2007. Beam and frame structures, Compendium on structural design of bridges. Report 109, Royal Institute of Technology, division of Structural Design and Bridges.
Sundquist H., 2007. Safety, Loads and Load Distribution on Structures, Compendium on structural design of bridges. Report 108, Royal Institute of Technology, division of Structural Design and Bridges.
Sundquist H., 2008. Infrastructure Structures, Compendium on structural design of bridges. Report 116, Royal Institute of Technology, division of Structural Design and Bridges.
Thiebault, V., 2011. Design of railway bridges considering LCA. 158p. Master of Science Thesis 305, Royal Institute of Technology, division of Structural Design and Bridges. ISSN 1103-4297


6.2. FURTHER RESEARCH AND SUGGESTIONS FOR IMPROVEMENT
107
A Gantt diagrams
The following diagrams were created with the help of the software GanttProject18. Each diagram starts on Monday, the 5th of September 2011. One column stands for one week, one line stands for one action. They were all planned for two teams of four workers plus one leader.
Additional information and the analysis of results are provided in Section 4.2.
18 Available on the address: http://www.ganttproject.biz/
Appendix

APPENDIX A
108
A.1 Solution DA-PAPB

A.2. SOLUTION DA-PC
109
A.2 Solution DA-PC

APPENDIX A
110
A.3 Solution DB-PAPB

A.4. SOLUTION DB-PC
111
A.4 Solution DB-PC

TRITA-BKN. Master Thesis 324,
Structural Design and Bridges 2011
ISSN 1103-4297
ISRN KTH/BKN/EX-324-SE
www.kth.se