
PRELIMINARY DECISION United Energy distribution ... - Preliminary decision... · 6-0 Attachment 6...
155
6-0 Attachment 6 – Capital expenditure | United Energy Preliminary decision 2016–20 PRELIMINARY DECISION United Energy distribution determination 2016 to 2020 Attachment 6 – Capital expenditure October 2015
Transcript of PRELIMINARY DECISION United Energy distribution ... - Preliminary decision... · 6-0 Attachment 6...

6-0 Attachment 6 – Capital expenditure | United Energy Preliminary decision 2016–20
PRELIMINARY DECISION
United Energy distribution
determination
2016 to 2020
Attachment 6 – Capital
expenditure
October 2015

6-1 Attachment 6 – Capital expenditure | United Energy Preliminary decision 2016–20
© Commonwealth of Australia 2015
This work is copyright. In addition to any use permitted under the Copyright Act 1968, all
material contained within this work is provided under a Creative Commons Attributions 3.0
Australia licence, with the exception of:
the Commonwealth Coat of Arms
the ACCC and AER logos
any illustration, diagram, photograph or graphic over which the Australian Competition and
Consumer Commission does not hold copyright, but which may be part of or contained
within this publication. The details of the relevant licence conditions are available on the
Creative Commons website, as is the full legal code for the CC BY 3.0 AU licence.
Requests and inquiries concerning reproduction and rights should be addressed to the:
Director, Corporate Communications
Australian Competition and Consumer Commission
GPO Box 4141, Canberra ACT 2601
Inquiries about this publication should be addressed to:
Australian Energy Regulator
GPO Box 520
Melbourne Vic 3001
Tel: (03) 9290 1444
Fax: (03) 9290 1457
Email: [email protected]

6-2 Attachment 6 – Capital expenditure | United Energy Preliminary decision 2016–20
Note
This attachment forms part of the AER's preliminary decision on United Energy's
revenue proposal 2016–20. It should be read with all other parts of the preliminary
decision.
The preliminary decision includes the following documents:
Overview
Attachment 1 - Annual revenue requirement
Attachment 2 - Regulatory asset base
Attachment 3 - Rate of return
Attachment 4 - Value of imputation credits
Attachment 5 - Regulatory depreciation
Attachment 6 - Capital expenditure
Attachment 7 - Operating expenditure
Attachment 8 - Corporate income tax
Attachment 9 - Efficiency benefit sharing scheme
Attachment 10 - Capital expenditure sharing scheme
Attachment 11 - Service target performance incentive scheme
Attachment 12 - Demand management incentive scheme
Attachment 13 - Classification of services
Attachment 14 - Control mechanism
Attachment 15 - Pass through events
Attachment 16 - Alternative control services
Attachment 17 - Negotiated services framework and criteria
Attachment 18 - f-factor scheme
6-3 Attachment 6 – Capital expenditure | United Energy Preliminary decision 2016–20
Contents
Note ...............................................................................................................6-2
Contents .......................................................................................................6-3
Shortened forms ..........................................................................................6-6
6 Capital expenditure ...............................................................................6-8
6.1 Preliminary decision .......................................................................6-8
6.2 United Energy's proposal ............................................................. 6-11
6.3 AER’s assessment approach ....................................................... 6-12
6.3.1 Building an alternative estimate of total forecast capex ............. 6-15
6.3.2 Comparing the distributor's proposal with our alternative estimate 6-
17
6.4 Reasons for preliminary decision ............................................... 6-18
6.4.1 Key assumptions ....................................................................... 6-19
6.4.2 Forecasting methodology .......................................................... 6-20
6.4.3 Interaction with the STPIS ......................................................... 6-21
6.4.4 United Energy’s capex performance .......................................... 6-22
6.4.5 Interrelationships ....................................................................... 6-28
6.4.6 Consideration of the capex factors ............................................ 6-29
A Assessment techniques ...................................................................... 6-32
A.1 Economic benchmarking ............................................................. 6-32
A.2 Trend analysis ............................................................................... 6-33
A.3 Category analysis ......................................................................... 6-34
A.4 Predictive modelling ..................................................................... 6-34
A.5 Engineering review ....................................................................... 6-35
B Assessment of capex drivers ............................................................. 6-36
B.1 Alternative estimate ...................................................................... 6-36

6-4 Attachment 6 – Capital expenditure | United Energy Preliminary decision 2016–20
B.2 AER findings and estimates for augmentation expenditure ..... 6-37
B.2.1 Trend analysis ........................................................................... 6-40
B.2.2 Forecasting methodology and Value of Customer Reliability ..... 6-45
B.2.3 Project reviews .......................................................................... 6-51
B.3 Forecast customer connections capex, including capital
contributions ........................................................................................ 6-53
B.3.1 Trend analysis ........................................................................... 6-54
B.3.2 United Energy forecasting methodology .................................... 6-57
B.4 Forecast repex .............................................................................. 6-62
B.4.1 Position ..................................................................................... 6-62
B.4.2 United Energy's proposal .......................................................... 6-63
B.4.3 AER approach ........................................................................... 6-63
B.4.4 AER repex findings ................................................................... 6-66
B.5 Victorian Bushfires Royal Commission ...................................... 6-85
B.5.1 Bushfire safety-related capital expenditure ................................ 6-85
B.6 Forecast non–network capex .................................................... 6-102
B.6.1 Position ................................................................................... 6-102
B.6.2 United Energy's proposal ........................................................ 6-102
B.6.3 Information and communications technology capex ................ 6-105
B.6.4 Fleet asset disposals ............................................................... 6-112
C Maximum demand forecasts ............................................................ 6-113
C.1 AER determination ...................................................................... 6-114
C.2 United Energy's proposal ........................................................... 6-116
C.3 Demand trends ............................................................................ 6-117
C.4 United Energy's forecasting methodology and assumptions . 6-124
D Real material cost escalation ........................................................... 6-129
D.5 Position ........................................................................................ 6-129
D.6 United Energy’s proposal .......................................................... 6-130

6-5 Attachment 6 – Capital expenditure | United Energy Preliminary decision 2016–20
D.11 Labour and construction escalators ................................... 6-143
E Predictive modelling approach and scenarios ............................... 6-144
E.1 Predictive modelling techniques ............................................... 6-144
E.2 Data specification process ........................................................ 6-145
E.3 Data collection and refinement .................................................. 6-146
E.4 Benchmarking repex asset data ................................................ 6-146
E.4.1 Benchmark data for each asset category ................................ 6-147
E.5 Repex model scenarios .............................................................. 6-149
E.6 The treatment of staked wooden poles ..................................... 6-152
E.6.1 Like-for-like repex modelling.................................................... 6-152
E.6.2 Non-like-for-like replacement ................................................... 6-152
E.7 Calibrating staked wooden poles .............................................. 6-154

6-6 Attachment 6 – Capital expenditure | United Energy Preliminary decision 2016–20
Shortened forms Shortened form Extended form
AEMC Australian Energy Market Commission
AEMO Australian Energy Market Operator
AER Australian Energy Regulator
AMI Advanced metering infrastructure
augex augmentation expenditure
capex capital expenditure
CCP Consumer Challenge Panel
CESS capital expenditure sharing scheme
CPI consumer price index
DRP debt risk premium
DMIA demand management innovation allowance
DMIS demand management incentive scheme
distributor distribution network service provider
DUoS distribution use of system
EBSS efficiency benefit sharing scheme
ERP equity risk premium
Expenditure Assessment Guideline Expenditure Forecast Assessment Guideline for electricity
distribution
F&A framework and approach
MRP market risk premium
NEL national electricity law
NEM national electricity market
NEO national electricity objective
NER national electricity rules
NSP network service provider
opex operating expenditure
PPI partial performance indicators
PTRM post-tax revenue model
RAB regulatory asset base
RBA Reserve Bank of Australia
repex replacement expenditure

6-7 Attachment 6 – Capital expenditure | United Energy Preliminary decision 2016–20
Shortened form Extended form
RFM roll forward model
RIN regulatory information notice
RPP revenue and pricing principles
SAIDI system average interruption duration index
SAIFI system average interruption frequency index
SLCAPM Sharpe-Lintner capital asset pricing model
STPIS service target performance incentive scheme
WACC weighted average cost of capital

6-8 Attachment 6 – Capital expenditure | United Energy Preliminary decision 2016–20
6 Capital expenditure
Capital expenditure (capex) refers to the investment made in the network to provide
standard control services. This investment mostly relates to assets with long lives (30-
50 years is typical) and these costs are recovered over several regulatory periods. On
an annual basis, however, the financing cost and depreciation associated with these
assets are recovered (return of and on capital) as part of the building blocks that form
part of United Energy’s total revenue requirement.1
This attachment sets out our preliminary decision on United Energy’s total forecast
capex. Further detailed analysis is in the following appendices:
• Appendix A - Assessment techniques
• Appendix B - Assessment of capex drivers
• Appendix C - Maximum demand forecasts
• Appendix D - Real material cost escalation
• Appendix E - Predictive modelling approach and scenarios.
6.1 Preliminary decision
We are not satisfied United Energy's proposed total forecast capex of $1,104 million
($2015) reasonably reflects the capex criteria. We substituted our estimate of United
Energy's total forecast capex for the 2016–20 regulatory control period. We are
satisfied that our substitute estimate of $814.8 million ($2015) reasonably reflects the
capex criteria. Table 6.1 outlines our preliminary decision.
Table 6.1 Our preliminary decision on United Energy’s total forecast
capex ($2015, million)
2016 2017 2018 2019 2020 Total
United Energy’s proposal 228.8 238.1 235.5 208.1 193.5 1,104.0
AER preliminary decision 167.8 172.0 166.9 156.4 151.7 814.8
Difference –61.0 –66.1 –68.6 –51.7 –41.8 –289.2
Percentage difference (%) –26.7 –27.8 –29.1 –24.8 –21.6 –26.2
Source: AER analysis.
Note: Numbers may not add up due to rounding.
Table 6.2 summarises our findings and the reasons for our preliminary decision.
1 NER, cl. 6.4.3(a).

6-9 Attachment 6 – Capital expenditure | United Energy Preliminary decision 2016–20
These reasons include our responses to stakeholders' submissions on United Energy's
regulatory proposal. In the table we present our reasons by ‘capex driver’ (for example,
augmentation, replacement, and connections). This reflects the way in which we tested
United Energy's total forecast capex. Our testing used techniques tailored to the
different capex drivers, taking into account the best available evidence. Through our
techniques, we found United Energy's capex forecast across all categories was higher
than an efficient level, inconsistent with the NER. We are not satisfied that United
Energy's proposed total forecast capex is consistent with the requirements of the
NER.2
Our findings on the capex drivers are part of our broader analysis and should not be
considered in isolation. Our preliminary decision concerns United Energy’s total
forecast capex for the 2016–20 period. We do not approve an amount of forecast
expenditure for each capex driver. However we use our findings on the different capex
drivers to arrive at an alternative estimate for total capex. We test this total estimate of
capex against the requirements of the NER (see section 6.3 for a detailed discussion).
We are satisfied that our estimate represents the total forecast capex that as a whole
reasonably reflects the capex criteria.
Table 6.2 Summary of AER reasons and findings
Issue Reasons and findings
Total capex forecast
United Energy proposed a total capex forecast of $1,104 million ($2015) in its
proposal. We are not satisfied this forecast reflects the capex criteria.
We are satisfied our substitute estimate of $814.8 million ($2015) reasonably reflects
the capex criteria. Our substitute estimate is 26 per cent lower than United Energy's
proposal.
The reasons for this decision are summarised in this table and detailed in the
remainder of this attachment.
Forecasting methodology,
key assumptions and past
capex performance
We consider United Energy’s key assumptions and forecasting methodology are
generally reasonable. Where we identified specific areas of concern, we discuss these
in the appendices to this capex attachment and section 6.4.2.
Augmentation capex
We do not accept United Energy’s forecast augex of $166.5 million ($2015) as a
reasonable estimate for this category. We consider that $127 million ($2015) is a
reasonable estimate for United Energy to meet forecast demand growth and satisfy
the capex criteria.
While we accept the majority of United Energy’s demand driven forecast, we consider
that some reductions are necessary to reflect a lower forecast of demand. In part this
reflects our view that United Energy’s demand forecast does not reflect a realistic
expectation of demand over the 2016–20 regulatory control period. We also consider
that Untied Energy has overestimated the value of customer reliability (VCR) that it
applies to plan its augmentation requirements.
Customer connections capex
We are satisfied United Energy’s forecast is a reasonable estimate for this category.
We have included an amount of $249.1 million ($2015) in our substitute capex
estimate. In determining this, we are satisfied that the forecast methodology United
Energy has relied on represents an unbiased estimate of the capex it requires.
2 NER, cll. 6.5.7(c) and (d).

6-10 Attachment 6 – Capital expenditure | United Energy Preliminary decision 2016–20
Issue Reasons and findings
Asset replacement capex
(repex)
We do not accept United Energy’s forecast repex of $585 million ($2015) as a
reasonable estimate for this category. We consider our alternative estimate of $414
million ($2015) will allow United Energy to meet the capex objectives and have
included this amount in our alternative estimate. Our alternative estimate is 29 per
cent lower than United Energy’s proposed repex. Our repex modelling estimates a
lower amount of “business as usual” repex is necessary compared to United Energy’s
forecast for the modelled categories of repex. We also do not accept United Energy’s
proposed increase to repex for categories it has reported under “other” repex. We
accept there may be a need to replace a number of these assets. However, we are of
the view that United Energy has not provided justification why it needs to spend
significantly more repex on some of these categories in the forthcoming period. United
Energy has not provided business cases with reasonable options analysis or sufficient
cost-benefit analysis to justify the proposed repex, and there is a lack of top-down
assessment.
Non-network capex
We do not accept United Energy’s proposed non-network capex of $194.6 million
($2015). We have instead included in our alternative estimate of total capex an
amount of $134.6 million ($2015) for non-network capex. United Energy’s forecast
capex for information technology does not reasonably reflect the efficient costs of a
prudent operator. We are not sufficiently satisfied that forecast capex associated with
the Power of Choice market reforms and RIN reporting framework is necessary to
meet an applicable regulatory obligation, or reasonably reflects the capex criteria.
Real cost escalators
In respect of real material cost escalators (leading to cost increases above CPI), we
are not satisfied that United Energy’s proposed real material cost escalators, which
form part of its total forecast capex, reasonably reflect a realistic expectation of the
cost inputs required to achieve the capex objectives over the 2016–20 regulatory
control period. We consider that zero per cent real cost escalation is reasonably likely
to reflect the capex criteria including that it is likely to reasonably reflect a realistic
expectation of the cost inputs required to achieve the capex objectives over the 2016–
20 regulatory control period. Our approach to real materials cost escalation does not
affect the proposed application of labour and construction cost escalators which apply
to United Energy’s forecast capex for standard control services.
We are not satisfied United Energy’s proposed real labour cost escalators which form
part of its total forecast capex reasonably reflect a realistic expectation of the cost
inputs required to achieve the capex objectives over the 2016–20 regulatory control
period. We discuss our assessment of forecast our labour price growth for United
Energy in attachment 7.
The difference between the impact of the real labour and materials cost escalations
proposed by United Energy and those accepted by the AER in its capex decision is
$18.4 million ($2015).
Source: AER analysis.
We consider that our overall capex forecast addresses the revenue and pricing
principles. In particular, we consider our overall capex forecast provides United Energy
a reasonable opportunity to recover at least the efficient costs it incurs in:
providing direct control network services; and
complying with its regulatory obligations and requirements.3
3 NEL, s. 7A.

6-11 Attachment 6 – Capital expenditure | United Energy Preliminary decision 2016–20
As set out in appendix B we are satisfied that our overall capex forecast is consistent
with the national electricity objective (NEO). We consider our decision promotes
efficient investment in, and efficient operation and use of, electricity services for the
long term interests of consumers of electricity.
We also consider that overall our capex forecast addresses the capital expenditure
objectives.4 In making our preliminary decision, we specifically considered the impact
our decision will have on the safety and reliability of United Energy's network. We
consider this capex forecast should be sufficient for a prudent and efficient service
provider in United Energy's circumstances to be able to maintain the safety, service
quality, security and reliability of its network consistent with its current obligations.
6.2 United Energy's proposal
United Energy proposed total forecast capex of $1,104 million ($2015) for the 2016–20
regulatory control period.5 This is $132.3 million ($2015) above United Energy’s actual
capex of $971.7 million ($2015) for the 2011–15 regulatory control period.6
Figure 6.1 shows the increase between United Energy’s proposal for the 2016–20
regulatory control period and the actual capex that it spent during the 2011–15
regulatory control period. United Energy has stated that this forecast increase in capex
is mainly attributable to a need to:7
continue to undertake bushfire mitigation measures, including SWER replacement,
in accordance with its regulatory obligations
continue to address risks to the general public of electric shocks through activities
such as the Doncaster Pillars Replacement Program
address deteriorating network reliability. The primary areas that contribute to this
outcome are replacement, augmentation, and ICT capex.
4 NER, cl. 6.5.7(a).
5 United Energy, Regulatory Proposal 2016–20, April 2015, pp. 43–45.
6 This includes estimated capex for the 2015 regulatory year.
7 United Energy Regulatory Proposal 2016–20, April 2015, pp. 45–48.

6-12 Attachment 6 – Capital expenditure | United Energy Preliminary decision 2016–20
Figure 6.1 United Energy total actual and forecast capex 2011–2020
Source: AER analysis.
6.3 AER’s assessment approach
This section outlines our approach to capex assessments. It sets out the relevant
legislative and rule requirements, and outlines our assessment techniques. It also
explains how we derive an alternative estimate of total forecast capex against which
we compare the distributor’s total forecast capex. The information United Energy
provided in its regulatory proposal, including its response to our RIN, is a vital part of
our assessment. We also took into account information that United Energy provided in
response to our information requests, and submissions from other stakeholders.
Our assessment approach involves the following steps:
Our starting point for building an alternative estimate is the distributor’s regulatory
proposal.8 We apply our various assessment techniques, both qualitative and
quantitative, to assess the different elements of the distributor’s proposal. This
analysis informs our view on whether the distributor’s proposal reasonably reflects
the capex criteria in the NER at the total capex level.9 It also provides us with an
8 AER, Better regulation: Explanatory statement: Expenditure forecast assessment guideline, November 2013, p. 7;
see also AEMC, Final rule determination: National electricity amendment (Economic regulation of network service
providers) Rule 2012, 29 November 2012, pp. 111 and 112. 9 NER, cl. 6.5.7(c).
0
50
100
150
200
250
2011 2012 2013 2014 2015 2016 2017 2018 2019 2020
$m real 2015
actual capex estimate capex proposed capex
preliminary decision allowance

6-13 Attachment 6 – Capital expenditure | United Energy Preliminary decision 2016–20
alternative forecast that we consider meets the criteria. In arriving at our alternative
estimate, we weight the various techniques we used in our assessment. We give
more weight to techniques we consider are more robust in the particular
circumstances of the assessment.
Having established our alternative estimate of the total forecast capex, we can test
the distributor's total forecast capex. This includes comparing our alternative
estimate total with the distributor's total forecast capex and what the reasons for
any differences are. If there is a difference between the two, we may need to
exercise our judgement as to what is a reasonable margin of difference.
If we are satisfied the distributor's proposal reasonably reflects the capex criteria in
meeting the capex objectives, we will accept it. The capital expenditure objectives
(capex objectives) referred to in the capex criteria, are to:10
meet or manage the expected demand for standard control services over the period
comply with all regulatory obligations or requirements associated with the provision
of standard control services
to the extent that there are no such obligations or requirements, maintain service
quality, reliability and security of supply of standard control services and maintain
the reliability and security of the distribution system
maintain the safety of the distribution system through the supply of standard control
services.
If we are not satisfied, the NER requires us to put in place a substitute estimate that we
are satisfied reasonably reflects the capex criteria.11 Where we have done this, our
substitute estimate is based on our alternative estimate.
The capex criteria are:12
the efficient costs of achieving the capital expenditure objectives
the costs that a prudent operator would require to achieve the capital expenditure
objectives
a realistic expectation of the demand forecast and cost inputs required to achieve
the capital expenditure objectives.
The AEMC noted '[t]hese criteria broadly reflect the NEO [National Electricity
Objective]'.13 Importantly, we approve a total capex forecast and not particular
categories, projects or programs in the capex forecast. Our review of particular
10
NER, cl. 6.5.7(a). 11
NER, cl. 6.12.1(3)(ii). 12
NER, cl. 6.5.7(c). 13
AEMC, Final rule determination: National electricity amendment (Economic regulation of network service providers)
Rule 2012, 29 November 2012, p. 113.
6-14 Attachment 6 – Capital expenditure | United Energy Preliminary decision 2016–20
categories or projects informs our assessment of the total capex forecast. The AEMC
stated:14
It should be noted here that what the AER approves in this context is
expenditure allowances, not projects.
In deciding whether we are satisfied that United Energy’s proposed total forecast
capex reasonably reflects the capex criteria, we have regard to the capex factors.15 In
taking the capex factors into account, the AEMC noted:16
…this does not mean that every factor will be relevant to every aspect of every
regulatory determination the AER makes. The AER may decide that certain
factors are not relevant in certain cases once it has considered them.
Table 6.5 summarises how we took the capex factors into consideration.
More broadly, we note that in exercising our discretion, we take into account the
revenue and pricing principles set out in the NEL.17 In particular, we take into account
whether our overall capex forecast provides United Energy a reasonable opportunity to
recover at least the efficient costs it incurs in:
providing direct control network services; and
complying with its regulatory obligations and requirements.18
Expenditure Assessment Guideline
The rule changes the AEMC made in November 2012 required us to make and publish
an Expenditure Forecast Assessment Guideline for electricity distribution (Guideline).19
We released our Guideline in November 2013.20 The Guideline sets out our proposed
general approach to assessing capex (and opex) forecasts. The rule changes also
require us to set out our approach to assessing capex in the relevant framework and
approach paper. For United Energy, our framework and approach paper stated that we
would apply the Guideline, including the assessment techniques outlined in it.21 We
may depart from our Guideline approach and if we do so, we need to provide reasons.
In this determination, we have not departed from the approach set out in our Guideline.
14
AEMC, Final rule determination: National electricity amendment (Economic regulation of network service providers)
Rule 2012, 29 November 2012, p. vii. 15
NER, cl. 6.5.7(e). 16
AEMC, Final rule determination: National electricity amendment (Economic regulation of network service providers)
Rule 2012, 29 November 2012, p. 115. 17
NEL, ss. 7A and 16(2). 18
NEL, s. 7A. 19
AEMC, Final rule determination: National electricity amendment (Economic regulation of network service providers)
Rule 2012, 29 November 2012, p. 114. 20
AER, Better regulation: Expenditure forecast assessment guideline for electricity distribution, November 2013. 21
AER, Final Framework and approach for the Victorian Electricity Distributors: Regulatory control period
commencing 1 January 2016, 24 October 2014, pp. 119–120.

6-15 Attachment 6 – Capital expenditure | United Energy Preliminary decision 2016–20
We note that RIN data form part of a distributor's regulatory proposal.22 In our
Guideline we stated we would "require all the data that facilitate the application of our
assessment approach and assessment techniques". We also stated that the RIN we
issue in advance of a distributor lodging its regulatory proposal would specify the exact
information we require.23 Our Guideline made clear our intention to rely upon RIN data
during distribution determinations.
6.3.1 Building an alternative estimate of total forecast capex
The following section sets out the approach we apply to arrive at an alternative
estimate of total forecast capex.
Our starting point for building an alternative estimate is the distributor’s proposal.24 We
review the proposed forecast methodology and the key assumptions that underlie the
distributor's forecast. We also consider the distributor’s performance in the previous
regulatory control period to inform our alternative estimate.
We then apply our specific assessment techniques to develop an estimate and assess
the economic justifications that the distributor puts forward. Many of our techniques
encompass the capex factors that we are required to take into account. Appendix A
and appendix B contain further details on each of these techniques.
Some of these techniques focus on total capex, others focus on high level,
standardised sub-categories of capex. Importantly, while we may consider certain
projects and programs in forming a view on the total capex forecast, we do not
determine which projects or programs the distributor should or should not undertake.
This is consistent with the regulatory framework and the AEMC's statement that the
AER does not approve specific projects. Rather, we approve an overall revenue
requirement that includes an assessment of what we find to be an efficient total capex
forecast.25
We determine total revenue by reference to our analysis of the proposed capex and
the various building blocks. Once we approve total revenue, the distributor is able to
prioritise its capex program given its circumstances over the course of the regulatory
control period. The distributor may need to undertake projects or programs it did not
anticipate during the distribution determination. The distributor may also not require
some of the projects or programs it proposed for the regulatory control period. We
consider a prudent and efficient distributor would consider the changing environment
throughout the regulatory control period in its decision making.
22
NER, cll. 6.8.2(c2) and (d). 23
AER, Better regulation: Expenditure forecast assessment guideline for electricity distribution, November 2013,
p. 25. 24
AER, Better regulation: Explanatory statement: Expenditure forecast assessment guideline, November 2013, p. 7;
AEMC, Final rule determination: National electricity amendment (Economic regulation of network service providers)
Rule 2012, 29 November 2012, pp. 111 and 112. 25
AEMC, Final rule determination: National electricity amendment (Economic regulation of network service providers)
Rule 2012, 29 November 2012, p. vii.

6-16 Attachment 6 – Capital expenditure | United Energy Preliminary decision 2016–20
As we explained in our Guideline:26
Our assessment techniques may complement each other in terms of the
information they provide. This holistic approach gives us the ability to use all of
these techniques, and refine them over time. The extent to which we use each
technique will vary depending on the expenditure proposal we are assessing,
but we intend to consider the inter-connections between our assessment
techniques when determining total capex … forecasts. We typically would not
infer the findings of an assessment technique in isolation from other
techniques.
In arriving at our estimate, we weight the various techniques we used in our
assessment. We weight these techniques on a case by case basis using our
judgement. Broadly, we give more weight to techniques we consider are more robust in
the particular circumstances of the assessment. By relying on a number of techniques,
we ensure we consider a wide variety of information and can take a holistic approach
to assessing the distributor’s capex forecast.
Where our techniques involve the use of a consultant, we consider their reports as one
of the inputs to arriving at our preliminary decision on overall capex. Our preliminary
decision clearly sets out the extent we accept our consultants' findings. Where we
apply our consultants’ findings, we do so only after carefully reviewing their analysis
and conclusions, and evaluating these against outcomes of our other techniques and
our examination of United Energy’s proposal.
We also take into account the various interrelationships between the total forecast
capex and other components of a distributor's distribution determination. The other
components that directly affect the total forecast capex include:
forecast opex
forecast demand
the service target performance incentive scheme
the capital expenditure sharing scheme
real cost escalation
contingent projects.
We discuss how these components impact the total forecast capex in Table 6.4.
Underlying our approach are two general assumptions:
The capex criteria relating to a prudent operator and efficient costs are
complementary. Prudent and efficient expenditure reflects the lowest long-term
26
AER, Better regulation: Expenditure forecast assessment guideline for electricity distribution, November 2013,
p. 12.

6-17 Attachment 6 – Capital expenditure | United Energy Preliminary decision 2016–20
cost to consumers for the most appropriate investment or activity required to
achieve the expenditure objectives.27
Past expenditure was sufficient for the distributor to manage and operate its
network in past periods, in a manner that achieved the capex objectives.28
6.3.2 Comparing the distributor's proposal with our alternative
estimate
Having established our estimate of the total forecast capex, we can test the
distributor's proposed total forecast capex. This includes comparing our alternative
estimate of forecast total capex with the distributor's proposal. The distributor's forecast
methodology and its key assumptions may explain any differences between our
alternative estimate and its proposal.
As the AEMC foreshadowed, we may need to exercise our judgement in determining
whether any 'margin of difference' is reasonable:29
The AER could be expected to approach the assessment of a NSP's
expenditure (capex or opex) forecast by determining its own forecast of
expenditure based on the material before it. Presumably this will never match
exactly the amount proposed by the NSP. However there will be a certain
margin of difference between the AER's forecast and that of the NSP within
which the AER could say that the NSP's forecast is reasonable. What the
margin is in a particular case, and therefore what the AER will accept as
reasonable, is a matter for the AER exercising its regulatory judgment.
As noted above, we draw on a range of techniques, as well as our assessment of
elements that impact upon capex such as demand and real cost escalators.
Our decision on the total forecast capex does not strictly limit a distributor’s actual
spending. A distributor might spend more on capex than the total forecast capex
amount specified in our decision in response to unanticipated expenditure needs.
The regulatory framework has a number of mechanisms to deal with such
circumstances. Importantly, a distributor does not bear the full cost where unexpected
events lead to an overspend of the approved capex forecast. Rather, the distributor
bears 30 per cent of this cost if the expenditure is subsequently found to be prudent
27
AER, Better regulation: Expenditure forecast assessment guideline for electricity distribution, November 2013,
pp. 8 and 9. The Australian Competition Tribunal has previously endorsed this approach: see : Application by
Ergon Energy Corporation Limited (Non-system property capital expenditure) (No 4) [2010] ACompT 12;
Application by EnergyAustralia and Others [2009] ACompT 8; Application by Ergon Energy Corporation Limited
(Labour Cost Escalators) (No 3) [2010] ACompT 11; Application by DBNGP (WA) Transmission Pty Ltd (No 3)
[2012] ACompT 14; Application by United Energy Distribution Pty Limited [2012] ACompT 1; Re: Application by
ElectraNet Pty Limited (No 3) [2008] ACompT 3 ; Application by DBNGP (WA). 28
AER, Better regulation: Expenditure forecast assessment guideline for electricity distribution, November 2013, p. 9. 29
AEMC, Final rule determination: National electricity amendment (Economic regulation of network service providers)
Rule 2012, 29 November 2012, p. 112.
6-18 Attachment 6 – Capital expenditure | United Energy Preliminary decision 2016–20
and efficient. Further, the pass through provisions provide a means for a distributor to
pass on significant, unexpected capex to customers, where appropriate.30 Similarly, a
distributor may spend less than the capex forecast because they have been more
efficient than expected. In this case the distributor will keep on average 30 per cent of
this reduction over time.
We set our alternative estimate at the level where the distributor has a reasonable
opportunity to recover efficient costs. The regulatory framework allows the distributor to
respond to any unanticipated issues that arise during the regulatory control period. In
the event that this leads to the approved total revenue underestimating the total capex
required, the distributor should have sufficient flexibility to allow it to meet its safety and
reliability obligations by reallocating its budget. Conversely, if there is an
overestimation, the stronger incentives the AEMC put in place in 2012 should result in
the distributor only spending what is efficient. As noted, the distributor and consumers
share the benefits of the underspend and the costs of an overspend under the
regulatory regime.
6.4 Reasons for preliminary decision
We applied the assessment approach set out in section 6.3 to United Energy. We are
not satisfied United Energy's total forecast capex reasonably reflects the capex criteria.
We compared United Energy's capex forecast to the alternative capex forecast we
constructed using the approach and techniques outlined in appendices A and B. United
Energy's proposal is materially higher than ours. We are satisfied that our alternative
estimate reasonably reflects the capex criteria.
Table 6.3 sets out the capex amounts by driver that we included in our alternative
estimate of United Energy’s total forecast capex for the 2016–20 regulatory control
period.
30
NER, r. 6.6.

6-19 Attachment 6 – Capital expenditure | United Energy Preliminary decision 2016–20
Table 6.3 Our assessment of required capex by capex driver 2016–20
($2015, million)
Category 2016 2017 2018 2019 2020 Total
Augmentation 34.7 32.3 30.9 18.7 10.5 127.0
Connections 48.2 49.3 50.6 50.1 50.9 249.1
Replacement 82 85.7 86.9 83.3 76.1 413.9
Non-Network 22.7 27.5 23.3 26.5 34.5 134.6
Labour and materials
escalation adjustment -2.1 -4.7 -6.5 -3.4 -1.7 -18.4
Gross Capex (includes
capital contributions) 185.5 190.1 185.2 175.1 170.3 906.2
Capital Contributions 17.7 18.1 18.3 18.7 18.5 91.4
Net Capex (excluding
capital contributions) 167.8 172.0 166.9 156.4 151.7 814.8
Source: AER analysis.
Note: Numbers may not add up due to rounding.
We discuss our assessment of United Energy's forecasting methodology, key
assumptions and past capex performance in the sections below.
Our assessment of capex drivers are in appendices A and B. These set out the
application of our assessment techniques to the capex drivers, and the weighting we
gave to particular techniques. We used our reasoning in the appendices to form our
alternative estimate.
6.4.1 Key assumptions
The NER requires United Energy to include in its regulatory proposal the key
assumptions that underlie its proposed forecast capex. United Energy must also
provide a certification by its Directors that those key assumptions are reasonable.31
United Energy’s key assumptions are that:32
the maximum demand and customer growth is consistent with its forecasts set out
in chapter 9 of its regulatory proposal
the customer connection growth is consistent with its forecasts set out in chapter 9
of its regulatory proposal
31
NER, cll. S6.1.1.1(2), (4) and (5). 32
United Energy, Regulatory Proposal 2016–20, April 2015, p. 53.

6-20 Attachment 6 – Capital expenditure | United Energy Preliminary decision 2016–20
customers value reliability in accordance with the AEMO 2014 VCR survey, and it
is therefore appropriate to use:
o for augmentation and replacement capex on power transformers, a VCR
based on AEMO’s 2014 VCR survey results calculated on data specific to
the summer peak period; and
o for replacement capex on all other assets, a VCR based on AEMO’s 2014
VCR survey results calculated on data across all sectors and all seasons
the forecast capex will maintain, but not improve, network reliability; and
its current legislative and regulatory obligations will not change materially, other
than as identified in its regulatory proposal (being for Power of Choice, Energy
Safe Victoria Regulations, and the AER’s RIN reporting requirements).
We have assessed United Energy’s key assumptions in the appendices to this capex
attachment.
6.4.2 Forecasting methodology
The NER requires United Energy to inform us about the methodology it proposes to
use to prepare its forecast capex allowance before it submits its regulatory proposal.33
United Energy must include this information in its regulatory proposal.34
The key aspects of United Energy’s forecasting methodology include:35
United Energy consulted extensively with customers and other stakeholders in
order to obtain, consider and reflect their views and feedback into the initiatives
and projects underpinning its expenditure forecasts
United Energy’s capex forecasts are underpinned by capex governance
arrangements. These arrangements include internal review of United Energy’s
bottom up forecasts by various management expenditure committees prior to
seeking Board approval
United Energy’s capex forecasts are underpinned by an asset management
framework which is being revised to move toward compliance with ISO 55000. The
key aspects of this framework are:
o Asset Management Strategy – sets out the objectives and high level network
planning and management approach to achieving these objectives
o Asset Management Plans – these translate the Asset Management Strategy
and asset performance data into more detailed investment plans based on a
detailed understanding of the nature and condition of United Energy’s assets
33
NER, cll. 6.8.1A and 11.60.3(c). 34
NER, cl. S6.1.1(2). 35
United Energy, Regulatory Proposal 2016–20, April 2015, p. 42; United Energy, Expenditure forecasting
methodology, 30 May 2014.

6-21 Attachment 6 – Capital expenditure | United Energy Preliminary decision 2016–20
o Life Cycle Management Plans (Works Program) – these underpin the Asset
Management Plans at an individual asset or asset class level and provide
detailed work instructions on how to manage individual assets. They also
contain a work plan including volumes of work and how these volumes have
been derived.
We consider United Energy's forecasting methodology is generally reasonable. Where
we identified specific areas of concern, we discuss these in the appendices to this
capex attachment.
The Victorian Energy Consumer and Use Alliance (VECUA) considered the Victorian
distributors overly relied on bottom up methodologies with insufficient regard to top
down methods.36 Origin Energy supported the application of both a top down and
bottom up assessment:37
to demonstrate that a level of overall restraint has been brought to bear. This
dual exercise is necessary to ensure that forecast costs, including unit rates,
have not been overstated and that inter-relationships and synergies between
projects or areas of work which are more readily identified at a portfolio level
are adequately accounted for.
As we noted in previous determinations, the drawback of deriving a capex forecast
through a bottom-up assessment is it does not of itself provide sufficient evidence that
the estimate is efficient. Bottom up approaches tend to overstate required allowances
as they do not adequately account for inter-relationships and synergies between
projects or areas of work. In contrast, reviewing aggregated areas of expenditure or the
total expenditure, allows for an overall assessment of efficiency.38
6.4.3 Interaction with the STPIS
We consider that our approved capex forecast is consistent with the setting of targets
under the STPIS. In particular, we consider that the capex allowance should not be set
such that it would lead to United Energy systemically under or over performing against
its STPIS targets. We consider our approved capex forecast is sufficient to allow a
prudent and efficient United Energy to maintain performance at the targets set under
the STPIS. As such, it is appropriate to apply the STPIS as set out in attachment 11.
In making our preliminary decision, we have specifically considered the impact our
decision will have on the safety and reliability of United Energy’s network.
In its submission, the CCP noted the following explanation from the AEMC:39
36
VECUA, Submission: Victorian distribution networks’ 2016–20 revenue proposals, 13 July 2105, p. 19. 37
Origin Energy, Submission to Victorian electricity distributors regulatory proposals, 13 July 2015, p. 8. 38
For example, see AER, Preliminary decision: Ergon Energy determination 2015−16 to 2019−20: Attachment 6 −
Capital expenditure, April 2015, pp. 22–23. 39
CCP, Advice to the AER: AER’s Preliminary Decision for SA Power Networks for 2015-20 and SA Power Networks’
revised regulatory proposal, August 2015 p. 27.

6-22 Attachment 6 – Capital expenditure | United Energy Preliminary decision 2016–20
…operating and capital expenditure allowances for NSPs should be no more
than the level considered necessary to comply with the relevant regulatory
obligation or requirement, where these have been set by the body allocated to
that role. Expenditure by NSPs to achieve standards above these levels should
be unnecessary, as they are only required to deliver to the standards set. It
would also amount to the AER substituting a regulatory obligation or
requirement with its own views on the appropriate level of reliability, which
would undermine the role of the standard setting body, and create uncertainty
and duplication of roles.
NSPs are still free to make incremental improvements over and above the
regulatory requirements at their own discretion. Such additional expenditure will
not generally be recoverable, through forecast capital and operating
expenditure. However, DNSPs are also provided with annual financial
incentives to improve reliability performance under the STPIS.
We consider our substitute estimate is sufficient for United Energy to maintain the
safety, service quality and reliability of its network consistent with its obligations. Our
provision of a total capex forecast does not constrain a distributors actual spending –
either as a cap or as a requirement that the forecast be spent on specific projects or
activities. It is conceivable that a distributor might wish to expend particular capex
differently or in excess of the total capex forecast set out in our decision. However,
such additional expenditure is not included in our assessment of expenditure forecasts
as it is not required to meet the capex objectives. We consider the STPIS is the
appropriate mechanism to provide distributors with the incentive to improve reliability
performance where such improvements reflect value to the energy customer.
Under our analysis of specific capex drivers, we have explained how our analysis and
certain assessment techniques factor in safety and reliability obligations and
requirements.
6.4.4 United Energy’s capex performance
We have looked at a number of historical metrics of United Energy’s capex
performance against that of other distributors in the NEM. We also compare United
Energy’s proposed forecast capex allowance against historical trends. These metrics
are largely based on outputs of the annual benchmarking report and other analysis
undertaken using data provided by the distributors for the annual benchmarking report.
The report includes United Energy’s relative partial and multilateral total factor
productivity (MTFP) performance, capex per customer and maximum demand, and
United Energy’s historic capex trend.
We note that the NER set out that we must have regard to our annual benchmarking
report.40 This section shows how we have taken it into account. We consider this high
level benchmarking at the overall capex level is suitable to gain an overall
40
NER, cl. 6.5.7(e).

6-23 Attachment 6 – Capital expenditure | United Energy Preliminary decision 2016–20
understanding of United Energy’s proposal in a broader context. However, in our capex
assessment we have not relied on our high level benchmarking metrics set out below
other than to gain a high level insight into United Energy’s proposal. We have not used
this analysis deterministically in our capex assessment.
Partial factor productivity of capital and multilateral total factor
productivity
Figure 6.2 shows a measure of partial factor productivity of capital taken from our
benchmarking report. This measure incorporated the productivity of transformers,
overhead lines and underground cables. United Energy performs relatively well on this
measure, falling only behind CitiPower, and Jemena in 2012 and 2013.
Figure 6.2 Partial factor productivity of capital (transformers, overhead
and underground lines)
Source: AER, Electricity distribution network service providers: Annual benchmarking report, November 2014, p. 33.
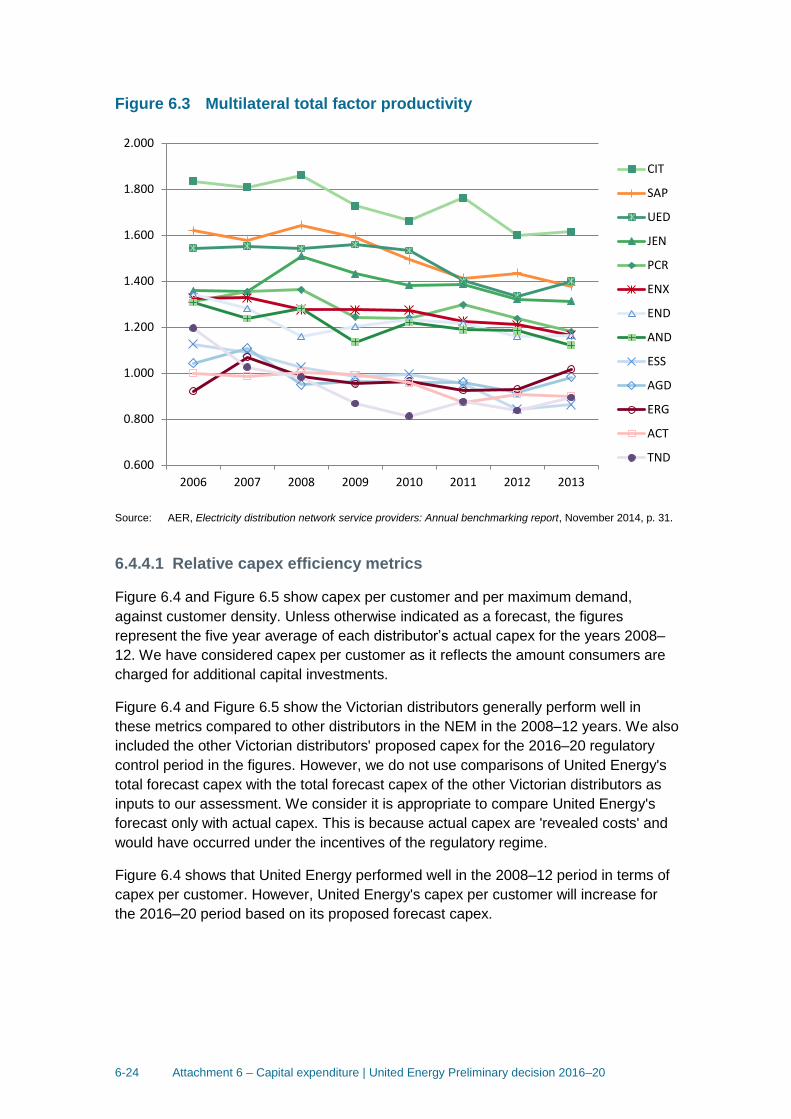
Figure 6.3 shows that United Energy ranks similarly on MTFP. MTFP measures how
efficient a business is in terms of its inputs (costs) and outputs (energy delivered,
customer numbers, ratcheted maximum demand, reliability and circuit line length).
United Energy is one of the top performers on this metric.
0.600
0.800
1.000
1.200
1.400
1.600
1.800
2.000
2006 2007 2008 2009 2010 2011 2012 2013
03CIT
13UED
08JEN
10SAP
05ENX
04END
11AND
06ERG
02AGD
09PCR
01ACT
07ESS
12TND
6-24 Attachment 6 – Capital expenditure | United Energy Preliminary decision 2016–20
Figure 6.3 Multilateral total factor productivity
Source: AER, Electricity distribution network service providers: Annual benchmarking report, November 2014, p. 31.
6.4.4.1 Relative capex efficiency metrics
Figure 6.4 and Figure 6.5 show capex per customer and per maximum demand,
against customer density. Unless otherwise indicated as a forecast, the figures
represent the five year average of each distributor’s actual capex for the years 2008–
12. We have considered capex per customer as it reflects the amount consumers are
charged for additional capital investments.
Figure 6.4 and Figure 6.5 show the Victorian distributors generally perform well in
these metrics compared to other distributors in the NEM in the 2008–12 years. We also
included the other Victorian distributors' proposed capex for the 2016–20 regulatory
control period in the figures. However, we do not use comparisons of United Energy's
total forecast capex with the total forecast capex of the other Victorian distributors as
inputs to our assessment. We consider it is appropriate to compare United Energy's
forecast only with actual capex. This is because actual capex are 'revealed costs' and
would have occurred under the incentives of the regulatory regime.
Figure 6.4 shows that United Energy performed well in the 2008–12 period in terms of
capex per customer. However, United Energy's capex per customer will increase for
the 2016–20 period based on its proposed forecast capex.
0.600
0.800
1.000
1.200
1.400
1.600
1.800
2.000
2006 2007 2008 2009 2010 2011 2012 2013
CIT
SAP
UED
JEN
PCR
ENX
END
AND
ESS
AGD
ERG
ACT
TND

6-25 Attachment 6 – Capital expenditure | United Energy Preliminary decision 2016–20
Figure 6.4 Capex per customer (000s, $2013–14), against customer
density
Source: AER analysis.
Figure 6.5 shows that United Energy performed well in 2008–12 in terms of capex per
maximum demand. Again capex per maximum demand is forecast to increase for
United Energy in the next period.
ActewAGL
AusGrid
CitiPower
Endeavour Energy
Energex
Ergon EnergyEssential Energy
JemenaPowercor
SA Power Networks
AusNet ServicesTasNetworks
United Energy
CitiPower forecast
Jemena forecast
Powercor forecast
AusNet Services forecast
United Energy forecast
0
0.05
0.1
0.15
0.2
0.25
0.3
0.35
0.4
0.45
0.5
0.55
0.6
0.65
0.7
0.75
0.8
0.85
0.9
0.95
1
0 10 20 30 40 50 60 70 80 90 100 110
Cap
ex p
er
cust
om
er
Customer density

6-26 Attachment 6 – Capital expenditure | United Energy Preliminary decision 2016–20
Figure 6.5 Capex per maximum demand (000s, $2013–14), against
customer density
Source: AER analysis.
The Consumer Utilities Advocacy Centre (CUAC) expressed concern about the large
increases in capex some Victorian distributors proposed and the decline in productivity
in recent years.41
The Victorian Greenhouse Alliances (VGA) noted the increases in the capex forecast
of the Victorian distributors. The VGA considered the increased capex forecasts were
concerning given over-investment over recent regulatory periods has led to excess
levels of network capacity and declining network utilisation. The VGA also expressed
concern that the Victorian distributors proposed such high levels of capex at a time
of:42
declining capacity utilisation
reduced average asset age for most asset categories
static or falling demand and consumption
41
CUAC, Submission: Victorian electricity distribution pricing review (EDPR) 2016 to 2020, 13 July 2015, p. 2. 42
VGA, Submission: Local Government response to the Victorian electricity distribution price review (EDPR) 2016–
20, July 2015, p. 33.
ActewAGL
AusGrid
CitiPower
Endeavour Energy
Energex
Ergon Energy
Essential Energy
Jemena
Powercor
SA Power Networks
AusNet Services
TasNetworks
United Energy
CitiPower forecast
Jemena forecast
Powercor forecast
AusNet Services forecast
United Energy forecast
$0
$50
$100
$150
$200
$250
$300
$350
0 10 20 30 40 50 60 70 80 90 100 110
Cap
ex p
er M
axim
um
dem
and
Customer density

6-27 Attachment 6 – Capital expenditure | United Energy Preliminary decision 2016–20
reductions in the reliability standards.
The Department of Economic Development, Jobs, Transport and Resources
(DEDJTR) and the VECUA made similar points in their submissions.43 We considered
these factors into detail in our assessment of capex drivers (see appendix B). For
example, we made reductions to the capex forecast as we do not consider United
Energy's demand forecast is realistic (see appendix B.2).
Appendix B details our assessment of United Energy's capex categories. These
assessments, along with the high level analysis in this section 6.4.4, were inputs into
our preliminary decision on United Energy's total capex for the 2016–20 regulatory
control period. We consider our assessment results in a total capex forecast that is
largely consistent with the submissions received. Figure 6.1 shows our preliminary
decision capex forecast is 16 per cent lower than United Energy's actual capex in the
2011–15 regulatory control period. By comparison, United Energy's proposed capex is
14 per cent higher than its actual capex for the 2011–15 regulatory control period.
To arrive at our preliminary decision, we considered the issues noted in these
submissions, such as lower demand and declining utilisation in the network. For
example, we consider United Energy's demand forecast does not reflect a realistic
expectation of demand over 2016–20 and substituted a lower demand forecast (see
appendix C). Our assessment of United Energy's augex forecast reflects this lower
demand forecast (see section B.2). Importantly, our assessment considered many
other factors such as asset age and condition. We discuss these, and other issues
relevant to United Energy's capex proposal, in detail in appendix B.
United Energy’s historic capex trends
We have compared United Energy’s capex proposal for the 2016–20 regulatory control
period against the long term historical trend in capex levels.
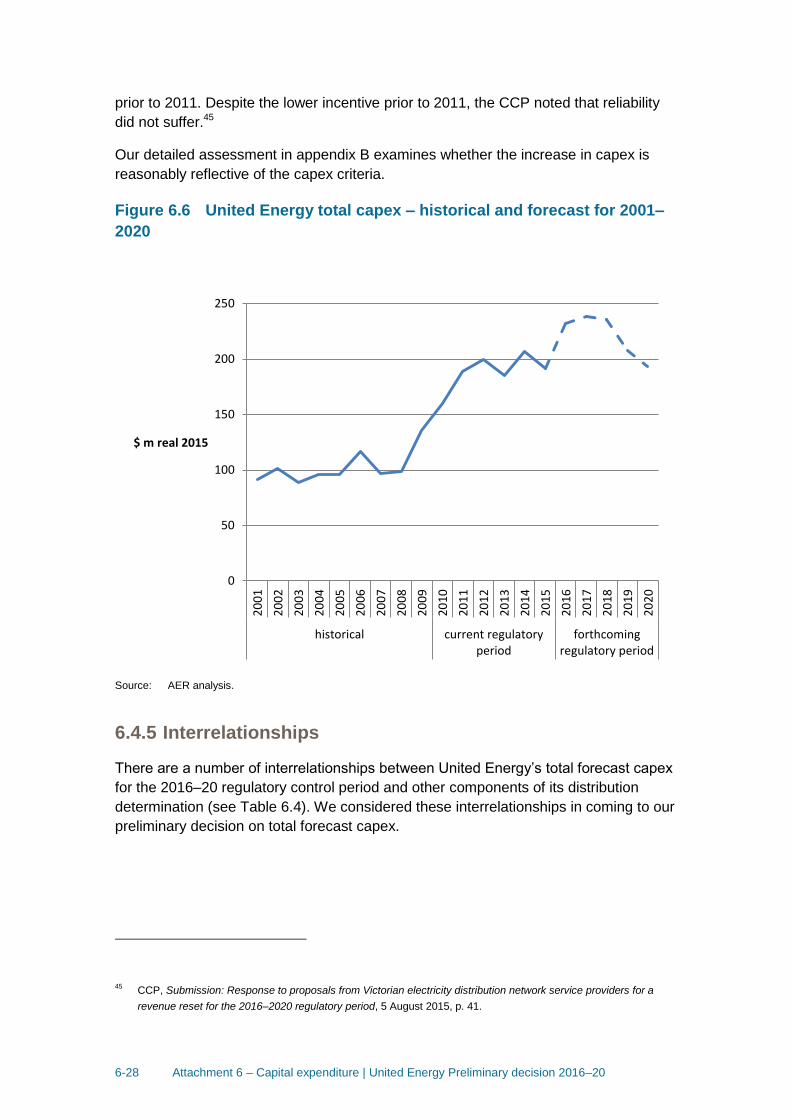
Figure 6.6 shows actual historic capex and proposed capex between 2001 and 2020.
This figure shows that United Energy’s forecast is significantly higher than historical
levels (actual spend), particularly for the first 3 years of the regulatory control period.
We note that United Energy’s capex falls towards the end of the regulatory control
period.
The Consumer Challenge Panel (CCP) noted capex in the current period occurred
under the 'old' National Electricity Rules, which the CCP considered overtly
incentivised investment.44 The CCP further noted the NER did not apply in Victoria
43
DEDJTR, Submission to Victorian electricity distribution pricing review – 2016 to 2020, 13 July 2015, p. 6; VECUA,
Submission: Victorian distribution networks’ 2016–20 revenue proposals, 13 July 2105, pp. 6 and 18. 44
That is, prior the AEMC's changes to the NER in November 2012.
6-28 Attachment 6 – Capital expenditure | United Energy Preliminary decision 2016–20
prior to 2011. Despite the lower incentive prior to 2011, the CCP noted that reliability
did not suffer.45
Our detailed assessment in appendix B examines whether the increase in capex is
reasonably reflective of the capex criteria.
Figure 6.6 United Energy total capex – historical and forecast for 2001–
2020
Source: AER analysis.
6.4.5 Interrelationships
There are a number of interrelationships between United Energy’s total forecast capex
for the 2016–20 regulatory control period and other components of its distribution
determination (see Table 6.4). We considered these interrelationships in coming to our
preliminary decision on total forecast capex.
45
CCP, Submission: Response to proposals from Victorian electricity distribution network service providers for a
revenue reset for the 2016–2020 regulatory period, 5 August 2015, p. 41.
0
50
100
150
200
250
20
01
20
02
20
03
20
04
20
05
20
06
20
07
20
08
20
09
20
10
20
11
20
12
20
13
20
14
20
15
20
16
20
17
20
18
20
19
20
20
historical current regulatoryperiod
forthcomingregulatory period
$ m real 2015

6-29 Attachment 6 – Capital expenditure | United Energy Preliminary decision 2016–20
Table 6.4 Interrelationships between total forecast capex and other
components
Other component Interrelationships with total forecast capex
Total forecast opex
There are elements of United Energy's total forecast opex that are specifically related to its
total forecast capex. These include the forecast labour price growth that we included in our
opex forecast in Attachment 7. This is because the price of labour affects both total forecast
capex and total forecast opex.
More generally, we note our total opex forecast will provide United Energy with sufficient opex
to maintain the reliability of its network. Although we do not approve opex on specific
categories of opex such as maintenance, the total opex we approve will in part influence the
repex United Energy needs to spend during the 2016–20 period.
Forecast demand
Forecast demand is related to United Energy's total forecast capex. Growth driven capex,
which includes augex and customer connections capex, is typically triggered by a need to
build or upgrade a network to address changes in demand or to comply with quality, reliability
and security of supply requirements. Hence, the main driver of growth-related capex is
maximum demand and its effect on network utilisation and reliability.
Capital Expenditure
Sharing Scheme
(CESS)
The CESS is related to United Energy's total forecast capex. In particular, the effective
application of the CESS is contingent on the approved total forecast capex being efficient, and
that it reasonably reflects the capex criteria. As we note in the capex criteria table below, this
is because any efficiency gains or losses are measured against the approved total forecast
capex. In addition, in future distribution determinations we will be required to undertake an ex
post review of the efficiency and prudency of capex, with the option to exclude any inefficient
capex in excess of the approved total forecast capex from United Energy's regulatory asset
base. In particular, the CESS will ensure that United Energy bears at least 30 per cent of any
overspend against the capex allowance. Similarly, if United Energy can fulfil their objectives
without spending the full capex allowance, it will be able to retain 30 per cent of the benefit of
this. In addition, if an overspend is found to be inefficient through the ex post review, United
Energy risks having to bear the entire overspend.
Service Target
Performance
Incentive Scheme
(STPIS)
The STPIS is interrelated to United Energy's total forecast capex, in so far as it is important
that it does not include any expenditure for the purposes of improving supply reliability during
the 2016–20 regulatory control period. This is because such expenditure should be offset by
rewards provided through the application of the STPIS.
Further, the forecast capex should be sufficient to allow United Energy to maintain
performance at the targets set under the STPIS. The capex allowance should not be set such
that there is an expectation that it will lead to United Energy systematically under or over
performing against its targets.
Contingent project
A contingent project is interrelated to United Energy's total forecast capex. This is because an
amount of expenditure that should be included as a contingent project should not be included
as part of United Energy's total forecast capex for the 2016–20 regulatory control period.
We did not identify any contingent projects for United Energy during the 2016–20 period.
Source: AER analysis.
6.4.6 Consideration of the capex factors
As we discussed in section 6.3, we took the capex factors into consideration when
assessing United Energy's total capex forecast.46 Table 6.5 summarises how we have
taken into account the capex factors. Where relevant, we also had regard to the capex
46
NER, cll. 6.5.7(c), (d) and (e).

6-30 Attachment 6 – Capital expenditure | United Energy Preliminary decision 2016–20
factors in assessing the forecast capex associated with its underlying capex drivers
such as repex, augex and so on (see appendix B).
Table 6.5 AER consideration of the capex factors
Capex factor AER consideration
The most recent annual benchmarking report and
benchmarking capex that would be incurred by an
efficient distributor over the relevant regulatory
control period
We had regard to our most recent benchmarking report in
assessing United Energy's proposed total forecast capex and in
determining our alternative estimate for the 2016–20 regulatory
control period. This can be seen in the metrics we used in our
assessment of United Energy's capex performance.
The actual and expected capex of United Energy
during any preceding regulatory control periods
We had regard to United Energy's actual and expected capex
during the 2011–15 and preceding regulatory control periods in
assessing its proposed total forecast.
This can be seen in our assessment of United Energy's capex
performance. It can also be seen in our assessment of the
forecast capex associated with the capex drivers that underlie
United Energy's total forecast capex.
For some elements of non-network, augex and connections
capex, we rely on trend analysis to arrive at an estimate that
meets the capex criteria.
The extent to which the capex forecast includes
expenditure to address concerns of electricity
consumers as identified by United Energy in the
course of its engagement with electricity
consumers
We had regard to the extent to which United Energy's proposed
total forecast capex includes expenditure to address consumer
concerns that United Energy identified. United Energy has
undertaken engagement with its customers and presented high
level findings regarding its customer preferences. These findings
suggest that consumers value affordability and reliable networks.
The relative prices of operating and capital inputs
We had regard to the relative prices of operating and capital
inputs in assessing United Energy's proposed real cost
escalation factors. In particular, we have not accepted United
Energy’s proposal to apply real cost escalation for labour and
materials.
The substitution possibilities between operating
and capital expenditure
We had regard to the substitution possibilities between opex and
capex. We considered whether there are more efficient and
prudent trade-offs in investing more or less in capital in place of
ongoing operations. See our discussion about the
interrelationships between United Energy's total forecast capex
and total forecast opex in Table 6.4 above.
Whether the capex forecast is consistent with any
incentive scheme or schemes that apply to United
Energy
We had regard to whether United Energy's proposed total
forecast capex is consistent with the CESS and the STPIS. See
our discussion about the interrelationships between United
Energy's total forecast capex and the application of the CESS
and the STPIS in Table 6.4 above.
The extent to which the capex forecast is referable
to arrangements with a person other than the
distributor that do not reflect arm's length terms
We had regard to whether any part of United Energy's proposed
total forecast capex or our alternative estimate is referable to
arrangements with a person other than United Energy that do not
reflect arm's length terms. We do not have evidence to indicate
that any of United Energy’s arrangements do not reflect arms
length terms.
Whether the capex forecast includes an amount
relating to a project that should more appropriately
be included as a contingent project
We had regard to whether any amount of United Energy's
proposed total forecast capex or our alternative estimate relates
to a project that should more appropriately be included as a
contingent project. We did not identify any such amounts that
should more appropriately be included as a contingent project.

6-31 Attachment 6 – Capital expenditure | United Energy Preliminary decision 2016–20
Capex factor AER consideration
The extent to which United Energy has considered
and made provision for efficient and prudent non-
network alternatives
We had regard to the extent to which United Energy made
provision for efficient and prudent non-network alternatives as
part of our assessment. In particular, we considered this within
our review of United Energy’s augex proposal.
Any other factor the AER considers relevant and
which the AER has notified United Energy in
writing, prior to the submission of its revised
regulatory proposal, is a capex factor
We did not identify any other capex factor that we consider
relevant.
Source: AER analysis.
6-32 Attachment 6 – Capital expenditure | United Energy Preliminary decision 2016–20
A Assessment techniques
This appendix describes the assessment approaches we applied in assessing United
Energy’s proposed forecast capex. We used a variety of techniques to determine
whether the United Energy total forecast capex reasonably reflects the capex criteria.
Appendix B sets out in greater detail the extent to which we relied on each of the
assessment techniques.
The assessment techniques that we apply in capex are necessarily different from those
we apply in the assessment of opex. This is reflective of differences in the nature of the
expenditure we are assessing. As such, we use some assessment techniques in our
capex assessment that are not suitable for assessing opex and vice versa. We set this
out in our expenditure assessment guideline, where we stated:47
Past actual expenditure may not be an appropriate starting point for capex
given it is largely non-recurrent or 'lumpy', and so past expenditures or work
volumes may not be indicative of future volumes. For non-recurrent
expenditure, we will attempt to normalise for work volumes and examine per
unit costs (including through benchmarking across distributors) when forming a
view on forecast unit costs.
Other drivers of capex (such as replacement expenditure and connections
works) may be recurrent. For such expenditure, we will attempt to identify
trends in revealed volumes and costs as an indicator of forecast requirements.
Below we set out the assessment techniques we used to asses United Energy’s capex.
A.1 Economic benchmarking
Economic benchmarking is one of the key outputs of our annual benchmarking report.
The NER requires us to consider the annual benchmarking report as it is one of the
capex factors.48 Economic benchmarking applies economic theory to measure the
efficiency of a distributor's use of inputs to produce outputs, having regard to
environmental factors.49 It allows us to compare the performance of a distributor
against its own past performance, and the performance of other distributors. Economic
benchmarking helps us to assess whether a distributor's capex forecast represents
efficient costs.50 As the AEMC stated, 'benchmarking is a critical exercise in assessing
the efficiency of a NSP'.51
A number of economic benchmarks from the annual benchmarking report are relevant
to our assessment of capex. These include measures of total cost efficiency and
47
AER, Better regulation: Expenditure forecast assessment guideline for electricity distribution, November 2013, p. 8. 48
NER, cl. 6.5.7(e)(4). 49
AER, Better regulation: Explanatory statement: Expenditure forecasting assessment guidelines, November 2013. 50
NER, cl. 6.5.7(c). 51
AEMC, Final rule determination: National electricity amendment (Economic regulation of network service providers)
Rule 2012, 29 November 2012, p. 25.

6-33 Attachment 6 – Capital expenditure | United Energy Preliminary decision 2016–20
overall capex efficiency. In general, these measures calculate a distributor's efficiency
with consideration given to its inputs, outputs and its operating environment. We
considered each distributor's operating environment in so far as there are factors
outside of a distributor's control that affect its ability to convert inputs into outputs.52
Once such exogenous factors are taken into account, we expect distributors to operate
at similar levels of efficiency. One example of an exogenous factor we took into
account is customer density. For more on how we derived these measures, see our
annual benchmarking report.53
In addition to the measures in the annual benchmarking report, we considered how
distributors performed on a number of overall capex metrics, including capex per
customer, and capex per maximum demand. We calculated these economic
benchmarks using actual data from the previous regulatory control period.
The results from economic benchmarking give an indication of the relative efficiency of
each of the distributors, and how this has changed over time.
A.2 Trend analysis
We considered past trends in actual and forecast capex as this is one of the capex
factors under the NER.54
Trend analysis involves comparing a distributor's forecast capex and work volumes
against historical levels. Where forecast capex and volumes are materially different to
historical levels, we seek to understand the reasons for these differences. In doing so,
we consider the reasons the distributor provides in its proposal, as well as changes in
the circumstances of the distributor.
In considering whether the total forecast capex reasonably reflects the capex criteria,
we need to consider whether the forecast will allow the distributor to meet expected
demand, and comply with relevant regulatory obligations.55 Demand and regulatory
obligations (specifically, service standards) are key drivers of capex. More onerous
standards will increase capex, as will growth in maximum demand. Conversely,
reduced service obligations or a decline in demand will likely cause a reduction in the
amount of capex the distributor requires.
Maximum demand is a key driver of augmentation or demand driven expenditure.
Augmentation often needs to occur prior to demand growth being realised. Hence,
forecast rather than actual demand is relevant when a business is deciding the
augmentation projects it will require in an upcoming regulatory control period. To the
extent actual demand differs from forecast, however, a business should reassess the
52
AEMC, Final rule determination: National electricity amendment (Economic regulation of network service providers)
Rule 2012, 29 November 2012, p. 113. Exogenous factors could include geographic factors, customer factors,
network factors and jurisdictional factors. 53
AER, Electricity distribution network service providers: Annual benchmarking report, November 2014. 54
NER, cl. 6.5.7(e)(5). 55
NER, cl. 6.5.7(a)(3).
6-34 Attachment 6 – Capital expenditure | United Energy Preliminary decision 2016–20
need for the projects. Growth in a business' network will also drive connections related
capex. For these reasons it is important to consider how trends in capex (in particular,
augex and connections) compare with trends in demand (and customer numbers).
For service standards, there is generally a lag between when capex is undertaken (or
not) and when the service improves (or declines). This is important when considering
the expected impact of an increase or decrease in capex on service levels. It is also
relevant to consider when service standards have changed and how this has affected
the distributor's capex requirements.
We looked at trends in capex across a range of levels including at the total capex level,
and the category level (such as growth related capex, and repex) as relevant. We also
compared these with trends in demand and changes in service standards over time.
A.3 Category analysis
Expenditure category analysis allows us to compare expenditure across NSPs, and
over time, for various levels of capex. The comparisons we perform include:
overall costs within each category of capex
unit costs, across a range of activities
volumes, across a range of activities
asset lives, across a range of asset classes which we use in assessing repex.
Using standardised reporting templates, we collected data on augex, repex,
connections, non-network capex, overheads and demand forecasts for all distributors
in the NEM. The use of standardised category data allows us to make direct
comparisons across distributors. Standardised category data also allows us to identify
and scrutinise different operating and environmental factors that affect the amount and
cost of works performed by distributors, and how these factors may change over time.
A.4 Predictive modelling
Predictive modelling uses statistical analysis to determine the expected efficient costs
over the regulatory control period associated with the demand for electricity services
for different categories of works. We have two predictive models:
the repex model
the augex model (used in a qualitative sense).
The use of the repex and augex models is directly relevant to assessing whether a
distributor's capex forecast reasonably reflects the capex criteria.56 The models draw
56
NER, cl. 6.5.7(c).
6-35 Attachment 6 – Capital expenditure | United Energy Preliminary decision 2016–20
on actual capex the distributor incurred during the preceding regulatory control period.
This past capex is a factor that we must take into account.57
The repex model is a high-level probability based model that forecasts asset
replacement capex (repex) for various asset categories based on their condition (using
age as a proxy), and unit costs. If we consider a distributor’s proposed repex does not
conform to the capex criteria, we use the repex model (in combination with other
techniques where appropriate) to generate a substitute forecast.
The augex model compares utilisation thresholds with forecasts of maximum demand
to identify the parts of a network segment that may require augmentation.58 The model
then uses capacity factors to calculate required augmentation, and unit costs to derive
an augex forecast for the distributor over a given period.59 In this way, the augex model
accounts for the main internal drivers of augex that may differ between distributors,
namely peak demand growth and its impact on asset utilisation. We can use the augex
model to identify general trends in asset utilisation over time as well as to identify
outliers in a distributor's augex forecast.60
For our preliminary decision we have relied on input data for the augex model to review
forecast utilisation of individual zone substations to assess whether augmentation may
be necessary to alleviate capacity constraints. We use this analysis both as a starting
point for our further detailed evaluation, and as a cross-check on our overall augex
estimate. We have not otherwise used the augex model in our assessment of United
Energy’s augex forecast.
A.5 Engineering review
We drew on engineering and other technical expertise within the AER to assist with our
review of United Energy’s capex proposals.61 We also relied on the technical review of
our consultant, Energeia, to assist with our review of distributors' capex proposals.
These involved reviewing United Energy’s processes, and specific projects and
programs of work.
Appendix B discusses in detail our consideration of these reviews in our assessment of
United Energy’s capex forecast.
Origin Energy submitted the AER must continue to apply technical assessments in
concert with its benchmarking techniques to ensure a prudent balance between asset
risk and input costs.62
57
NER, cl. 6.5.7(e)(5). 58
Asset utilisation is the proportion of the asset's capability under use during peak demand conditions. 59
For more information, see: AER, Guidance document: AER augmentation model handbook, November 2013. 60
AER, 'Meeting summary – distributor replacement and augmentation capex', Workshop 4: Category analysis work-
stream – Replacement and demand driven augmentation (Distribution), 8 March 2013, p. 1. 61
AER, Better regulation: Explanatory statement: Expenditure forecast assessment guideline, November 2013, p. 86. 62
Origin Energy, Submission to Victorian electricity distributors regulatory proposals, 13 July 2015, p. 1.

6-36 Attachment 6 – Capital expenditure | United Energy Preliminary decision 2016–20
B Assessment of capex drivers
We present our detailed analysis of the sub-categories of United Energy’s forecast
capex for the 2016–20 regulatory control period in this appendix. These sub-categories
reflect the drivers of forecast capex over the 2016–20 period. These drivers are
augmentation capex (augex), customer connections capex, replacement capex
(repex), reliability improvement capex, capitalised overheads and non-network capex.
As we discuss in the capex attachment, we are not satisfied that United Energy’s
proposed total forecast capex reasonably reflects the capex criteria. In this appendix
we set out further analysis in support of this view. This further analysis also explains
the basis for our alternative estimate of United Energy’s total forecast capex that we
are satisfied reasonably reflects the capex criteria. In coming to our views and our
alternative estimate we have applied the assessment techniques that we discuss in
appendix A.
This appendix sets out our findings and views on each sub-category of capex. The
structure of this appendix is:
Section B.1 Alternative estimate
Section B.2 AER findings and estimates for augmentation expenditure
Section B.3 Forecast customer connections capex, including capital contributions
Section B.4 Forecast repex
Section B.5 Victorian Bushfires Royal Commission
Section B.6 Forecast non–network capex.
In each of these sections, we examine sub-categories of capex which we include in our
alternative estimate. For each such sub-category, we explain why we are satisfied the
amount of capex that we include in our alternative estimate reasonably reflects the
capex criteria.
B.1 Alternative estimate
Having examined United Energy’s proposal, we formed a view on our alternative
estimate of the capex required to reasonably reflect the capex criteria. Our alternative
estimate is based on our assessment techniques, explained in section 6.3 and
appendix A. Our weighting of each of these techniques, and our response to United
Energy’s submissions on the weighting that should be given to particular techniques, is
set out under the capex drivers in appendix B.
We are satisfied that our alternative estimate reasonably reflects the capex criteria.

6-37 Attachment 6 – Capital expenditure | United Energy Preliminary decision 2016–20
B.2 AER findings and estimates for augmentation expenditure
Augmentation is typically triggered by the need to build or upgrade the network to
address changes in demand and network utilisation. However, it can also triggered by
the need to upgrade the network to comply with quality, safety, reliability and security
of supply requirements.
United Energy proposed a forecast of $166.5 million ($2015) for augmentation capex
(augex), excluding overheads. This is an 8.7 per cent decrease compared to actual
augex incurred in the 2010–15 regulatory control period. Table 6.6 sets out the
components of United Energy’s augex forecast.
Table 6.6 United Energy’s proposed augex ($2015, million, excluding
overheads)
Augex category 2016 2017 2018 2019 2020 Total
Zone substation and sub-
transmission projects 12.1 14.4 21.5 23.1 12.5 83.6
HV feeders augmentation 11.4 6.0 5.1 3.3 3.5 29.3
Distribution system
augmentation 11.2 11.8 11.2 10.5 8.9 53.7
Total augex proposal 34.7 32.3 37.8 36.9 24.9 166.5
Source: United Energy reset RIN; United Energy regulatory proposal; United Energy response to AER 018.
Note: Numbers may not add up due to rounding.
Our estimate of required augex for United Energy for the 2016–20 period is $127
million ($2015), a reduction of 24 percent on United Energy’s proposal. We accept that
a large proportion of United Energy’s augex proposal reasonably reflects the capex
criteria. However, we consider that United Energy’s proposed augex forecast, in total,
does not all reasonably reflect the capex criteria. This is because United Energy
forecasts of maximum demand and inputs into its network planning framework are
likely overstated, which has the effect of inflating its augex forecast. We are satisfied
that our estimate of required augex, when combined with the rest of our capex
decision, reasonably reflects the capex criteria over the 2016–20 period.
We have formed this view by reviewing all of the material submitted by United Energy
in its regulatory proposal and in response to requests for further information, and
stakeholder views from submissions. Our review used a combination of top-down and
bottom-up assessment techniques to estimate the efficient and prudent capex that
Untied Energy will require to meet its obligations given expected demand growth and
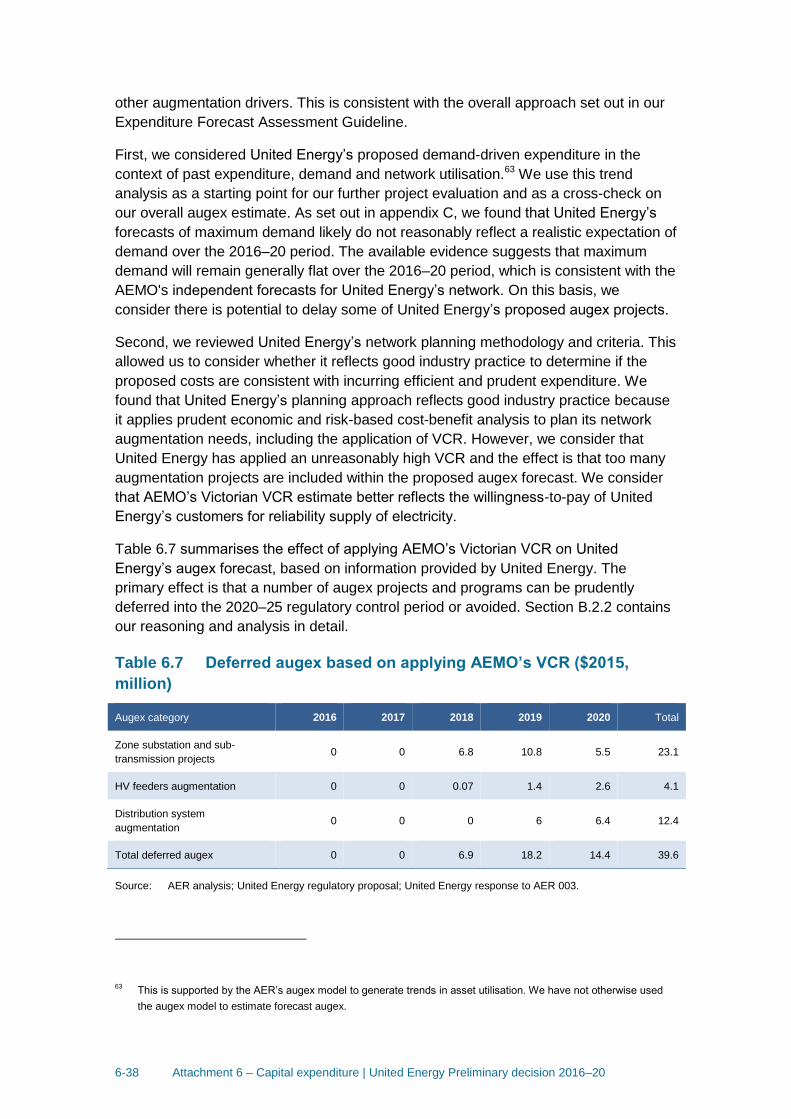
6-38 Attachment 6 – Capital expenditure | United Energy Preliminary decision 2016–20
other augmentation drivers. This is consistent with the overall approach set out in our
Expenditure Forecast Assessment Guideline.
First, we considered United Energy’s proposed demand-driven expenditure in the
context of past expenditure, demand and network utilisation.63 We use this trend
analysis as a starting point for our further project evaluation and as a cross-check on
our overall augex estimate. As set out in appendix C, we found that United Energy’s
forecasts of maximum demand likely do not reasonably reflect a realistic expectation of
demand over the 2016–20 period. The available evidence suggests that maximum
demand will remain generally flat over the 2016–20 period, which is consistent with the
AEMO's independent forecasts for United Energy’s network. On this basis, we
consider there is potential to delay some of United Energy’s proposed augex projects.
Second, we reviewed United Energy’s network planning methodology and criteria. This
allowed us to consider whether it reflects good industry practice to determine if the
proposed costs are consistent with incurring efficient and prudent expenditure. We
found that United Energy’s planning approach reflects good industry practice because
it applies prudent economic and risk-based cost-benefit analysis to plan its network
augmentation needs, including the application of VCR. However, we consider that
United Energy has applied an unreasonably high VCR and the effect is that too many
augmentation projects are included within the proposed augex forecast. We consider
that AEMO’s Victorian VCR estimate better reflects the willingness-to-pay of United
Energy’s customers for reliability supply of electricity.
Table 6.7 summarises the effect of applying AEMO’s Victorian VCR on United
Energy’s augex forecast, based on information provided by United Energy. The
primary effect is that a number of augex projects and programs can be prudently
deferred into the 2020–25 regulatory control period or avoided. Section B.2.2 contains
our reasoning and analysis in detail.
Table 6.7 Deferred augex based on applying AEMO’s VCR ($2015,
million)
Augex category 2016 2017 2018 2019 2020 Total
Zone substation and sub-
transmission projects 0 0 6.8 10.8 5.5 23.1
HV feeders augmentation 0 0 0.07 1.4 2.6 4.1
Distribution system
augmentation 0 0 0 6 6.4 12.4
Total deferred augex 0 0 6.9 18.2 14.4 39.6
Source: AER analysis; United Energy regulatory proposal; United Energy response to AER 003.
63
This is supported by the AER’s augex model to generate trends in asset utilisation. We have not otherwise used
the augex model to estimate forecast augex.

6-39 Attachment 6 – Capital expenditure | United Energy Preliminary decision 2016–20
Third, we undertook a more detailed technical review of a sample of United Energy’s
major augex projects and programs. This informs our overall review by assessing
whether United Energy adopts efficient design, costs and timing for its major projects
so that the costs reflect the efficient costs that a prudent operator would require to
achieve the capex objectives. We also consider the application and impact of
maximum demand forecasts and VCR for the specific projects we reviewed.
In undertaking our review of United Energy’s network planning methodology and the
sample of its major projects, we draw on engineering and other technical expertise
within the AER.
Table 6.8 sets out our alternative estimate of United Energy’s augex forecast. We have
calculated our alternative estimate of augex by adjusting United Energy’s proposed
augex forecast to exclude the capex that will be deferred using AEMO’s VCR estimate.
We have not made any other adjustments to United Energy’s augex forecast. However
we consider that our trend analysis and project technical reviews support our
alternative estimate. In particular:
The proposed augex for the Doncaster, Mornington and Carrum Downs zone
substations (including the new Skye zone substation and sub-transmission line)
would be deferred by applying AEMO’s VCR estimate. Similarly, the forecast
utilisation of these zone substations will be lower under a realistic demand forecast.
This suggests that proposed augmentation of these zone substations (and
associated sub-transmission lines) can be deferred or avoided under both a lower
VCR and lower forecast of maximum demand.
Some of the proposed augex for feeders and distribution transformers will be
deferred by applying AEMO’s VCR estimate. The proposed augex for these
feeders and distribution transformers is also driven by forecast utilisation of these
assets. A reduction in demand forecasts will reduce asset utilisation and allow
some augmentation to be deferred or avoided. This suggests that some of the
proposed augmentation of feeders and distribution transformer can be deferred or
avoided under both a lower VCR and lower forecast of maximum demand.
United Energy’s proposal submitted that network reliability will decrease if it defers
augmentation projects based on AEMO’s VCR. It submitted that because of this it
would not be complying with clause 6.5.7(a) of the NER which requires it to submit a
capex forecast that maintains current levels of reliability.
For the reasons set out in section B.2.2 below, we consider that this amount of capex
(as included within our alternative estimate) will enable United Energy to satisfy its
regulatory obligation under clause 5.2 of the Victorian Distribution Code in relation to
reliability. In the same way, this also means that this capex is sufficient for United
Energy to comply with clause 6.5.7(a) of the NER which relates to compliance with
applicable regulatory obligations. We also consider that United Energy likely overstates
the potential risks to maintain network reliability over the 2016–20 period.
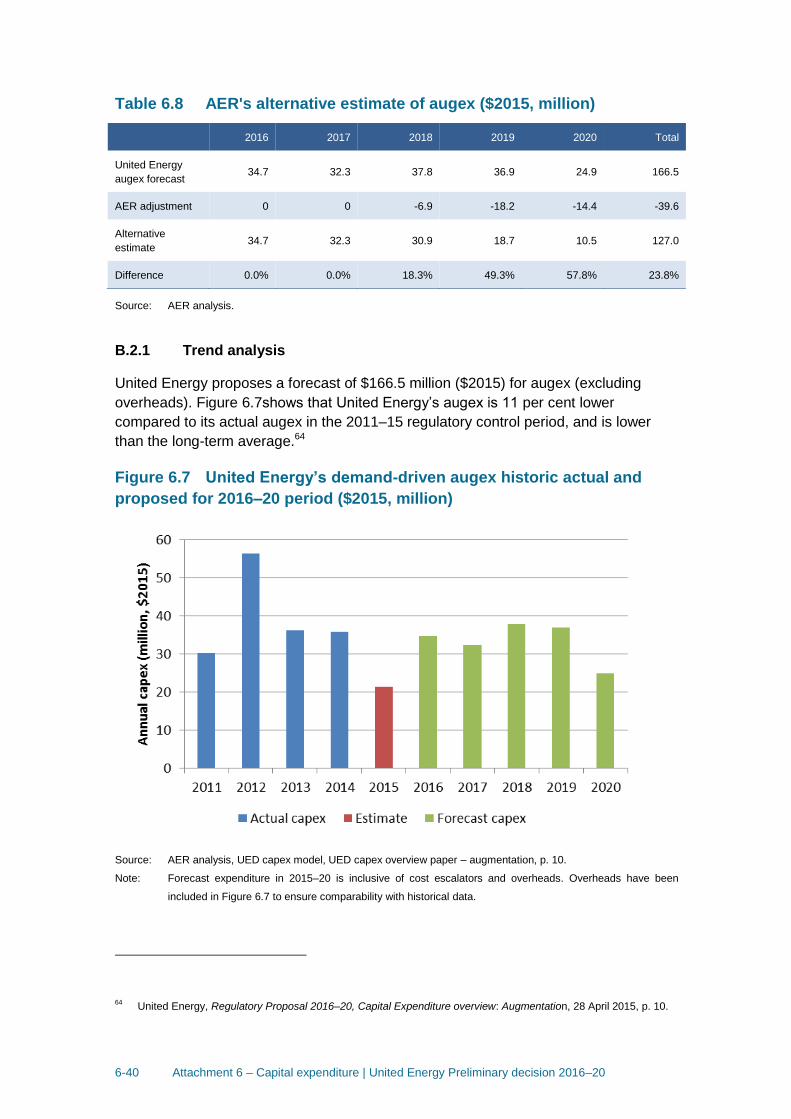
6-40 Attachment 6 – Capital expenditure | United Energy Preliminary decision 2016–20
Table 6.8 AER's alternative estimate of augex ($2015, million)
2016 2017 2018 2019 2020 Total
United Energy
augex forecast 34.7 32.3 37.8 36.9 24.9 166.5
AER adjustment 0 0 -6.9 -18.2 -14.4 -39.6
Alternative
estimate 34.7 32.3 30.9 18.7 10.5 127.0
Difference 0.0% 0.0% 18.3% 49.3% 57.8% 23.8%
Source: AER analysis.
B.2.1 Trend analysis
United Energy proposes a forecast of $166.5 million ($2015) for augex (excluding
overheads). Figure 6.7shows that United Energy’s augex is 11 per cent lower
compared to its actual augex in the 2011–15 regulatory control period, and is lower
than the long-term average.64
Figure 6.7 United Energy’s demand-driven augex historic actual and
proposed for 2016–20 period ($2015, million)
Source: AER analysis, UED capex model, UED capex overview paper – augmentation, p. 10.
Note: Forecast expenditure in 2015–20 is inclusive of cost escalators and overheads. Overheads have been
included in Figure 6.7 to ensure comparability with historical data.
64
United Energy, Regulatory Proposal 2016–20, Capital Expenditure overview: Augmentation, 28 April 2015, p. 10.

6-41 Attachment 6 – Capital expenditure | United Energy Preliminary decision 2016–20
United Energy stated that its forecast reduction in augex is a result of declining
demand in the last couple of years due to electricity price rises and a slow economy
providing some deferral of capital expenditure.65 The proposed augex for 2016–20 is
approximately 14 percent of United Energy’s proposed total capex program.66
To examine the impact of a maximum demand on the need for network augmentation,
we then look at network utilisation. Network utilisation is a measure of the installed
network capacity that is, or is forecast to be, in use. Where utilisation rates decline over
time (such as from a decline in maximum demand), it is expected that total augex
requirements would similarly fall.
Figure 6.8 shows United Energy’s zone substation utilisation between 2010 and 2014,
and forecast utilisation in 2020 (at the end of the regulatory period). Between 2010 and
2014 United Energy undertook zone substation augmentation, which is shown in a
decrease in the number of substations operating above 70 per cent of their maximum
capacity. The flattening of maximum demand between 2010 and 2014 also contributed
to reduction in the utilisation of the network.
The forecast of zone substation utilisation in 2020 is based on United Energy’s forecast
demand at each substation and existing levels of capacity (without additional
augmentation). The increase in the number of highly utilised zone substations reflects
United Energy’s expectations on demand growth between 2015 and 2020 – shown in
Figure 6.8 as a shift to the right compared to the utilisation recorded in 2014.
65
United Energy, Regulatory Proposal 2016–20, Capital Expenditure overview: Augmentation, 28 April 2015, p. 11. 66
United Energy, Regulatory Proposal 2016–20, 30 April 2015, p. 43.
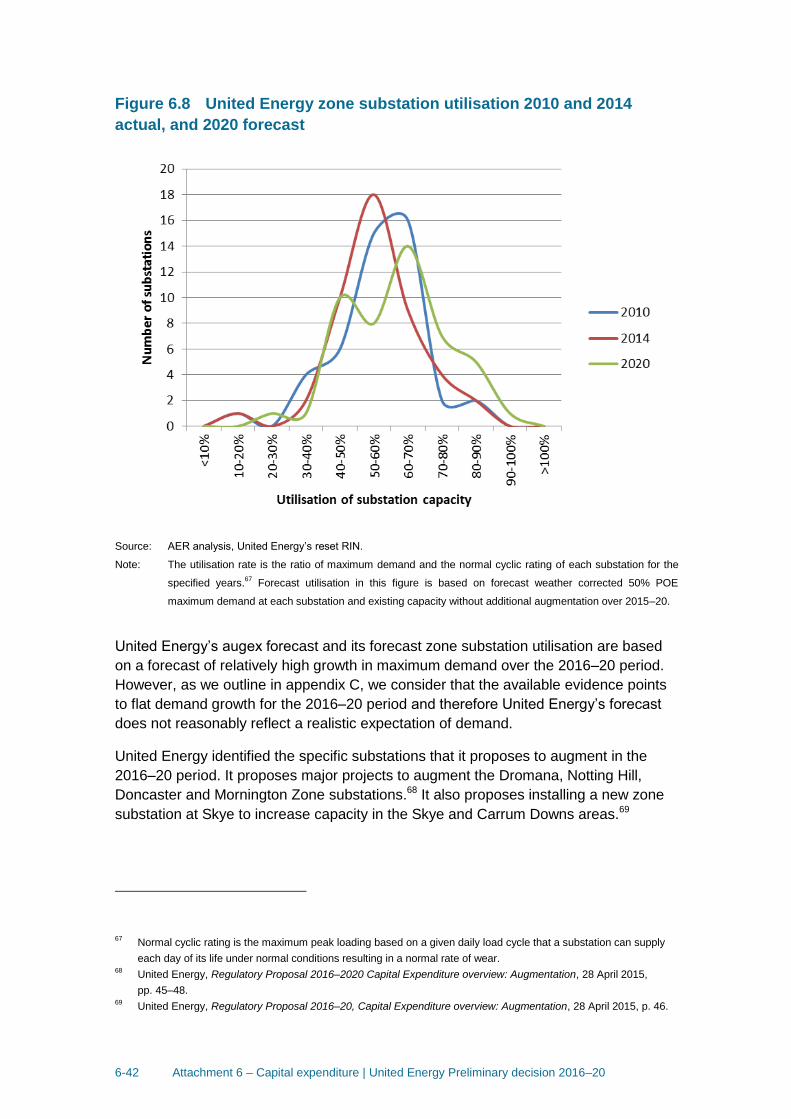
6-42 Attachment 6 – Capital expenditure | United Energy Preliminary decision 2016–20
Figure 6.8 United Energy zone substation utilisation 2010 and 2014
actual, and 2020 forecast
Source: AER analysis, United Energy’s reset RIN.
Note: The utilisation rate is the ratio of maximum demand and the normal cyclic rating of each substation for the
specified years.67
Forecast utilisation in this figure is based on forecast weather corrected 50% POE
maximum demand at each substation and existing capacity without additional augmentation over 2015–20.
United Energy’s augex forecast and its forecast zone substation utilisation are based
on a forecast of relatively high growth in maximum demand over the 2016–20 period.
However, as we outline in appendix C, we consider that the available evidence points
to flat demand growth for the 2016–20 period and therefore United Energy’s forecast
does not reasonably reflect a realistic expectation of demand.
United Energy identified the specific substations that it proposes to augment in the
2016–20 period. It proposes major projects to augment the Dromana, Notting Hill,
Doncaster and Mornington Zone substations.68 It also proposes installing a new zone
substation at Skye to increase capacity in the Skye and Carrum Downs areas.69
67
Normal cyclic rating is the maximum peak loading based on a given daily load cycle that a substation can supply
each day of its life under normal conditions resulting in a normal rate of wear. 68
United Energy, Regulatory Proposal 2016–2020 Capital Expenditure overview: Augmentation, 28 April 2015,
pp. 45–48. 69
United Energy, Regulatory Proposal 2016–20, Capital Expenditure overview: Augmentation, 28 April 2015, p. 46.

6-43 Attachment 6 – Capital expenditure | United Energy Preliminary decision 2016–20
We have reviewed the forecast utilisation at these substations under realistic demand
forecasts to assess whether augmentation may be necessary to alleviate capacity
constraints. This is consistent with the submission from the VECUA which states that:
The AER needs to determine the distributors’ augmentation capex needs utilising credible demand forecasts at the zone substation level and taking into account local system utilisation and excess capacity levels.70
Table 6.9 below shows the forecast utilisation (without augmentation) for the four zone
substations proposed for augmentation (plus Carrum Downs) between 2015 and 2020,
based on United Energy’s demand forecasts and what we consider are realistic
demand forecasts.71 These figures show that United Energy, under its assumptions,
expects utilisation to increase over the period for each substation. However, by 2020
the forecast utilisation is not expected to be consistently high at each zone substation,
with forecast utilisation less than 80 per cent of normal cyclic rating for the Notting Hill
and Mornington substations. This suggests that the need for augmentation is not
consistent across the network, even under United Energy’s demand assumptions.
Under what we consider to be realistic demand forecasts, Table 6.9 shows that
forecast zone substation utilisation will generally remain flat. We consider that based
on these findings, augmentation of the Notting Hill, Doncaster, Mornington and Carrum
Downs (i.e. Skye) zone substations could be delayed or even avoided.
Table 6.9 Normal cyclic utilisation of zone substations proposed to be
augmented
Zone substation United Energy demand forecasts Realistic demand forecasts
2015 2020 2015 2020
Dromana 0.87 0.99 0.83 0.83
Carrum Downs 0.74 0.85 0.71 0.71
Doncaster 0.78 0.84 0.74 0.70
Notting Hill 0.61 0.77 0.58 0.65
Mornington 0.57 0.62 0.54 0.52
Source: AER analysis, United Energy’s reset RIN.
70
Victorian Energy Consumer and User Alliance, Submission to the AER Victorian Distribution Networks’ 2016–20
Revenue Proposals, 13 July 2015, p. 25. 71
As set out in Appendix C, we consider that AEMO’s demand forecast reflect a more realistic expectation of
demand over the 2016–20 period. We compared AEMO’s forecast to United Energy’s system-level demand
forecast to determine the percentage overestimation of United Energy’s forecast for each year of the 2016–20
period. We reduced the demand forecast for each zone substation by this percentage.
6-44 Attachment 6 – Capital expenditure | United Energy Preliminary decision 2016–20
We understand United Energy (and the other Victorian electricity businesses) is in the
process of updating their demand forecasts as part of the 2015 distribution annual
planning report (DAPR). We also note that AEMO will publish updated connection point
demand forecasts for Victoria. We consider the forecasts in our decisions should
reflect the most current expectations of the forecast period. Hence, we are open to
United Energy submitting updated demand forecasts and we will consider these
updated forecasts and other information (such as AEMO's revised connection point
forecasts) in the final decision.
A number of submissions commented on network utilisation:
The CCP submitted that United Energy’s existing utilisation data and declining peak
demand supports a view that there is little need for augmentation capex.72 The
CCP accepted that each Victorian distributor identifies that there are pockets of
demand growth in its network that require augmentation. However, it also notes
that there are also pockets of declining usage, meaning there is the potential to
utilise assets no longer needed in some parts of the network and relocate them to
where growth is being experienced.73
The VECUA and the Victorian Greenhouse Alliances also submitted that there were
significant investments in the Victorian networks over recent regulatory periods
which have led to excess levels of network capacity and declining network
utilisation.74 Both submitted that we should consider this evidence closely in our
capex assessment.
As noted by these stakeholders, we agree that current levels of network utilisation are
important factors to consider in reviewing augmentation requirements over time.
However, in terms of determining a level of augex for the 2016–20 period, it is also
necessary to consider future demand and forecast network utilisation over this period.
We considered this above.
We note the comments of CCP in relation to the ability to relocate assets. Advice from
our technical and engineering staff suggests that it is generally not technically or
economically feasible to relocate distribution assets to other parts of the network to any
significant degree. We understand that any ability to relocate assets would be limited
and would not impact materially on the required expenditure for the 2016–20 period.
72
CCP Sub-panel 3, Response to proposals from Victorian electricity distribution network service providers, August
2015, p. 17. 73
CCP Sub-panel 3, Response to proposals from Victorian electricity distribution network service providers, August
2015, p. 17. 74
Victorian Energy Consumer and User Alliance, Submission to the AER Victorian Distribution Networks’ 2016–20
Revenue Proposals, 13 July 2015, pp. 4 and 22–24; Victorian Greenhouse Alliances, Submission to the AER -
Local Government Response to the Victorian Electricity Distribution Price Review 2016–20 - 13 July 2015, pp. 33–
34.

6-45 Attachment 6 – Capital expenditure | United Energy Preliminary decision 2016–20
B.2.2 Forecasting methodology and Value of Customer
Reliability
This section considers United Energy’s augmentation forecasting methodology and
input assumptions, in particular the use of VCR assumptions.
United Energy submitted that it developed its augex forecast using a ‘probabilistic
planning approach’.75 This is an economic approach to network planning in which
United Energy compares the forecast cost to consumers from losing energy supply
(e.g. when demand exceeds available capacity) against the proposed cost to augment
capacity. The cost to consumers is calculated by multiplying the expected energy-at-
risk (e.g. the energy not supplied when demand exceeds capacity) by VCR. When the
cost to consumer is higher than the cost of augmentation, the investment will proceed.
VCR measures the willingness of customers to pay for the reliability support of
electricity, in dollar per kilowatt hours (kWh). Probabilistic network planning that
considers VCR is well accepted as being consistent with good industry practice and
prudent network planning because the decision on whether to invest takes into account
the economic value to customers of electricity supply. When VCR lowers, this suggests
that fewer investments will proceed because customers may be more accepting of risk
in terms of reliability of electricity supply.
The Victorian Distribution Code (which sets jurisdictional obligations for network
reliability, asset planning and connections) also sets requirements relating to prudent
network planning and reliability. In particular, it requires that United Energy:
1. use best endeavours to develop and implement plans for the maintenance of its
assets and for the establishment and augmentation of transmission connections, to
minimise the risks associated with the failure or reduced performance of assets and
in a way which minimises costs to customers (taking into account distribution
losses)76
2. use best endeavours to meet the reliability targets required by the AER’s regulatory
determination, and otherwise meet reasonable customer expectations of reliability
of supply.77
We have reviewed United Energy’s network planning and augmentation forecasting
approach through a sample of its projects. On the basis of our review, we are satisfied
that United Energy applies a cost-benefit and probabilistic planning methods that take
into account VCR and reasonable risk-analysis to assess the merits of investment
options. However, we consider that United Energy’s VCR is over-estimated and likely
does not reflect the expectations of its customers across its network. Our reasons are
set out in detail in the next section.
75
United Energy, Regulatory Proposal 2016–20, April 2015, p. 64. 76
Victorian Distribution Code, clause 3.1. 77
Victorian Distribution Code, clause 5.2.

6-46 Attachment 6 – Capital expenditure | United Energy Preliminary decision 2016–20
United Energy’s VCR
United Energy applies a VCR of 56.8 ($/kWh) for its augex planning. This VCR is 30
per cent higher than the VCR adopted by the other Victorian DNSPs, which adopt
AEMO’s 2014 Victorian VCR.
AEMO VCR
In September 2014, AEMO released the results of its first national VCR survey.78 As
shown in Table 6.10, the updated Victorian VCR has decreased significantly compared
to the previous values used in 2013. This is largely driven by commercial and
agricultural customers, however, decreases were observed across all customer
groups. The Victorian VCR value is consistent with the VCR values for other NEM
states.
Table 6.10 Summary of Victorian VCR between 2013 and 2014 ($/kWh)
Year Victoria (weighted average) Agriculture Commercial Industrial Residential
2013 63.09 147.76 113.05 44.93 27.19
2014 39.50 47.67 44.72 44.06 24.76
Change -38% -68% -60% -2% -9%
Source: AEMO VCR report, regulatory proposals.
AEMO suggested that the decrease in the VCR could be explained by increased
electricity costs since 2007–08 and the implementation of energy efficiency savings by
commercial and agricultural businesses.79 It is also likely that previous VCR values
have been over-stated because they did not reflect up-to-date customer information
and the VCR has been maintained in real terms, with no comprehensive survey for a
number of years.
AEMO surveyed customers to determine their willingness to pay under twenty-four
different outage scenarios.80 AEMO’s VCR for each customer type is based on the
weighted-average VCR of these different outages. The Victorian $39.50/kWh is then
determined based on the weighted average of the VCR for each customer-type.
AEMO stated that VCR values may differ across networks due to specific
characteristics and customers of the network. In its VCR application guideline, AEMO
stated that VCR values may be re-calculated using one or more of the following
approaches:
78
AEMO, Value of Customer Reliability Review, September 2014. To develop its revised VCR, AEMO surveyed
approximately 3000 residential and business customers across the NEM states. For Victoria, this is the first survey
of VCR since the previous Victorian VCR study completed in 2007–08. 79
AEMO, Value of Customer Reliability Review, September 2014, pp. 1 and 36. 80
For example, different outage timing (e.g. summer/winter/weekend/weekday) and outage duration (e.g. 0-1 hour/1-
3 hour).

6-47 Attachment 6 – Capital expenditure | United Energy Preliminary decision 2016–20
Locational VCR — calculated by re-weighting the VCR review results using the
composition of the customer demand being served. This may more precisely
represent the VCR value expressed by customers at a local level than using the
state-level aggregated VCR value as a proxy.81
Outage specific VCRs – calculated by re-weighting the probabilities of different
outage types to place more weight on specific outage scenarios (i.e. ones
occurring during peak times).82
Local knowledge – calculate a specific VCR using local knowledge where it is
possible to provide reliable evidence of alternative, better substantiated values.83
United Energy VCR
United Energy’s VCR of $56.8/kwh is based on re-weighting the values within AEMO’s
Victorian VCR. While United Energy accepted that AEMO’s VCR survey results reflect
the best estimate of customers’ willingness to pay, it does not consider that the
Victorian VCR is correct for its business. United Energy made the following changes to
AEMO’s VCR estimate.
First, it re-weighted the different outage probabilities estimated by AEMO and focused
solely on the VCR during summer peak-periods where there are outages of less than
one hour and 1 to 3 hours. United Energy submitted that it only focused on these two
outage scenarios because it targets network augmentation during peak summer
periods where network capacity is expected to be exceeded.
Second, it changed the Victorian residential VCR value for outages less than one hour
during peak summer times from $28.14/kWh to $43.10/kWh (which reflects the NSW
VCR value for this outage type). In support of this change, United Energy submitted
that:
Values for all other states for this condition are $42.91 for Qld, $42.75 for NSW, $41,49
for SA and $45.28 for Tas, with an average of $43.10/kWh. For Victoria, AEMO has
specified $28.14/kWh. Furthermore this value is inconsistently lower than the 1-3 hour
VCR values. There is no valid reason why residential customers in UE’s service area
value reliability any differently to any other residential customers in other states in the
NEM, hence UE deems that $43.10/kWh is more appropriate to use for our residential
customers for the 0-1 hour outage condition.84
Third, it changed the weighting placed on large and small businesses that were
adopted in AEMO’s VCR calculation. United Energy submitted that AEMO’s Victorian
81
AEMO, Value of Customer Reliability Review – Application Guide, December 2014, p. 6. 82
AEMO, Value of Customer Reliability Review – Application Guide, December 2014, p. 9. 83
AEMO, Value of Customer Reliability Review – Application Guide, December 2014, p. 9. 84
United Energy, Regulatory Proposal 2016–20, 30 April 2015, Attachment NET117 (Value of Customer Reliability
(VCR) Application Guideline), p. 7.

6-48 Attachment 6 – Capital expenditure | United Energy Preliminary decision 2016–20
VCR over-accounts for large businesses and under-accounts for small businesses
when compared to its customer base.
AER position
We do not accept United Energy’s composite VCR and instead consider that AEMO’s
Victorian VCR should be applied to United Energy’s augex forecast. This is for the
following reasons.
First, we disagree that the Victorian residential VCR value for outages less than one
hour during peak summer times is incorrect. This outage event value is based on
AEMO’s Victorian survey results which we consider provide the most accurate
reflection of how Victorian residential consumers value reliability. We consider that
there are a number of plausible hypotheses which may explain why the results differ
for Victoria compared to other states. For example, AEMO states that this is likely due
to high residential gas usage in Victoria.85
Second, United Energy’s VCR may overstate the willingness of its consumers to pay
for reliability because it only reflects the willingness of consumers to pay for reliability
during peak summer conditions. The outage-specific VCR is higher than during other
outage times. While United Energy submitted that this VCR reflects its augmentation
practices (e.g. only augmenting when demand exceeds capacity during summer peak
times), it does not necessarily reflect the value placed by United Energy’s customers
across its network. In particular, because United Energy places zero weight on longer
outage times, and off-peak, winter or weekend outages, it does not allow for a
complete picture of the consumer’s perspective.
In contrast, AEMO’s VCR’s is based on the weighted average VCR of different types of
customers and outage scenarios (e.g. time of year and length of outage). This seeks to
provide a complete and balanced understanding of customer preferences. While
AEMO’s application guideline stated that it is appropriate to place more weight on
specific outage scenarios, it does not appear to contemplate scenarios in which 22 out
of 24 outage scenarios are excluded.
This position is supported by a submission from the VECUA. The VECUA stated that it
does not consider that United Energy’s approach is evidence-based or is supported by
credible willingness to pay information. 86
We consider that United Energy’s adjustments to customer composition (e.g. changing
the weighting placed on large and small businesses) are reasonable. United Energy’s
calculations are based on reliable data sourced from Interval Meter Store and Smart
Meter Data over a 12 month period, which are verified against total energy sales.
85
AEMO, VCR report, December 2014, p. 18. 86
VECUA, Submission to the AER Victorian Distribution Networks’ 2016–20 Revenue Proposals - 13 July 2015,
p. 28.

6-49 Attachment 6 – Capital expenditure | United Energy Preliminary decision 2016–20
Having said that, based on our review of United Energy’s calculations, it appears that
changing the customer composition has only a marginal impact on the VCR value.
We note that there may be alternative VCRs that are appropriate to apply to United
Energy’s network (e.g. re-weighting outage scenarios that apply more weight on peak
summer days but do not ignore all other scenarios). However, in the absence of other
information, we consider that AEMO’s VCR should be applied to United Energy’s
augex forecast. We consider the implications of applying this VCR in the next section.
Implications for augmentation capex and reliability
Applying AEMO’s VCR to calculate United Energy’s augmentation requirements leads
to $39.6 million ($2015) of proposed capex deferred from the 2016–20 period. As set
out previously, when the estimate of VCR lowers this suggests that some projects will
now be deferred as their cost would now exceed the value of load at risk.
Table 6.11 sets out United Energy’s proposed projects and capital works that will be
deferred by applying AEMO’s VCR. This is based on information provided by United
Energy about the proposed timing of its capital projects under its VCR and AEMO’s
VCR.
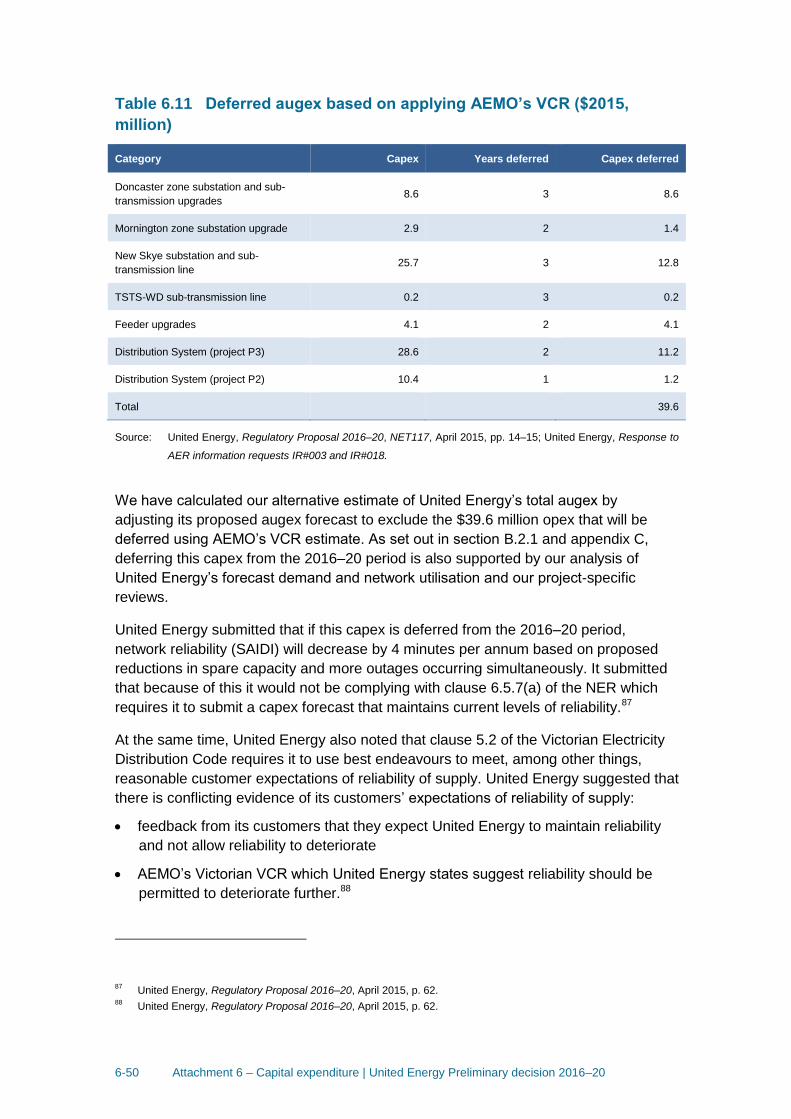
6-50 Attachment 6 – Capital expenditure | United Energy Preliminary decision 2016–20
Table 6.11 Deferred augex based on applying AEMO’s VCR ($2015,
million)
Category Capex Years deferred Capex deferred
Doncaster zone substation and sub-
transmission upgrades 8.6 3 8.6
Mornington zone substation upgrade 2.9 2 1.4
New Skye substation and sub-
transmission line 25.7 3 12.8
TSTS-WD sub-transmission line 0.2 3 0.2
Feeder upgrades 4.1 2 4.1
Distribution System (project P3) 28.6 2 11.2
Distribution System (project P2) 10.4 1 1.2
Total 39.6
Source: United Energy, Regulatory Proposal 2016–20, NET117, April 2015, pp. 14–15; United Energy, Response to
AER information requests IR#003 and IR#018.
We have calculated our alternative estimate of United Energy’s total augex by
adjusting its proposed augex forecast to exclude the $39.6 million opex that will be
deferred using AEMO’s VCR estimate. As set out in section B.2.1 and appendix C,
deferring this capex from the 2016–20 period is also supported by our analysis of
United Energy’s forecast demand and network utilisation and our project-specific
reviews.
United Energy submitted that if this capex is deferred from the 2016–20 period,
network reliability (SAIDI) will decrease by 4 minutes per annum based on proposed
reductions in spare capacity and more outages occurring simultaneously. It submitted
that because of this it would not be complying with clause 6.5.7(a) of the NER which
requires it to submit a capex forecast that maintains current levels of reliability.87
At the same time, United Energy also noted that clause 5.2 of the Victorian Electricity
Distribution Code requires it to use best endeavours to meet, among other things,
reasonable customer expectations of reliability of supply. United Energy suggested that
there is conflicting evidence of its customers’ expectations of reliability of supply:
feedback from its customers that they expect United Energy to maintain reliability
and not allow reliability to deteriorate
AEMO’s Victorian VCR which United Energy states suggest reliability should be
permitted to deteriorate further.88
87
United Energy, Regulatory Proposal 2016–20, April 2015, p. 62. 88
United Energy, Regulatory Proposal 2016–20, April 2015, p. 62.

6-51 Attachment 6 – Capital expenditure | United Energy Preliminary decision 2016–20
Under NER clause 6.5.7(a)(2), United Energy is required to submit a capex forecast
that maintains reliability only to the extent that there is no applicable regulatory
obligation or requirement in relation to the reliability of United Energy’s distribution
system. We consider that clause 5.2 of the Victorian Electricity Distribution Code sets a
regulatory obligation on United Energy in relation to reliability.
We consider that AEMO’s VCR estimate is relevant to United Energy’s obligation
under clause 5.2 of the Victorian Electricity Distribution Code. This is because this
reflects the most current value of customers’ expectations of the reliability of electricity
supply (as discussed above). This does not necessarily conflict with customer views
that reliability should not deteriorate because VCR does not reflect absolute levels of
reliability, or expected reliability outcomes. Rather it reflects customers’ tolerance of
risk and the trade-offs between reliability and prices.
Having said that, we consider it is difficult to accept the accuracy of United Energy’s
assertion that network reliability will deteriorate by 4 minutes per annum over 2016–20
based on deferring the capex set out in Table 6.11. This is because:
The primary impact of the change in VCR is to defer projects from the end of the
2016–20 period into the next period. Even if these projects were not deferred, any
associated reliability outcomes would have not been felt until after 2016–20.
Hence, deferring these projects should not have any material effect on the
reliability outcome over 2016–20.
If maximum demand that United Energy forecasts over the 2015–20 period does
not eventuate, there will likely be additional spare capacity in United Energy’s
network. This will allow United Energy to defer projects without risking outages. As
set out in appendix C and above, we are not satisfied that United Energy’s demand
forecasts reasonably reflect a realistic expectation of demand and demand will
likely be lower than forecast.
United Energy’s reliability performance is influenced by a number of factors,
including the configuration and condition of its network assets. This is a result of its
historical investment and operating practices. Given the size of United Energy’s
asset base and that most network assets have an expected life in excess of 50
years, a small change in capex is unlikely to result in an abrupt change in reliability
performance.
In conclusion, we consider that United Energy’s proposed augmentation capex does
not reasonably reflect the capex necessary to comply with an applicable regulatory
obligation in relation to reliability. We have substituted a forecast augex that
reasonably reflects the capex criteria.
B.2.3 Project reviews
We reviewed a sample of United Energy’s major augex projects and programs to
consider whether United Energy’s planning supports augmentation under realistic

6-52 Attachment 6 – Capital expenditure | United Energy Preliminary decision 2016–20
demand forecasts and AEMO’s VCR. In particular, we reviewed the United Energy’s
supporting evidence and documentation for the proposed:
new Skye zone substation and associated sub-transmission line (which is proposed
to alleviate forecast capacity constraints at Carrum Downs zone substation)
feeder augmentation and pole top capacitor program
distribution system (low voltage wires and transformers) augmentation program.
On the basis of our review, we observe that reductions in demand forecasts and
adopting AEMO’s VCR will reduce the need for augmentation based on the specific
project analysis undertaken by United Energy. Our key findings are as follows.
First, United Energy’s proposed capex and timing for the Skye zone substation and
sub-transmission line satisfies a cost-benefit analysis based on Untied Energy’s VCR
and demand forecast. However, lowering the demand forecasts and adopting AEMO’s
VCR means that the cost to consumers from forecast unserved energy drops by up to
50 per cent. This means that the estimate cost of this project ($26 million) no longer
satisfies a cost benefit test.
Second, for United Energy’s feeder augmentation program, it will only consider
possible augmentation of a feeder if utilisation reaches 85 per cent and above.89 United
Energy showed that 6 feeders are expected to exceed their normal cyclic rating in
2015–16 and a further 11 by 2016–17. It also shows that a further 85 distribution
feeders are expected to exceed 85 percent of their rating by 2016–17.90 From this,
United Energy selects 13 feeders that are economical to augment.91
Under a lower demand forecast, we calculate that up to 75 per cent of targeted feeders
will not exceed their cyclic capacity rating by 2015–16. This means that it may be
economical to defer augmenting these feeders until they become more highly utilised.
Given that demand is not expected to grow as strongly as United Energy forecasts (as
we set out in appendix C), this may mean that augmentation for a number of these
feeders could be deferred into the next regulatory period.
Third, for United Energy’s distribution system augmentation program, it proposed to
augment distribution substations with peak utilisation of 120 per cent (daily normal
cyclic rating) and low voltage circuits that have experienced outages.92 United Energy’s
supporting documentation provided figures that show the utilisation of existing
89
United Energy, Regulatory Proposal 2016–20, Attachment: 2014 Distribution Annual Planning Report, April 2015,
p. 309. 90
United Energy, Regulatory Proposal 2016–20, Attachment: 2014 Distribution Annual Planning Report, April 2015,
pp. 309–310. 91
United Energy, Regulatory Proposal 2016–20, Attachment: 2014 Distribution Annual Planning Report, April 2015,
pp. 309–313. 92
United Energy, Regulatory Proposal 2016–20, Attachment: Distribution system augmentation strategy, 7 May
2014, p. 9.
6-53 Attachment 6 – Capital expenditure | United Energy Preliminary decision 2016–20
distribution substations and how it has changed over time in response to demand.93
This showed that reduced demand growth between 2009 and 2014 reduced the
number of distribution substations with utilisation above 120 per cent. Given that actual
demand over 2016–20 will likely be less than United Energy forecasts, this will likely
reduce the number of distribution substations that require augmentation.
This project-specific analysis supports our findings in our analysis of United Energy’s
forecast demand and network utilisation, and our review of the use of VCR. In
particular:
The proposed capex for the new Skye zone-substation and sub-transmission line
no longer satisfies a cost-benefit analysis under a realistic demand forecast. This
suggests that the capex can be deferred or a lower cost option adopted. Under
AEMO’s VCR, this capex will also be deferred because it reduces the cost to
consumers if the project does not proceed in the 2016–20 period.
If actual demand over the 2015–20 period is less than Untied Energy forecasts, this
will reduce asset utilisation and allow some augmentation to be deferred or
avoided. Some of the proposed augex for feeders and distribution transformers will
also be deferred under AEMO’s VCR estimate.
B.3 Forecast customer connections capex, including capital contributions
Connections capex is incurred by United Energy to connect new customers to its
network and where necessary augment the shared network to ensure there is sufficient
capacity to meet the new demand.
New connection works can be undertaken by United Energy or a third party. The new
customer provides a contribution towards the cost of the new connection assets. This
contribution can be monetary or in contributed assets. In calculating the customer
contribution, United Energy is required to take into account the forecast revenue
anticipated from the new connection94. These contributions are subtracted from total
gross capex and as such decrease the revenue that is recoverable from all consumers.
Customer contributions are sometimes referred to as capital contributions or capcons.
The mix between net capex and capcons is important as it determines from whom and
when United Energy recovers revenue associated with the capex investment. For
works involving a customer contribution, United Energy recovers revenue directly from
the customer who initiates the work at the time the work is undertaken. This is different
from net capex where United Energy recovers revenue for this expenditure through
both the return on capital and return of capital building blocks that form part of the
93
See Figure 2a in United Energy, Regulatory Proposal 2016–20, Attachment: Distribution system augmentation
strategy, 7 May 2014, p. 12. 94
In Victoria, the Essential Services Commission’s (ESCV) Guidelines 14 and 15 determine the customer connection
charges.

6-54 Attachment 6 – Capital expenditure | United Energy Preliminary decision 2016–20
calculation of United Energy’s annual revenue requirement.95 That is, United Energy
recovers net capex investment across the life of the asset through revenue received for
the provision of standard control services. United Energy has forecast $249.1 million
($2015–16) of expenditure for connection works for the 2016–20 regulatory control
period, net of customer contributions. Table 6.12 shows United Energy's forecast for
connections expenditure and customer contributions.
Table 6.12 United Energy proposed connections capex ($2015–16,
million, excluding overheads)
Category 2016 2017 2018 2019 2020 Total
Gross connections capex 48.2 49.3 50.6 50.1 50.9 249.1
Customer contributions 17.7 18.1 18.3 18.7 18.5 91.3
Net connections capex 30.5 31.2 32.3 31.3 32.4 157.7
Source: United Energy, Response to information request AER 020 (note: numbers may not add due to rounding)
We accept both United Energy’s net connections capex forecast and customer
contributions forecast and have included these in our substitute estimate of net capex.
In determining that United Energy’s forecasts meet the capex criteria, we considered:
the trends in United Energy’s connections capex across time, and
United Energy’s forecast methodology.
We note that stakeholders have raised some concerns with the classification of
connection services.96 We discuss the determination of service classifications in
attachment 13.
B.3.1 Trend analysis
As we note in section A.2 above, when assessing United Energy’s connections capex
we have considered the trends in actual and forecast capex.97 We have used this
analysis to provide context to United Energy’s proposal, in particular trend analysis has
allowed us to:
gauge the degree to which United Energy’s proposal is consistent with past
connections capex, and
95
For more information on the building blocks included in the determination of United Energy’s annual revenue
requirement see our attachments on the Regulatory Asset Base and Regulatory Depreciation. 96
Consumer Challenge Panel 3 – Victorian DNSPs revenue reset comments on DNSPs proposal, pp. 54–56.
Vector - Submission on the AER’s Issues Paper on Victorian Electricity Distribution Pricing Review for 2016–2020,
13 July 2015, pp. 4–5. 97
This is one of the capex factors to which we are required to have regard to under the NER (NER, cl. 6.5.7(a)(5)).
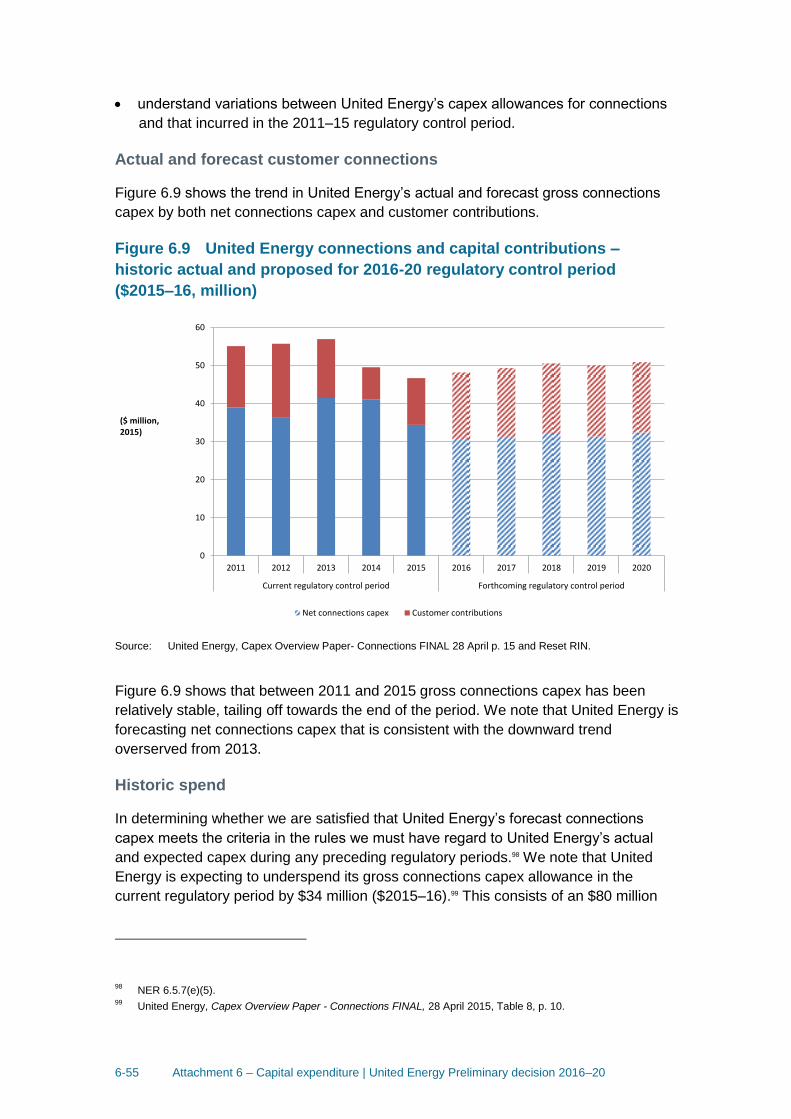
6-55 Attachment 6 – Capital expenditure | United Energy Preliminary decision 2016–20
understand variations between United Energy’s capex allowances for connections
and that incurred in the 2011–15 regulatory control period.
Actual and forecast customer connections
Figure 6.9 shows the trend in United Energy’s actual and forecast gross connections
capex by both net connections capex and customer contributions.
Figure 6.9 United Energy connections and capital contributions –
historic actual and proposed for 2016-20 regulatory control period
($2015–16, million)
Source: United Energy, Capex Overview Paper- Connections FINAL 28 April p. 15 and Reset RIN.
Figure 6.9 shows that between 2011 and 2015 gross connections capex has been
relatively stable, tailing off towards the end of the period. We note that United Energy is
forecasting net connections capex that is consistent with the downward trend
overserved from 2013.
Historic spend
In determining whether we are satisfied that United Energy’s forecast connections
capex meets the criteria in the rules we must have regard to United Energy’s actual
and expected capex during any preceding regulatory periods.98 We note that United
Energy is expecting to underspend its gross connections capex allowance in the
current regulatory period by $34 million ($2015–16).99 This consists of an $80 million
98
NER 6.5.7(e)(5). 99
United Energy, Capex Overview Paper - Connections FINAL, 28 April 2015, Table 8, p. 10.
0
10
20
30
40
50
60
2011 2012 2013 2014 2015 2016 2017 2018 2019 2020
Current regulatory control period Forthcoming regulatory control period
($ million,2015)
Net connections capex Customer contributions

6-56 Attachment 6 – Capital expenditure | United Energy Preliminary decision 2016–20
($2015–16) under recovery of the forecast customer contributions and an overspend
on net connections capex of $46 million ($2015–16).100 This follows $70 million
overspend in the previous regulatory control period compared to the AER
determination.101
Figure 6.10 compares United Energy’s connections capex spend in the 2011–15
regulatory control period with the allowance included in the capex determination.
Figure 6.10 United Energy 2011–15 regulatory control period
connections capex – actual and allowed ($2015–16, million)
Source: United Energy, Capex Overview Paper- Connections 28 April Table 8.
In its proposal United Energy notes over the 2011–15 regulatory control period that
United Energy:
connected more customers than forecast
undertook these higher volumes at a lower total cost than forecast, and
funded more of the costs of connections directly, as a result of customer
contributions being lower than forecast.102
United Energy considers that the above factors coupled with its expectation to
underspend compared to its allowance demonstrates that its connections capex in the
current regulatory period is efficient.103 We note that a major feature of the regulatory
100
United Energy, Capex Overview Paper - Connections FINAL, 28 April 2015, Table 8, p. 10. 101
United Energy, Capex Overview Pape r- Connections FINAL, 28 April 2015, Table 8, p. 8. 102
United Energy, Capex Overview Paper - Connections FINAL, 28 April 2015, Table 8, p. 17. 103
United Energy, Capex Overview Paper - Connections FINAL, 28 April 2015, Table 8, p. 17.
-30
-20
-10
0
10
20
2011 2012 2013 2014 2015
($ million, real 2015)
Net Connections Capex Customer contributions

6-57 Attachment 6 – Capital expenditure | United Energy Preliminary decision 2016–20
framework is the incentives United Energy has to achieve efficiency gains whereby
actual expenditure is lower than the allowance. Differences between actual and
allowed connections capex could be the result of efficiency gains, forecasting errors or
some combination of the two.
We have been mindful of the above trends when assessing United Energy’s forecast
methodology for the 2016–20 regulatory control period.
B.3.2 United Energy forecasting methodology
United Energy categorises its connections capex into a series of activity based
connection type forecasts. These activity forecasts correspond to each standard
control customer connection service as classified in the final framework and
approach.104
United Energy’s gross connections capex forecast consists of projections of the
volumes and unit rates of these categorisations. United Energy then separately
produces a forecast of customer contribution revenue to determine the split between
net connection capex and customer contributions for the period.105
In determining whether we are satisfied United Energy’s forecast meets the capex
criteria, we have assessed each phase of the forecast as set out below.
Unit rates
For each connection categorisation, United Energy derives separate unit rates
according to whether the volume of each type of connection project is “unitised” or
“non-unitised”.106 Unitised projects have lives of up to 12 months whereas non-unitised
projects have lives that can extend to up to three years.107 Analysing each type, we
note:
the non-unitised projects are individually costed and rely on average actual unit
rates. Each unit rate or average cost for a series of project types is determined by
sourcing data from existing projects across the past three financial years108, and
the unitised projects are based on standardised contractual unit rates for unitised
United Energy projects.
We are satisfied that United Energy’s unit rates are reasonable given they are based
on verifiable historical data. We have sought to verify this by assessing the unit rates
included in United Energy’s forecast and note that these are declining when compared
104
United Energy, Regulatory Proposal 2016–20, Attachment: Capex Overview Paper - Connections FINAL, 28 April
2015, Table 8, p. 12. (United Energy, Capex Overview Paper - Connections FINAL, 28 April 2015). 105
United Energy, Capex Overview Paper - Connections FINAL, 28 April 2015, Table 8, p. 19. 106
United Energy, Capex Overview Paper - Connections FINAL, 28 April 2015, Table 8, p. 19. 107
United Energy, Capex Overview Pape r- Connections FINAL, 28 April 2015, p. 21. 108
United Energy, Capex Overview Paper - Connections FINAL, 28 April 2015, Table 8, p. 19.

6-58 Attachment 6 – Capital expenditure | United Energy Preliminary decision 2016–20
to the historical unit rates underlying the current period expenditure.109 United Energy
also notes in its proposal that contracts with its service providers are competitively
tendered on an arms’ length basis.110 Further, we note that the use of historical
expenditure works in step with the regulatory framework to reveal efficient cost over
time.
Volumes
United Energy then takes the unit rates and multiplies these by volume forecasts for
each categorisation of connection. United Energy produces each volume forecast by
applying growth indices to the count of projects in the most recent year for each
categorisation. These growth indices rely on economic and industry forecasts
published by the Australian Construction Industry Forum (ACIF).
We are satisfied that the growth rates underlying United Energy’s forecast represent a
realistic expectation of the volume connection activity United Energy will be required to
undertake over the 2016–20 regulatory control period. In determining this we have
compared this growth rate to other available data on the rate of residential construction
and found they follow a similar trend.
Figure 6.11 below shows the aggregate historical and forecast of the ACIF data
underlying the growth indices that United Energy relied on, which we have compared
to the actual and forecast new dwelling data for Victoria published by the Housing
Institute of Australia (HIA).111 We consider the HIA is a reasonably well accepted
industry standard indicator of commercial and industrial connection activity. HIA is a
private-sector industry association comprising mainly house construction contractors.
HIA forecasts have been used by the industry since 1984.112
109
This is based on the volume weighted unit costs reported within United Energy’s RIN data, with the exception of
the “Simple connection LV - COMMERCIAL/INDUSTRIAL” category. 110
United Energy, Capex Overview Paper - Connections FINAL, 28 April 2015, Table 8, p. 27. 111
HIA Housing Forecasts, May 2015. 112
Mills, Anthony and Harris, David and Skitmore, Martin R., The Accuracy of Housing Forecasting in Australia,
Engineering Construction and Architectural, Management 10(4), 2003, pp. 245–253. Accessed from:
http://eprints.qut.edu.au/archive/00004441/.
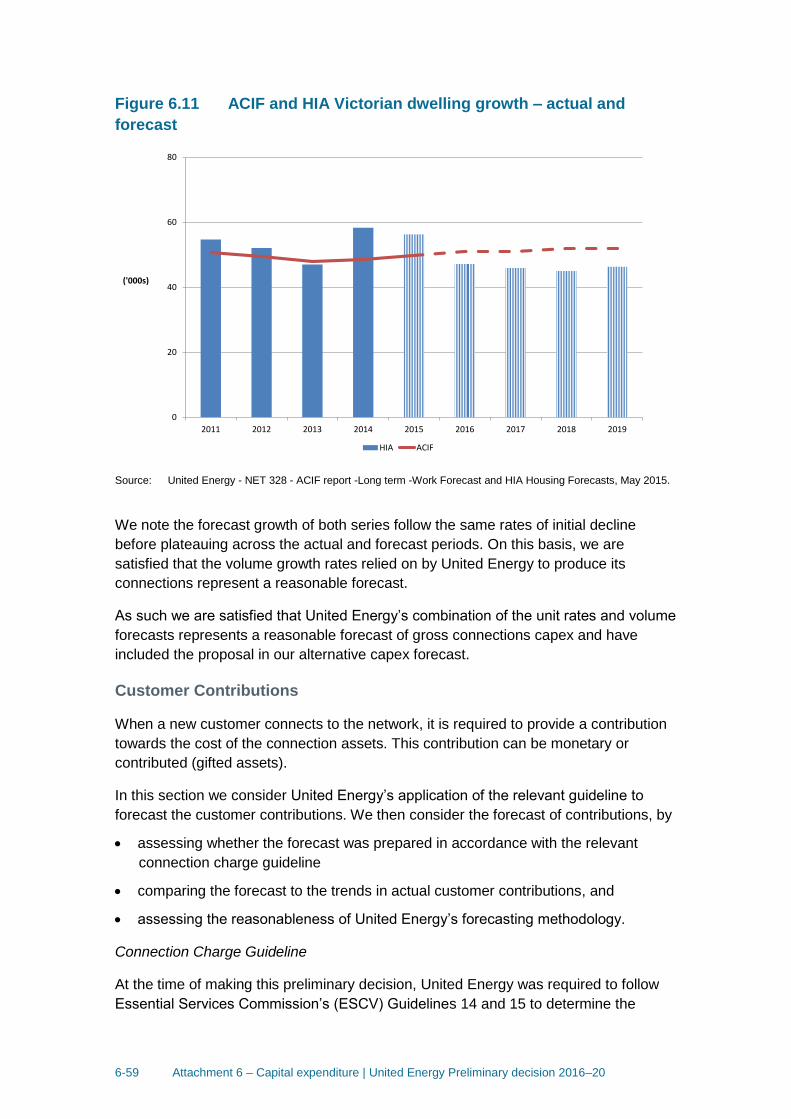
6-59 Attachment 6 – Capital expenditure | United Energy Preliminary decision 2016–20
Figure 6.11 ACIF and HIA Victorian dwelling growth – actual and
forecast
Source: United Energy - NET 328 - ACIF report -Long term -Work Forecast and HIA Housing Forecasts, May 2015.
We note the forecast growth of both series follow the same rates of initial decline
before plateauing across the actual and forecast periods. On this basis, we are
satisfied that the volume growth rates relied on by United Energy to produce its
connections represent a reasonable forecast.
As such we are satisfied that United Energy’s combination of the unit rates and volume
forecasts represents a reasonable forecast of gross connections capex and have
included the proposal in our alternative capex forecast.
Customer Contributions
When a new customer connects to the network, it is required to provide a contribution
towards the cost of the connection assets. This contribution can be monetary or
contributed (gifted assets).
In this section we consider United Energy’s application of the relevant guideline to
forecast the customer contributions. We then consider the forecast of contributions, by
assessing whether the forecast was prepared in accordance with the relevant
connection charge guideline
comparing the forecast to the trends in actual customer contributions, and
assessing the reasonableness of United Energy’s forecasting methodology.
Connection Charge Guideline
At the time of making this preliminary decision, United Energy was required to follow
Essential Services Commission’s (ESCV) Guidelines 14 and 15 to determine the
0
20
40
60
80
2011 2012 2013 2014 2015 2016 2017 2018 2019
('000s)
HIA ACIF

6-60 Attachment 6 – Capital expenditure | United Energy Preliminary decision 2016–20
customer connection charges. In September 2015, we were advised that the Victorian
Government intended to implement Chapter 5A of the NER for the 2016–20 regulatory
control period. This change will impact on how the customer contribution is calculated.
This preliminary decision sets out our views on the methodology used by United
Energy to determine its customer contribution under the old framework. We intend to
work with the Victorian Government and United Energy to fully implement the change
to the AER’s connection charging guideline under Chapter 5A of the rules. We expect
that United Energy will base its revised proposal on the new charging framework and
also consider, where relevant, our consideration of their existing methodology.
Actual and forecast customer contributions
Figure 6.12 shows the trend in United Energy’s actual and forecast customer
contributions and compares customer contributions for the 2011–15 regulatory control
period with United Energy’s forecast for the 2016–20 regulatory control period.
Figure 6.12 United Energy’s customer contributions – actual and
proposed for 2016-20 regulatory control period ($2015–16, million)
Source: United Energy, Capex Overview Paper- Connections FINAL, 28 April 2015.
To determine whether we are satisfied this forecast meets the capex criteria, we have
assessed the methodology United Energy has relied on to produce this forecast.
United Energy forecast methodology
United Energy’s forecast of customer contributions consists of a forecast of:
cash contributions received from customers for works it undertakes, and
gifted assets.
0
5
10
15
20
25
2011 2012 2013 2014 2015 2016 2017 2018 2019 2020
Current regulatory control period Forthcoming regulatory control period
($ million,2015)
6-61 Attachment 6 – Capital expenditure | United Energy Preliminary decision 2016–20
With respect to its cash contribution forecast, United Energy adopts a phased
approach. The first step involves back-casting each project United Energy undertook in
the current regulatory period to establish the contribution the customer would have
made if calculated on current prices. These back-cast contribution amounts are then
used to generate a historical average contribution rate for each category of connection.
United Energy then applies this contribution rate for each category of connection
included in its gross connections forecast.113
United Energy forecasts the gifted asset component of its contribution forecast based
on the historic trend and internal knowledge and understanding of potential projects
expected to occur in coming years.114 United Energy combines this gifted asset
component with the cash contribution component to produce a contribution amount for
each category of connection. United Energy nets off these contribution amounts to
produce the net capex forecast.115
We are satisfied that United Energy’s use of historical percentage rates is derived from
a sufficiently large sample of projects. Further we note that in combination with the
trending approach applied to generate its gross connections forecast, we are satisfied
that it has demonstrated that the sample used is reflective of the projects included in its
forecast.
United Energy’s application of the ESCV’s Guideline 14 yields a significant increase in
the proportion of the gross forecast capex being recovered through customer
contributions than was the case in the 2011–15 regulatory control period. In simple
terms, the customer contribution is determined by deducting the incremental revenue
that United Energy will receive from the new customer over a set period, from the
incremental cost of the connection.116 Therefore, where the incremental revenue from
the customer is expected to decline, the ‘gap’ between incremental cost and revenue
widens. This has the effect of increasing the contribution required from the new
customer.
United Energy in its proposal notes by applying the ESCV’s guideline 14:
In the current period, we are expecting to underspend the AER’s allowance for
Gross Connections capital expenditure by $34 million and we under-recovered
our Customer Contributions against the AER’s forecast by $80 million. This
means that we overspent our Net Connections capital expenditure by $46
million. As a result, we undertook more work than was forecast and we were
not funded for this by developers (and other new customers). There was
therefore a “wealth transfer” from all existing customers to developers (and
other new customers) during the current period.
113
United Energy, Capex Overview Paper- Connections FINAL, 28 April 2015, p. 22. 114
United Energy, Capex Overview Paper- Connections FINAL 28 April 2015, p. 22. 115
United Energy, Capex Overview Paper- Connections FINAL 28 April 2015, p. 22. 116
The period is set in Guideline 14 and forecasts of incremental revenue and costs are made over 15 years for a
business customer and 30 years for a residential customer.

6-62 Attachment 6 – Capital expenditure | United Energy Preliminary decision 2016–20
In total, we are satisfied that the customer contributions forecast by United Energy are
consistent with the requirements set out in the ESCV's Guidelines 14 and 15.
However, as noted above, this estimate will likely be amended in United Energy’s
revised proposal to take account of the implementation of Chapter 5A of the NER.
B.4 Forecast repex
Repex is driven by the inability of network assets to meet the needs of consumers and
the overall network. The decision to replace can be based on cost, quality, safety,
reliability, security, or a combination of these factors. In the long run, a service
provider's assets will no longer meet the requirements of consumers or the network
and will need to be replaced, refurbished or removed.117 Replacement is commonly
driven when the condition of the asset means that it is no longer economic or safe to
be maintained. It may also occur due to jurisdictional safety regulations, or because the
risk of using the asset exceeds the benefit of continuing to operate it on the network.
Technological change may also advance the timing of the replacement decision and
the type of asset that is selected as the replacement.
Electricity network assets are typically long-life assets and the majority will remain in
use for far longer than a single five year regulatory period. Many of these assets have
economic lives of 50 years or more. As a consequence, a service provider will only
replace a portion of its network assets in each regulatory control period. The majority of
network assets will remain in commission well beyond the end of any single regulatory
control period.
Our assessment of repex seeks to establish the portion of United Energy’s assets that
will likely require replacement over the 2016–20 regulatory control period, and the
associated expenditure. United Energy’s forecast of repex includes estimates of the
capex it considers necessary to comply with safety obligations implemented in
response to the 2009 Victorian Bushfires Royal Commission (VBRC). Our analysis of
United Energy’s repex forecast for VBRC is included at appendix B.5 as the
expenditure driver is related. The repex aspects are then included in the total repex
forecast.
B.4.1 Position
We do not accept United Energy's proposed repex of $585 million. We have instead
included in our alternative estimate of overall total capex, an amount of $414 million
($2015) for repex, excluding overheads. This is 71 per cent of the amount that United
Energy proposal. We are satisfied that this amount reasonably reflects the capex
criteria.
117
Assets may also be replaced due to network augmentation. In these cases the primary reason for the asset
expenditure is not the replacement of an asset that has reached the end of its economic life, but the need to deploy
new assets to augment the network, predominantly in response to changing demand.
6-63 Attachment 6 – Capital expenditure | United Energy Preliminary decision 2016–20
B.4.2 United Energy's proposal
United Energy's proposed forecast repex is $585 million. United Energy submitted that
this expenditure is driven by:118
requirements to comply with mandatory regulatory obligations
age profile of their assets which is impacted by substantial network investment
during the 1960s and 1970s
desire to address a trend decline in reliability performance.
We address United Energy’s submission as part of our assessment below.
B.4.3 AER approach
We have applied several assessment techniques to assess United Energy’s forecast of
repex against the capex criteria. These techniques were:
analysis of United Energy’s long term total repex trends
predictive modelling of repex based on United Energy’s assets in commission
review of United Energy’s approach to forecasting replacement expenditure to meet
its safety and reliability obligations
consideration of various asset health indicators and comparative performance
metrics.
We use predictive modelling to assist us in assessing approximately 58 per cent of
United Energy’s proposed repex. This assessment is considered in combination with
the findings of our consultant, Energeia, who provided technical advice on United
Energy’s repex forecast. For the remaining categories of expenditure, we may use
predictive modelling where suitable asset age data and historical expenditure are
available, but will also rely on analysis of historical expenditure.
We note that the assessment of long term trends, the consideration of asset health
indicators and comparative metrics are also considered as part of our assessment
process. However, we have not ultimately used these to reject United Energy’s
forecast of repex or develop our alternative estimate. Our findings from these
assessment techniques are consistent with our overall conclusion. We explain the
reasons for this approach in the “other repex categories” section below.
We note that the assessment of long term trends, the consideration of asset health
indicators and comparative metrics are also considered as part of our assessment
process. However, we have not ultimately used these to reject United Energy’s
forecast of repex or develop our alternative estimate. Our findings from these
assessment techniques are consistent with our overall conclusion.
118
United Energy, Regulatory Proposal 2016–2020, April 2015, pp. 75–76.

6-64 Attachment 6 – Capital expenditure | United Energy Preliminary decision 2016–20
In its report on the Victorian distributor’s the CCP considered that the suite of
approaches we use in our assessment or repex provides a much better top down
approach to identifying the upper bounds for efficient capex proposals than appears to
be the view of the distributors’.119
Trend analysis
We recognise the limitations of expenditure trends, especially in circumstances where
replacement needs may change over time (e.g. a distributor may have a lumpy asset
age profile or legislative obligations may change over time). In recognising these
limitations, we have used this analysis to draw general observations in relation to the
modelled categories of repex, but we have not used it to reject United Energy’s
forecast of repex or develop our alternative estimate. However, we have relied on trend
analysis to assist our assessment of the unmodelled categories of repex.
Predictive modelling
Our predictive model, known as the repex model, can be used to predict a reasonable
amount of repex United Energy would require if it maintains its current risk profile for
condition-based replacement into the next regulatory period. Using what we refer to as
calibrated replacement lives in the repex model gives an estimate that reflects United
Energy’s 'business as usual' asset replacement practices. We explain the calibrated
replacement life scenario, along with other input scenarios, below.
As part of the 'Better Regulation' process we undertook extensive consultation with
service providers on the repex model and its inputs. The repex model we developed
through this consultation process is well-established and was successfully
implemented it in a number of revenue determination processes including the recent
NSW/ACT decisions. It builds on repex modelling we undertook in previous Victorian
and Tasmanian distribution pricing determinations.120 The CCP countered the view of
the distributors that there are significant shortcomings in our repex modelling
approach. The CCP recognised that predictive modelling is part of our overall
approach which also uses other techniques such as trend analysis.121
The repex model has the advantage of providing both a bottom up assessment, as it is
based on detailed sub-categories of assets using data provided by the service
providers, and once aggregated it provides a well-founded high level assessment of
that data. The model can also be calibrated using data on United Energy’s entire stock
119
Consumer Challenge Panel Sub Panel 3, Response to proposals from Victorian electricity distribution network
service providers for a revenue reset for the 2016–2020 regulatory period, August 2015, pp. 38. 120
We first used the predictive model to inform our assessment of the Victorian distributors' repex proposals in 2010.
We undertook extensive consultation on this technique in developing the Expenditure Forecasting Assessment
Guideline. We have since used the repex model to inform our assessment of repex proposals for Tasmanian,
NSW, ACT, QLD and SA distributors. 121
Consumer Challenge Panel Sub Panel 3, Response to proposals from Victorian electricity distribution network
service providers for a revenue reset for the 2016–2020 regulatory period, August 2015, pp. 38.

6-65 Attachment 6 – Capital expenditure | United Energy Preliminary decision 2016–20
of network assets, along with United Energy’s recent actual replacement practices, to
estimate the repex required to maintain its current risk profile.
Notably, we can use the calibrated repex model to capture a number of the drivers put
forward by United Energy’s in its submission. This includes replacement drivers related
to the deterioration in asset condition; environmental conditions; fleet problems; asset
failure risk; risk of collateral asset damage; safety risk to public and field personnel,
environmental damage from asset failure; technical obsolescence; and third party
damage. This is because the calibrated repex model captures the replacement
practices from the last period, which include each of these drivers listed above.
We recognise that predictive modelling cannot perfectly predict United Energy’s
necessary replacement volumes and expenditure over the next regulatory period, in
the same way that no prediction of future needs will be absolutely precise. However,
we consider the repex model is suitable for providing a reasonable statistical estimate
of replacement volumes and expenditure for certain types of assets, where we are
satisfied we have the necessary data. We note that the service providers (including
United Energy) rely on similar predictive modelling to support their forecast amount for
repex.
We use predictive modelling to estimate a value of ‘business as usual’ repex for the
modelled categories to assist in our assessment. However, predictive modelling is not
the only assessment technique we have relied on in assessing United Energy’s
proposal. Our other techniques, which are qualitative in nature, allow us to form a view
on whether or not ‘business as usual’ expenditure appropriately reflects the capex
criteria.
Any material difference from the 'business as usual' estimate could be explained by
evidence of a non-age related increase in asset risk in the network (such as a change
in jurisdictional safety or environmental legislation) or evidence of significant asset
degradation that could not be explained by asset age. United Energy faces a number
of new safety obligations arising from the recommendations of the VBRC. These are
assessed at appendix B.5 of this preliminary decision.
Technical review
We engaged Energeia to perform a technical review of United Energy’s proposed
repex. Energeia assessed United Energy’s approach to forecasting, in particular,
whether United Energy’s forecast repex in order to maintain its safety and reliability, or
whether it was seeking to improve these outcomes. In doing so, Energeia took account
of indicators of safety and reliability, forecast expenditure, and qualitative information
from United Energy on the matters it has regard to when forecasting repex. Energeia’s
review was limited to the six asset categories included in the repex model.
As set out above, we considered Energeia's findings in assessing whether United
Energy’s forecast will allow it to prudently and efficiently maintain the safety and
reliability of its network. all Victorian network businesses have used predictive
modelling as part of their initial proposal. this allows us to have confidence that the use

6-66 Attachment 6 – Capital expenditure | United Energy Preliminary decision 2016–20
of the repex model is suitable in either accepting a network business’s proposal, or in
arriving at our alternative estimate.
Asset health indicators and comparative performance metrics
We have used a number of asset health indicators with a view to observing asset
health. While providing some context for our decision, we have not relied on these
indicators to any extent to inform our alternative estimate, they have provided context
for our decision and the findings are consistent with our overall conclusion.
Similar to trend analysis, our use of these high level benchmarks has been to inform
the relative efficiency of United Energy’s previous repex. However, we have not used
this analysis in rejecting United Energy’s proposal and in developing our alternative
estimate. We used this analysis as a cross-check with the findings of other techniques.
B.4.4 AER repex findings
Trends in historical and forecast repex
We have conducted a trend analysis of repex. The NER requires that we consider the
actual and expected capital expenditure during any preceding regulatory control
period.122 Our use of trend analysis is to gauge how United Energy's historical actual
repex compares to its expected repex for the 2016–20 regulatory control period. Figure
6.13 shows United Energy's repex spend has been steadily increasing across time
which United Energy is forecasting to continue for the first part of the 2016–20
regulatory control period before tapering off in the latter two years.
Figure 6.13 United Energy - Actual and forecast repex ($ million, 2015)
122
NER, cl. 6.5.7(e)(5).
0
20
40
60
80
100
120
140
2009 2010 2011 2012 2013 2014 2015 2016 2017 2018 2019 2020
Current regulatory control period Forthcoming regulatory control period
($ million,2015/16)

6-67 Attachment 6 – Capital expenditure | United Energy Preliminary decision 2016–20
Source: Reset RIN 2016–20 - Consolidated Information, 2009–2013 Category Analysis RIN and 2014 Category
Analysis RIN
When considering the above trend we acknowledge there are limitations in long term
year on year comparisons of replacement expenditure.
Predictive modelling
We use predictive modelling to estimate how much repex United Energy is expected to
need in future, given how old its current assets are, and based on when it is likely to
replace the assets. We modelled six asset groups using the repex model. These were
poles, overhead conductors, underground cables, service lines, transformers and
switchgear. To ensure comparability across different service providers, these asset
groups have also been split into various asset sub categories.
We have sufficient replacement volume, cost and asset age data for these modelled
categories at a granular level. This gives us the ability to assess the outcomes of
benchmark data across all distributors in the NEM. For other categories, we do not
necessarily have sufficient data to allow such comparison, for example, repex without
an associated age profile. In this instance, we rely more heavily on other assessment
techniques such as business cases and high level justifications put forward by the
service providers. However, where we have age and historical volumes, we may still
choose to use the repex model to test both the service provider's proposal and our own
findings. Our predictive modelling process is described further at appendix E. In total,
the assets in these six categories represent 58 per cent of United Energy’s proposed
repex.
We consider the best estimate of business as usual repex for United Energy is
provided by using calibrated asset replacement lives and unit costs derived from
United Energy’s recent forecast expenditure. This estimate uses United Energy’s own
forecast unit costs, but it effectively 'calibrates' the proposed forecast replacement
volumes to reflect a volume of replacement that is consistent with United Energy’s
recent observed replacement practices, rather than relying on a purely aged based
indicator. We have assessed this finding in the context of our technical review before
forming a view as to the appropriate repex component of capex for United Energy. We
set out below our views on their suitability for use in our assessment.
In total for all six modelled categories we have included an amount of $220 million
($2015) in our alternative estimate of total forecast capex, compared to United
Energy's forecast of $346 million. We have had regard to the outcome and the findings
of the technical review in considering whether it is appropriate to forecast repex on the
basis of a business as usual estimate, or whether United Energy has provided
sufficient evidence to suggest that its replacement needs are higher in the next period.
Our technical consultant, Energeia, assessed United Energy’s approach to forecasting,
In particular, whether United Energy’s forecast repex was necessary in order to
maintain its safety and reliability, or whether it was seeking to improve these outcomes.
Energeia found that while United Energy provided the most robust evidence of trading-

6-68 Attachment 6 – Capital expenditure | United Energy Preliminary decision 2016–20
off reliability repex, it had not evidenced trading-off safety repex between asset
categories. Energeia could not conclude that United Energy’s proposed repex was
prudent and efficient due to the number and degree of risks and/or issues identified.123
The CCP stated that it is consumer experience that should be the core driver of repex
levels, concluding that consumers are satisfied with current levels of repex and
therefore they see no need for a step increase in repex. It considered that the
distributors’ proposed overall level of repex is not justified as current reliability levels do
not suggest there is a need to increase repex. The CCP was of the view that the
residual ages of the distributors' assets have maintained or improved over time, opex
spending has been increasing, and condition based assessments appear subjective
and likely conservative.124
Model inputs
The repex model uses the following inputs:
The asset age profile input is the number of assets in commission and when each
one was installed.
The replacement life input is a mean replacement life and standard deviation (i.e.
on average, how old assets are when they are replaced).
The unit cost input is the unit cost of replacement (i.e. on average, how much each
asset costs to replace).
In appendix E, we describe using the repex model to create three scenarios. In each of
the three modelling scenarios (base case scenario, calibrated scenario and benchmark
scenario) we combined different data for the final two inputs.
Under all scenarios, the first input is United Energy's asset age profile (how old United
Energy's existing assets are). This is a fixed input in all three scenarios.
The second and third inputs can be varied by using different input assumptions about:
how long we expect an asset to last before it needs replacing; and
how much it costs to replace it.
The repex model takes the replacement life input for each asset category and applies it
to the actual age of the assets in each asset category. In doing this it calculates how
many assets are likely to need replacement in the near future.125 The model then
applies the unit cost input to calculate how much expenditure is needed for that
123
Energeia, Review of Victorian Distribution Network Service Provider's Initial Replacement Capex Proposals 2016–
2020, September 2015, pp. 32–33. 124
Consumer Challenge Panel Sub Panel 3, Response to proposals from Victorian electricity distribution network
service providers for a revenue reset for the 2016–2020 regulatory period, August 2015, p. 47. 125
The repex model predicts replacement volumes for the next 20 years.
6-69 Attachment 6 – Capital expenditure | United Energy Preliminary decision 2016–20
amount of replacement in each asset category. This is aggregated to a total repex
forecast for each of the next 20 years.
In the remaining part of this section, we outline the replacement lives and unit cost
inputs we tested in the repex model to assess United Energy’s proposed repex. As part
of our assessment, we compared the outcomes of using United Energy's estimated
replacement lives and its unit costs, both forecast and historical, with the replacement
lives and unit costs achieved by other NEM distributors. We also used the repex model
to determine calibrated replacement lives that are based on United Energy's past five
years of actual replacement data. These reflect United Energy's immediate past
approach to replacement.126 We calculated historic unit costs by dividing historic
expenditure by historic volumes and forecast unit costs by dividing forecast
expenditure by forecast volumes. Detail on how we prepared the model inputs is at
appendix E of this preliminary decision.127
Our repex modelling assessment is exclusive of expenditure required for VBRC repex,
which United Energy has identified in various repex categories.
'Business as usual' repex
The calibrated asset life scenario gives an estimate based on United Energy’s current
risk profile, as evidenced by its own replacement practices. Our estimate brings
forward the current replacement practices that United Energy has used to meet the
capex objectives in the past. Calibrated replacement lives use United Energy’s recent
asset replacement practices to estimate a replacement life for each asset type. These
replacement lives are calculated by using United Energy’s past five years of
replacement volumes, and its current asset age profile (which reveals how many, and
how old, United Energy’s assets are), to find the age at which, on average, United
Energy replaces its assets.
The calibrated replacement life may be different to the “nameplate” or nominal
replacement age of the asset (which we considered under the “base case” scenario).
United Energy reports these expected asset lives as part of its RIN response. However
these reflect expectations of lives from engineering and manufacturing information,
rather than observations of the economic lives achieved on the network. Using the
lives provided in the RIN response in the repex model provides estimates of repex that
greatly exceed United Energy’s own expectation of its replacement needs over the
next period. From this, we observe that, in general, these technical estimates of asset
life tend to understate the actual lives achieved on the network, and are a conservative
estimate of the observable economic life of the assets, when compared to the
calibrated replacement life.
126
For discussion on how we prepared each of the inputs see AER, Preliminary decision, Energex distribution
determination Attachment 6: Capital expenditure, Appendix E :Predictive modelling approach and scenarios, May
2015. 127
AER, Preliminary decision, Energex distribution determination, Attachment 6: Capital expenditure, appendix E,
May 2015.

6-70 Attachment 6 – Capital expenditure | United Energy Preliminary decision 2016–20
The calibrated asset life scenario has been our preferred modelling scenario in recent
reviews of other service providers.128 This is because we considered the calibrated
replacement lives formed the basis of a business as usual estimate of repex, as they
are derived from the service provider's actual replacement practice observed over the
past five years and the observable (or revealed) economic replacement lives of the
assets.
A service provider decides to replace each asset at a certain time by taking into
account the age and condition of the asset, its operating environment, and its
regulatory obligations. If the service provider is currently meeting its network reliability,
quality and safety requirements by replacing assets when they reach a certain age,
then by adopting the same approach to replacement in future they are likely to
continue to meet its obligations. Consequently, the estimates derived from the model
reflect the replacement practices that United Energy has used in the past to meet the
capex objective of maintaining the safety and reliability of the network.
If underlying circumstances are different in the next regulatory control period, then this
approach to replacement may no longer allow a service provider to meet its
obligations. We consider a change in underlying circumstances to be a genuine
change in the underlying risk of operating an asset, genuine and justifiable evidence
that there has been a change in the expected non-age related condition of assets from
the last regulatory control period, or a change in relevant regulatory obligations (e.g.
obligations governing safety and reliability).
If we are satisfied that there is evidence of a change in a service provider's underlying
circumstances, we will accept that future asset replacement should not be based on a
business as usual approach. This means that where there is evidence that a service
provider's obligations have changed then it may be necessary to provide a forecast of
repex different to the business as usual estimate. This alternative forecast would be
required in order to satisfy us that the amount reasonably reflects the capex criteria.
Where there are new obligations (or fewer obligations) we can use the service
provider’s past practices as a first step before estimating the impact of the change. The
new safety obligations arising from the VBRC recommendations represent a change in
circumstances from the ‘business as usual’ practices of the last period. The impact of
these are set out in appendix B.5 and, as noted above, are included within our
consideration of total repex. We do not consider that United Energy has identified other
new obligations for the next regulatory period that cannot be captured by adopting the
‘business as usual’ forecast of repex. Consequently, we have relied on our estimate
from the calibrated repex model, in combination with our findings in relation to the new
safety obligations, in assessing whether United Energy proposed repex reasonably
reflects the capex criteria.
128
In our determinations for NSW, Queensland and South Australian distributors.

6-71 Attachment 6 – Capital expenditure | United Energy Preliminary decision 2016–20
The CCP highlighted variances across distributor's stated asset lives and anomalies in
the Victorian distributors’ data. The CCP supported a more standard approach to asset
lives across the distributors. It noted the average residual ages of the distributors'
assets have been maintained or improved over time. The current levels of capex have
not resulted in a deterioration of residual asset lives, which the CCP considers implies
there is no need for an increase in repex over current expenditure levels.129 We
consider these views support our use of the calibrated scenario as the asset lives are
derived from a distributor’s revealed replacement approach.
The Victorian Greenhouse Alliance was concerned with the significant increases to
repex the Victorian distributors are proposing. It considered this was concerning given
that over-investment in the networks over recent regulatory periods has led to excess
levels of network capacity and declining network utilisation. It is also found it
concerning that high revenue proposals were being put forward at a time of declining
capacity utilisation, a reduced average asset age for most asset categories, static or
falling demand and consumption, and reductions in the excessive reliability
standards.130
As noted above, we are satisfied that with the exception of additional funding to
address the impact of new safety obligations a business as usual approach to repex
will provide United Energy with sufficient capex to manage the replacement of its
assets and meet the capex objectives of maintaining safety, reliability and security of
the distribution system.
That said, we have also considered whether the service provider’s replacement
practices from the last regulatory control period did more than maintain safety,
reliability and security of the distribution system, such that applying the business as
usual approach for asset replacement may result in replacement practices that provide
for expenditure over and above what is necessary to satisfy the capex objectives. In
considering the efficiency of recent replacement practices, we place some weight on
the ex-ante capex incentive framework under which the service providers' operate.
There are incentives embedded in the regulatory regime that encourage a service
provider to spend capex efficiently (which may involve spending all of the allowance,
less or more, in order to meet the capex objectives). A service provider is only funded
in the regulatory control period to meet the capex allowance. The service provider
keeps the funding cost obtained over the regulatory control period of any unspent
capex for that period, and, conversely, bears the funding cost of any capital
expenditure that exceeds the allowance. In this way, the service provider has an
incentive to spend efficient capex, or close to the allowance set by the regulator, as it is
essentially rewarded (penalised) for any underspend (overspend). This provides some
assurance that a service provider reacting to these incentives will undertake efficient
129
Consumer Challenge Panel Sub Panel 3, Response to proposals from Victorian electricity distribution network
service providers for a revenue reset for the 2016–2020 regulatory period, August 2015, pp. 48, 50–51. 130
Victorian greenhouse alliance, Submission to the AER - Local Government Response to the Victorian Electricity
Distribution Price Review 2016–20 - 13 July 2015, p. 7.

6-72 Attachment 6 – Capital expenditure | United Energy Preliminary decision 2016–20
capex to meet the capex objectives. This means that to some extent we can rely on the
ex-ante capex framework to encourage the service providers to engage in efficient and
prudent replacement practices.
Going forward, this incentive will be supplemented by a Capital Expenditure Sharing
Scheme, which will provide a constant incentive to spend efficient capex over the
regulatory control period, as well as the ability to exclude capex overspends from the
RAB as part of an ex-post review. These additional arrangements will provide us with
greater confidence that the service provider’s past replacement practices are likely to
reflect efficient and prudent costs, such that business as usual asset replacement
approach is likely to be consistent capex objectives.
Possible future rule changes may also extend the regulatory investment test for
distribution (RIT-D) to repex. Such a change would make it incumbent upon the service
provider to develop credible options for asset replacement, including considering
whether the asset life could be extended or whether the asset could be retired rather
than replaced.
Finally, the collection of a longer period of data on changes in the asset base as part of
our category analysis RIN will provide us with further information into the service
providers' asset replacement practices over a longer period of time. This will further
inform our understanding of business as usual replacement practice to estimate repex.
More time series data would also strengthen our ability to use benchmarked
information (e.g. asset life inputs) in the repex model in the future, which is intended to
drive further efficiency in replacement expenditure.
Calibrated scenario
The calibrated repex model scenario, which was described in the last section, provides
an estimate of replacement volumes for the next period. In order to estimate how much
repex is required to replace this estimated volume of assets, we must multiply the
volume by the cost of replacing a single asset (unit cost). We tested two unit cost
assumptions, based on data provided by United Energy:
We have modelled the calibrated lives using two unit cost assumptions, being:
United Energy's own historical unit costs from the current regulatory period. These
reflect the unit costs United Energy has incurred over the last five years.
United Energy's own forecast unit costs for the next regulatory period. These reflect
the unit costs United Energy expects to incur over the next five years.
Applied to the forecast volumes predicted from calibrated replacement lives, the repex
model estimates $220 million of repex using United Energy's historical unit costs, and
$272 million using forecast unit costs. These are both below United Energy's forecast
of $346 million for the six modelled asset categories. This suggests that United
Energy’s forecast is not likely to reflect a business as usual amount of repex.
There is a significant difference between the calibrated scenario outcomes when using
United Energy's historical or forecast unit costs. United Energy's forecast unit costs for
6-73 Attachment 6 – Capital expenditure | United Energy Preliminary decision 2016–20
the next five years are, on average, higher than its unit costs over the last five years.
However, in the absence of a reasonable explanation, we would not expect forecast
unit costs to be higher than historical unit costs given the incentive framework
encourages a distributor to become more cost efficient over time.
We compared United Energy's historical unit costs to benchmark unit costs. These are
based on the unit costs of all NEM distributors across the consistent asset categories
we use in the repex model, which were provided as part of the category analysis RIN.
In summary, we take unit cost observations from across the NEM and find an average
unit cost, a lower quartile unit cost, and the lowest unit cost in the NEM for each asset
category. When applied in the repex model average benchmark unit costs produced an
almost identical forecast for the modelled categories compared to using United
Energy’s own historic unit costs. This suggested United Energy's historical unit costs
are more likely to reflect a realistic expectation of input costs than the unit costs it
forecasts.
Accordingly, we adopted United Energy's historical unit costs for the purpose of
calculating a business as usual repex estimate. Consequently, we consider $220
million is the most reasonable business as usual estimation of repex. As noted above,
we will rely on this outcome and the findings of the technical review in considering
whether it is appropriate to forecast repex on the basis of a business as usual
estimate, or whether United Energy has provided sufficient evidence to suggest that its
replacement needs are higher in the next regulatory control period, such that its
forecast of $346 million is appropriate.
Testing other model inputs
As outlined earlier (and in appendix E) we used the repex model to create other
scenarios combining different input data. In this section we explain how the outcomes
of these other scenarios support our conclusion to use the calibrated scenario.
Base case scenario outcomes
United Energy provided its own estimate of asset replacement lives in its RIN
response. To test this inputs we include them in a predictive modelling scenario that is
referred to as the base case. The base case scenario gives repex estimates of $913
million (historical unit cost) and $1.3 billion (forecast unit cost). These forecasts are
significantly higher than United Energy's forecast of $346 million for the six modelled
asset groups.
The replacement profile predicted by the repex model under the base case scenario
features a sharp step-up in expenditure in the first year of the forecast, which then
declines over the remainder of the period. This replacement profile indicates that a
significant portion of the asset population currently in commission is much older than
would be expected using United Energy's estimated replacement lives. Using this input
causes the model to immediately predict the replacement of this stock of assets. This,
in turn, results in a large stock of predicted asset replacements in the first year of the
forecast, which then declines over time.

6-74 Attachment 6 – Capital expenditure | United Energy Preliminary decision 2016–20
Based on our analysis of the base case scenario outcomes we consider that United
Energy's estimated replacement lives are not credible or reliable for the following
reasons.
First, if United Energy's actual replacement lives were consistent with their estimated
replacement lives, we would not expect to see the observed asset replacement profile.
If United Energy's actual asset replacement profile followed its estimated replacement
lives, the older assets would have:
already reached the end of their economic (replacement) lives and would have
already been largely replaced; and
would therefore not be expected to be in the asset age profile, or be in such
insignificant volumes that it would not materially affect the outcome of predictive
modelling.
The 'step-up/trend down' replacement profile observed from the base case scenario
suggests that a significant proportion of the asset population has survived longer than
would be expected using United Energy's estimated replacement lives. These 'survivor'
assets have a material effect on the observed outcome. This outcome suggests that
United Energy's estimated replacement lives are shorter than those it achieves in
practice.
Second, further analysis of the base case scenario reveals the replacement life inputs
are the main drivers of the base case scenario outcome. Under the calibrated scenario
where United Energy's estimated replacement lives are substituted with calibrated
replacement lives the model outputs are $220 million for historical unit costs and
$272 million for forecast unit costs. Taken together with the information from our other
analytical techniques, and our concerns that United Energy's estimated replacement
lives do not reflect its actual replacement practices, we consider that the estimated
replacement life information provided by United Energy will not result in a reasonable
forecast of business as usual repex.
Benchmarked scenario outcomes
Benchmarked uncalibrated replacement lives
We developed a series of benchmark replacement lives using the data collected from
all NEM distributors in the category analysis RINs. For model inputs we used the
average, third quartile (above average), and longest replacement lives of all NEM
distributors for each category. We discuss how we prepared this data in appendix E.
As with United Energy's estimated replacement lives, we found using these benchmark
replacement lives produced sharp 'step-up/trend down' forecast expenditure, indicating
the replacement lives used are likely to be too short for modelling purposes as they
predict a large unrealistic 'backlog' of replacement. When used in the model these also
produced outcomes higher than United Energy's own forecasts.
Benchmarked calibrated replacement lives

6-75 Attachment 6 – Capital expenditure | United Energy Preliminary decision 2016–20
We developed benchmark calibrated lives by first using the repex model to calculate
calibrated lives based on the replacement data from all NEM distributors. For model
inputs we again used the average, third quartile (above average), and longest of the
calibrated lives of all NEM distributors for each category. We discuss how we prepared
this data in appendix E.
When applied to the repex model, compared to using calibrated replacement lives
based on United Energy’s data the:
average benchmark and third quartile calibrated replacement lives produced higher
outcomes
longest benchmark calibrated replacement lives produced lower outcomes.
When applied to the repex model, compared to United Energy’s proposed forecast
repex for the modelled categories the:
benchmark average calibrated lives produced a higher outcome
benchmark third quartile and longest calibrated lives produced lower outcomes.
The calibrated benchmark replacement lives may reflect to some extent the particular
circumstances of a distributor and this may not be applicable to the business under
review. These inputs provide us with a check that United Energy's calibrated
replacement lives were reasonable against its peer service providers in the NEM.
Further, these outcomes support our view that United Energy's forecast for the
modelled categories is likely to be a reasonable estimate of business as usual repex.
Benchmarked unit costs
We developed industry benchmark unit costs using the data collected from all NEM
distributors in the category analysis RINs. For model inputs we used the average, first
quartile (below average), and lowest unit costs of all NEM distributors for each asset
category. We discuss how we prepared this data in appendix E.
When applied to the repex model, compared to using United Energy’s unit costs the:
average benchmark unit costs produced a similar but slightly higher outcome
first quartile and lowest benchmark unit costs produced lower outcomes.
We consider the benchmark unit costs provide a useful comparison with the cost of
other distributors in the NEM.
United Energy’s predictive modelling
United Energy submitted a report by Nuttall Consulting which we respond to in the
remainder of this section. We reviewed the submissions of United Energy and Nuttall
Consulting and continue to consider that our predictive modelling is a useful and
important technique when assessing United Energy’s forecast of repex against the

6-76 Attachment 6 – Capital expenditure | United Energy Preliminary decision 2016–20
capex criteria. Our predictive modelling approach is well established having been used
by us in previous distribution determinations and by other regulators.131 It has been
refined following extensive consultation as part of the Better Regulation program. It
was clear from our engagement with stakeholders in that process that calibration is
understood to be an integral part of good practice in repex modelling for the very
reason that it utilises updated data provided by the business being regulated. It is not
an arbitrary process or one which involves manipulation to arrive at a pre-determined
outcome. It is a systematic process with a transparent purpose.
United Energy’s forecast for the six categories we modelled was $346 million. Nuttall
consulting’s modelling scenarios range from 16 per cent below United Energy’s repex
forecast to three per cent above its forecast. However, the majority are below United
Energy’s forecast by between nine per cent and sixteen per cent. Nuttall consulting
noted the change to its forecast unit cost parameter had the most significant effect on
outcomes. The results suggesting that the unit costs United Energy is using for its
forecast are materially higher, in aggregate and on average, than it has incurred in
recent history.132
Nuttall Consulting’s approach was based on our approach for the NSW draft
determinations. However, it utilised a range of slightly different modelling inputs
compared to those we employ in our modelling approach. Nuttall consulting also
modelled pole top structures which we do not model under our approach. Further
explanation of why we do not model this category is in the following section on other
repex categories.133
United Energy note their repex forecast for the modelled categories falls within Nuttall
Consulting’s range of scenarios. United Energy submitted its current performance data
is indicating higher asset failure rates which are not fully reflected in the repex model
across certain asset categories and considered this would underestimate future repex
needs. Further, that forecast repex includes expected asset failures attributable to
causes other than age such as third party damage. It was of the view that the repex
model was based on relatively young average asset age with a bias towards lower
replacement volumes which would again underestimate future repex.134
We consider that Nuttall Consulting’s findings are consistent with the outcome of our
predictive modelling, indicating that United Energy’s forecast for the modelled repex
categories is higher than a business as usual estimate. We do not consider United
Energy has justified that there is a reason to depart from our approach in this instance.
131
OFGEM, Strategy decisions for the RIIO-ED1 electricity distribution price control - Tools for cost assessment,
March 2013, p. 44; AER, Final decision: Victorian electricity distribution network service providers: Distribution
determination 2011–2015, October 2010; AER, Final decision: Aurora Energy distribution determination, April
2012. 132
Nuttall Consulting, AER repex modelling, Assessing UED’s replacement forecast, a report to UED, April 2015, pp.
19–20. 133
Nuttall Consulting, AER repex modelling, Assessing UED’s replacement forecast, a report to UED, April 2015, pp.
1–20. 134
United Energy, Regulatory Proposal 2016–20, April 2015, p. 72.

6-77 Attachment 6 – Capital expenditure | United Energy Preliminary decision 2016–20
In particular, we consider that higher failure rates and third party causes of failure are
captured by the calibrated model, as it utilises recent replacement practices in
estimating efficient repex. The calibrated replacement lives reflect a continuing of the
replacement practices that United Energy has used in the past to meet the capex
objective of maintaining the safety and reliability of the network, including its responses
to replacing failing assets.
Other repex categories
Repex categorised as supervisory control and data acquisition (SCADA), network
control and protection (collectively referred to hereafter as SCADA); pole top
structures; and assets identified in the "other" category have generally not been
included in the repex model in recent decisions. We conducted a qualitative review of
United Energy’s proposal on these expenditure items and comparison with historical
trends. Together, these categories of repex account for $178 million (45 per cent) of
United Energy's proposed repex.
As noted in appendix E, we did not consider pole top structures were suitable for
inclusion in the model because of their relationship to pole replacement. That is, when
a pole is replaced, it usually includes the structure, such that it is difficult to predict the
number of structures that will be replaced independent of the pole category. Where we
are unable to directly use predictive modelling for pole top structures we have placed
more weight on an analysis of historical repex, trends, and information provided by
United Energy in relation to these categories. Our analysis of these is included below.
We consider that the replacement of network assets is likely to be relatively recurrent
between periods. There will be period-on-period changes to repex requirements that
reflect the lumpiness of the installation of assets in the past. Using predictive tools
such as the repex model allows us to take this lumpiness into account in our
assessment. For repex categories we cannot model, historical expenditure is our best
high level indicator of the prudency and efficiency of the proposed expenditure. Where
past expenditure was sufficient to meet the capex criteria it can be a good indicator of
whether forecast repex is likely to reasonably reflect the capex criteria. This is due to
the predictable and recurrent nature of repex.135
For unmodelled asset categories we consider that if the forecast expenditure for the
next period is similar or lower than the expenditure in the last period, the distributor’s
forecast is likely to satisfy the capex criteria. If forecast repex exceeds historical
expenditure, we would expect the distributor to sufficiently justify the increase.
We have accepted United Energy’s proposed repex for pole top structures of $97
million and its proposed repex for SCADA of $33 million. However, we do not accept
United Energy’s proposed forecast repex for “other” repex categories of $122 million.
We are instead satisfied that United Energy’s “other” repex from the 2011–15 period of
135
AER, Expenditure Forecast Assessment Guideline for Electricity Distribution, November 2013, pp. 7–9.

6-78 Attachment 6 – Capital expenditure | United Energy Preliminary decision 2016–20
$28 million is sufficient to meet business as usual requirements, and reasonably
reflects the capex criteria.
We explain the reasons for our decision in the remainder of this section. There is also
support from submissions that United Energy’s proposed total repex may not
reasonably reflect the capex criteria. While we are satisfied that United Energy’s
proposed repex for the six modelled categories reasonably reflects the capex criteria,
our assessment of the remainder of United Energy total forecast repex does not
support the entirety of its proposed increase to repex.
The CCP questioned the Victorian distributor’s arguments that condition based
monitoring has identified more assets at risk than occurred in the past, necessitating
more repex. It considered that unless there are exogenous reasons causing faster
deterioration of assets than what occurred in the past, the only reason for significant
increases in repex would be:
a more conservative approach is being used to establish asset condition
distributors are applying less care in their maintenance practices.
Since the Victorian distributors’ have not had an overall reduction in network
performance the CCP considers that the first cause above is more likely. This leads the
CCP to conclude that greater conservatism is being applied to condition assessments
than was applied in the past.136
The CCP was also concerned with the approach of the businesses to assessing asset
health, considering that the bulk of assessments are being made on a subjective
qualitative basis. For example, visual inspections which will vary between individuals,
and that the context for an inspection may produce greater conservatism like
performing an assessment following bushfires. The CCP also questioned the assertion
that increased failure rates have driven the increased proposed repex.137
The Victorian Greenhouse Alliance noted there was little information in the proposals
on asset condition. It considered this makes it difficult to assess the validity of the
distributors' claims, and that the distributors should provide greater transparency on
asset age trends and asset condition data.138
Our assessment of “other” repex revealed concerns with the levels proposed,
consistent with the concerns raised in submissions. We do not accept United Energy’s
proposed repex of $122 million for these categories. We are instead satisfied that an
amount of $28 million reflects the capex criteria.
136
Consumer Challenge Panel Sub Panel 3, Response to proposals from Victorian electricity distribution network
service providers for a revenue reset for the 2016–2020 regulatory period, August 2015, p. 52. 137
Consumer Challenge Panel Sub Panel 3, Response to proposals from Victorian electricity distribution network
service providers for a revenue reset for the 2016–2020 regulatory period, August 2015, p. 47. 138
Victorian greenhouse alliance, Submission to the AER - Local Government Response to the Victorian Electricity
Distribution Price Review 2016–20 - 13 July 2015, p. 34.

6-79 Attachment 6 – Capital expenditure | United Energy Preliminary decision 2016–20
In relation to the six modelled categories, the assessment we have conducted
essentially provides expenditure for a continuation of the replacement practices that
United Energy has used in the last regulatory period to meet the capex objectives. The
ex-ante efficiency incentives embedded in the regulatory regime, provides a degree of
assurance that a service provider responding to these incentives in the past will have
engaged in replacement practices are prudent and efficient. We have also considered
the expenditures related to obligations arising from the recommendations of the VBRC
in appendix B.5.
Pole top structures
United Energy has forecast $97 million of repex on pole top structures over the 2016–
20 regulatory control period. This represents a four per cent decrease over the 2011–
15 regulatory control period.
As noted above, we consider repex is likely to be relatively recurrent between periods,
and that historical repex can be used as a good guide when assessing United Energy’s
forecast.
Given United Energy’s forecast is lower than its expenditure in the last period, we are
satisfied that forecast repex for pole top structures of $97 million is likely to reflect the
capex criteria and have included this amount in our alternative estimate of total
forecast capex.
SCADA, network control and protection
United Energy's proposal includes $34 million for replacement of SCADA, network
control and protection (collectively referred to as SCADA). This represents a $7 million
increase over the 2010–15 regulatory control period. We consider the proposed
increase is relatively low in materiality. We are satisfied that United Energy’s forecast
SCADA repex of $34 million is likely to reflect the capex criteria and have included this
amount in our alternative estimate of total forecast capex.
Other repex
United Energy categorised a number of assets under an "Other" asset group in its RIN
response. United Energy forecast $122 million of repex for these assets for the 2016–
20 regulatory control period. This is over four times higher than the 2011–15 regulatory
control period, or $94 million, as shown in Figure 6.14. The assets include:139
various zone substation expenditure
ACR/RCGS
rogue
fuse saver
139
United Energy, Regulatory Proposal 2016–2020, April 2015, p. 71.

6-80 Attachment 6 – Capital expenditure | United Energy Preliminary decision 2016–20
clashing
animal
communications
environmental
bundling/noise
asbestos
power quality
PQ meter other
LV regulator
harmonic filter
prot - BTOS
safety
CCTV
REFCL/GFN
operational Technology
op Technology.
Figure 6.14 United Energy’s actual and proposed “other” repex ($2015)
Source: Reset RIN 2016–20 - Consolidated Information, 2009–2013 Category Analysis RIN and 2014 Category
Analysis RIN.
If repex in the forecast period exceeds historical expenditure, we would expect that the
distributor to sufficiently justify the increase. As noted above, we consider repex is
0
5
10
15
20
25
30
35
2011 2012 2013 2014 2015 2016 2017 2018 2019 2020
Current regulatory control period Forthcoming regulatory control period
($ million,2015/16)

6-81 Attachment 6 – Capital expenditure | United Energy Preliminary decision 2016–20
likely to be relatively recurrent between periods, and that historical repex can be used
as a good guide when assessing United Energy’s forecast. There are almost no
historical examples of expenditure of this type in United Energy’s replacement
programs that we could identify. It is unclear why the need to replace these assets has
suddenly and significantly arisen in the forthcoming period.
We accept there may be a need to replace a number of these assets. However, we are
of the view that United Energy has not provided justification why it needs has to spend
significantly more repex on some of these categories in the forthcoming period. United
Energy has not provided business cases with reasonable options analysis or sufficient
cost-benefit analysis to justify the proposed repex, and there is a lack of top-down
assessment.
We assessed a sample of United Energy’s business cases, as we could not identify
comprehensive information in for all categories. We concluded these were not
sufficient to support the proposed replacement expenditure. The business cases did
not contain robust options analysis. For example, the project is assessed versus a do
nothing option. The cost-benefit analysis also appears insufficient.
In the absence of persuasive evidence to depart from United Energy’s historical repex
from the last regulatory period, we are satisfied that United Energy’s repex on other
categories from the 2010–15 period of $28 million is sufficient to meet the capex
criteria. We note our assessment of “other” repex is exclusive of expenditure required
for VBRC repex, which United Energy has identified. Our assessment of VBRC
expenditure is at attachment B.5.

6-82 Attachment 6 – Capital expenditure | United Energy Preliminary decision 2016–20
Network health indicators
As noted above, we have looked at network health indicators and benchmarks to form
high level observations about whether United Energy’ past replacement practices have
allowed it to meet the capex objectives. While this has not been used directly either to
reject United Energy’ repex proposal, or in arriving at an alternative estimate, the
findings are consistent with our overall findings on repex. In summary we observed
that:
the measures of reliability and asset failures show that outages on United Energy’
network have been relatively stable or declining across time with the exception of
2014 which saw a sharp increase(see Trends in reliability and asset failure, along
with Table 1 and Figure 1)
measures of United Energy’ network assets residual service lives and age show
that the overall age of the network is being maintained. Using age as a high level
proxy for condition, this suggests that historical replacement expenditures have
been sufficient to maintain the condition of the network (see Trends in the
remaining service life and age of network assets, along with Figure 2)
asset utilisation has reduced in recent years which means assets are more lightly
loaded, this is likely to have a positive impact on overall asset condition (see Asset
utilisation discussion below).
Further, the value of customer reliability has recently fallen. Other things being equal,
this fall should result in the deferral of repex as the value customers place on reliability
for replacement projects has fallen.
The above indicators generally suggest that replacement expenditure in the past
period has been sufficient to allow United Energy to meet the capex objectives. This is
consistent with our overall findings on repex from our other assessment techniques.
The asset health indicators are discussed in more detail below.
Trends in reliability and asset failure
Asset failure is a significant contributor to the volume of sustained interruptions on
United Energy’ network. Table 6.13 shows that, over the 2008–14 period 36.9per cent
of total interruptions on United Energy’ network were caused by the failure of assets.140
140
These measures do not include planned outages, momentary outages, major event days and excluded events.
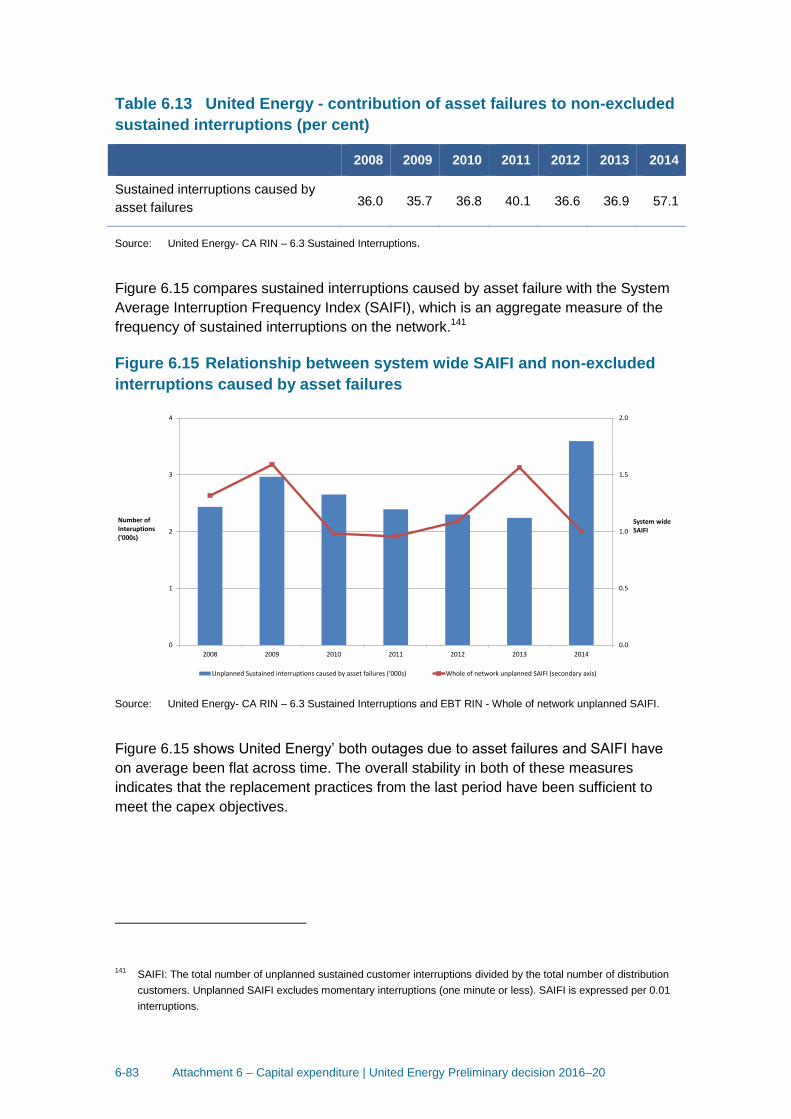
6-83 Attachment 6 – Capital expenditure | United Energy Preliminary decision 2016–20
Table 6.13 United Energy - contribution of asset failures to non-excluded
sustained interruptions (per cent)
2008 2009 2010 2011 2012 2013 2014
Sustained interruptions caused by
asset failures 36.0 35.7 36.8 40.1 36.6 36.9 57.1
Source: United Energy- CA RIN – 6.3 Sustained Interruptions.
Figure 6.15 compares sustained interruptions caused by asset failure with the System
Average Interruption Frequency Index (SAIFI), which is an aggregate measure of the
frequency of sustained interruptions on the network.141
Figure 6.15 Relationship between system wide SAIFI and non-excluded
interruptions caused by asset failures
Source: United Energy- CA RIN – 6.3 Sustained Interruptions and EBT RIN - Whole of network unplanned SAIFI.
Figure 6.15 shows United Energy’ both outages due to asset failures and SAIFI have
on average been flat across time. The overall stability in both of these measures
indicates that the replacement practices from the last period have been sufficient to
meet the capex objectives.
141
SAIFI: The total number of unplanned sustained customer interruptions divided by the total number of distribution
customers. Unplanned SAIFI excludes momentary interruptions (one minute or less). SAIFI is expressed per 0.01
interruptions.
0.0
0.5
1.0
1.5
2.0
0
1
2
3
4
2008 2009 2010 2011 2012 2013 2014
System wideSAIFI
Number of Interuptions('000s)
Unplanned Sustained interruptions caused by asset failures ('000s) Whole of network unplanned SAIFI (secondary axis)

6-84 Attachment 6 – Capital expenditure | United Energy Preliminary decision 2016–20
Trends in the remaining service life and age of network assets
Another factor which we have considered when assessing United Energy’ repex
requirements for the 2016–20 period is the trend in United Energy’ residual asset life
across time. We are satisfied that residual service life is a reasonable high-level proxy
for asset condition. Asset condition is a key driver of replacement expenditure.
Figure 6.16 shows that United Energy’ residual asset lives have been flat over the
period 2006–2013. This means that, on average, United Energy’ network assets are
staying the same age.
Figure 6.16 United Energy estimated residual service life network
assets
Source: United Energy- EBT RIN - 4. Assets (RAB) - Table 4.4.2 Asset Lives – estimated residual service life
(Standard control services)
We acknowledge limitations exist when using estimated residual service life to indicate
the trend in the underlying condition of network assets. Large volumes of network
augmentation and connections can result in a large stock of new assets being installed
in the network, which may bring down the network’s average age. In this way, the
residual service life of the assets may increase without necessarily addressing any
underlying asset condition deterioration.
Noting the above, the flat trend in residual lives (where age is a proxy for asset
condition) suggests that the health of United Energy’ asset base has been maintained.
Asset utilisation
We consider the degree of asset utilisation can impact asset condition for certain
network assets. As set out in the augex section B.2, we note United Energy has
experienced a steady decrease in utilisation levels at its zone substations between
2010 and 2014. United Energy undertook zone substation augmentation projects
0
10
20
30
40
50
2006 2007 2008 2009 2010 2011 2012 2013
Years
Overhead network assets < 33kV Underground network assets < 33kVDistribution substations (incl transformers) Overhead network assets ≥ 33kVUnderground network assets ≥ 33kV Zone substations and transformers“Other” assets with long lives “Other” assets with short lives

6-85 Attachment 6 – Capital expenditure | United Energy Preliminary decision 2016–20
between 2010 and 2014 that led to a decrease in the number of substations operating
above 70 per cent of their maximum capacity. We note that the flattening of demand
between 2010 and 2014 may have contributed to a reduction in the utilisation of the
network. As of 2014, there are no substations operating above their maximum
capacity.
We are satisfied this demonstrates that United Energy’ network has spare capacity in
its network based on past investments. All things being equal, we expect a positive
correlation between asset condition and lower network utilisation exists for certain
asset classes.
However we recognise that:
The relationship between asset utilisation and condition is not uniform between
asset types. For example; poles and fuses.
The relationship is not necessarily linear (e.g. condition may not be materially
impacted until a threshold point is reached).
The condition of the asset may be difficult to determine (e.g. overhead conductor).
As such early-life asset failures may be due to utilisation or, more commonly, a
combination of factors (e.g. utilisation and vibration).
While noting these issues, we consider that United Energy’s asset utilisation has not
been high, and we do not expect any material deterioration of United Energy’ network
assets is likely to have occurred in recent years due to high utilisation of the assets.
B.5 Victorian Bushfires Royal Commission
B.5.1 Bushfire safety-related capital expenditure
United Energy proposed a forecast of $ 72.698 million ($2015) for bushfire safety-
related capex (including overheads and escalation). This is driven by a bushfire safety
mitigation program for the 2016–20 period.
We do not accept United Energy's proposed $ 72.698 million ($2015) forecast and
have not included this amount in their replacement capital expenditure. Our alternative
forecast of this allowance is $33.941 million ($2015) (including overheads and
escalation).
In coming to this view, we have assessed the United Energy bushfire safety capex
proposals. Based on our assessment, we find that the proposed capex for the bushfire
safety programs do not reasonably reflect the capex criteria and therefore we have not
included the proposed capex in our estimate of United Energy's capex requirements.
Our assessment of this program is contained in the section below.

6-86 Attachment 6 – Capital expenditure | United Energy Preliminary decision 2016–20
Table 6.14 United Energy's proposed capex for a bushfire mitigation
program ($2015, million including overheads & escalation)
Strategy Proposed capex
Connectors 4.687
Spreaders 0.475
Conductors 4,297
HV ABC 18.468
LV ABC 1.234
SWER (unmodelled) 18.367
Dampers 4.779
REFCLs 20.390
Total 72.698
Sources: United Energy, Regulatory Proposal 2016–20, Attachment: NET 449 – AER Category Expenditure
Explanation Statement: Asset Class – Connectors and Conductors, April 2015, Table 8, p. 23 and United
Energy, Regulatory Proposal 2016–20, Attachment: NET 457 – AER Category Expenditure Explanatory
Statement – Other Programs, April 2015, Table 5.4, p. 30
AER assessment approach
For bushfire safety related capex there are three potential bases for consideration of a
funding requirement. These are:
1. Business As Usual (BAU): Capex which we assess along with other capex in
attachment 6. We use the tools outlined in attachment 6 to assess the efficiency of
the forecast. These capex projects relate to maintaining the quality, reliability or
security of supply of standard control services or the reliability or security of the
distribution system through the supply of standard control services or the safety of
the distribution system through the supply of standard control services.142
2. Approved projects are set out in the companies’ Electrical Safety Management
Scheme (ESMS) or Bushfire Mitigation Plan (BMP). We rely on Energy Safe
Victoria to establish need. We then assess the efficiency of the forecast cost.
These projects are assessed in accordance with the capital expenditure objectives
to determine if they are necessary to comply with applicable regulatory obligations
or requirements associated with the provision of standard control services.143
142
NER, cl. 6.5.7(a)(3) & (4). 143
NER, cl. 6.5.7(a)(2).

6-87 Attachment 6 – Capital expenditure | United Energy Preliminary decision 2016–20
3. Pending regulations from the Victorian Government which will implement aspects of
recommendation 27 of the Victorian Bushfires Royal Commission (VBRC). The
timing and scope of the regulations are not yet known. We want to provide the
DNSP with a mechanism to recover the prudent and efficient costs associated with
any new obligations while ensuring that consumers pay no more than necessary for
the implementation of these.
Our first order of assessment is to consider whether a proposed expenditure fits into
one of these broad categories. This helps us to determine which are the most
appropriate tools to assess whether a proposal satisfies the capital expenditure
objectives.144 We also consider if the amount sought is compliant with the capital
expenditure criteria, particularly if the cost is prudent and efficient.145
This proposed capex amount for the bushfire safety program is incremental to United
Energy's business as usual capex related to bushfire risk management. In comparison
to the other Victorian distributors, United Energy's program of safety activities is less
reliant on setting firm targets for specific activities in its ESMS but places higher
emphasis on the results from operational activities. This difference means the United
Energy program is not directly comparable to the programs of the other Victorian
distributors.
Table 6.14 sets out the proposed components of the program.
Assessment of United Energy's capex
United Energy has sought allowances for the cost of work necessary to:
install vibration dampers, armour rods and spacers in its network
install REFCL (Rapid Earth Fault Current Limiting) technology devices
remove SWER (single wire earth return) lines
install or replace connectors, conductors and Low Voltage and High Voltage Aerial
Bundled Cabling (ABC).
Based on the evidence submitted by United Energy and other information before us,
we are not satisfied that the whole of the bushfire mitigation program as proposed by
United Energy is required to maintain the reliability and safety of the network and to
comply with applicable regulatory obligations or requirements and would be a prudent
and efficient investment in the network.
As such, we do not accept United Energy's capex proposal to spend $72.698 million
($2015, including overheads and escalation) on a bushfire mitigation program. Our
alternative estimate of United Energy's total capital expenditure allowance instead
144
NER, cl. 6.5.7(a). 145
NER, cl. 6.5.7(c)(1) & (2).

6-88 Attachment 6 – Capital expenditure | United Energy Preliminary decision 2016–20
factors in expenditure related to United Energy's business as usual bushfire risk
management, based on their current approved Electrical Safety Management Scheme.
In summary, we consider that:
United Energy's bushfire mitigation expenditure program for armour rods, vibration
dampers and spacers is in response to a mandatory program of work required
under a compulsory Electrical Safety Management Scheme and is required to
comply with applicable regulatory obligations or requirements.
United Energy's VBRC proposal includes BAU capex to maintain the reliability and
safety of its network. These programs are the HV ABC, LV ABC, connectors and
conductors programs and the installation of four REFCL devices and the
reconstruction of its SWER network.
United Energy has not proposed any contingent projects in relation to possible
future regulatory obligations associated with these programs.
United Energy has not provided evidence of a mandatory obligation to address
bushfire risk from ignition by power lines through the installation of four REFCL
devices or for the reconstruction of SWER lines.
In the absence of a regulatory obligation we do not consider that United Energy's
proposed investment in REFCL technology or SWER line reconstruction is
necessary to maintain the safety and reliability of the network.
There has also been no change to regulations and / or safety standards related to
bushfire risk that would justify additional expenditure on REFCL technology.
United Energy's cost benefit analysis of their proposed program of REFCL
installations is incomplete. It omits the possibility the Victorian Government may
require a different solution to the REFCL in the areas to be served by some or all of
the proposed REFCL units. If this occurs the installation of a REFCL may be
unnecessary.
United Energy's business cases and other supporting material it has provided does
not properly evaluate the costs versus the benefits of the REFCL or SWER
replacement programs.
It is open to United Energy in its revised proposal to address the issues raised in this
preliminary decision and provide the necessary supporting material to show that its
proposed capex for the bushfire mitigation program reasonably reflects the capex
criteria, and would be in the long term interests of consumers.
We note, in our reasons below, the specific areas where sufficient supporting material
was not provided or the evidence submitted did not reasonably demonstrate the
program satisfied the criteria.
For these reasons, we do not accept United Energy's’ proposed capex for the bushfire
mitigation program satisfies the capex criteria. Each of these reasons is discussed
further below.

6-89 Attachment 6 – Capital expenditure | United Energy Preliminary decision 2016–20
Regulatory obligation
In Victoria, the safety obligations of major electricity companies are contained in the
Electricity Safety Act 1998 (Vic). Section 99 of this Act mandates that major electricity
companies must submit an approved Electricity Safety Management Scheme (ESMS)
to Energy Safe Victoria for acceptance.146 These schemes are regulated by Energy
Safe Victoria. Each of the five Victorian distributors is classed as a ‘major electricity
company’ under this Act.
It is compulsory for United Energy to comply with the accepted ESMS for its network.147
Further, the Act requires that each major electricity company must submit a Bushfire
Mitigation Plan for its network to Energy Safe Victoria and must comply with that
plan.148 The Bushfire Mitigation Plan forms part of an accepted ESMS.149 This legislated
requirement applies to the whole of the United Energy network including urban areas
of the network.
On 4 January 2011 Energy Safe Victoria issued two directions under s 141 of the
Electricity Safety Act to United Energy. A major electricity company must comply with a
direction under s 141 of this Act that applies to it.150 The first direction required that
United Energy inspect all powerlines in its network and fit armour rods and vibration
dampers by 1 November 2020 where the existing installation did not conform to the
Victorian Electricity Supply Industry standard.151 The second direction required the
fitting of spacers where the existing installation did not conform to the Victorian
Electricity Supply Industry standard.152
Two mechanisms exist for a major electricity company to address a safety concern of
when it arises. The first is to voluntarily propose to address the safety hazard by
including an undertaking in their ESMS or the Bushfire Mitigation Plan to undertake a
specific activity to address the hazard. If a proposed change to their ESMS is approved
by the safety regulator, the activity becomes an obligation which must be carried out.
The second mechanism is the creation of a new regulatory obligation by the
Government or an action by a Government agency under existing legislation. The
issuance of a direction by Energy Safe Victoria falls into this category. United Energy's
VBRC capex proposal is partially in response to regulatory obligations imposed by the
directions of ESV. However, a substantial component is based on the ongoing need to
maintain the safety and reliability of the network. The proposal has been assessed on
this basis.
146
Electricity Safety Act 1998 (Vic), s. 99 147
Electricity Safety Act 1998 (Vic), s. 106. 148
See, Electricity Safety Act 1998 (Vic), ss. 113A, 113B and 113C. 149
Electricity Safety Act 1998 (Vic), s. 113D. 150
Electricity Safety Act 1998 (Vic), s. 141(4). 151
Energy Safe Victoria, Direction under section 141(d)(2) of the Electricity Safety Act 1998 - Fitting of armour rods
and vibration dampers, 4 Jan 2011. 152
Energy Safe Victoria, Direction under section 141(d)(2) of the Electricity Safety Act 1998 - Fitting of spacers, 4 Jan
2011.

6-90 Attachment 6 – Capital expenditure | United Energy Preliminary decision 2016–20
The mandatory safety obligations of United Energy relate to three project categories
which we now assess:
United Energy Proposal
United Energy's BMP related obligations are contained in their Fire Protection Plan
dated August 2014.153
What are armour rods, vibration dampers and spacers?
Armour rods are a fitting used to protect the power conductor from damage due to
bending, compression, abrasion and fatigue due to wind-induced vibration and
flashovers. They are helical rods wound over the conductor where it sits on an
insulator. Vibration dampers are an additional device to reduce fatigue caused through
wind-induced vibration. They are often helical rods wound over the conductor a short
distance away from the cross arm. Spacers are insulated rods that are tied between
the conductors to stop them from clashing in windy conditions.
Armour rods, vibration dampers and spacers
The obligations for armour rods, vibration dampers and spacers are contained in the
Fire Prevention Plan at section 1.154 Accordingly, United Energy has demonstrated it
has an obligation to undertake this work in the next regulatory control period.
In reaching our conclusion, we have also taken into account the interrelationship
between this proposed expenditure and other expenditure proposed by United Energy.
As United Energy was directed to undertake this work we are satisfied this is a discrete
program of work that does not fall within United Energy's business as usual level of
capex to manage asset fire safety.
We next assess whether the proposed allowance satisfies the capex criteria.155 In
response to an AER information request United Energy provided a copy of their Fire
Prevention Plan.156 The plan states:157
As a result of the Victorian Bushfire Royal Commission and Recommendation
33, Energy Safe Victoria (ESV) has directed UE under section 141(2)(d) of the
Electricity Safety Act and via letters dated 4 January 2011 to amend its
Electricity Safety Management Scheme (ESMS) to include the development (or
reinforcement) of plans and procedures in relation to the fitting of spacers/
spreaders, vibration dampers and armour rods. The current status of the
progress of these programs are now reported through the UE ESMS reporting
regime.
153
United Energy, Fire Prevention Plan 2014–2019, August 2014 (provided in response to AER information request to
United Energy 022, 7 August 2015). 154
United Energy, Fire Prevention Plan 2014–2019, August 2014, p. 9. 155
NER, cl. 6.5.7(c)(1) & (2). 156
AER, Information Request to United Energy IR# 022, 7 August 2015. 157
United Energy, Fire Prevention Plan 2014–2019, August 2014, p. 8.
6-91 Attachment 6 – Capital expenditure | United Energy Preliminary decision 2016–20
United Energy has prepared forecasts for armour rods and vibration dampers (5,000),
and spacers (1,680) based on based on consideration of its ESMS reporting regime
and has provided these forecasts to ESV. We consider the survey methodology to be
sound. As the basis of this forecast is the result of a survey to establish a program to
complete the works, adjusted for works completed or programmed to be completed in
the 2011–15 regulatory control period, we accept these forecasts.
The costs to be incurred for each activity are derived from actual contract rates used
by United Energy. United Energy stated:
Unitised rates are based on agreed rates from our existing contracts with the
service providers Tenix and Zinfra.158
The unitised rate159 for the installation of vibration dampers and armour rods negotiated
by United Energy appears to be high. However, the unitised rates proposed by United
Energy are derived from contracts with independent service providers. We are satisfied
that the contracts were properly entered into on a competitive basis, based on a
detailed work specification. The unitised rate is a market tested rate. A major reason
for differences in these rates for each distributor will reflect differences in the number of
armour rods requiring treatment as a proportion of the total number of spans relative to
the number of vibration dampers required on the same span. For this activity, there are
likely to be significant differences in mobilisation, outage and traffic management costs
between the United Energy rate and the CitiPower/Powercor rate. This is particularly
so because the United Energy rate is based on a smaller program and thus is unlikely
to achieve a similar scale economy. On this basis, we accept the United Energy
unitised rate is efficient.
We calculate a unitised rate of $282.44 per spreader. This rate has been negotiated
with the service providers Zinfra and Tenix. It is an 18 per cent reduction on the current
rate. We accept this rate.
For armour rods and vibration dampers we accept United Energy's forecast of $4.779
million ($2015, including overheads & escalation).
For spreaders we accept United Energy's forecast of $ 0.475 million ($2015, including
overheads & escalation).
Accordingly, the resultant cost estimates reasonably reflect the capex criteria.
158
United Energy, Regulatory Proposal 2016–20, Attachment NET 449 – AER Category Expenditure Explanation
Statement: Asset Class – Connectors and Conductors, April 2015, p. 7. 159
Throughout this section a reference to a unitised rate of United Energy is an amount derived from United Energy,
NET 449 AER Category Expenditure Explanation Statement: Asset Class – Connectors and Conductors, April
2015, Table 8, p. 23.

6-92 Attachment 6 – Capital expenditure | United Energy Preliminary decision 2016–20
Business as usual capex
United Energy has proposed significant bushfire mitigation capex for six activities
which we consider should be assessed as BAU capex. These programs are the High
Voltage Aerial Bundled Cable (HV ABC), Low Voltage Aerial Bundled Cable (LV ABC),
connectors and conductors programs and the installation of four REFCL devices and
the reconstruction of its SWER network. This is because we have not been able to
identify a specific commitment to these six activities in either the approved United
Energy Electrical Safety Management scheme or the United Energy Fire Prevention
Plan 20142019. We note that the Fire Prevention Plan (FPP) contains United Energy's
current Bushfire Mitigation Plan.
The FPP identifies roles and accountabilities of United Energy personnel in meeting
their monitoring, operational response and reporting obligations under their ESMS.
However, the approach taken in United Energy's FPP does not set firm targets for
addressing specific defects in assets or asset categories. Rather, United Energy relies
on monitoring of their network to identify defects as they arise. They respond to
identified problems by setting in place programs to address the problem areas. These
programs are reported to ESV and actioned appropriately.
We consider this approach is consistent with United Energy maintaining the safety and
reliability of their network. However, there are no set targets for any of the six activities
listed in this section in the FPP. For a regulatory obligation to be demonstrated we
expect to be able to identify a target for a volume of work or a statement of milestones
that need to be achieved by a certain date. On this basis we consider none of the six
activities are necessary to meet a regulatory obligation or requirement. However, as
United Energy has an ongoing commitment to maintaining the safety and reliability of
its network, their overall approach to these activities is consistent with the capex
objectives. We next consider whether each listed activity individually satisfies the
capex objectives.
What are connectors?
As their name suggests, connectors are the device used to join two or more wires
together. There are a wide variety of connector types. United Energy reports that it has
a high failure rate detected in certain connector types due to incorrect installation.
Connectors
United Energy replaced 14,482 cable connectors in the current period. The forecast in
the next period is a 24 per cent reduction in the volume to be treated to 11,040.160 The
expenditure explanation statement details the history of problems encountered with
certain connector types. These manifest as outages, affecting reliability or as complete
failure leading to potential safety concerns. Because of these concerns the expenditure
160
United Energy, Regulatory Proposal 2016–20: Attachment NET 449 – AER Category Expenditure Explanation
Statement: Asset Class – Connectors and Conductors, April 2015, Table 8, p. 23.

6-93 Attachment 6 – Capital expenditure | United Energy Preliminary decision 2016–20
has not been assessed under the general replacement program of United Energy. It is
a continuation of an established program. We accept this program is necessary to
maintain the reliability and safety of the network.
In reaching our conclusion, we have also taken into account the interrelationship
between this proposed expenditure and other expenditure proposed by United Energy.
Replacement of connectors is a program of work that falls within United Energy's
business as usual level of capex to manage asset safety and reliability. We have taken
this into account in determining an allowance for this work.
We next assess whether the proposed allowance satisfies the capex criteria.161 United
Energy has prepared a forecast for connectors of 11,040 units based on consideration
of its asset management system and its historical rates of treatment. The basis of this
forecast is the result of an survey to establish a program to complete the works,
adjusted for works completed or programmed to be completed in the 2011–15
regulatory control period. We consider the forecast methodology to be sound. The
forecast volume is 24 per cent less than the volume in the current period. We accept
this forecast.
We calculate the unit rate of $424.57 per connector for this work. This rate has been
renegotiated with the service providers Zinfra and Tenix. This is an increase in the
unitised rate of 13 per cent. Although the increase in price is material, the unitised rate
is derived from contracts with independent service providers. We are satisfied that the
contracts were properly entered into on a competitive basis, based on a detailed work
specification. Therefore, the unitised rate is a market tested rate. The rate takes into
account the terrain and access difficulties which will arise as this program is
completed. These differences are unique to this work specification and mean direct
comparison of the rate for this activity with other utilities is not possible.
For connectors we accept United Energy's unitised rate and the forecast of $4.687
million ($2015, including overheads & escalation) is a reasonable estimate of the least
cost necessary to satisfy the capex objectives.
What are conductors?
Conductors is a generic term that describes the wires and cables that carry electricity
through a distribution network. The term can include bare steel, aluminium and copper
wires as well as all types of insulated cables. In this proposal the term is applied to
bare steel wires as are used in the overhead lines that exist in United Energy's
distribution area.
Conductors
An ongoing need is for the replacement of conductors as they reach the end of their
technical and economic lives. United Energy report they replaced 93,891 m of cable in
the current period. The forecast is based on a Weibull analysis of the asset population.
161
NER, cll. 6.5.7(c)(1) & (2).

6-94 Attachment 6 – Capital expenditure | United Energy Preliminary decision 2016–20
In the next period United Energy forecast a 58 per cent reduction in the volume to be
treated to 39,520 m.162 It is a continuation of an established program. We accept this
forecast replacement is necessary to maintain the reliability and safety of the network.
In reaching our conclusion, we have also taken into account the interrelationship
between this proposed expenditure and other expenditure proposed by United Energy.
Replacement of conductors is a program of work that falls within United Energy's
business as usual level of capex to manage asset safety and reliability. We have taken
this into account in determining an allowance for this work.
We next assess whether the proposed allowance satisfies the capex criteria.163 United
Energy has prepared a forecast for conductors of 39,520 m based on consideration of
its asset management system and its historical rates of treatment. The basis of this
forecast is the result of a Weibull analysis to establish a program to complete the
works, adjusted for works completed or programmed to be completed in the 2011–15
regulatory control period. We consider the application of a Weibull analysis to this
asset category is sound. The forecast is 58 per cent less than the volume in the current
period. We accept this forecast.
We calculate the unitised rate of $108.73 per m for this work. This rate has been
renegotiated with the service providers Zinfra and Tenix. Although the increase in price
is significant, the unitised rate proposed by United Energy is derived from contracts
with independent service providers. We are satisfied that the contracts were properly
entered into on a competitive basis, based on a detailed work specification. The
unitised rate is a market tested rate. The rate takes into account the terrain and access
difficulties which will arise as this program is completed. These differences are unique
to this work specification and mean direct comparison of the rate for this activity with
other utilities is not possible.
For conductors we accept United Energy's unitised rate and the forecast of $4.248
million ($2015, including overheads & escalation) reasonably reflect the capex criteria.
What is Low Voltage and High Voltage Aerial Bundled Cabling?
Aerial Bundled Cabling is a type of overhead power line. It may operate at low voltage
(1 000 volts or less) or at high voltage (above 1 000 volts). It usually involves three
insulated phase conductors bundled tightly together. It may include a fourth conductor
for the neutral which may be bare or insulated, depending on local practice.
Low Voltage Aerial Bundled Cabling (LV ABC)
Another ongoing need under United Energy's ESMS is for the replacement of
deteriorating Low Voltage Aerial Bundled Cable. The program replaced 15,381 m of
cable in the current period. The forecast in the next period is a 14 per cent reduction in
162
United Energy, Regulatory Proposal, Attachment: NET 449 – AER Category Expenditure Explanation Statement:
Asset Class – Connectors and Conductors, April 2015, Table 8, p. 23. 163
NER, cll. 6.5.7(c)(1) & (2).

6-95 Attachment 6 – Capital expenditure | United Energy Preliminary decision 2016–20
the volume to be treated to 13,191 m.164 However, this forecast is greater than would
be suggested by the asset age profile alone. Were this expenditure considered as
general replacement expenditure a lower forecast would have resulted based on the
application of the AER's repex model.
United Energy explain this higher forecast is because in treed areas it has determined
that insulated cable will have lower faults.165 We also note that this increase in the
forecast is offset by the reduction in overhead conductor replacement noted above.
Longer term, it will also reduce opex requirements as vegetation clearance
requirements are reduced. It is a continuation of an established program. We consider
the primary driver is to maintain the safety of the network. We also consider the effect
on increasing reliability will be small. On this basis we accept this program is
necessary to maintain the reliability and safety of the network.
In reaching our conclusion, we have also taken into account the interrelationship
between this proposed expenditure and other expenditure proposed by United Energy.
This is a program of work that falls within United Energy's business as usual level of
capex to manage asset fire safety. We have taken this into account in determining an
allowance for this work.
We next assess whether the proposed allowance satisfies the capex criteria.166 United
Energy has prepared a forecast for LV ABC of 13,191 m based on consideration of its
ESMS reporting regime and GIS data. The basis of this forecast is a survey to
establish a program to complete the works, adjusted for works completed or
programmed to be completed in the 2011–15 regulatory control period. We accept the
forecasting methodology is sound. The forecast is 14 per cent less than the volume in
the current period. We calculate the unit rate of $93.57 per m for this work. This rate
has been negotiated with the service providers Zinfra and Tenix. It is a 63 per cent
reduction on the current rate. We accept these forecasts.
Accordingly, the resultant cost estimate of $1.234 million ($2015, including overheads
& escalation) reasonably reflects the capex criteria.
High Voltage Aerial Bundled Cabling (HV ABC)
An issue which has arisen in the current period for all the Victorian distributors is an
increased need for early replacement of deteriorating High Voltage Aerial Bundled
Cable. United Energy has replaced 2,026 m of cable in the current period. The forecast
in the next period is a 1,349 per cent increase to 29,347 m.167 This forecast is not
consistent with the asset age profile for HV ABC. To support the increase in proposed
164
United Energy, Regulatory Proposal 2016–20: Attachment NET 449 – AER Category Expenditure Explanation
Statement: Asset Class – Connectors and Conductors, April 2015, Table 8, p. 23. 165
United Energy, Regulatory Proposal 2016–20: Attachment : NET 449 – AER Category Expenditure Explanation
Statement: Asset Class – Connectors and Conductors, April 2015, p. 25. 166
NER, cll. 6.5.7(c)(1) & (2). 167
United Energy, Regulatory Proposal 2016–20, Attachment: NET 449 – AER Category Expenditure Explanation
Statement: Asset Class – Connectors and Conductors, April 2015 Table 8, p. 23.

6-96 Attachment 6 – Capital expenditure | United Energy Preliminary decision 2016–20
replacements United Energy prepared a business case which outlines the rapid
increase in failure rate.
Investigations by external and internal experts reveal that the root cause for HV
ABC failures which have occurred on UE’s network, is the ongoing electrical
discharge between the earthed catenary wire and the semi conductive core
material around each phase. This leads to erosion of the semi conductive
screen, creating high electric stress points on the insulation and ultimately
insulation failure.168
This indicates that the design standard adopted when the cable was deployed
commencing in the 1990's was deficient. This design standard was developed by the
former State Electricity Commission Victoria based on the best available information at
the time. It did not recognise the potential for early insulation failure when strung with
an earthed catenary wire. This failure mode has only become apparent after an
extended period in service. Consequently, we do not consider the need for this
replacement results from an imprudent decision by United Energy. United Energy
illustrate the impact on reliability by an example based on the Dromana sub-station.
Taking DMA 13 as an example; the 14 sustained outages on DMA13 over the
past ten years known to be caused by ABC failures have contributed 2.68
SAIDI minutes. UE intends to replace a 4.5 km section of HV ABC on feeder
DMA 13 in 2015. Nine of the fourteen incidents are located on the section
targeted to be replaced, impacting SAIDI by 1.91 minutes. Six out of these 9
HV ABC faults occurred in the past two years.169
The business case also states:
The concerning consequence of HV ABC failure is the potential for a fire start in
HBRA. So far, 7 out of 24 HV ABC faults across UE’s network over the past ten
years have resulted in fire starts in HBRA.170
We consider that the business case demonstrates that the replacement program for
HV ABC is necessary to maintain the reliability and safety of the network.
In reaching our conclusion, we have also taken into account the interrelationship
between this proposed expenditure and other expenditure proposed by United Energy.
This is a program of work that falls within United Energy's business as usual level of
capex and opex to manage asset fire safety. We have taken this into account in
determining an allowance for this work.
168
United Energy, Regulatory Proposal 2016–20, Attachment: NET 618 High Voltage Aerial Bundled Cable
Replacement Program - PJ 0131-0, April 2015, p. 3. 169
United Energy, Regulatory Proposal 2016–20, Attachment: NET 618 High Voltage Aerial Bundled Cable
Replacement Program - PJ 0131-0, April 2015, p. 5. 170
United Energy, Regulatory Proposal 2016–20, Attachment: NET 618 High Voltage Aerial Bundled Cable
Replacement Program - PJ 0131-0, April 2015, p. 5.
6-97 Attachment 6 – Capital expenditure | United Energy Preliminary decision 2016–20
We next assess whether the proposed allowance satisfies the capex criteria.171 United
Energy has prepared a forecast for HV ABC (29,347 m) based on consideration of its
GIS data and resource availability. We accept the forecasting methodology is sound.
As the basis of this forecast is the result of a survey to establish a program to complete
the works, adjusted for works completed or programmed to be completed in the 2011–
15 regulatory control period, we accept this forecast.
The total cost of replacing all 60 km of 22 kV ABC is in the order of
$38M. As this is unlikely to be possible in a short time frame, a program
of prioritised replacements over 10 years is proposed. This will target
replacement of approximately 5.6 km pa at an annual cost of $3.5M.172
We calculate the unit rate of $629.31 per m for this work. This rate has been
renegotiated with the service providers Zinfra and Tenix. It is a 22 per cent increase on
the current rate. Although the increase in price is significant, the unitised rates
proposed by United Energy are derived from contracts with independent service
providers. We are satisfied that the contracts were properly entered into on a
competitive basis, based on a detailed work specification. The unitised rate is a market
tested rate. The rate takes into account the terrain and access difficulties which will
arise as this program is completed. These differences are unique to this work
specification and mean direct comparison of the rate for this activity with other utilities
is not possible. We accept this forecast and the proposed unitised rate.
Accordingly, the resultant cost estimate of $18.468 million ($2015, including overheads
& escalation) reasonably reflects the capex criteria.
Single Wire Earth Return (SWER) replacement
SWER is a low cost technology with a single conductor (usually steel) commonly used
to supply small loads in remote and rural areas. United Energy stated they have
committed to replacing all the SWER in their network.173
UE has given a commitment to replace all its SWER systems by 2021 to
comply with the recommendations of the Bushfire Royal Commission.174
The AER has not been able to identify a specific commitment to this activity in either
the approved United Energy Electrical Safety Management Scheme or the United
Energy Fire Prevention Plan 2014-2019. We note that the Fire Prevention Plan
contains United Energy's current Bushfire Mitigation Plan.
171
NER, cll. 6.5.7(c)(1) & (2). 172
United Energy, Regulatory Proposal 2016–20, Attachment: NET 618 High Voltage Aerial Bundled Cable
Replacement Program - PJ 0131-0, April 2015, p. 1. 173
SWER operates at 12.7 kV and is used to supply small loads, usually in rural and remote areas. 174
United Energy, Regulatory Proposal 2016–20, Attachment: NET 457 – AER Category Expenditure Explanatory
Statement – Other Programs, April 2015, pp. 31–32.
6-98 Attachment 6 – Capital expenditure | United Energy Preliminary decision 2016–20
We note that the Victorian Bushfires Royal Commission made recommendations that
relate to improving the safety of SWER systems. For AusNet Services and Powercor
the ESV issued directions requiring specific actions to improve the safety of their
SWER networks. However, as United Energy has not identified an existing regulatory
obligation we have considered whether the expenditure is necessary to maintain the
reliability and safety of the United Energy network.
The United Energy supporting information does not set out a business case for why
expenditure will be necessary to maintain the reliability and safety of the network. The
business case examines the options to achieve the outcome of total replacement of
SWER.175 The chosen option is the least cost option. The business case cites the high
consequences of failures of SWER installations identified by the VBRC as justification
for the expenditure. However, this does not establish that the United Energy SWER
system is currently unsafe or likely to become unsafe or unreliable in the next
regulatory control period. In the absence of evidence to suggest that the SWER
network is currently unsafe or likely to become unsafe or unreliable we conclude this
expenditure is not required to maintain the reliability and safety of the network and to
comply with applicable regulatory obligations or requirements.
In reaching our conclusion, we have also taken into account the interrelationship
between this proposed expenditure and other expenditure proposed by United Energy.
For the capex criteria to be satisfied the capital expenditure must reasonably reflect the
efficient cost of satisfying the capital expenditure objectives. If no capital expenditure
objective is satisfied then the capex criteria cannot be met. On this basis we do not
accept United Energy's cost estimate of $18.367 million ($2015, including overheads &
escalation) reasonably reflects the capex criteria. Accordingly, we consider this project
should not be funded.
We note that the Victorian Government is expected to implement a new regulatory
obligation in response to recommendation 27 of the VBRC. In a later section we
discuss our preferred approach to deal with these possible new regulations as they
may affect United Energy's SWER systems in high bushfire risk areas.
What is Rapid Earth Fault Current Limiting (REFCL) Technology?
The Victorian Government is currently investigating technology solutions which reduce
the cost of minimising the risk of a powerline fault igniting a fire. The REFCL is a
relatively new technology which may have cost advantages. Its potential for bushfire
mitigation is promising. It is an extension of resonant earth system technology, which is
commonly used in Europe and elsewhere. The REFCL device is capable of detecting
when a power line has fallen to the ground and can almost instantaneously shut off
power on the fallen line.
175
United Energy, Regulatory Proposal 2016–20: Attachment: NET 233 – Single Wire Earth Return (SWER), ver 1.0,
April 2015.

6-99 Attachment 6 – Capital expenditure | United Energy Preliminary decision 2016–20
Rapid Earth Fault Current Limiting (REFCL) devices
United Energy proposes to install four REFCLs in the 2016–20 regulatory control
period at: Frankston, Dromana, Rosebud and Mornington. Feeders leaving these
substations each service areas of high bushfire risk when assessed against the criteria
of the Victorian Government emergency services agencies.176 The selection by United
Energy of these four substations as sites for REFCLs is based on this criteria. United
Energy previously installed a trial Ground Fault Neutraliser at the Frankston South sub-
station during the 2011–15 regulatory control period. The Ground Fault Neutralizer is a
specific form of REFCL technology.
The United Energy Fire Protection Plan does not include a firm commitment to install
REFCLs at any of the four locations (Frankston, Dromana, Mornington and Rosebud).
In the absence of a specific commitment to undertake these REFCL installations we do
not consider that United Energy has demonstrated it has an obligation to undertake
this work in the next regulatory control period.
As no regulatory obligation exists we do not consider that the proposed investment in
Rapid Earth Fault Current Limiting (REFCL) technology is necessary to comply with
applicable regulatory obligations or requirements. We next consider if the REFCLs are
necessary to maintain the safety and reliability of the network.
United Energy submitted a detailed business case to justify the expenditure on safety
and reliability grounds.177 However, the business case does not establish that the
technology is required to maintain the safety and reliability of the network. We consider
the United Energy business case establishes that the REFCL technology will enhance
network safety, especially if associated with other works to improve the safety of the
SWER network. We discuss this further below.
When compared to the cost of undergrounding powerlines, new technologies offer the
potential to significantly reduce the cost of reducing the risk of igniting a fire. However,
until there are established standards for the design, construction and operation of
these newer technologies it is a difficult task to assess whether investment in the new
technology will be required to comply with applicable regulatory obligations or
requirements and will be prudent and efficient. Our reason for this conclusion is that
the Victorian Government may determine that different specific treatments are to apply
in designated areas of the State. This creates a risk that the areas selected by United
Energy for REFCL deployment may be subject to different technical requirements that
make the deployment of a REFCL unnecessary or inappropriate.
In reaching our conclusion, we have also taken into account the interrelationship
between this proposed expenditure and other expenditure proposed by United Energy.
176
United Energy, Regulatory Proposal 2016–20, Attachment: NET 224 - UE PL 2050 REFCL Strategic Plan v1.0.
April 2015. 177
United Energy, Regulatory Proposal 2016–20, Attachment: NET 224 - UE PL 2050 REFCL Strategic Plan v1.0,
April 2015.
6-100 Attachment 6 – Capital expenditure | United Energy Preliminary decision 2016–20
We are satisfied this is a discrete program of work that does not fall within United
Energy's business as usual level of capex and opex to manage asset fire safety.
The Victorian Government may proceed with a mandatory program of installing
REFCLs in selected locations in the near future. However, this Victorian Government
program is not yet in place. The locations to be mandated to be the subject of REFCL
installations have yet to be determined. UE stated:178
UE propose to install four REFCL schemes at zone substation[s] which supply
its high bushfire risk networks in the forecast period. The justification is the
reduced fire start risk in bushfire areas.
In developing the proposed regulations to support the REFCL technology the Victorian
Government is developing a Regulatory Impact Statement (RIS). A key component of
the RIS process is to calculate the relative costs and benefits of the installation of a
REFCL device at each zone sub-station. Until this work is complete the identification of
those United Energy substations suitable for treatment by a REFCL is speculative. The
AER expects to rely on the RIS prepared by the Victorian Government to identify those
locations which should be subject to the installation of a REFCL in the next regulatory
control period.
United Energy has performed a separate cost-benefit analysis to demonstrate that the
safety and reliability benefits of these installations warrant funding.179 We accept their
analysis demonstrates a net reliability and safety benefit. However, the approach
adopted by the Victorian Government may require a different approach be used which
achieves the mandated safety outcome. For example, the Victorian Government may
determine that alternative treatments such as the fitting of enhanced capability
automatic circuit reclosers or reconstruction of the SWER lines using a new insulated
cable type is a sufficient treatment. The areas selected by United Energy may not meet
the threshold set by the Victorian Government above which treatment with a REFCL is
warranted. As a consequence, the deployment of a REFCL may be redundant at one
or more of the nominated locations.
Accordingly, we consider the United Energy cost estimates for REFCLs do not
reasonably reflect the capex criteria. We consider the decision to deploy REFCLs can
best be addressed as a potential future regulatory obligation. We set out in the next
section our preferred approach to potential future regulatory obligations, if they arise.
Future regulatory obligations
Following the Victorian Bushfires Royal Commission (VBRC) 67 recommendations
were made, of which eight relate directly to the safety of electrical distribution networks
in Victoria. Another relevant recommendation is recommendation 27:
178
United Energy, Regulatory Proposal 2016–20, Attachment: NET 457 – AER Category Expenditure Explanatory
Statement – Other Programs, April 2015, p. 28. 179
United Energy, Regulatory Proposal 2016–20: Attachment: NET 224 – UE PL 2050 REFCL Strategic Plan, April
2015, Table 3, p. 24.

6-101 Attachment 6 – Capital expenditure | United Energy Preliminary decision 2016–20
The State amend the Regulations under Victoria’s Electricity Safety Act 1998
and otherwise take such steps as may be required to give effect to the
following:
the progressive replacement of all SWER (single-wire earth return) power lines in Victoria with aerial bundled cable, underground cabling or other technology that delivers greatly reduced bushfire risk. The replacement program should be completed in the areas of highest bushfire risk within 10 years and should continue in areas of lower bushfire risk as the lines reach the end of their engineering lives
the progressive replacement of all 22-kilovolt distribution feeders with aerial bundled cable, underground cabling or other technology that delivers greatly reduced bushfire risk as the feeders reach the end of their engineering lives. Priority should be given to distribution feeders in the areas of highest bushfire risk.
The Victorian Government is developing a regulatory requirement to give effect to
recommendation 27. In particular, work is being undertaken by the Victorian
Government to develop suitable regulatory standards for the use of new technologies
such as Rapid Earth Fault Current Limiting (REFCL) devices and a new types of
insulated line as major tools to reduce the risk of powerline faults igniting bushfires.
These regulations are expected to apply in High Bushfire Risk Areas (HBRA) of the
State and will involve a mandatory program of installing REFCLs and a change to the
design standards that apply to new line construction and the reconstruction of assets in
certain areas (Codified Areas). However, this Victorian Government requirement is still
being developed and is not yet in place. The timing and scope of the regulations are
not currently known.
United Energy has not addressed this impending development in its regulatory
proposal. AusNet Services proposed to apply a regulatory change pass through event
to any regulatory change or changes that apply in the next regulatory control period.
Powercor on the other hand proposed that the pending regulatory changes be dealt
with as contingent projects. We have therefore, considered whether either approach is
preferable (contingent project or pass through event) and the trigger event which
should apply to a contingent project.
Having considered the respective proposals of AusNet Services and Powercor, we
consider a contingent project approach is preferable. Our preference is to apply a
common regulatory approach to all affected service providers. We prefer to deal with
the costs of the Victorian government regulations consistently across distributors. This
ensures that the cost of the regulation is recovered from customers in the same
manner. It also allows us to compare the costs and impacts on customers more
transparently so that we can ensure that consumers pay no more than necessary for
the implementation of the regulation. This is particularly important because the cost
and timing of the regulation are not yet known.
Until the Victorian Government regulations have been determined and are promulgated
it will remain unclear whether there is likely to be an impact on United Energy. If, in
their substitute determination regulatory proposal United Energy applies for one or
more contingent projects in response to these impending regulations, our intention is to

6-102 Attachment 6 – Capital expenditure | United Energy Preliminary decision 2016–20
apply a common regulatory approach to that proposal, including the applicable trigger
event.
B.6 Forecast non–network capex
The non-network capex category for United Energy includes expenditure on
information and communications technology (ICT), buildings and property, motor
vehicles, and tools and equipment. United Energy proposed $194.6 million ($2015) for
non-network capex, compared to $173.2 million in the 2011–15 regulatory control
period.180 It proposed $163.7 million for ICT capex, compared to $131.2 million in the
previous period. It has also proposed $30.9 million for the other non-network capex
categories, compared to $40.1 million in the previous period.
B.6.1 Position
We do not accept United Energy's forecast non-network capex. We have instead
included an amount of $134.6 million ($2015) for non-network capex in our estimate of
total capex which we consider reasonably reflects the capex criteria. This is a reduction
of 31 per cent. This is comprised of $103.6 million for ICT capex and $30.9 million for
other non-network capex
In coming to this view, we have found that United Energy's forecast non-network ICT
capex of $163.7 million ($2015) does not reflect the efficient costs of a prudent
operator. We consider that non-network ICT capex of $103.6 million ($2015)
reasonably reflects United Energy's required capex for this category in the 2016–20
regulatory control period. This is a reduction of 37 per cent from United Energy’s
forecast ICT capex.
In modelling United Energy's required revenue for the 2016–20 regulatory control
period, we have also accounted for forecast disposals of fleet assets which United
Energy omitted from its regulatory proposal.
B.6.2 United Energy's proposal
Figure 6.17 shows United Energy's actual and expected non-network capex for the
period from 2001 to 2015, and forecast capex for the 2016–20 regulatory control
period.
180
United Energy, Regulatory proposal 2016–20, April 2015, pp. 76 and 80.

6-103 Attachment 6 – Capital expenditure | United Energy Preliminary decision 2016–20
Figure 6.17 United Energy's non-network capex 2001 to 2020
($million, 2015)
Source: United Energy, Regulatory information notice, template 2.6; United Energy, Category Analysis RIN 2014,
template 2.6; United Energy, RIN response for 2011-2015 regulatory control period, template 2.1.1; AER
analysis.
United Energy's forecast non-network capex for the 2016–20 regulatory control period
is 12 per cent higher than actual and expected capex in the 2011–15 regulatory control
period.181
Our analysis of longer term trends in non-network capex suggests that United Energy
has forecast capex for this category at relatively high levels for most of the regulatory
control period. Non-network capex in the first three years of the 2016–20 regulatory
control period is forecast to be higher than expenditure in any year since 2001, with the
exception of the 2011 year. We therefore consider that United Energy's forecast non-
network capex program warrants further review to confirm the need for and timing of
the proposed expenditure.
We have assessed forecast expenditure in each category of non-network capex.
Analysis at this level has been used to inform our view of whether forecast capex is
reasonable relative to historical rates of expenditure in each category, and to identify
trends in the different category forecasts which may warrant further review.182 Figure
6.18 shows United Energy's actual and forecast non-network capex by sub-category
for the period from 2009 to 2020.
181
United Energy, Regulatory information notice, template 2.6; United Energy, Category Analysis RIN 2014, template
2.6; AER analysis. 182
NER, cl. 6.5.7(e)(5).
0
10
20
30
40
50
60
70
$ million 2015
United Energy - Non-network capex
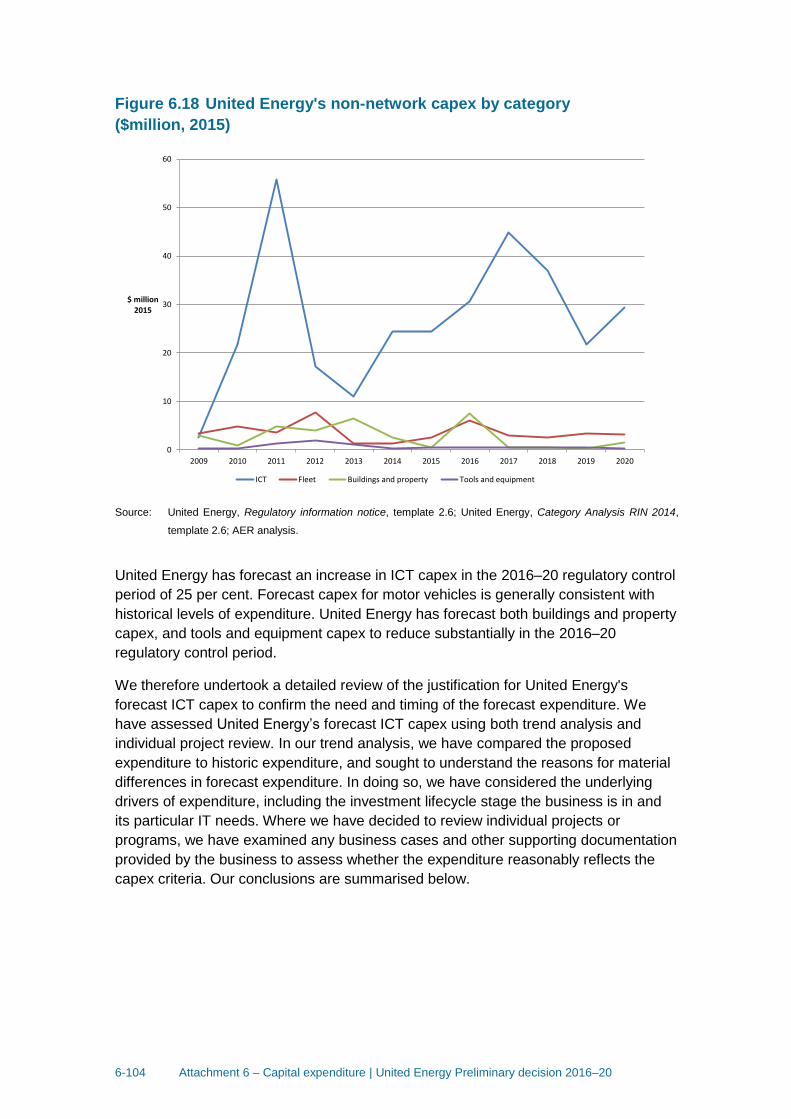
6-104 Attachment 6 – Capital expenditure | United Energy Preliminary decision 2016–20
Figure 6.18 United Energy's non-network capex by category
($million, 2015)
Source: United Energy, Regulatory information notice, template 2.6; United Energy, Category Analysis RIN 2014,
template 2.6; AER analysis.
United Energy has forecast an increase in ICT capex in the 2016–20 regulatory control
period of 25 per cent. Forecast capex for motor vehicles is generally consistent with
historical levels of expenditure. United Energy has forecast both buildings and property
capex, and tools and equipment capex to reduce substantially in the 2016–20
regulatory control period.
We therefore undertook a detailed review of the justification for United Energy's
forecast ICT capex to confirm the need and timing of the forecast expenditure. We
have assessed United Energy’s forecast ICT capex using both trend analysis and
individual project review. In our trend analysis, we have compared the proposed
expenditure to historic expenditure, and sought to understand the reasons for material
differences in forecast expenditure. In doing so, we have considered the underlying
drivers of expenditure, including the investment lifecycle stage the business is in and
its particular IT needs. Where we have decided to review individual projects or
programs, we have examined any business cases and other supporting documentation
provided by the business to assess whether the expenditure reasonably reflects the
capex criteria. Our conclusions are summarised below.
0
10
20
30
40
50
60
2009 2010 2011 2012 2013 2014 2015 2016 2017 2018 2019 2020
$ million 2015
ICT Fleet Buildings and property Tools and equipment
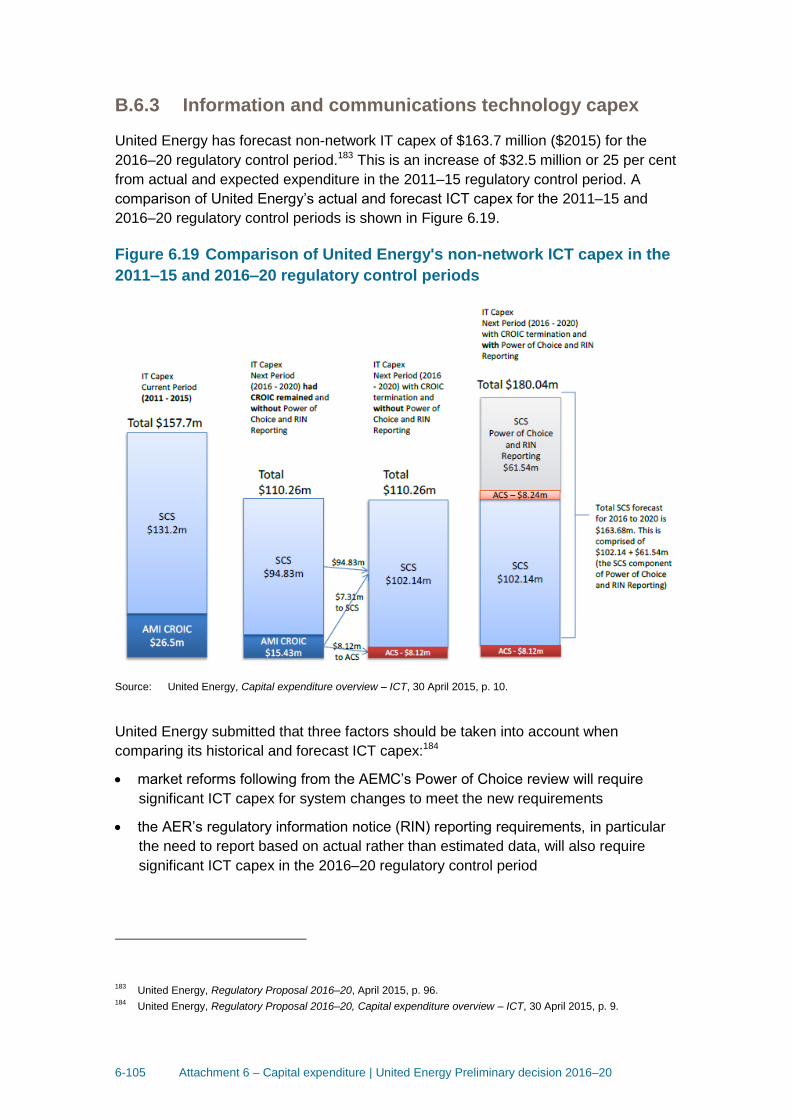
6-105 Attachment 6 – Capital expenditure | United Energy Preliminary decision 2016–20
B.6.3 Information and communications technology capex
United Energy has forecast non-network IT capex of $163.7 million ($2015) for the
2016–20 regulatory control period.183 This is an increase of $32.5 million or 25 per cent
from actual and expected expenditure in the 2011–15 regulatory control period. A
comparison of United Energy’s actual and forecast ICT capex for the 2011–15 and
2016–20 regulatory control periods is shown in Figure 6.19.
Figure 6.19 Comparison of United Energy's non-network ICT capex in the
2011–15 and 2016–20 regulatory control periods
Source: United Energy, Capital expenditure overview – ICT, 30 April 2015, p. 10.
United Energy submitted that three factors should be taken into account when
comparing its historical and forecast ICT capex:184
market reforms following from the AEMC’s Power of Choice review will require
significant ICT capex for system changes to meet the new requirements
the AER’s regulatory information notice (RIN) reporting requirements, in particular
the need to report based on actual rather than estimated data, will also require
significant ICT capex in the 2016–20 regulatory control period
183
United Energy, Regulatory Proposal 2016–20, April 2015, p. 96. 184
United Energy, Regulatory Proposal 2016–20, Capital expenditure overview – ICT, 30 April 2015, p. 9.

6-106 Attachment 6 – Capital expenditure | United Energy Preliminary decision 2016–20
termination of the Advanced Metering Infrastructure Cost Recovery Order in
Council (CROIC) at the end of 2015 – a portion of the recurrent ICT costs
previously recovered under the CROIC will be included as standard control
services capex in the 2016–20 regulatory control period.
United Energy submitted that a valid comparison of forecast and historical ICT capex
would exclude the costs for Power of Choice and RIN reporting projects and account
for the ongoing recovery of CROIC costs. On that basis, United Energy identified
forecast ICT capex for standard control services of $102.1 million ($2015), a reduction
in forecast ICT capex of approximately 29 per cent when the additional Power of
Choice and RIN reporting projects are excluded.185
We consider that United Energy’s base forecast for ICT capex of $102.1 million is likely
to reflect the high level drivers of these costs, and reasonably reflect the efficient costs
of a prudent operator. A majority of this expenditure is recurrent in nature, designed to
maintain the currency or capability of ICT infrastructure, applications and services.186
The forecast reduction in comparable ICT capex requirements reflects the substantial
investment made by United Energy in the 2011–2016 regulatory control period, and its
current stage in the ICT asset lifecycle. In the 2011–2016 regulatory control period,
United Energy delivered several large ICT projects that were critical to its business
transformation process. These included a major enterprise resource planning system
replacement project, a system separation project, two data centre relocations, a major
infrastructure refresh, updates of the distribution management system, and upgrades
of market systems.187 These major projects do not need to be replicated in the 2016–
20 regulatory control period. Rather, continued investment is required to maintain and
refresh existing ICT assets, and address remaining capability gaps as required. United
Energy submitted that:188
Having completed a major overhaul of our ICT systems in recent years, we will
continue to invest in the systems to ensure these systems are refreshed to
maintain the industry standard required to meet the needs of our customers.
This is consistent with the Consumer Challenge Panel’s submission that levels of ICT
capex in the 2011–2016 regulatory control period in part reflected ‘one off’ adjustments
which do not necessarily need to be replicated in the 2016–20 regulatory control
period. The Consumer Challenge Panel submitted that overall, capex for IT and
communications should reflect a reduction from current levels in order to bring the
amounts of capex back to ‘reasonable’ levels.189 We consider the 29 per cent reduction
in United Energy’s base standard control ICT capex forecast is consistent with this
view.
185
United Energy, Regulatory Proposal 2016–20, Capital expenditure overview – ICT, 30 April 2015, p. 10. 186
United Energy, Regulatory Proposal 2016–20, IT Capital Program 2016 to 2020, April 2015, p. 30. 187
United Energy, Regulatory proposal 2016–20, 30 April 2015, p. 77. 188
United Energy, Regulatory proposal 2016–20, 30 April 2015, p. 79. 189
CCP Sub-Panel 3, Response to proposals from Victorian electricity distribution network service providers,
5 August 2015, pp. 58–59.
6-107 Attachment 6 – Capital expenditure | United Energy Preliminary decision 2016–20
In reaching this conclusion, we have not attempted to re-examine United Energy’s
prioritisation of particular business needs, or approve investments for specific projects
or programs. Rather, we have considered whether the proposed $102.1 million base
ICT capex program, excluding new major projects, reasonably reflects a prudent and
efficient level of capex that is deliverable in the 2016–20 regulatory control period. We
are satisfied that this is the case.
The additional capex of $61.5 million proposed by United Energy for the Power of
Choice and RIN reporting projects is considered separately below.
Power of Choice ICT capex
United Energy forecast ICT capex of $37.2 million ($2015) for nine projects related to
forthcoming market reforms driven by the recommendations of the AEMC’s Power of
Choice review. The ICT projects provide for new or modified systems to deliver new or
enhanced capabilities in the following areas:
electricity customer switching
distribution network pricing arrangements
expanding competition in metering and related services
enabling multiple trading relationships
customer access to information about their electricity consumption
management of embedded networks
enabling the deployment of demand management
delivery of demand side participation information to AEMO
introduction of a market based demand response mechanism.
United Energy is the only Victorian DNSP to propose ex ante capex costs related to
the full range of potential market reforms arising from the AEMC’s Power of Choice
review. The other four Victorian DNSPs have proposed to recover various Power of
Choice related costs through the cost pass through arrangements of the NER rather
than through the ex-ante capex allowance. This is because in most cases the nature of
future regulatory obligations and the scope, timing and cost of system changes
required to accommodate them remain uncertain. This uncertainty is reflected in the
regulatory proposals submitted by AusNet Services, Jemena, CitiPower and Powercor,
which include the following statements:
there is a large degree of uncertainty with respect to the timing and quantum of
Power of Choice related cost impacts190
****
190
AusNet Services, Regulatory proposal 2016–20, April 2015, p. 270.

6-108 Attachment 6 – Capital expenditure | United Energy Preliminary decision 2016–20
As the AEMC has only released a draft determination and certain procedures
and guidelines are yet to be published, there is uncertainty as to JEN’s role and
responsibilities in respect of metering services, the scope of the systems
changes it will have to implement (and the cost involved), and the need for
additional operating and capital expenditure to ensure it is fully compliant191
****
CitiPower considers there is still uncertainty as to the detail of the framework for
metering contestability .… Having regard to that uncertainty, the cost
implications of the expiration of the Victorian Metering Derogation and the
introduction of metering contestability are not sufficiently certain such that they
could be included in CitiPower’s forecast expenditure in its regulatory
proposal.192
****
Powercor is unable to fully assess the impact of multiple trading relationships
until after the rule change determination and/or retail market procedures have
concluded.193
United Energy also acknowledges this uncertainty in the project justification documents
submitted for each of the nine proposed Power of Choice related projects. These
project justification documents all include a statement that: ’detailed requirements are
not available at this stage’.194
We sought further information from United Energy to explain the rationale behind its
preferred approach to managing the uncertainty surrounding future Power of Choice
related ICT costs, in contrast to the approach adopted by the other Victorian DNSPs.195
United Energy submitted that:196
While the PoC Rules were not final at the time of submitting our Regulatory
Proposal, we consider that quantifying the expected costs of meeting these
new Rules, based on the information known at the time, improves transparency
for stakeholders and is critical for informing the further development of the PoC
Rules.
As you would be aware, since submitting our Regulatory Proposal, further
progress has been made on the development of the PoC Rules, albeit that they
are still not final. We have been actively following these changes and will revise
our forecast costs associated with meeting these Rules as part of our Revised
Regulatory Proposal.
191
Jemena, Regulatory proposal 2016–20, Attachment 5–4: Risk Management Framework, 30 April 2015, p. 15. 192
CitiPower, Regulatory proposal 2016–20, Appendix L – Managing uncertainty, April 2015, p. 21. 193
Powercor, Regulatory proposal 2016–20, Appendix L – Managing uncertainty, April 2015, p. 26. 194
The statement is made under the ‘Assumptions’ section of each project justification document. For example, refer
to United Energy, PJ20 Power of Choice Multiple Trading Relationships, 16 March 2015, p, 8. 195
AER, Information request to United Energy IR#016, 30 July 2015. 196
United Energy, Response to information request United Energy IR#016, 6 August 2015, p. 1.

6-109 Attachment 6 – Capital expenditure | United Energy Preliminary decision 2016–20
We agree with United Energy that attempting to quantify the expected costs of meeting
the new Power of Choice related rules aids transparency and may contribute to the
further development of the rule changes. However, in assessing United Energy’s
forecast capex, we must be satisfied that the capex reasonably reflects the capex
criteria.
We are not satisfied that United Energy’s forecast ICT capex for Power of Choice
related projects reasonably reflects the capex criteria. Given the uncertainty that exists
around the nature of the applicable regulatory obligations, the possible system
changes required, and the quantum of costs which may be incurred, we are not
satisfied that United Energy’s forecasts reasonably reflect the efficient costs of a
prudent operator or a realistic expectation of the cost inputs required to achieve the
capex objectives.197 Further, where a rule change process has commenced, or is
expected to commence, but has not yet concluded, we do not consider that possible
capex associated with a future rule change is required to meet an applicable regulatory
obligation or requirement.198
On this basis, we have not included United Energy’s forecast standard control capex of
$37.2 million for the nine proposed Power of Choice related IT capex projects in our
estimate of total capex for this preliminary decision. The scope, timing and cost of
necessary IT system changes related to the various Power of Choice reforms remain
uncertain. The regulatory change event pass through in the NER provides a
mechanism for the recovery of costs associated with a regulatory change where those
costs are material. We will review any updated or additional supporting information
relating to these costs submitted by United Energy as part of its revised proposal.
RIN Reporting ICT capex
United Energy forecast ICT capex of $24.3 million ($2015) to achieve compliance with
RIN reporting obligations in the 2016–20 regulatory control period.199 This project is
intended to deliver changes to nine IT systems resulting in:200
an enhanced RIN reporting capability
improved automation of RIN reporting processes
integration with transaction-based and data warehousing and reporting
applications.
The majority of the costs associated with the RIN reporting project are labour costs
($21 million) with relatively minor costs for IT hardware, software licences and project
management ($3.3 million).201
197
NER, 6.5.7(c). 198
NER, r. 6.5.7(a)(2). 199
United Energy, Regulatory proposal 2016–20, Capital expenditure overview – ICT, 30 April 2015, p. 9. 200
United Energy, PJ22 – RIN Reporting, 15 March 2015, p. 26. 201
United Energy, PJ22 – RIN Reporting, 15 March 2015, p. 27.
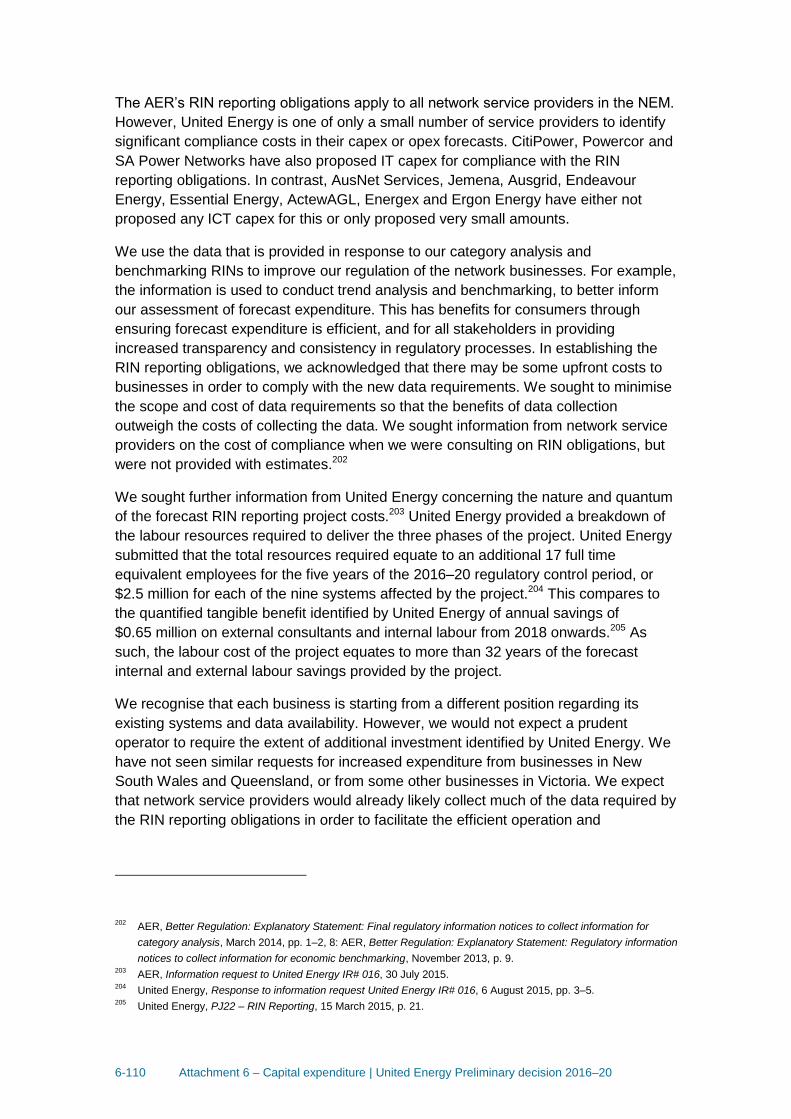
6-110 Attachment 6 – Capital expenditure | United Energy Preliminary decision 2016–20
The AER’s RIN reporting obligations apply to all network service providers in the NEM.
However, United Energy is one of only a small number of service providers to identify
significant compliance costs in their capex or opex forecasts. CitiPower, Powercor and
SA Power Networks have also proposed IT capex for compliance with the RIN
reporting obligations. In contrast, AusNet Services, Jemena, Ausgrid, Endeavour
Energy, Essential Energy, ActewAGL, Energex and Ergon Energy have either not
proposed any ICT capex for this or only proposed very small amounts.
We use the data that is provided in response to our category analysis and
benchmarking RINs to improve our regulation of the network businesses. For example,
the information is used to conduct trend analysis and benchmarking, to better inform
our assessment of forecast expenditure. This has benefits for consumers through
ensuring forecast expenditure is efficient, and for all stakeholders in providing
increased transparency and consistency in regulatory processes. In establishing the
RIN reporting obligations, we acknowledged that there may be some upfront costs to
businesses in order to comply with the new data requirements. We sought to minimise
the scope and cost of data requirements so that the benefits of data collection
outweigh the costs of collecting the data. We sought information from network service
providers on the cost of compliance when we were consulting on RIN obligations, but
were not provided with estimates.202
We sought further information from United Energy concerning the nature and quantum
of the forecast RIN reporting project costs.203 United Energy provided a breakdown of
the labour resources required to deliver the three phases of the project. United Energy
submitted that the total resources required equate to an additional 17 full time
equivalent employees for the five years of the 2016–20 regulatory control period, or
$2.5 million for each of the nine systems affected by the project.204 This compares to
the quantified tangible benefit identified by United Energy of annual savings of
$0.65 million on external consultants and internal labour from 2018 onwards.205 As
such, the labour cost of the project equates to more than 32 years of the forecast
internal and external labour savings provided by the project.
We recognise that each business is starting from a different position regarding its
existing systems and data availability. However, we would not expect a prudent
operator to require the extent of additional investment identified by United Energy. We
have not seen similar requests for increased expenditure from businesses in New
South Wales and Queensland, or from some other businesses in Victoria. We expect
that network service providers would already likely collect much of the data required by
the RIN reporting obligations in order to facilitate the efficient operation and
202
AER, Better Regulation: Explanatory Statement: Final regulatory information notices to collect information for
category analysis, March 2014, pp. 1–2, 8: AER, Better Regulation: Explanatory Statement: Regulatory information
notices to collect information for economic benchmarking, November 2013, p. 9. 203
AER, Information request to United Energy IR# 016, 30 July 2015. 204
United Energy, Response to information request United Energy IR# 016, 6 August 2015, pp. 3–5. 205
United Energy, PJ22 – RIN Reporting, 15 March 2015, p. 21.
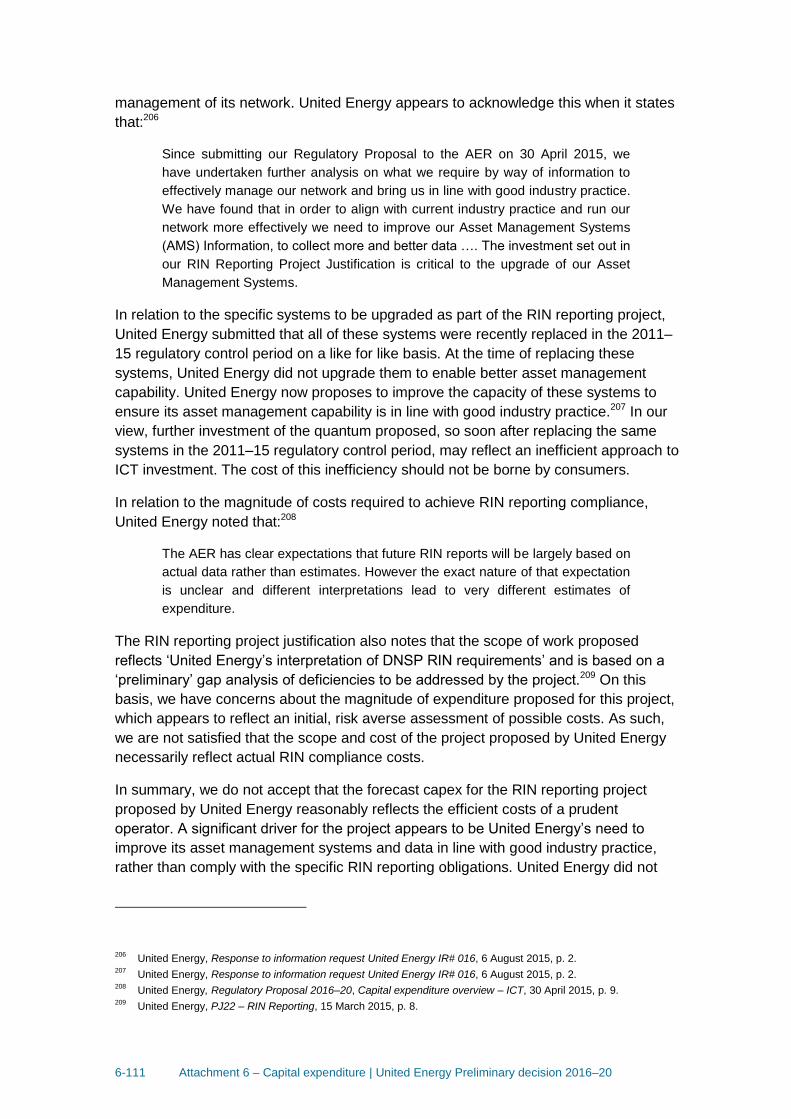
6-111 Attachment 6 – Capital expenditure | United Energy Preliminary decision 2016–20
management of its network. United Energy appears to acknowledge this when it states
that:206
Since submitting our Regulatory Proposal to the AER on 30 April 2015, we
have undertaken further analysis on what we require by way of information to
effectively manage our network and bring us in line with good industry practice.
We have found that in order to align with current industry practice and run our
network more effectively we need to improve our Asset Management Systems
(AMS) Information, to collect more and better data …. The investment set out in
our RIN Reporting Project Justification is critical to the upgrade of our Asset
Management Systems.
In relation to the specific systems to be upgraded as part of the RIN reporting project,
United Energy submitted that all of these systems were recently replaced in the 2011–
15 regulatory control period on a like for like basis. At the time of replacing these
systems, United Energy did not upgrade them to enable better asset management
capability. United Energy now proposes to improve the capacity of these systems to
ensure its asset management capability is in line with good industry practice.207 In our
view, further investment of the quantum proposed, so soon after replacing the same
systems in the 2011–15 regulatory control period, may reflect an inefficient approach to
ICT investment. The cost of this inefficiency should not be borne by consumers.
In relation to the magnitude of costs required to achieve RIN reporting compliance,
United Energy noted that:208
The AER has clear expectations that future RIN reports will be largely based on
actual data rather than estimates. However the exact nature of that expectation
is unclear and different interpretations lead to very different estimates of
expenditure.
The RIN reporting project justification also notes that the scope of work proposed
reflects ‘United Energy’s interpretation of DNSP RIN requirements’ and is based on a
‘preliminary’ gap analysis of deficiencies to be addressed by the project.209 On this
basis, we have concerns about the magnitude of expenditure proposed for this project,
which appears to reflect an initial, risk averse assessment of possible costs. As such,
we are not satisfied that the scope and cost of the project proposed by United Energy
necessarily reflect actual RIN compliance costs.
In summary, we do not accept that the forecast capex for the RIN reporting project
proposed by United Energy reasonably reflects the efficient costs of a prudent
operator. A significant driver for the project appears to be United Energy’s need to
improve its asset management systems and data in line with good industry practice,
rather than comply with the specific RIN reporting obligations. United Energy did not
206
United Energy, Response to information request United Energy IR# 016, 6 August 2015, p. 2. 207
United Energy, Response to information request United Energy IR# 016, 6 August 2015, p. 2. 208
United Energy, Regulatory Proposal 2016–20, Capital expenditure overview – ICT, 30 April 2015, p. 9. 209
United Energy, PJ22 – RIN Reporting, 15 March 2015, p. 8.
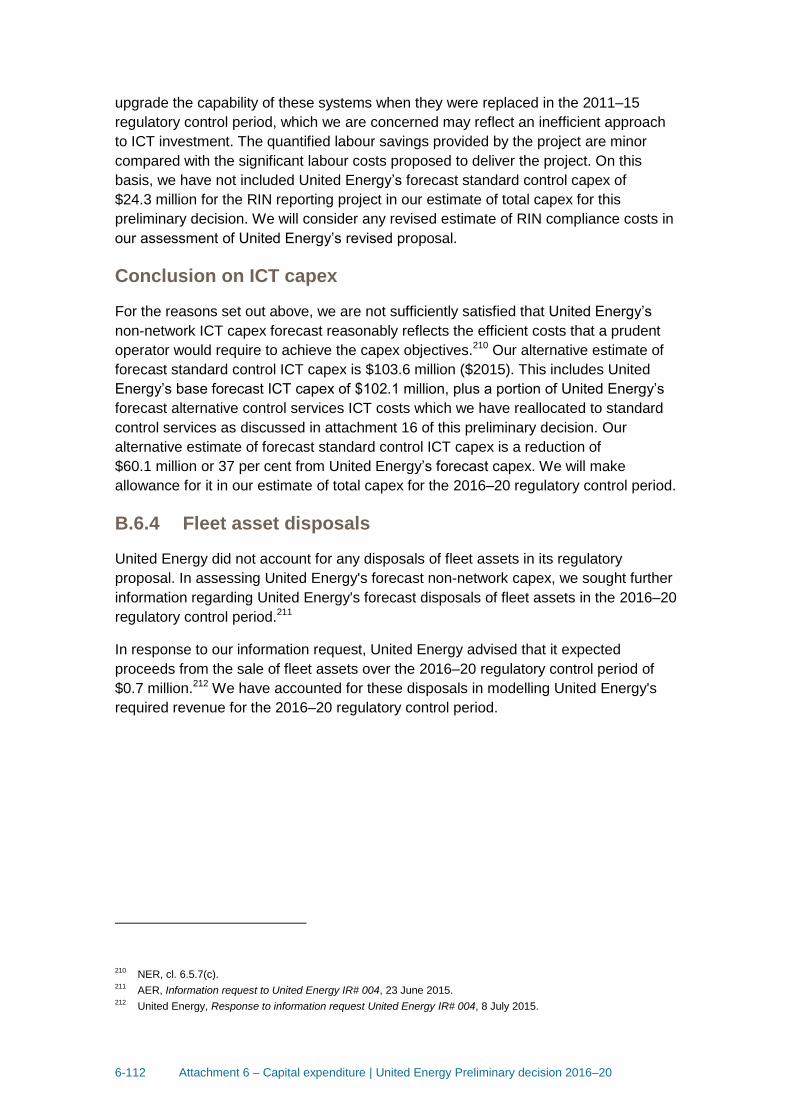
6-112 Attachment 6 – Capital expenditure | United Energy Preliminary decision 2016–20
upgrade the capability of these systems when they were replaced in the 2011–15
regulatory control period, which we are concerned may reflect an inefficient approach
to ICT investment. The quantified labour savings provided by the project are minor
compared with the significant labour costs proposed to deliver the project. On this
basis, we have not included United Energy’s forecast standard control capex of
$24.3 million for the RIN reporting project in our estimate of total capex for this
preliminary decision. We will consider any revised estimate of RIN compliance costs in
our assessment of United Energy’s revised proposal.
Conclusion on ICT capex
For the reasons set out above, we are not sufficiently satisfied that United Energy’s
non-network ICT capex forecast reasonably reflects the efficient costs that a prudent
operator would require to achieve the capex objectives.210 Our alternative estimate of
forecast standard control ICT capex is $103.6 million ($2015). This includes United
Energy’s base forecast ICT capex of $102.1 million, plus a portion of United Energy’s
forecast alternative control services ICT costs which we have reallocated to standard
control services as discussed in attachment 16 of this preliminary decision. Our
alternative estimate of forecast standard control ICT capex is a reduction of
$60.1 million or 37 per cent from United Energy’s forecast capex. We will make
allowance for it in our estimate of total capex for the 2016–20 regulatory control period.
B.6.4 Fleet asset disposals
United Energy did not account for any disposals of fleet assets in its regulatory
proposal. In assessing United Energy's forecast non-network capex, we sought further
information regarding United Energy's forecast disposals of fleet assets in the 2016–20
regulatory control period.211
In response to our information request, United Energy advised that it expected
proceeds from the sale of fleet assets over the 2016–20 regulatory control period of
$0.7 million.212 We have accounted for these disposals in modelling United Energy's
required revenue for the 2016–20 regulatory control period.
210
NER, cl. 6.5.7(c). 211
AER, Information request to United Energy IR# 004, 23 June 2015. 212
United Energy, Response to information request United Energy IR# 004, 8 July 2015.

6-113 Attachment 6 – Capital expenditure | United Energy Preliminary decision 2016–20
C Maximum demand forecasts
Maximum demand forecasts are fundamental to a distributor's forecast capex and
opex, and to our assessment of that forecast expenditure.213 This is because we must
determine whether the capex and opex forecasts reasonably reflect a realistic
expectation of demand forecasts. Hence accurate, or at least unbiased, demand
forecasts are important inputs to ensuring efficient levels of investment in the network.
This attachment sets out our decision on United Energy's forecast network maximum
demand for the 2016–20 regulatory control period. We consider United Energy's
demand forecasts at the total system level and the more local level.
System demand represents total demand in the United Energy distribution network.
System demand trends give a high level indication of the need for expenditure on the
network to meet changes in demand. Forecasts of increasing system demand
generally signal an increased network utilisation which may, once any spare capacity
in the network is used up, lead to a requirement for growth capex. Conversely
forecasts of stagnant or falling system demand will generally signal falling network
utilisation, a more limited requirement for growth capex, and the potential for the
network to be rationalised in some locations.
Localised demand growth (spatial demand) drives the requirement for specific growth
projects or programs. Spatial demand growth is not uniform across the entire network:
for example, future demand trends would differ between established suburbs and new
residential developments.
In our consideration of United Energy's demand forecasts, we have had regard to:
United Energy's proposal
independent maximum demand forecasts from the Australian Energy Market
Operator (AEMO)214
a report by our internal economic consultant, Dr Darryl Biggar, on the forecasting
methodologies underlying each Victorian electricity distributor's demand forecasts
for 2016–20 (this report will be published alongside this preliminary decision)215
long-term demand trends and changes in the electricity market, and
stakeholder submissions in response to United Energy's proposal (as well as
submissions made in relation to the Victorian electricity distribution determinations
more generally).216
213
NER, cll. 6.5.6(c)(3) and 6.5.7(c)(3). 214
AEMO, Transmission Connection Point Forecasting Report — For Victoria, September 2014 215
Biggar, 2015 Victorian Electricity Distribution Pricing review: An Assessment of the Vic DNSP's Demand
Forecasting Methodology, August 2015. 216
See AER, http://www.aer.gov.au/node/24446.

6-114 Attachment 6 – Capital expenditure | United Energy Preliminary decision 2016–20
These are set out in more detail in the remainder of this appendix.
C.1 AER determination
We are not satisfied that United Energy’s demand forecasts reflect a realistic
expectation of demand over the 2016–20 regulatory control period. In determining a
realistic expectation of demand over the 2016–20 period, we have had regard to the
following factors:
Recently observed changes in the electricity market and the way energy is
consumed in recent years (e.g. strong uptake of solar PV, changing customer
behaviours and energy efficiency measures) suggests that the strong positive
demand growth seen in United Energy's network prior to 2009 is unlikely to return
in the short to medium term. This is discussed in section C.3.
United Energy's forecasting methodology uses observed historical patterns of peak
demand, and the sensitivity of historical demand to temperature, to forecast future
maximum demand. On this basis, United Energy forecasts a recovery of maximum
demand levels from the previous flattening of demand. This is primarily due to a
number of demand drivers such as impact of air conditioning penetration and
expected growth rate, which have not been adequately supported. We are
concerned that the model used to develop United Energy's forecasts does not
allow for the potential changes that we may be observing for the electricity market
in Victoria and recent declines in demand. This is discussed in section C.2 and C.4.
Independent forecasts from AEMO better explain the actual demand pattern seen
on all distributors’ networks. This is because it does not assume a fixed structural
relationship between demand and demand drivers over a long period and, instead,
places greater reliance on industry knowledge and judgement. While not without its
limitations, we consider that AEMO's forecasts better reflect recent changes in the
electricity market. This is also discussed in section C.4.
We understand that United Energy (and the Victorian electricity businesses) are in the
process of updating their demand forecasts as part of the 2015 distribution annual
planning report (DAPR). We also note that AEMO will publish updated connection point
demand forecasts for Victoria. We are open to United Energy submitting an updated
demand forecast that accounts for the factors listed above, including the most recent
demand data and AEMO’s updated forecasts.
We consider the forecasts in our decisions should reflect the most current expectations
of the forecast period. Hence, we will also consider updated demand forecasts and
other information (such as AEMO's revised connection point forecasts) in the final
decision to reflect the most up to date data.
We have also received a number of consumer submissions that raise concerns with
United Energy's and the other Victorian distributors maximum demand forecasts. The
CCP submitted that we should pay particular attention to the distributors maximum
demand forecasts and whether they have been over estimated, given the following
considerations:
forecasts of maximum demand are key drivers of revenue requirements

6-115 Attachment 6 – Capital expenditure | United Energy Preliminary decision 2016–20
distributors' forecasts exceed and contrast with AEMO’s forecasts, and
distributors have consistently over forecast maximum demands in the past.217
The Ethnic Communities Council of Victoria (ECCV) also supported us further
examining the Victorian distributors' forecasts that exceed forecasts by AEMO.218
The VECUA also submitted that the Victorian distributors have consistently over
estimated their peak demand and energy delivered projections. VECUA put forward
that network distributors are insulated from volume risk through revenue cap
regulation, which allows them to pass that risk on to customers. Therefore if the actual
energy delivered is lower than forecast by networks’ then networks will increase their
prices to recover their guaranteed revenues. VECUA also considered it important to
note:219
…that the Victoria distributors were rewarded with windfall profits for their
forecasting errors, as their revenue allowances included returns and
depreciation on load-driven capex which they did not incur.
As set out in this appendix, we have closely examined United Energy's maximum
demand forecasts and drawn similar observations to these submissions. A key part of
our work has been to analyse United Energy (and the other Victorian distributors)
demand forecasts with reference to AEMO's independent maximum demand forecasts.
However, the VECUA submitted that AEMO has consistently over estimated its energy
forecasts in recent years and has not fully considered the influence of future factors in
reducing demand (such as energy efficiency schemes, automotive closures, cost
reflective price structures and battery storage technology).220 We do not agree with the
VECUA and consider that AEMO's explanation of its forecasting methodology reveals
that it has considered a wide variety of information in its forecast, including predictions
for energy efficiency and automotive closures in Victoria and this represents an
enhancement and improvement to its previous forecast approach.221
Further, the CCP and VECUA referred to AusNet Services demand forecasts as the
only Victorian distributor to forecast lower energy consumption in the future compared
to the past.222 VECUA has submitted that AusNet Services demand forecasting
217
CCP Sub-panel 3, Response to proposals from Victorian electricity distribution network service providers, August
2015, pp. 32–37. 218
Ethnic Community Council of Victoria, Submission to the Australian Energy Regulator Victoria Electricity Pricing
Review, 15 July 2015, p. 4. 219
Victorian Energy Consumer and User Alliance, Submission to the AER Victorian Distribution Networks’ 2016–20
Revenue Proposals, 13 July 2015, pp. 14–16. 220
Victorian Energy Consumer and User Alliance, Submission to the AER Victorian Distribution Networks’ 2016–20
Revenue Proposals, 13 July 2015, p. 17. 221
AEMO, Detailed summary of 2015 electricity forecasts, 2015 National Electricity Forecasting Report, June 2015,
p. 11. 222
CCP Sub-panel 3, Response to proposals from Victorian electricity distribution network service providers, August
2015, pp. 35–37; Victorian Energy Consumer and User Alliance, Submission to the AER Victorian Distribution
Networks’ 2016–20 Revenue Proposals, 13 July 2015, pp. 15–16.
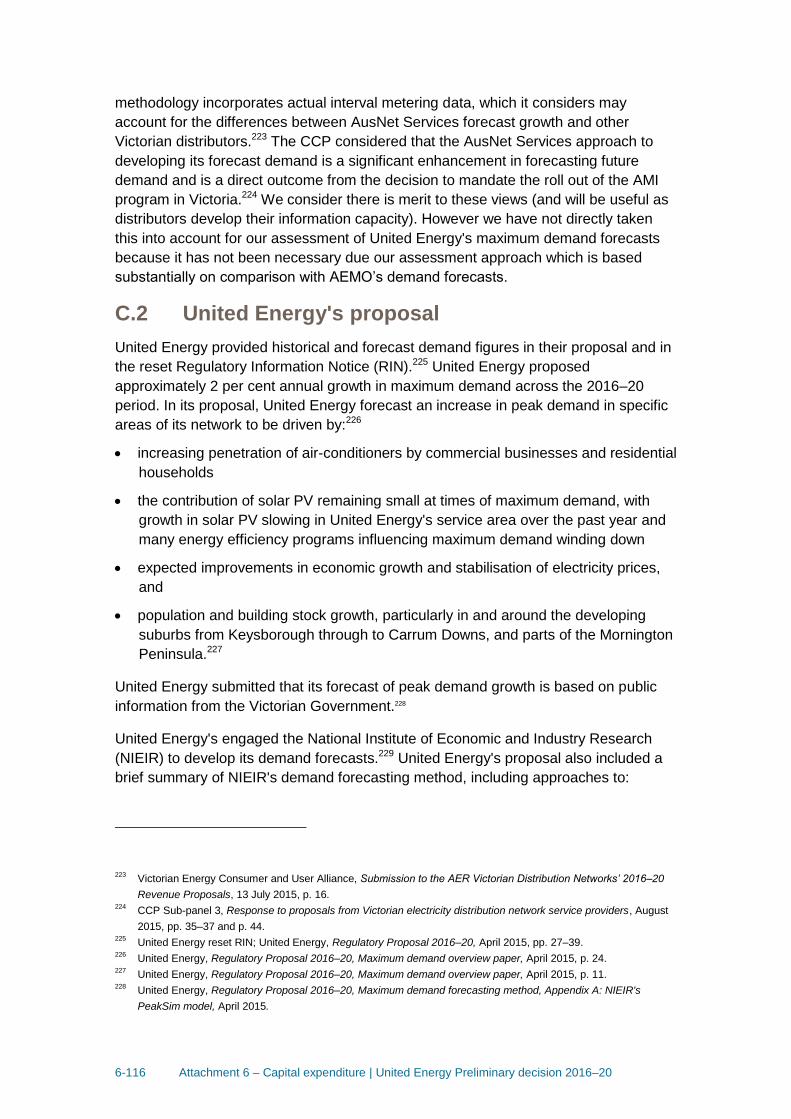
6-116 Attachment 6 – Capital expenditure | United Energy Preliminary decision 2016–20
methodology incorporates actual interval metering data, which it considers may
account for the differences between AusNet Services forecast growth and other
Victorian distributors.223 The CCP considered that the AusNet Services approach to
developing its forecast demand is a significant enhancement in forecasting future
demand and is a direct outcome from the decision to mandate the roll out of the AMI
program in Victoria.224 We consider there is merit to these views (and will be useful as
distributors develop their information capacity). However we have not directly taken
this into account for our assessment of United Energy's maximum demand forecasts
because it has not been necessary due our assessment approach which is based
substantially on comparison with AEMO’s demand forecasts.
C.2 United Energy's proposal
United Energy provided historical and forecast demand figures in their proposal and in
the reset Regulatory Information Notice (RIN).225 United Energy proposed
approximately 2 per cent annual growth in maximum demand across the 2016–20
period. In its proposal, United Energy forecast an increase in peak demand in specific
areas of its network to be driven by:226
increasing penetration of air-conditioners by commercial businesses and residential
households
the contribution of solar PV remaining small at times of maximum demand, with
growth in solar PV slowing in United Energy's service area over the past year and
many energy efficiency programs influencing maximum demand winding down
expected improvements in economic growth and stabilisation of electricity prices,
and
population and building stock growth, particularly in and around the developing
suburbs from Keysborough through to Carrum Downs, and parts of the Mornington
Peninsula.227
United Energy submitted that its forecast of peak demand growth is based on public
information from the Victorian Government.228
United Energy's engaged the National Institute of Economic and Industry Research
(NIEIR) to develop its demand forecasts.229 United Energy's proposal also included a
brief summary of NIEIR's demand forecasting method, including approaches to:
223
Victorian Energy Consumer and User Alliance, Submission to the AER Victorian Distribution Networks’ 2016–20
Revenue Proposals, 13 July 2015, p. 16. 224
CCP Sub-panel 3, Response to proposals from Victorian electricity distribution network service providers, August
2015, pp. 35–37 and p. 44. 225
United Energy reset RIN; United Energy, Regulatory Proposal 2016–20, April 2015, pp. 27–39. 226
United Energy, Regulatory Proposal 2016–20, Maximum demand overview paper, April 2015, p. 24. 227
United Energy, Regulatory Proposal 2016–20, Maximum demand overview paper, April 2015, p. 11. 228
United Energy, Regulatory Proposal 2016–20, Maximum demand forecasting method, Appendix A: NIEIR's
PeakSim model, April 2015.

6-117 Attachment 6 – Capital expenditure | United Energy Preliminary decision 2016–20
demand drivers
accounting for economic conditions such as incomes and electricity prices
projections of residential customer numbers by dwelling stock forecasts; non-
residential customer number forecasts are derived from historic growth in energy
consumption, historic customer growth and average usage by tariff class,230 and
post model-adjustments for changes in electricity prices, energy efficiency
programs and embedded generation.231
United Energy submitted that it then undertakes a top down and a bottom up
verification of the NIEIR demand forecast. The top down verification is reconciled with
another economic model developed by AECOM (Architecture, Engineering, Consulting,
Operations, and Maintenance). This model is described as a simplified version of
NIEIR's model and reported to follow the approach adopted by AEMO. The bottom up
verification reconciles zone substation and high voltage distribution feeder forecasts
with NIEIR's forecast. United Energy submitted that the bottom up verification is then
reconciled with the top down forecast in order to address any apparent bias in the
bottom up forecasts.232
United Energy's forecasting methodology is described in detail in Dr Biggar's report.233
C.3 Demand trends
Our first step in examining United Energy's forecast of maximum demand is to look at
whether the forecast is consistent with, or explained by, long-term demand trends and
changes in the electricity markets.
Figure 6.20 shows that over the last few years, the path of electricity demand seems to
be changing. From 2006 to 2009, actual maximum demand on United Energy's
network was growing steadily. Then from 2009 to 2012, demand flattened and
declined. The decline in 2009 from historical demand growth has also been recorded
for Victoria (as shown in Figure 6.21) and for the NEM. While there was some growth
in demand between 2013 and 2014, this does not necessarily indicate a return to
longer-term growth in demand.
As shown further in Figure 6.20, United Energy's demand forecasts for the 2015–20
period are higher than the actual demand observed for its network during 2006–14 (in
particular its PoE 10 forecasts). United Energy forecasts a return to demand growth on
the network similar to that experienced prior to 2009. This contrasts with AEMO's
229
United Energy, Regulatory Proposal 2016–20, April 2015, p. 27. 230
United Energy, Regulatory Proposal 2016–20, April 2015, p. 39. 231
United Energy, Regulatory Proposal 2016–20, April 2015, pp. 37–38. 232
United Energy, Regulatory Proposal 2016–20, April 2015, pp. 34–36; United Energy, Regulatory Proposal 2016–
20, Maximum demand forecasting method, pp. 7–8. 233
Biggar, 2015 Victorian Electricity Distribution Pricing review: An Assessment of the Vic DNSP's Demand
Forecasting Methodology, August 2015, pp. 19–25.

6-118 Attachment 6 – Capital expenditure | United Energy Preliminary decision 2016–20
Connection Point Forecasts, published in September 2014, which forecasts little or no
growth in connection point demand on United Energy's network for the same period.234
Figure 6.20 Comparison of peak demand forecasts of United Energy
and AEMO (MW, non-coincident, summated connection point forecasts)
Source: United Energy regulatory proposal, AER analysis using AEMO data on transmission connection point
forecasts; reset RIN; economic benchmarking RIN 2006-14.
Note: Actual demand over the 2006 to 2014 period reflects United Energy's actual maximum demand over this
period (as reported in United Energy's economic benchmarking RIN data from 2006 to 2014). This is
opposed to weather normalised historical maximum demand data.
Figure 6.21 shows AEMO's forecasts of maximum demand across Victoria. In its 2015
national electricity forecasting report, AEMO forecast a flattening of maximum demand
for Victoria for 2015–2020. However, AEMO has forecast some growth in maximum
demand over the next twenty years, which is a change from its 2014 national electricity
forecasting report.
234
AEMO, Transmission Connection Point Forecasting Report for Victoria, September 2014, pp. 12–13.
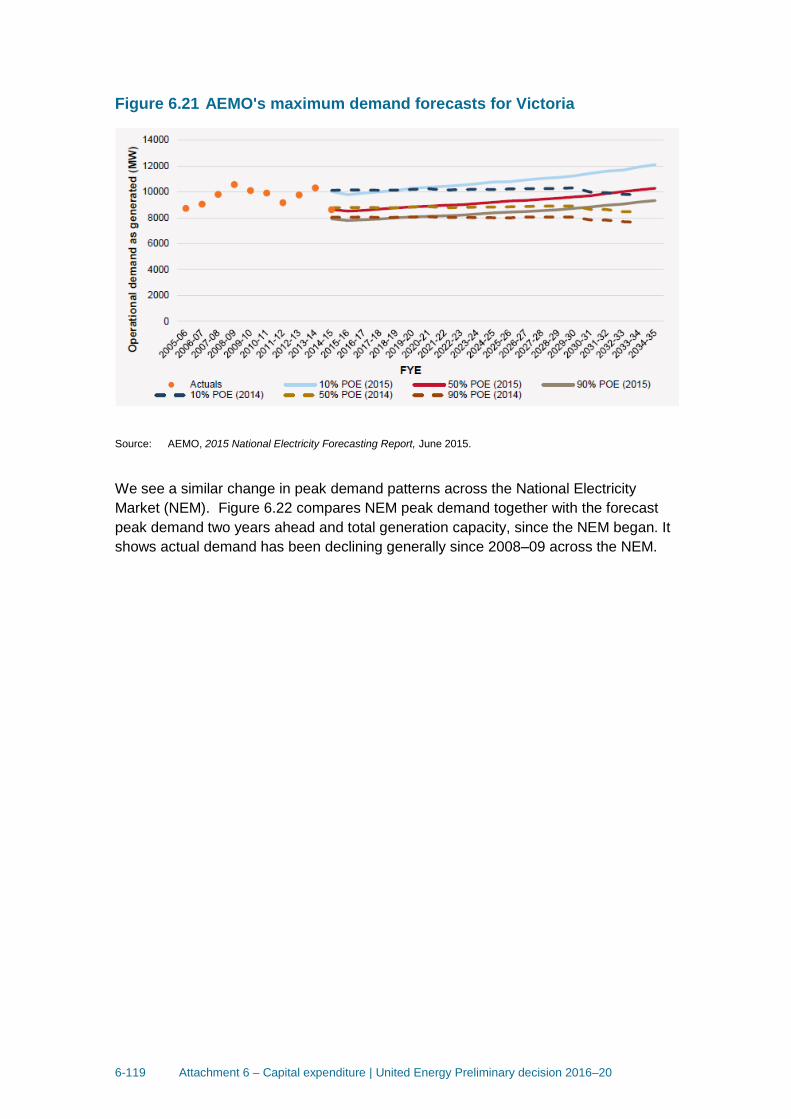
6-119 Attachment 6 – Capital expenditure | United Energy Preliminary decision 2016–20
Figure 6.21 AEMO's maximum demand forecasts for Victoria
Source: AEMO, 2015 National Electricity Forecasting Report, June 2015.
We see a similar change in peak demand patterns across the National Electricity
Market (NEM). Figure 6.22 compares NEM peak demand together with the forecast
peak demand two years ahead and total generation capacity, since the NEM began. It
shows actual demand has been declining generally since 2008–09 across the NEM.
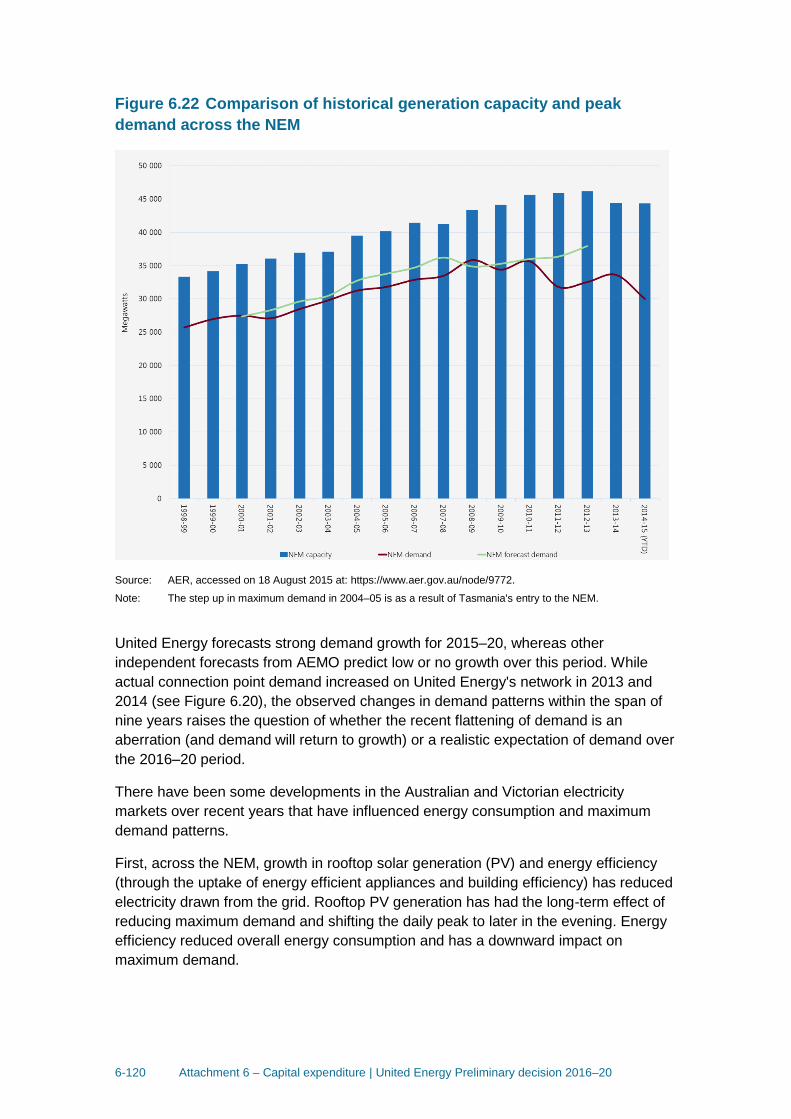
6-120 Attachment 6 – Capital expenditure | United Energy Preliminary decision 2016–20
Figure 6.22 Comparison of historical generation capacity and peak
demand across the NEM
Source: AER, accessed on 18 August 2015 at: https://www.aer.gov.au/node/9772.
Note: The step up in maximum demand in 2004–05 is as a result of Tasmania's entry to the NEM.
United Energy forecasts strong demand growth for 2015–20, whereas other
independent forecasts from AEMO predict low or no growth over this period. While
actual connection point demand increased on United Energy's network in 2013 and
2014 (see Figure 6.20), the observed changes in demand patterns within the span of
nine years raises the question of whether the recent flattening of demand is an
aberration (and demand will return to growth) or a realistic expectation of demand over
the 2016–20 period.
There have been some developments in the Australian and Victorian electricity
markets over recent years that have influenced energy consumption and maximum
demand patterns.
First, across the NEM, growth in rooftop solar generation (PV) and energy efficiency
(through the uptake of energy efficient appliances and building efficiency) has reduced
electricity drawn from the grid. Rooftop PV generation has had the long-term effect of
reducing maximum demand and shifting the daily peak to later in the evening. Energy
efficiency reduced overall energy consumption and has a downward impact on
maximum demand.

6-121 Attachment 6 – Capital expenditure | United Energy Preliminary decision 2016–20
In Victoria, AEMO reported that in the five years to 2014–15, consumption in the
residential and commercial sector decreased due to rising prices and the uptake of
rooftop PV.235 AEMO forecasts that there will be continued uptake of rooftop PV in the
residential and commercial sectors.
To demonstrate, Figure 6.23, drawn from AEMO's 2015 national electricity forecasting
report for Victoria, shows the projected capacity of solar PV systems across Victoria.
From this figure we observe a projected substantial increase in the volume of installed
rooftop solar PV capacity can be observed from 2010 to 2015, with capacity expected
to continue to grow strongly to 2020 and beyond.236
Figure 6.23 Projected capacity of solar PV systems in Victoria
Source: AEMO, 2015 National Electricity Forecasting Report, June 2015.
However, we note that the impact of rooftop PV will likely have diminishing impacts on
maximum demand over the longer-term as peak daily demand shifts to the evening.
This is recognised in AEMO's forecasting report.237 We note that electricity storage
(e.g. batteries) has the potential to significantly enhance the impact of solar generation
on maximum demand on the distribution network. However, wide-spread uptake of
battery storage will probably not be significant over the 2016–20 period.
235
AEMO, Detailed summary of 2015 electricity forecasts, 2015 National Electricity Forecasting Report, June 2015,
p. 68. 236
AEMO, Detailed summary of 2015 electricity forecasts, 2015 National Electricity Forecasting Report, June 2015,
p. 73. 237
AEMO, Detailed summary of 2015 electricity forecasts, 2015 National Electricity Forecasting Report, June 2015,
p. 77.
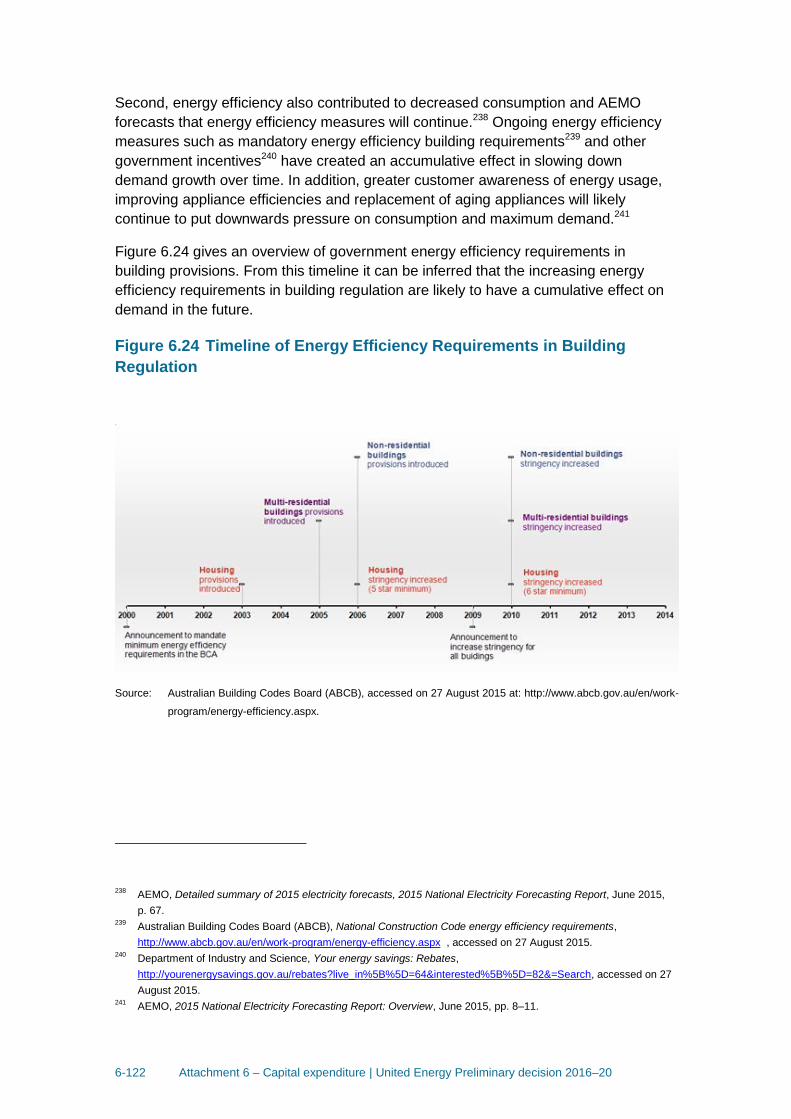
6-122 Attachment 6 – Capital expenditure | United Energy Preliminary decision 2016–20
Second, energy efficiency also contributed to decreased consumption and AEMO
forecasts that energy efficiency measures will continue.238 Ongoing energy efficiency
measures such as mandatory energy efficiency building requirements239 and other
government incentives240 have created an accumulative effect in slowing down
demand growth over time. In addition, greater customer awareness of energy usage,
improving appliance efficiencies and replacement of aging appliances will likely
continue to put downwards pressure on consumption and maximum demand.241
Figure 6.24 gives an overview of government energy efficiency requirements in
building provisions. From this timeline it can be inferred that the increasing energy
efficiency requirements in building regulation are likely to have a cumulative effect on
demand in the future.
Figure 6.24 Timeline of Energy Efficiency Requirements in Building
Regulation
Source: Australian Building Codes Board (ABCB), accessed on 27 August 2015 at: http://www.abcb.gov.au/en/work-
program/energy-efficiency.aspx.
238
AEMO, Detailed summary of 2015 electricity forecasts, 2015 National Electricity Forecasting Report, June 2015,
p. 67. 239
Australian Building Codes Board (ABCB), National Construction Code energy efficiency requirements,
http://www.abcb.gov.au/en/work-program/energy-efficiency.aspx , accessed on 27 August 2015. 240
Department of Industry and Science, Your energy savings: Rebates,
http://yourenergysavings.gov.au/rebates?live_in%5B%5D=64&interested%5B%5D=82&=Search, accessed on 27
August 2015. 241
AEMO, 2015 National Electricity Forecasting Report: Overview, June 2015, pp. 8–11.
6-123 Attachment 6 – Capital expenditure | United Energy Preliminary decision 2016–20
Finally, AEMO also forecast that Victoria is not expected to recover to its historical high
level of operational consumption (in 2008–09) until 2030–31, when population is
projected to be 1.7 million higher than in 2014–15.242
We consider that the combination of these factors support forecast reductions or
softening of maximum demand even in the presence of economic and population
growth. In particular, based on our assessment of independent forecasts from AEMO,
we consider the continuing presence of energy efficiency measures, improving
appliance efficiencies and continued growth in rooftop PV will likely put downward
pressure on demand, which may counteract any demand growth due to economic and
population growth. Solar PV and energy efficiency are not transient or temporary
phenomena, but rather fundamental changes in the way electricity is consumed.
As set out in section C.4 below, we consider that United Energy's forecasting
methodology does not adequately capture the changes we are observing for the
electricity market in Victoria and recent declines in demand. This is because United
Energy's methodology assumes that the structural model they have estimated using
2004–2015 data accurately and completely captures the key drivers of demand in
Victoria and that the same relationships between demand and demand-drivers will
continue to hold over the 2016–20 period. We are not satisfied that this reflects a
realistic expectation of future demand over the 2016–20 period since we are not
confident that the drivers used in United Energy's model are able to fully capture the
changes in demand in recent years.
We note this is consistent with international trends. Figure 6.25 highlights the fact that
growth in electricity demand is currently low or zero in the USA and UK despite the
existence of continued population growth and economic growth. In other words, this
chart suggests that the impact of economic growth and population growth on electricity
demand is being offset by other factors (such as improving energy efficiency). On this
basis, it is reasonable to argue that high growth is unlikely to return over 2016–20.243
242
AEMO, Detailed summary of 2015 electricity forecasts, 2015 National Electricity Forecasting Report, June 2015,
p. 67. 243
Biggar, 2015 Victorian Electricity Distribution Pricing review: An Assessment of the Vic DNSP's Demand
Forecasting Methodology, August 2015, p. 11.

6-124 Attachment 6 – Capital expenditure | United Energy Preliminary decision 2016–20
Figure 6.25 Long-term trends in electricity growth rates
Source: Energy Supply Association of Australia (ESAA).244
C.4 United Energy's forecasting methodology and assumptions
Our next step in examining United Energy's forecasts of maximum demand is to look at
United Energy's methodology and whether it is likely to result in a realistic maximum
demand forecast. We have relied on a report by our internal economic consultant, Dr
Darryl Biggar, and some of our observations about recent trend in maximum demand.
Broadly, Dr Biggar stated that Untied Energy has drawn on sophisticated forecasting
tools and has sought to validate its forecasts using a range of different approaches.
However, Dr Biggar raised concerns that United Energy's forecasts, and the
forecasting tools it uses, may not capture all of the relevant factors which may drive
peak demand in the future. On this basis, Dr Biggar stated that he is concerned that
the estimates put forward by UE are not a realistic expectation of future demand.
We consider that this position is supported by both recent trends in demand and
consumption patterns, and AEMO's independent demand forecasts.
Assessment of NIEIR's demand forecasting methodology
United Energy forecasting methodology (from NIEIR) is segmented into two parts:
244
Economic and Social Outlook Conference 2014, ESAA, 3 July 2014, p. 7, accessed on 18 August 2015 at:
http://www.melbourneinstitute.com/downloads/conferences/Outlook2014/Outlook2014_slides/6_Warren,%20Matth
ew.pdf.

6-125 Attachment 6 – Capital expenditure | United Energy Preliminary decision 2016–20
Temperature insensitive (base) demand – the part of demand that would occur
irrespective of the weather conditions. The projections of base demand are
assumed to be strongly related to the estimated growth or decline in energy sales.
Temperature sensitive demand – the part of demand that occurs due to prevailing
weather conditions. NIEIR argued that the temperature sensitivity of electricity
demand is primarily driven by the penetration of air conditioning load.
To estimate demand forecasts that are sensitive to temperature, NIEIR first estimated
a long-term historical relationship between demand and temperature. It then used this
observed historic pattern of peak demand to forecast future peak demand. NIEIR then
made some various post modelling adjustments for changes in electricity prices,
energy efficiency programs, and small scale embedded generation. Collectively these
adjustments are relatively minor.
In Dr Biggar's report (2015), he observed that NIEIR's forecasting model forecast that
temperature insensitive (or base) demand will recover from previous lows and that
temperature sensitivity will increase. This relates to two key assumptions in NIEIR's
forecast:245
that energy volumes are no longer in decline and will recover to 2008 levels before
flattening out again, and
there will be increasing penetration of air conditioning at the rate of 2 to 3 percent
per annum. This yields an increase in NIEIR's projections of maximum demand
across its network.
Dr Biggar stated that NIEIR's forecast air conditioning penetration rate is insufficiently
justified. In particular, Dr Biggar noted that where new air conditioner models are
being used to replace older, less efficient models, an increase in air conditioner
purchases could be expected to decrease (rather than increase) the impact on
maximum demand. 246 Furthermore, Dr Biggar considered this approach ignores the
plausible impact of solar PV on base level demand and temperature sensitivity.
We agree and consider that solar PV and energy efficiency measures could outweigh
any expected increase in maximum demand from increased penetration of air
conditioners. The NIEIR model appears to use long-term historical relationships
between demand and temperature, which may not necessarily take into account
increases in energy efficiency.
Taking into account Dr Biggar's observations, we are concerned that the assumptions
in NIEIR's model do not sufficiently account for the recent decline in maximum
demand. NIEIR's report is also more than one year old. Accounting for 2014/15
summer demand would likely further support a decline in maximum demand. Biggar's
245
Biggar, 2015 Victorian Electricity Distribution Pricing review: An Assessment of the Vic DNSP's Demand
Forecasting Methodology, August 2015, pp. 19–25. 246
Biggar, 2015 Victorian Electricity Distribution Pricing review: An Assessment of the Vic DNSP's Demand
Forecasting Methodology, August 2015, pp. 19–25.

6-126 Attachment 6 – Capital expenditure | United Energy Preliminary decision 2016–20
summary of NIEIR's approach is that while it appears sound in its estimates of historic
peak demand, it appears less convincing when it comes to forecasting future peak
demand levels.247
Assessment of AECOM's demand forecasting methodology
Our next step in examining United Energy's forecasts of maximum demand is to look at
their process for validating the forecasts provided by NIEIR. We have reviewed United
Energy's validation model developed by AECOM.
AECOM's forecasting methodology, like most forecasting models, assumes that there
is a fixed and unchanging underlying relationship between demand and key demand
drivers. It also assumes that this relationship can be accurately estimated using historic
data and that these relationships that have been observed in the past will continue into
the future. However, if there are changes in the market which are not captured in the
forecasting model, the model will not provide a reliable guide to future outcomes.
This is shown in Dr Biggar's 2015 report on the Victorian electricity distributors'
demand forecasting methodologies.248 Dr Biggar's analysis, replicated in Figure 6.26,
provides a simple illustration which shows what can happen when the assumed drivers
of demand do not capture a fixed and unchanging relationship between demand and
the key drivers. In this example it is assumed that the primary driver of demand is time
(a simple time trend). But as Figure 6.26 shows, there appears to be no fixed
relationship between peak demand and time. In the first half of the last decade, peak
demand growth was increasing rapidly. Since around 2009 it appears that peak
demand has been declining. This illustrates that a model, which assumes a simple
fixed relationship between peak demand and time would likely give unreliable forecasts
of future peak demand.249
247
Biggar, 2015 Victorian Electricity Distribution Pricing review: An Assessment of the Vic DNSP's Demand
Forecasting Methodology, August 2015, pp. 19–25. 248
Biggar, 2015 Victorian Electricity Distribution Pricing review: An Assessment of the Vic DNSP's Demand
Forecasting Methodology, August 2015, p. 8. 249
Biggar, 2015 Victorian Electricity Distribution Pricing review: An Assessment of the Vic DNSP's Demand
Forecasting Methodology, August 2015, p. 8.

6-127 Attachment 6 – Capital expenditure | United Energy Preliminary decision 2016–20
Figure 6.26 Illustration of future forecasts of POE10 levels based on the
most recent five years of data
Source: Biggar, 2015 Victorian Electricity Distribution Pricing review: An Assessment of the Vic DNSP's Demand
Forecasting Methodology, August 2015, p. 10.
Similarly, Dr Biggar observed that AECOM's modelling enforces a single relationship
between maximum demand and weather and other key drivers historically which is
assumed to continue to hold in the future. 250 After examining the drivers used by
AECOM, Dr Biggar expressed concern that these drivers may not be able to capture
the recent apparent change in demand drivers noted above (such as investment in
solar PV and increasing energy efficiency).251 This is supported by the evidence
presented in section C.3 above which suggests that average demand growth is likely to
be low, zero or negative in the near future.
AEMO's connection point demand forecasts
We have used AEMO's connection point demand forecasts as an independent
comparison to United Energy's forecasts. In September 2014, AEMO published its
report on connection point demand forecasts for each of the Victorian electricity
distributors for the 2014–2023 period. As noted previously, AEMO forecasts low or
zero demand growth over the 2016–20 period.
250
Biggar, 2015 Victorian Electricity Distribution Pricing review: An Assessment of the Vic DNSP's Demand
Forecasting Methodology, August 2015, p. 22. 251
Biggar, 2015 Victorian Electricity Distribution Pricing review: An Assessment of the Vic DNSP's Demand
Forecasting Methodology, August 2015, p. 24.

6-128 Attachment 6 – Capital expenditure | United Energy Preliminary decision 2016–20
AEMO's connection point demand forecasts are based on a methodology developed
by ACIL Allen, which was developed after consultation during 2012–13 with all
distribution businesses.252 This methodology does not assume a particular long-term
structural relationship for demand over time. AEMO has decided to adopt a ‘cubic’
relationship with historical demand and adopts an “off-the-point approach” (which
means that the demand forecast begins at the most recent point of actual demand).253
ACIL Allen's "off-the-point" approach is not without its criticisms. In particular, it relies
on industry knowledge and judgement to adopt an alternative to a historical linear trend
and to start the forecast at the most recent point, which can be arbitrary if not based on
first principles or underlying economic phenomena.254 However, we consider it is a
better model for forecasting demand for United Energy's network for 2015–20 than
NIEIR's models. This is because ACIL Allen's models do not assume a fixed structural
relationship between long-term drivers of demand and certain economic factors across
the entire period. In using the "off-the-point" approach ACIL Allen extrapolates the
relationship between demand and the long-term underlying drivers based on the most
recent actual demand value. Because of this, we consider that AEMO's forecast is
more likely to reflect a realistic expectation of demand over the 2016–20 period.
252
In December 2012, the Council of Australian Governments (COAG) released its energy market reform
implementation plan. In this plan, AEMO will develop independent demand forecasts in 2013–14 to inform the
AER's assessment of infrastructure investment plans submitted by Network Service Providers . Further detail is
provided at http://www.aemo.com.au/Electricity/Planning/Forecasting/AEMO-Transmission-Connection-Point-
Forecasting. 253
Biggar, 2015 Victorian Electricity Distribution Pricing review: An Assessment of the Vic DNSP's Demand
Forecasting Methodology, August 2015, pp. 19–25. 254
This was a source of criticism in Frontier Economics’ peer review of AEMO’s demand forecasts. See Frontier,
“High level review of transmission connection point forecasts: Victoria”, A report prepared for the Australian Energy
Market Operator, September 2014.

6-129 Attachment 6 – Capital expenditure | United Energy Preliminary decision 2016–20
D Real material cost escalation
Real material cost escalation is a method for accounting for expected changes in the
costs of key material inputs to forecast capex. The capital expenditure real escalation
forecast model submitted by United Energy includes forecasts for changes in the
prices of commodities such as copper, aluminium, steel and crude oil, rather than the
prices of the physical inputs it actually sources for its network services (e.g., poles,
cables, transformers). United Energy has also escalated construction related costs in
its cost of materials forecast.
D.5 Position
We are not satisfied that United Energy’s proposed real material cost escalators
(leading to cost increases above CPI) reasonably reflect a realistic expectation of the
cost inputs required to achieve the capex objectives over the 2016–20 period.255
Instead we consider that zero per cent real cost escalation is reasonably likely to
reflect the capex criteria. We consider this is likely to reasonably reflect a realistic
expectation of the cost inputs required to achieve the capex objectives over the 2016–
20 period. We have arrived at this conclusion on the basis that:
zero per cent real cost escalation is likely to provide a more reliable estimation of
the price of input materials, given the potential inaccuracy of commodities
forecasting;
there is little evidence to support how accurately United Energy’s real cost
escalation model reasonably reflects changes in prices it paid for physical assets in
the past. Without this supporting evidence, it is difficult to assess the accuracy and
reliability of United Energy’s real cost escalation model as a predictor of the prices
of the assets used to provide network services, and
United Energy has not provided any supporting evidence to show that it has
considered whether there may be some material exogenous factors that impact on
the cost of physical inputs that are not captured by its capex forecast model.
Our approach to real materials cost escalation discussed above does not affect the
proposed application of labour and construction related cost escalators which apply to
United Energy’s standard control services capital expenditure. We consider that labour
and construction related cost escalation as proposed by United Energy is likely to more
reasonably reflect a realistic expectation of the cost inputs required to achieve the
capex criteria, given these are direct inputs into the cost of providing network services.
255
NER, cl. 6.5.7(a).

6-130 Attachment 6 – Capital expenditure | United Energy Preliminary decision 2016–20
D.6 United Energy’s proposal
United Energy stated that the escalators applied to materials were developed internally
using raw-commodity level data provided by an independent expert, BIS Shrapnel, to
forecast real material cost escalations for the 2016–20 regulatory period.256 United
Energy stated that it derived its material cost escalators by applying escalators at the
raw-commodity level (i.e. wood, aluminium, copper, steel, oil, concrete etc.) to the
estimated mix of these materials used to construct and/or maintain its distribution
network (e.g. poles, cables, transformers).257 United Energy then applied a weighted
average escalator, including labour, for each asset class for each year to its capex
forecast.258
Real cost escalation indices for the following material cost drivers were calculated for
United Energy by BIS Schrapnel:259
aluminium
copper
steel
oil
wood; and
concrete.
Table 6.15 outlines United Energy’s real materials cost escalation forecasts.
Table 6.15 United Energy’s real materials cost escalation forecast—
inputs (per cent)
2016 2017 2018 2019 2020
Aluminium 8.0 8.2 5.1 -7.0 -5.2
Copper 3.5 7.7 2.1 -10.0 -6.1
Steel 4.7 3.0 2.7 -11.0 -3.4
Oil -1.1 4.3 2.5 -7.7 -5.0
Wood 2.2 1.7 0.9 2.2 3.9
Concrete -1.0 -2.0 -4.9 -3.2 1.3
Source: United Energy, Revenue proposal, Attachment FIN 583, BIS Schrapnel, Real Labour and Material Cost
Escalation Forecasts to 2020 - Australia and Victoria, November 2014, p. iii.
256
United Energy, Regulatory Proposal 2016–20, April 2015, p. 59. 257
United Energy, Regulatory Proposal 2016–20, April 2015, p. 60. 258
United Energy, Regulatory Proposal 2016–20, April 2015, p. 60. 259
United Energy, Revenue proposal Attachment FIN 583 BIS Schrapnel, Real Labour and Material Cost Escalation
Forecasts to 2020 - Australia and Victoria, November 2014.
6-131 Attachment 6 – Capital expenditure | United Energy Preliminary decision 2016–20
D.7 Assessment approach
We assessed United Energy’s proposed real material cost escalators as part of our
assessment of total capex under the National Electricity Rules (NER) requirements.
Under the NER, we must accept United Energy’s capex forecast if we are satisfied it
reasonably reflects the capex criteria.260 Relevantly, we must be satisfied those
forecasts reasonably reflect a realistic expectation of cost inputs required to achieve
the capex objectives.261
We have applied our approach as set out in our Expenditure Forecast Assessment
Guideline (Expenditure Guideline) to assessing the input price modelling approach to
forecast materials cost.262 In the Expenditure Guideline we stated that we had seen
limited evidence to demonstrate that the commodity input weightings used by service
providers to generate a forecast of the cost of material inputs have produced unbiased
forecasts of the costs the service providers paid for manufactured materials.263 We
considered it important that such evidence be provided because the changes in the
prices of manufactured materials are not solely influenced by the changes in the raw
materials that are used.264 As a result, the price of manufactured network materials may
not be well correlated with raw material input costs. We expect service providers to
demonstrate that their proposed approach to forecast manufactured material cost
changes is likely to reasonably reflect changes in raw material input costs.
In our assessment of United Energy’s proposed material cost escalation, we:
reviewed the BIS Schrapnel report commissioned by United Energy265
reviewed the capex real escalation model used by United Energy266; and
reviewed the approach to forecasting manufactured material costs in the context of
electricity service providers mitigating such costs and producing unbiased
forecasts.
We received no stakeholder submissions on this issue.
260
NER, cl. 6.5.7(c). 261
NER, cl. 6.5.7(c)(3). 262
AER, Better Regulation - Explanatory Statement Expenditure Forecast Assessment Guideline, November 2013,
pp. 50–51. 263
AER, Better Regulation - Explanatory Statement Expenditure Forecast Assessment Guideline, November 2013, p.
50. 264
AER, Better Regulation - Explanatory Statement Expenditure Forecast Assessment Guideline, November 2013, p.
50. 265
United Energy, Regulatory Proposal 2016–20: Attachment: FIN 583 BIS Schrapnel, Real Labour and Material Cost
Escalation Forecasts to 2020 - Australia and Victoria, November 2014. 266
United Energy, Regulatory Proposal 2016–20: Attachment: FIN 583 Real Escalation working (BIS Schrapnel) –
LOCKED.

6-132 Attachment 6 – Capital expenditure | United Energy Preliminary decision 2016–20
D.8 Reasons
We must be satisfied that a forecast is based on a sound and robust methodology in
order to accept that United Energy’s proposed total capex reasonably reflects the
capex criteria.267 This criteria includes that the total forecast capex reasonably reflects a
realistic expectation of cost inputs required to achieve the capex objectives.268 In
making our assessment, we do recognise that predicting future materials costs for
electricity service providers involves a degree of uncertainty. However, for the reasons
set out below, we are not satisfied that the materials forecasts provided by United
Energy satisfy the requirements of the NER. Accordingly, we have not accepted it as
part of our substitute estimate in our preliminary decision on total forecast capex. We
are satisfied that zero per cent real cost escalation is reasonably likely to reflect the
capex criteria and this has been taken into account into our substitute estimate.
Capital expenditure forecast model
United Energy’s capex real escalation model does not demonstrate how and to what
extent material inputs have affected the cost of inputs such as cables and
transformers. In particular, there is no supporting evidence to substantiate how
accurately United Energy’s materials escalation forecasts reasonably reflected
changes in prices they paid for assets in the past to assess the reliability of forecast
materials prices.
In our Expenditure Guideline, we requested service providers should demonstrate that
their proposed approach to forecast materials cost changes reasonably reflected the
change in prices they paid for physical inputs in the past. United Energy’s proposal
does not include supporting data or information which demonstrates movements or
interlinkages between changes in the input prices of commodities and the prices
United Energy paid for physical inputs. United Energy’s capex real escalation model
assumes a weighting for total material inputs for each asset class, but does not provide
information which explains the basis for the weightings, or that the weightings applied
have produced unbiased forecasts of the costs of United Energy’s assets. For these
reasons, there is no basis on which we can conclude that the forecasts are reliable. In
summary, United Energy has not demonstrated that their proposed approach to
forecast materials cost changes reasonably reflects the change in prices they paid for
assets in the past.
Materials input cost model forecasting
United Energy estimated cost escalators in order to assist in forecasting future
operating and capital expenditure. These cost escalators include commodity inputs in
the case of capital expenditure. United Energy adopted a high level approach,
hypothesising a relationship between these commodity inputs and the physical assets
it purchased. United Energy has not successfully attempted to explain or quantify this
267
NER, cl. 6.5.7(c). 268
NER, cl. 6.5.7(c)(3).

6-133 Attachment 6 – Capital expenditure | United Energy Preliminary decision 2016–20
relationship, particularly in respect to movements in the prices between the commodity
inputs and the physical assets and the derivation of commodity input weightings for
each asset class.
We recognise that active trading or futures markets to forecast prices of assets such as
transformers are not available and that in order to forecast the prices of these assets a
proxy forecasting method needs to be adopted. Nonetheless, that forecasting method
must be reasonably reliable to estimate the prices of inputs used by service providers
to provide network services. United Energy has not provided any supporting
information that indicates whether the forecasts have taken into account any material
exogenous factors which may impact on the reliability of material input costs. Such
factors may include changes in technologies which affect the weighting of commodity
inputs, suppliers of the physical assets changing their sourcing for the commodity
inputs, and the general volatility of exchange rates.
Materials input cost mitigation
We consider that there is potential for United Energy to mitigate the magnitude of any
overall input cost increases. This could be achieved by:
potential commodity input substitution by the electricity service provider and the
supplier of the inputs. An increase in the price of one commodity input may result in
input substitution to an appropriate level providing there are no technically fixed
proportions between the inputs. Although there will likely be an increase in the cost
of production for a given output level, the overall cost increase will be less than the
weighted sum of the input cost increase using the initial input share weights due to
substitution of the now relatively cheaper input for this relatively expensive input.
We are aware of input substitution occurring in the electricity industry during the
late 1960's when copper prices increased, potentially impacting significantly on the
cost of copper cables. Electricity service provider's cable costs were mitigated as
relatively cheaper aluminium cables could be substituted for copper cables. We do
however recognise that the principle of input substitutability cannot be applied to all
inputs, at least in the short term, because there are technologies with which some
inputs are not substitutable. However, even in the short term there may be
substitution possibilities between operating and capital expenditure, thereby
potentially reducing the total expenditure requirements of an electricity service
provider269
the substitution potential between opex and capex when the relative prices of
operating and capital inputs change.270 For example, United Energy has not
demonstrated whether there are any opportunities to increase the level of opex
(e.g. maintenance costs) for any of its asset classes in an environment of
increasing material input costs
269
NER, cl. 6.5.7(e)(7). 270
NER, cl. 6.5.7(e)(6).

6-134 Attachment 6 – Capital expenditure | United Energy Preliminary decision 2016–20
the scale of any operation change to the electricity service provider's business that
may impact on its capex requirements, including an increase in capex efficiency,
and
increases in productivity that have not been taken into account by United Energy in
forecasting its capex requirements.
By discounting the possibility of commodity input substitution throughout the 2016–20
period, we consider that there is potential for an upward bias in estimating material
input cost escalation by maintaining the base year cost commodity share weights.
Forecasting uncertainty
The NER requires that an electricity service provider's forecast capital expenditure
reasonably reflects a realistic expectation of cost inputs required to achieve the capex
objectives.271 We consider that there is likely to be significant uncertainty in forecasting
commodity input price movements. The following factors have assisted us in forming
this view:
recent studies which show that forecasts of crude oil spot prices based on futures
prices do not provide a significant improvement compared to a ‘no-change’ forecast
for most forecast horizons, and sometimes perform worse272
evidence in the economic literature on the usefulness of commodities futures prices
in forecasting spot prices is somewhat mixed. Only for some commodities and for
some forecast horizons do futures prices perform better than ‘no change’
forecasts;273 and
the difficulty in forecasting nominal exchange rates (used to convert most materials
which are priced in $US to $AUS). A review of the economic literature of exchange
rate forecast models suggests a “no change” forecasting approach may be
preferable to the forward exchange rate produced by these forecasting models.274
271
NER, cl. 6.5.7(c)(3). 272
R. Alquist, L. Kilian, R. Vigfusson, Forecasting the Price of Oil, Board of Governors of the Federal Reserve System,
International Finance Discussion Papers, Number 1022, July 2011 (also published as Alquist, Ron, Lutz Kilian, and
Robert J. Vigfusson, 2013, Forecasting the Price of Oil, in Handbook of Economic Forecasting, Vol. 2, ed. by
Graham Elliott and Allan Timmermann (Amsterdam: North Holland), pp. 68–69 and pp. 427–508) and International
Monetary Fund, World Economic Outlook — Recovery Strengthens, Remains Uneven, Washington, April 2014, pp.
25–31. 273
International Monetary Fund, World Economic Outlook — Recovery Strengthens, Remains Uneven, Washington,
April 2014, p. 27, Chinn, Menzie D., and Olivier Coibion, The Predictive Content of Commodity Futures, Journal of
Futures Markets, 2014, Volume 34, Issue 7, p. 19 and pp. 607–636 and T. Reeve, R. Vigfusson, Evaluating the
Forecasting Performance of Commodity Futures Prices, Board of Governors of the Federal Reserve System,
International Finance Discussion Papers, Number 1025, August 2011, pp. 1 and 10. 274
R. Meese, K. Rogoff, (1983), Empirical exchange rate models of the seventies: do they fit out of sample?, Journal
of International Economics, 14, B. Rossi, (2013), Exchange rate predictability, Journal of Economic Literature,
51(4), E. Fama, (1984), Forward and spot exchange rates, Journal of Monetary Economics, 14, K. Froot and R.
Thaler, (1990), Anomalies: Foreign exchange, the Journal of Economic Perspectives, Vol. 4, No. 3, CEG,
Escalation factors affecting expenditure forecasts, December 2013, and BIS Shrapnel, Real labour and material
cost escalation forecasts to 2019/20, Australia and New South Wales, Final report, April 2014.

6-135 Attachment 6 – Capital expenditure | United Energy Preliminary decision 2016–20
Strategic contracts with suppliers
We consider that electricity service providers can mitigate the risks associated with
changes in material input costs by including hedging strategies or price escalation
provisions in their contracts with suppliers of inputs (e.g. by including fixed prices in
long term contracts). We also consider there is the potential for double counting where
contract prices reflect this allocation of risk from the electricity service provider to the
supplier, where a real escalation is then factored into forecast capex. In considering
the substitution possibilities between operating and capital expenditure,275 we note that
it is open to an electricity service provider to mitigate the potential impact of escalating
contract prices by transferring this risk, where possible, to its operating expenditure.
Cost based price increases
Accepting the pass through of material input costs to input asset prices is reflective of a
cost based pricing approach. We consider this cost based approach reduces the
incentives for electricity service providers to manage their capex efficiently, and may
instead incentivise electricity service providers to over forecast their capex. In taking
into account the revenue and pricing principles, we note that this approach would be
less likely to promote efficient investment.276 It also would not result in a capex forecast
that was consistent with the nature of the incentives applied under the CESS and the
STPIS to United Energy as part of this decision.277
Selection of commodity inputs
The limited number of material inputs included in United Energy’s capex real escalation
model may not be representative of the full set of inputs or input choices impacting on
changes in the prices of assets purchased by United Energy. United Energy’s capex
forecast model may also be biased to the extent that it may include a selective subset
of commodities that are forecast to increase in price during the 2016–20 period.
Commodities boom
The relevance of material input cost escalation post the 2009 commodities boom
experienced in Australia when material input cost escalators were included in
determining the approved capex allowance for electricity service providers. We
consider that the impact of the commodities boom has subsided and as a
consequence the justification for incorporating material cost escalation in determining
forecast capex has also diminished.
275
NER, cl. 6.5.7(e)(7). 276
NEL, s. 7. 277
NER, cl. 6.5.7(e)(8).

6-136 Attachment 6 – Capital expenditure | United Energy Preliminary decision 2016–20
D.9 Review of independent expert's reports
We have reviewed the BIS Schrapnel report commissioned by United Energy. We
consider that this review, along with our review of two other reports detailed below,
provides further support for our position to not accept United Energy’s proposed
materials cost escalation.
BIS Schrapnel report
BIS Schrapnel acknowledge that as well as individual supply and demand drivers
impacting on the forecast price of commodities, movements in the exchange rate
also impact on the price of commodities. BIS Schrapnel stated that movements in
the Australian dollar against the US dollar can have significant effects on the
domestic price of minerals and metals.278 BIS Shrapnel are forecasting the
Australian dollar to fall to US$0.77 in 2018279. This is significantly lower than the
exchange rate forecasts by Sinclair Knight Mertz (SKM, now Jacobs SKM) of
between US$0.91 to US$0.85 from 2014–15 to 2018–19 submitted as part of our
recent review of TransGrid’s transmission determination for the 2015–18 regulatory
period.280 In its report submitted in respect to our review of Jemena Gas Networks
access arrangement for the 2015–20 access arrangement period, BIS Schrapnel
stated that exchange rate forecasts are not authoritative over the long term.281
We consider the forecasting of foreign exchange movements during the next
regulatory control period to be another example of the potential inaccuracy of
modelling for material input cost escalation.
BIS Schrapnel stated that for a range of items used in most businesses the
average price increase would be similar to consumer price inflation and that an
appropriate cost escalator for general materials would be the Consumer Price
Index (CPI).282 In its forecast for general materials such as stationary, office
furniture, electricity, water, fuel and rent for Jemena Gas Networks, BIS Shrapnel
assumed that across the range of these items, the average price increase would be
similar to consumer price inflation and that the appropriate cost escalator for
general materials is the CPI.283
This treatment of general business inputs supports our view that where we cannot
be satisfied that a forecast of real cost escalation for a specific material input is
278
United Energy, Regulatory Proposal 2016–20: Attachment FIN 583 BIS Schrapnel, Real Labour and Material Cost
Escalation Forecasts to 2020 - Australia and Victoria, November 2014, p. 37. 279
United Energy, Regulatory Proposal 2016–20: Attachment FIN 583 BIS Schrapnel, Real Labour and Material Cost
Escalation Forecasts to 2020 - Australia and Victoria, November 2014, p. 4. 280
SKM, TransGrid Commodity Price Escalation Forecast 2013/14 - 2018/19, 9 December 2013, p. 10. 281
BIS Shrapnel, Real Labour and Material Cost Escalation Forecasts to 2019/20 - Australia and New South Wales,
April 2014, p. A–7. 282
United Energy, Regulatory Proposal 2016–20: Attachment FIN 583 BIS Schrapnel, Real Labour and Material Cost
Escalation Forecasts to 2020 - Australia and Victoria, November 2014, p. 43. 283
BIS Shrapnel, Real Labour and Material Cost Escalation Forecasts to 2019–20 - Australia and New South Wales,
April 2014, p. 48.
6-137 Attachment 6 – Capital expenditure | United Energy Preliminary decision 2016–20
robust, and cannot determine a robust alternative forecast, zero per cent real cost
escalation is reasonably likely to reflect the capex criteria and under the PTRM the
electricity service provider's broad range of inputs are escalated annually by the
CPI.
In addition to our review of the BIS Shrapnel Report, we have also received
submissions from electricity service providers on other recent resets. We have
considered the relevance of those submissions to the issues raised by United Energy
in order to arrive at a position that takes into account all available information. Our
views on these reports are set out below. Overall, both these reports lend further
support to our position to not accept United Energy’s proposed materials cost
escalation.
Competition Economists Group report
A number of electricity service providers commissioned the Competition Economists
Group (CEG) to provide real material cost escalation indices in respect to revenue
resets for these businesses recently undertaken by us. These businesses included
ActewAGL, Ausgrid, Endeavour Energy, Essential Energy and TasNetworks
(Transend).
CEG acknowledged that forecasts of general cost movements (e.g. consumer price
index or producer price index) can be used to derive changes in the cost of other
inputs used by electricity service providers or their suppliers separate from material
inputs (e.g. energy costs and equipment leases etc.).284 This is consistent with the
Post-tax Revenue Model (PTRM) which reflects at least in part movements in an
electricity service provider's intermediary input costs.
CEG acknowledged that futures prices will be very unlikely to exactly predict future
spot prices given that all manner of unexpected events can occur.285 This is
consistent with our view that there are likely to be a significant number of material
exogenous factors that impact on the price of assets that are not captured by the
material input cost models used by United Energy.
CEG provide the following quote from the International Monetary Fund (IMF) in
respect of futures markets:286
While futures prices are not accurate predictors of future spot prices, they
nevertheless reflect current beliefs of market participants about forthcoming
price developments.
This supports our view that there is a reasonable degree of uncertainty in the
modelling of material input cost escalators to reliably and accurately estimate the
prices of assets used by electricity service providers to provide network services.
Whilst the IMF may conclude that commodity futures prices reflect market beliefs
284
CEG, Escalation factors affecting expenditure forecasts, December 2013, p. 3. 285
CEG, Escalation factors affecting expenditure forecasts, December 2013, pp. 4–5. 286
CEG, Escalation factors affecting expenditure forecasts, December 2013, p. 5.

6-138 Attachment 6 – Capital expenditure | United Energy Preliminary decision 2016–20
on future prices, there is no support from the IMF that futures prices provide an
accurate predictor of future commodity prices.
Figures 1 and 2 of CEG’s report respectively show the variance between aluminium
and copper prices predicted by the London Metals Exchange (LME) 3 month, 15
month and 27 month futures less actual prices between July 1993 and December
2013.287 Analysis of this data shows that the longer the futures projection period, the
less accurate are LME futures in predicting actual commodity prices. Given the
next regulatory control period covers a time span of 60 months we consider it
reasonable to question the degree of accuracy of forecast futures commodity prices
towards the end of this period.
Figures 1 and 2 also show that futures forecasts have a greater tendency towards
over-estimating of actual aluminium and copper prices over the 20 year period
(particularly for aluminium). The greatest forecast over-estimate variance was
about 100 per cent for aluminium and 130 per cent for copper. In contrast, the
greatest forecast under-estimate variance was about 44 per cent for aluminium and
70 per cent for copper.
In respect of forecasting electricity service providers future costs, CEG stated
that:288
There is always a high degree of uncertainty associated with predicting the
future. Although we consider that we have obtained the best possible estimates
of the NSPs’ future costs at the present time, the actual magnitude of these
costs at the time that they are incurred may well be considerably higher or
lower than we have estimated in this report. This is a reflection of the fact that
while futures prices and forecasts today may well be a very precise estimate of
current expectations of the future, they are at best an imprecise estimate of
future values.
This statement again is consistent with our view about the degree of the precision
and accuracy of futures prices in respect of predicting electricity service providers
future input costs. CEG also highlights the (poor) predictive value of LME futures
for actual aluminium prices.289
CEG also acknowledge that its escalation of aluminium prices are not necessarily
the prices paid for aluminium equipment by manufacturers. As an example, CEG
referred to producers of electrical cable who purchase fabricated aluminium which
has gone through further stages of production than the refined aluminium that is
traded on the LME. CEG also stated that aluminium prices can be expected to be
influenced by refined aluminium prices but these prices cannot be expected to
move together in a ‘one-for-one’ relationship.290
287
CEG, Escalation factors affecting expenditure forecasts, December 2013, pp. 5–6. 288
CEG, Escalation factors affecting expenditure forecasts, December 2013, p. 13. 289
CEG, Escalation factors affecting expenditure forecasts, December 2013, p. 5. 290
CEG, Escalation factors affecting expenditure forecasts, December 2013, p. 19.

6-139 Attachment 6 – Capital expenditure | United Energy Preliminary decision 2016–20
CEG provided similar views for copper and steel futures. For copper, CEG stated
that the prices quoted for copper are prices traded on the LME that meet the
specifications of the LME but that there is not necessarily a 'one-for-one'
relationship between these prices and the price paid for copper equipment by
manufacturers.291 For steel futures, CEG stated that the steel used by electricity
service providers has been fabricated, and as such, embodies labour, capital and
other inputs (e.g. energy) and acknowledges that there is not necessarily a 'one-for
one' relationship between the mill gate steel and the steel used by electricity
service providers.292
These statements by CEG support our view that the capex real escalation model
used by United Energy has not demonstrated how and to what extent material
inputs have affected the cost of intermediate outputs. We note, as emphasised by
CEG, there is likely to be significant value adding and processing of the raw
material before the physical asset is purchased by United Energy.
CEG has provided data on historical indexed aluminium, copper, steel and crude oil
actual (real) prices from July 2005 to December 2013 as well as forecast real
prices from January 2014 to January 2021 which were used to determine its
forecast escalation factors.293 For all four commodities, the CEG forecast indexed
real prices showed a trend of higher prices compared to the historical trend.
Aluminium and crude oil exhibited the greatest trend variance. Copper and steel
prices were forecast to remain relatively stable whist aluminium and crude oil prices
were forecast to rise significantly compared to the historical trend.
Sinclair Knights Mertz report
Sinclair Knights Mertz (SKM, now Jacobs SKM) were commissioned by TransGrid to
provide real material cost escalation indices in respect to the revenue reset for
TransGrid recently undertaken by us.
SKM cautioned that there are a variety of factors that could cause business
conditions and results to differ materially from what is contained in its forward
looking statements.294 This is consistent with our view that there are likely to be a
significant number of material exogenous factors that impact on the cost of assets
that are not captured by United Energy’s capex real escalation model.
SKM stated it used the Australian CPI to account for those materials or cost items
for equipment whose price trend cannot be rationally or conclusively explained by
the movement of commodities prices.295
In its modelling of the exchange rate, SKM has in part adopted the longer term
historical average of $0.80 USD/AUD as the long term forecast going forward.296
291
CEG, Escalation factors affecting expenditure forecasts, December 2013, p. 19. 292
CEG, Escalation factors affecting expenditure forecasts, December 2013, p. 23. 293
CEG, Escalation factors affecting expenditure forecasts, December 2013, Figures 3, 4 and 5, pp. 23, 25 and 28. 294
SKM, TransGrid Commodity Price Escalation Forecast 2013/14 - 2018/19, 9 December 2013, p. 4. 295
SKM, TransGrid Commodity Price Escalation Forecast 2013/14 - 2018/19, 9 December 2013, p. 8.

6-140 Attachment 6 – Capital expenditure | United Energy Preliminary decision 2016–20
This is consistent with our view that longer term historical commodity prices should
be considered when reviewing and forecasting future prices. In general, we
consider that long term historical data has a greater number of observations and as
a consequence is a more reliable predictor of future prices than a data time series
of fewer observations.
SKM stated that the future price position from the LME futures contracts for copper
and aluminium are only available for three years out to December 2016 and that in
order to estimate prices beyond this data point, it is necessary to revert to
economic forecasts as the most robust source of future price expectations.297 SKM
also stated that LME steel futures are still not yet sufficiently liquid to provide a
robust price outlook.298
SKM stated that in respect to the reliability of oil future contracts as a predictor of
actual oil prices, futures markets solely are not a reliable predictor or robust
foundation for future price forecasts. SKM also stated that future oil contracts tend
to follow the current spot price up and down, with a curve upwards or downwards
reflecting current (short term) market sentiment.299 SKM selected Consensus
Economics forecasts as the best currently available outlook for oil prices
throughout the duration of the next regulatory control period.300 The decision by
SKM to adopt an economic forecast for oil rather than using futures highlights the
uncertainty surrounding the forecasting of commodity prices.
Comparison of independent expert's cost escalation factors
To illustrate the potential uncertainty in forecasting real material input costs, we have
compared the material cost escalation forecasts derived by BIS Schrapnel and CEG as
shown in Table 6.16 SKM did not provide its real materials escalation forecasts in
calendar years so were excluded from this comparison.
296
SKM, TransGrid Commodity Price Escalation Forecast 2013/14 - 2018/19, 9 December 2013, p. 9. 297
SKM, TransGrid Commodity Price Escalation Forecast 2013/14 - 2018/19, 9 December 2013, p. 12. 298
SKM, TransGrid Commodity Price Escalation Forecast 2013/14 - 2018/19, 9 December 2013, p. 16. 299
SKM, TransGrid Commodity Price Escalation Forecast 2013/14 - 2018/19, 9 December 2013, p. 18. 300
SKM, TransGrid Commodity Price Escalation Forecast 2013/14 - 2018/19, 9 December 2013, p. 20.

6-141 Attachment 6 – Capital expenditure | United Energy Preliminary decision 2016–20
Table 6.16 Real material input cost escalation forecasts (per cent)
2015 (%) 2016 (%) 2017 (%) 2018 (%) 2019 (%)
Aluminium
CEG
BIS Shrapnel
Difference (%)
8.3
9.5
-12.6%
0.9
8.0
-88.8%
1.8
8.2
-78.0%
2.9
5.1
-43.1%
2.8
-7.0
-140.0%
Copper
CEG
BIS Shrapnel
Difference (%)
-1.4
0.4
-450.0%
-1.5
3.5
-142.9%
-0.4
7.7
-105.2%
1.2
2.1
-42.9%
1.1
-10.0
-111.0%
Steel
CEG
BIS Shrapnel1
Difference (%)
-4.2
4.8
-187.5%
1.8
4.7
-61.7%
0.9
3.0
-70.0%
1.0
2.7
-63.0%
1.0
-11.0
-109.1%
Oil
CEG
BIS Shrapnel
Difference (%)
-9.0
-1.9
373.7%
1.2
-1.1
-209.1%
1.0
4.3
-76.7%
0.9
2.5
-64.0%
1.0
-7.7
-113.0%
Source: CEG, Updated cost escalation factors, December 2014, pp. 6, 7, 9 and 10 and BIS Shrapnel, Real Labour
and Material Cost Escalation Forecasts to 2019/20 - Australia and New South Wales, April 2014, p. iii. and
BIS Shrapnel, Real Labour and Material Cost Escalation Forecasts to 2019/20 - Australia and New South
Wales, April 2014, p. iii.
As Table 6.16 shows, there is considerable variation between the two consultant’s commodities escalation forecasts. The greatest margin of variation is 12.0 percentage points for steel in 2019, where CEG has forecast a real price increase of 1.0 per cent and BIS Shrapnel a real price decrease of 11.0 per cent. These forecast divergences between consultants further demonstrate the uncertainty in the modelling of material input cost escalators to reliably and accurately estimate the prices of intermediate outputs used by service providers to provide network services. This supports our view that United Energy’s forecast real material cost escalators do not reasonably reflect a realistic expectation of the cost inputs required to achieve the capex objectives over the 2016–20 regulatory control period.301
D.10 Conclusions on materials cost escalation
We are not satisfied that United Energy has demonstrated that the weightings applied
to the intermediate inputs have produced unbiased forecasts of the movement in the
prices it expects to pay for its physical assets. In particular, United Energy has not
301
NER, cl. 6.5.7(a).

6-142 Attachment 6 – Capital expenditure | United Energy Preliminary decision 2016–20
provided sufficient evidence to show that the changes in the prices of the assets they
purchase are highly correlated to changes in raw material inputs.
CEG, in its report to electricity distribution service providers, identified a number of
factors which are consistent with our view that United Energy’s capex real escalation
model has not demonstrated how and to what extent material inputs are likely to affect
the cost of assets. BIS Schrapnel and CEG acknowledged that forecasts of general
cost movements (e.g. CPI or producer price index) can be used to derive changes in
the cost of other inputs used by electricity service providers or their suppliers separate
from material inputs.302 CEG stated that futures prices are unlikely to exactly predict
future spot prices given that all manner of unexpected events can occur.303 CEG also
stated that while futures prices and forecasts today may well be a very precise
estimate of current expectations of the future, they are at best an imprecise estimate of
future values.304
Recent reviews of commodity price movements show mixed results for commodity
price forecasts based on futures prices. Further, nominal exchange rates are in general
extremely difficult to forecast and based on the economic literature of a review of
exchange rate forecast models, a “no change” forecasting approach may be
preferable.
It is our view that where we are not satisfied that a forecast of real cost escalation for
materials is robust, and we cannot determine a robust alternative forecast, then real
cost escalation should not be applied in determining a service provider's required
capital expenditure. We accept that there is uncertainty in estimating real cost changes
but we consider the degree of the potential inaccuracy of commodities forecasts is
such that there should be no escalation for the price of input materials used by United
Energy to provide network services.
In previous AER decisions, including our recent decisions for the New South Wales
and ACT distribution networks as well as our decisions for Envestra's Queensland and
South Australian gas networks, we took a similar approach. This was on the basis that
as all of the New South Wales and ACT distribution businesses and Envestra's real
costs are escalated annually by CPI under the PTRM and tariff variation mechanism
respectively, CPI must inform the AER's underlying assumptions about energy service
provider’s overall input costs. Consistent with this, we applied zero real cost escalation
and by default the New South Wales and ACT distribution businesses and Envestra's
input costs were escalated by CPI in the absence of a viable and robust alternative.
Likewise, for United Energy, we consider that in the absence of a well-founded
materials cost escalation forecast, escalating real costs annually by the CPI is the
302
United Energy, Regulatory Proposal 2016–20: Attachment: FIN 583 BIS Schrapnel, Real Labour and Material
Cost Escalation Forecasts to 2020 - Australia and Victoria, November 2014, p. 43 and CEG, Escalation factors
affecting expenditure forecasts, December 2013, p. 3. 303
CEG, Escalation factors affecting expenditure forecasts, December 2013, pp. 4–5. 304
CEG, Escalation factors affecting expenditure forecasts, December 2013, p. 13.

6-143 Attachment 6 – Capital expenditure | United Energy Preliminary decision 2016–20
better alternative that will contribute to a total forecast capex that reasonably reflects
the capex criteria.
The CPI can be used to account for the cost items for equipment whose price trend
cannot be conclusively explained by the movement of commodities prices. This
approach is consistent with the revenue and pricing principles of the NEL which
provide that a regulated network service provider should be provided with a reasonable
opportunity to recover at least the efficient costs it incurs in providing direct control
network services.305
D.11 Labour and construction escalators
Our approach to real materials cost escalation does not affect the application of labour
and construction related cost escalators, which will continue to apply to standard
control services capital and operating expenditure.
We consider that labour and construction related cost escalation reasonably reflects a
realistic expectation of the cost inputs required to achieve the opex and capex
objectives.306 We consider that real labour and construction related cost escalators can
be more reliably and robustly forecast than material input cost escalators, in part
because these are not intermediate inputs and for labour escalators, productivity
improvements have been factored into the analysis (refer to the opex attachment).
Further details on our consideration of labour cost escalators are discussed in
Attachment 7.
305
NEL, s. 7(2). 306
NER, cll. 6.5.6(c)(3) and.6.5.7(c)(3).
6-144 Attachment 6 – Capital expenditure | United Energy Preliminary decision 2016–20
E Predictive modelling approach and
scenarios
This section provides a guide to our repex modelling process. It sets out:
the background to the repex modelling techniques
discussion of the data required to apply the repex model
detail on how this data was specified
description of how this data was collected and refined for inclusion in the repex
model
the outcomes of the repex model under various input scenarios
This supports the detailed and multifaceted reasoning outlined in appendix A.
E.1 Predictive modelling techniques
In late 2012 the AEMC published changes to the National Electricity and National Gas
Rules.307 In light of these rule changes the AER undertook a “Better Regulation” work
program, which included publishing a series of guidelines setting out our approach to
regulation under the new rules.308
The expenditure forecast assessment Guideline (Guideline) describes our approach,
assessment techniques and information requirements for setting efficient expenditure
allowances for distributors.309 It lists predictive modelling as one of the assessment
techniques we may employ when assessing a distributor's repex. We first developed
and used our repex model in our 2009–10 review of the Victorian electricity DNSPs'
2011–15 regulatory proposals and have also used it subsequently.310
The technical underpinnings of the repex model are discussed in detail in the
Replacement expenditure model handbook.311 At a basic level, the model predicts the
volume of a distributor's assets that may need to be replaced over each of the next 20
years. This prediction is made by looking at the age of assets already in commission,
and the time at which, on average, these assets would be expected to be replaced.
The unit cost of replacing the assets is used to provide an estimate of replacement
expenditure. The data used in the model is derived from the distributor’s regulatory
information notice (RIN) responses and from the outcomes of the unit cost and
307
AEMC, Rule Determination, National Electricity Amendment (Economic Regulation of Network Service Providers)
Rule 2012, 29 November 2012. 308
See AER Better regulation reform program web page at http://www.aer.gov.au/Better-regulation-reform-program. 309
AER, Expenditure Forecast Assessment Guideline for Electricity Distribution, November 2013; AER, Expenditure
Forecast Assessment Guideline for Electricity Transmission, November 2013. 310
AER Determinations for 2011–15 for CitiPower, Jemena, Powercor, SP AusNet, and United Energy. 311
AER, Electricity network service providers: Replacement expenditure model handbook, November 2013.

6-145 Attachment 6 – Capital expenditure | United Energy Preliminary decision 2016–20
replacement life benchmarking across all distribution businesses in the NEM. These
processes are described below.
E.2 Data specification process
Our repex model requires the following input data on a distributor's network assets:
the age profile of network assets currently in commission
expenditure and replacement volume data of network assets
the mean and standard deviation of each asset’s replacement life (replacement
life).
Given our intention to apply unit cost and replacement life benchmarking techniques,
we defined the model’s input data around a series of prescribed network asset
categories. We collected this information by issuing two types of RINs:
1. "Reset RINs" which we issued to distributors requiring them to submit this
information with their upcoming regulatory proposal
2. "Category analysis RINs" which we issued to all distributors in the NEM.
The two types of RIN requested the same historical asset data for use in our repex
modelling. The Reset RIN also collected data corresponding to the distributors
proposed forecast repex over the 2016–20 regulatory control period. In both RINs, the
templates relevant to repex are sheets 2.2 and 5.2.
For background, we note that in past determinations, our RINs did not specify
standardised network asset subcategories for distributors to report against. Instead, we
required the distributors to provide us data that adhered to broad network asset groups
(e.g. poles, overhead conductors etc.). This allowed the distributor discretion as to how
its assets were subcategorised within these groups. The limited prescription over asset
types meant that drawing meaningful comparisons of unit costs and replacement lives
across distributors was difficult.312
Our changed approach of adopting a standardised approach to network asset
categories provides us with a dataset suitable for comparative analysis, and better
equips us to assess the relative prices of capital inputs as required by the capex
criteria.313
When we were formulating the standardised network assets, we aimed to differentiate
the asset categorisations where material differences in unit cost and replacement life
existed. Development of these asset subcategories involved extensive consultation
312
The repex model has been applied in the Victorian 2011–15 and Aurora Energy 2012–17 distribution
determinations; AER, Electricity network service providers: Replacement expenditure model handbook, November
2013. 313
NER, cl. 6.5.7(e)(6).

6-146 Attachment 6 – Capital expenditure | United Energy Preliminary decision 2016–20
with stakeholders, including a series of workshops, bilateral meetings and submissions
on data templates and draft RINs.314
E.3 Data collection and refinement
The new RINs represent a shift in the data reporting obligations on distributors. Given
this is the first period in which the distributors have had to respond to the new RINs, we
undertook regular consultation with the distributors. This consultation involved
collaborative and iterative efforts to refine the datasets to better align the data with
what we require to deploy our assessment techniques. We consider that the data
refinement and consultation undertaken after the RINs were received, along with the
extensive consultation carried out during the Better Regulation process, provide us
with reasonable assurance of the data's quality for use in this part of our analysis.
To aid distributors, an extensive list of detailed definitions was included as an appendix
to the RINs. Where possible, these definitions included examples to assist distributors
in deciding whether costs or activities should be included or excluded from particular
categories. We acknowledge that, regardless of how extensive and exhaustive these
definitions are, they cannot cater for all possible circumstances. To some extent,
distributors needed to apply discretion in providing data. In these instances, distributors
were required to clearly document their interpretations and assumptions in a “basis of
preparation” statement accompanying the RIN submission.
Following the initial submissions, we assessed the basis of preparation statements that
accompanied the RINs to determine whether the data submitted complied with the
RINs. We took into account the shift in data reporting obligations under the new RINs
when assessing the submissions. Overall, we considered that the repex data provided
by all distributors was compliant. We did find a number of instances where the
distributors’ interpretations did not accord with the requirements of the RIN but for the
purpose of proceeding with our assessment of the proposals, these inconsistencies
were not substantial enough for a finding of non-compliance with the NEL or NER
requirements.315
Nonetheless, in order that our data was the most up to date and accurate, we did
inform distributors, in detailed documentation, where the data they had provided was
not entirely consistent with the RINs, and invited them to provide updated data.
Refining the repex data was an iterative process, where distributors returned amended
consolidated RIN templates until such time that the data submitted was fit for purpose.
E.4 Benchmarking repex asset data
As outlined above, we required the following data on distributors' assets for our repex
modelling:
314
See AER Expenditure forecast assessment guideline—Regulatory information notices for category analysis
webpage at http://www.aer.gov.au/node/21843. 315
NER, cl. 6.9.1.
6-147 Attachment 6 – Capital expenditure | United Energy Preliminary decision 2016–20
age profile of network assets currently in commission
expenditure, replacement volumes and failure data of network assets
the mean and standard deviation of each asset’s replacement life.
All NEM distributors provided this data in the Reset RINs and Category analysis RINs
under standardised network asset categories.
To inform our expenditure assessment for the distributors currently undergoing
revenue determinations,316 we compared their data to the data from all NEM
distributors. We did this by using the reported expenditure and replacement volume
data to derive benchmark unit costs for the standardised network asset categories. We
also derived benchmark replacement lives (the mean and standard deviation of each
asset’s replacement life) for the standardised network asset categories.
In this section we explain the data sets we constructed using all NEM distributors' data,
and the benchmark unit costs and replacement lives we derived for the standardised
network asset categories.
E.4.1 Benchmark data for each asset category
For each standardised network asset category where distributors provided data we
constructed three sets of data from which we derived the following three sets of
benchmarks:317
benchmark unit costs
benchmark means and standard deviations of each asset’s replacement life
(referred to as "uncalibrated replacement lives" to distinguish these from the next
category)
benchmark calibrated means and standard deviations of each asset’s replacement
life.
Our process for arriving at each of the benchmarks was as follows. We calculated a
unit cost for each NEM distributor in each asset category in which it reported
replacement expenditure and replacement volumes. To do this:
We determined a unit cost for each distributor, in each year, for each category it
reported under. To do this we divided the reported replacement expenditure by the
reported replacement volume.
Then we determined a single unit cost for each distributor for each category it
reported under. We first inflated the unit costs in each year using the CPI index.318
316
Vic, SA and QLD distribution network service providers—AusNet Services, United Energy, Jemena, Powercor,
Citipower, SA Power Networks, Energex and Ergon Energy. 317
We did not derive benchmark data for some standardised asset categories where no values were reported by any
distributors, or for categories distributors created outside the standardised asset categories. 318
We took into account whether the distributor reported on calendar or financial year basis.
6-148 Attachment 6 – Capital expenditure | United Energy Preliminary decision 2016–20
We then calculated a single unit cost. We did this by first weighting the unit cost
from each year by the replacement volume in that year. We then divided the total of
these expenditures by the total replacement volume number.
We formulated two sets of replacement life data for each NEM distributor:
The replacement life data all NEM distributors reported in their RINs.
The replacement life data we derived using the repex model for each NEM
distributor. These are also called calibrated replacement lives. The repex model
derives the replacement lives that are implied by the observed replacement
practices of a distributor. That is, the lives are based on the data a distributor
reported in the RIN on its replacement expenditure and volumes over the most
recent five years, and the age profile of its network assets currently in commission.
In this way, they can be said to derive from the distributors observed replacement
practices. The calibrated lives the repex model derives can differ from the
replacement lives a distributor reports.
We derived the benchmarks for an asset category using each of the three data sets
above. That is, we derived a set of benchmark unit costs, benchmark replacement
lives, and benchmark calibrated replacement lives for an asset category. To
differentiate the two sets of benchmarked replacement lives, we refer to the
benchmarks based on the calibration process as 'benchmarked calibrated replacement
lives' and those based on replacement lives reported by the NEM distributors as
'benchmarked uncalibrated replacement lives'. We applied the method outlined below
to each of the three data sets.
We first excluded Ausgrid's data, since it reported replacement expenditure values as
direct costs and overheads. Therefore these expenditures were not comparable to all
other NEM distributors which reported replacement expenditure as direct costs only.
We then excluded outliers by:319
calculating the average of all values for an asset category
determining the standard deviation of all values for an asset category
excluding values that were outside plus or minus one standard deviation from the
average.
Using the data set excluding outliers we then determined the:
Average value:
o benchmark average unit cost
319
For the benchmarked calibrated replacement lives we performed two additional steps on the data prior to this. We
excluded any means where the distributor did not report corresponding replacement expenditure. This was
because zero volumes led to the repex model deriving a large calibrated mean which may not reflect industry
practice and may distort the benchmark observation. We also excluded any calibrated mean replacement lives
above 90 years. Although the repex model can generate these large lives, observations of more than 90 years
exceed the number of years reportable in the asset age profile.
6-149 Attachment 6 – Capital expenditure | United Energy Preliminary decision 2016–20
o benchmark average mean and standard deviation replacement life
o benchmark average calibrated mean and standard deviation replacement
life.
One quartile better than the average value:
o benchmark first quartile unit cost (below the mean)
o benchmark third quartile uncalibrated mean replacement life (above the
mean)
o benchmark third quartile calibrated mean replacement life (above the mean).
'Best' value:
o benchmark best (lowest) unit cost
o benchmark best (highest) uncalibrated mean replacement life
o benchmark best (highest) calibrated mean replacement life.320
E.5 Repex model scenarios
As noted above, our repex model uses an asset age profile, expected replacement life
information and the unit cost of replacing assets to develop an estimate of replacement
volume and expenditure over a 20 year period.
The asset age profile data provided by the distributors is a fixed piece of data. That is,
it is set, and not open to interpretation or subject to scenario testing.321 However, we
have multiple data sources for replacement lives and unit costs, being the data
provided by the distributors, data that can be derived from their performance over the
last five years, and benchmark data from all distributors across the NEM. The range of
different inputs allows us to run the model under a number of different scenarios, and
develop a range of outcomes to assist in our decision making.
We have categorised three broad input scenarios under which the repex model may be
run. These are explained in greater detail within our Replacement expenditure model
handbook.322 They are:
320
We did not determine quartile or best values for the uncalibrated standard deviation and calibrated standard
deviation replacement lives. This is because we used the benchmark average replacement lives (mean and
standard derivation) for comparative analysis between the distributors. However, the benchmark quartile and best
replacement life data was for use in the repex model sensitivity analysis. The repex model only requires the mean
component of an asset's replacement life as an input. The repex model then assumes the standard deviation
replacement life of an asset is the square root of the mean replacement life. The use of a square root for the
standard deviation is explained in more detail in our Replacement expenditure model handbook; AER, Electricity
network service providers: Replacement expenditure model handbook, November 2013. 321
It has been necessary for some distributors to make assumptions on the asset age profile to remove double
counting. This is detailed at the end of this appendix. 322
AER, Electricity network service providers: Replacement expenditure model handbook, November 2013.

6-150 Attachment 6 – Capital expenditure | United Energy Preliminary decision 2016–20
(1) The Base scenario – the base scenario uses inputs provided by the distributor in
their RIN response. Each distributor provided average replacement life data as
part of this response. As the distributors did not explicitly provide an estimate of
their unit cost, we have used the observed historical unit cost from the last five
years and the forecast unit cost from the upcoming regulatory control period in the
base scenario.
(2) The Calibrated scenario – the process of “calibrating” the expected replacement
lives in the repex model is described in the AER’s replacement expenditure
handbook.323 The calibration involves deriving a replacement life and standard
deviation that matches the distributor's recent historical replacement practices (in
this case, the five years from 2011 to 2015). The calibrated scenario benchmarks
the business to its own observed historical replacement practices.
(3) The Benchmarked scenarios – the benchmarked scenarios use unit cost and
replacement life inputs from the category analysis benchmarks. These represent
the observed costs and replacement behaviour from distributors across the NEM.
As noted above, we have made observations for an “average”, “first or third
quartile” and “best performer” for each repex category, so there is no single
"benchmarked" scenario, but a series of scenarios giving a range of different
outputs.
The model can also take into account different wooden pole staking/stobie pole plating
rate assumptions (see section E.3 for more information on this process). For the
Victorian distributors, who exhibit high wooden pole staking rates relative to the rest of
the NEM, we have not chosen to test different staking scenarios. A full list of the
scenario outcomes is provided in Figure 6.27 and Figure 6.28 below.
Figure 6.27 Repex model outputs – replacement lives
Replacement lives
Base case (RIN) $914 million
Calibrated lives $220 million
Benchmarked calibrated average $361 million
Benchmarked calibrated third quartile $320 million
Benchmarked calibrated best $191 million
Source: AER analysis, using historic unit costs.
323
AER, Electricity network service providers: Replacement expenditure model handbook, November 2013, pp. 20–
21.

6-151 Attachment 6 – Capital expenditure | United Energy Preliminary decision 2016–20
Figure 6.28 Repex model outputs − unit costs
Unit cost
Benchmarked average $227 million
Benchmarked first quartile $147 million
Benchmarked best $118 million
Source: AER analysis, using calibrated replacement lives.
Data assumptions
Certain data points were not available for use in the model. For unit costs, this arose
either because the distributor did not incur any expenditure on an asset category in the
2011–15 regulatory control period (used to derive historical unit costs) or had not
proposed any expenditure in the 2016–20 regulatory control period (used to derive
forecast unit costs). If both these inputs were not available, we used the benchmarked
average unit cost as a substitute input.
In addition, we did not use a calibrated asset replacement life where the distributor did
not replace any assets during the 2011−15 regulatory control period. This is because
the calibration process relies on replacement volumes over the five year period to
derive a mean and standard deviation, and using a value of zero may not be
appropriate for this purpose. In the first instance, we substituted these values with the
average calibrated replacement life of the broad asset group to which the asset
subcategory belonged. Where this was not available, we used the benchmarked
calibrated replacement life or the base case replacement life from the distributor.
While the majority of the data was provided in a form suitable for modelling, limited
adjustments needed to be made for some of the data. For United Energy we converted
some forecast underground cable replacement volumes metres to kilometres to match
its historic reporting.
Un-modelled repex
As detailed in the AER's repex handbook, the repex model is most suitable for asset
categories and groups with a moderate to large asset population of relatively
homogenous assets. It is less suitable for assets with small populations or those that
are relatively heterogeneous. For this reason, we chose to exclude certain data (or
asset categories) from the modelling process, and did not use predictive modelling to
directly assess these categories. However, where suitable data was available, we used
predictive modelling to test our other findings on these categories. We decided to
exclude SCADA repex from the model for this reason. Expenditure on pole top
structures was also excluded, as it is related to expenditure on overall pole
6-152 Attachment 6 – Capital expenditure | United Energy Preliminary decision 2016–20
replacement and modelling may result in double counting of replacement volumes.
Other excluded categories are detailed in appendix E.3 of this preliminary decision.324
E.6 The treatment of staked wooden poles
The staking of a wooden pole is the practice of attaching a metal support structure (a
stake or bracket) to reinforce an aged wooden pole.325 The practice has been adopted
by distributors as a low-cost option to extend the life of a wooden pole. These assets
require special consideration in the repex model because, unlike most other asset
types, they are not installed or replaced on a like for like basis. To understand why this
requires special treatment, we have described below the normal like-for-like
assumption used in the repex model, why staked poles do not fit well within this
assumption, and how we adapt the model inputs to take account of this.
E.6.1 Like-for-like repex modelling
Replacement expenditure is normally considered to be on a like-for-like basis. When
an asset is identified for replacement, it is assumed that the asset will be replaced with
its modern equivalent, and not a different asset. For example, conductor rated to carry
low voltage will be replaced with conductor of the same rating, not conductor rated for
high voltage purposes.
The repex model predicts the volume of old assets that need to be replaced, not the
volume of new assets that need to be installed. This is simple to deal with when an
asset is replaced on a like-for-like basis – the old asset is simply replaced by a new
asset of the same kind. It follows that the volume of assets that needs to be replaced
where like-for-like replacement is appropriate match the volume of new assets to be
installed. The cost of replacing the volume of retired assets is the unit cost of the new
asset multiplied by the volume of assets that need to be replaced.
E.6.2 Non-like-for-like replacement
Where old assets are commonly replaced with a different asset, we cannot simply
assume the cost of the new asset will match the cost of the old asset's modern
equivalent. As the repex model predicts the number of old assets that need to be
replaced, it is necessary to make allowances for the cost of a different asset in
determining the replacement cost. In running the repex model, the only category where
this was significant was wooden poles.
324
For AusNet Services, we ran a limited set of modelling scenarios on SCADA and other repex, as suitable data was
available. This was used to test the findings from our other techniques. For Powercor, we ran limited scenarios on
pole top structures to test the findings from our other techniques. For each of these, we relied more on other
assessment techniques, as detailed in Appendix A. 325
The equivalent practice for stobie poles is known as "plating", which similarly provides a low cost life extension. SA
Power Networks carries out this process. We applied the same process for modelling SA Power Networks' stobie
pole plating data as we have for staked wooden poles. However, for simplicity, this section only refers to the
staking process.

6-153 Attachment 6 – Capital expenditure | United Energy Preliminary decision 2016–20
Staked and unstaked wooden poles
The life of a wooden pole may be extended by installing a metal stake to reinforce its
base. Staked wooden poles are treated as a different asset in the repex model to
unstaked poles. This is because staked and unstaked poles have different expected
lives and different costs of replacement.
When a wooden pole needs to be replaced, it will either be staked or replaced with a
new pole. The decision on which replacement type will be carried out is made by
determining whether the stake will be effective in extending the pole's life, and is
usually based on the condition of the pole base. If the wood at the base has
deteriorated too far, staking will not be effective, and the pole will need to be replaced.
If there is enough sound wood to hold the stake, the life of the pole can be extended,
and a stake can be installed. Consequently, there are two possible asset replacements
(and two associated unit costs) that may be made by the distributor – a new pole to
replace the old one or nailing a stake to the old pole.
The other non-like-for-like scenario related to staking is where an in-commission
staked pole needs to be replaced. Staking is a one-off process. When a staked pole
needs to be replaced, a new pole must be installed in its place. The cost of replacing
an in-commission staked pole is the cost of a new pole.
Unit cost blending
We use a process of unit cost blending to account for the non-like-for-like asset
categories.
For unstaked wooden poles that need to be replaced, there are two appropriate unit
costs: the cost of a new pole; and the cost of staking an old pole. We have used a
weighted average between the unit cost of staking and the unit cost of pole
replacement to arrive at a blended unit cost.326 We ran the model under a variety of
different weightings – including the observed staking rate of the business and observed
best practice from the distributors in the NEM.
For the Victorian distributors, we adopted their own observed staking ratio.
For staked wooden poles being replaced, in the first instance, we used historical data
from the distributors on the proportion of different voltage staked wooden poles being
replaced to approximate the volume of each new asset going forward.327 The unit cost
of replacing a staked wooden pole is a weighted average based on the historical
proportion of pole types replaced. Where historical data was not available, we used the
326
For example, if a distributor replaces a pole with a new pole 50 per cent of the time, and stakes the pole the other
50 per cent of the time, the blended unit cost would be a straight average of the two unit costs. If the mix was
60:40, the unit cost would be weighted accordingly. 327
Poles with different maximum voltages have different unit costs. An assumption needs to be made to determine,
for example, how many new ">1kv poles" and how many new "1kv-11kv" need to be installed to replace the staked
wooden poles.
6-154 Attachment 6 – Capital expenditure | United Energy Preliminary decision 2016–20
asset age data to determine what proportion of the network each pole category
represented, and used this information to weight the unit costs.
E.7 Calibrating staked wooden poles
Special consideration also has to be given to staked wooden poles when determining
calibrated replacement lives. This is because historical volumes of replacements are
used in calibration. The RIN responses provide us with information on the volume of
new assets installed over the last five years. However, the model predicts the volume
of old assets being replaced. Since the replacement of staked poles is not on a like-for-
like basis, we make an adjustment for the calibration process to function correctly. That
is, we need to know the number of staked poles that reach the end of their economic
life so we can calibrate the model for when these assets are replaced. The category
analysis RIN currently only provides us with information on how many new stakings
have taken place, rather than how many were actually replaced. We sought, and were
provided with this information directly from the distributors.