Preliminary Data Assessment of the New Albany Shale in the KGS #1
16
Preliminary Data Assessment of the New Albany Shale in the KGS #1 Blan Well, Hancock County Brandon C. Nuttall Kentucky Geological Survey 23-Oct-2009
Transcript of Preliminary Data Assessment of the New Albany Shale in the KGS #1

Preliminary Data Assessment of the New Albany Shale in the KGS
#1 Blan Well, Hancock County
Brandon C. Nuttall
Kentucky Geological Survey
23-Oct-2009
Presenter
Presentation Notes
There are two reasons to investigate the New Albany shale as part of an overall assessment of carbon sequestration potential in the Blan well. With lab measured permeabilities in the fraction of a microdarcy range, the New Albany will act as a regional seal for CO2 injected into deeper zones. These permeability data will be discussed more completely at another time. My primary reason for looking at the New Albany is to estimate its potential as a CO2 sponge. In organic-rich gas shales, research indicates CO2 has a greater adsorption affinity than CH4.
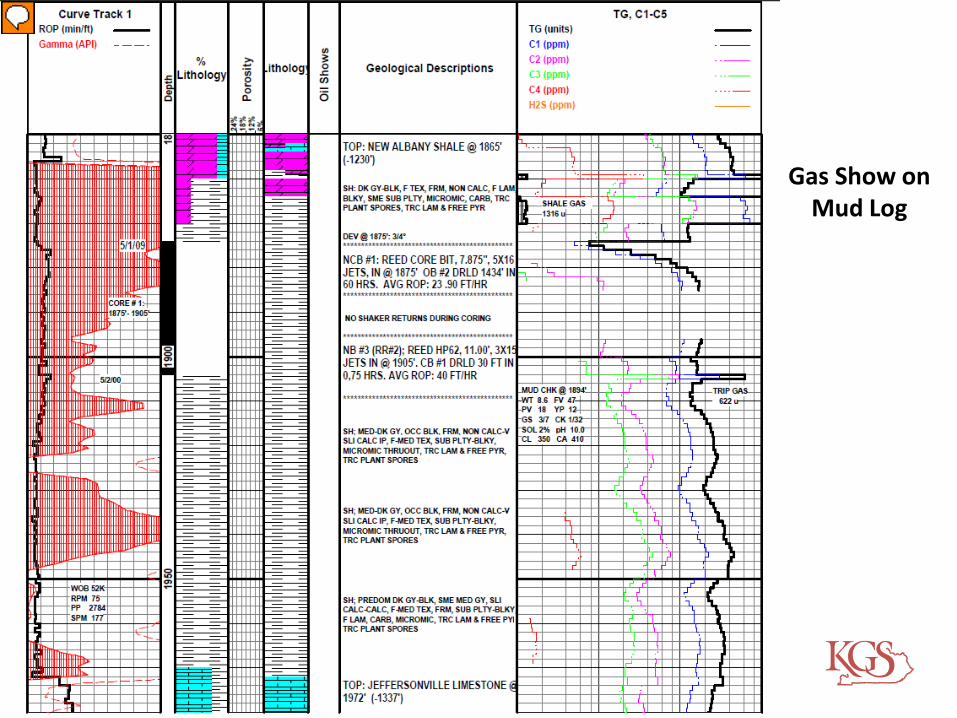
Gas Show on Mud Log
Presenter
Presentation Notes
In the Blan well, 107 feet of organic-rich, Devonian New Albany Shale was encountered at drilling depths from 1,865 to 1,972 feet. A good show of natural gas was recorded at the top of the shale. Thirty feet of core were recovered from 1,875 to 1,905 feet.
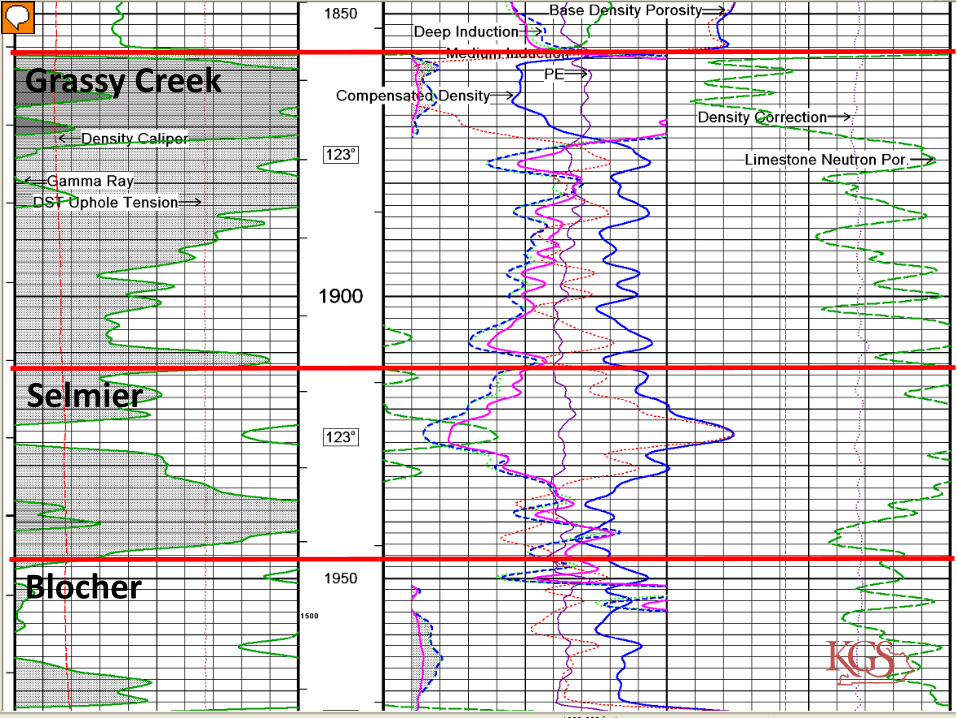
Grassy Creek
Selmier
Blocher
Presenter
Presentation Notes
In this area, the New Albany can be divided into three units: The Grassy Creek Member, Selmier Member (somewhat less organic, grayer shale), and the Blocher Member (characterized by carbonate richness).
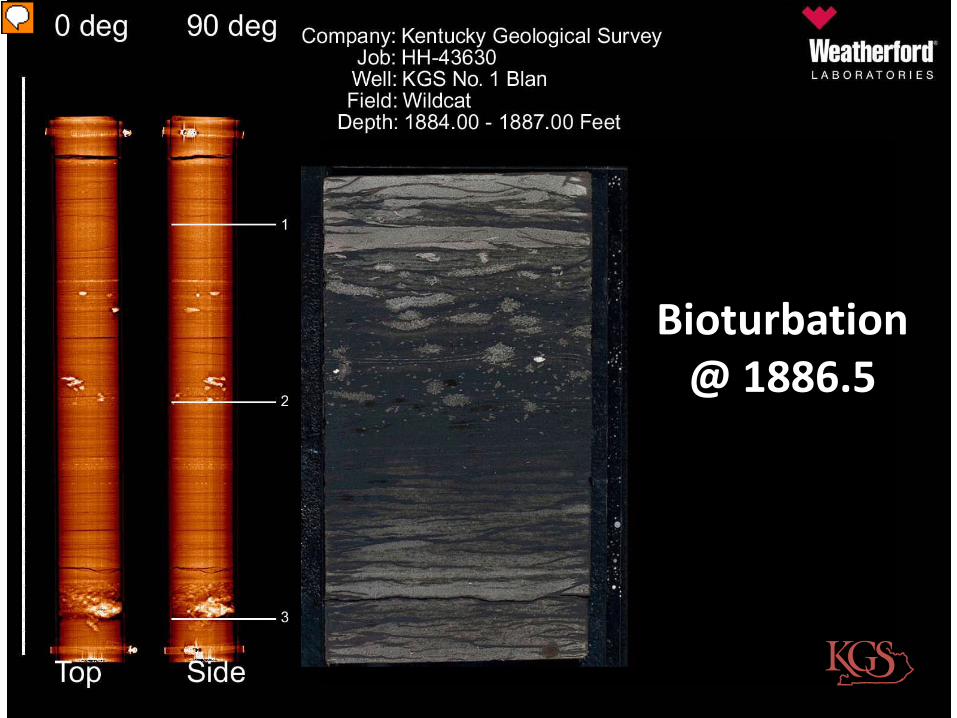
Bioturbation@ 1886.5
Presenter
Presentation Notes
A CT scan of the core segments was acquired to begin characterization of the bed forms and identify fracturing. The bright spots in the CT scan on the left indicate mineralization both isolated blebs of pyrite and layers characterized by carbonate cements. These data were used in conjunction with geophysical logs to assist with choosing sample points for XRD, TOC/RockEval, thin sections, and other laboratory analyses.

50x
200x
Presenter
Presentation Notes
On the left is photography of the slabbed core indicating a natural fracture. On the right is a set of photomicrographs from a thin section taken near the top of this interval. While rare, the thin section indicates the presence of porosity in the shale (patches of blue epoxy used in mounting). The yellow material, both rounded and flattened, are tasmanites, a green marine algae and source of much of the organic matter in the shale. Pyrite and quartz are the likely fillings that have preserved inflated tasmanites specimens.
0
5
10
15
20
0 1 2 3 4
Thor
ium
(ppm
)
Potassium (%)Courtesy Weatherford Chart GN 8-11, 2009
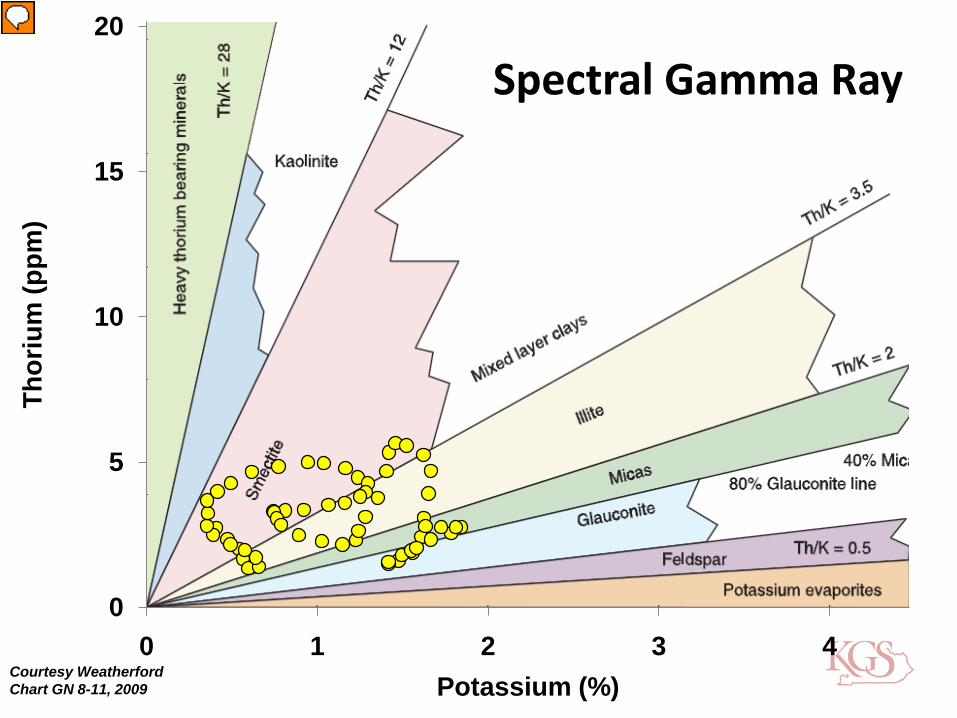
Spectral Gamma Ray
Presenter
Presentation Notes
A cross plot of thorium and potassium data from spectral gamma ray logging suggests the primary clays in the New Albany are mixed-layer Smectite and Illite.

47%
13%
32%
2%6%
X-Ray Diffraction Mineralogy
ClaysPyriteQuartzCarbonateOther
Illite (46%)Mixed Layer (1%)
Presenter
Presentation Notes
That analysis is supported by XRD analysis of bulk mineralogy and the clay fraction.

RhoMax = 2.62(Schmoker)
Presenter
Presentation Notes
My research indicates the CO2 adsorption capacity of organic shale is proportional to the total organic content (TOC) of the shale. That TOC in turn can be estimated from bulk density data (RhoB) from a standard open-hole nuclear log suite. Schmoker (1993) provides a method for determining TOC from RhoB. Schmoker proposes that given the quartz, clay, and accessory mineral content of shale have relatively constant densities, the organic matter content is the primary influence on observed density changes in shale. Schmoker further suggests a relation using the maximum observed density of the gray shale intervals in calculating the TOC from RhoB. Schmoker, J.W., 1993, Use of formation-density logs to determine organic-carbon content in Devonian shales of the western Appalachian Basin and an additional example based on the Bakken Formation of the Williston Basin, in Roen, J.B., and Kepferle, R.C., eds., Petroleum geology of the Devonian and Mississippian black shale of eastern North America: U. S. Geological Survey Bulletin 1909, U.S. Government Printing Office, p. J1-J14.

1840
1860
1880
1900
1920
1940
1960
1980
0 2 4 6 8 10 12 14
Total Organic Carbon (%)
TOC Schmoker
Grassy Creek
Selmier
Blocher
Presenter
Presentation Notes
Using Schmoker’s relationship, a maximum TOC of nearly 10% is observed.

1840
1860
1880
1900
1920
1940
1960
1980
0 2 4 6 8 10 12 14
Total Organic Carbon (%)
Leco TOC
TOC Schmoker
Grassy Creek
Selmier
Blocher
Presenter
Presentation Notes
However, when that calculated TOC log is compared to the Leco TOC data from the core, the lab data seem to indicate a higher TOC than calculated.

1840
1860
1880
1900
1920
1940
1960
1980
0 2 4 6 8 10 12 14
Total Organic Carbon (%)
Leco TOC
TOC Schmoker
TOC Adjusted
Median TOC from core =Median Adjusted TOC
Grassy Creek
Selmier
Blocher
Presenter
Presentation Notes
By shifting the median of the calculated TOC (from RhoB) data to the median of the laboratory-measured TOC at the same depth points an adjusted TOC log curve is derived.
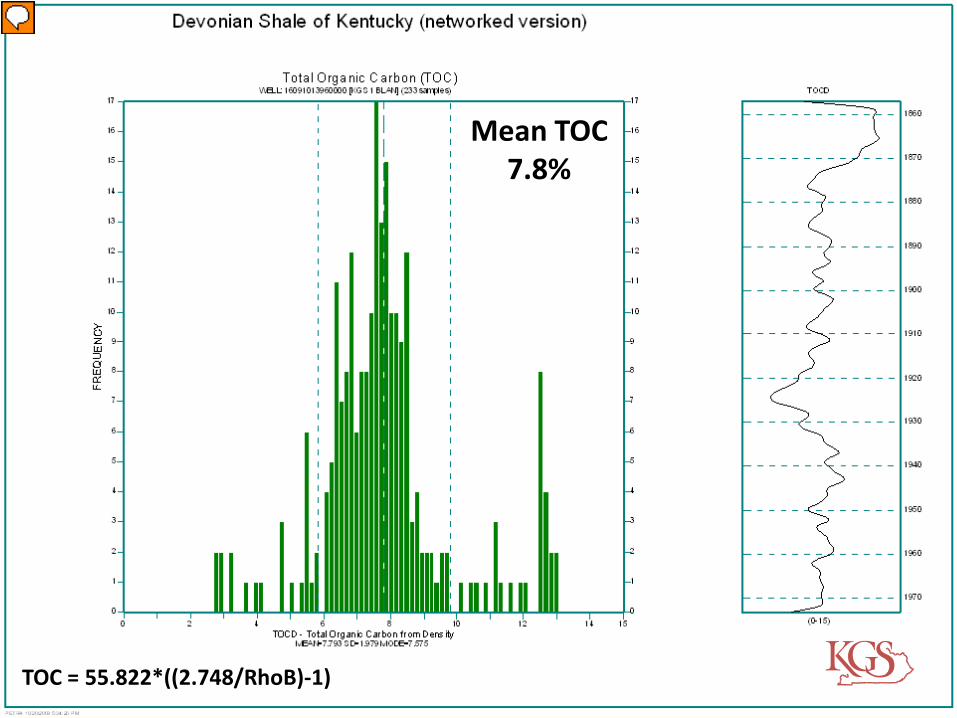
TOC = 55.822*((2.748/RhoB)-1)
Mean TOC7.8%
Presenter
Presentation Notes
These adjusted data indicate a mean TOC of 7.8% for the New Albany in the Blan well.
Presenter
Presentation Notes
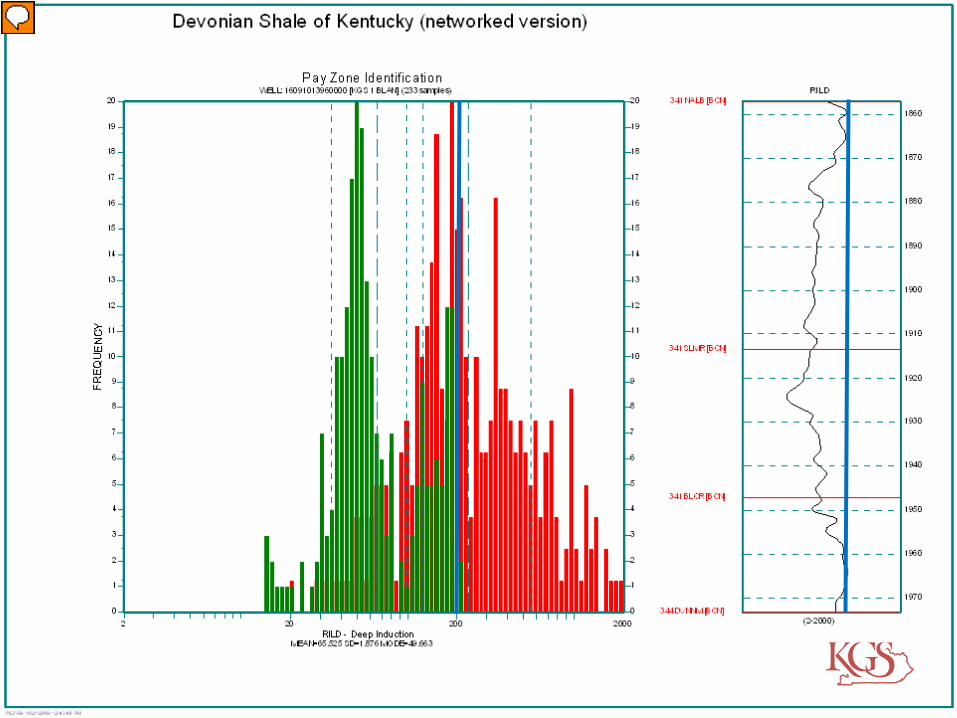
It is common to complete organic-rich shale wells in zones exhibiting 200 ohms or more resistance. The Blan well (green) does not exhibit intervals that immediately suggest a successful shale gas completion as compared to a nearby shale gas well (red, North Coast #1 Mudd & Whobrey). Blue line indicates 200 ohm cutoff.

Storage Calculations
• Preliminary– 10% storage
efficiency
– 181 tons CO2 per acre
Presenter
Presentation Notes
These preliminary calculations indicate that with a 10% storage efficiency, as much as 181 tons of CO2 could be stored acre. CO2 and CH4 adsorption isotherms are in progress but are not available to refine this analysis. While this doesn’t sound like a large capacity, the total volume of shale is huge. The estimated capacity also indicates a capacity for adsorbing and immobilizing any CO2 from deeper storage targets, see Busch and others (2008). Busch, A., Alles, S., Gensterblum, Y., Prinz, D., Dewhurst, D.N., Raven, M.D., Stanjek, H., and Krooss, B.M., 2008, Carbon dioxide storage potential of shales: International Journal of Greenhouse Gas Control, v. 2, no. 3, p. 297-308.

1866
1871
1876
1881
1886
1891
1896
1901
0 20 40 60HC POTENTIAL (S2), mg/g rock
LOG 2: HYDROCARBONPOTENTIAL
1866
1871
1876
1881
1886
1891
1896
1901
0 200 400 600 800HYDROGEN INDEX (HI)
LOG 3: ORGANIC MATTER TYPE
Mar
ine
oil-
Mix
ed o
il-ga
s-
Lacu
strin
eoi
l-
1866
1871
1876
1881
1886
1891
1896
1901
0 2 4 6 8 10
DE
PTH
( fe
et )
TOC, wt. %
LOG 1: ORGANIC RICHNESS
Good to excellent
1866
1871
1876
1881
1886
1891
1896
1901
0 50 100 150 200S1/TOC *100
LOG 4: NORMALIZED OIL CONTENT
Low
mat
urity
or o
verm
atur
e
Oil/
gas
prod
uctio
n or
co
ntam
inat
ion
Low
mat
urity
Mat
ure
stai
ned
sour
ce ro
ck
Presenter
Presentation Notes
Laboratory TOC analysis was supplemented with Rock Eval data. These data indicate good organic richness and a hydrocarbon potential. Consistent with the presence of Tasmanites, the organic matter is consistently marine. Finally, the New Albany is a mature source rock, albeit in the oil to wet gas window.
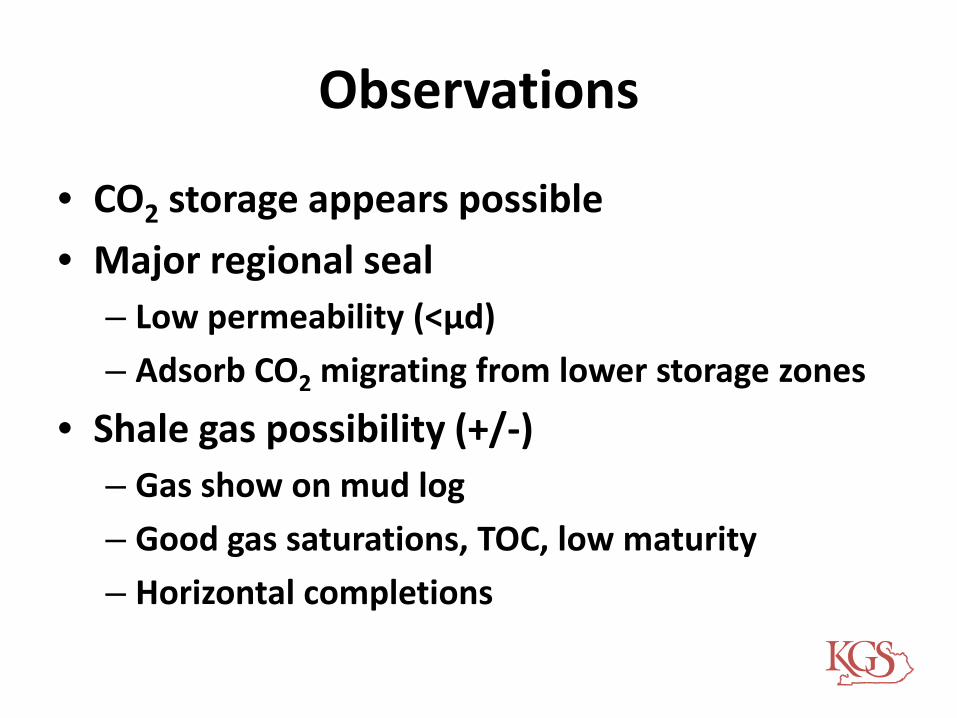
Observations
• CO2 storage appears possible
• Major regional seal– Low permeability (<μd)
– Adsorb CO2 migrating from lower storage zones
• Shale gas possibility (+/-)– Gas show on mud log
– Good gas saturations, TOC, low maturity
– Horizontal completions