Preferences, Norms and Constraints in farmers™ agro ... · PDF filethe heterogeneity of...
23
Preferences, Norms and Constraints in farmers agro-ecological choices. Case study using choice experiments survey in the Rhone River Delta, France MØlanie JAECK, Robert LIFRAN January 2009 Abstract The aim of this paper is to elicit the sensitivity of farmers to pay- ment for agro-environmental services in a context of strong ecological and policy constraints. We present results from a choice experiment survey performed among the whole population of agricultural decision-makers (104) in the Camargue area. Several econometric models have been esti- mated, the most signicant being the Latent Classes one. Three classes have been identied, two of them representing farmers with strong com- mittment to a specic technology (either very chemicals intensive or or- ganic farming ), the main class encompassing farmers complying with the norms of the PGI « Riz de Camargue » . The estimated parameters of the utility function, together with the parameter of the monetary attribute provided the monetary value of each relevant agro-ecological attribute and the associated outcomes (average and risk yield). Outcomes of the choice experiments make a strong case for di/erentiating incentives for spreading environmental friendly technologies. Keywords : Agricultural Technological Choices, Agro-environmental measures, Policy Instruments design, Choice Experiments, Sample Selec- tion Model, Latent classes Model, Random Parameter Model, Rice pro- duction, Organic farming JEL Classication : Q12, Q26, Q28 1
Transcript of Preferences, Norms and Constraints in farmers™ agro ... · PDF filethe heterogeneity of...
Preferences, Norms and Constraints in farmers�agro-ecological choices. Case study using choiceexperiments survey in the Rhone River Delta,
France
Mélanie JAECK, Robert LIFRAN
January 2009
Abstract
The aim of this paper is to elicit the sensitivity of farmers to pay-ment for agro-environmental services in a context of strong ecological andpolicy constraints. We present results from a choice experiment surveyperformed among the whole population of agricultural decision-makers(104) in the Camargue area. Several econometric models have been esti-mated, the most signi�cant being the Latent Classes one. Three classeshave been identi�ed, two of them representing farmers with strong com-mittment to a speci�c technology (either very chemicals intensive or or-ganic farming ), the main class encompassing farmers complying with thenorms of the PGI « Riz de Camargue » . The estimated parameters of theutility function, together with the parameter of the monetary attributeprovided the monetary value of each relevant agro-ecological attribute andthe associated outcomes (average and risk yield). Outcomes of the choiceexperiments make a strong case for di¤erentiating incentives for spreadingenvironmental friendly technologies.
Keywords : Agricultural Technological Choices, Agro-environmentalmeasures, Policy Instruments design, Choice Experiments, Sample Selec-tion Model, Latent classes Model, Random Parameter Model, Rice pro-duction, Organic farming
JEL Classi�cation : Q12, Q26, Q28
1

Introduction
Overall in the world the complex relationship between the technology of agricul-ture and the environment is placed under scrutiny. The motivations behind thatinterest are context-dependant, and pertain to market strategies, to strategies ofinternational negotiation or to consumers demand for pesticides-free products.Moreover, the protection of the environment itself could be locally important,specially in area with a great natural heritage value, as in the Camargue area.In such a context, it is di¢ cult to organize the spatial coexistence of intensiveagriculture and biodiversity rich area (Green et al. 2005). Mainly because theimportance of spillover arising from the intrication of water channel network. Ifzoning and specialization of zones in segregated spaces for intensive agricultureand biodiversity conservation prove to be not possible or very di¢ cult, then itis worth to look at the distribution of farmers preferences and motivations whenthey choose their technology of rice production.In each case, balancing between the economic e¢ ciency and the preservation ofthe environment calls for a careful analysis of the farmers ability to change theirpractices. Compensating payments could be in some cases necessary to moti-vate farmers to adopt environmental friendly technologies, but if this is done,they are not automatically undi¤erentiated.The general assumption of the paper is that farmers face several norms
and constraints, but they have nevertheless a scope for expressing individualchoices. To test that hypothesis, we used a choice experiment approach. Choiceexperiments are useful tools to measure either the willingness to accept or thewillingness to pay for a set of attributes characterizing goods, services or tech-nology. In that paper, we will present the results of the choice experiment surveyperformed among the whole population of agricultural decision-makers (104) inthe Camargue area, Rhone River delta, France. Moreover, using suitable econo-metric models, such as Random Parameter Logit or Latent Class Models, itwill be possible to asses and characterize the underlying heterogeneity in thefarmers technology choices. More precisely, we would like to gain insights onthe heterogeneity of farmers preferences regarding both the attributes of thetechnology and the related compensatory payments.Our use of choice experiment to assess the farmer willingness to accept forspeci�c attributes of agricultural technology with di¤erentiated impacts on theenvironment is , according to authors� knowledge of the literature, original.The results are useful inputs for the design of policy instruments, as long as theregulator is concerned for e¢ cient use of public funds. Helping in the design ofdi¤erentiated payments. for speci�c environmental services could be a bene�cialoutcome of our research1 .
1This research is co-funded by the two Regional Government of Provence-Côte d�Azur andof Languedoc -Roussillon
2
1 Litterature review
The issue we are about investigating is related to three di¤erent �elds of theliterature : agricultural household models, technology adoption and choice ex-periments.The �rst �eld is on the issue of separability between household decision
making and farm management and concern the impact of individual utilityfunction of the farm manager, on the choice of farming style and of productiontechnology.The second �eld of relevant literature concerns the technology adoption
process, and how we can discriminate between individual factors and social in-fuences and interactions pertaining either to collective action or to commercialrelationships ?Finally , it is worth to examine how the question at stake has been investi-
gated in the choice experiments litterature.In their choice of production technology, farmers have preferences not only re-garding productivity or pro�tability, but also for various attributes of crops,animals or farming practices. Utility-based adoption models already provideevidence of the importance of the technology�s perception by the farmers. Batzet al . show that the speed and the level of adoption of a speci�c technol-ogy depend on the level of the investment required, the risk involved, and thecomplexity and the di¢ culties of the task involved in the curse of the imple-mentation (Batz, 2003).Adesina et al. draw attention to the lack of concerns about the farmers�per-ceptions of the characteristics of the technology. They use a Tobit model ofadoption of new and improved rice cultivars in Sierra-Leone, and show that thecharacteristics of a cultivar that are taken into account are not only those re-lated to yield or input use, but also those related to subjective traits (Adesinaet aL, 1993).In a context of subsistence farming, Dalton used a hedonic model of rice traitsshowing that yield is not a signi�cant factor in the adoption, compared withthe length of plant lifecycle, plant height, grains properties (colour, elongation,swelling and tenderness). (Dalton, 2004).Birol and al. analyzed the valuation of agrobiodiversity by Hungarian smallfarmers in their Home gardens using a choice experiment. They rely on fourcomponents of the home-garden system (Richness of crop varieties and fruitstrees, crop landrace, integration of crops and livestock production, organic pro-duction versus pesticides use). Preferences of small farmers who are orientedtoward the satisfaction of the household�s needs are described by the mean ofthe prefered choice sets, and translated into monetary terms (Birol 2008).Roessler and Scarpa use a choice experiment survey to assess the preferences offarmers breeding pigs in Vietnam. Based on the set of �ve attributes (growth,reproduction, disease resistance, feeding needs and physical appearence), theyidenti�ed two types of breeders as folow : « resources driven » and « demanddriven or market oriented » breeders. (Roessler, 2007).
3

Birol et al. presented a latent class approach for the Mexican smallholders fac-ing a choice between the use of the traditional « milpa » system, based on theconservation of genetically diverse maize , and the GM maize (Birol 2006).Dupraz and al. (Dupraz, 2003) stated that farmers�households are togetherproducers and consumers of the environment they contribute to forging. Theyaccomodate the multifonctionnality of the agricultural production in consideringthe technological �exibility of their environmental supply. Using a contingentvaluation survey , they con�rmed that farmers behaviour is in�uenced by envi-ronmental preferences. More precisely, Davies and Hodge found that two atti-tudinal factors, « stewardship orientation » and « technological beliefs » wereby far the most signiifcant in determining the acceptabilitiy of cross-compliancein the CAP implementation (Davies, 2006). As a consequence, structural andsocio-demographic factors were considerably less impportant. They identi�edclusters of farmers according to their overall attitudinal orientation.In the same line , Schmitzberger and al., using the concept of « styles of farm-ing » elaborated by Van der Ploeg, established the link between those styles,land use intensity and motivations for biodiversity conservation and participa-tion in agri-environmental programs (Schmitzberger et al, 2005). Van der Ploegde�ned styles of farming as « a unity of thinking and doing » . Farming stylesencompasse human attitudes, farming objectives, economic success and ecolog-ical performance. (Van der Ploeg, 1994). Identifying and characterizing themain farming styles inside a set of farmers or an area proved very useful totarget some subsets of farmers able to foster a wider adoption of improved weedmanagement strategies by broadacre croppers in Australia (Howden, P. and al.,1998)Finally, two main conclusions arise from this literature review. The �rst
one is related to the importance of subjective factors and preferences in thechoices of technology �s attributes (even if few papers are dealing explicitly withthe implementation ). The second is about the importance of the diversity ofperceptions and farming styles or subcultures (the heterogeneity issue).
2 Local context
The Camargue is a large area made of intricate �elds, marshes and lagoonsin and around the Rhone River Delta (South of France). It belongs to the setof biodiversity hotspots around the Mediterannee Sea registered in the Ramsarconvention and also in the European Framework « Habitat, Fauna and Flora » .The area has been recently accepted as part of to the « Man and Biosphere »reserves network. Several local institutionnal arrangements for managing waterand biodiversity in the landscape have been �nally designed in a context of con-�icting interests (Water Local commission, and Parc Naturel de Camargue).Wheat production and cattle are the main agricultural activities, while variousrecreational activities, commercial hunting among them, provide high incometo landlords. The agricultural production is very intensive, but the use of pes-ticides and herbicides is highly controlled by several administrative regulations
4
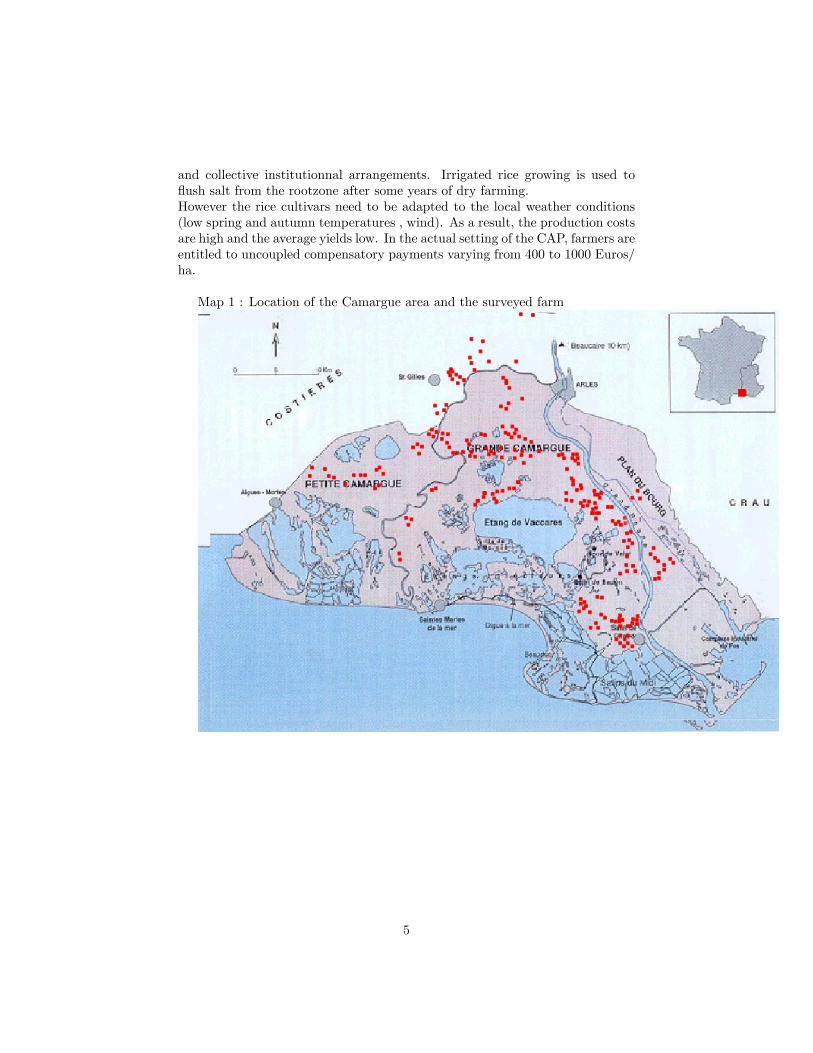
and collective institutionnal arrangements. Irrigated rice growing is used to�ush salt from the rootzone after some years of dry farming.However the rice cultivars need to be adapted to the local weather conditions(low spring and autumn temperatures , wind). As a result, the production costsare high and the average yields low. In the actual setting of the CAP, farmers areentitled to uncoupled compensatory payments varying from 400 to 1000 Euros/ha.
Map 1 : Location of the Camargue area and the surveyed farm
5

3 Model of technology choice
We assume that farmer�s population exhibits a diversity of preferences re-garding the prefered technology. Preferences diversity encompasses both theaversion/addiction to pesticides use, the aversion to the use of seasonal wageworkers, the risk aversion, among others. It is well known that agricultural pro-duction faces a number of constraints arising from the climat, the local agro-ecological conditions or the farm�s structure. The multiplication of constraintslimits the scope for expressing preferences. Moreover, it is often di¢ cult to dis-tinguish constrained choices from unconstrained one.For instance, farmers practising organic farming face several agro-ecological con-straints arising from the di¢ uclty of controling the weeds. As a consequence,the long rotation of rice is a necessity (one year of rice , three years of otherscereal) in that case. But that constraint could be softened by controling weedstrough manual weeding, which is costly and implies high transactions costs. Asa consequence, farmers averse to the use of wage workers could prefer to reducethe rice area.Assuming a diversity of preferences related to the use of pesticides and to the
use of seasonnal wage workers, we propose to distinguish, as in Schmitzberger,(Schmitzberger, 2005) two subpopulations, the productivity oriented farmers,the environmentally friendly oriented farmers and a third subset of supportoriented farmers. While the farmers belonging to the �rst style of farming arewilling to use more pesticides and grow more rice, the second one are willingto avoid them, and accept to use more workers to remove weeds. The thirdgroup of farmers belonging to the support optimizers could choose either onetechnology or another, depending of what is giving the more pro�table outcome.
6

Figure 1 shows how the production possibilities frontiers, expressing the di-versity of technologies, could �t with the preferences related to the correspondingfarming styles.
4 Survey design and data collection
Before proceeding to the survey implementation, we gained the support ofthe main stakeholders in the Delta, the rice growers side (Centre Français du Riz,Syndicat des Riziculteurs de France et Filière, SRFF) and the Environmentaland Landscape Agency side (Parc Naturel Régional de Camargue, PNR). Thatproved to be very important in securing a good stewardship of the survey andgood conditions for the interviews. Interviews were managed by the authorsand by 3 professional surveyors, each having in charge a speci�c area.The attributes choosen to describe cropping technology should be credi-
ble and relevant. Nonetheless, the number of attributes is constrained by thecognitive burden involved in the choice tasks.We thus identi�ed six attributes,assuming they are the main factors explaining the farmers technology choices
7

(Table I below). Three of them are related to agro-ecological means; the lengthof life cycle of rice cultivar, the weeds control technology and the type of crop-rotation. Two other concern outcome; the average yield over �ve years and thethe yield variability. The �nal attribute is a monetary attribute, representing acompensating payment.Weeds control appears to be one of the main problems in irrigated rice croppingin the area. The technology chosen has implications in terms of workforce, useof herbicides, and impact on the biodiversity and environment. It is thereforeimportant will to de�ne farmers�sensibility about the choices of weed controltechnology. The practices proposed in the choice sets are currently practisedin the area, even if not very widespread, for instance, manual and mechanicalweeding.The choice of the rice cultivar, involving the length of the crop� life cycle, isanother relevant attribute insofar as it has consequences on production risk.The type of crop rotation on the same plot is constrained by the weed controland by the salinity of the root zone. When the weed control is not good enough,it is necessary to leave rice cropping for wheat or alfa-alfa. But after a few yearsof wheat cropping, it is necessary to go back to irrigated rice cropping, to �ushsalt from the root zone2 .We used a fractional factorial design to create the experiment structure. An
optimal and e¢ cient design is characterized by three properties, orthogonality,balance and minimum overlap (Huber et Zwerina, 1996). We generated it withSAS R software program, following guidelines by Kuhfeld (2004). The e¢ cientchoice task design resulted in 24 choice sets. In order to limit the number of tasksper respondent, we split them in two blocks. Two sets were discarded due to thelack of realism, so each rice grower faced 11 choice sets, each containing threeoptions. We could not introduce a status quo alternative, given that each farmerhas a di¤erent business. There were two alternatives and one opt-out option,in which the farmer choose to leave his land unexploited. This later option canprovide null or even negative utility (Table II). The main interest of the opt-outoption is twofold : not to force respondents to choose an unsatisfactory option,and being relevant, because the fallow is an option in the actual CAP.The questionnaire was organized in three parts. The �rst one is about the
respondent �s personal identity, with some opinion questions concerning theirconception of the farmers �profession, and their sensibility with respect to en-vironmental preoccupations.. The second one is the choice experiment exerciseitself, The last part concerns questions about the description of the entreprise,for instance the size, the crops, the crop rotation, the suppliers, the customers,and the presence of marshes...Starting from a list of 200 farming entities delivering rice to the rice process-
ing industry, the �nal whole population of decision makers has been de�ned as alist of 104 managers involved in the economical and technological decision mak-ing process (often, the same manager is in charge of managing several farming
2We are grateful to J.C. Mouret (INRA, UMR Innovation) and to C. Thomas (CFR) fortheir helpful advices and comments. Final choice of attributes remains our responsability
8

units). One would remarks that the list represents the entire population of thedecisions maker, and not simply a sample.
Table I : Attributes description and levels
Attributes Description LevelsWeeds control Method of weeds control 1 : intensive chemical weeding (three applica-
tions or more),technology 2 : chemical weeding with one or two applica-
tions,3 : lines seeding and mechanical weeding,4 : counterfacted seeding and manual weedsremoving
Cultivar choice Rice cultivar characterized by 1 : short cycle : 140-150 days,a di¤erent length of life cycle 2 : medium cycle : 150-160 days,
3 : long cycle : > 160 daysCrop Rotation� Rice return time on the same 1 : long rotation (1 year of rice /5 years),
type plot. It is the number of years 2 : �cereal� rotation (2 years of rice / 5 notnecessarily consecutive years ),
of rice growing 3 : �intensive cereal � rotation (2 or 3 consec-utive years of rice )
Average yield over Average of the wheat yield for 1 : < 2 tons,�ve years a �ve years period 2 : [ 2 ; 5 t[,
3 : [ 5 ; 7 t [,4 : �7 t
Yield variability Frequency of yields below the 1 : 0 year,average 2 : 1 year,
3 : 3 yearsCompensatory Extra income o¤ered either 1 : 0 Euro,
payment by the market, or by the CAP 2 : 400 Euros / ha,over the base margin created 3 : 700 Euros / ha,by the scenario 4 : 1000 Euros / ha
9

Table II : example of a choice set
In the event where the following technical itineraries would be the only youface to produce, Which one would you prefer adopt ?
options Scenario A Scenario B Scenario CWeeds controltechnology
Fake seeding and manualweeding
Lines seeding and me-chanical weeding
Crop rotation �intensive cereal� �cereal�Varietal choice Short cycle Long cycleAverage yieldover �ve years
[ 5 ; 7 t [ < 2t
Variability=risk over �veyears
1 bad year with respect tothe average
1 bad year with respect tothe average
Margin di¤eren-tial
0 euros / ha 1000 euros / ha Leave the land un-exploited
A /_ / B /_/ C /_/
5 Models Estimations
The choice data were analyzed and estimated using LIMDEP 9.0 softwareprogram, and more precisely the package NLOGIT 4.0. We have four quanti-tative attributes (varietal choice, average yield, risk and monetary attribute),and two qualitative (weeds control technology and crop rotation) we have codedusing e¤ect coding. For the two scenarios proposed, the rice growers�indirectutility derived from the attributes of our choice experiment study takes thisform :
V ij = CV (Zvarietal choice) +RISK(Zrisk) +ROL(Zlong rotation)+ROC(Zcereal rotation) +AEM(Zmanual weeding)+ASM(Zmechanical weeding) +ACHI(Zintensive chemical weeding)+RDT (Zyield) + PRI(Zmargin differential)
and the following form for the third alternative, the opt-out one :
V ij = ASC
We introduce here an Alternative Speci�c Constant (ASC) to take into accounte¤ects on utility which are not explained by the attributes, and the utility func-tion takes a such form in this option because of the absence of attribute and levelto describe it, given it is an opt-out alternative. This is a way to model these sit-uations in choice experiment work. After having estimated a basic multinomiallogit model, several others models were estimated to consider �rst the presenceof the opt-out option (sample selection model), and then to better integrate the
10

heterogeneity in the rice growers tastes (Random parameter model and latentclass model).
5.1 The basic multinomial logit model
Table III : Estimates of the multinomial logit model
Variable Value std error of �ASC -0,6942 0,8667Cultivar choice -0,0078 0,0057Rotation
"intensive cereal" 0,1038* 0,05771"Cereal" 0,1453** 0,0645Long -0,2491*** 0,0697
Weeds control technologyChemical 0,474Manual -0,1135 0,0735Mechanical -0,4751*** 0,0777Intensive chemical 0,1146 0,0787
Risk -0,1983*** 0,0442Yield 0,0226*** 0,0019Prime 0,0011*** 0,0001Number of observations 1144Number of parameters 10Log likelihood -1154,521Rho-squared 0,14347*, **, *** means statistically signi�cant at 90%, 95% and 99% signi�cance level
For qualitative variables, we chose as reference levels those which are themost widespread among the current practices of the rice growers in Camargue.The parameter attributes associated with levels �cereal� rotation, long rota-tion, mechanical weeding, and those for risk, yield and prime are all signi�cant,at the 1% level of con�dence (except �cereal� rotation, signi�cant at the 5%level of con�dence). We can note that long rotation and mechanical weedingare unfavorable to producers, whereas �cereal� rotation, higher yield and pre-mium bring a greater utility to respondents. The parameter estimate of risk isfound to be negative, as expected, that is an increasing risk is associated witha decreasing utility, signifying that farmers are adverse to risk. The ASC ofthe opt-out option is not signi�cant, that can be explained by the fact thatthe hypothesis of Independence of Irrelevant alternatives (IIA) is violated, in-sofar as the choice of this option depends clearly on the two other scenariosproposed to the respondent. The IIA property was tested using the Hausmanand McFadden (1984) test. The results are reported in table IV below. All theinformation must be included in the estimation, and this is not the case with the
11

MNL model. Moreover, the non signi�cance of attribute levels manual weedingand intensive chemical weeding can be the result of a too big heterogeneity inthe population of rice growers for these factors, and can reveal the presence ofclasses in which the preferences would be di¤erent. For all those reasons theMNL model is de�nitively not appropriate.
Table IV : IIA test
Alternative dropped �2 Degree of freedom Probability
Scenario A 28,0554 10 0,001769Scenario B 19,3113 10 0,036482
5.2 The sample selection model
The sample selection model is a two step model, in which we �rst estimatea probit model to explain the choice of the opt-out option, and then we usethis information to �nd the value of attributes� parameters estimates with aselection. In the probit model, as well as the attributes characterizing thescenarios, we introduce instrumental variables, like the practice of additionalrecreational activities by the respondent, the presence of cattle or sheeps onthe farm and the choice by the producer of the response �stop rice growing�to a question on his reaction to the possibility of a hypothetical ban on theuse of chemical weedkillers. The table V presents the �nal results, those of theselection model.
12

Table V : Estimates of the sample selection model
Variable Value std error of �ASC 0,6679*** 0,0406Cultivar choice -0,0040*** 0,0003Rotation
"intensive cereal" 0,0242* 0,01342"Cereal" 0,0297** 0,0142Long -0,0539*** 0,0142
Weeds control technologyChemical 0,0948Manual -0,0308* 0,0159Mechanical -0,0815*** 0,0165Intensive chemical 0,0175 0,0173
Risk -0,0201** 0,0086Yield 0,0052*** 0,0004Prime 0,0003 *** 0,0000Number of observations 2415Log likelihood -1411,562Log likelihood (restricted) -1730,990Rho-squared 0,22893Chi-squared 638,86signi�cance level 0,0000*, **, *** means statistically signi�cant at 90%, 95% and 99% signi�cance level
We can note that more variables are signi�cant, and the global model isbetter, in terms of McFadden �2, which is becoming here much better3 . TheASC becomes signi�cant and positive. The attributes �cultivar choice� and�manual weeding�become signi�cant too and negative, as expected. Indeed, itis clearly possible to see the repulsion exerted by the mechanical and manualweeding, which are viewed by the respondents as costly practices, in time andmoney. The fact that the utility decreases as the length of the life cycle increasesis consistent with the risk aversion, because the longer is the life cycle, the morethe risk is high4 . The sign and the signi�cance of attributes parameters relatedto the crop rotation, risk, yield and prime are still the same. The attribute levelintensive chemical weeding is the only one no signi�cant.
Nevertheless, due to the existence of a signi�cant group of farmers prac-ticing organic farming, we decided to estimate two models taking into accountthis heterogeneity in the population, the random parameter model and then thelatent class model.
3According to Hensher and Johnson (1981) �2 values between 0; 2 to 0; 4 are consider tobe extremely good �ts.
4A seed with a long life cycle forces the rice growers to sow earlier, and thus it can be riskyif the weather is cold during the fertilization, that causes a bad rice rising.
13

5.3 The random parameter model
In the random parameter models, an assumption over the distribution ofeach of the random parameter (the density function f(�=�) must be de�ned.In this paper, random parameters are speci�ed to be distributed according to theweibull distribution.
Table VI : Estimates of the random parameter model
Variable Value std error of �Random Parameters
ASC 0,4957 1,6382Manual weeding control -2,1191*** 0,5925
Non Random ParametersCultivar choice -0,0114 0,0071Rotation
"intensive cereal" 0,2006** 0,87692"Cereal" 0,2291** 0,0923Long -0,4297*** 0,1216
Weeds control technologyChemical 2,4051Mechanical -0,4755*** 0,0992Intensive chemical 0,1895* 0,1023
Risk -0,2079*** 0,0626Yield 0,0312*** 0,0043Prime 0,0015*** 0,0002Number of observations 1144Log likelihood -1154,5208Log likelihood (restricted) -1256,8125Pseudo rho-squared 0,21752Chi-squared 546,7686signi�cance level 0,0000*, **, *** means statistically signi�cant at 90%, 95% and 99% signi�cance level
The model is still better than the basic MNL one. The manual weeding isnow very signi�cant, that proves that this attribute level is indeed heterogeneousamong the rice growers population. The attribute related to the length of the lifecycle appears now to not be very signi�cant, because it is statistically signi�cantat less than the 90% signi�cance level. But the attribute level intensive chemicalweeding is now signi�cant, with a positive in�uence on the farmers indirectutility. Nothing is change for the other attributes parameters. As we know thatheterogeneity exists in our population, we will thus determine how producerssplit into classes, and estimate attributes parameters for each of them. That�swhy a latent class seems to be the most relevant model.
14

5.4 The latent class model
Table VII: Estimates of the latent class model
Variable Class 1 Class 2 Class 3ASC - 2,5141** 3,5569** 5,3621**Varietal choice - 0,0074 0,0095 0,0183rotation
"intensive cereal" 0,2274*** 0,1162 - 0,7145***�Cereal� 0,1235 0,2156** 0,2093Long - 0,3509*** - 0,3318*** 0,5052*
Weeds control technologychemical 0,513 0,8787 - 1,7232Manual - 0,0157 - 0,7728*** 1,5897***Mechanical - 0,5397*** - 0,8994*** 1,3060***intensive chemical 0,0424 0,7935*** - 1,1725***
Risk - 0,1963*** - 0,3139*** - 1,0818***Yield 0,0238*** 0,0221*** 0,0577***Prime 0,0010*** 0,0018*** 0,0010*Probability of class 0,6014 0,296 0,100Number of observations 1144Log likelihood -1154,521Log likelihood (restricted) -1256,812Pseudo Rho-squared 0,3089Chi-squared 776,3506signi�cance level 0,0000000*, **, *** means statistically signi�cant at 90%, 95% and 99% signi�cance level
The �rst class involves 60 % of the population of decision-makers. Attributesa¤ecting negatively their utility are the long crops rotation, the mechanicalweeding and higher risk , whereas higher compensatory premium and yield in-crease their indirect utility. This class certainly encompasses farmers committedto the technological norms of the PGI (Protected Geographical Indication) �Rizde Camargue�. That norm does not exclude the use of chemicals. One couldconsider that norm as a main or dominant farming subculture. In that class�estimates, several attributes are not statistically signi�cant. This can be eitherthe consequence of the cognitive complexity involved by the management of ahigh number of attributes, the respondents focusing only on the main attributesthey consider relevant for them, or by the direct in�uence of the norm on theirresponses.Beside that core class 1, there are two opposites classes, one being charac-
terized by the rejection of any agro-ecological practices (one third of the overallpopulation), and the other characterized by their adoption (10%) .In class 2, all the attributes except the length of the cultivar�s life cycle are
signi�cant. Crop�s rotation including more wheat and intensive chemical weedscontrol are positively valued, while long rotation, manual or mechanical weeds
15

control are negatively valued. In class 3, the parameter of the length of thecultivar�s life cycle is positive and signi�cant, but the attributes characterizingthe preferences for the crop�s rotation are not. Indeed, manual or mechanicalweeds control are valued positively, while intensive chemical weeding is nega-tively valued.In both classes 2 and 3, the ASC are positive, a result contrasted with the nega-tive ASC in class 1. One could interpret that by the di¤erence in the level of thereserve utility associated to the opt-out choice. In other words, farmers belong-ing to class 1 exhibit a negative utility of the no production option. Farmersbelonging to class 2 or class 3 have each a strong and clear farming subculture,and they prefer to not produce instead of implementing one unwanted technol-ogy .These results are in some way surprising, because we have not anticipated thestrength of the preferences for an intensive farming system. The remainingquestion is about the interpretation to be given to that observation. Is it reallythe expression of a strong farming subculture, or the simple expression of theexistence of one strong agro-ecological constraint arising from the presence ofsalt in the underlying soils layers and aquifer ?
6 Estimation of the �value� of technology�attributes
The monetary value of each attribute, called implicit prices or part-worth, couldbe calculated from the latent classes estimates, using the following relationship:
Implicit price =��attribute=�monetary attribute
�This implicit price represents the marginal welfare variation for a change in
any of the attribute. It corresponds to a compensatory payment that farmer arewilling to accept (WTA) for adopting an attribute (or for a one unit improve-ment in the attribute level), in the case of negative values, or to give it up, inthe case of positive values.
16

Table VIII : Technology�attributes implicit prices (in Euros)
Variables Class 1 Class 2 Class 3
Cultivarrotation
"Cereal" 119,11Long - 337,39 183,34 510,29
weeds control technologyManual - 426,99 1605,78Mechanical - 518,99 - 496,92 1317,14Intensive chemical 40,81 438,42 - 1184,31
Risk - 188,74 - 173,41 - 1092,74Yield 22,89 12,23 58,27
All the farmers in the three classes attached a positive value to higher yields,whereas a negative value has been always attached to the risk attribute. Onlythe level of the implicit price for those attributes di¤ers from class 1 and 2 toclass 3. Class 3, which is certainly associated to organic farming preferences,exhibits a risk aversion considerably higher than the two others groups.For all the remaining attributes, preferences are very contrasted from classes
3 to class 1 and 2. For the later, negative values are associated with agro-ecological practices, while positive one are given to the intensive use of chemicals.For the PGI �Riz de Camargue�producers, mechanical weeds control and longrotation (two characteristics of organic farming) are highly negatively valued.The aversion for the manual weeds control is more moderate, with a lowernegative value. However, we can observe in the second class an importantrejection of all organic agro-ecological practices, more especially manual andmechanical weeds control, and a strong preference for the intensive chemicalweeding. This class represents indeed an intensive farming subculture. Finally,the last class is the one with the highly contrasted values. All attributes relatedto the weeds control and the risk�s level are very important for these rice growers.They have a strong aversion for an intensive use of chemicals, and are willingto practice a manual and mechanical weeds control.
Conclusion
Using a choice experiment survey, this research has elicited rice growers valua-tion of attributes describing their technology�individual preferences.With help of experts and after several tests, we identi�ed �ve relevant tech-
nology�s attributes, three related to agro-ecological means (length of life cycleof rice cultivar, weeds control technology, type of crop-rotation), two relatedto outcome (average yield and yield variability) and �nally, a sixth monetaryattribute, representing a compensating payment in addition of the base grossmargin. Choice sets have been proposed to the farmers, including one opt-outoptions, leaving the land unexploited.
17

The econometric analysis of the data demonstrated a great heterogeneityin the preferences among the decision-makers in the area. Random parame-ters logit and Latent Class Models helped to give a more precise view of thatunderlying heterogeneity.Facing the cognitive di¢ culty of the task choice, respondents certainly used
the references of existing collective norms in the Camargue area as benchmarks.The Latent Class Model identi�ed a core class of responses corresponding tothe standard of the PGI �Riz de Camargue�, and a little one, correspondingto the �organic farming standard�. Nevertheless, beside these well-known stan-dard, an important group of respondents, representing one third of the farmerspopulation, expressed their preferences for a technology using more intensivecropping practices. The question about the interpretation to be given to thatobservation is still open. Is it really the expression of a strong farming sub-culture, or the simple expression of the existence of an strong agro-ecologicalconstraint pertaining to the presence of salt in the underlying soils layers andaquifer?Whatever the interpretation would be, the results are nevertheless worthy
for the managers of the collective standards or of the corresponding marketingchannels. Moreover, they have a great value for policy makers, because theyidenti�ed and measured the diversity of values attached to the main componentsof the rice cropping technology in the area.Estimates of the implicit prices show that breathing spaces exist to bring
rice growers about to adopt environmental friendly practices through marketor public policies incentives. It�s worth noting that the compensatory paymentto give to farmers of class 1, the most important in number, is of the samemagnitude as the actual �bulk unconditional payment�, the so-called �DPU�.Our results could help in designing targeted contracts by sub-area, conservationor environmental objectives.
18

References
[1] Batz, F-J., W. Janssen, and K.J Peters, (2003), Predicting technologyadoption to improve research priority- Setting, Agricultural economics vol.28, pp. 151-164
[2] Birol, E., M. Smale, and A. Gyovaii, (2006), Using a Choice Experimentto Estimate Farmers�s Valuation of Agrobiodiversity on Hungarian SmallFarms, Environmental and Resources Economics, vol. 34, pp. 439-469
[3] Birol,E., M. Smale, and al., (2008), Farmer Preferences for milpa diver-sity and genetically modi�ed maize in Mexico: a latent class approach,Environment and Development Economics,
[4] Bougherara, D., and G. Ducos, (2006), Farmers�Preferences over Conser-vation Contract Flexibility and Duration, An Estimation of the E¤ectsof Transactions Costs using Choice Experiment, INRA, Rennes, WorkingPaper, 26 p.
[5] Davies, B.B., and I. Hodge, (2006), Farmer�s Preferences for New Environ-mental Policy Instruments: Determining the Acceptability of Cross Com-pliance for Biodiversity Bene�ts, Journal of Agricultural Economics, vol.57 (3), pp. 393-414
[6] Dalton, T.J., (2004), A household hedonic model of rice traits: economicvalues from farmers in West Africa, Agricultural Economics, vol. 31, pp.149-159
[7] Dupraz, P., D. Vermesch , B. H. de Frahan and L. Delvaux, (2003), Theenvironmental supply of farm Households, A Flexible Willingness to AcceptModel, Environmental and Resources Economics, Vol. 25, pp. 171-189
[8] Green, R.E., S.T. Cornell, J.P.W. Scharlemann, A. Balmford, (2005),Farming and the fate of wild nature, Science, 307, pp. 550-555
[9] Hausman, J. A. and D. McFadden (1984), �Speci�cation Tests for theMultinomial Logit Model�, Econometrica 52, 1219�1240.
[10] Hensher, D. A. and L. W. Johnson (1981), Applied Discrete Choice Mod-elling, London: Croom-Helm/New York: John Wiley.
[11] Howden, P., F. Vanclay, D. Lemerle, and J. Kent, 1998, Working with thegrain : farming styles among Australian Broadacre croppers, Rural societyJournal, Vol 8 (2)
[12] Huber and Zwerina (1996) The importance of Utility Balance in E¢ cientChoice Designs. Journal of marketing research Col XXXIII, (August 1996),p.307-317.
19
[13] Kuhfeld, W.F (2004): Marketing research methods inSAS. SAS institute Inc.,Cary, NC, USA, Available online:http://support.sas.com/techsup/technote/ts694.pdf
[14] Qaim, M. and A. de Janvry, (2003), Genetically Modi�ed Crops, Corpo-rate Pricing Strategies and Farmers�Adoption: the case of BT Cotton inArgentina, American Journal of Agricultural Economics, vol. 85 (4), pp.814-828
[15] Roessler and R. Scarpa, (2007), Using Choice Experiments to assess small-holders farmers preferences for pig breeding traits in di¤erent productionsystems in NorthWest Vietnam, Ecological Economics�vol. 66, pp. 184-192
[16] Schmitzberger, I ., Th. Wrbka, B. Steiner and al., (2005), How farmingstyles in�uence biodiversity maintenance in Austrian agricultural land-scapes, Agriculture, Ecosystems and Environment, vol. 108, pp. 274-290
[17] Van der Ploeg, J.D., 1994, Styles of farming, an introductory note on con-cepts and methodology, in J.D. Van der Ploeg and A. Long, Ed., 1994, Bornfrom within, Practice and Perspectives of Endogenous Rural Development,Van Gorem, Assen, p. 7-30
[18] Vanclay, F., L. Mesiti and P. Howden, (1998), Styles of Farming and Farm-ing subcultures : appropriate Concepts for Australian Rural Sociology ?Rural Society Journal
20

ANNEX
Empirical data on the surveyed farmers population
General description of the sample
In Camargue area, the rice growers population is almost exclusively maleand old, with more than half of farmers being more than �fty years old. More-over, producers are relatively well educated, in general or with a special educa-tion in agriculture. With regard to the education in agriculture, the populationsplit almost equally into those who don�t have any particular education in farm-ing, and those who have received one.
Table I : Socio demographic characteristics of the decision makers
Characteristics FrequencyAge :
- 18-35 years 14%- 36-50 years 33%- More than 50 years 53%
Sexe :- Male 98%- Female 2%
General education :- No general education 10%- Primary education 14%- Short secondary education 31%- Long secondary education 23%- Higher education 22%
Education in Agriculture:- No agricultural education 41%- Primary education 2%- Short secondary education 16%- Long secondary education 12%- Higher education 29%
The rice growing farms in Camargue have usually broadacre (more than 100ha), and in particular the majority of them are bigger than 200 ha. Only alow percentage (2,5%) of exploitations are very little, that is a net farming areabelow 50 ha.
21

Table II: Characteristics of farms
Characteristics FrequencyNet farming area :
- < 50 ha 2,5%- [50-100 ha[ 23,5%- [100 ha- 200 ha[ 31%- >= 200 ha 43%
Organic cropping :- A part of the whole surfaces in organic 22%- All surfaces in organic 15%
A typology of rice growers with farming subcultures
We elaborated a typology of the decision makers with respect to the farm�scharacteristics and to personal conceptions of the profession.Due to the importance of recreational activities in the Camargue area , we
focused on the presence on the farm of pertinent criterion such as additionalrecreational activities (tourism, commercial hunting, bull race...), marshes (andmore precisely swamps for hunting), cattle (belonging to the farm or not), andthen we included also the average crop�s yields.We �nally identi�ed two main groups:- the �rst one encompasses rice growers who focused only on the farming
production. We call them �Entrepreneurs in agriculture�given that they havea �productivist�farming subculture and get highest yields. Indeed, only few ofthem (7%) are concerned by very lower yields ([2t-5t[). They don�t manage anyadditional recreation activities nor natural spaces (no land for cattle or marsh).They represent 40% of the whole population.- the second one encompasses �Multifunctionals Farmers�who integrate nat-
ural area into their management, while their conception of farming takes intoaccount ecological considerations. They combine agricultural production, recre-ational activities, and manage cattle and marshes. A great part of them getagricultural yields in the range [5t-7t[, but with a greater dispersion than the�Entrepreneurs in Agriculture�. They represent 60% of the population.To complete this general presentation, we end up with linking the former ty-
pology to the personal conceptions about the farming profession. That resultedin the de�nition of two farming subcultures (Table III).
22
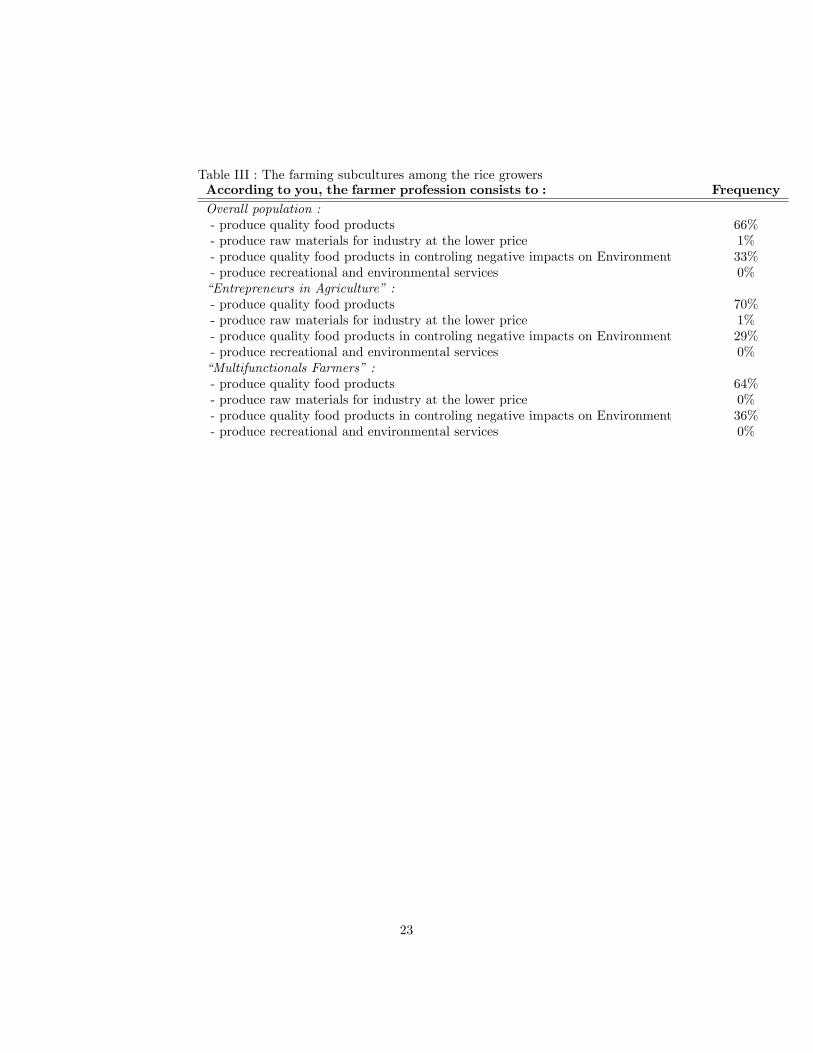
Table III : The farming subcultures among the rice growersAccording to you, the farmer profession consists to : FrequencyOverall population :- produce quality food products 66%- produce raw materials for industry at the lower price 1%- produce quality food products in controling negative impacts on Environment 33%- produce recreational and environmental services 0%�Entrepreneurs in Agriculture� :- produce quality food products 70%- produce raw materials for industry at the lower price 1%- produce quality food products in controling negative impacts on Environment 29%- produce recreational and environmental services 0%�Multifunctionals Farmers� :- produce quality food products 64%- produce raw materials for industry at the lower price 0%- produce quality food products in controling negative impacts on Environment 36%- produce recreational and environmental services 0%
23