
Preferences for Redistribution in Transition Countries
28
Preferences for Redistribution in Transition Countries John E. Anderson and Shaun N. Shimul Department of Economics, University of Nebraska-Lincoln, USA December 22, 2016 Abstract In this paper we analyze the attitudes of residents of transition coun- tries with specic focus on whether they have a strong taste for income redistribution. We implement emprical strategies to test the implications of the basic theoretical models in the literature regarding preferences for redistribution. Empirical models of survey respondents preference for re- distribution, willingness to pay for welfare programs, and preferences for inequality as a work incentive are estimated. Particular focus is placed on testing the prospect of upward mobility (POUM) hypothesis which holds that people below the median, expecting their future income to be higher than their current income, have less desire for redistribution. Evidence presented in this paper indicates that POUM generally describes the at- titudes of survey respondents in transition countries. Data used in this study are from the European Bank for Reconstruction and Development (EBRD) Life in Transition Survey (LITS II) for the year 2010). JEL codes: E21, H11, H31, H53, I38, P27 Keywords: income distribution, income redistribution, preference for redistribution, prospect of upward mobility (POUM) hypothesis, transi- tion economies Acknowledgement 1 This paper has been prepared for presentation at the meetings of the Association for Comparative Economic Studies at the Allied Social Sciences Association meetings, Chicago, January, 2017. 1 Introduction and Background 1.1 Introduction In this paper we tackle the question of whether residents of transition coun- tries have a strong taste for income redistribution given their experience with uctuating incomes and the di¢ culties of transition. We provide a theoretical basis explaining how citizens may desire income redistribution mechanisms We estimate empirical models of survey respondents preferences for redistribution, willingness to pay for welfare programs, and preferences for inequality as a work 1
Transcript of Preferences for Redistribution in Transition Countries

Preferences for Redistribution in TransitionCountries
John E. Anderson and Sha�un N. ShimulDepartment of Economics, University of Nebraska-Lincoln, USA
December 22, 2016
Abstract
In this paper we analyze the attitudes of residents of transition coun-tries with speci�c focus on whether they have a strong taste for incomeredistribution. We implement emprical strategies to test the implicationsof the basic theoretical models in the literature regarding preferences forredistribution. Empirical models of survey respondent�s preference for re-distribution, willingness to pay for welfare programs, and preferences forinequality as a work incentive are estimated. Particular focus is placed ontesting the prospect of upward mobility (POUM) hypothesis which holdsthat people below the median, expecting their future income to be higherthan their current income, have less desire for redistribution. Evidencepresented in this paper indicates that POUM generally describes the at-titudes of survey respondents in transition countries. Data used in thisstudy are from the European Bank for Reconstruction and Development(EBRD) Life in Transition Survey (LITS II) for the year 2010).
JEL codes: E21, H11, H31, H53, I38, P27Keywords: income distribution, income redistribution, preference for
redistribution, prospect of upward mobility (POUM) hypothesis, transi-tion economies
Acknowledgement 1 This paper has been prepared for presentation atthe meetings of the Association for Comparative Economic Studies at theAllied Social Sciences Association meetings, Chicago, January, 2017.
1 Introduction and Background
1.1 Introduction
In this paper we tackle the question of whether residents of transition coun-tries have a strong taste for income redistribution given their experience with�uctuating incomes and the di¢ culties of transition. We provide a theoreticalbasis explaining how citizens may desire income redistribution mechanisms Weestimate empirical models of survey respondent�s preferences for redistribution,willingness to pay for welfare programs, and preferences for inequality as a work
1
incentive are estimated. In particular, we focus on testing the prospect of up-ward mobility (POUM) hypothesis which holds that people below the median,expecting their future income to be higher than their current income, have lessdesire for redistribution. In the absence of a formal insurance market to insureagainst the possibility of lower income in the future, citizens may desire thatthe government compress the income distribution by providing redistributivesafety net programs. In contrast, however, Benabou and Ok (2001) examinethe hypothesis that the poor actually do not support substantial degrees of in-come redistribution because they hope that they can climb the income ladderthemselves (or their children can after them). This conjecture is known as theprospect of upward mobility (POUM) hypothesis. The research reported intheir study, using United States data, indicates that at least in that context thedesire for social insurance dominates the POUM e¤ect. Data used in this studyare from the European Bank for Reconstruction and Development (EBRD) Lifein Transition Survey (LITS II 2010). The LITS II survey provides a wave of re-search covering 29 transition countries plus Kosovo and �ve Western Europeancomparator countries. Using LITS II survey responses we examine the POUMhypothesis by testing whether the populations of the transition countries havepreferences that conform to the hypothesis.
1.2 Previous Literature
Meltzer and Richard (1981) provide the conventional theory of government sizeand redistribution in the context of majority voting in a democracy and thepreferences of the median voter. Their model indicates that the extent ofredistribution depends on the voting rule used in the democratic process ofdetermining government expenditures and on the distribution of productivityin the labor market. Crucial to the outcome is the position of the median voterin the income distribution and changes in relative labor productivity. Theprimary testable implication of their model is that an increase in the meanincome relative to the median voter�s income has the e¤ect of increasing thesize of government. While insightful, this model is not fully applicable to thetransition economy context for two reasons: (1) the weak link between wageand salary income and productivity in labor markets, and (2) the weaknessof democratic institutions implying that the median voter context is not fullyrelevant in those countries. For these reasons, an insurance context seemspreferable for the analysis that follows.Agell and Lommerud (1992) have shown how an insurance-based model ex-
plains the behavior of labor union members in supporting their union whichoften works to compress the wage distribution. They examine how relativewage uncertainty can be used to explain why people support wage compressionin the context of labor unions. They demonstrate that in a competitive econ-omy with a large degree of income dispersion it only takes a small amount ofuncertainty regarding where one will land in the future income distribution togenerate a solution where everyone supports some degree of wage compression.In comparing the labor union context of their model with a country�s tax and
2

transfer system they state, "In principle, a suitably designed tax system couldthus provide the same insurance as pay compression." The application of thatprinciple may be imperfect, however. Pay compression in the workplace andredistributive taxes and transfers in society at large have di¤erent e¢ ciencye¤ects and provide insurance against di¤erent types of risk. Of course, socialnorms are also important, as developed in Ackerlo¤ (1982). Varian (1080) alsouses an insurance framework to model preferences for redistribution.Although most studies claim that the preference for redistribution largely
depends on the income distribution, i.e. higher income people will prefer lessincome redistribution, Piketty (1995) claims that controlling for other factorsthe relationship between individual income and the preference for redistributionhas rather a weak link . He shows that this preference is highly in�uenced bylearning and beliefs about social and individual mobility. For example, he arguesthat individuals born in a left-wing culture (or of left wing parents) are morelikely to support income redistribution, and this result exists irrespective of theincome level of the individual. Even though two regions such as the UnitedStates and the European Union might have similar income mobility structures,the preference for redistribution is higher in the European Union than the UnitedStates. Hence it is possible that a country with higher inequality would notprefer more income redistribution and the results might be obtained throughthe rational choices of voters. He concludes that the persistent di¤erence in theincome distribution across countries is possibly due to the presence of persistencedi¤erences in beliefs about income mobility, in contrast to actual mobility, andthis di¤erence may be evident even in an environment where individuals havesimilar objective functions regarding the cost of distribution. Hence, for a statewith high inequality it is possible to observe a lower demand for redistribution.On the other hand, the individual�s experience and learning about mobilitymight be di¤erent than the broader social mobility and so even though themaximization problem faced by the individuals are same, heterogeneity of thepreference for redistribution is quite possible. Although this study providesinsightful theoretical perspectives, an empirical exercise along this line wouldbe very useful to better understand this phenomenon. Transition country datao¤ers an excellence opportunity to study this issue.Two recent studies on preferences for redistribution in the United States
provide additional insight. Kuziemko et at (2015) provide evidence from ran-domized experiments using U.S. survey data that indicates their treatment (pro-viding information on income inequality and the relationship between top mar-ginal tax rates and economic growth) has large e¤ects on respondent�s views oninequality, but has little e¤ect on their preferences for redistribution. Cout-tenier and Sangier (2015) show that in the United States individuals in statesthat have large mineral resource endowments have stronger negative views onredistribution.This review of theoretical literature provides a basis for examining household
survey data from transition countries for the purpose of analyzing the expresseddesires for income redistribution. In what follows, we estimate empirical modelsof survey respondent�s preferences for redistribution, willingness to pay for wel-
3

fare programs, and preferences for inequality as a work incentive are estimated.Particular focus is placed on testing the prospect of upward mobility (POUM)hypothesis which holds that people below the median, expecting their futureincome to be higher than their current income, have less desire for redistribu-tion. The basic model of preferences for redistribution used to motivate ourempirical analysis is taken from Meltzer and Richards (1981), Romer (1975),and more recently Alesina and Giuliano (2011). We follow the Alesina andGiuliano (2011) exposition to provide a theoretical basis for our empirical workto follow.
2 Theoretical Context
2.0.1 Basic model
In the basic static model, individuals have utility functions ui = u(ci) indicatingthat they derive utility from consumption or income. They supply a single unitof labor inelastically and they have di¤ering productivities �i that yield di¤eringincomes. The average productivity is �A. The tax and transfer mechanism inthe basic model is extremely simple, with lump sum transfers that are �nancevia a linear income tax. The income tax rate t generates tax revenue andalso results in excess burden of wt2 per individual. The government�s budgetconstraint requires that each individual receive a uniform lump-sum transfer.The median voter theorem is used in this model to aggregate the preferencesof individuals in the society and determine a political equilibrium. With thismodel setup, it can be shown that the consumption of individual i is given as:
ci = yi = �i(1� t) + �At� wt2: (1)
Consumption is determined by three terms in this expression: after-tax laborincome, the lump-sum government transfer, and the excess burden of the incometax.Alesina and Giuliani (2011) show that the equilibrium tax rate derived from
maximization of consumption for the median-productivity individual (�M ) isgiven as:
t =�A � �M2w
: (2)
Hence, the di¤erence between the average and median productivities is thecritical factor indicating inequality and the tax rate depends importantly onthis measure of inequality. The tax rate is larger (smaller) for larger (smaller)di¤erences in productivity. In a simple version of the basic model, such as thatused here, it is the di¤erence between average and median voter�s income thatis the critical factor.
4

2.0.2 Expected future income
If individuals care not only about their current income, but also care about theirfuture income as in Benabou and Ok (2001), the basic model must be extendedto at least two periods. Now, suppose that the utility of individual i dependson consumption today (period one) and tomorrow (period two), as indicated inthe revised utility function:
ui = u(ci1; ci2): (3)
Further, we assume that there are productivity shocks that impact income, soyi2 = �i+"i2. The individual�s budget constraint, without discounting, is then
(yi1 + E(yi2))(1� t) + tyA1 + tE(yA2 )� 2wt2 = ci1 + ci2 (4)
where E is the expectations operator and the superscript A indicates the av-erage or mean. This budget constraint requires that after-tax income in thetwo periods, plus tax revenue net of excess burden, be equal to the sum ofconsumption in the two periods.Consider the decision-making of the individual in this context. The tax rate
is determined in period one and is �xed thereafter in period two. Period twoincome is uncertain which means that the individual must vote on the basis ofhis expectation of income relative to the known average and the median incomein period one, and those of period two which are unknown to him. POUMindicates that a person below the median in period one would be averse toredistribution.The literature on POUM, as in Benabou and Ok (2001) has examined
whether the prospect of downward mobility o¤sets the prospect of upward mo-bility. They show that POUM may reduce the demand for redistribution byindividuals, relative to the Meltzer and Richards (1981) basic model implicationunder certain circumstances. Those circumstances, as summarized by Alesinaand Giuliani (2011) are: (1) expected income in period two is a concave func-tion of income in period one, (2) there is limited risk aversion, and (3) there is askewed distribution of the stochastic productivity shocks. The �rst of these cir-cumstances requires that some individuals below the median in period one willbe above the median in period two, but this situation declines at an increasingrate relative to period one income. The second circumstance regarding pro-ductivity (and income) shocks keeps the income distribution from degenerating.Finally, the third circumstance assures that there are not too many individualsexpecting downward mobility.
2.0.3 Inequality in the utility function
What if people care about inequality in a more direct way? To address thisquestion, researchers have explored models that place measures of inequalitydirectly into the utility function. For example, if we have a measure of incomeinequality at time t denoted Qt, the utility function can be written as:
5

Uit =TXt=p
u(cit(:::Qt)) (5)
In this expression utility is the sum from the present period p to a future date Tover which utility in each period is a function of consumption and other factors,and is conditioned on the measure of income inequality. In this formulation, theindividual does not care about inequality directly, but cares because inequalitya¤ects her utility. The interesting issue to consider is whether it is possible thatincreased inequality may reduce the individual�s utility. Alesina and Giuliano(2011) suggest two reasons why this may occur. First, there may be external-ities in education. Redistribution may increase the average education level inthe country thereby providing a bene�t to even the relatively high income indi-viduals in society. Second, redistribution may reduce crime among low incomeindividuals thereby providing a bene�t to higher income individuals. Of course,there are also reasons to believe that increased inequality has a positive e¤ect.Primarily, higher degrees of inequality provide work incentives in a society, afeature we can test using the LITS data.Inequality has been modeled directly within the utility function as well. In
that case the utility function can be speci�ed as:
Ui =TXp=t
(�t(u(cit(:::Qt))� �i(Q�Q�i )2) (6)
where Q�i is the ideal inequality for individual i. Note that the quadratic spec-i�cation involves symmetric loss as the actual level of inequality deviates fromthe ideal level. This speci�cation is suggestive, only. Other speci�cationscan and have been used in the literature. This particular speci�cation cap-tures the possibility that individuals care about their own income as well as thebroader income distribution of the society in which they live. Increased incomefor one�s self may means higher income inequality in the economy, which hasnegative weight in the utility function. But, this speci�cation highlights whywe may observe duality in people�s responses. On the one hand, they preferhigher inequality in order to maintain a work incentive in the economy, but onthe other hand they may prefer to donate some of their own earned income forwelfare programs to reduce income inequality. Important questions that arisein this case are what determines the values of Q�i and �i. Alesina and Giulianisuggest several possibilities. First, from a libertarian point of view, Q� = QL
considers the desired income distribution as that provided by market forces,with no redistribution provided by the government. Second, from an e¢ ciencymaximizing point of view, Q� = QE where QE R QL depending on which ofthe factors a¤ecting individual utility discussed above is stronger. Third, acommunist view would suggest that everyone should be identical, with QCi = 0and the government equalizes income using taxes and transfers. Finally, aRawlsian view would suggest an income distribution QRi resulting ex post from
6

implementation of policies that equalize all citizen�s utility behind the so-calledveil of ignorance.Given the appropriate survey data on respondent�s preferences for redistri-
bution, we can gain insight on which of these views is representative. In whatfollows, we take the insights from these models to survey data collected amongtransition countries. Our desire is to examine attitudes toward redistribution,willingness to pay for increased welfare program bene�ts, and test whether thePOUM hypothesis holds.It is worth mentioning that the models used in the equations (3), (5) and
(6) represent alternative mechanisms for the preference for redistribution. Eventhough the POUM hypothesis uses only income and income shocks as the de-terminants of the preference for redistribution, many studies claim that otherfactors are also important determinants. Piketty (1955) argues that existing cul-ture and experience shape beliefs about upward mobility and the preference forinequality (redistribution). Alesina and Giuliano (2011) shows that individualsmay prefer lower inequality since higher equality has a negative impact on indi-viduals though increased crime, and a lower external bene�t of education. Eventhough our focus is to test the POUM hypothesis, the utility functions in (3), (4)and (5) are suggestive of other mechanisms which can help us better understandthe POUM hypothesis and control for other relevant variables. Assuming thatthe budget constraint is unchanged across di¤erent levels of utility functionsconsidered, the utility function will determine the equilibrium level of taxation,i.e. the preference for redistribution, which will be similar to the equilibriumexpressed in (1) with some modi�cations depending on the utility function spec-i�cation. Hence, the preference for redistribution can be determined by incomeand income shocks or by other factors or combinations of income and incomeshocks, the prospect of upward mobility, experience, and beliefs about mobility,country characteristics, etc. Thus di¤erent utility functions are used under dif-ferent assumptions regarding preferences. The LITS II data gives us not onlythe opportunity to look at current income but also future and past income aswell as diverse macro and cultural variables. After controlling for all those, wecan test the POUM hypothesis and assess its robustness. Even though our datawill not allow us to estimate the parameters of the utility functions explicitly,however, it makes possible testing the e¤ects of various variables in shaping theutility functions.
3 Life in Transition Survey Data
Data used in this study are taken from the European Bank for Reconstructionand Development (EBRD) Life in Transition Survey (LITS), 2010 wave. Thesedata were collected via face-to-face interviews with survey respondents in thirtytransition countries. The full LITS II data set includes approximately 30,000observations.Using the LITS II data we test several hypotheses. Questions 2.27 through
2.29 of the survey instrument speci�cally ask respondents to place themselves on
7

an income ladder with ten rungs (avoiding the statistical jargon of deciles) at thetime of the survey and four years prior. In addition, the survey asks them theiranticipated position four years hence. The survey instrument also asks severalquestions to solicit the respondent�s desire for income redistribution (questions3.01 and 3.16) and willingness to pay more taxes for increased welfare programbene�ts (question 3.06). We use the income ladder questions, in particular, totest the POUM hypothesis.LITS II data also covers �ve comparison countries in Western Europe. Esti-
mations of the results from these groups will help understand the di¤erence inpreferences in the transition countries compared to other developed countries.If income is the only determinant, then we would expect similar signs in thedeveloped and transition countries regressions for most of the variables.In our analysis, we also used developed countries comparator data. Most
of the previous studies have only used developed country data. However, theLITS II dataset provides the opportunity to explore the transition economiesalong with comparator developed countries. Though our interest is the countriesin transition, using comparator countries data we can also test the state char-acteristics that in�uence the preference for redistribution. With this dataset,we cannot only test the POUM hypothesis for transition countries but alsowe can make some comparison with the developed countries, and we can testwhether the country characteristics have any role to play in determining atti-tudes towards distribution. Based on Piketty (1995) and Alesina and Giuliano(2011) studies, we expect that even with similar mobility functions, the coun-try may have a di¤erent taste for redistribution, shaped by country experienceand long tradition. If we observe similar patterns across economies, then itis likely that country characteristic matter least; however, if they are di¤erentthen perhaps the country characteristics shape attitudes towards redistribution.Moreover, these data provide the opportunity to check the POUM hypothesisacross economies.Table 1 provides summary statistics for the variables used in analysis. Re-
spondents indicate that their position on the ten-step income ladder is 4.33, justbelow the middle rung of the ladder. Sixty-one percent of the survey respon-dents are female. The income di¤erence variable (expected future income minuscurrent income) has a mean of 0.51 indicating that on average respondents ex-pect to be half a step higher on the income ladder four years in the future. Thelonger term income di¤erence variable (future income minus previous income)has a mean of 0.25 indicating that respondents expect their future income po-sition four years hence to be one-quarter of a step higher on the income ladderthan it was four years in the past. Given that the survey was conducted in2010, it seems reasonable that the longer term income expectation is smallerthan the purely prospective expectation, if income in the recent past was lowerdue to the global �nancial crisis and recession.
8
4 Taste for Redistribution
Transition economies provide an interesting test bed for testing several hypothe-ses, including the POUM hypothesis. We estimated models explaining surveyrespondents attitudes on reducing the rich-poor income gap, Willingness to payincreased taxes for enhanced welfare program bene�ts, and the preference forinequality as a work incentive. While we estimated models to examine all threeof this issues, our main concern is with the POUM hypothesis which positsthat even the poor may not support radical redistribution if they expect thatthey will climb up the income ladder in near future. Even though they havelower income now they do not prefer greater income redistributional policies tobe implemented by the government, in anticipation of being at a higher pointin the income distribution in the future. In their seminal work Benabou andOk (2001) formalized this hypothesis. Later, several studies empirically testedthis hypothesis and found strong evidence in favor of this theory. For exampleChecchi and Filippin (2004) studied the POUM e¤ect in an experimental set-ting, and Alesina and La Ferrara (2005) studied the hypothesis using U.S. paneldata. Buscha (2012) examined the hypothesis using U.K. data .The life in transition surveys (LITS II) o¤ers a useful source of survey re-
sponses that enable testing of the POUM hypothesis in the context of transitioneconomies. There are several speci�c questions in the survey that are very usefulfor testing the POUM hypothesis, which are exploited in this study in follow-ing sections. First, however, we present graphical representations of several keysurvey indicators.
4.1 Graphical Representation
Section 3 of the LITS II survey questionnaire asks speci�c questions which weuse to examine the POUM hypothesis. Question 301 asks the opinion of therespondent regarding whether the poor-rich income gap of the country shouldbe reduced. Question 306 asks whether the respondent is willing to give partof his/her income or pay more taxes, if you were sure that the extra moneywas used to di¤erent welfare activities such as improving health, education,climate change issues, and helping the needy. Question 316a asks the opinion orpreference of respondents about the how income should be distributed. Possibleresponses follow a ten step scale with 1 being the response that the person wantsa more equal income distribution and 10 being the response that larger incomedi¤erences are acceptable because they provide incentives for individual e¤ort.
4.1.1 Descriptive information on rich-poor income gap reductionperception
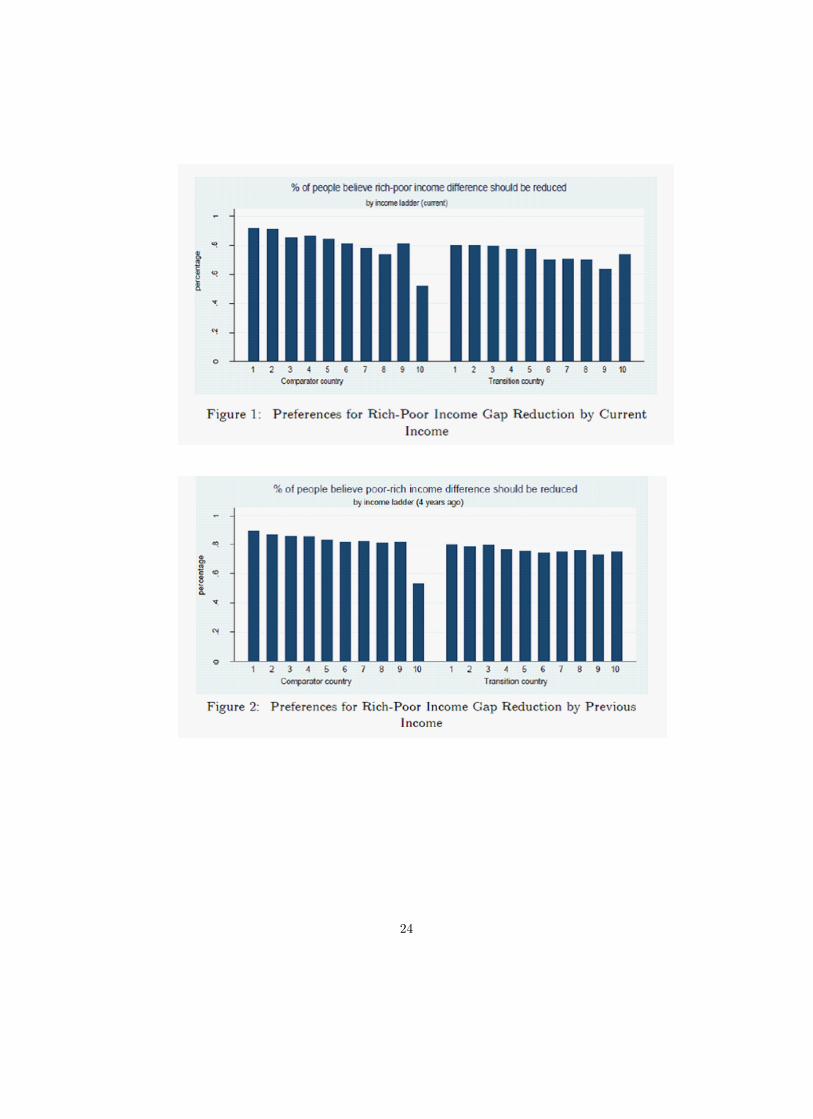
In this section, we report on results regarding the rich-poor income gap using re-sponses to survey question 301h. We create a binary variable capturing whetherrespondents agree (agree or strongly agree) to the view that the income dispar-ity between rich and poor should be reduced. Figure 1 reports the percent of
9

respondents who believe that the rich-poor income di¤erence in their countryshould be reduced, by income decile. The �gure provides responses for bothrespondents in transition countries and in the comparator countries of France,Germany, Italy, and Sweden. Initial inspection of Figure 1 indicates that higherincome respondents are generally less likely to support the idea of reducing therich-poor income gap. Interestingly, people on the highest rung of the incomeladder do support income redistribution more than those in the ninth decile intransition economies. Responses are very similar in the comparator countries,with the exception of the upward jump in support for redistribution in the ninthdecile, followed by a substantial reduction in support in the tenth decile. Thosewho have higher income in comparator countries are much less likely to agreewith reducing income disparities.Figure 2 illustrates the percentage of respondents who believe the rich-poor
income gap should be reduced, but in this case the income distribution is basedon their positions four years ago, before the economic crisis. The e¤ect of thecrisis is seen by comparing Figure 2 with Figure 1. The economic crisis hadthe e¤ect of reducing support for redistribution in the upper half of the incomedistribution in transition countries.
4.1.2 Descriptive information on preference for income distribution
Question 316a of the LITS II survey asks about the views respondents hold forhow income should be distributed on a scale from 1 to 10, with 1 being equalincome for all and 10 being larger income disparity accepted to ensure properincentives to work. The average rating is used to depict respondents viewsregarding this issue. Figure 3 illustrates the mean rating by income decile forrespondents in both transition countries and comparator countries. It is evidentfrom Figure 3 that the mean rating increases with respondent�s income in bothcountry settings. Even those who are on the lower rungs of the income ladder(less than 5) have mean ratings less than 5 indicating that the relatively poordo not prefer much redistribution.Figure 4 plots the same data by income four years prior. Comparing Fig-
ure 4 with Figure 3 for transition countries it is evident that the e¤ect of theeconomic crisis was to reduce support for redistribution across the income distri-bution, with support for redistribution dropping at the low end and support forinequality rising at the high end. Similarly, for comparator countries the e¤ectof the crisis appears to have been a reduction in support for redistribution.Figure 5 illustrates the same data by anticipated income four years in the
future. In this case it is quite clear that there is a monotonically rising meanranking. As expected future income rises, respondents are less supportive ofredistributive policies.
4.2 Regression results
In order to make the analysis more precise it is necessary to do more than merelyeyeball bar charts. In this section we estimate empirical models explaining
10

respondent�s expressed preference for redistribution
4.2.1 Models of the preference for reducing the rich-poor incomegap
First, we model responses to the question (survey question 301h) that askswhether the rich-poor income gap should be reduced in the country. The possibleresponses range from strongly disagree to strongly agree. Eight models areused to analyze the survey responses. As in Buscha (2012), several individualcharacteristics are used as explanatory variables, including gender, income, andlocation of residence. In addition, country �xed e¤ects are included. We alsouse two measures of the change in income over time for respondents. Our �rstmeasure is the di¤erence between the expected future income (four years hence)and current income. This measure is a prospective view of anticipated incomechange. The second measure is the di¤erence between expected future income(four years hence) and previous income (four years ago). This measure is acombination of retrospective and prospective change in income, covering aneight year period.Another explanatory variable used in the models is an indicator of whether
the respondent�s income level is close to the median. This measure identi�esthe people who will most likely be a¤ected by the expected changes in theirposition in the income distribution. Those already near the top do not havemuch room to move up, and those at the bottom are not as likely to moveup. We also include a variable to capture anticipated income jumps. Thisdichotomous variable identi�es respondents who have lower than mean currentincome (lower than income ladder rung 5) but expect to be at a higher than meanincome ladder rung in future. Just one caveat should be mentioned in relationto the use of this variable. Inclusion of this variable omits many observationsfrom the regression estimation since those who have income higher than themean are excluded from the sample used in estimation.Table 2 reports results of estimation for ordered probit models where the de-
pendent variable is the survey respondent�s preference for redistribution. Model1 includes respondent characteristics. Models 2-8 include additional variables.In Model 1 we see that gender matters. Female respondents prefer a moreequal distribution of income than do males. The respondent�s current level ofincome has signi�cant negative e¤ect on the preference for a more equal incomedistribution. the income di¤erence variable (expected future income positionminus current position) has a negative and signi�cant coe¢ cient. That resultindicates that survey respondents expecting higher income in the future are lesssupporting of redistribution. Consistent with the POUM hypothesis, the di¤er-ence between expected future income and current income reduces the strengthof the preference for redistribution. The coe¢ cient for the income di¤erencevariable is negative and signi�cantly di¤erent from zero in four model speci�ca-tions. These results suggest that respondents who believe that their income willgo up in future have a weaker preference for reducing the rich-poor income gap.Respondents with mortgages on their homes, indicating that they have access
11

to �nancial markets, express a stronger preference for reducing the rich-poorincome gap, but those living in metropolitan areas express a weaker preference.Respondents living in countries with more income inequality, measured by theGini Coe¢ cient, express a stronger preference for reducing the rich-poor incomegap, although this e¤ect is statistically insigni�cant. The level of economic de-velopment in the country of the respondent, as measured by log gross nationalincome, has no discernible e¤ect on preferences for redistribution.Model 2 includes a measure of income change over a longer period of time
(eight years): expected future income minus previous income. This variable hasa negative coe¢ cient estimate and is statistically signi�cant. This result alsocon�rms the POUM hypothesis that respondents expecting future income to behigher than past income have less desire for redistribution. The addition of thisvariable causes the other income di¤erence variable with a shorter time horizon(future minus current income position) to become insigni�cant. Otherwise, themodel coe¢ cients are consistent with Model 1. We also tested whether respon-dents with income around the mean prefer more redistribution, as suggestedby the POUM hypothesis, in Models 3-8. The results for that variable are notrobust across all model speci�cations, however.Model 5 includes the income jump variable, which has a positive and sta-
tistically signi�cant coe¢ cient indicating that respondents below the medianlevel of income who expect to have higher income in the future have a strongerpreference for redistribution. This �nding is distinct from that indicated by theincome di¤erence variable, where respondents believe that they will have higherincome in the future, because it is conditioned on respondents having belowmedian income. In general, those expecting their incomes to rise in the futurehave a weaker preference for redistribution, but those below the median whoexpect higher income in the future have a stronger preference.In the remaining three models of Table 2, we include variables to test whether
survey respondent attitudes toward redistribution are sensitive to their situationin comparison to the previous generation. Models 6 and 8 include an indicatorthat the respondent has a higher education level than his or her father. In bothmodels where this variable is included it is not statistically discernible. Models7 and 8 include a variable indicating that the respondent has the perceptionthat his/her condition is better than his/her parents. In both models thisvariable is positive and statistically signi�cant indicating greater support forredistribution.Table 2a shows results of estimation for similar models using survey responses
from the Western European comparator countries only. While for the transi-tion countries, we observe strong coe¢ cients for the income variable, supportingthe POUM hypothesis, other variables are not that strong. However, for thedeveloped comparator countries, along with the income variable other variablesseem to be very important. For example, though the prospect of mobility (anon-income measure) appears to be weakly signi�cant in transition countries,this variable is signi�cant for the developed countries. It may be that survey re-spondents who have higher education levels compared to their parents tend notto prefer higher degrees of income redistribution. For the transition economies
12

location is an important predictor, however, for the comparator developed na-tions, it is not an important determinant. Moreover, the in�uence of existinginequality in the country is very weak in the transition country regressions, butit is very strong for developed countries. More interestingly, the GNI per capitavariable has the opposite e¤ect.
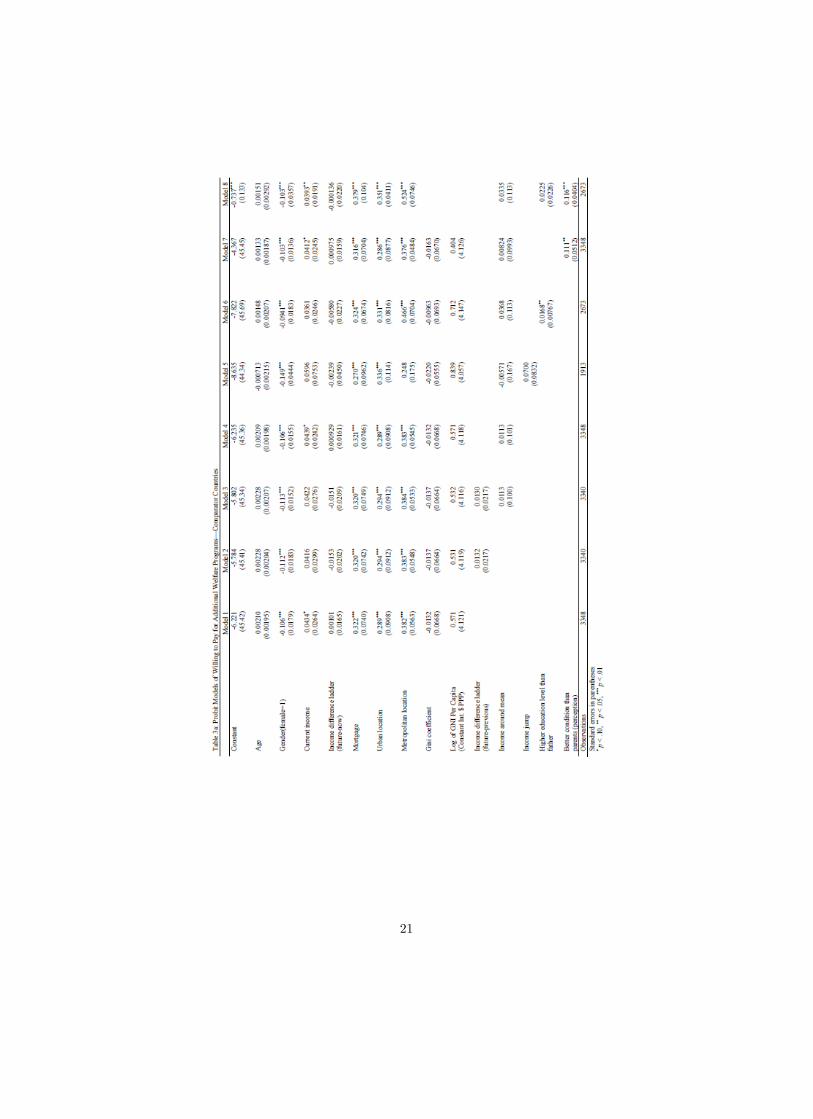
4.2.2 Models of willingness to pay for welfare programs
Next, we investigate whether survey respondents are willing to pay for increasedwelfare programs. Question 306 of the LITS II survey asks respondents if theyare willing to give part of their income, or pay more taxes, for increased welfareprogram activities. Potential responses in the survey instrument are simply yesor no. For this analysis we created a new dummy variable taking on the valueone if the respondent is willing to pay an additional portion of income for anyof the four welfare activities, zero otherwise.Table 3 reports results of probit model estimations. Here, individual charac-
teristics are less important factors in determining who is willing to pay. Higherincome people are willing to pay an additional portion of income for welfareactives, as indicated by the positive estimated coe¢ cient. Respondents in coun-tries with higher degrees of inequality indicate no signi�cantly greater willing-ness to pay more, but those in countries with higher per capita income preferto pay less for welfare activities. Urban area residents are willing to pay morethan those in rural areas, but those in metropolitan areas are not willing to paymore.Among income measures included in the models, the expected future increase
in income is not signi�cant across speci�cations of Models 1-7, but is positiveand weakly signi�cant in Model 8. The eight-year di¤erence in income is alsonot signi�cant in Models 2 and 3. The indicator that the respondent�s incomeis around the mean is also not signi�cant in Models 3-8. And, the incomejump variable is not signi�cant in Model 5. Respondents who perceive thattheir condition is better than their parents are more willing to pay for welfareprograms, as indicated in Models 7 and 8.Similar regressions for education, health and other social sectors were esti-
mated separately. The results are very similar to those when all variables arecombined. The income jump variable is signi�cant for all regressions of di¤erentdependent variables except when willing to pay for education is considered.Table 3a shows results of estimation for similar models using survey responses
from the Western European comparator countries only. The results for the will-ingness to pay for welfare programs in the comparator countries is somewhatsimilar to that for the transition economies. While country GNI per capita wasa very signi�cant predictor of attitudes toward redistribution in the transitioneconomies, it is not very important for survey respondents in the developedcountries. However, once again the income variable has similar estimated coef-�cients in both sets of regressions. Higher education (compared to parents) hasno impact on the preference for redistribution in transition countries; however,it is weakly signi�cant for the developed countries.
13

4.2.3 Preference for inequality as a work incentive
Finally, we analyze survey responses on preferences for income inequality as awork incentive. Question q316a asks respondents about their preference forincome distribution. This question is the closest form of the variable needed tounderstand POUM hypothesis. Respondents were asked to state their prefer-ence regarding the income distribution using a scale ranging 1 to 10 where oneindicates a desire for an equal income distribution and ten indicates a desire foran unequal income distribution in order to provide a work incentive.Our initial estimations using this dependent variable are reported in Table
4 where ordinary least squares (OLS) model estimates are reported in order tounderstand the determinants of stated preferences. In these models a positiveestimated coe¢ cient indicates a stronger preference for income inequality toensure work incentive while a negative coe¢ cient indicates a desire for moreincome equality. The POUM hypothesis predicts that people with lower thanmedian current income with a higher expected future income will prefer a moreunequal distribution. The reported results indicate that respondents on higherincome ladder rungs tend to prefer more inequality. The estimated coe¢ cientsfor the income di¤erence variable are positive and signi�cant in seven of theeight estimated models. These results indicate that respondents expecting theirincomes to rise over the next four years express a stronger preference for incomeinequality.In Model 5, the income jump variable is included to speci�cally test the
POUM hypothesis. The estimated coe¢ cient for that variable is positive andsigni�cant. That is, even though respondents are currently low on the incomeladder, their expectation of higher income in the future (above the mean on theincome ladder) is associated with a desire for less income redistribution. This�nding is exactly what the POUM hypothesis predicts. Hence, the regressionresults strongly support the POUM hypothesis.Other explanatory variables are also signi�cant across model speci�cations
in Table 4. Place of residence and country characteristics are also importantdeterminants of the POUM hypothesis. Urban and metropolitan residents pre-fer more income disparity than their rural counterparts. Respondents living incountries with higher per capita income express a preference for more equality.When comparing themselves to parents, respondents with higher educationalattainment or better overall condition indicate a preference for less redistribu-tion and more work incentive. They apparently believe that their own e¤ortsor work to improve their condition is reason to prefer that others do the same,rather than have a more redistributive system of government transfers.Table 4a shows results of estimation for similar models using survey responses
from the Western European comparator countries only. In the preference forredistribution as a work incentive equations for the developed comparator coun-tries, we observe that the state economy size (GNI per capita) is less important.Moreover, the location of the respondents (urban or metro) does not matter indetermining the preference for redistribution for the work incentive purpose.
14

4.2.4 Transformation function/mobility function
Benabou & Ok (2001) base the validity of the POUM hypothesis on a ratio-nal expectations approach. It may appear that under rational expectations it isnot possible for everyone to expect higher income in future and hence it is notsurprising to think that the POUM hypothesis is �awed intuitively. A mean-reverting steady-state equilibrium condition does not allow for increased incomefor all groups perpetually. Therefore, rational expectations are not compatiblewith everyone holding realistic views of their income prospects. However, Ben-abou and Ok showed that this is not necessarily the case. They demonstratedthat in the case of a concave transition function and idiosyncratic income shocksthe POUM hypothesis is valid even in a rational expectations framework. Theyshow that there exists a range of incomes below the mean where the individualdoes not favor redistribution if and only if her expected income tomorrow is anincreasing and concave function of today�s income. The more concave the tran-sition function, the lower the demand for redistribution. The concave transitionfunction is actually nothing more than the usual diminishing phenomenon ofthe production function or other similar term used in economics. And it alsoimplies more equal distribution of income in future since richer will have moreincome in future but they will experience diminishing returns.For the same reason, those who have income close to mean will experience
lower income in future if a progressive income tax is imposed for redistributionand so even individuals with incomes lower than mean will tend to reject highertaxes. In contrast to the concavity factor, idiosyncratic shocks also a¤ect theincome distribution. But, that reality does not a¤ect the taste for redistribution(since idiosyncratic shocks are stochastic, not deterministic), whereas concavitycan be assumed to be deterministic. Concavity implies a more equal distributionof future income, or a type of convergence, i.e. skewness reducing of the Lorenzcurve. But, idiosyncratic shocks still maintain some skewness in the incomedistribution. So, two opposite forces are at work to shape the long-run incomedistribution.Our current data do not allow us to test the idiosyncratic shocks, however,
the LITS II data permit us to test for concavity. To verify the concavity oftransition function we estimate a regression equation where expected futureincome is a function of current income and current income squared. We �nd thatthe transformation function is concave with the coe¢ cient for current incomepositive and that for the square of income negative (both have p-values lessthan one percent). Therefore, this data corroborates the POUM hypothesis.(See Table A1 in the appendix).
5 Summary and Conclusions
Our major research question focuses on transition economy respondents�opin-ions on income redistribution. We analyzed this issue in several ways. First,we modeled respondents�preferences for reducing the rich-poor income gap us-
15

ing both binary and ordered probit models. The results indicate that olderrespondents, females, and those with mortgages favor more redistribution. Re-spondents currently positioned higher on the ten-step income ladder (re�ectingdeciles) want less redistribution. Furthermore, those expecting to be positionedhigher on the income ladder in the future want less redistribution, consistentwith the POUM hypothesis. Respondents living in countries with higher Ginicoe¢ cients indicate a stronger preference for redistribution, although if they livein a metropolitan area they want less redistribution.When asked if they are willing to pay more for additional welfare program
bene�ts, older respondents are more likely to say no while respondents withhigher income are more likely to say yes. Urban respondents and those in coun-tries with higher Gini coe¢ cients are more likely to indicate greater willingnessto pay. But, those in countries with higher per capita income are less likely tobe willing to pay more.We also estimated models of respondents�preferences for inequality as a work
incentive, i.e. a desire for a less equal income distribution as an incentive forcitizens to work hard to get ahead. Those models indicate that older respondentswant less inequality as a work incentive. Income is an important determinant,however, with respondents on higher income ladder rungs expressing a desirefor more inequality as a work incentive. In addition, respondents expectingto be on a higher income ladder rung in the future want more inequality asa work incentive. Other factors also matter, with mortgage holders, urban ormetropolitan residents or those in countries with higher Gini coe¢ cients wantingmore inequality. But, respondents in countries with higher income per capitaexpress a weaker desire for inequality as a work incentive.We observe that for both the transition economies and the developed coun-
tries the income equality of the countries as measured by the Gini coe¢ cientseems to be relatively unimportant. Moreover, while the GNI per capita is a ma-jor factor in determining preferences for redistribution in transition economies,it is not signi�cant for the comparator countries.Based on the above pieces of evidence, it is clear that though individual level
characteristics and experience have some impact in determining redistributionpreferences, the POUM hypothesis seems to be a¢ rmed in a very substantialand robust manner. Interestingly though, while other explanatory factors havedi¤erent magnitudes or signs, the key variables pertinent to the POUM hy-pothesis are very similar across all speci�cations providing strong indications ofrobustness. Speci�cally, the empirical evidence strongly supports the POUMhypothesis for transition economies.
16

17

18

19

20
21

22

23
24

25

References
[1] Acemoglu, Daron, Suresh Maidu, Pascual Restrepo, and James A. Robin-son. 2015. "Democracy, Redistribution and Inequality." Chapter 21 in theHandbook of Income Distribution, Volume 2B, edited by Anthony Atkinsonand François Bourguignon. New York, NY: Elsevier.
[2] Ackerlo¤, G. 1982. "Labor Contracts as Partial Gift Exchange." QuarterlyJournal of Economics 97: 543-69.
[3] Agell, Jonas and Kjell Erik Lommerud. 1992. "Union Egalitarianism asIncome Insurance." Economica 59: 295-310.
[4] Alesina, A., La Ferrara, E., 2005. Preferences for redistribution in the landof opportunities. Journal of Public Economics 89: 897�931.
[5] Alesina, A. and P. Giuliano. 2011. Preferences for Redistribution. Chapter4 in J. Benhabib, M.O. Jackson, and A. Bisin, eds., Handbook of SocialEconomics, Volume 1A, North-Holland. pp. 93-132.
[6] Chiang, S.H. and S.C. Chiang. 1990. "General Human Capital as a SharedInvestment under Asymmetric Information." Canadian Journal of Eco-nomics 23: 175-88.
[7] Bénabou, R. and E. Ok. 2001. �Social Mobility and the Demand for Redis-tribution: The POUM Hypothesis.�The Quarterly Journal of Economics116(2):447-487.
[8] Buscha, F. 2012. Financial expectations and the �left�right�political valuescale: Testing for the POUM hypothesis. Economics Letters 115: 460�464.
26
[9] Checchi, D., Filippin, A., 2004. An experimental study of the POUM hy-pothesis. Research on Economic Inequality 11: 115�136.
[10] Couttinier, Mahtieu, and Marc Sangier. 2015. "Living in the Garden ofEden: Mineral Resources and Preferences for Redistribution." Journal ofComparative Economics 43(2):243-256.
[11] Deaton, A. 2008. �Income, Health, and Well-Being around the World: Ev-idence from the Gallup World Poll.� Journal of Economic Perspectives22(2):53-72.
[12] European Bank for Reconstruction and De-velopment. Retrieved May 29, 2014 fromhttp://www.ebrd.com/pages/research/economics/data/lits.shtml.
[13] Kuziemko, Ilyana, Michael I. Norton, Emmanuel Saez, and StefanieStatcheva. 2015. "How Elastic are Preferences for Redistribution? Ev-idence from Randomized Survey Experiments." American Economic Re-view 105(4):1478-1508.
[14] Loshkin, M. and R. Yemtsov. 2004. �Household Strategies for Coping withPoverty and Social Exclusion in Post-Crisis Russia.�Review of Develop-ment Economics 8(1):15-32.
[15] Meltzer, Allan M. and Scott F. Richard. 1981. "A Rational Theory of theSize of Government." Journal of Political Economy 89(5):914-927.
[16] Piketty, Thomas. 1995. "Social Mobility and Redistributive Politics."Quar-terly Journal of Economics 60(3):551-584.
[17] Varian, H.R. 1980. "Redistributive Taxation as Social Insurance." Journalof Public Economics14: 49-68.
[18] World Bank. 2011. The Jobs Crisis: Household and Government Responsesto the Great Recession in Eastern Europe and Central Asia. Washington,DC: The International Bank for Reconstruction and Development.
[19] Zaidi, S., A. Alam, P. Mitra, and R. Sundaram. 2009. �Satisfaction withLife and Service Delivery in Eastern Europe and the Former Soviet Union:Some Insights from the 2006 Life in Transition Survey.� World Bank Work-ing paper No. 162.
27

6 Appendix
28


