Predicting Preference Reversals via Gaussian Process Uncertainty Aversion
Preference Uncertainty Preference Learning and Paired Comparison Experiments David C Kingsley and Thomas C Brown
ABSTRACT Results from paired comparison experiments suggest that as respondents progress through a sequence of binary choices they become more consistent apparently fine-tuning their prefershyences Consistency may be indicated by the variance of the estimated valuation distribution measured by the error term in the random utility model A significant reduction in the variance is shown to be consistent with a model of preference uncertainty allowing for preference learning Respondents beshycome more adept at discriminating among items as they gain experience considering and comparing them suggesting that methods allowing for such experience may obtain more well founded values (JEL C25 D83)
I INTRODUCTION
A fundamental assumption of neoclassishycal microeconomic theory is that preferencshyes are transitive This intuitive assumption implies that among a series of binary choices preferences cannot cycle For exshyample if a consumer prefers A to Band B to C then it follows that he or she also prefers A to C Paired comparison experishyments involve multiple binary choices beshytween items in the choice set allowing researchers to test the transitivity axiom
Past research shows that for all but very small choice sets respondents paired choices are rarely fully transitive but that as respondents progress through a random sequence of paired choices they beco~e more consistent apparently fine-tunmg their preferences (Brown et al 2008) This fine-tuning implies imprecision of prefershyence or in other words preference uncershytainty Preference uncertainty was described by Thurstone (1927) as reflecting an under-
Land Economicsmiddot August 2010 bull 86 (3) 530-544 ISSN 0023-7639 E-ISSN 1543-8325 copy 2010 bv the Board of Regents of the University of Wisconsin System
shy
lying valuation distribution from which an individual randomly draws a value at a given instant Allowing for preference uncertainty the respondent becomes a potential source of error within choice models Respondent error and the existence of preference uncertainty is an increasingly important topic being investigated within choice experiments and valuation studies Indeed an emergent theme within nonmarshyket valuation is to allow respondents to express levels of uncertainty (Alberini Boyle and Welsh 2003 Champ et al 1997 Evans Flores and Boyle 2003 Li and Mattsson 1995 Welsh and Poe 1998)
Preference uncertainty implies that the design of the experiment or valuation survey may affect respondent choice Reshysearchers have examined the effect of experimental design using the error varishyance of the random utility model as a measure of preference uncertainty Increasshying the complexity of the choice set was found to increase the variance of the error term in a heteroskedastic logit model (DeShazo and Fermo 2002) Deshazo and Fermo hypothesize that the variance of choice models and choice consistency are inversely related Similarly it has been shown that the difficulty of the choice referred to as task demand has a nonlinear effect on the error term Both very easy and very difficult choices were more random
The authors are respectively assistant professor Department of Economics and Management Westfield State College Westfield Massachusetts and research economist Rocky Mountain Research Station Fort Collins Colorado This paper benefited from discussions with Patricia Champ Nick Flores Jason Shogren and Donald Waldman as well as conference and seminar participants at the AERE sessions at the ASSA 2006 annual meetings University of Colorado at Boulder the Environmental Protection Agency and Stephen F Austin State University All errors remain our own
531
i - 10
~ 86(3) Kingsley and Brown Preference Learning
I
i (Swait and Adamowicz 1996) These papers is also not inconsistent with the discovered lor suggest preference uncertainty but do not preference hypothesis (Plott 1996) whichl address preference learning maintains that stable underlying preferencshy
I t This step was taken in two studies that
I looked at the effect that repeated choices had on the mean and variance of elicited preferences (Holmes and Boyle 2005 Savshy
I age and Waldman 2008) A reduction in the I
I I
error variance through the choice experishyment implies preference learning while an increase implies respondent fatigue or l boredom Results from Savage and Waldshy
l man (2008) were mixed in their web sample fatigue was supported but in their mail l sample the error was constant Holmes and
l Boyle (2005) found that error variance did t decline over a sequence of choices implying
-l
that respondents were better able to disshy criminate between choices made later in the I experiment
I
t In this paper we show that the increasing
choice consistency observed by Brown et al it
(2008) is accompanied by a significant ~ reduction in the error variance of a random ~ utility model fit to the paired comparison I data We interpret this finding as preference
learning This result implies that the data l
become less noisy over choice occasions and l indicates that respondents are better able to t discriminate between items in later choices ~ Further we find as expected that greater i utility difference between items significantly
reduces the probability of an inconsistent choice and that inconsistent choices are lo likely to be switched when retested at the
end of the experiment ~ Taken together these findings suggest
i that even hypothetical market experience
provided through simple paired comparishyr sons may affect respondents choices and
~ that nonmarket valuation techniques that rely on only one or a few responses may not
~ be obtaining well-founded values This - finding is in line with the recent report by bull Bateman et al (2008) that respondents to a
dichotomous-choice contingent valuationi
l survey require repetition and experience with the choice task in order to express preferences consistent with economic theoshyry As described in more detail in the
J Discussion section (Section V) our finding
es are uncovered through experience with a choice task
II PREFERENCE UNCERTAINTY AND LEARNING
Random utility models provide a general framework within which researchers invesshytigate individual choice behavior (McFadshyden 2001) Consistent with economic theoshyry these models assume that individuals always choose the alternative yielding the highest level of utility (Marschak 1959) Utility is described as a random variable in order to reflect the researchers observashytional deficiencies not individuals uncershytainty about their own preferences (BenshyAkiva and Lerman 1985)
The model that Marschak (1959) proshyposed was an interpretation of what was probably the first stochastic model of choice introduced by L L Thurstone in 1927 under the name of the law of comparative judgment Unlike the modern random utility model in Thurstones modshyel utility is represented by a distribution about a fixed point of central tendency (Thurstone 1927) This representation of utility has important implications concernshying the source of error in choice models and represents the fundamental difference beshytween these models (Brown and Peterson 2009 Flores 2003) Thurstones model is now referred to as a constant utility model (Ben-Akiva and Lerman 1985) The conshystant utility model allows individuals to sample their utility from a distribution choices are made based on the realization of utility on a particular choice occasion This uncertainty may cause observed preferences to appear inconsistent (ie violate transishytivity)
The law of comparative judgment was developed to explain common results from psychometric choice experiments involving binary choices (Bock and Jones 1968 Brown and Peterson 2003 Torgerson 1958) For Thurstone a choice between
532 Land Economics August 2010
two alternatives involved draws from two underlying preference or judgment distrishybutions (McFadden 2001) Subjects might for example be presented with numerous pairs of objects and asked for each pair to say which object is heavier The main finding which dates back at least to Fechners work (1860) was not surprisingshyly that the closer the items were in weight the more common incorrect selections became
Allowing for researcher error is common practice in economic models Although allowing for the existence of uncertain preferences and sources of error beyond the researcher is less common it has not been ignored For example Bockstael and Strand (1987) examined the effect the source of error has on the estimation of economic values in a framework they called random preferences More recent reshysearch suggests that each respondent has an implicit valuation distribution (Wang 1997) For Wang respondents answer dichotomous choice questions as if their values reflect distributions rather than fixed points Similarly Li and Mattsson (1995) assume that respondents have incomplete knowledge of their preferences and thus can give the wrong answer to a dichotomous choice question They find that respondents are a significant source of error and so exacerbate the standard deviation of the estimated valuation distribution
This paper assumes that both sources of error researcher and respondent are presshyent in individual choice The term prefershyence uncertainty reflects respondent error which translates to draws from an underlyshying valuation distribution unknown to both the respondent and the researcher These random draws may contribute to inconsisshytency and increase the noise measured in the data If respondent uncertainty could be reduced perhaps through market experishyence or experimental design choice consisshytency would increase and the data would become less noisy This process will be referred to as preference learning and will be evident through a reduction in the standard deviation of the estimated valuashy
tion distribution measured by the error variance in the random utility model
Dichotomous Choice Contingent Valuation
In a standard dichotomous choice conshytingent valuation study respondents are asked to respond yes or no to a question such as Would you be willing to pay ti dollars to obtain environmental improvement k The individuals valuashytion function is defined as follows
[1]
where Uik is individual is unobserved utility of item k the deterministic component of value is represented by iYk and elk represents the stochastic component Note that we assume a homogeneous set of individuals with respect to Jk It is common to express rtk as linear in parameters xi[3 where Xi is a set of variables describing the characterisshytics of either the individual or the item The respondent is assumed to choose yes whenever Uik ~ t i Therefore
[2]
where P indicates probability Allowing the stochastic error term Sih to be normally distributed with mean zero and constant variance 0 we have the following expresshysions
[3]
and
P(no) I-P(yes) [4]
where ltD is the standard normal cumulative distribution Then 0 represents the stanshydard deviation of the estimated valuation distribution which has mean Jk
It is worth noting that within dichotoshymous choice contingent valuation settings the assumption of a symmetric valuation distribution means that the scale of the model has little consequence such that preference uncertainty leads to no bias in
86(3j Kingsley and Brown Preference Learning 533
the estimated mean or median The imporshytance of recognizing preference uncertainty and preference learning becomes evident within choice experiments where responshydents make several choices between items
gt bullbull Common examples of such choice experishyi ments include attribute-based methods and
paired comparison experiments to
t Paired Comparison Experiments
L Consider the choice between two items FIGURE 1 labeled rand c The utilities of the items to A CO]SISTElrI CHOICE individual i are distributed as follows
instantaneous value of item c Uie Thus Uir=cxr+eir [5] Figure 1 depicts a consistent choice because
the choice based on these instantaneous and values is consistent with the individuals
l [6] underlying preferences represented by the
expected values As depicted in Figure 2 these two density functions allow for anI Under the assumption that elk is a mean inconsistent choice wherein Utegt Ulr despitezero random variable distributed iid r being preferred in expectationnormal the choice between items rand c
can be written probabilistically where Prc is The expression for Prc provides two intuitive results First for a given standard the probability that item r is chosen over deviation (Je the greater the utility differshyitem c ence arc a r a the more likely the
Prc = P(Uir gt UI) = P(CXr +elr gt CXc +pound11) choice will be consistent (item r being [7] chosen over item c) and conversely the
= P(eie -Sir lt tJ r - CXe) less likely an inconsistent choice becomes 1 or d$(~)
[lO]t [8] dcxr1
Second for a given utility difference lImand the narrower the distribution (the smaller is [9]
where Vi(Jc is the standard deviation of eic er
Consider the density functions of items r and c depicted in Figures 1 and 2 which represent the underlying valuation distribushytion assumed to exist for each individual In expectation item r is preferred to item c since lI r gt lIcbull But for a given choice individuals act on their instantaneous values not their expected values which are unshyknown Figure 1 shows the instantaneous value of item r Uir above (to the right of) the
jshy
FIGURE 2 AN INCONSISTENT CHOICE
-
534 Land Economics August 2010
TABLE 1 lTE4S INCLUDED BY PETERSON AND BROWN
I A meal at a restaurant of the respondents choice not to exceed $15 (Meal) 2 A nontransferable $200 gift certificate (0 a clothing store of the respondents choice (Clothes) 3 Two tickets and transportation to a cultural or sporting event in Denver estimated at $75 (Tickets and
transportation) 4 A nontransferable $500 certificate good for travel on any airline (Airline tickets) 5 A 2000-acre wildlife refuge in the mountains west of Fort Collins Colorado purchased by the university (Wildlife
refuge) 6 An agreement among Colorado State University local business and government to improve the water and air
quality in Fort Collins (Clean air arrangement) 7 An annual no-cost on-campus weekend music festival open to all students (Spring festival) 8 A no-fee service providing video tapes of all class lectures in the university library (Video service) 9 An expansion to the parking garage system on campus so that parking is always easy to find and convenient (Parking
10 area in the student center
(je) the more likely a consistent choice becomes and the wider the distribution the more likely an inconsistent choice becomes
lt0 [11]
In psychometric experiments inconsisshytent choices are easily identified because the expected value of each item is objective (eg the weight of an object) However in economic valuation studies the expected value must be estimated and inconsistency particularly within an individual is not easily identified Peterson and Brown (1998) developed a simple technique (discussed in the next section) used with paired comparshyison experiments that identifies a responshydents likely set of inconsistent choices
III PAIRED COMPARISON METHODOLOGY
The paired comparison method has successfully been used in nonmarket valuashytion studies (Champ and Loomis 1998 Kingsley 2006 Loomis et aL 1998 Peterson and Brown 1998)) In this paper we
I This paper is primarily concerned with what the measure of the error term of the model of individual choice reveals about the decision making process and not with the estimated values of the items assessed All data related to the estimated means are available upon request
reanalyze paired comparison data collected by Peterson and Brown (1998) In the Peterson and Brown experiment all items were economic gains Respondents were instructed to choose the item in each pair they would prefer if they could have either at no cost The paired choices were drawn from a set of four private goods and six locally relevant public goods (Table 1) along with 11 monetary amounts Items were not paired with themselves and dollar amounts were not compared (it was asshysumed that larger dollar amounts were preferred) Each respondent made 155 choices 45 between items and 110 between an item and a dollar amount For presenshytation pairs were randomized across reshyspondent and choice occasion The pairs were presented on a personal computer and the time respondents took to enter each choice was recorded Three hundred and thirty students from Colorado State Unishyversity participated in the study Four were dropped because of missing data leaving a total of 326 respondents providing 50530 individual observations In addition the experiment retested 10 consistent and all inconsistent choices within an individual after the initial choices were made The respondents had not been informed that some choices would be repeated and there was no break in the presentation of pairs to
2 Dollar amounts were 25 50 75 100 200 300 400 500 600 and 700
---- --~--
86(3) Kingsley and Brown Preference Learning 535
indicate that a new portion of the experishyment had begun
Given a set of t items the paired comparison method presents them indepenshydently in pairs as (tI2)(t 1) discrete binary choices These choices yield a preference score for each item which is the number of times the respondent prefers that item to other items in the set A respondents vector of preference scores describes the individushyals preference order among the items in the choice set with larger integers indicating more-preferred items In the case of a 21shyitem choice set an individual preference score vector with no circular triads contains all 21 integers from 0 through 20 Circular triads (ie choices that imply A gt B gt C gt A) cause some integers to appear more than once in the preference score vector while others disappear
For a given respondent a pairs prefershyence score difference (PSD) is simply the absolute value of the difference between the preference scores of the two items of the pair This integer which can range from 0 to 20 for a 21-item choice set indicates on an ordinal scale the difference in value assigned to the two items
The number of circular triads in each individuals set of binary choices can be calculated directly from the preference scores The number of items in the set determines the maximum possible number of circular triads The individual responshydents coefficient of consistency is calculatshyed by subtracting the observed number of circular triads from the maximum number possible and dividing by the maximum3
The coefficient varies from one indicating no circular triads in a persons choices to zero indicating the maximum possible number of circular triads
3 The maximum possible number ofcircular triads m is (tl24)(P - I) when t is an odd number and (24)(t2 4) when t is even where I is the number of items in the set Letting ai equal the preference score of the ilh item and b equal the average preference score in other words (t - 1)12 the number of circular triads is (David 1988) c=(t24) (t2 -1)_12L(a-bf The coefficient of consistency (Kendall and Smith 1940) is then defined as 1 - elm
When a circular triad occurs it is not unambiguous which choice is the cause of the circularity This is easily seen by considering a choice set of three items whose three paired comparisons produce the following circular triad A gt B gt Cgt A Reversing anyone of the three binary choices removes the circularity of prefershyence selection of one to label as inconsisshytent is arbitrary However with more items in the choice set selection of inconshysistent choices though still imperfect can be quite accurate For each respondent we selected as inconsistent any choice that was contrarY to the order of the items in the respondents preference score vector with the condition that the order of items with identical preference scores was necessarily arbitrary Simulations show that the accushyracy of this procedure in correctly identifyshying inconsistent choices increases rapidly as the PSD increases In simulations with a set of 21 items and assuming nOlmal dispersion distributions the accuracy of the procedure rises quickly from 50 at a PSD of 0 to nearly 100 at a PSD of 54
IV RESULTS AND ANALYSIS
In this section we first report on the likelihood of an inconsistent choice and the likelihood of a preference reversal This analysis provides support for the notion of preference learning We then take a closer look at preference uncertainty and prefershyence learning fitting a heteroskedastic probit model to the paired comparison data
Probability ofan Inconsistent Choice
The proportion of choices identified as inconsistent using the decision rule deshyscribed above falls quickly and then levels off as respondents progress through the experiment (Figure 3) Nearly 14 of reshyspondents first choices are identified as inconsistent but by the twentieth choice the
4 A thorough explanation of the procedure for specifying inconsistent choices is found in Chapter 4 of Brown and Petersons book (2009) available at www treesearchfsfed uspubs31863
bullbull bull bull bull bull bullbullbull bull
536 Land Economics August 2010
016 c 014S en 012 c 0 u 010 c c 008 0
0061 0 c 004 2 D 002
000
bull bull bull ~ ~ ~ ~ ~ bull bullbullbullbullbull4k bull ~ ~bullbull ~ ~ middotItmiddotmiddotmiddot middot ~ bull ~
1 21 41 61 81 101 121 141
Choice Occasion
FIGURE 3 PROPORTION OF CHOICES IDENTIFIED AS INCONSISTENT
proportion has dropped to around 5 to 6 Because the order in which the pairs were presented was random for each respondent this result is unrelated to presentation order and thus seems driven by respondents experience comparing the items
A probit model is estimated to predict the probability of a choice being identified as inconsistent The dependent variable Yij equals 1 if the choice is identified as inconsistent and 0 otherwise where i denotes the individual and j denotes the choice occasion Exogenous variables inshyclude Choice occasion In(Choice occasion) PSD a public good dummy and the amount of time in seconds required to make the choice Demographic variables included are Gender Age and Education
The variable Choice occasion represents the order in which a given respondent encountered the pairs of items and made a choice given Figure 3 the probability of an inconsistent choice is expected to decrease over choice occasion In(Choice occasion) captures the decreasing and leveling off relationship between choice inconsistency and choice occasion depicted in Figure 3 PSD is used as an approximate measure of the utility difference the expectation being that respondents are less likely to commit
an inconsistent choice the greater is this difference 5 The public good dummy represhysents any choice involving a public good (the public good may be paired with another public good a private good or a dollar amount) Respondents are assumed to face greater uncertainty when the choice involves a public good as opposed to choices involving only private goods or a private good and a monetary amount because they lack experience making public good choices Greater uncertainty is expected to lead to greater choice inconsisshytency Similarly the amount of time reshyquired to make the choice reflects the difficulty of the choice and is expected to be positively related to choice inconsistency Therefore
[12]
and
5 PSD should clearly be related to the probability of an inconsistent choice It is included in the model to verify this expectation Its inclusion raises the question of endogeneity With this in mind we ran several other probit models that systematically excluded individual independent variables in order to observe whether results were sensitive to inclusion of PSD or any of the other independent variables Results remained consistent and the coefficient on PSD varied very little
537
P(Vij 0) ltD(xij3) [13]
All 50530 choices are pooled over individuals i and choice occasions j so the likelihood function becomes
n J yLlvij(3) IIIIltD(x3Yil [I-ltD(x3)]I- [14]
i j
Results shown in Table 2 support the intuition of the modeL Note that only marginal effects are reported and that Columns (1) and (2) present models that treat each observation as independent while Columns (3) and (4) adjust the standard errors to account for the repeated choices made within individuaL As expectshyed controlling for repeated responses per individual raises the standard errors howshyever the marginal effects remain significant A negative and significant PSD indicates as predicted in the conceptual model that inconsistency is less likely the greater the utility difference between the items Addishytionally choices including a public good are more likely to be inconsistent perhaps suggesting that there is greater uncertainty and thus a wider valuation distribution for these goods Choices that require more time to make are also more likely to be inconsistent and older students tend to be more consistent
Importantly Choice occasion (Columns and 3) is negative and significant
suggesting that an inconsistent choice beshycomes less likely as respondents progress through the experiment When Choice occasion is modeled in log form (Columns 2 and 4) Choice occasion is also significant implying that the probability of an inconshysistent choice decreases quickly and levels off The Akaike information criterion (AIC) statistic reported III Table 2 is a measure of fit as is shown the log form provides a substantially lower AIC and therefore provides a better fit to the data Figure 46 illustrates the two functional
6 Figure 4 was created using the estimated coefficients from Table 2 Columns (3) and (4) All variables except dummy variables are set to their PSD 693 Age 198 School = 132 Time Gender 0 (Female) and Public = O
86(3) Kingsley and Brown Preference Learning
538 Land Economics August 2010
~ 002 0 cu
0 001 e Cshy O
1 21 41 61 81 101 121 141 Choice Occasion
FIGURE 4 SPECIFICATION EFFECTS OgtJ THE PROBABILITY OF AN INCOgtJSISTENT CHOICE
C) () 0070 c U 006 c C) It) 005 iii c 0040 ()
5 003 0
II(
forms based on the data in Columns (3) and (4)
Probability ofa Preference Reversal
The experiment retested 10 randomly selected consistent choices and all inconsisshytent choices made by an individual after the initial 155 choices were made The data show substantial differences in the reversal rates of originally consistent as opposed to originally inconsistent choices Of the 3260 consistent choices retested 289 or 89 were reversed whereas 2250 of 3679 (612) inconsistent choices were reversed (Table 3) This indicates that respondents were not only striving for consistency with their previous choices but also expressing their preferences
The data are further broken out in Table 3 into the types of choices made A choice may be between two public goods two private goods a public and private good a public good and a dollar amount or a private good and a dollar amount As is shown there are only slight differences among the types of choices in the rate of preference reversal indicating that type of choice did not playa large role in preference reversals
A probit model was used to test for the significance of factors hypothesized to affect the probability of a preference reversal As noted above two distinct sets of data were retested the set of originally inconsistent choices and a random selection of 10 originally consistent choices For both sets of choices the dependent variable Yu equals I if the choice was reversed and 0 otherwise Six exogenous variables are included PSD
TABLE 3 CHOICE SWITCHIgtJG
Number Number Proportion Type of Choice Retested Switched Switched
Identified Inconsistent Choices Public vs public 366 214 058 Public vs money 1493 970 065 Private vs private 153 95 062 Private vs money 921 518 056 Public vs private 746 453 061 Total 3679 2250 061
Identified Consistent Choices
Public vs public 257 26 010 Public vs money 1307 121 009 Priva te vs priva te 157 18 011 Private vs money 1056 82 008 Public vs private 483 42 009 Total 3260 289 009
539 86(3) Kingsley and Brown Preference Learning
TABLE 4 PROBABILITY OF A PREFERENCE REVERSAL
Inconsistent Consistent
Choke oecasion -000194 (0000179) -000194 (0000202) -0000078 (00000728) -0000078 (00000738) PSD 00858 (000473) 00858 (000521) -00162 (0000961) -00162 (000116) Public 00638 (00185) 00638 (00177) 00141 (000644) 00141 (000753) Age 000207 (000357) 000207 (000352) -000181 (000151) -000181 (000148) Sex 00211 (00169) 00211 (00174) -0000396 (000662) -0000396 (00082) School -00000226 (000639) -00000226 (000614) 000539 (0000272) 000539 (000275)
Log likelihood -2178 -2178 -806 -806 AIC 4368 4368 1624 1624 N 3679 3260
Note Dependent variable Yij equals I if the original choice was reversed Marginal effects reported Standard errors in parentheses Columns (I) and (3) contain models that treat each observation as independent Columns (2) and (4) adjust the standard errors for clustering by individual AIC Akaike information criterion PSD preference score difference
bullbull Coefficient is significant at the p lt 005 level
the public good dummy the choice occashysion when the original choice was made and the three demographic variables
The results are presented in Table 4 Columns (1) and (2) investigate the probshyability of reversing a choice that was originally identified as inconsistent whereshyas Columns (3) and (4) investigate the probability of reversing a choice that was originally identified as consistent Columns (2) and (4) adjust the error terms to account for repeated observations within individual As is shown accounting for repeated observations has little impact on the marshyginal effects Results suggest that the greater the PSD between the items the more (less) likely an originally inconsistent (consistent) choice is reversed Choices involving a public good are more likely to be reversed in both the inconsistent and consistent subsets Choice occasion has a significant and negative effect on the probability of reversshying an originally inconsistent choice showshying that more recent inconsistent choices are less likely to be reversed However Choice occasion has no significant effect on reversshying an originally consistent choice
Preference Learning
This paper defines preference learning as a significant reduction in the error variance of the random utility model that is a
significant narrowing of the estimated valushyation distribution7 The valuation function for this analysis is as follows
[i5]
Again the index i denotes the individual and j denotes the choice occasion Note that the data are set up in rows and columns as such the item index will be k = r c for row or column The row contains the 10 items and the column contains the 10 items along with the 11 monetary amounts As before the model assumes that all respondents are identical (that they have the same valuation on each Xk) The error term tijk includes an alternative specific error constant and is normally distributed N (OltJijA) The probashybility contribution to the likelihood funcshytion is denoted Prc (Per) for the probability that the row (column) item is chosen over the column (row) item
First consider the choice between an item and a dollar amount Each bid amount appears only in the column and is denoted by lijc The probability that the item is
7 As noted previously the primary focus of this paper is the error process over choice oecasion and the ability of respondents to discriminate between choices as they progress through the paired comparison experiment Therefore we limit our presentation here to the error process
540 Land Economics August 2010
preferred to the dollar amount is
[16]
and thus
[17]
Next consider the choice between two items
and thus
[19]
where (0 +012 is the standard deviation of 6e -6 The dependent variable Yijk
equals 1 if the column item is chosen and deg otherwise The likelihood function is written as follows
tJ J
L(Yijk CtkO) = n n P Viigt P~t [20] I I
In order to test for preference learning a heteroskedastic pro bit model is introduced that allows the standard deviation of the error term to adjust over Choice occasion as follows
[21 ]
Two functional forms are considered linear Ookj Ak + f3(j) and nonlinear Ofki = )k + 13(1 Ii)middot Furthermore this reduced form specification sets the standard deviation to be a function of the three available demoshygraphic variables It has been shown that one can identify the error variance of choice models by exploiting the variation in monetary thresholds (Cameron 1988 Camshyeron and James 1987) In particular using the variation across dollar amounts in this paired comparison experiment we are able to identify the standard deviation within the model Furthermore using choice occasion we are able to identify changes to this error structure over the course of the experiment
TABLE 5 HETEROSKEDASTTC PROBIT MODEL
(2)
1 - Video service 356 (279) 325 (278) A Parking capacity 334 (280) 299 (275) 1 Meal 264 (278) 233 (276) i - Clothes 165 (248) 133 (246) A - Wildlife refuge 464 (318)middot 432 (316) 1 Spring festival 335 (278) 302 (276) i Tickets and 199 (256) 168 (254)
transportation ) - Eating area 362 (296) 325 (294) A Airline tickets 231 (255) 199 (254) A Clean arrangement 427 (299) 397 (298) Gender 1383 (484) 133 (479)middot Age 495 (138) 491 (136) Edncation -591 (239)-588 (236) f3 -026 (005) 34899 (6066)middot Log likelihood - 26029 - 26002 AIC 52106 52052 N
Note Standard errors in parentheses The model for Column (1) is (J =Ak +JU) The model for Column (2) is (J =Jx + J(lj) AIC Akaike information criterion
Coefficient is significant at the p lt 005 leveL
This specification using the standard devishyation as a function ofchoice occasion made it impossible to cluster the error terms by individuals as the full model was unidentishyfied However previous models show little impact of clustering and we do not believe this to be a serious problem
Interpretation of these parameters is as follows Researcher error as well as any error generated by the respondent unrelated to choice occasion will be picked up by )k
This term can be interpreted as an alternashytive specific error constant that is a measure of the error introduced into the model by each item In both forms a significant 3 represents a significant change in the scale over choice occasion (ie a change in respondent error) A reduction in the scale is interpreted as preference learning and an increase is interpreted as fatigue or boreshydom The hypothesis to be tested is Ho 13 = 0 implying that choice occasion has no effect on the scale of the model
Results for the parameterized error strucshyture are shown in Table 5 The important result is the significance of 13 in both the linear (Column 1) and nonlinear (Column 2) forms Both models suggest that the scale
86(3) Kingsley and Brown Preference Learning 541
of the choice model decreases as responshydents progress through a sequence of randomly ordered choices This implies that the data become less noisy as the responshydent continues through the experiment In order to believe that this reduction stems from researcher error it would need to be the case that some unobservable charactershyistics of the choices became less significant to the respondent as the experiment proshygressed
As shown in Figure 3 the proportion of choices identified as inconsistent drops quickly and levels off suggesting that the nonlinear form is the more appropnate representation of the preferen~e l~arning described in these data ThIS IS also supported by the lower Ale statistic reported in Table 5 for the no~IInear model This evidence supports the Inverse relationship between choice consistency and the scale of random utility choice models (DeShazo and Fermo 2002 Savage and Waldman 2008)
The above analysis implies that the error change parameter [3 is equivalent across items In order to relax this assumption we ran a model allowing each item to have a [3 Table 6 presents the [3 coefficients to simplify the presentation the 10 A rows are not shown The [3 tenns for 6 ofthe 10 items remain significant for the 4 others the [3 is found to be insignificant It is not entirely surprising that across a variety of items some may benefit from learning while others may not Why some items are susceptible to learning while thers are not is unknown and may be expenment specIfic However it is important to note that the results are not driven to be a single item or even a subset of items (Le only the public goods or only the private goods) and that the learning indicated in Table 5 is supportshyed across a variety of items
v CONCLUSION AND DISCUSSION
This paper combines common notions of preference uncertainty and preference learnshying found in the literature Preference uncershytainty implies that an individuals choice on a
TABLE 6 HETEROSKEDASTIC PROBIT MODEL INDIVIDUAL
BETA TERMS
fJ Video service 3064 (6535) fJ Parking capacity -184 (9760) fJ - Meal 1286 (13050) fJ - Clothes 2851 (1064) fJ Wildlife refuge 3205 (24330) fJ Spring festival 7939 (3541) fJ - Tickets and transportation 7302 (2509) fJ - Eating area 2962 (1478) fJ Airline tickets 34290469) fJ Clean arrangement 2372 (231 70) Gender 1259 (478) Age 489 (136) Edueation -575 (236) Log likelihood -25983 AlC 52031 N
Nole Based on the model a = Ak +Pk(l) Standard errors in parentheses Ale Akaike information criterion
bullbull Coefficient is significant at the p lt 005 level
particular occasion represents a draw from an underlying valuation distribution Thereshyfore the respondent is a potential source of error within choice models The existence of preference uncertainty allows for the possishybility that market experience or experimental design may affect respondent choice A change in preference uncertainty depending on the direction of the change can be interpreted as preference learning or responshydent fatigue
Our investigation of changes in the error process over choice occasion points to some process of preference learning It was found that the probability of an inconsistent choice decreases with choice occasion and utility difference between items of a pair It was also found that the greater the utility difference between the items the more (less) likely an originally inconsistent (consistent) choice is reversed upon retrial Both of these results are implied by the conceptual model presented
Further using a heteroskedastic probit model it is shown that as respondents progress through the experiment the scale of the random utility model decreases significantly This result implies that the
542 Land Economics August 2010
data become less noisy over choice occasion and indicates that the respondents are better able to discriminate between items in later choices This result supports the ability of individuals to learn their preferences as they progress through a choice experiment in a way consistent with the discovered prefershyence hypothesis (Plott 1996) This hypothesis proposes that stable underlying preferences are discovered or learned through experience with a choice task that provides relevant feedback and incentives (see also Braga and Starmer 2005) Respondents in our paired comparison sessions can be said to be learning their underlying preferences in the sense that they refined or fine-tuned them Further we observed no indication that the underlying preferences were not stable since as reported by Brown et al (2008) there was no change in mean preference scores over choice occasions It is notable that this refinement occurred even though the paired comparison task provides no feedback or incentives that would enshycourage respondents to focus more carefully or otherwise alter their behavior This suggests that mere experience in choosing between pairs of a set of items is sufficient for preference learning to occur9
The result that respondents are able to learn their preferences as they progress through a choice experiment raises imporshy
--___ _--shy
8 An alternative to the diseovered preference hypothshyesis is the constructed preference hypothesis (Gregory Lichtenstein and Slovic 1993) which posits that prefershyences are quite labile and context dependent and that they are constructed during and possibly influenced by the choice task at hand We presented the paired choices in only one context and thus did not test the extent to which respondents choices were subject to contextual cues We do note however that the paired comparison task is relatively free of contextual cues in that the choices are binary and randomly ordered and the respondents do not interact Further in our implementation of the task payment-and all the concerns that arise with paymentshywere not an issue The method of paired comparisons thus offers a credible way to assess underlying preferences without being overly concerned about the influence of unwanted contextual cues
9 This finding is also not inconsistent with that of List (20032004) although the kind offield market experience he examined is quite different from the experience gained during a paired comparison exercise
tant questions for the economic valuation literature Notably one must consider the efficiency if not the appropriateness of single-shot surveys that assume well-foundshyed preferences exist a priori Furthermore the question of whether elicited preferences may be altered through this process is of central concern to the literature and is deserving of further investigation
References
Alberini Anna Kevin J Boyle and Michael P Welsh 2003 Analysis of Contingent Valuashytion Data with Multiple Bids and Response Options Allowing Respondents to Express Uncertainty Journal of Environmental Ecoshynomics and Management 45 (I) 40-62
Bateman Ian J Diane Burgess W George Hutchinson and David 1 Matthews 2008 Learning Design Contingent Valuation NOAA Guidelines Preference Learning and Coherent Arbitrariness Journal of En vironshymental Economics alld Management 55 (2) 127-41
Ben-Akiva Moshe and Steven R Lerman 1985 Discrete Choice Analysis Theory and Applicashytioll to Travel Demand Cambridge MA MIT Press
Bock R bull and Lyle V Jones 1968 The Measureshyment and Prediction of Judgment and Gfwice San Francisco Holden-Day
Bockstael Nancy E and lver E Strand Jr 1987 The Effect of Common Sources of Regression Error on Benefit Estimates Land Economics 63 (I) 1120
Braga Jacinto and Chris Starmer 2005 Prefershyence Anomalies Preference Elicitation and the Discovered Preference Hypothesis Environshymental and Resource Economics 32 () 55-89
Brown Thomas c David Kingsley George L Peterson Nick Flores Andrea Clarke and Andrej Birjulin 2008 Reliability of Individual Valuations of Public and Private Goods Response Time Preference Learning and Choice Consistency Journal of Public Ecoshynomics 92 (7) 1595-1606
Brown Thomas c and George L Peterson 2003 MUltiple Good Valuation In A Primer on Nonmarket Valuation ed Patricia A Champ Kevin Boyle and Thomas C Brown Norwell MA Kluwer Academic Publishers
2009 An Enquiry into the Method ofPaired Comparison Reliability Scaling and Thur-
III(
86(3) Kingsley and Brown Preference Learning 543
stones Law of Comparative Judgment General Technical Report RMRS-GTR-216WWW Fort Collins CO Rocky Mountain Research Station
Cameron Trudy Ann 1988 A New Paradigm for Valuing Non-Market Goods Using Referenshydum Data Maximum Likelihood Estimation by Censored Logistic Regression Journal of Environmental Economics and Management 15 (3) 355~79
Cameron Trudy Ann and Michelle D James 1987 Efficient Estimation Methods for Closed-Ended Contingent Valuation Surshyveys Review of Economics and Statistics 69 (2) 269-76
Champ Patricia A Richard C Bishop Thomas C Brown and Daniel W McCollum 1997 Using Donation Mechanisms to Value Nonshyuse Benefits from Public Goods Journal of Environmental Economics and A1anagement 33151-62
Champ Patricia A and John B Loomis 1998 WTA Estimates Using the Method of Paired Comparison Tests of Robustness Environshymental and Resource Economics 12 (3) 375-86
David Herbert A 1988 The lvlethod of Paired Comparisons 2nd ed New York Oxford University Press
DeShazo J R and German Fermo 2002 Designing Choice Sets for Stated Preference Methods The Effects of Complexity on Choice Consistency Journal of Environmental Ecoshynomics and lvlanagement 44 (I) 123-43
Evans Mary F Nicholas E Flores and Kevin J Boyle 2003 Multiple-Bounded Uncertainty Choice Data as Probabilistic Intentions Land Economics 79 (4) 549--60
Fechner G T 1860 Elemente Der PsycllOphysik Leipzig Breitkopf and Hartel
Flores Nicholas E 2003 A Complimentary Approach to the Law of Comparative Judgshyment and Random Utility Models Working Paper Boulder CO University of Colorado Department of Economics
Gregory Robin Sarah Lichtenstein and Paul Slovic 1993 Valuing Environmental Resourcshyes A Constructive Approach Journal of Risk and Uncertainty 7 (2) 177-97
Holmes Thomas P and Kevin J Boyle 2005 Dynamic Learning and Context-Dependence in Sequential Attribute-Based Stated-Prefershyence Valuation Questions Land Economics 81 (1) 114-26
Kendall M G and B Babington Smith 1940 On the Method of Paired Comparisons Biometrika 31 (3-4) 324-45
Kingsley David A 2006 Multiple Good Valuashytion Using Paired Comparison Choice Experishyments Working Paper Boulder CO Univershysity of Colorado Department of Economics
Li Chuan-Zhong and Leif Mattsson 1995 Discrete Choice under Preference Uncertainty An Improved Structural Model for Contingent Valuation Journal of Environmental Economshyics and Management 28 (2) 256-69
List John A 2003 Does Market Experience Eliminate Market Anomalies Quarterly Jourshynal of Economics 118 (I) 41-71
~- 2004 Substitutability Experience and the Value Disparity Evidence from the Marshyketplace Journal of Environmental Economics and l1fanagement 47 (3) 486-509
Loomis John George Peterson Patricia Champ Thomas Brown and Beatrice Lucero 1998 Paired Comparison Estimates of Willingness to Accept versus Contingent Valuation Estimates of Willingness to Pay Journal of Economic Behavior and Organization 35 (4) 501-15
Marschak Jocob 1959 Binary-Choice Conshystraints and Random Utility Indicators In Afathematical Methods in the Social Sciences ed Kenneth J Arrow Samuel Karlin and Patrick Suppes Palo Alto CA Stanford University Press
McFadden Daniel 2001 Economic Choices American Economic Review 91 (3) 351-78
Peterson George L and Thomas C Brown 1998 Economic Valuation by the Method of Paired Comparison with Emphasis on Evaluation of the Transitivity Axiom Land Economics 74 (2) 240-61
Plott Charles R 1996 Rational Individual Behavior in Markets and Social Choice Proshycesses The Discovered Preference Hypothesis In Rational Foundations of Economic Behavior ed Kenneth J Arrow Enrico Colombatto Mark Perleman and Christian Schmidt Lonshydon Macmillan and St Martins
Savage Scott J and Donald M Waldman 2008 Learning and Fatigue During Choice Expershyiments A Comparison of Online and Mail Survey Modes Journal of Applied Econometshyrics 23 (3) 351-71
Swait Joffre and Wiktor Adamowicz 1996 The Effect of Choice Complexity on Random Utility Models An Application to Combined Stated and Revealed Preference Models Gainesville Deshypartment of Marketing University of Florida
Thurstone Louis L 1927 A Law ofComparative judgment Psychology Review 34273-86
Torgerson Warren S 1958 Theory and Methods of Scaling New York John Wiley and Sons
544 Land Economics August 2010
Wang H 1997 Treatment of Dont-Know Welsh Michael P and Gregory L Poe 1998 Responses in Contingentmiddot Valuation Surveys A Elicitation Effects in Contingent Valuation Random Valuation Model Journal of Envishy Comparisons to a Multiple Bounded Discrete ronmental Economics and Management 32 (2) Choice Approach Journal of Environmental 219-32 Economics and Management 36 (2) 170-85
III(
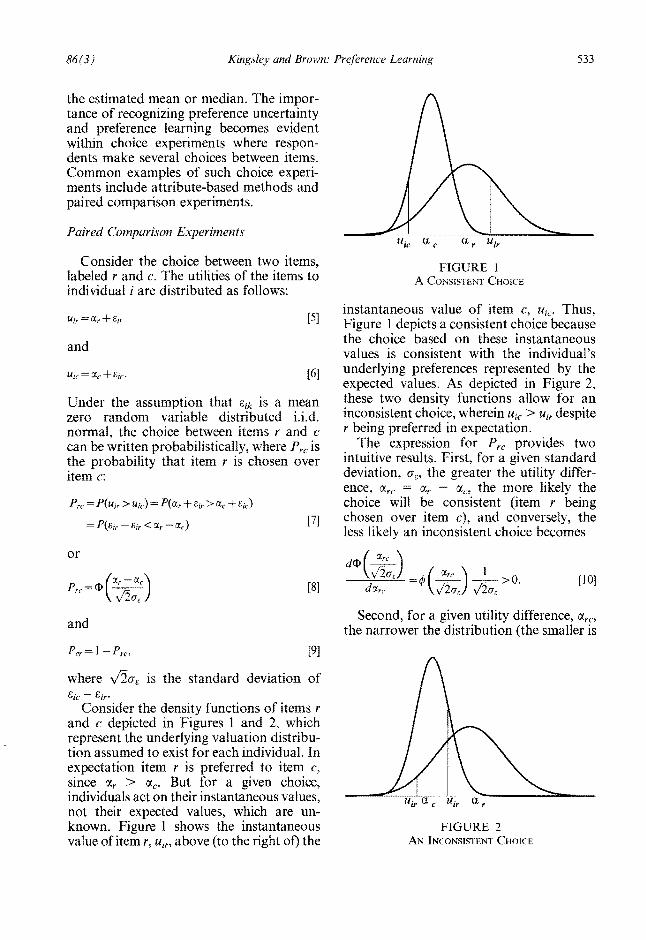
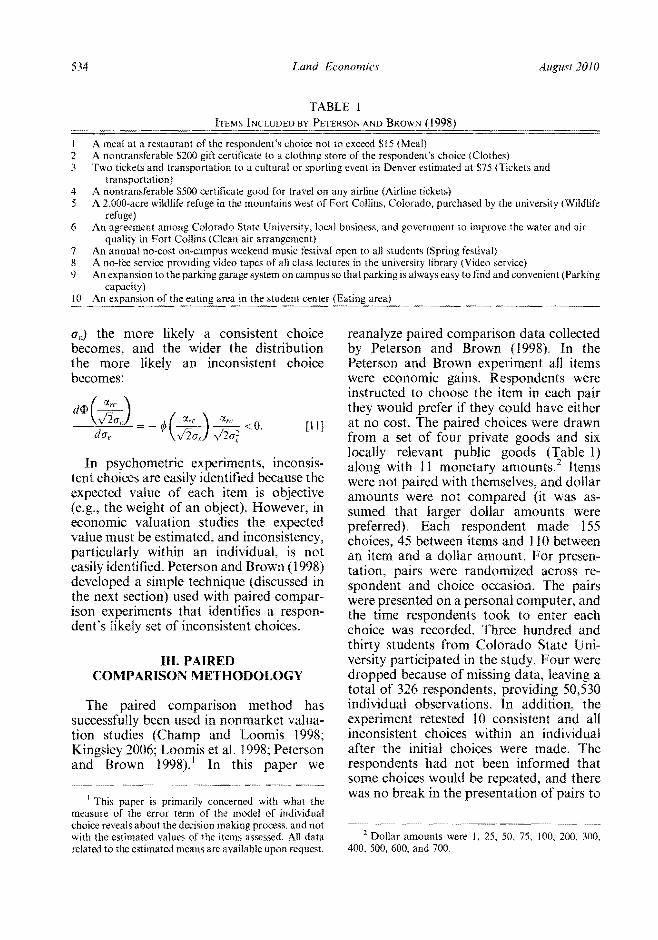
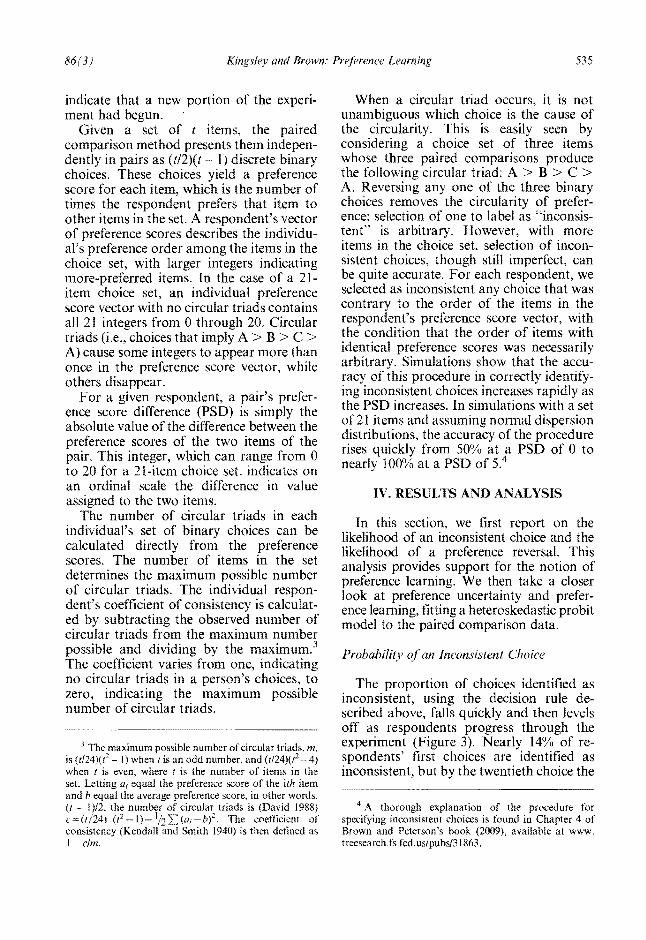
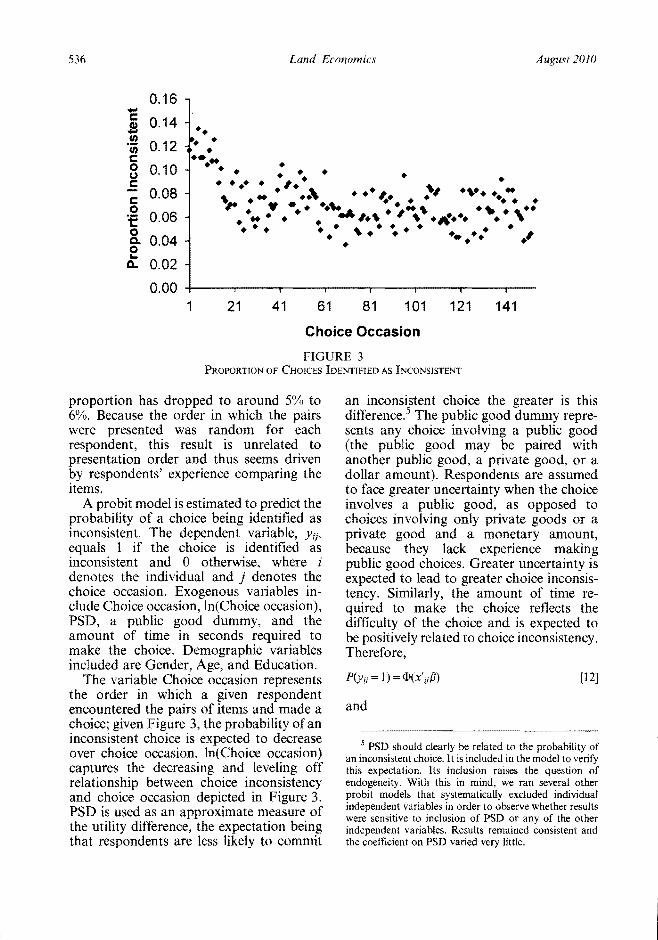
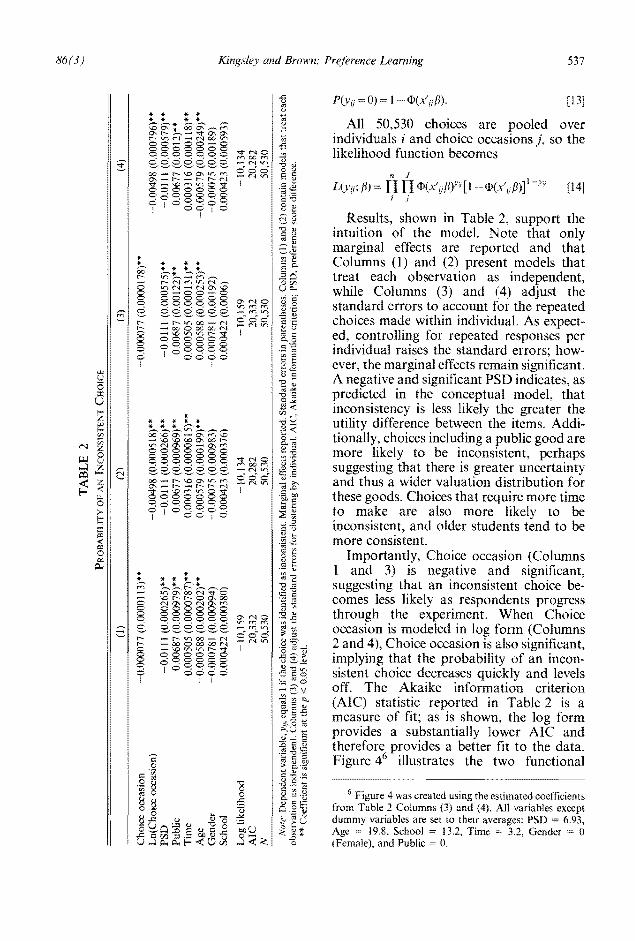
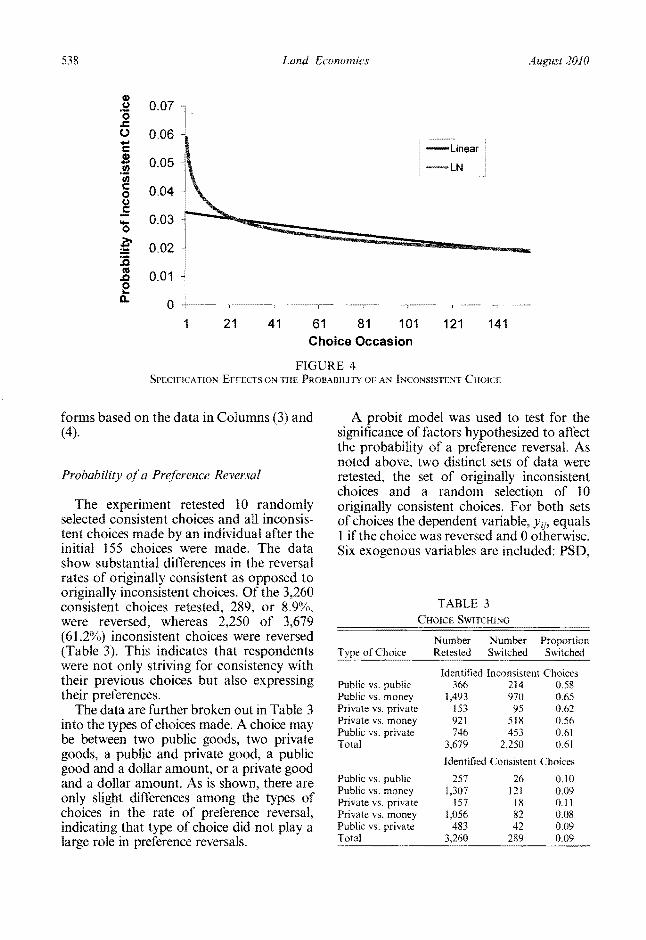
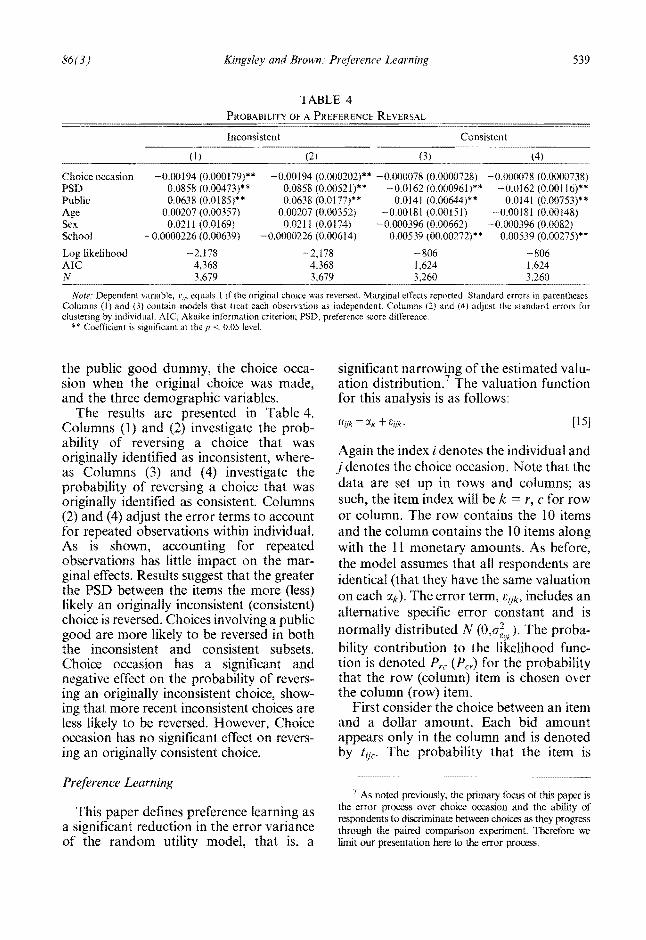
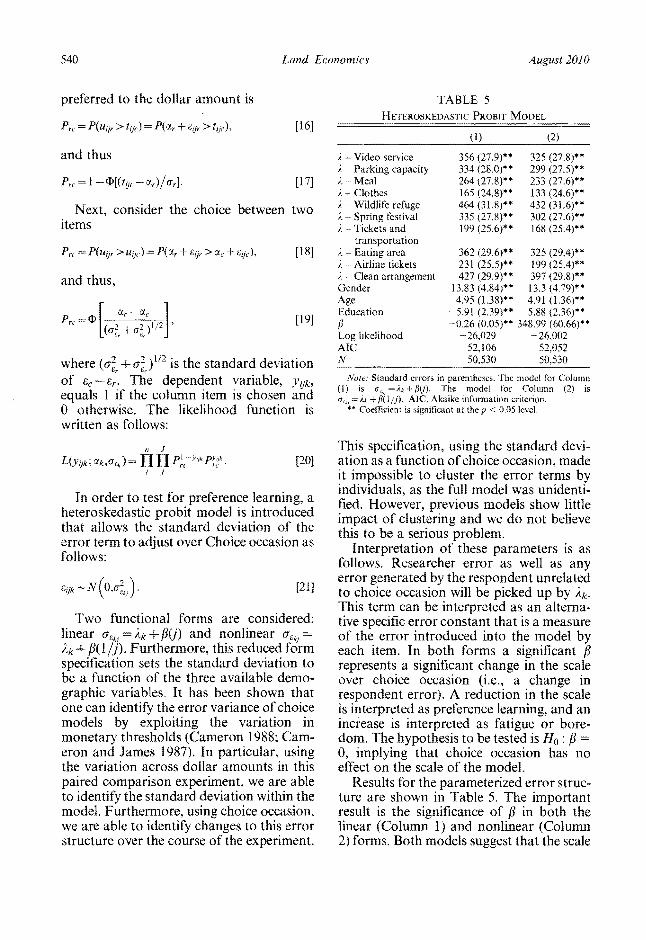
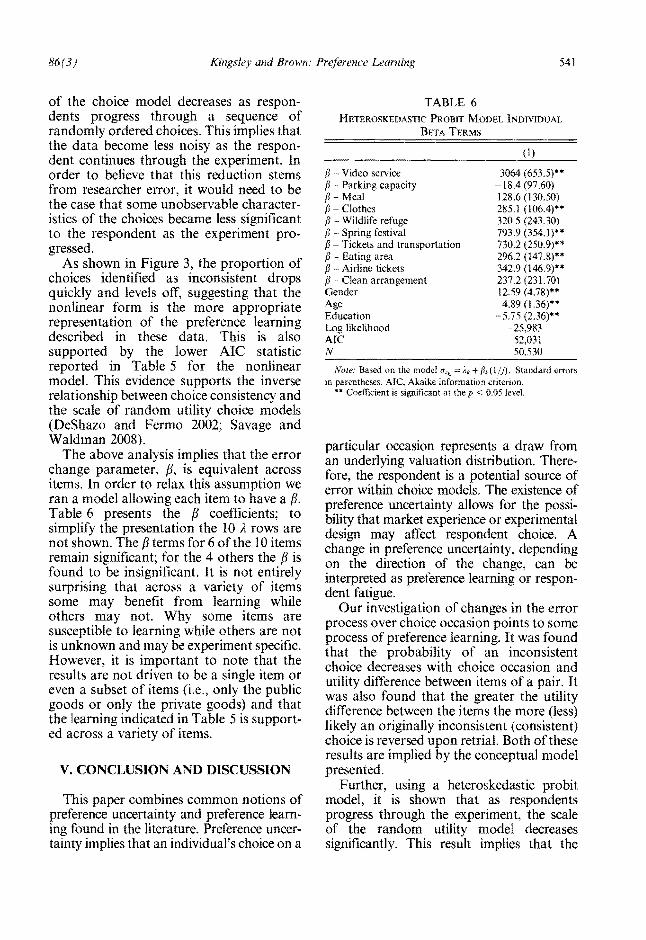