Preference Partisanship SSRNon2110/Papers/Preference_Partisanship_SSRN.pdfpreference partisanship,...
30
1 Polarized America: From Political Partisanship to Preference Partisanship Verena Schoenmueller (Bocconi University), Oded Netzer 1 (Graduate School of Business, Columbia University), and Florian Stahl (University of Mannheim, Mannheim Business School) Abstract In light of the widely discussed political divide post the 2016 election, we investigate in this paper whether this divide extends to the preferences of individuals for commercial brands, media sources and nonprofit organizations and how it evolved post the election. Using publicly available social media data of over 150 million Twitter users’ brand followerships we establish that commercial brands and organizations are affiliated with the consumers political ideology. We create a mosaic of brand preferences that are associated with either sides of the political spectrum, which we term preference partisanship, and explore the extent to which the political divide manifests itself also in the daily lives of individuals. Moreover, we identify an increasing polarization in preference partisanship since Donald Trump became President of the United States. Consistent with compensatory consumption theory, we find the increase in polarization post-election is stronger for liberals relative to conservatives. From a brand perspective, we show that brands can affect their degree of the political polarization by taking a political stand. Finally, after coloring brands as conservative or liberal we investigate the systematic differences and commonalities between them. We provide a publicly available API that allows access to our data and results. Keywords: Political Marketing, Social Media, Data Mining, Political Polarization, Branding. 1 Corresponding Author: 3022 Broadway, Uris 520, New York, NY 10027, USA, Telephone +1-212-854-9024, Email: [email protected]
Transcript of Preference Partisanship SSRNon2110/Papers/Preference_Partisanship_SSRN.pdfpreference partisanship,...
1
Polarized America: From Political Partisanship to Preference Partisanship
Verena Schoenmueller (Bocconi University), Oded Netzer1 (Graduate School of Business,
Columbia University), and Florian Stahl (University of Mannheim, Mannheim Business School)
Abstract
In light of the widely discussed political divide post the 2016 election, we investigate in this paper
whether this divide extends to the preferences of individuals for commercial brands, media sources
and nonprofit organizations and how it evolved post the election. Using publicly available social
media data of over 150 million Twitter users’ brand followerships we establish that commercial
brands and organizations are affiliated with the consumers political ideology. We create a mosaic
of brand preferences that are associated with either sides of the political spectrum, which we term
preference partisanship, and explore the extent to which the political divide manifests itself also
in the daily lives of individuals. Moreover, we identify an increasing polarization in preference
partisanship since Donald Trump became President of the United States. Consistent with
compensatory consumption theory, we find the increase in polarization post-election is stronger
for liberals relative to conservatives. From a brand perspective, we show that brands can affect
their degree of the political polarization by taking a political stand. Finally, after coloring brands
as conservative or liberal we investigate the systematic differences and commonalities between
them. We provide a publicly available API that allows access to our data and results.
Keywords: Political Marketing, Social Media, Data Mining, Political Polarization, Branding.
1 Corresponding Author: 3022 Broadway, Uris 520, New York, NY 10027, USA, Telephone +1-212-854-9024, Email: [email protected]
2
Introduction
The political divide in the United States (U.S.) is well documented and has been claimed to
accelerate over the past couple of years (Pew Research Center 2017a). In the aftermath of the 2016
U.S. presidential election, a heated debate arose regarding the role of social media in American
politics and its impact on the political divide. Part of this debate has revolved around the political
echo chambers, suggesting that people surround themselves with likeminded people, leading to a
further enhancement of the political divide. Dave Barry, the Pulitzer Prize winning author and
columnist, anticipated the current climate well when he suggested that Republicans think of
Democrats as godless, Nordstrom-loving, weenies who read The Atlantic while sucking their latte,
while Democrats dismiss Republicans as ignorant religious fanatics, NRA-obsessed, drinking
Budweiser, watching Fox News and surfing the Drudge Report (Barry 2004).
In line with this claim, the far-reaching impact of political orientation has been shown to
relate to many different aspects of lives, such as the person’s social identity (Iyengar and
Westwood 2015, Ordabayeva and Fernandes 2018, Ordabayeva 2019), personality (Sibley et al.
2012) and even to physiological characteristics such as one’s genetics (Alford et al. 2005) and
neurological structures (Nam et al. 2017). The view that the political divide extends beyond
political partisanship to day-to-day behaviors, is also echoed by several studies that have shown
that conservatives and liberals2 exhibit different patterns of behavior in grocery shopping (Khan
et al. 2013), movie choices (Roos and Shachar 2014), recycling (Kidwell et al. 2013), charity
(Winterich et al. 2012), complaint/dispute (Jung et al. 2017), and lifestyle choices (DellaPosta et
al. 2015). The question we ask is, can we use publicly available social media data to put together
the pieces of evidence from the above-mentioned literature into a comprehensive mosaic that
2 Throughout the paper, we interchangeably use liberals and Democrats as well as conservative and Republicans to reflect the two sides of the political spectrum.

3
reflects the differences between conservatives and liberals that span far beyond their political
differences, which we term preference partisanship?
Social media in general, and Twitter in particular, played an important role in the 2016
U.S. presidential election and as an important and controversial communication channel thereafter
(Emerging Technology 2017). It has been accused by some for fueling political divide by
information sharing (Bail et al. 2018), though others have suggested its effect is limited (Boxell et
al. 2017). Independent of the role of Twitter in directly affecting individuals’ political opinions,
we explore Twitter’s role as a window into people’s preferences, beliefs, and values, creating a
picture of one’s persona (Culotta and Cutler 2016) and relating it to political ideology. On social
media platforms such as Twitter, individuals “announce,” via the accounts they follow, their
preferences and values with respect to the stores they like to shop in, the sports team they root for,
the newspapers they read, their alcoholic beverage of choice or the charity organizations they
support. This source of data is not only extensive and large in scale, but it is also publicly available
at the individual Twitter user level. We use these data to identify political affiliation of a brand or
organization, by the overlap of followers of Democratic accounts (Hillary Clinton and/or the
Democratic National Committee (DNC)) and Republican accounts (Donald Trump and/or the
Grand Old Party (GOP)) and their brand/organization followership. We then separate Twitter users
who follow accounts of the two opposite ends of the political spectrum to obtain the preference
partisanship map. Particularly for a sensitive topic such as political affiliation, such an effort was
not possible before due to limited data on a large body of individuals with respect to both their
political affiliation as well as a wide spectrum of their preference microcosm.

4
Accordingly, the objective of this paper is to use social media data to investigate the degree
to which the political divide stretches to consumer preferences as expressed by their social media
behavior. Specifically, in this paper we address the following four research questions:
• Does the U.S. political divide extend to preferences for commercial brands, media sources,
and non-profit organizations (NPOs)? And if so, can we use readily available social media
data to uncover preference partisanship?
• How did the preference partisanship polarization evolve post the 2016 U.S. election?
• In light of the increase in brands taking a political stand post the 2016 elections, how do
such actions affect the brands’ preference partisanship?
• Are there systematic differences and commonalities between the underlying preference
universes of Democrats and Republicans?
To provide an easy access to the U.S. preference partisanship, we developed a publicly
available API that can be used by brand managers, researchers, writers, and consumers to assess
and compare the extent to which brands are preferred by conservatives or liberals on the Twitter
platform.
Dataset and Measures of Preference Partisanship
We build a dataset of all Twitter users who follow one of 637 major brand accounts that have more
than 100,000 followers, which we collected since February 2017. We use brand account to refer
to non-personal Twitter accounts such as companies, sports teams, media outlets, and NPOs. The
selection of accounts to follow is based on brands that are tracked by Y&R Brand Asset Valuator
and Interbrand, which track brands that are of high relevance to consumers, thus creating a broad
map of consumers’ preferences.
5
We restrict our analysis to Twitter users that follow one of the brands and at least one
Democratic (Hillary Clinton and/or the DNC) or one Republican (Donald Trump and/or the GOP)
Twitter account, and who do not simultaneously follow Democratic and Republican accounts. This
restriction allows us to focus on users with a clear political preference.3 Previous studies have
demonstrated that the exclusive followership of Donald Trump and Hillary Clinton on Twitter is
a reliable indicator of the user’s support for the candidate (Electome.org). We validate our measure
of political ideology with the ideology score of Barberá et al. (2015), who collected a large dataset
of political ideology of Twitter users implementing a latent space model of political ideology (see
Webappendix 1). We find a high correlation between our political affiliation metrics and the
ideology score of Barberá et al. (2015). Specifically, we find a higher correlation for following the
political party (DNC or GOP) and the users’ political ideology scores than for following the party
leader (Donald Trump or Hillary Clinton). Thus, throughout the paper we mostly focus on
followership of the political parties’ accounts to contrast liberals and conservatives. We further
contrast the GOP’s followers to Donald Trump’s followers to investigate differences between
conservative political ideology and followership of Donald Trump as an individual (Smeltz 2018).
Our dataset includes 24,258,153 unique followers that exclusively follow one of the political
accounts with a total of 152,873,846 observations (account followings). To investigate differences
in preference partisanship between gender and location, we access geographical location for the
subset of users who reported the U.S. state they belong to (2,112,571 unique users) and the gender
3 We do not include users who follow political accounts from both sides of the political spectrum, because we cannot identify the political affiliation of these users. These users may be swing voters or voters with a strong political affiliation who are political enthusiasts or wish to learn about the opinions voiced by the opposite political side.

6
of users for whom we could identify their gender via their screenname4 (14,928,859 unique users).
Table Webappendix 2 provides descriptive statistics of our data.
One concern with using Twitter data is that a non-negligible proportion of the accounts are social
bots (Confessore et al. 2018). As bots might systematically generate personas that are associated
with conservatives or liberals, they may bias our results. Using a bot detection algorithm, we
removed over 2.2 million bot accounts (see Webappendix 4 for details). Interestingly, for both
political leaders we find a substantial proportion of bots (Hillary Clinton – 10%; Donald Trump
8%; GOP 5%; DNC 3%). An analysis without removing the bots using the Botometer algorithm
reveals similar results to the one reported below.
To measure the preference partisanship, we look at the joint followership of a brand
account and a political account by an individual (Culotta and Cutler 2016). As the number of
followers varies considerably across brands and political accounts, we control for these two factors
in measuring the preference partisanship. Our first measure controls only for the brand’s size as it
is used for analyses within a political account (e.g., the brands most commonly followed by
liberals). For this measure we calculate the ratio of the number of the brand’s followers that also
follow a Democrat (Republican) account to the total number of the brand’s followers – Relative
Preference Partisanship (RPP). This intuitively gives us a measure of the brands that are most
frequently followed by liberals or conservatives.
𝑹𝒆𝒍𝒂𝒕𝒊𝒗𝒆𝑷𝒓𝒆𝒇𝒆𝒓𝒆𝒏𝒄𝒆𝑷𝒂𝒓𝒕𝒊𝒔𝒂𝒏𝒔𝒉𝒊𝒑𝒃𝒑(𝑅𝑃𝑃56) = #(:;<<;=>?@;:5&6)#(:;<<;=>?;:5)
, (1)
where b stands for a brand and p stands for a political account.
In our data, conservative accounts (Trump and GOP) have considerably more followers
than liberals (Clinton and DNC). We use the measure of lift to control for both the brand and
4 We use https://pypi.org/project/gender-guesser/ to assess gender. See Webappendix 3 for details.

7
political account followership bases. We normalize the proportion of brand followers that also
follow a political account by the independent likelihood of following the brand and the political
account – Lift Preference Partisanship (LPP). We calculate the probability of following a brand
(𝑝𝑟𝑜𝑏(𝑏))by dividing the total number of brand followers of one brand by the number of account
followings in our sample of individuals who follow any brand and one political account. We
calculate the probability of following a political account (𝑝𝑟𝑜𝑏(𝑝))and the joint probability of
following a brand and a political account 𝑝𝑟𝑜𝑏(𝑏𝑎𝑛𝑑𝑝))in a similar manner. Intuitively, this
measure is the ratio of the likelihood of co-following a brand and a political account to the
likelihood of following both accounts independently.
𝑳𝒊𝒇𝒕𝑷𝒓𝒆𝒇𝒆𝒓𝒆𝒏𝒄𝒆𝑷𝒂𝒓𝒕𝒊𝒔𝒂𝒏𝒔𝒉𝒊𝒑𝒃𝒑K𝐿𝑃𝑃56M =𝒑𝒓𝒐𝒃(𝒃𝒂𝒏𝒅𝒑)
𝒑𝒓𝒐𝒃(𝒃)×𝒑𝒓𝒐𝒃(𝒑). (2)
We further normalize the lift preference partisanship measure such that it sums to one
across the two political parties as follows:
𝑹𝒆𝒍𝒂𝒕𝒊𝒗𝒆𝑳𝒊𝒇𝒕𝑷𝒓𝒆𝒇𝒆𝒓𝒆𝒏𝒄𝒆𝑷𝒂𝒓𝒕𝒊𝒔𝒂𝒏𝒔𝒉𝒊𝒑𝒃𝒑K𝑅𝐿𝑃𝑃56M =𝑳𝑷𝑷𝒃𝒑
(𝑳𝑷𝑷𝒃𝒑(𝑮𝑶𝑷)S𝑳𝑷𝑷𝒃𝒑(𝑫𝑵𝑪)). (3)
Results
The Mosaic of Preference Partisanship
Looking at the RPP (Equation 1) we can get a sense for the preference map of conservatives versus
liberals. In Figures 1 and 2, we depict the media brands, commercial brands and NPOs with the
highest proportion of Donald Trump, GOP, and DNC followers, respectively. First, in line with
the ongoing discussion about media bias and the political affiliation of media outlets, we find that
media sources differ drastically between conservatives and liberals. While media outlets such as
Vox.com, MSNBC and the Ebony Magazine are followed primarily by liberals, conservatives rely
mostly on the Drudge Report and Fox. Interestingly, outlets such as New York Times and CNN,

8
that were attacked by Donald Trump to be a left-wing outlet spreading so called “fake news”
(Smilowitz 2017) do not appear to have high preference partisanship with the DNC. This could
indicate their role as mainstream media sources.
While media outlets are often expected to be associated with a political belief (Blake 2014),
the relationship between political affiliation and commercial brands is less clear. Figure 2 shows
that the top brands among Donald Trump’s followers are primarily characterized by golf brands
(e.g., Titleist, Masters Tournament, and Callaway Golf), alcohol brands (e.g., Miller Lite, Coors
Light, and Maker’s Mark), as well as financial services (e.g., SmartyPig and PIMCO). We find
strong similarity between the brands associated with the GOP and the brands associated with
Donald Trump, apart from a stronger focus of the GOP followers on security brands (e.g.,
Raytheon and Northrop Grumman) and more mainstream financial firms (e.g., Fidelity
Investments and The Vanguard Group). The brands followed by DNC followers are considerably
different from those followed by conservatives. Liberals have a diverse brand universe and seem
to focus on entertainment (e.g., Hulu, Showtime, Syfy), tech companies (e.g., Lyft and Hulu) and
retail (Barnes&Noble and Pier 1 Imports; see Figure 1).
Looking at the difference between the NPOs followed by followers of the different political
groups can provide insight into the set of values that are important to conservatives and liberals.
Top NPOs followed by conservatives are the National Rifle Association, veteran NPOs, such as
Disabled American Veterans and Wounded Warrior Project, the Christian nonprofit organization,
Billy Graham Evangelistic Association, and the habitat conservation and hunting organization,
Ducks Unlimited. On the other hand, liberals focus more on causes related to reproductive health
care (e.g., Planned Parenthood), the immigration-related civil rights organization, American Civil
Liberties Union, and environmental organizations (e.g., Environmental Defense Fund and the

9
Sierra Club). These strong differences highlight the relationship between political affiliation and
societal values.
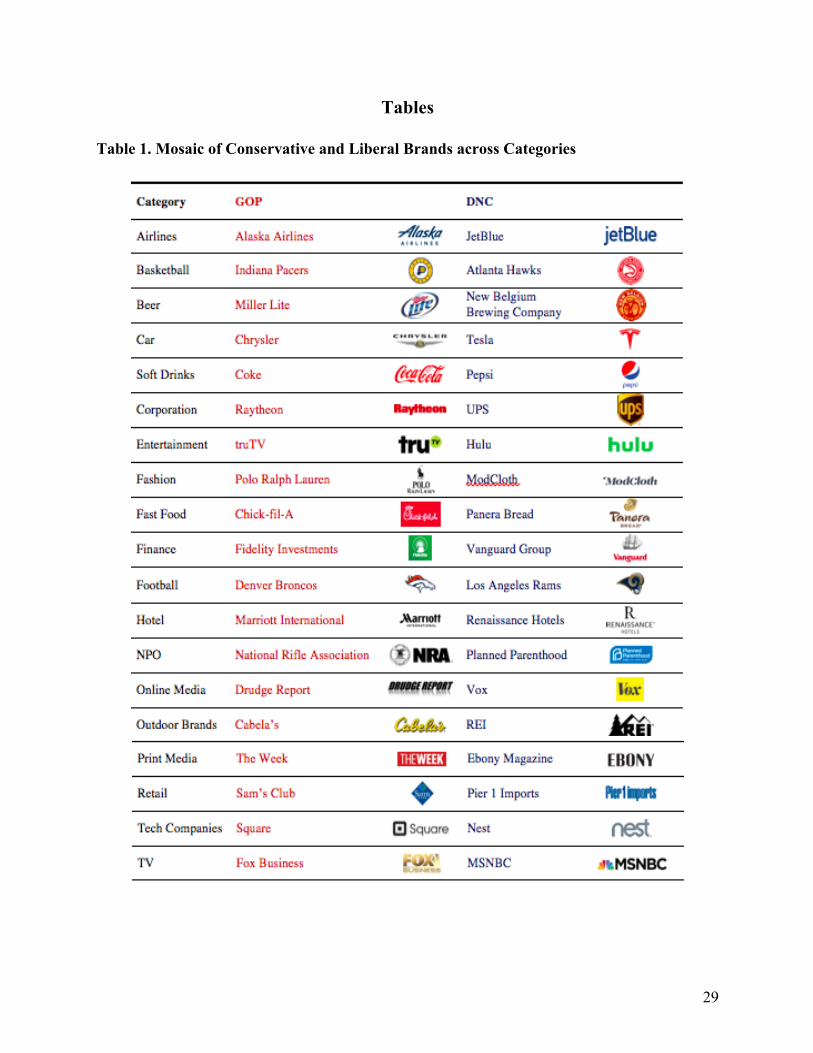
To depict the full mosaic of the different worlds liberals and conservatives live in, Table 1
presents the top brands in terms of the proportion of brand followers that follow the GOP or the
DNC across a set of categories. The results emphasize the stark difference between the microcosm
of conservatives and liberals. To more systematically assess the mosaic of preference partisanship,
we apply a topic modeling approach, which looks for groups of accounts that tend to be co-
followed together by users and can thus be interpreted as topics reflecting a user persona.
Specifically, we apply the unsupervised machine learning Hierarchical Poisson Factorization
approach (see Webappendix 5 for details) to identify such persona topics. For each topic, we
calculate the average likelihood of followership for each user. We then average these likelihoods
across users and their political affiliation to get the political affiliation of the topic.
We identify 31 non-empty topics. The topics vary considerably in their degree of
polarization. Table 2 displays the topics that were most closely related to the DNC or GOP. We
identify several topics with strong affiliation to the political parties. For example, Topic 3 reflect
a liberal persona that combines strong societal and nature value based on both NPOs and media
sources. Similarly, Topic 5 reflects a liberal younger tech, health and entertainment persona. On
the other hand, Topic 6 reflects a conservative sport enthusiast based on media and sport
followerships. Similarly, Topic 8 reflects a conservative financial persona based on both financial
media and financial institutions’ followerships (see further details in Webappendix 6).

10
Is Twitter Followership a Good Measure of Political Affiliation and Preference Partisanship?
One may question the relationship between following a brand or a political account on Twitter and
the user’s preference or political ideology. Users may follow an account on Twitter for reasons
other than preferences such as to obtain information, due to employment with the company, or for
social reasons. Additionally, it is possible that Twitter users are not representative of the population
of consumers at large. We conducted multiple robustness analyses to examine the validity of
Twitter followership as a measure of preference partisanship.
1. Political affiliation – For a subset of over 1 million users we compared the Twitter political
party followership based on our data with the political ideology score of Barberà et al.
(2015). We find that following the political party on Twitter is strongly related to the users’
political ideology score (see Webappendix 1 for details).
2. Brand preferences partisanship and brand affiliation – We conducted several analyses to
validate our brands’ political affiliation measures. First, we compare our brand preference
partisanship measures to the political affiliation of a subset of 283 brands that are also
tracked by the consumer panel data company YouGov. YouGov surveys consumers daily
on various topics including their brand preferences, purchase intentions and political
affiliation. We find a high correlation between our Twitter followership data and the
corresponding relative brand preferences by political affiliation based on the YouGov
survey (r=0.75). Thus, despite the possible limitations of the Twitter platform in terms of
representing consumers’ preferences at large, this analysis demonstrates that Twitter
followership strongly correlates with preference partisanship as measured by a survey of a
representative sample of U.S. consumers who were asked about their brand preferences
(See Webappendix 7 for the details).

11
Second, we relate our measure of brand political affiliation, to political donations made by
these brands. Specifically, for a subset of 360 brands we obtain from
https://www.goodsuniteus.com political donations made by the brand and its senior
employees. We find a high correlation between the RLPP and the proportion of donations
to the political party (r=0.4). Thus, the preference partisanship of a brand seems to be
affected by, or at the minimum correlated with, the brands political donation distribution.
3. Media preference partisanship - To check the robustness of our media preference
partisanship we compare our preference partisanship for media outlets with the political
bias ratings of media outlets according to mediabiasfactcheck.com. We find a high
correlation (r=0.74, p<0.001) between our media RLPP and the website ratings (see
Webappendix 8 for details).
Overall, these analyses validate that our political ideology and brand preferences as measured by
Twitter followership are highly correlated with external measures of political affiliation and brand
preferences from different sources.
What Happened to Preference Polarization Post the 2016 Election?
The election of Donald Trump and its effect on political partisanship have become increasing
topics of interest. A pattern discussed heavily in public media post the 2016 U.S. election has been
the increased polarization between conservatives and liberals (Gentzkow 2016, Pew Research
Center 2017b). Thus, we might expect to also see an increase in brands preference polarization
post the 2016 election. To investigate this issue we analyze the change in polarization in preference
partisanship over time.

12
We measure polarization between conservatives and liberals using the entropy of the
RLPP. The entropy measure for brand b at time t is calculated as (see Webappendix 9 for details
of the Entropy calculation):
𝑬𝒏𝒕𝒓𝒐𝒑𝒚𝒕𝒃 = −∑ [(𝑅𝐿𝑃𝑃\56) × logK𝑅𝐿𝑃𝑃\56M`.6∈cde,fgh (4)
Note that at a RLPP of 50% the brand would exhibit no partisanship and maximal entropy.
We compare the entropy measure for brands in February 20175 and the polarization a year later
(February 2018). Note that in calculating polarization we hold Twitter users’ political affiliation
constant per February 2017 and only look at changes in brands’ followership to avoid change in
partisanship post-election (e.g., users who start following the GOP post-election).
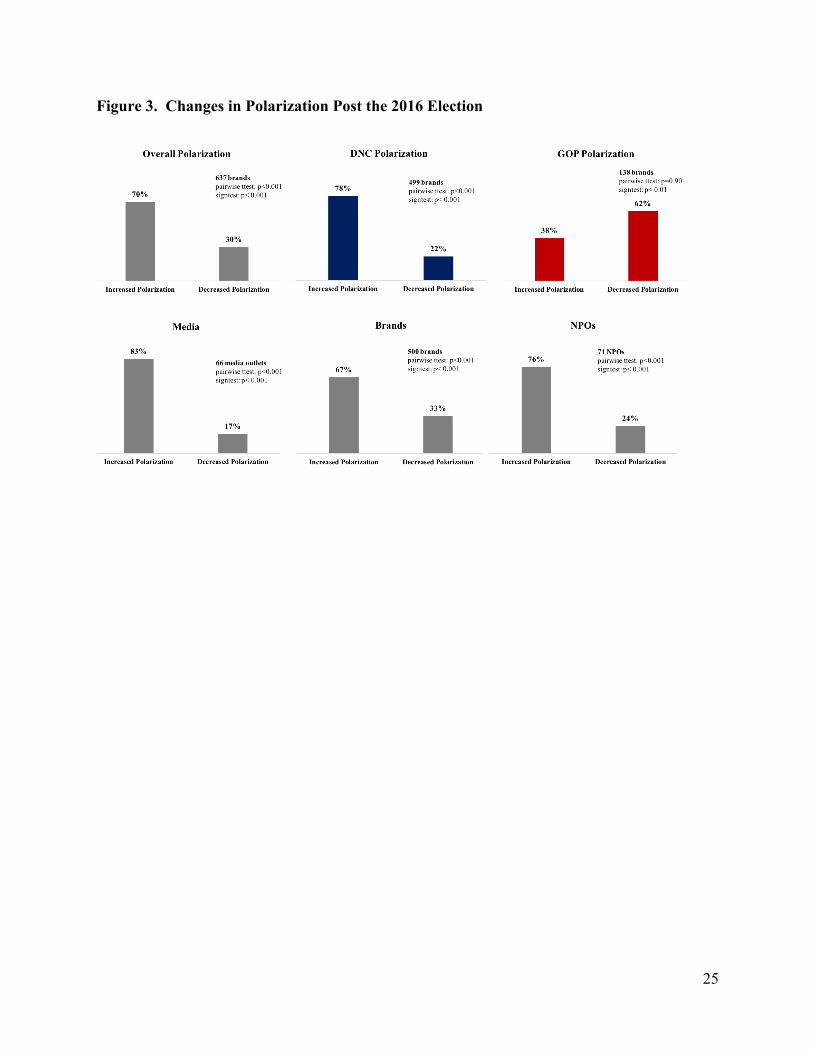
Looking at the overall change in entropy for all commercial accounts, we find an increasing
polarization. Of the 637 brands 70% show an increased polarization, while only 30% of the brands
decreased in terms of polarization during the year following the election (see Figure 3). The
polarization is stronger for media outlets (83% of the 66 media outlets exhibit increased
polarization) followed by NPOs (76% of the 71 NPOs exhibited increased polarization) and
commercial brands (67% of 500 brands exhibited increased in polarization). All three groups show
a significant increase in polarization. This result emphasizes that the proclaimed increase in
polarization commonly discussed in the context of people’s political affiliation may extend further
into people’s lives than initially thought, manifesting itself by a stronger division in brand
preferences.
Next, we compare the change in polarization post the 2016 election between liberal and
conservative brands as measured by their preference partisanship right after the election. We find
5 For NPOs we use the data from April 2017 rather than February 2017 because we started tracking NPOs in April 2017.

13
that the overall increase in polarization is driven by liberal brands. 78% of the brands that were
identified as DNC brands in February 2017 exhibit an increase in polarization, whereas those
identified as GOP brands in February 2017 even show a decrease in polarization albeit
insignificant.
The stronger increase in polarization for liberal brands compared to conservative brands is
consistent with the mechanism of compensatory consumption which is often used to combat
identity threats (Coleman et al. 2018). Indeed, liberals faced a threat to their political identity after
the somewhat unexpected election of Donald Trump, which they compensated by a stronger
support for liberal oriented brands and growing activism (Green 2018). This behavior can explain
our findings that liberals looked for consumption of media sources, support of NPOs and even
commercial brands that would help to offset the threat to their identity (Rucker and Galinsky 2013,
Long et al. 2018). Such compensatory consumption has been shown for a variety of domains such
as threats to one’s masculinity, intelligence, power, personality and freedom but thus far not to
political ideology.
Post the 2016 election, we witnessed an increase in occasions in which brands have either
publicly opposed or supported Donald Trump’s policies such as the anthem kneeling protest by
many NFL teams, Nordstrom discontinuing Ivanka Trump’s product line, or Under Armour
endorsing Donald Trump. Additionally, many brands, such as Google or the New York Times,
have been actively attacked by Donald Trump. Accordingly, we aim to further understand whether
the polarization displayed above changed for brands that actively or passively took a political
stand. We can classify brands into three different groups, brands that did not take any action,
brands that took (or were passively associated with) a congruent action (i.e., liberal brands
opposing Donald Trump or conservative brands supporting Donald Trump), and brands that took

14
(or were passively associated with) an incongruent action (i.e., liberal brands supporting Donald
Trump or conservative brands opposing Donald Trump). We should expect that congruent actions
should be associated with an increased polarization and incongruent actions with a decreased
polarization.
As illustrated in Figure 4, our results indeed show that brands that took a political stand
congruent with their political affiliation became significantly more polarized (79% of the 86 brands
became more polarized), while brands that took an action incongruent with their political
affiliation (e.g., NFL teams who took a liberal stand albeit mostly conservative preference
partisanships) became significantly less polarized (78% of the 46 brands). Consistent with our
previous finding we find that the majority of brands that took no political action became
significantly more polarized post the 2016 election (73% of the 505 brands), driven by the liberal
brands. The polarization change for conservative brands which did not take actions is statistically
insignificant. Regarding brands that took actions, we find that polarization increased for brands
that were associated with the DNC and engaged in congruent actions, while brands that took
incongruent actions (in support of Donald Trump), saw a decrease in polarization. For brands that
were associated with GOP followers, we find that congruent actions increased polarization, but
incongruent actions were associated with a decrease in polarization.
In summary, our results highlight that the widespread claim of increased political
polarization in the U.S. population is mirrored in an increasing polarization in preference
partisanship. Interestingly, we find a stronger polarization for liberal brands, which can be
attributed to the mechanism of compensatory consumption in which liberals use their followership
of brands to overcome identity threats created by the 2016 election. Additionally, we find that
brands that took an active or a passive political stand incongruent with their political affiliation

15
saw a decrease in polarization. Generally, our results on brands taking a political stand indicate
that brands can take control of their political polarization.
What do Conservative and Liberal Brands Have in Common?
Is there something that SmartyPig, Chick-fil-A, and Lowe’s have in common that makes them
attractive to followers from the conservative side of the political map? As we show later, these
brands are characterized as being “rugged”, “energetic” and “down-to-earth?” while brands like
Lyft, Chobani and MoneyGram, which are mostly followed by liberals, are perceived as
“intelligent” and “socially responsible”. These commonalties go beyond demographic similarities
of the brand followers and towards brand characteristics and personality.
To better understand the commonalities of the brands that are followed by individuals at
the different ends of the political spectrum, we collected a set of brand characteristics. Specifically,
we obtained survey data from the marketing agency Y&R conducted with a large U.S. consumer
panel. Brands are rated on a host of human personality characteristics such as “authentic,” “leader,”
and “intelligent” (Aaker 1997). For a subset of 447 brands we calculate for each brand the average
brand personality over the four quarterly surveys of 2016 for 46 brand personality traits. We then
split brands into liberal and conservative based on RLPP and calculate the average brand
characteristics for conservative vs liberal brands. We use an ANCOVA to control for gender by
using the proportion of female brand followers as a covariate.
Figure 5 displays the brand characteristics that show significant difference between DNC’s
and GOP’s as well as between Donald Trump’s and Hillary Clinton’s brands. First, consistent with
Ordabayeva and Fernandes (2018) who showed that liberal consumers prefer unique brands and
use them as a mean to differentiate themselves from others, we find that independence, difference

16
and innovation are significantly more associated with DNC brands relative to GOP brands.
Additionally, we find that liberal brands are characterized as being trustworthy, trendy, intelligent
and progressive. On the other hand, brands preferred by conservatives tend to be more strongly
characterized as traditional rugged, energetic, down to earth and arrogant.
The Role of Demographics in Preference Partisanship
One pattern that emerges from our results is that liberal brands might be perceived as somewhat
more feminine (e.g., Burt’s Bees) and conservative brands may be perceived as more masculine
(e.g., Cabela’s) or more associated with conservative geographies (e.g., Chick-fil-A). First, it is
unlikely that gender effects alone can explain the political partisanship as the voting patterns for
Donald Trump vs. Hillary Clinton in the 2016 election was not very divergent (39% of Trumps’
validated voters were female and 46% of Clinton’s validated voters were male, Pew Research
Center 2018).
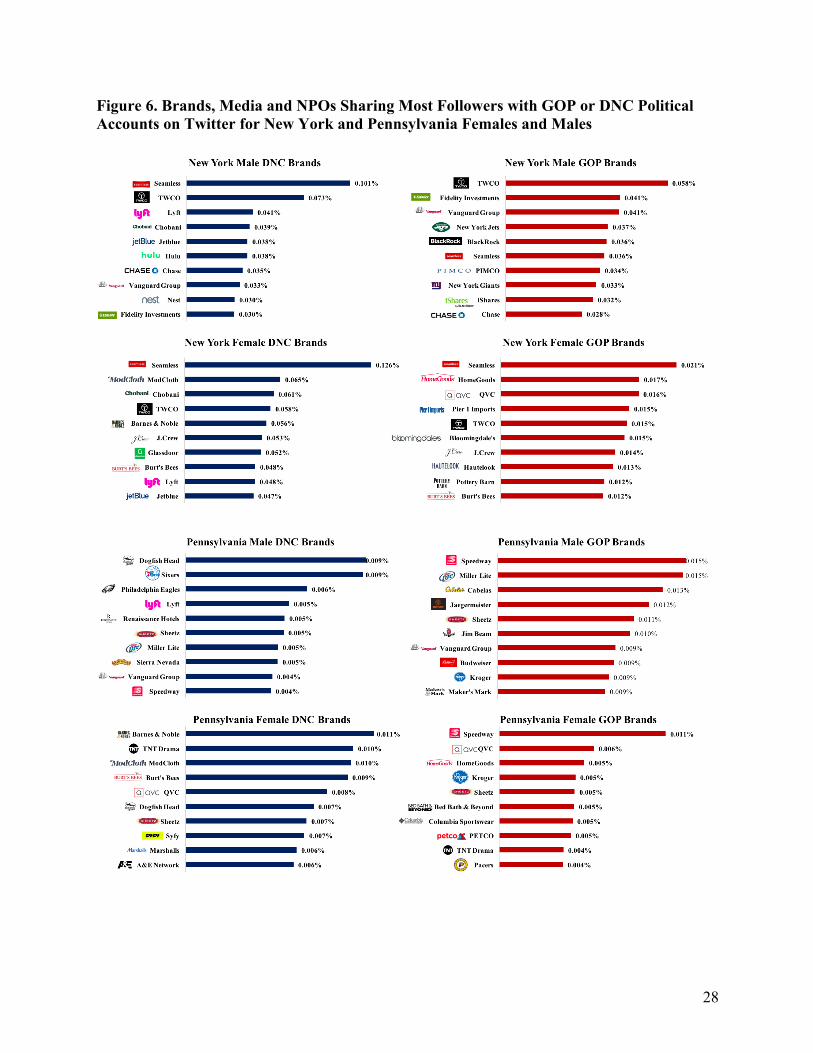
Second, to fully control for geography and gender, in Figure 6, we contrast the RPP for the
DNC and GOP separately for females and males who reside in NY and Pennsylvania.6 Consistent
with our previous results, we see substantial differences in preference polarization even when
controlling for gender and geography. For example, whereas both DNC and GOP females in NY
follow retail brands, the stores they prefer diverge substantially. DNC females follow stores like
ModCloth and Barnes&Noble, while GOP females follow stores like Home Goods,
Bloomingdales, or the TV shopping channel QVC.
To investigate more systematically the differences between conservative and liberal
preference partisanship, we explore the preference partisanship variance explained by “objective”
6 Analysis of additional geographies is available from the authors.

17
characteristics such as demographics (gender and geography of the followers) and firm
characteristics such as location of the headquarters and color of the firm’s logo, as well as more
perceptual drivers, namely the personality characteristics (see Webappendix 10 for details of the
variables used). We regress the GOP RLPP (Equation 3) on the demographics, firm characteristics
and personality. We also repeat the analysis for Donald Trump (Webappendix 11).
We first look at the model that includes only the objective brand characteristics (see Table
3). We see that a 10% increase in the proportion of female followers of the brand corresponds to a
3% decrease in the RLPP for the GOP. As expected, the proportion of conservative voters in each
state weighted by the popularity of the brands in the state also increases the preference partisanship
for conservative brands. However, we find no significant relationship between domestic brands
and the GOP brand affiliation. Interestingly, we do find that domestic brands significantly increase
the preference partisanship for Donald Trump by 0.4% (see Webappendix 11).
Taken together, our results show that gender and location can explain nearly 50% of
variation in the brands’ political affiliation. Additionally, a model that includes the brand
personality characteristics alone is equally effective in explaining the variation in the preference
partisanship. Adding the perceived brand personality characteristics to the demographic variables
can add additional information over and beyond the information captured by gender and the
location of the brand’s users explaining overall nearly two thirds of the variation in preference
partisanship.
Discussion
Our results highlight that the U.S. political divide extends to the preferences of individuals for
media sources, nonprofit organizations and commercial brands. We additionally find evidence for
18
an increasing polarization in preference partisanship since Donald Trump became President of the
U.S. This polarization is stronger for media outlets and NPOs compared to commercial brands.
Interestingly, the increase in polarization is primarily driven by liberal brands’ followers. This
finding is in line with the growing activism of liberals post-election. Furthermore, brands can take
control of their degree of polarization by taking a political stand. Finally, we identify systematic
differences and commonalities between the preference partisanship of liberals and conservatives.
While gender and geography can explain an important part of the preference partisanship
differences between the two sides of the political spectrum, brand characteristics can further help
to understand preferences of liberals and conservatives. This is a particularly relevant insight for
companies as brand characteristics are consumers’ perceptions that – at least to a certain degree –
are in the control of a company. Thus, brands should both measure and, if needed, attempt to adjust
their political affiliation as such affiliation has important implications for consumers’ preference
(Ordabayeva and Fernandes 2018, Kim, Park, and Dubois 2018).
An important contribution of our work is demonstrating the value of using publicly
available social media data to infer both consumers’ preferences and map preference partisanship.
Such an endeavor was effortful, costly and unscalable in the past. Twitter provides a useful
platform to access such data. However, one may question the generalizability of Twitter data to
infer consumers’ preferences. While we have conducted multiple analyses contrasting Twitter data
with survey and other outside measures of preference and political affiliation and found strong
convergent validity, we leave for future research to explore how preference partisanship can be
extracted from other sources of data that may include, for example, purchase data (e.g., e-
commerce data).

19
Finally, to enhance the access to our data, analyses, and the dissemination of our findings
we created a publicly available API that allows access to our results. We hope this offers a valuable
source for brand managers, consumers, academics, journalists, and political parties:
http://www.social-listening.org/.
References
Aaker JL (1997) Dimensions of brand personality. J. Mark. Res. 34(3): 347-356.
Alford JR, Funk CL, Hibbing JR (2005) Are political orientations genetically transmitted? Am.
Political Sci. Rev. 99(2):153-167.
Bail CA (2018) Exposure to opposing views on social media can increase political polarization.
PNAS 115(37):9216-9221.
Barberá P, Jost JT, Nagler J, Tucker JA, Bonneau R (2015) Tweeting from left to right: Is online
political communication more than an echo chamber? Psychol. Sci. 26(10):1531-1542.
Barry D (2004) An off-color rift. The Washington Post (December 19),
http://www.washingtonpost.com/wp-dyn/articles/A218-2004Dec14.html.
Blake A (2014) Ranking the media from liberal to conservative, based on their audiences. The
Washington Post (October 21).
https://www.washingtonpost.com/news/the-fix/wp/2014/10/21/lets-rank-the-media-from-
liberal-to-conservative-based-on-their-audiences/?utm_term=.56ed844bc658.
Boxell L, Gentzkow M, Shapiro JM (2017) Is the internet causing political polarization? Evidence
from demographics. Working Paper, National Bureau of Economic Research, Cambridge.

20
Coleman NV, Williams P, Morales AC (2018) Identity threats, compensatory consumption, and
working memory capacity: How feeling threatened leads to heightened evaluations of
identity-relevant products. J. Consumer Res. 46(1):99-118.
Confessore N, Dance GJX, Harris R (2018) Twitter followers vanish amid inquiries into fake
accounts. The New York Times (January 31). https://www.nytimes.com/interactive/2018/
01/31/technology/social-media-bots-investigations.html.
Culotta A, Cutler J (2016) Mining brand perceptions from twitter social networks. Mark.
Sci. 35(3):343-362.
DellaPosta D, Shi Y, Macy M (2015) Why do liberals drink lattes? Am. J. Sociol. 120(5): 1473-
1511.
Emerging Technology (2017) How tweets translate into votes. MIT Technology Review (October
26), https://www.technologyreview.com/s/609229/how-tweets-translate-into-votes.
Gentzkow M (2016) Polarization in 2016. Toulouse Network for Information Technology
Whitepaper. https://web.stanford.edu/~gentzkow/research/PolarizationIn2016.pdf.
Green E (2018) Politics as the new religion for progressive Democrats. The Atlantic (October 11),
https://www.theatlantic.com/politics/archive/2018/10/poll-shows-activism-highest-
among-non-religious-democrats/572674/.
Iyengar S, Westwood SJ (2015) Fear and loathing across party lines: New evidence on group
polarization. Am. J. Political Sci. 59(3):690-707.
Jung K, Garbarino E, Briley D, Wynhausen J (2017) Blue and red voices: Effects of political
ideology on consumers’ complaining and disputing behavior. J. Consumer Res. 44(3):477-
499.
Khan R, Misra K, Singh V (2013) Ideology and brand consumption. Psychol. Sci. 24(3):326-333.
21
Kidwell B, Farmer A, Hardesty DM (2013) Getting liberals and conservatives to go green: Political
ideology and congruent appeals. J. Consumer Res. 40(2):350-367.
Long JA, Eveland WP Jr., Slater MD (2018) Partisan media selectivity and partisan identity threat:
The role of social and geographic context. Mass Comm. Soc. 22(2):145-170.
Nam HH, Jost JT, Kaggen L, Campbell-Meiklejohn D, Van Bavel JJ (2017) Amygdala structure
and the tendency to perceive the social system as legitimate and desirable. Nat. Hum.
Behav. 2:133-138.
Ordabayeva, N (2019) Similar but unequal: Political polarization in the effects of perceived social
similarity on support for redistribution. J. Exp. Soc. Psychol. 84, 103811.
Ordabayeva N, Fernandes D (2018) Better or different? How political ideology shapes preferences
for differentiation in the social hierarchy. J. Consumer Res. 45(2):227-250.
Pew Research Center (2017a) Political polarization, 1994-2017. Accessed January 3, 2019,
http://www.people-press.org/interactives/political-polarization-1994-2017.
Pew Research Center (2017b) The partisan divide on political values grows even wider. Accessed
January 3, 2019, http://www.people-press.org/2017/10/05/the-partisan-divide-on-
political-values-grows-even-wider.
Pew Research Center (2018) An examination of the 2016 electorate, based on validated voters.
Accessed August 1, 2019, https://www.people-press.org/2018/08/09/an-examination-of-
the-2016-electorate-based-on-validated-voters/.
Roos JMT, Shachar R (2014) When Kerry met Sally: Politics and perceptions in the demand for
movies. Manag. Sci. 60(7):1617-1631.
Rucker DD, Galinsky A (2013) Compensatory consumption. Belk R, Ruvio A, eds. The Routledge
Companion to Identity and Consumption (Routledge Taylor & Francis Group, London),

22
207–215.
Sibley CG, Osborne D, Duckitt J (2012) Personality and political orientation: Meta‐analysis and
test of a threat‐constraint model. J. Res. Pers. 46(6):664-677.
Smeltz D (2018) A new survey shows that the Republican Party is not the party of Trump. The
Washington Post (October 2),
https://www.washingtonpost.com/news/monkey-cage/wp/2018/10/02/no-the-republican-
party-is-not-the-party-of-trump-this-new-survey-finds/?utm_term=.6c2008dcddbe.
Smilowitz E (2017) Trump attacks NY Times, Washington Post in tweets. The Hill (January 28).
https://thehill.com/homenews/administration/316655-trump-attacks-ny-times-
washington-post-in-tweets.
Swift A (2017) Six in 10 in U.S. see partisan bias in news media. Gallup (April 5).
https://news.gallup.com/poll/207794/six-partisan-bias-news-media.aspx.
Winterich KP, Zhang Y, Mittal V (2012) How political identity and charity positioning increase
donations: Insights from moral foundations theory. Int. J. Res. Mark. 29(4):346-354.

23
Figures
Figure 1. Brands, Media and NPOs Sharing Most Followers with GOP or DNC Political Accounts on Twitter

24
Figure 2. Brands, Media and NPOs Sharing Most Followers with Donald Trump on Twitter
25
Figure 3. Changes in Polarization Post the 2016 Election

26
Figure 4. Changes in Polarization by Political Action

27
Figure 5. Differences in Brand Perception between Liberal and Conservative Brands
28
Figure 6. Brands, Media and NPOs Sharing Most Followers with GOP or DNC Political Accounts on Twitter for New York and Pennsylvania Females and Males
29
Tables
Table 1. Mosaic of Conservative and Liberal Brands across Categories

30
Table 2. Hierarchical Poisson Factorization Topics and Preference Partisanship
Table 3. Preference for GOP by Brand Characteristics, Firm Characteristics, and Demographics