PREFACE - labourbureaunew.gov.inlabourbureaunew.gov.in/...Pay_Wages_Act_Year2012.pdf · PREFACE...
189
Transcript of PREFACE - labourbureaunew.gov.inlabourbureaunew.gov.in/...Pay_Wages_Act_Year2012.pdf · PREFACE...

PREFACE
Industrialisation in India has brought a huge social and economic change which
transformed it from an agrarian society into an industrial one. With the passage of time,
problems relating to payment of wages to persons employed in industry started emerging. To
regulate the exploitation of labour, Govt. of India has enacted the Payment of Wages Act in
the year 1936 after the recommendation of the Royal Commission of Labour.
The Payment of Wages (PW) system serves a useful purpose as it prevents
exploitation of labour and provides necessary cushion to workers as it makes mandatory for
the employer to pay wages to the workers before expiry of a specified day after the last day of
the wage period. Employers cannot withhold wages earned by workers nor can they make
any unauthorized deduction. If payment of wages is delayed or wrongful deductions are
made, workers or their trade unions can file a claim before the Authority under PW Act and
appeal can be filed against the order of the Authority.
In view of the necessity felt for a reliable database for formulation of progressive
labour policies and evaluate their implementation, Labour Bureau, has compiled this annual
report on the working of the Payment of Wages Act, 1936 for the year 2012. The report
contains information like Mandays worked, Average Daily Employment, Gross Wage Bill,
Per Capita Daily Earnings and Per Capita Annual Earnings etc.
Information contained in this volume is based on the annual reports /returns received
as per the Rules framed under Payment of Wages Act- 1936 from the concerned authorities
of the State Governments and Union Territories. The Labour Bureau, therefore, expresses its
gratitude to all of them for their co-operation.
I would like to express my appreciation for the efforts put in by the officers and staff
of the Wages Section of Labour Bureau, Chandigarh, whose names appear in Annexure-V of
this Report for bringing out the publication.
The views expressed in this publication are not necessarily those of the Ministry of
Labour and Employment, Government of India. Suggestions for improvement are welcome.
DALJEET SINGH
DIRECTOR GENERAL
CHANDIGARH
Dated: 25.02.2015
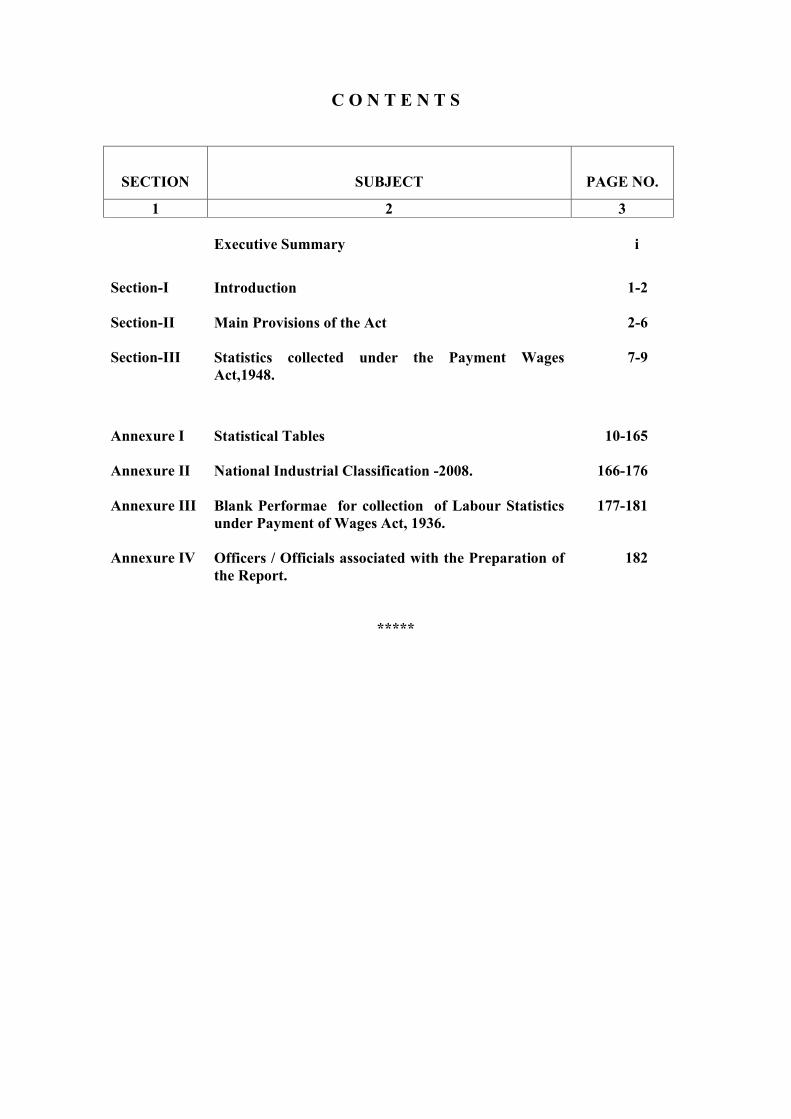
C O N T E N T S
SECTION
SUBJECT
PAGE NO.
1 2 3 Executive Summary i
Section-I Introduction
1-2
Section-II Main Provisions of the Act
2-6
Section-III Statistics collected under the Payment Wages Act,1948.
7-9
Annexure I Statistical Tables
10-165
Annexure II National Industrial Classification -2008.
166-176
Annexure III Blank Performae for collection of Labour Statistics under Payment of Wages Act, 1936.
177-181
Annexure IV Officers / Officials associated with the Preparation of the Report.
182
*****
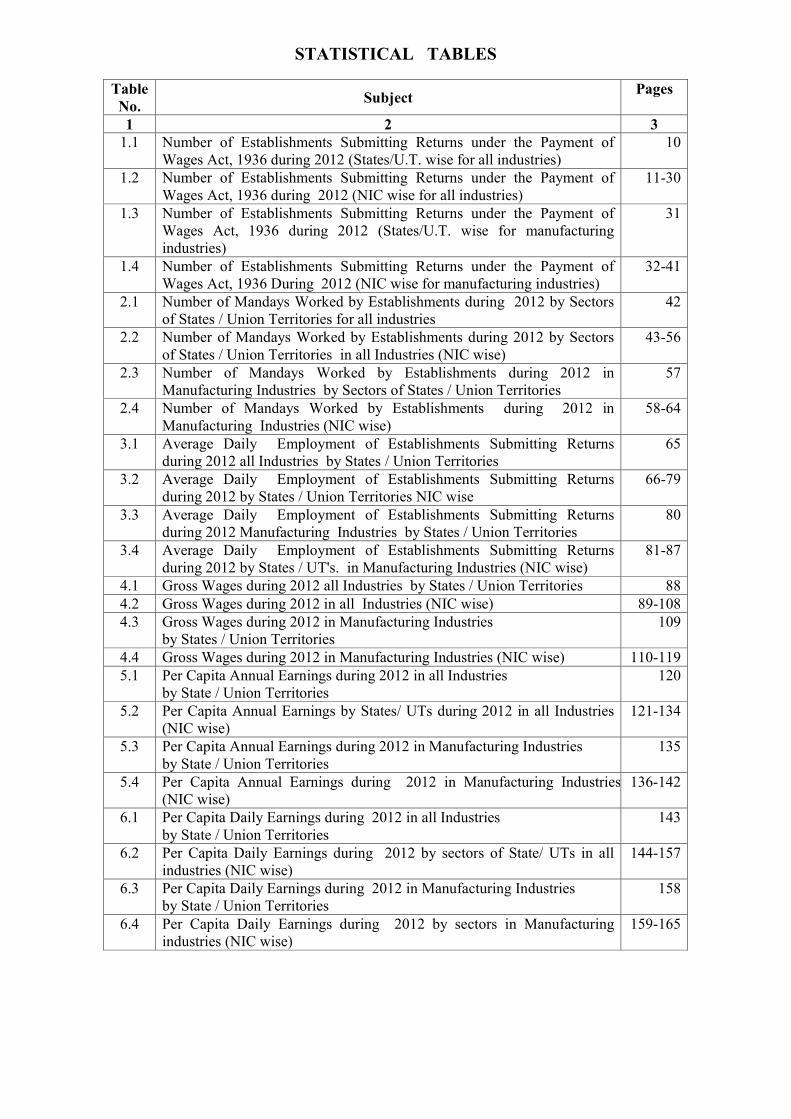
STATISTICAL TABLES
Table No.
Subject Pages
1 2 3
1.1 Number of Establishments Submitting Returns under the Payment of Wages Act, 1936 during 2012 (States/U.T. wise for all industries)
10
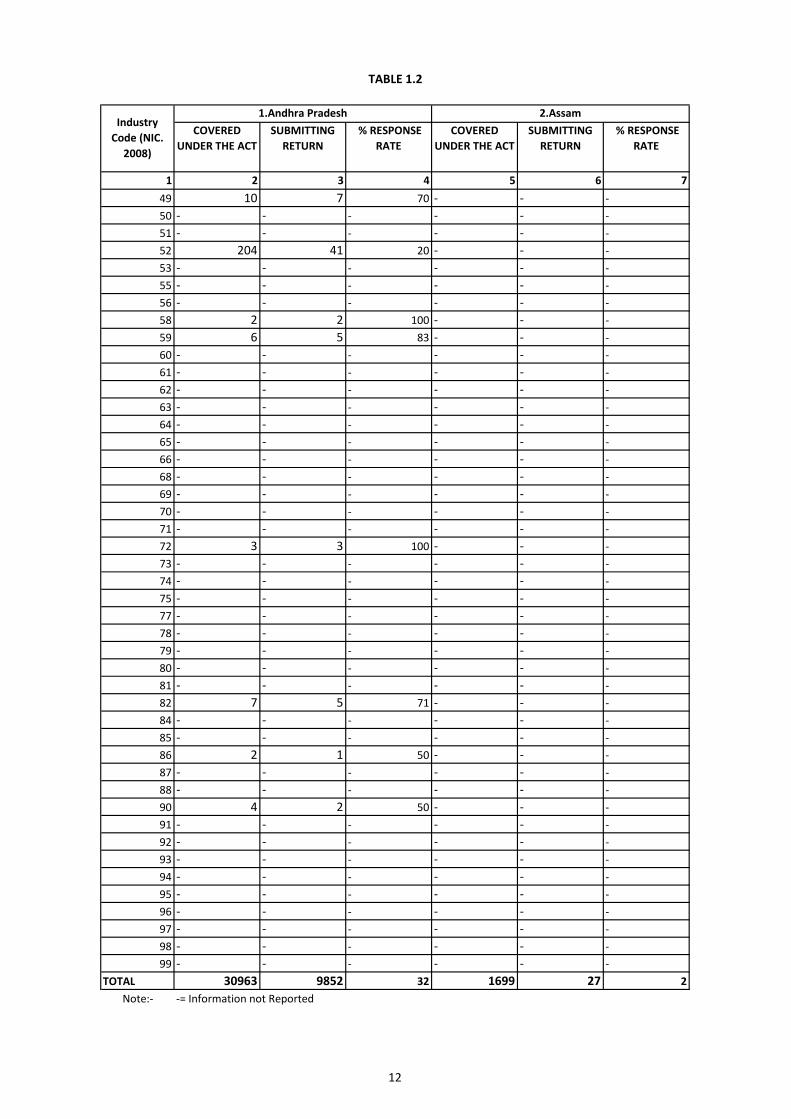
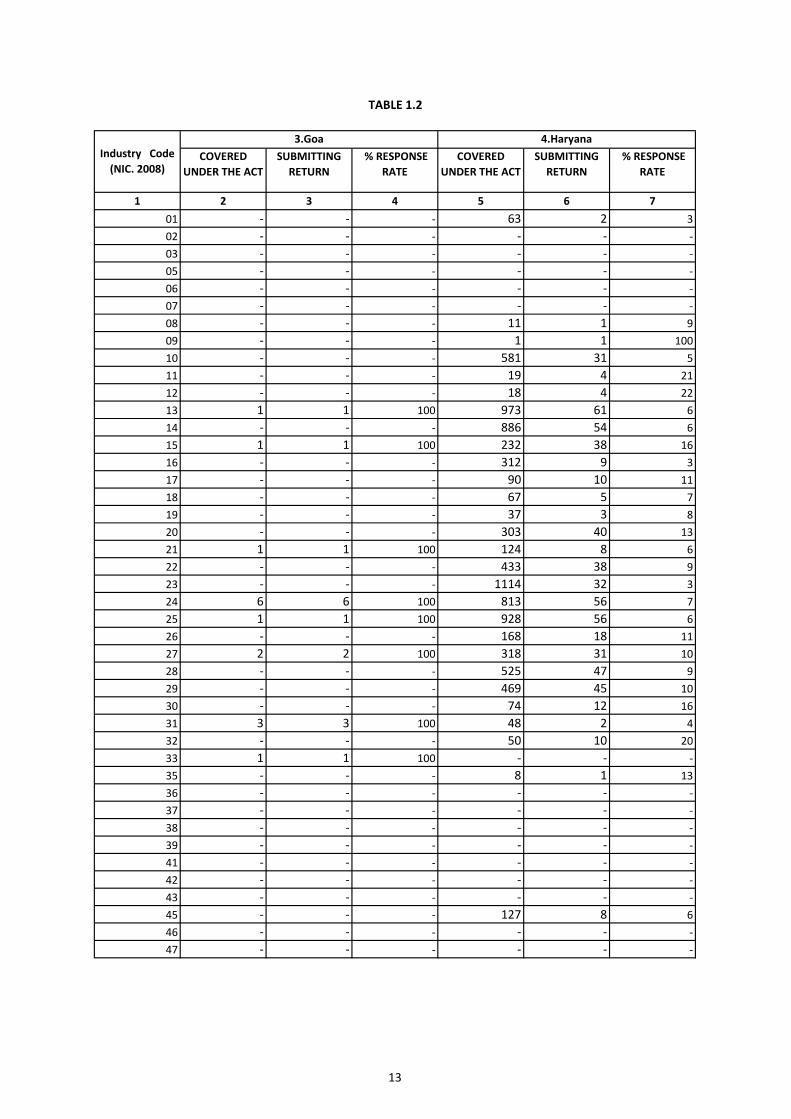
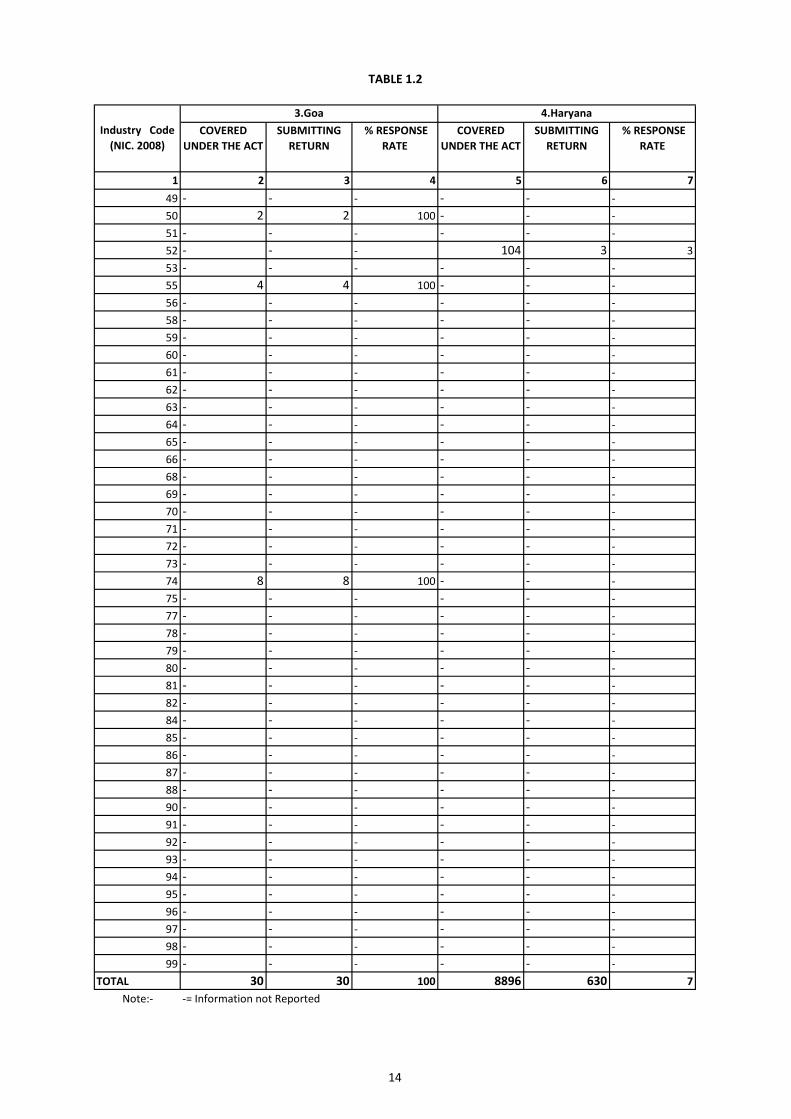
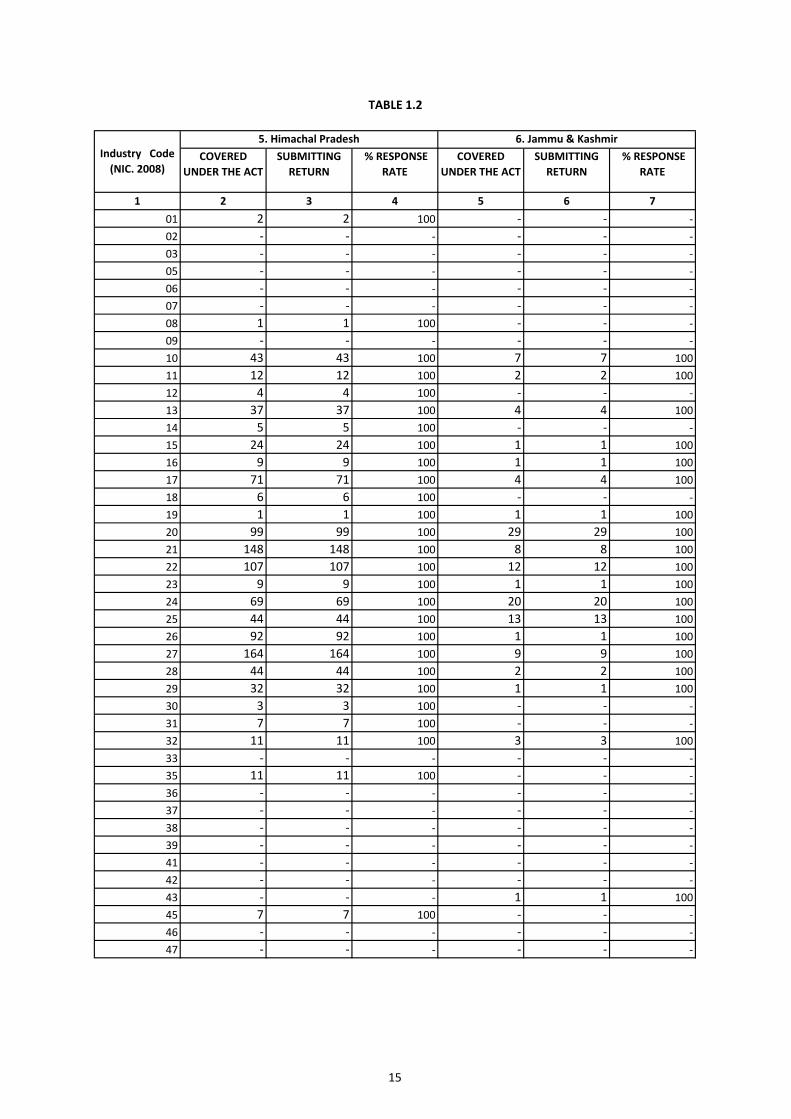
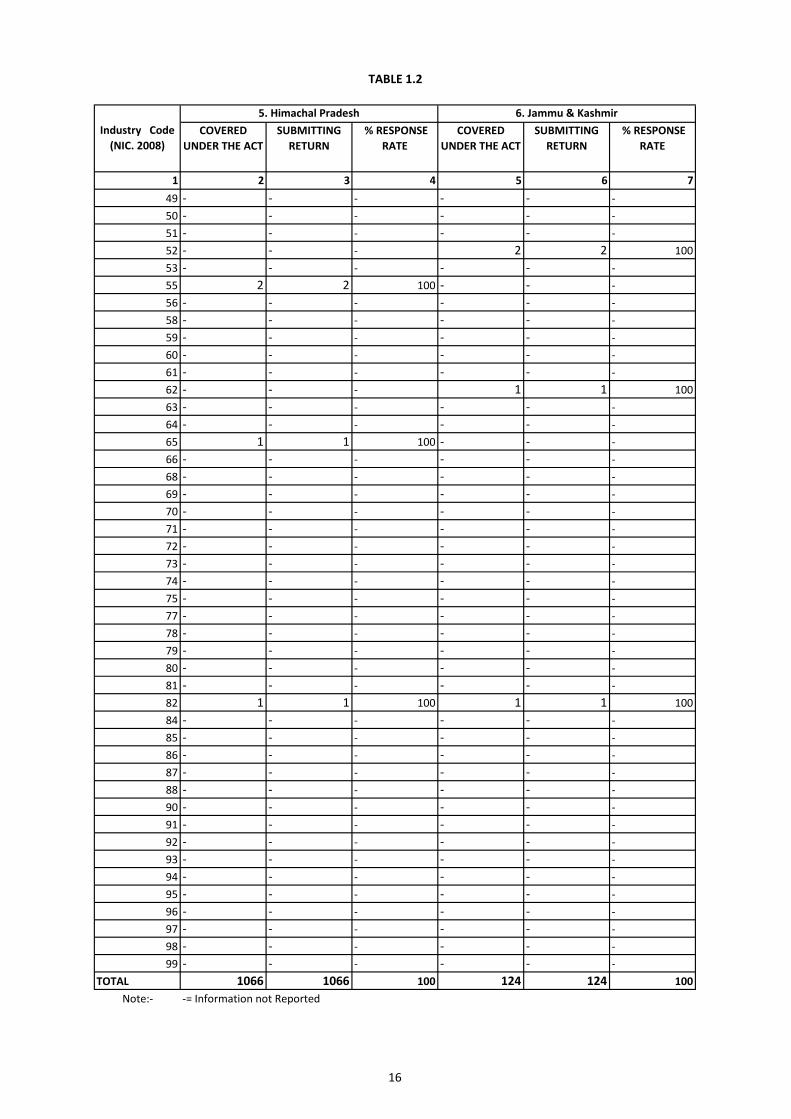
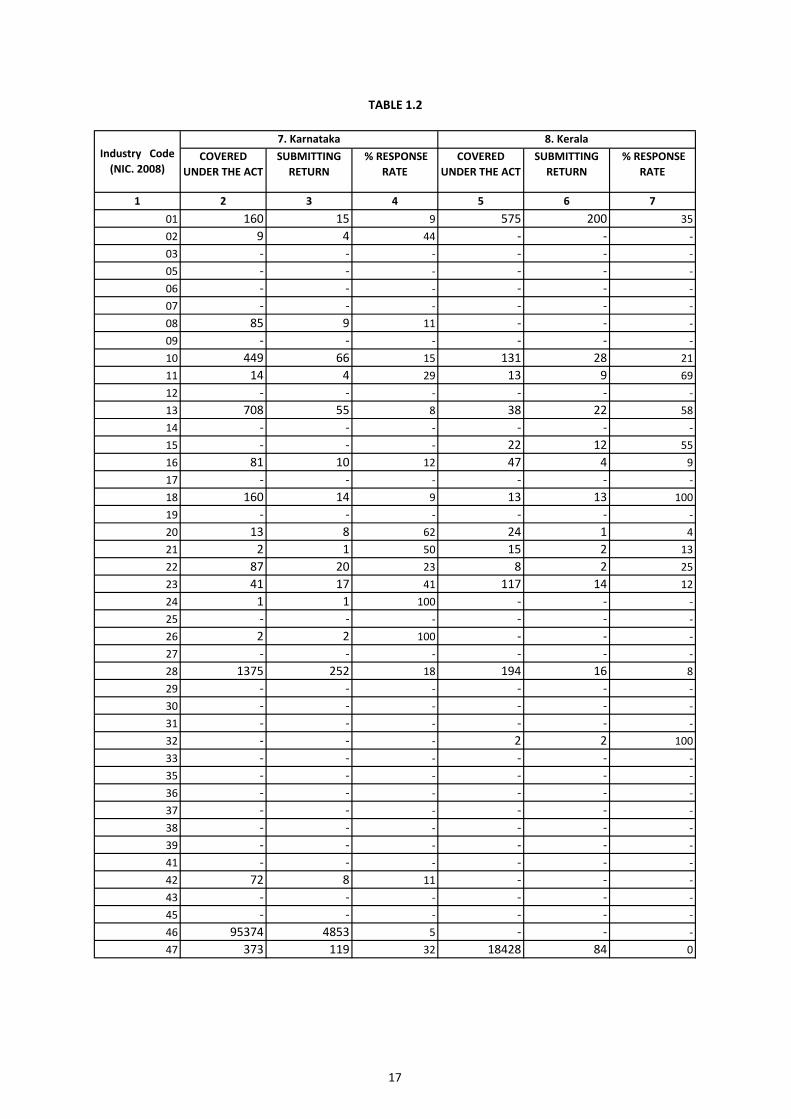
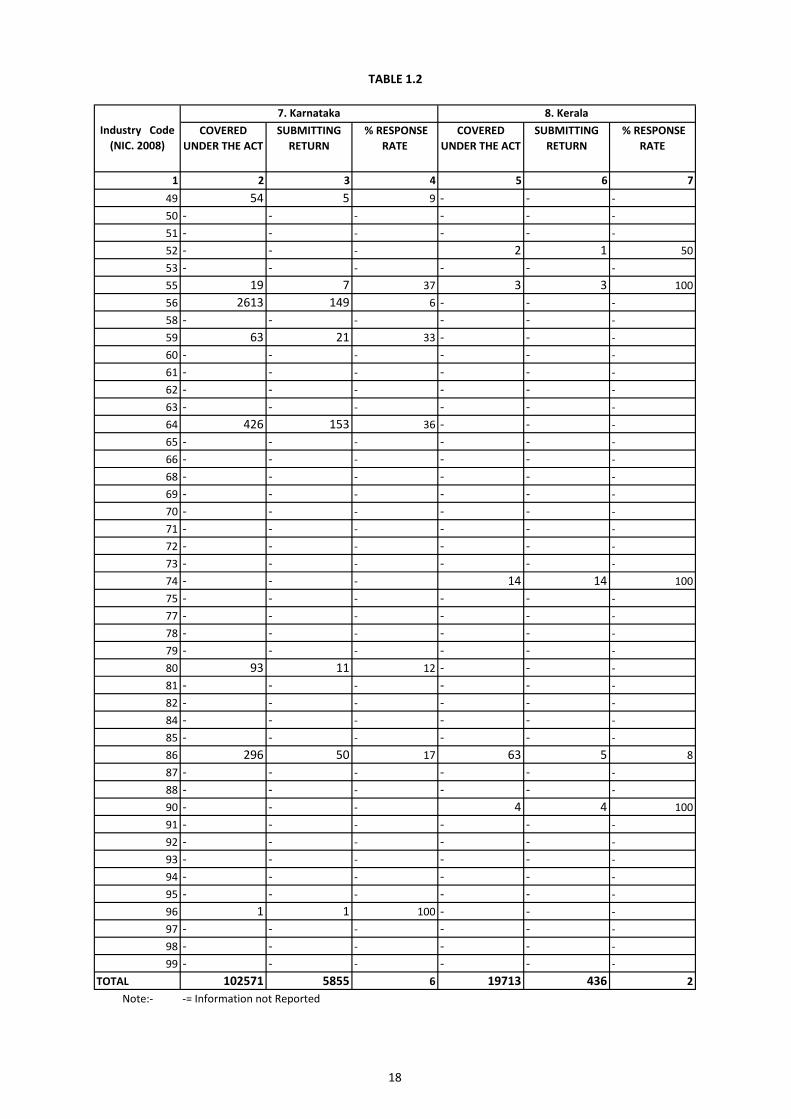
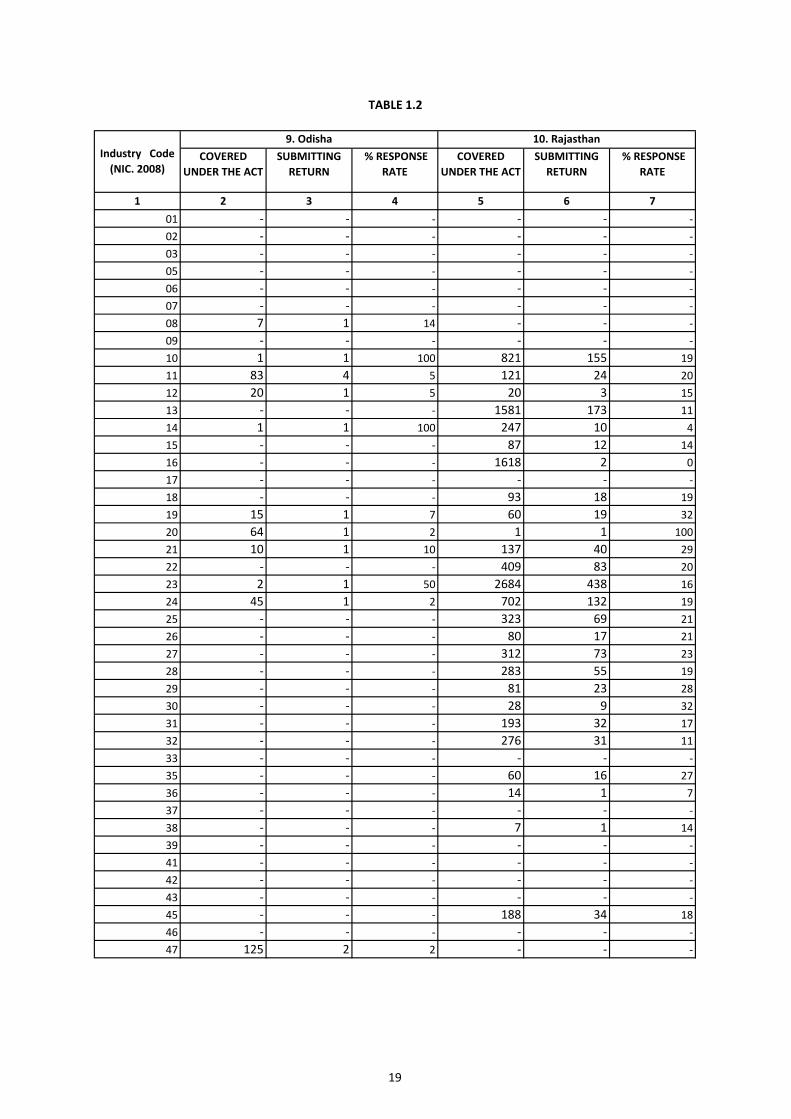
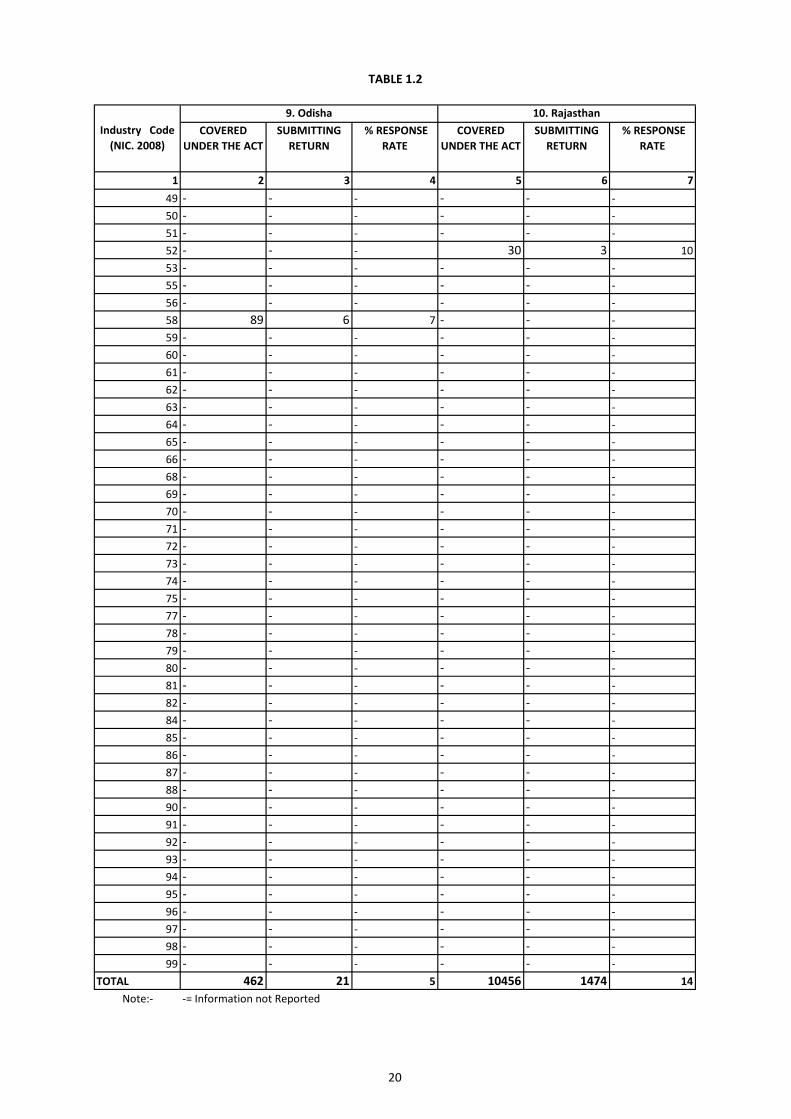
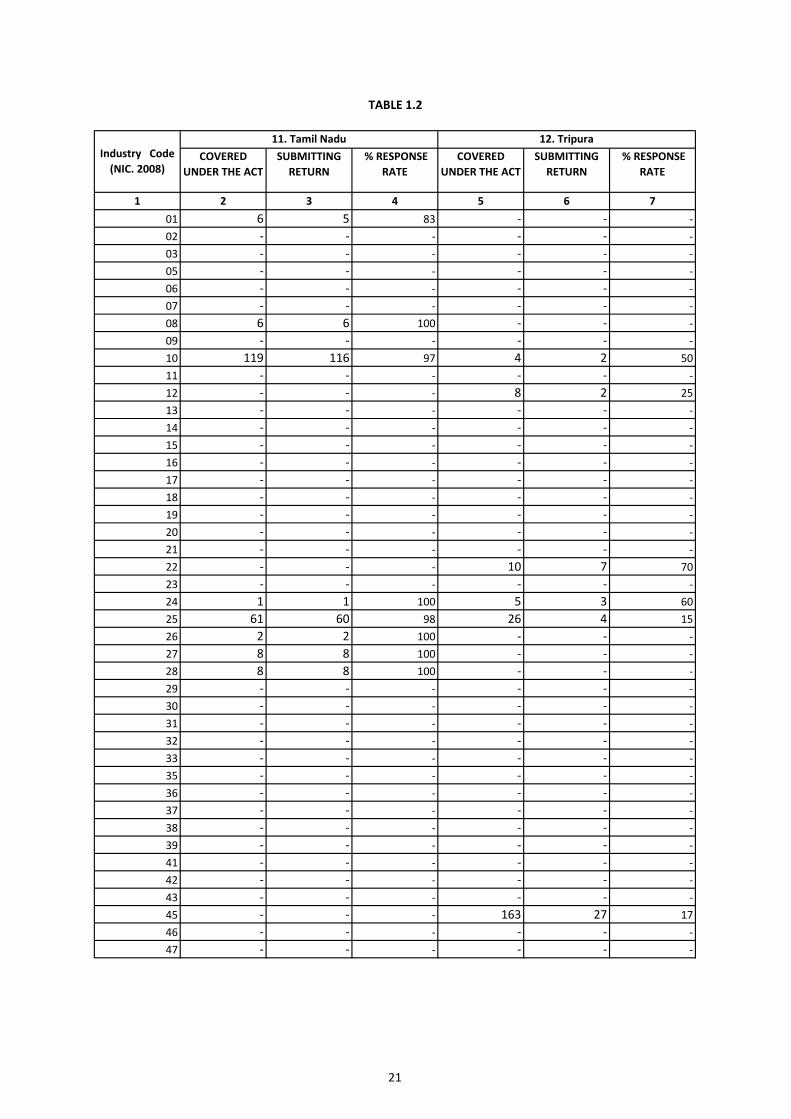
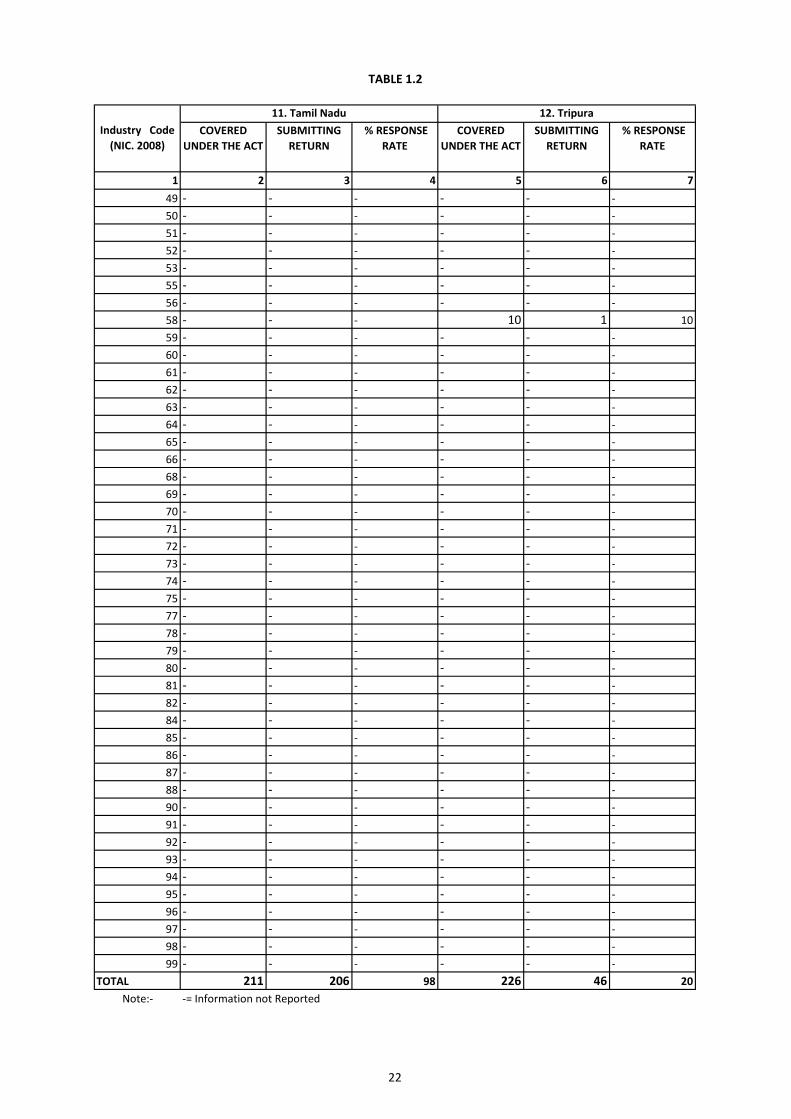
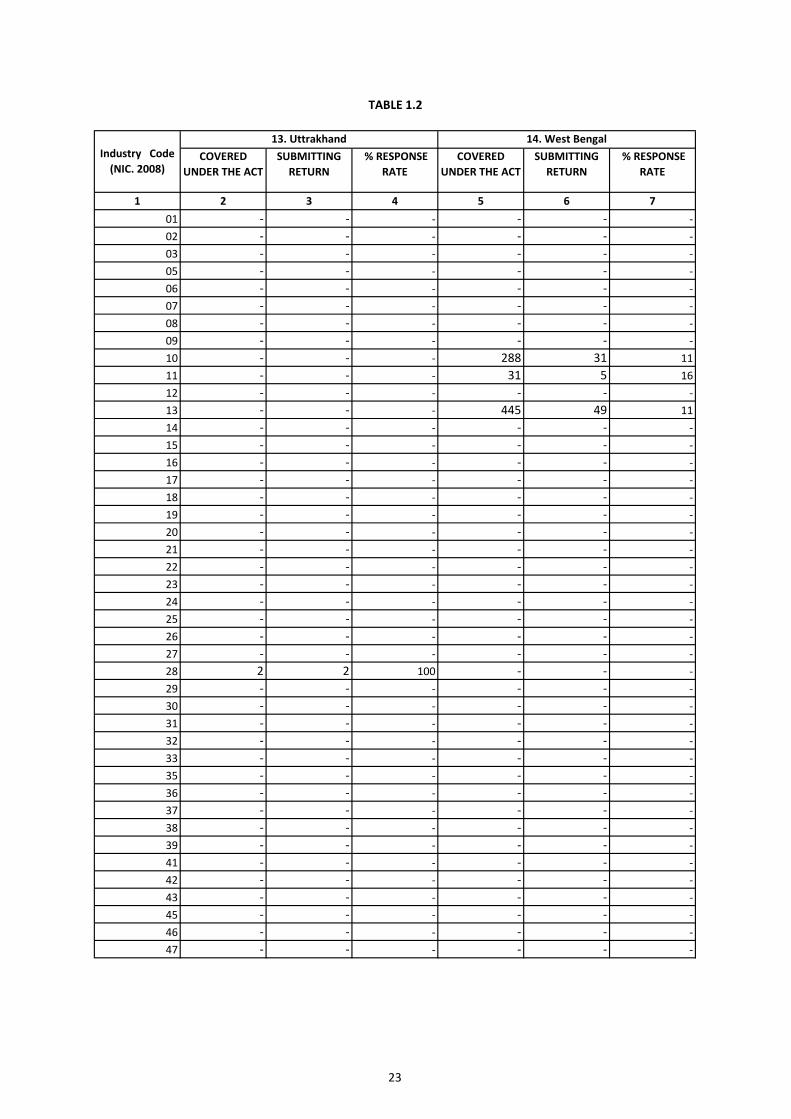
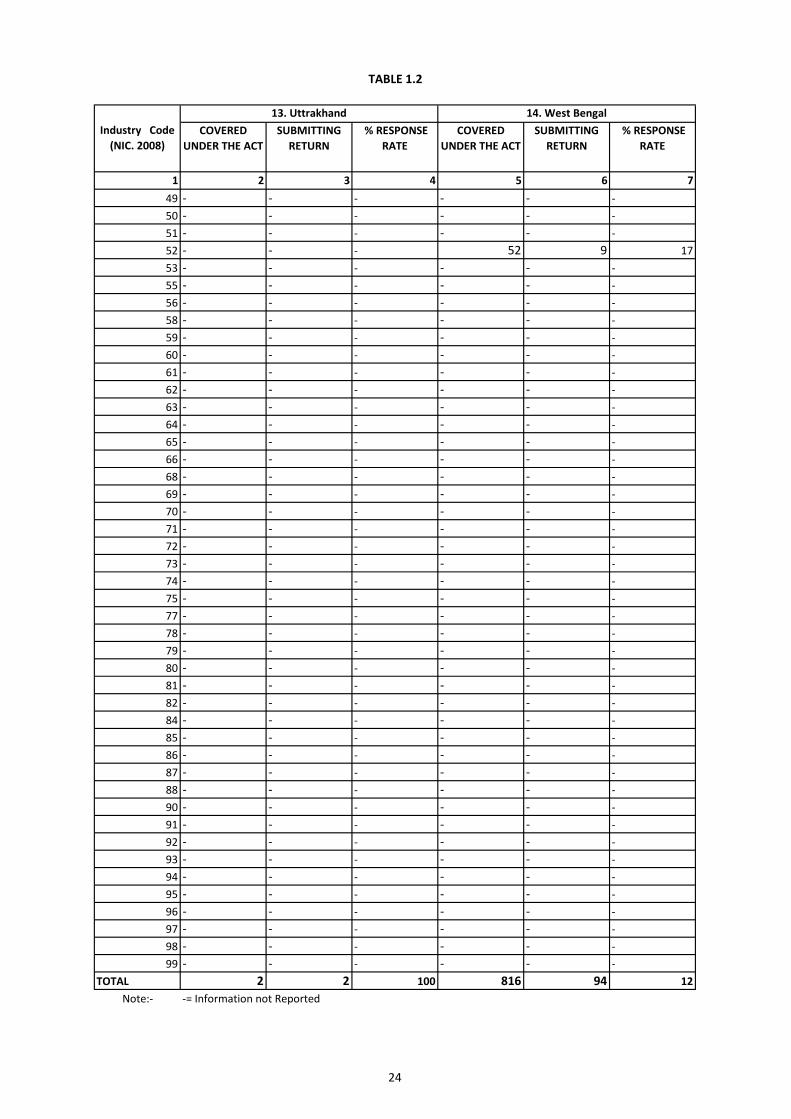
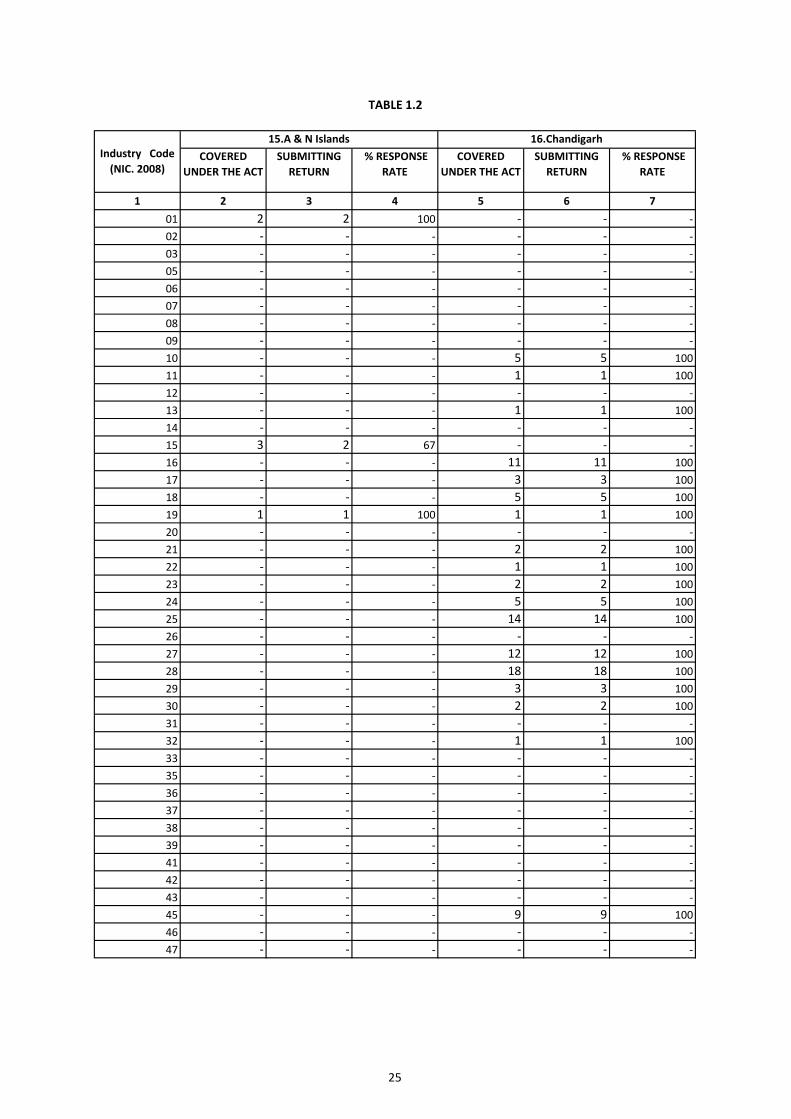
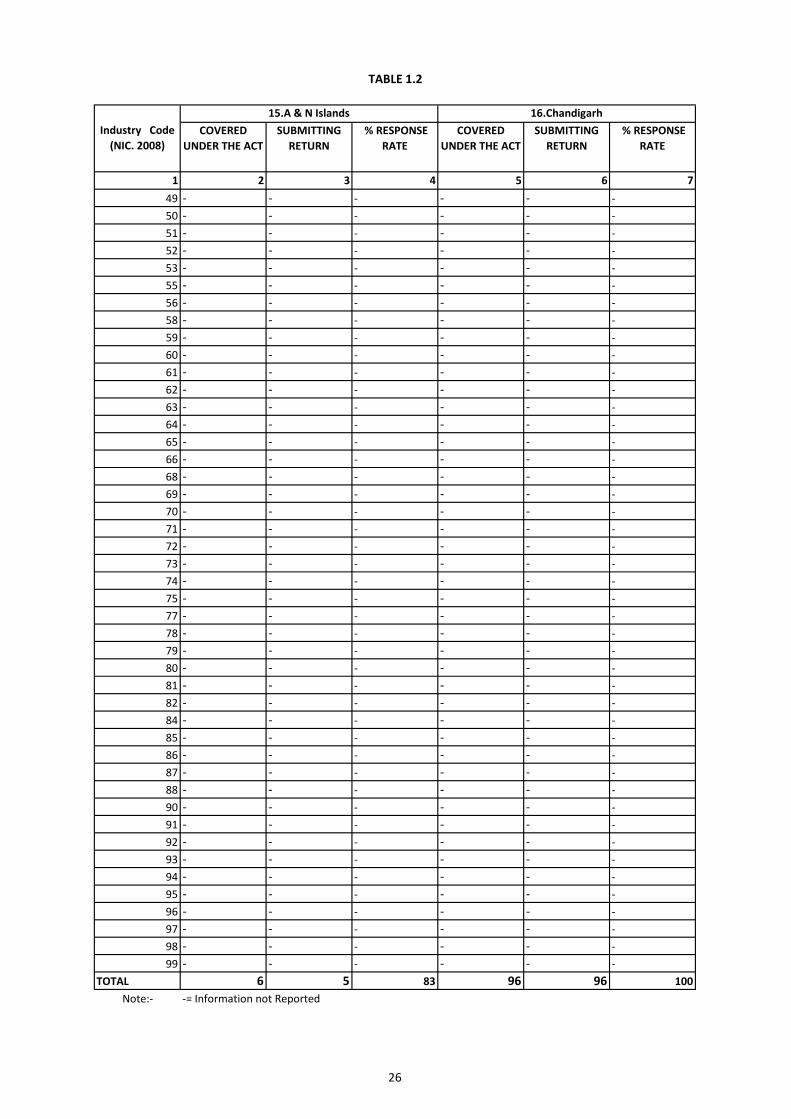
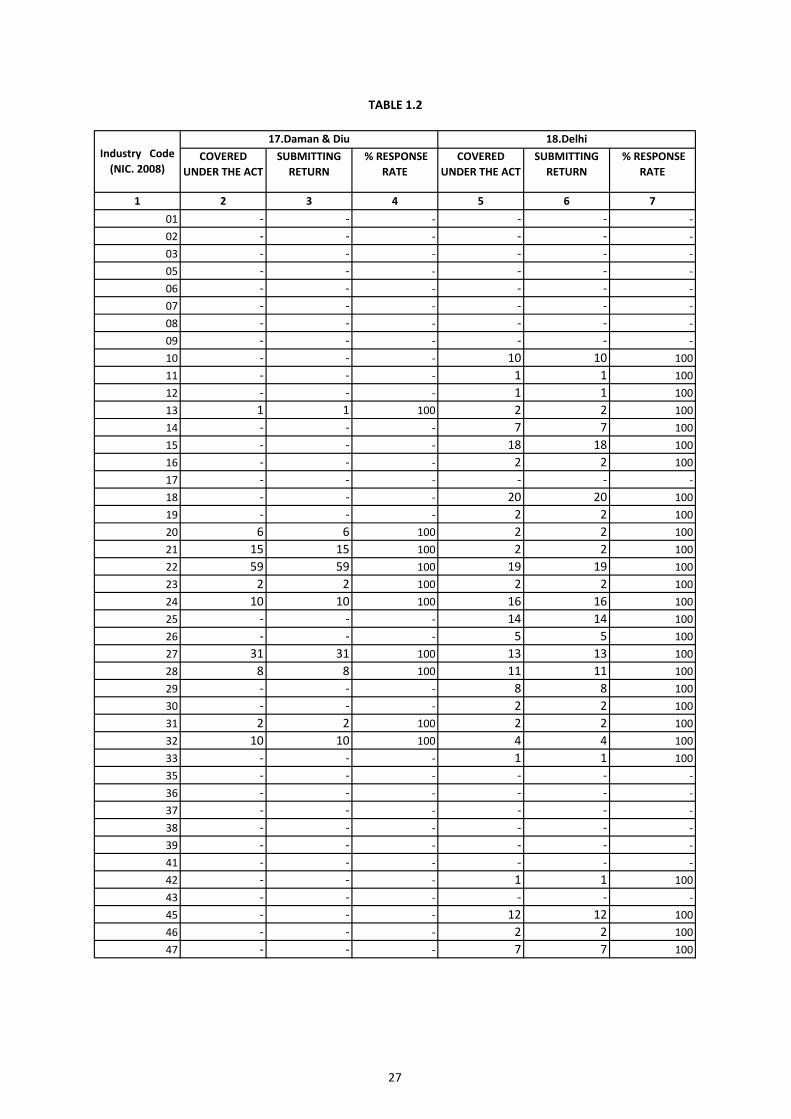
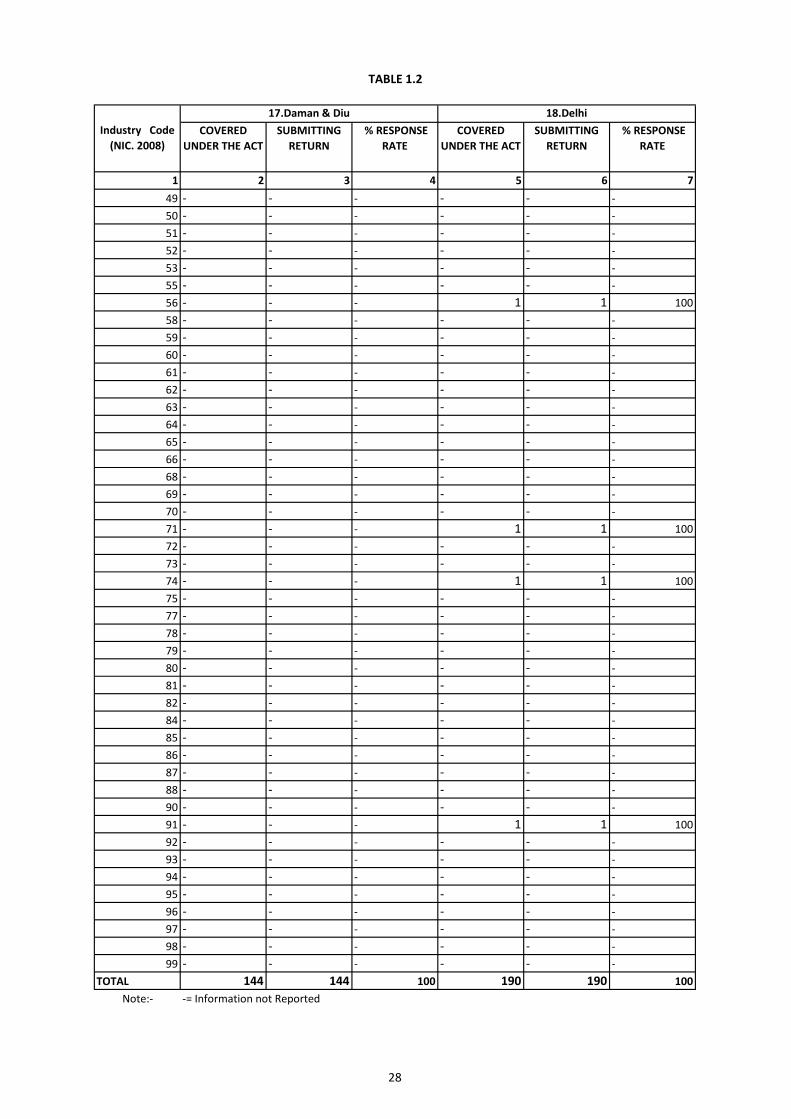
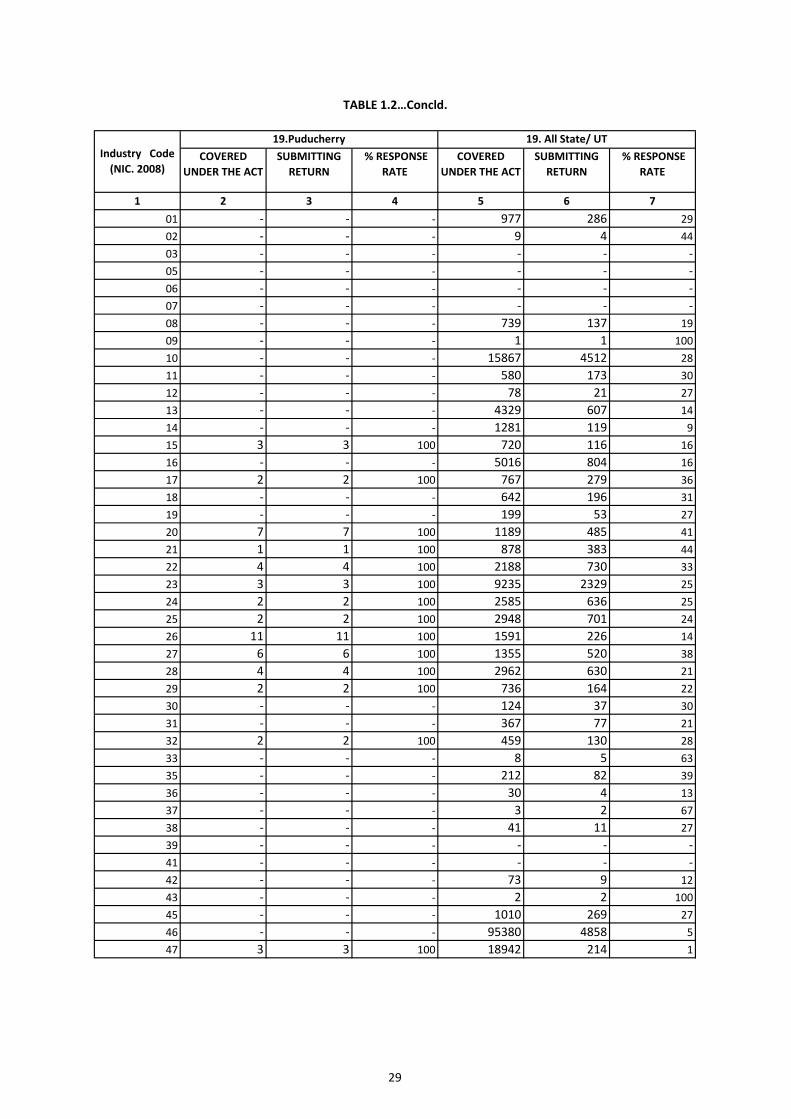
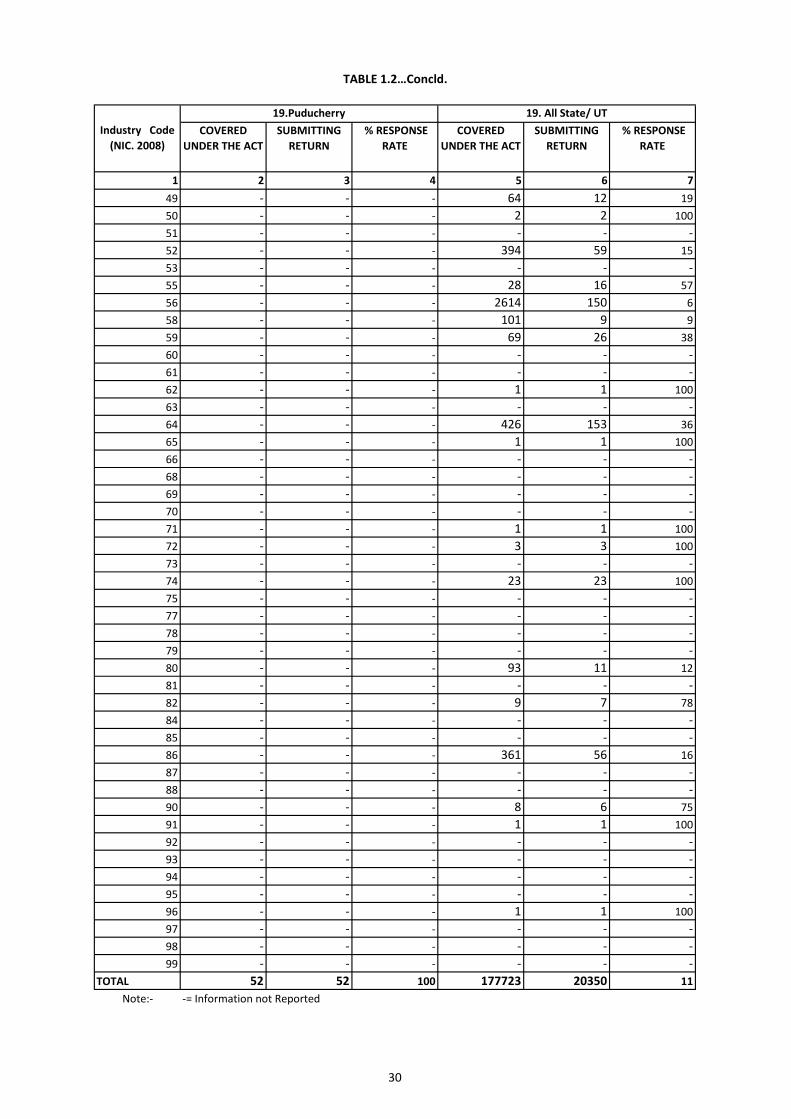
1.2 Number of Establishments Submitting Returns under the Payment of Wages Act, 1936 during 2012 (NIC wise for all industries)
11-30
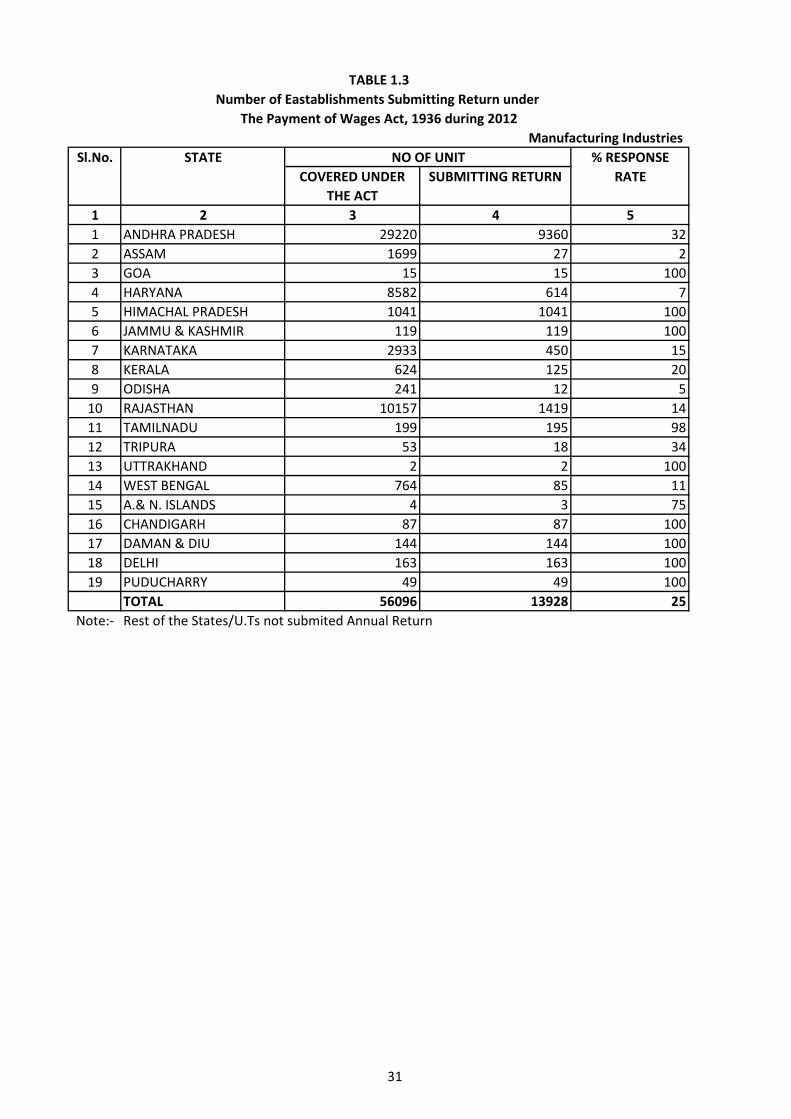
1.3 Number of Establishments Submitting Returns under the Payment of Wages Act, 1936 during 2012 (States/U.T. wise for manufacturing industries)
31
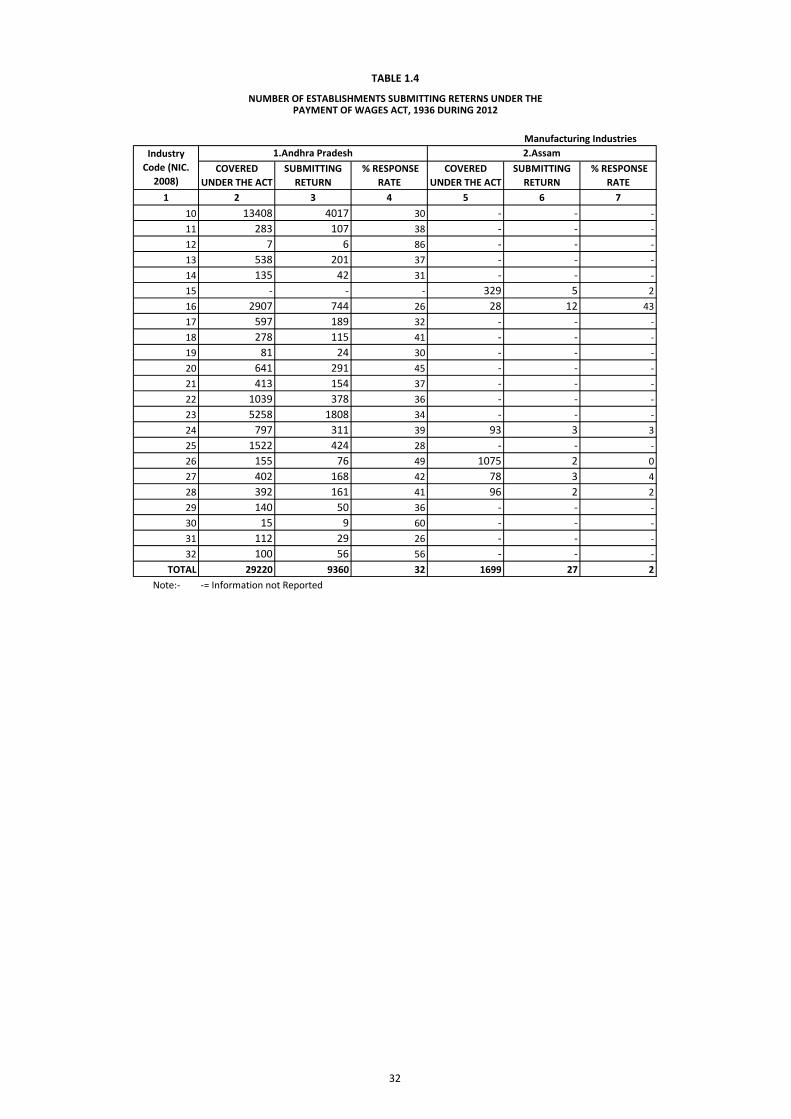
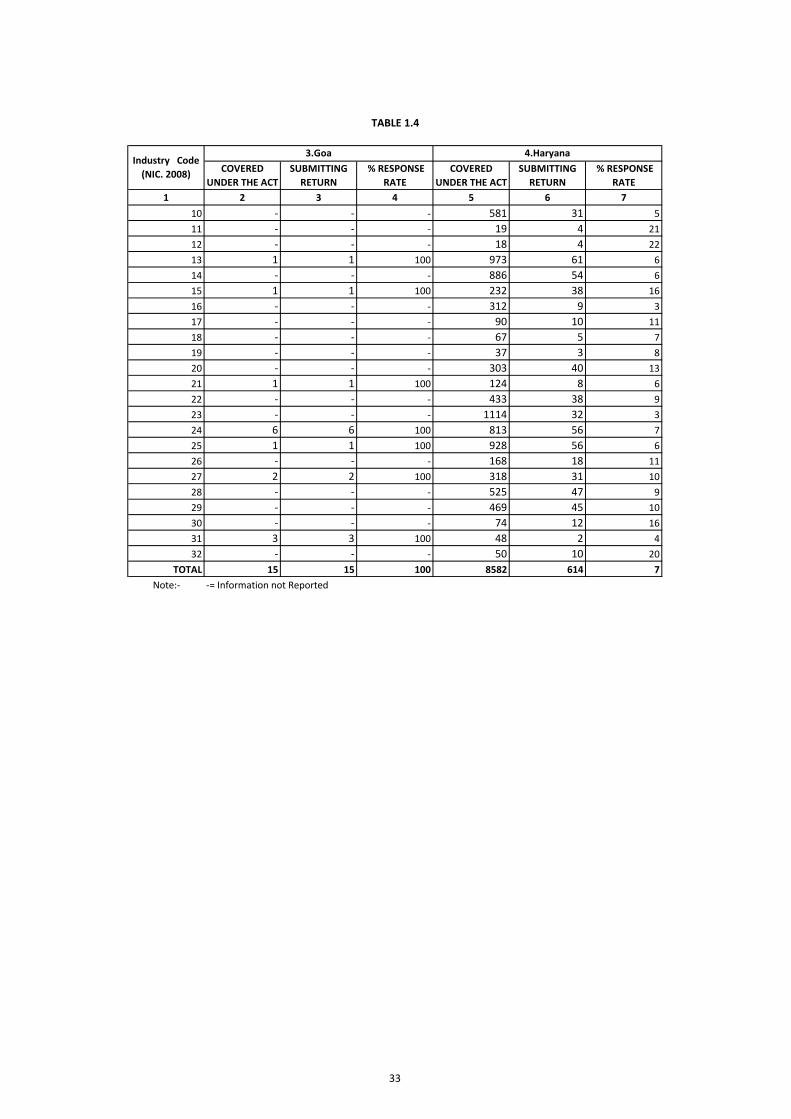
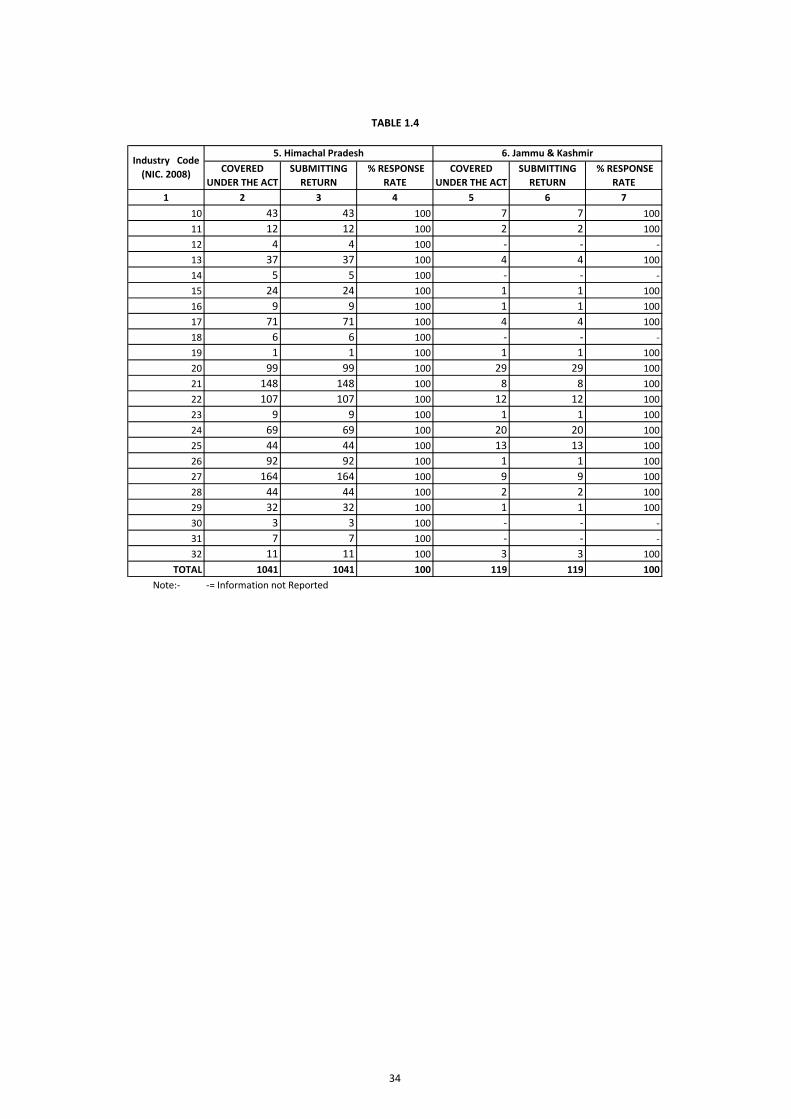
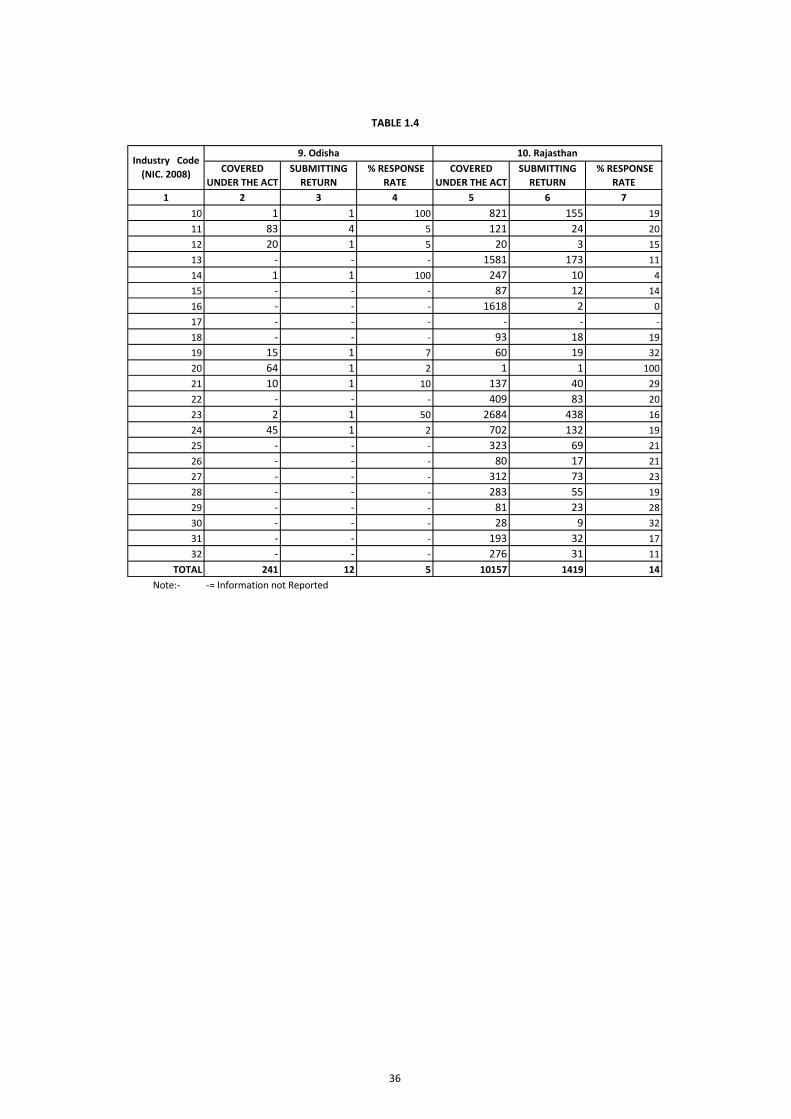
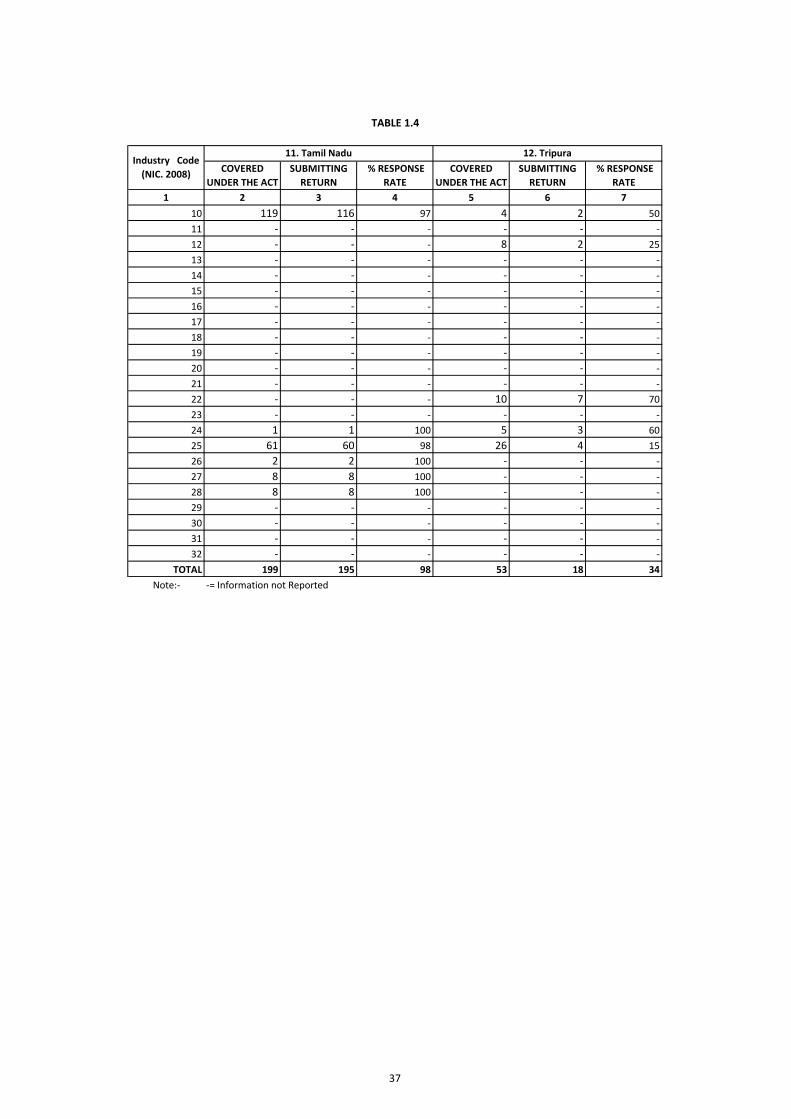
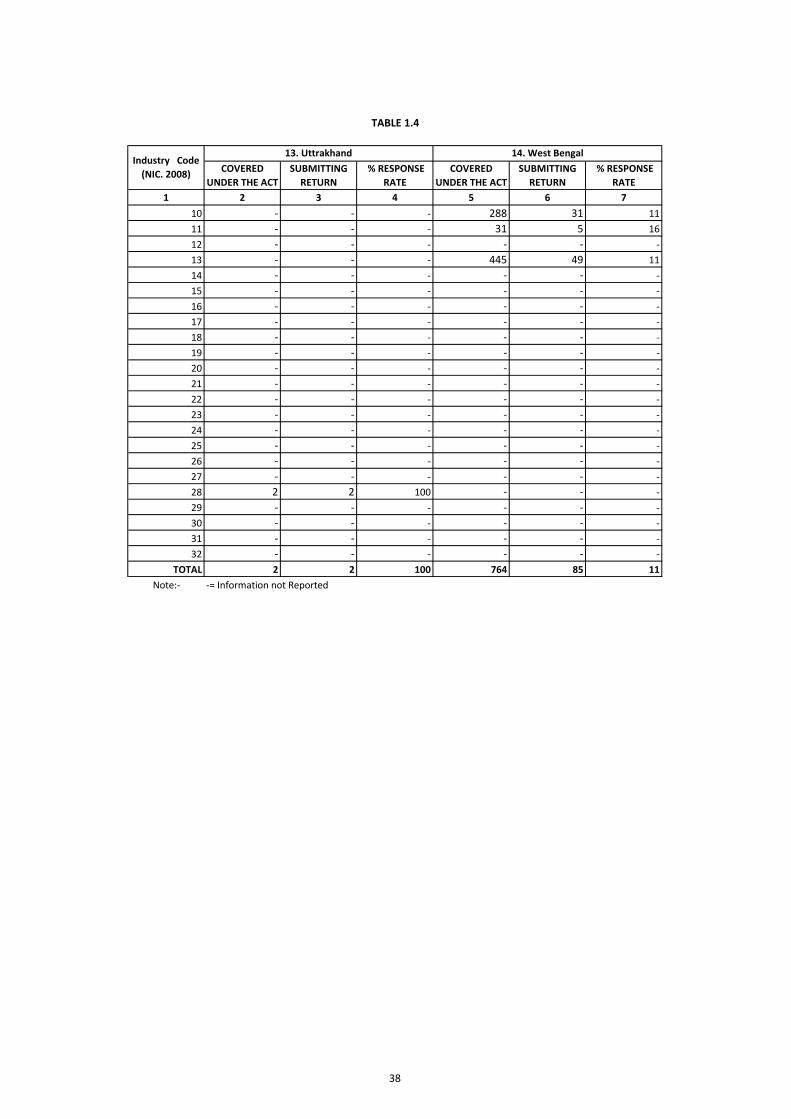
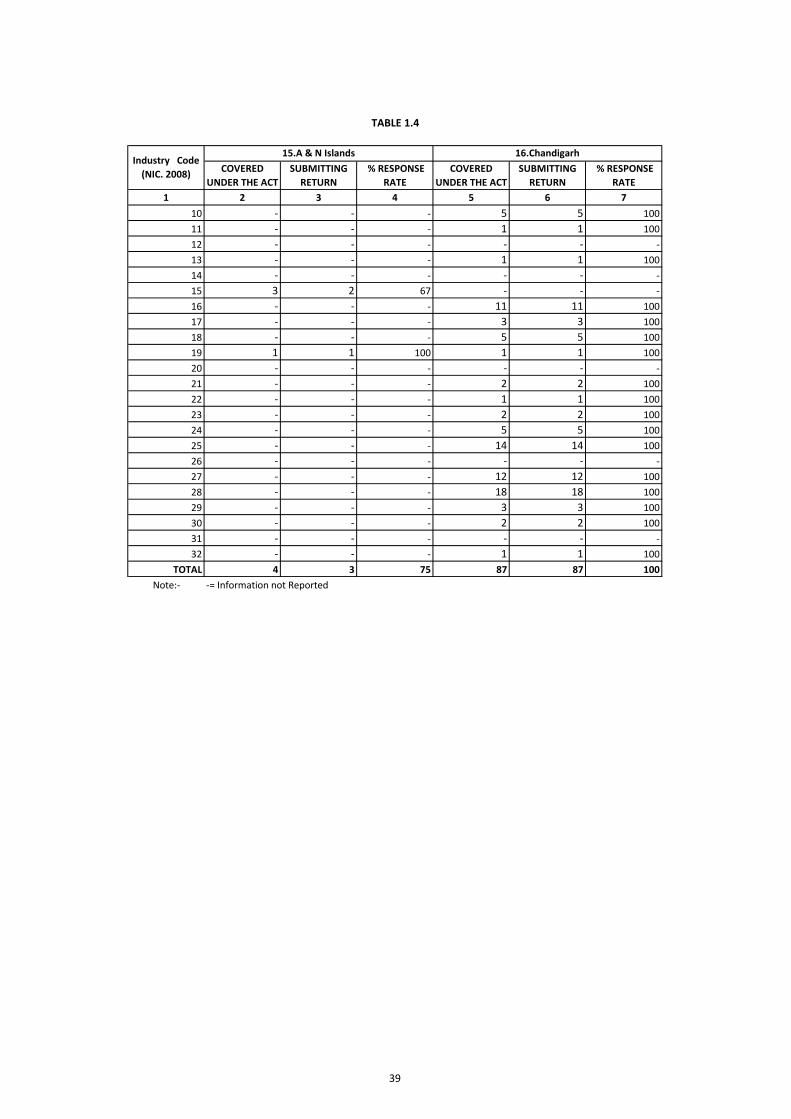
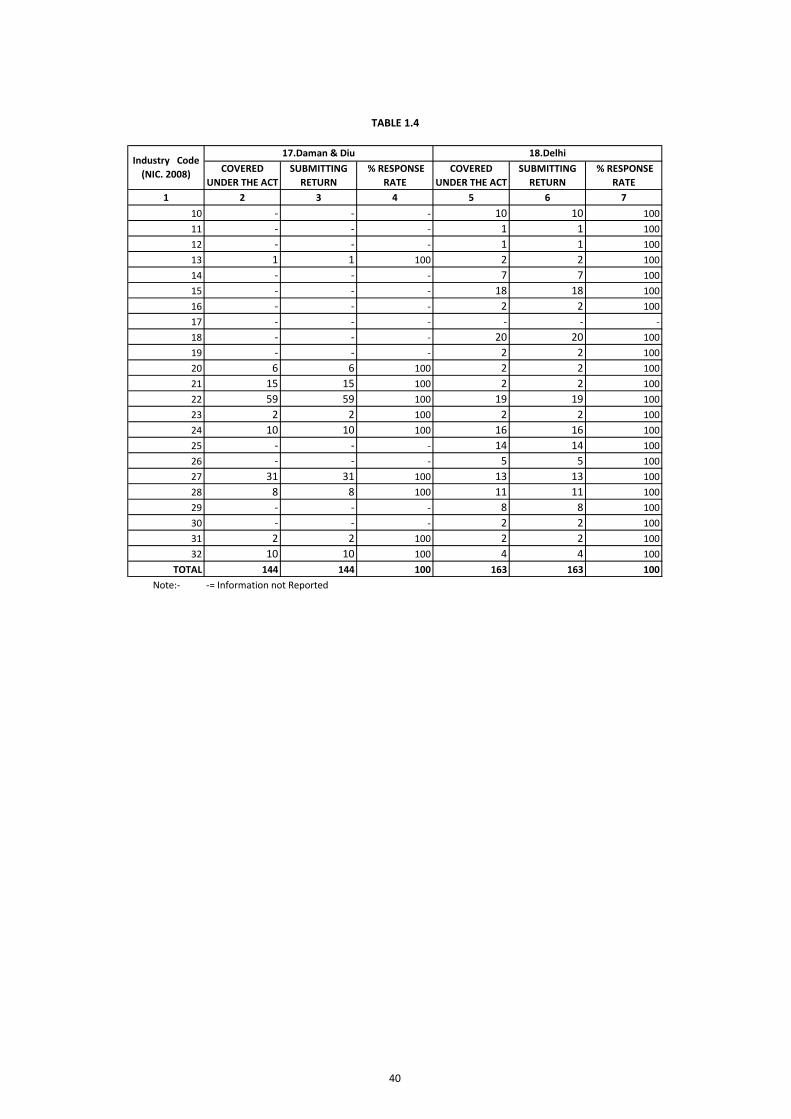
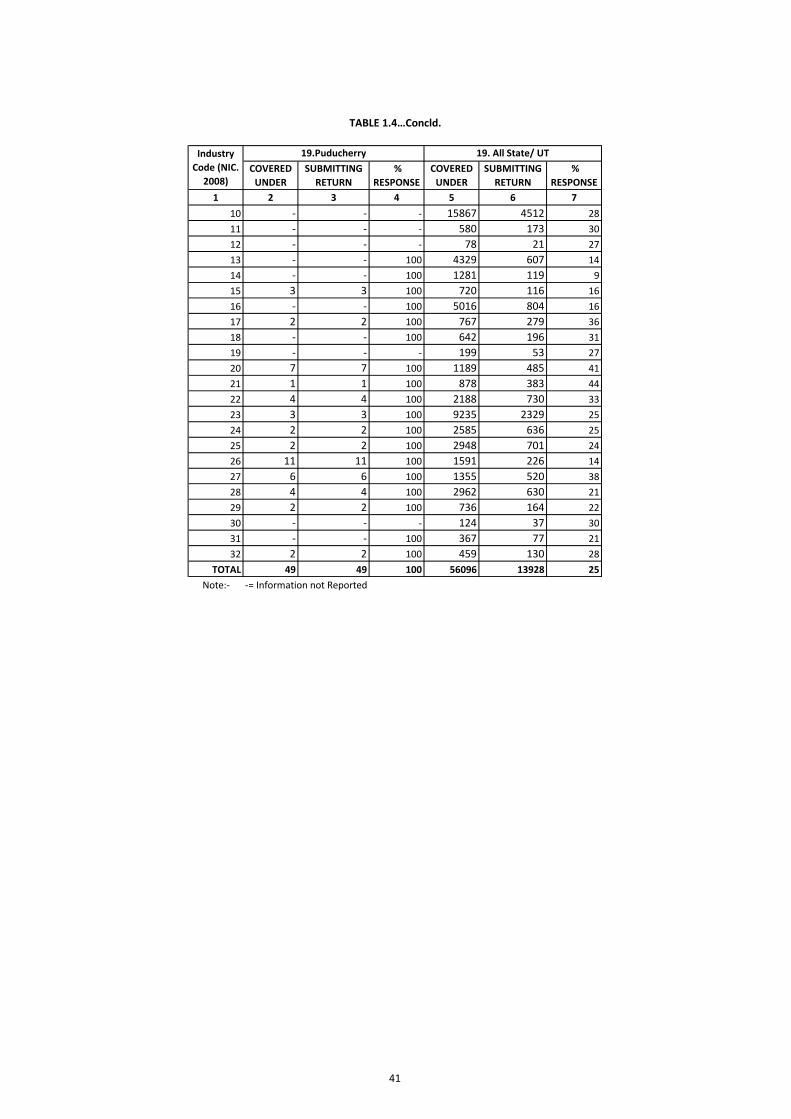
1.4 Number of Establishments Submitting Returns under the Payment of Wages Act, 1936 During 2012 (NIC wise for manufacturing industries)
32-41
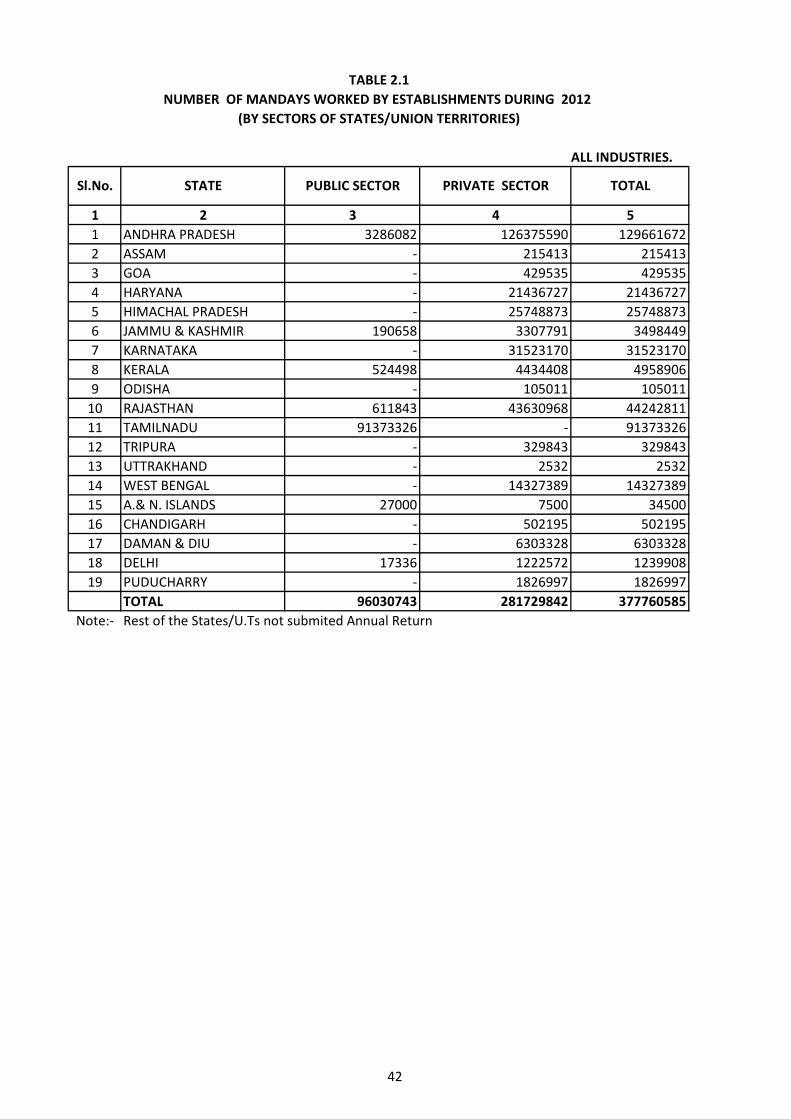
2.1 Number of Mandays Worked by Establishments during 2012 by Sectors of States / Union Territories for all industries
42
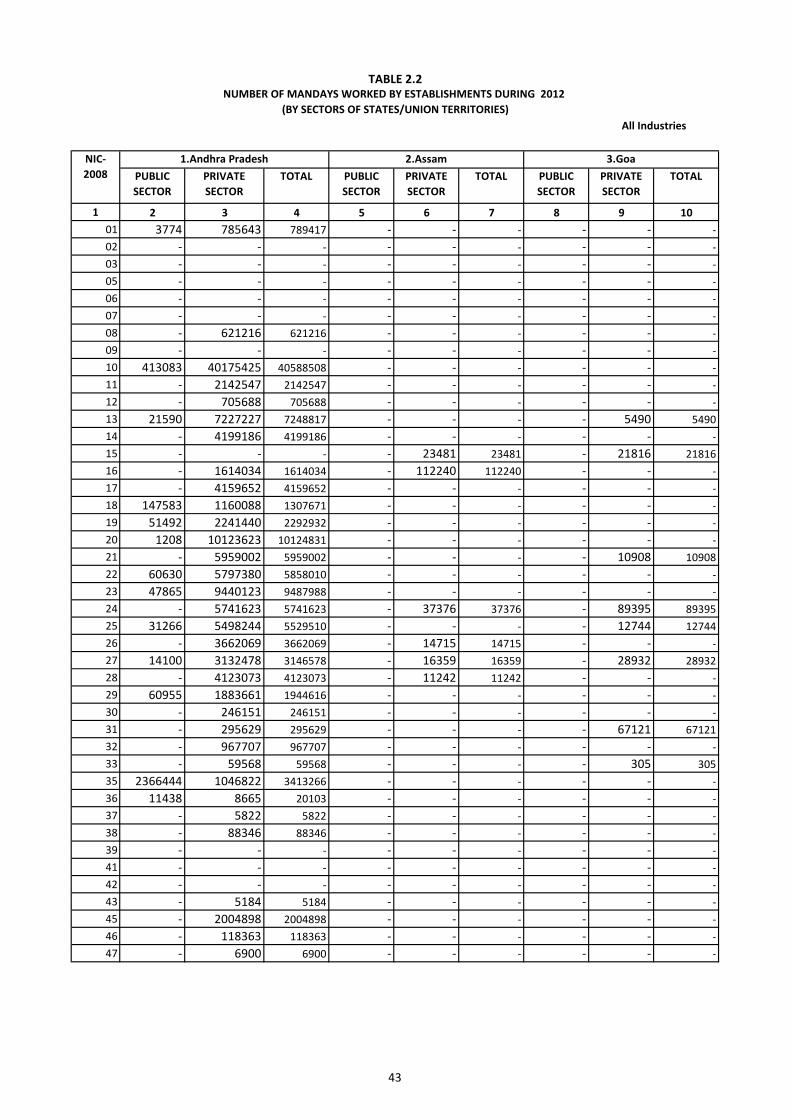
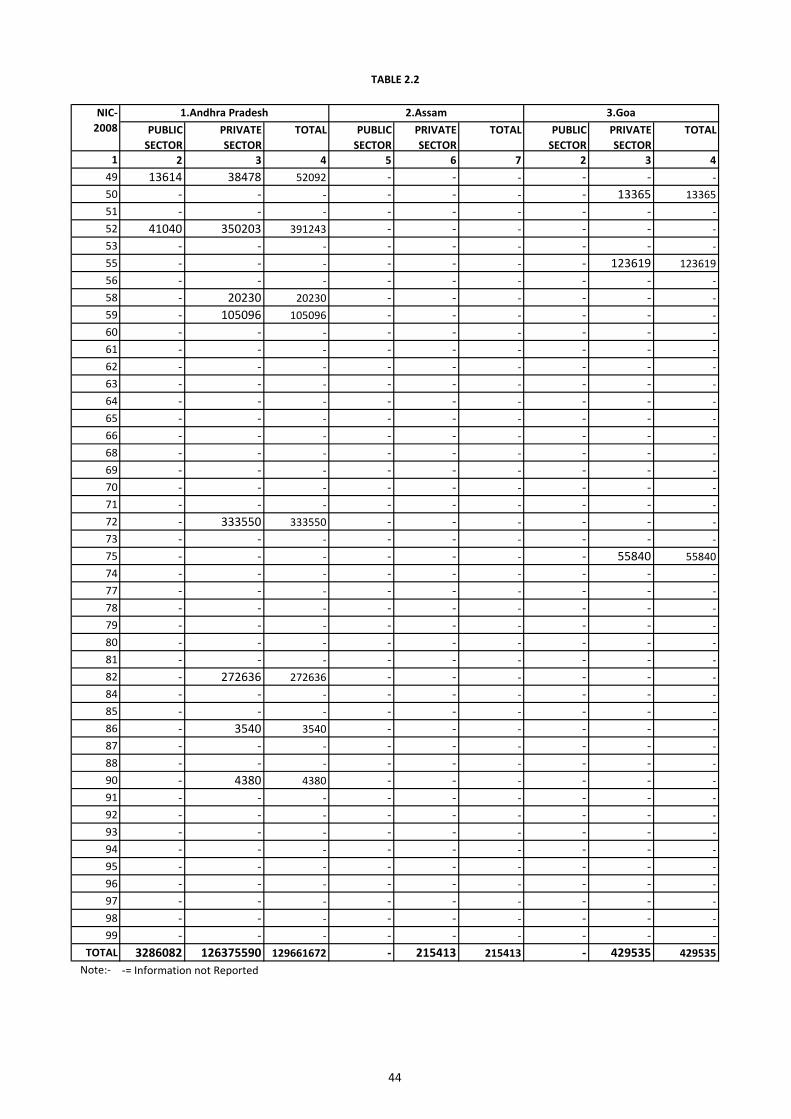
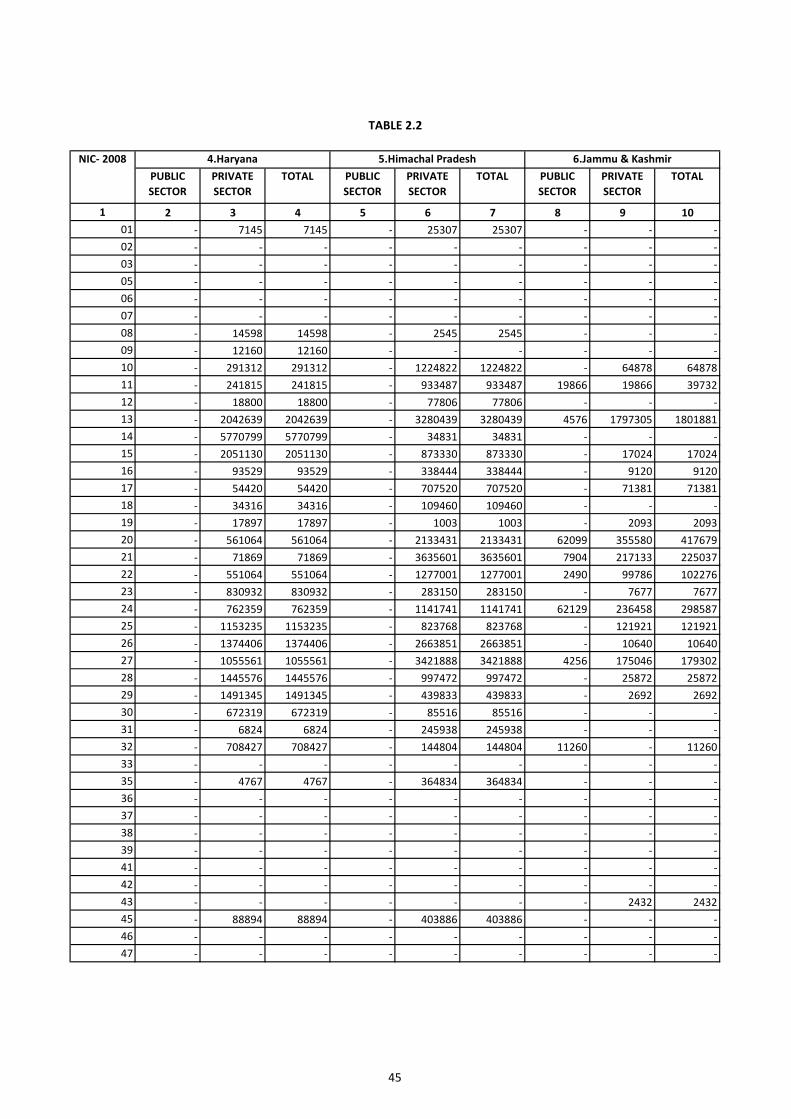
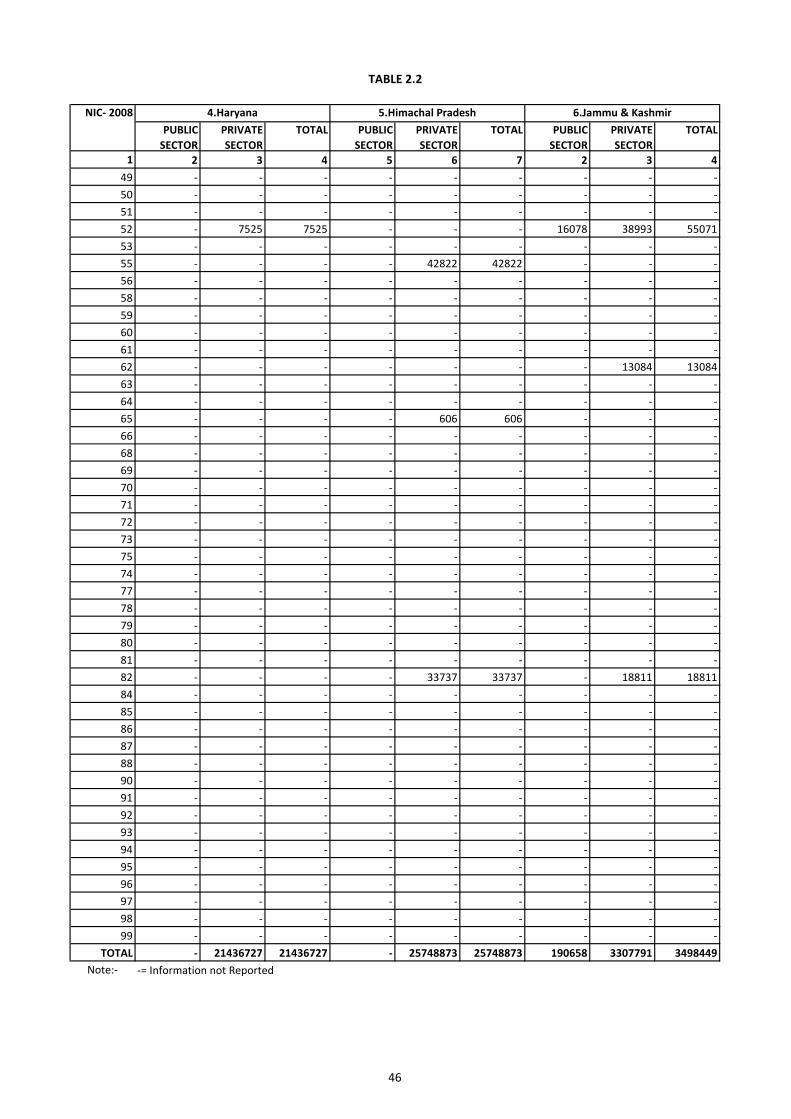
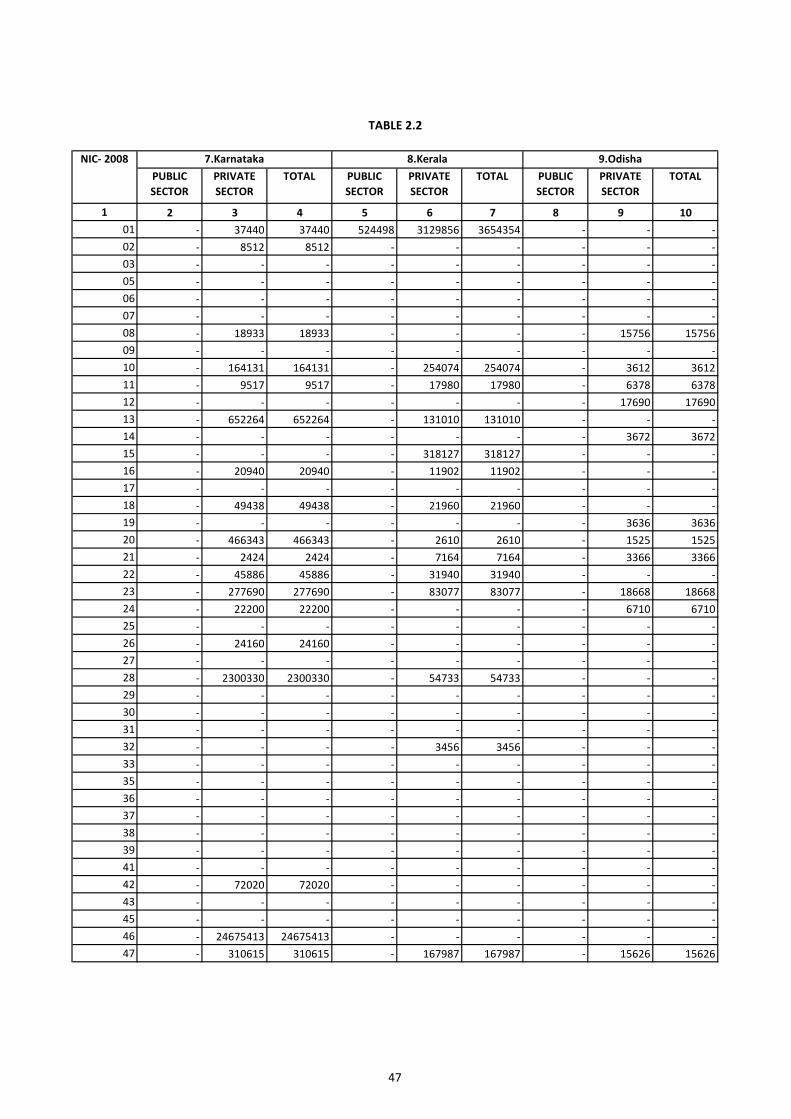
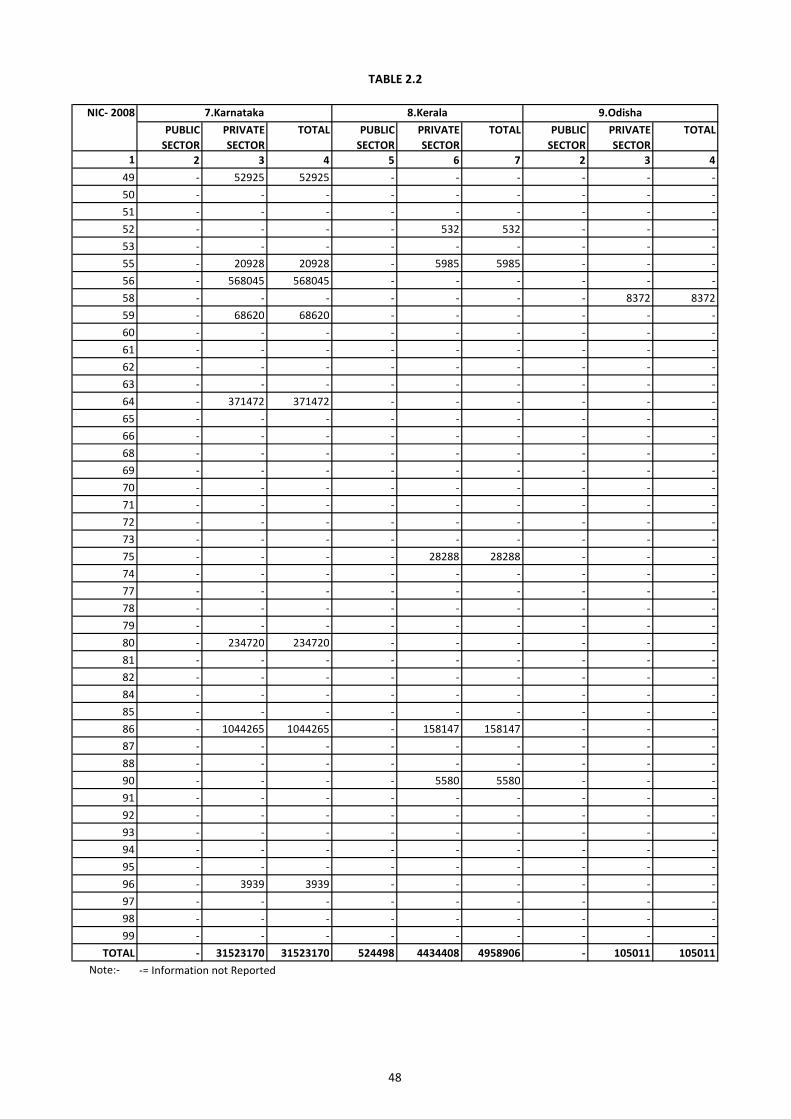
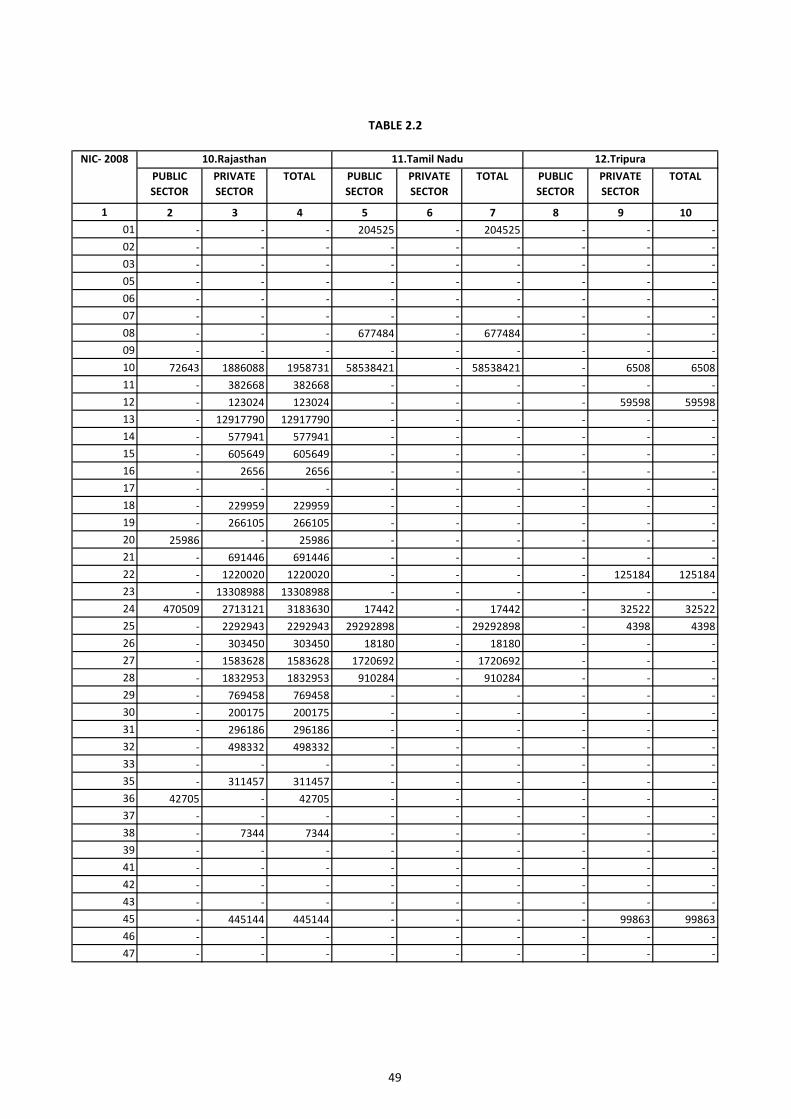
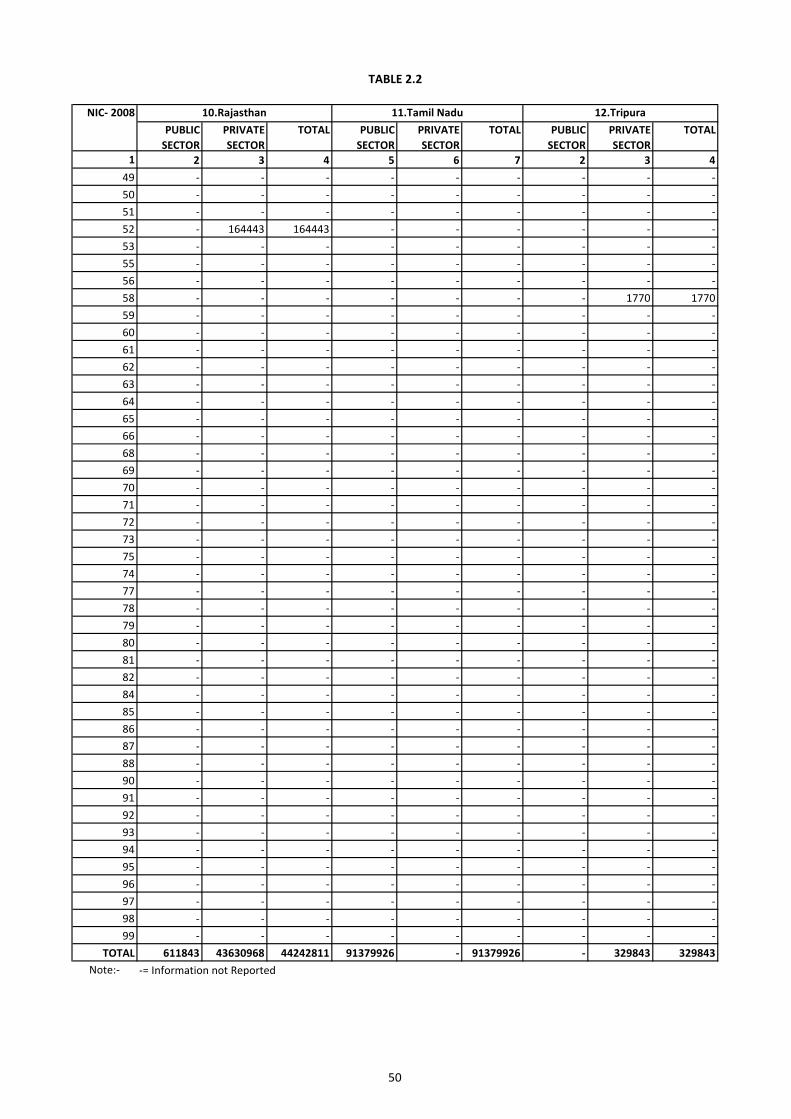
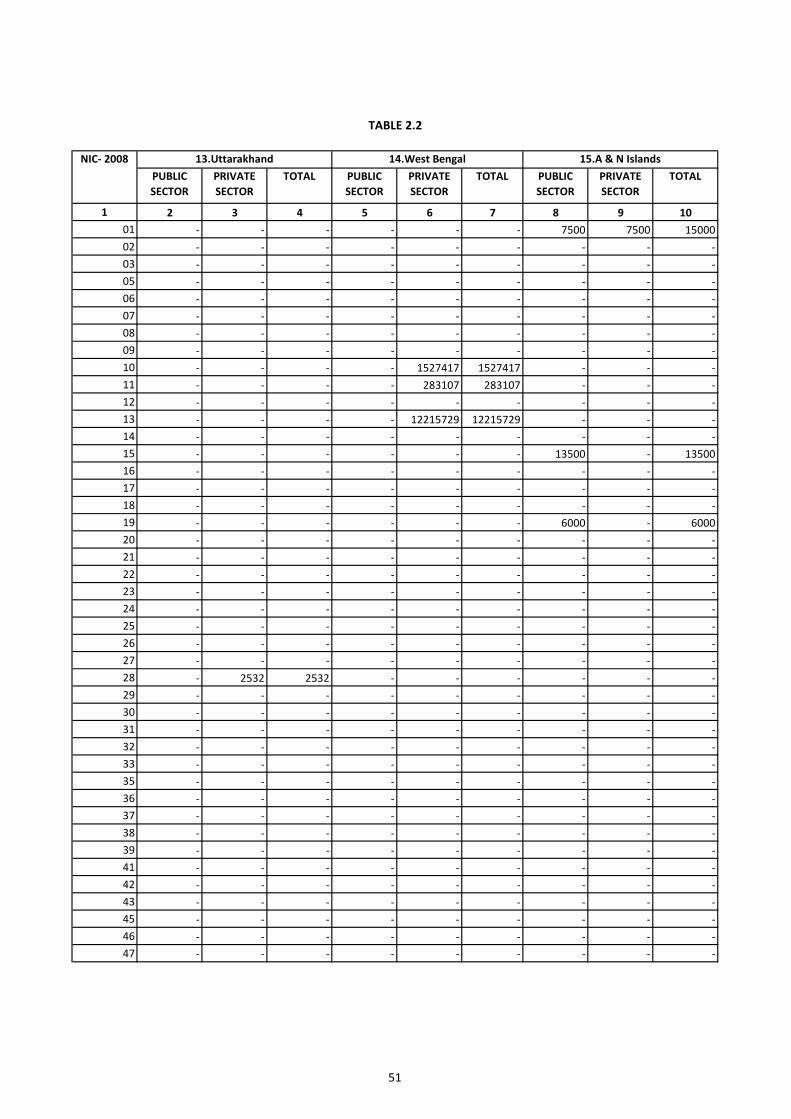
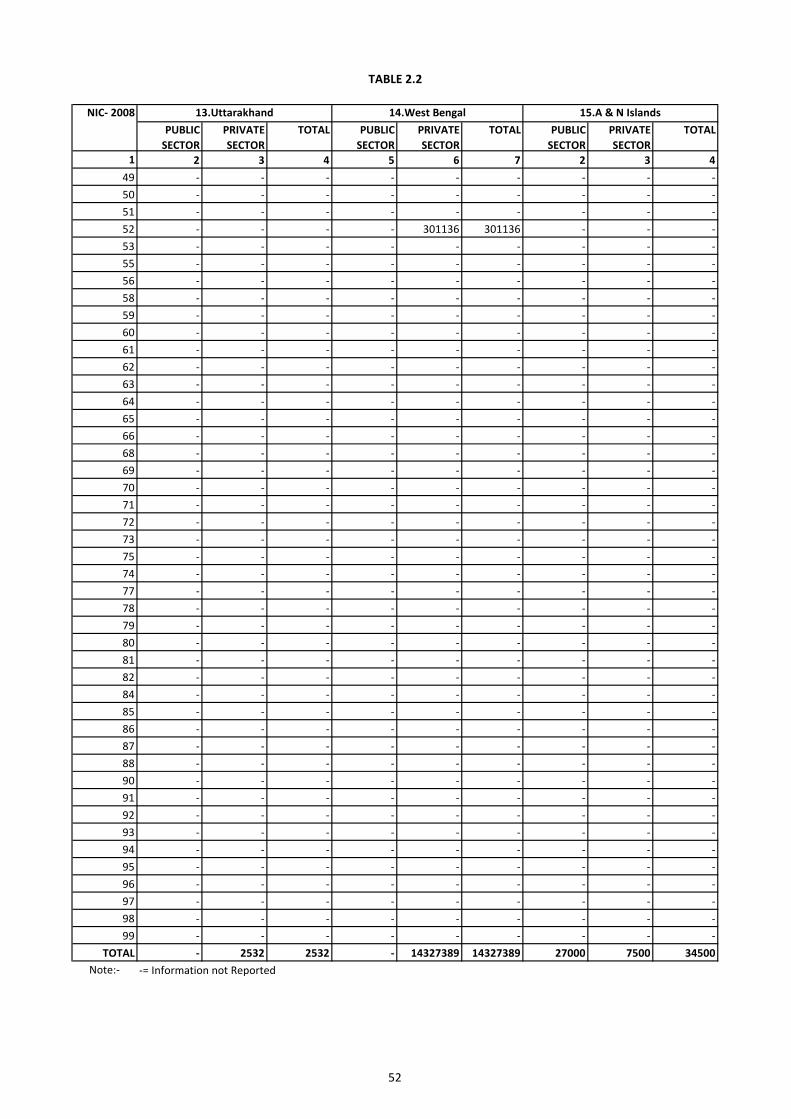
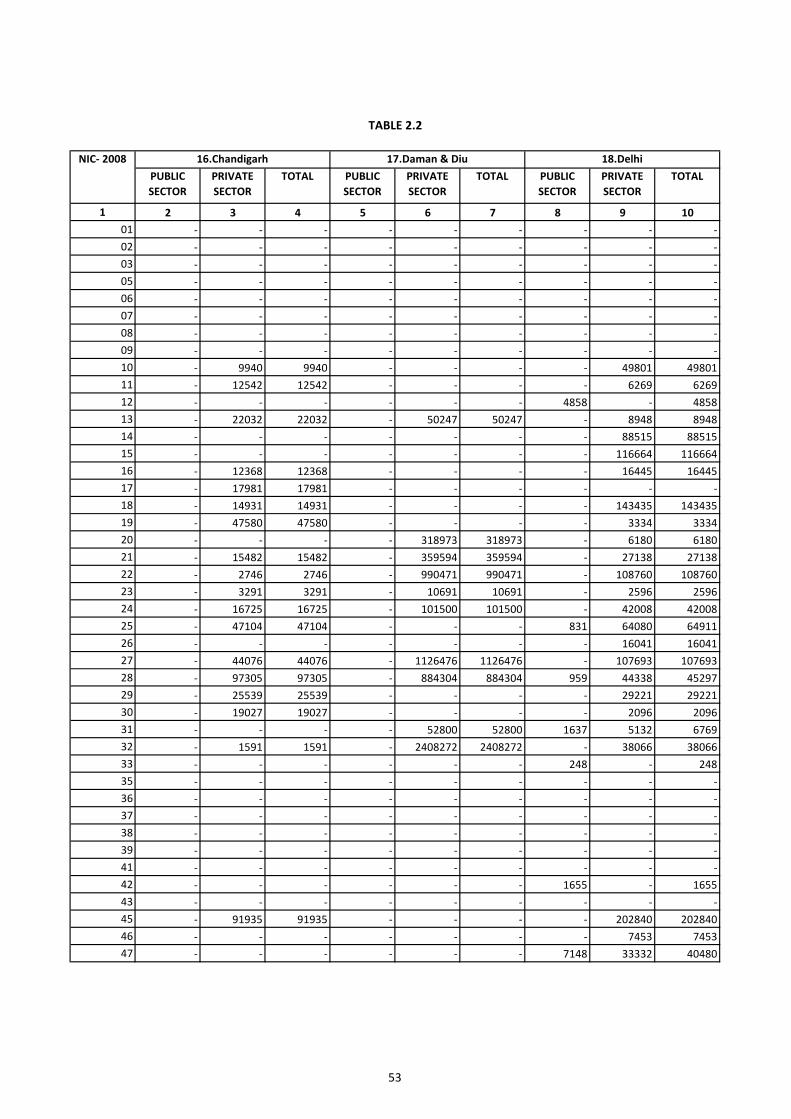
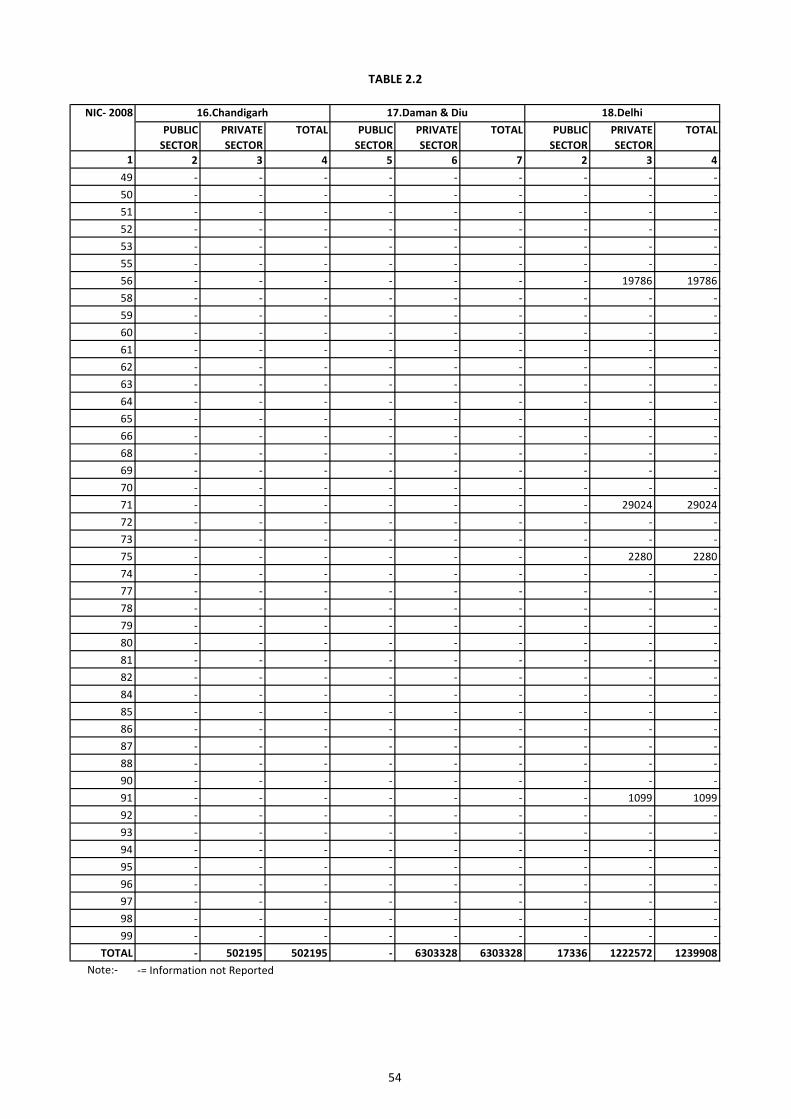
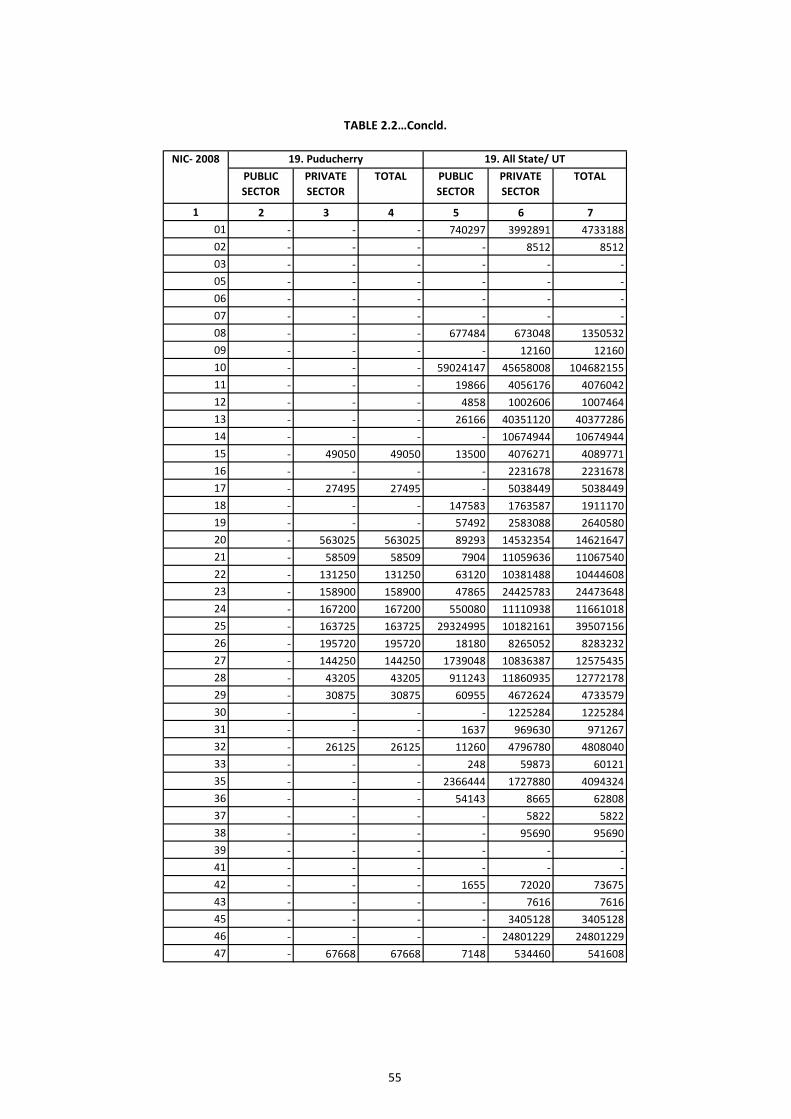
2.2 Number of Mandays Worked by Establishments during 2012 by Sectors of States / Union Territories in all Industries (NIC wise)
43-56
2.3 Number of Mandays Worked by Establishments during 2012 in Manufacturing Industries by Sectors of States / Union Territories
57
2.4 Number of Mandays Worked by Establishments during 2012 in Manufacturing Industries (NIC wise)
58-64
3.1 Average Daily Employment of Establishments Submitting Returns during 2012 all Industries by States / Union Territories
65
3.2 Average Daily Employment of Establishments Submitting Returns during 2012 by States / Union Territories NIC wise
66-79
3.3 Average Daily Employment of Establishments Submitting Returns during 2012 Manufacturing Industries by States / Union Territories
80
3.4 Average Daily Employment of Establishments Submitting Returns during 2012 by States / UT's. in Manufacturing Industries (NIC wise)
81-87
4.1 Gross Wages during 2012 all Industries by States / Union Territories 88 4.2 Gross Wages during 2012 in all Industries (NIC wise) 89-108 4.3 Gross Wages during 2012 in Manufacturing Industries
by States / Union Territories 109
4.4 Gross Wages during 2012 in Manufacturing Industries (NIC wise) 110-119 5.1 Per Capita Annual Earnings during 2012 in all Industries
by State / Union Territories 120
5.2 Per Capita Annual Earnings by States/ UTs during 2012 in all Industries (NIC wise)
121-134
5.3 Per Capita Annual Earnings during 2012 in Manufacturing Industries by State / Union Territories
135
5.4 Per Capita Annual Earnings during 2012 in Manufacturing Industries(NIC wise)
136-142
6.1 Per Capita Daily Earnings during 2012 in all Industries by State / Union Territories
143
6.2 Per Capita Daily Earnings during 2012 by sectors of State/ UTs in all industries (NIC wise)
144-157
6.3 Per Capita Daily Earnings during 2012 in Manufacturing Industries by State / Union Territories
158
6.4 Per Capita Daily Earnings during 2012 by sectors in Manufacturing industries (NIC wise)
159-165

i
EXECUTIVE SUMMARY
*****
The present report on the working of The Payment of Wages Act, 1936 pertains
to the year 2012.
The report is based on the returns received from 19 States/Union Territories for
the year 2012 namely Andhra Pradesh, Assam, Goa, Haryana, Himachal
Pradesh, Jammu & Kashmir, Karnataka, Kerala, Odisha, Rajasthan, Tamil
Nadu, Tripura, Uttarakhand, West Bengal, Andaman & Nicobar Islands,
Chandigarh, Daman & Diu, Delhi and Puducherry.
Amongst the reporting establishments highest response rate is found in Goa,
Himachal Pradesh, Jammu & Kashmir, Uttarakhand, Chandigarh, Daman &
Diu, Delhi, Puducherry and lowest is found in Assam.
In case of all industries highest number of units covered and units submitting
returns is found in Andhra Pradesh and lowest in Uttarakhand.
The highest number of mandays worked by establishments during 2012 is
reported in Andhra Pradesh.
The highest average daily employment is reported from the state of Andhra
Pradesh whereas lowest is recorded in Uttarakhand.
In the year 2012, highest gross wages is being paid by the state of Andhra
Pradesh and lowest is paid by Uttarakhand.
Amongst the States, highest per capita annual earnings is recorded in Tamil
Nadu whereas lowest is found in Uttarakhand.
The highest per capita daily earnings is recorded in Andaman & Nicobar
Islands whereas lowest in Tamil Nadu.
***
1
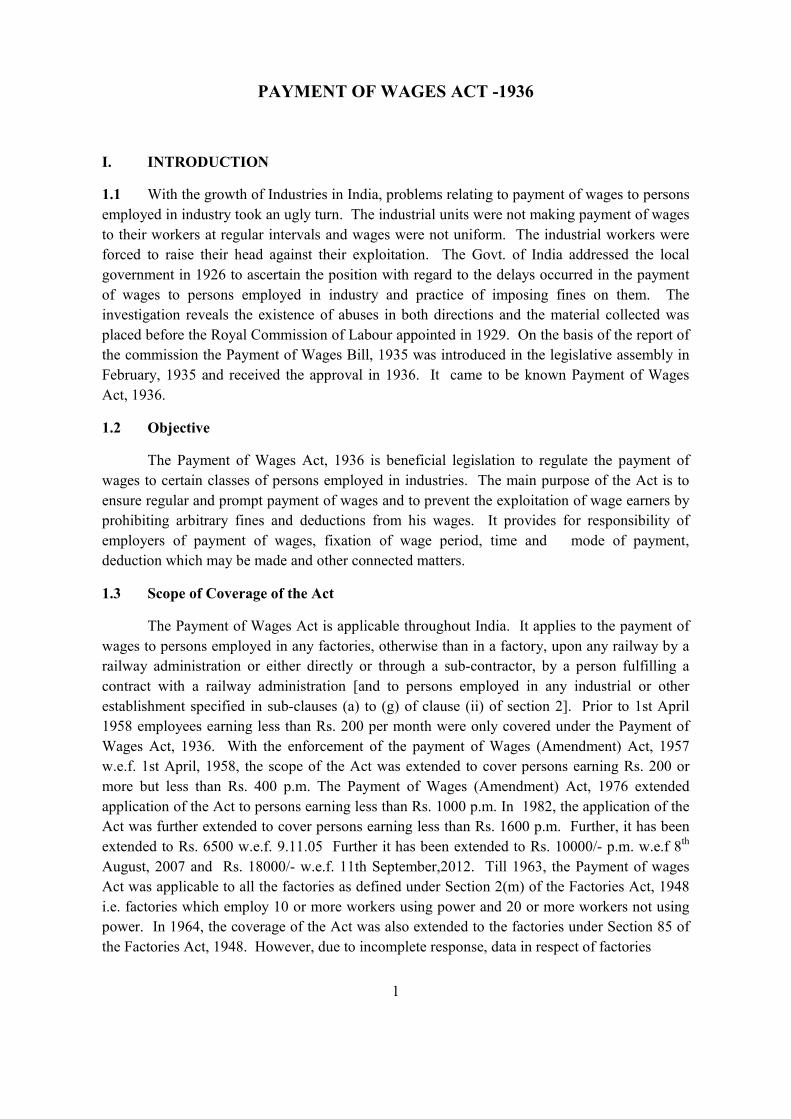
PAYMENT OF WAGES ACT -1936
I. INTRODUCTION
1.1 With the growth of Industries in India, problems relating to payment of wages to persons
employed in industry took an ugly turn. The industrial units were not making payment of wages
to their workers at regular intervals and wages were not uniform. The industrial workers were
forced to raise their head against their exploitation. The Govt. of India addressed the local
government in 1926 to ascertain the position with regard to the delays occurred in the payment
of wages to persons employed in industry and practice of imposing fines on them. The
investigation reveals the existence of abuses in both directions and the material collected was
placed before the Royal Commission of Labour appointed in 1929. On the basis of the report of
the commission the Payment of Wages Bill, 1935 was introduced in the legislative assembly in
February, 1935 and received the approval in 1936. It came to be known Payment of Wages
Act, 1936.
1.2 Objective
The Payment of Wages Act, 1936 is beneficial legislation to regulate the payment of
wages to certain classes of persons employed in industries. The main purpose of the Act is to
ensure regular and prompt payment of wages and to prevent the exploitation of wage earners by
prohibiting arbitrary fines and deductions from his wages. It provides for responsibility of
employers of payment of wages, fixation of wage period, time and mode of payment,
deduction which may be made and other connected matters.
1.3 Scope of Coverage of the Act
The Payment of Wages Act is applicable throughout India. It applies to the payment of
wages to persons employed in any factories, otherwise than in a factory, upon any railway by a
railway administration or either directly or through a sub-contractor, by a person fulfilling a
contract with a railway administration [and to persons employed in any industrial or other
establishment specified in sub-clauses (a) to (g) of clause (ii) of section 2]. Prior to 1st April
1958 employees earning less than Rs. 200 per month were only covered under the Payment of
Wages Act, 1936. With the enforcement of the payment of Wages (Amendment) Act, 1957
w.e.f. 1st April, 1958, the scope of the Act was extended to cover persons earning Rs. 200 or
more but less than Rs. 400 p.m. The Payment of Wages (Amendment) Act, 1976 extended
application of the Act to persons earning less than Rs. 1000 p.m. In 1982, the application of the
Act was further extended to cover persons earning less than Rs. 1600 p.m. Further, it has been
extended to Rs. 6500 w.e.f. 9.11.05 Further it has been extended to Rs. 10000/- p.m. w.e.f 8th
August, 2007 and Rs. 18000/- w.e.f. 11th September,2012. Till 1963, the Payment of wages
Act was applicable to all the factories as defined under Section 2(m) of the Factories Act, 1948
i.e. factories which employ 10 or more workers using power and 20 or more workers not using
power. In 1964, the coverage of the Act was also extended to the factories under Section 85 of
the Factories Act, 1948. However, due to incomplete response, data in respect of factories
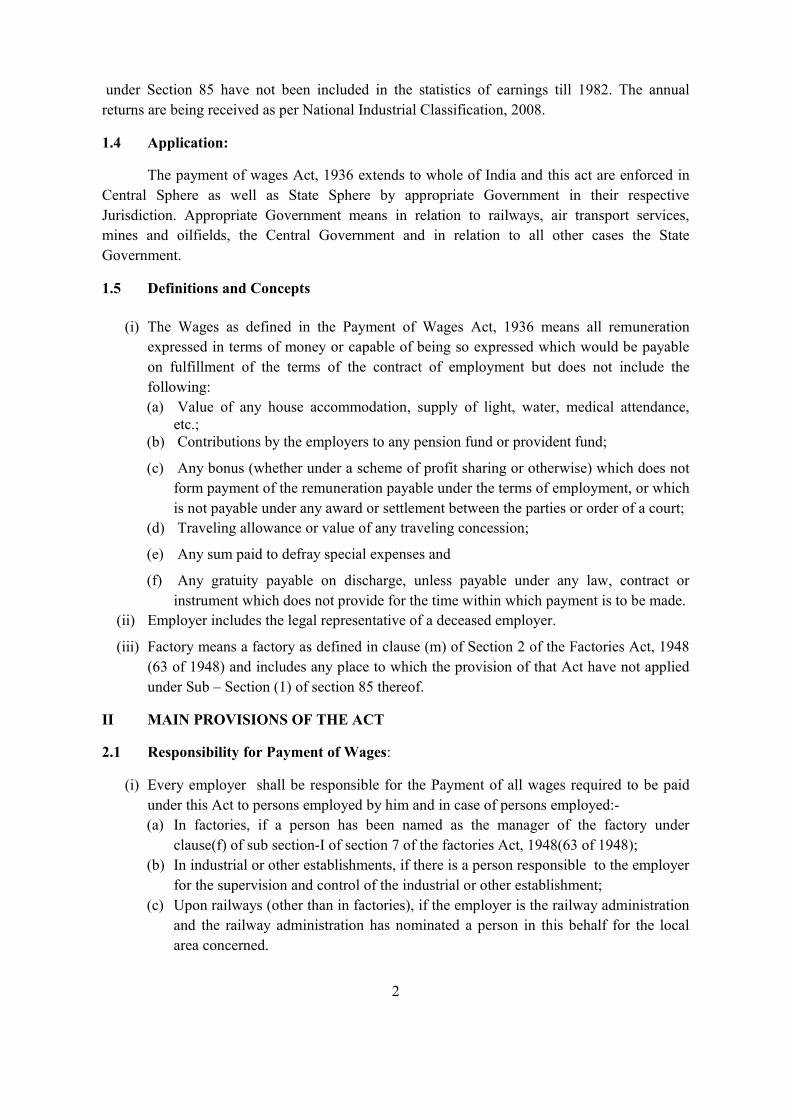
2
under Section 85 have not been included in the statistics of earnings till 1982. The annual
returns are being received as per National Industrial Classification, 2008.
1.4 Application:
The payment of wages Act, 1936 extends to whole of India and this act are enforced in
Central Sphere as well as State Sphere by appropriate Government in their respective
Jurisdiction. Appropriate Government means in relation to railways, air transport services,
mines and oilfields, the Central Government and in relation to all other cases the State
Government.
1.5 Definitions and Concepts
(i) The Wages as defined in the Payment of Wages Act, 1936 means all remuneration
expressed in terms of money or capable of being so expressed which would be payable
on fulfillment of the terms of the contract of employment but does not include the
following:
(a) Value of any house accommodation, supply of light, water, medical attendance, etc.;
(b) Contributions by the employers to any pension fund or provident fund;
(c) Any bonus (whether under a scheme of profit sharing or otherwise) which does not
form payment of the remuneration payable under the terms of employment, or which
is not payable under any award or settlement between the parties or order of a court;
(d) Traveling allowance or value of any traveling concession;
(e) Any sum paid to defray special expenses and
(f) Any gratuity payable on discharge, unless payable under any law, contract or
instrument which does not provide for the time within which payment is to be made.
(ii) Employer includes the legal representative of a deceased employer.
(iii) Factory means a factory as defined in clause (m) of Section 2 of the Factories Act, 1948
(63 of 1948) and includes any place to which the provision of that Act have not applied
under Sub – Section (1) of section 85 thereof.
II MAIN PROVISIONS OF THE ACT
2.1 Responsibility for Payment of Wages:
(i) Every employer shall be responsible for the Payment of all wages required to be paid
under this Act to persons employed by him and in case of persons employed:-
(a) In factories, if a person has been named as the manager of the factory under
clause(f) of sub section-I of section 7 of the factories Act, 1948(63 of 1948);
(b) In industrial or other establishments, if there is a person responsible to the employer
for the supervision and control of the industrial or other establishment;
(c) Upon railways (other than in factories), if the employer is the railway administration
and the railway administration has nominated a person in this behalf for the local
area concerned.
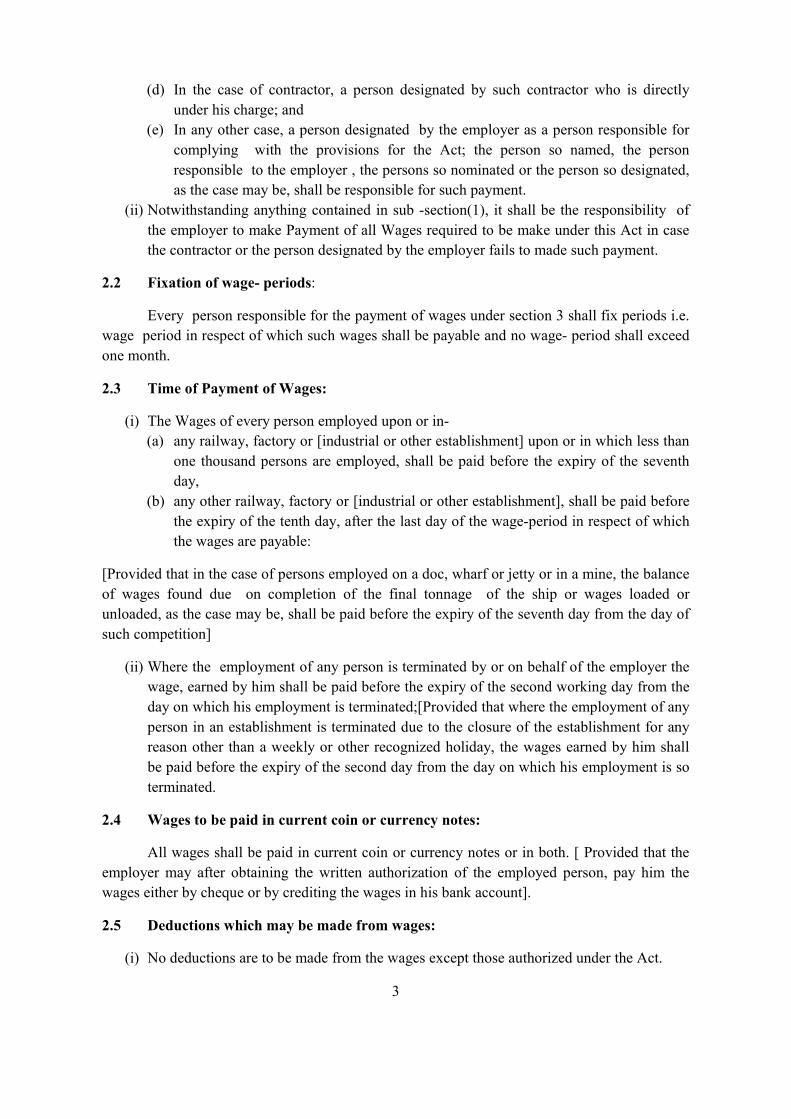
3
(d) In the case of contractor, a person designated by such contractor who is directly
under his charge; and
(e) In any other case, a person designated by the employer as a person responsible for
complying with the provisions for the Act; the person so named, the person
responsible to the employer , the persons so nominated or the person so designated,
as the case may be, shall be responsible for such payment.
(ii) Notwithstanding anything contained in sub -section(1), it shall be the responsibility of
the employer to make Payment of all Wages required to be make under this Act in case
the contractor or the person designated by the employer fails to made such payment.
2.2 Fixation of wage- periods:
Every person responsible for the payment of wages under section 3 shall fix periods i.e.
wage period in respect of which such wages shall be payable and no wage- period shall exceed
one month.
2.3 Time of Payment of Wages:
(i) The Wages of every person employed upon or in-
(a) any railway, factory or [industrial or other establishment] upon or in which less than
one thousand persons are employed, shall be paid before the expiry of the seventh
day,
(b) any other railway, factory or [industrial or other establishment], shall be paid before
the expiry of the tenth day, after the last day of the wage-period in respect of which
the wages are payable:
[Provided that in the case of persons employed on a doc, wharf or jetty or in a mine, the balance
of wages found due on completion of the final tonnage of the ship or wages loaded or
unloaded, as the case may be, shall be paid before the expiry of the seventh day from the day of
such competition]
(ii) Where the employment of any person is terminated by or on behalf of the employer the
wage, earned by him shall be paid before the expiry of the second working day from the
day on which his employment is terminated;[Provided that where the employment of any
person in an establishment is terminated due to the closure of the establishment for any
reason other than a weekly or other recognized holiday, the wages earned by him shall
be paid before the expiry of the second day from the day on which his employment is so
terminated.
2.4 Wages to be paid in current coin or currency notes:
All wages shall be paid in current coin or currency notes or in both. [ Provided that the
employer may after obtaining the written authorization of the employed person, pay him the
wages either by cheque or by crediting the wages in his bank account].
2.5 Deductions which may be made from wages:
(i) No deductions are to be made from the wages except those authorized under the Act.
4
(ii) Deductions are to be made in accordance with provision of the Act and may be of
following kinds, namely.
(a) fines
(b) deduction for absence from duty
(c) deduction for damage to or loss of goods entrusted to the employed persons
(d) deduction for such amenities and services supplied by employer
(e) deduction of recovery of advances of whatever nature including advances for
traveling allowance of conveyance allowance or for adjustment of overpayment of
wages
(f) deduction of income tax payable by the employed person
(g) deduction required to be made by order of a court or other authority competent to
make such order
2.6 Fine
(i) No fine shall be imposed on any employed person save in respect of such acts and
omissions on his part as the employer, with the previous approval of [ the appropriate
Government ] or of the prescribed authority, may have specified by notice under sub-
section(2).
(ii) A notice specifying such acts and omissions shall be exhibited in the prescribed
manner on the premises in which the employment is carried on or in the case of
persons employed upon a railway (otherwise than in factory), at the prescribed place
or places
(iii) No fine shall be imposed on any employed person until he has been given an
opportunity of showing cause against the fine, or otherwise, than in accordance with
such procedure as may be prescribed for imposition of fines.
(iv) Total amount of fine which may be imposed in any one wage - period on any
employed person shall not exceed an amount equal to [Three per cent of the wages]
payable to him in respect of that wage-period.
(v) No fine imposed on any employed person shall be recovered from him by installments
or after the expiry of [Ninety days] from the day on which it was imposed.
(vi) Every fine shall be deemed to have been imposed on the day of the act or omission in
respect of which it was imposed.
(vii) All fines and all realisations thereof shall be recorded in a register to be kept by the
person responsible for the payment of wages under section three in such form as
may be prescribed; and all such realisations shall be applied only to such purposes
beneficial to the persons employed in the factory or establishment as are approved
by the prescribed authority.
2.7 Dedication for absence from duty:
(i) Deductions may be made under clause(b) of sub-section(2)of section 7 only on account
of the absence of an employed person from the places or places where, by the terms of
his employment, he is required to work, such absence being for the whole or any part of
the period during which he is so required to work.
5
(ii) The amount of such deduction shall in no case bear to the wages payable to the
employed person in respect of wages-period for which the deduction is made a large
proportion than the period for which he was absent bears to the total period, within such
wage-period, during which by the terms of his employment, he has required to work.
Provided that, subject to any rules made in this behalf by [the appropriate Government], if ten or
more employed persons acting in concert absent themselves without due notice(that is to say
without giving the notice which is required under the terms of their contracts of employment )
and without reasonable cause, such deduction from any such person may include such amount
not exceeding his wages for eight days as may by any such terms be due to the employer in lieu
of due notice.
2.8 Deductions for damage or loss:
(i) A deduction under clause(c) or clause (0) of sub-section (2) of section 7 shall not
exceed the amount of the damage or loss caused to the employer by the neglect or
default of the employed person.
(ii) deduction shall not be made under clause (c) or clause(m) or clause(n) or clause(0) of
sub-section (2)of section 7 until the employed person has been given an opportunity of
showing cause against the deduction, or otherwise than in accordance with such
procedure as may be prescribed for the making of such deductions]
(iii) All such deductions and all realizations thereof shall be recorded in a register to be kept
by the person responsible for the payment of wages under section(3) in such form as
may be prescribed.
2.9 Deductions for services rendered:
A deduction under clause (d) or clause(e) of sub-section(2) of section 7 shall not be
made from the wages of an employed person, unless the house- accommodation amenity or
service has been accepted by him, as a term of employment or otherwise, and such deduction
shall not exceed an amount equivalent to the value of the house-accommodation amenity or
service supplied and, in the case of a deduction under the said clause (e), shall be subject to such
conditions as [the appropriate Government] may impose.
2.10 Deductions for recovery of advances:
Deductions under clause(f) of sub-section(2) of section7 shall be subject to the following
conditions, namely:
(a) recovery of an advance of money given before employment began shall be made from
the first payment of wages in respect of a complete wage period, but no recovery shall be
made of such advances given for travelling expenses;
(b) recovery of an advance of money given after employment began shall be subject to such
conditions as [ the appropriate Government ] may impose;]
(c) recovery of advances of wages not already earned shall be subject to any rules made by
[the appropriate Government] regulating the extent to which such advances may be
given and the installments by which they may be recovered.
6
2.11 Deductions for recovery of loans:
Deductions for recovery of loans granted under clause (f) of sub-section (2) of section 7
shall be subject to any rules made by [The appropriate Government] regulating the extent to
which such loans may be granted and the rate of interest payable thereon]
2.12 Deductions for Payments to co-operative societies and insurance schemes:
Deductions under clause (j) [and clause (K)] of sub section(2) of section 7 shall be
subject to such conditions as [ the appropriate Government] may impose.
2.13 Maintenance of registers and Records:
Every employer is required to maintain registers and records giving particulars of
employees, the work performed by them, the wages paid to them, the receipts given by them and
any other required particulars.
2.14 Inspections:
The appropriate Government may, by notification in the Official Gazette, appoint
inspectors for this purpose under the Act and define the local limits for their functions.
2.15 Claims:
The appropriate Government may , by notification in the Official Gazette, appoint
(a) any Commissioner for Workmen's Compensation; or
(b) any officer of the Central Government exercising functions as,-
i. Regional Labour Commissioner; or
ii. Assistant Labour Commissioner with at least two years' experience; or
(c) any officer of the State Government not below the rank of Assistant Labour
Commissioner with at least two years' experience; or
(d) a presiding officer of any Labour Court or Industrial Tribunal, constituted under the
Industrial Disputes Act, 1947 (14 of 1947), or under any corresponding law relating to
the investigation and settlement of industrial disputes in force in the State; or
(e) any other officer with experience as a Judge of a Civil Court or a Judicial Magistrate,
as the authority to hear and decide for any specified area all claims arising out of deductions
from the wages, or delay in payment of the wages, of persons employed or paid in that area,
including all matters incidental to such claims.
Provided that where the appropriate Government considers it necessary to do so, it may appoint
more than one authority for any specified area and may, by general or special order, provide for
the distribution or allocation of work to be performed by them under this Act.
7
III. STATISTICS COLLECTED UNDER THE ACT
3.1 All establishments covered under the Act are required to furnish to the concerned
authority (Central or State) an annual return in prescribed form as per the rules framed under the
Payment of Wages Act.,1936. The information submitted by units to State/ U.T. Authorities
contains identification particulars, number of mandays worked during the year, total wages paid
including deductions, number of cases involving deduction and amount realized, etc. In the
primary returns, figures relating to gross wages are collected with a break-up of the figures:
1. basic wages
2. cash allowances which include production or incentive bonus, efficiency bonus,
dearness and other allowances.
3. Money value of concessions.
4. Annual or profit sharing bonus and
5. Arrears
It is likely that uniform practice based on proper interpretation is not being followed by
all the reporting units in furnishing data for the various components particularly in regard to
money value of concessions. The units are required to submit the returns by the 15th February
of succeeding year.
The State Governments / Union territories submit consolidated statement on working of
the payment of Wages Act, 1936 to Labour Bureau for each calendar year by a specified date
i.e. 25th August of succeeding year. The consolidated returns of the State / Union Territory
Authorities contain industry –wise information on the following items:
(a) Number of factories covered under the act and submitting returns;
(b) Average daily employment during the year;
(c) Total mandays worked during the year and
(d) Total gross wage bill (before deductions) further broken up into components like basic
wages, cash allowance, bonus, arrears and money value of concessions, etc.
The consolidated returns received from the State / Union Territory authorities contain
requisite data in respect of only those factories which submit returns. Some of the factories
coming within the purview of the Payment of Wages Act do not submit the primary returns to
the State Authorities although it is a statutory obligation on their part to submit such returns.
Also varying number of factories submitting returns from year to year affect the comparability
not only of figures of total earnings but also those of per capita annual earnings.
3.2 Computation of Annual / Daily Earnings
The figures of average daily employment in an industry are derived by dividing total
attendance during the year by the number of working days reported by the individual
establishments belonging to that industry. Total gross wage bill for an industry when divided by
the corresponding average daily employment yield the figure of per capita annual earnings.
Thus, the figures of per capita annual earnings derived in this manner are subject to variation on
account of variation in the number of working days. It is for this reason that the per capita
8
annual earnings have been given only for perennial industries where the variation in the number
of working days during the year is not likely to be appreciable.
The per capita daily earnings are derived by dividing the total gross wages bill for a year
by the corresponding figures of total mandays worked in that year. The per capita daily earnings
are compiled for all industries i.e. seasonal as well as perennial. The data generated under the
Payment of Wages Act, 1936 namely:
1. Per capita daily earnings and
2. Per capita annual earnings
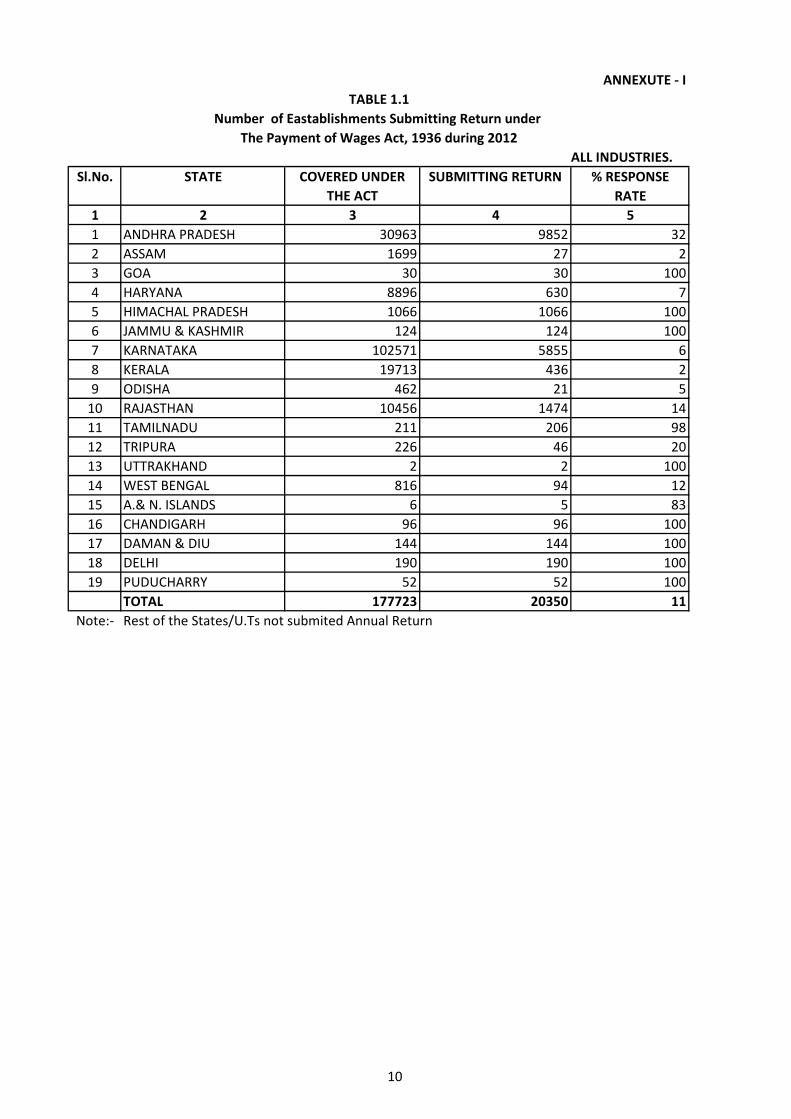
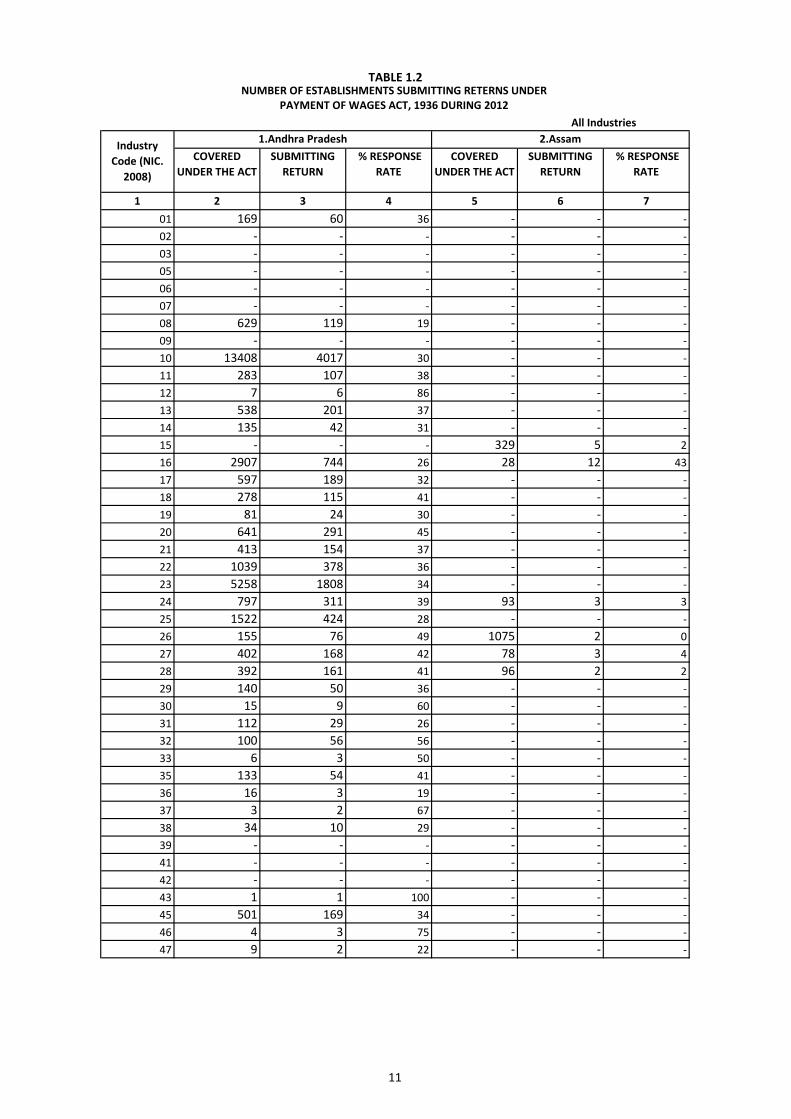
3.3 Coverage And Response Rate
Table 1.1 presents the number of establishments submitting returns States/U.T. wise for
all industries during 2012. This table shows that the highest number of units covered is found in
Karnataka (102571) whereas lowest is found in Uttarakhand (2). Similarly, the highest number
of units submitting returns is found in Andhra Pradesh (9852), whereas lowest number of units
submitting returns is found in Uttarakhand (2). Table 1.3 presents the number of establishments
submitting returns states/U.T. wise for manufacturing industries during 2012. This table shows
that the highest number of units covered is found in Andhra Pradesh (29220) whereas lowest is
found in Uttarakhand (2). Similarly, the highest number of units submitting returns is found in
Andhra Pradesh (9360) and lowest is found in Uttarakhand (2).
3.4 Mandays Worked
Table 2.1 presents the number of Mandays Worked by establishments during 2012 by
sectors of States/U.T.’s for all industries. This table shows that the highest number of mandays
worked is found in Andhra Pradesh (12.96 crores) in both public and private sectors, whereas
lowest is found in Uttarakhand (2.53 thousand) in both the sectors. Table 2.3 presents the
number of mandays worked by establishments during 2012 in manufacturing industries by
sectors of states/U.T.’s. This table shows that the highest number of mandays worked by
manufacturing industries is found in Andhra Pradesh in both public and private sectors and
lowest is found in Uttarakhand.
3.5 Average Daily Employment
Table 3.1 depicts that the highest number of average daily employment is recorded in
Andhra Pradesh (3.87 lakhs) and lowest is recorded in Uttarakhand (14) during 2012 by sectors
of States/U.T.’s for all industries. Table 3.3 depicts that the highest number of average daily
employment is recorded in Andhra Pradesh (3.59 lakhs) and lowest is recorded in Uttarakhand
(14) during 2012 in manufacturing industries both sectors.
3.6 Gross Wages
Table 4.1 shows that the highest gross wages during 2012 is recorded in Andhra Pradesh
(3206.7 crores) whereas the lowest is recorded in Uttarakhand (8.25 lakhs) in both public and
private sectors for all industries. Table 4.3 depicts that for manufacturing industries the highest
9
gross wages during 2012 is recorded in Andhra Pradesh (2981.10 crores) in both public and
private sectors whereas the lowest is recorded in Uttarakhand (8.25 lakhs).
3.7 Per Capita Annual Earnings
Table 5.1 shows that the per capita annual earnings during 2012 is highest in Tamil Nadu
(Rs.1.12 lakhs) whereas the lowest is in Uttarakhand (Rs. 58.9 thousand) by sectors of
States/U.T.’s for all industries. Table 5.3 shows that in manufacturing industries the highest per
capita annual earnings during 2012 is recorded in Tamil Nadu (Rs. 1.13 lakhs) whereas the
lowest is recorded in Uttarakhand (Rs. 58.9 thousand).
3.8 Per Capita Daily Earnings
Table 6.1 shows that the highest per capita daily earnings is recorded in Andaman & Nicobar
(Rs.350) whereas the lowest is recorded in Tamil Nadu (Rs. 31) by sectors of States/U.T.’s for
all industries during 2012. Whereas table 6.3 depicts that in manufacturing industries the highest
per capita daily earnings during 2012 is recorded in Andaman & Nicobar (Rs. 350) and the
lowest is recorded in Tamil Nadu (Rs. 31).
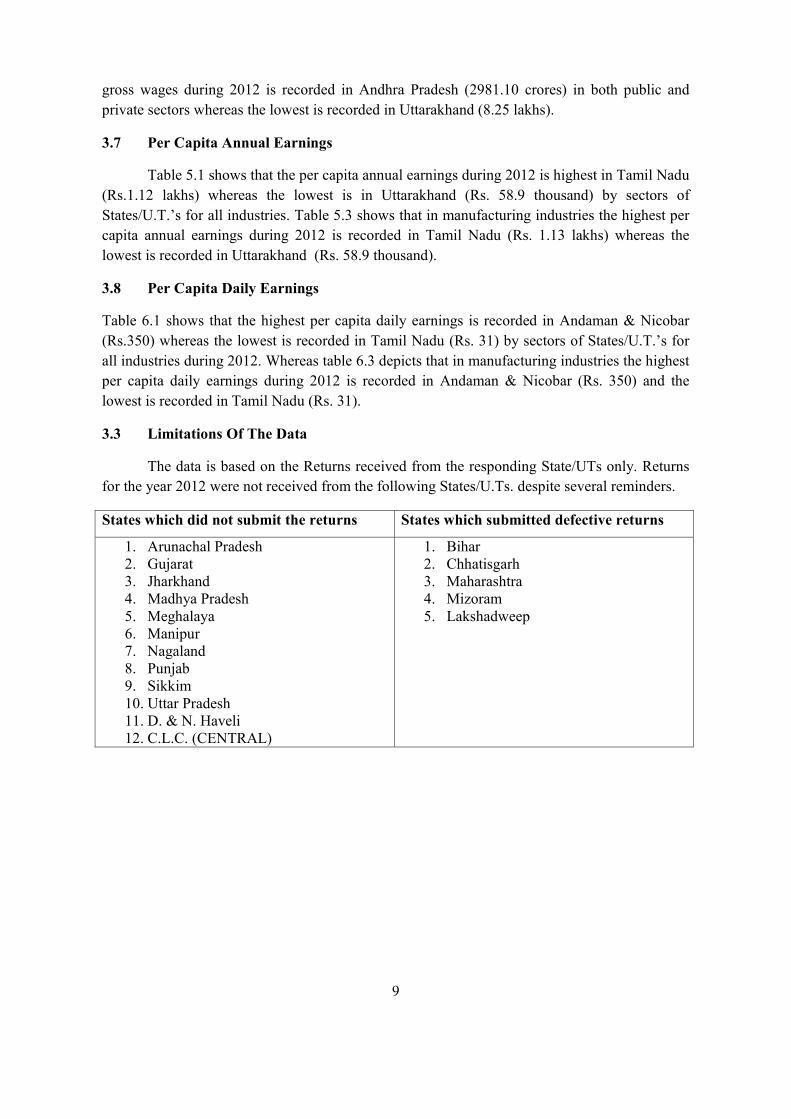
3.3 Limitations Of The Data
The data is based on the Returns received from the responding State/UTs only. Returns
for the year 2012 were not received from the following States/U.Ts. despite several reminders.
States which did not submit the returns States which submitted defective returns
1. Arunachal Pradesh 2. Gujarat 3. Jharkhand 4. Madhya Pradesh 5. Meghalaya 6. Manipur 7. Nagaland 8. Punjab 9. Sikkim 10. Uttar Pradesh 11. D. & N. Haveli 12. C.L.C. (CENTRAL)
1. Bihar 2. Chhatisgarh 3. Maharashtra 4. Mizoram 5. Lakshadweep
10
% RESPONSE RATE
1 2 3 4 51 ANDHRA PRADESH 30963 9852 322 ASSAM 1699 27 23 GOA 30 30 1004 HARYANA 8896 630 75 HIMACHAL PRADESH 1066 1066 1006 JAMMU & KASHMIR 124 124 1007 KARNATAKA 102571 5855 68 KERALA 19713 436 29 ODISHA 462 21 5
10 RAJASTHAN 10456 1474 1411 TAMILNADU 211 206 9812 TRIPURA 226 46 2013 UTTRAKHAND 2 2 10014 WEST BENGAL 816 94 1215 A.& N. ISLANDS 6 5 8316 CHANDIGARH 96 96 10017 DAMAN & DIU 144 144 10018 DELHI 190 190 10019 PUDUCHARRY 52 52 100
TOTAL 177723 20350 11Note:- Rest of the States/U.Ts not submited Annual Return
Sl.No. STATE COVERED UNDER THE ACT
SUBMITTING RETURN
ANNEXUTE - ITABLE 1.1
Number of Eastablishments Submitting Return under The Payment of Wages Act, 1936 during 2012
ALL INDUSTRIES.
11
COVERED UNDER THE ACT
SUBMITTING RETURN
% RESPONSE RATE
COVERED UNDER THE ACT
SUBMITTING RETURN
% RESPONSE RATE
1 2 3 4 5 6 701 169 60 36 - - -02 - - - - - -03 - - - - - -05 - - - - - -06 - - - - - -07 - - - - - -08 629 119 19 - - -09 - - - - - -10 13408 4017 30 - - -11 283 107 38 - - -12 7 6 86 - - -13 538 201 37 - - -14 135 42 31 - - -15 - - - 329 5 216 2907 744 26 28 12 4317 597 189 32 - - -18 278 115 41 - - -19 81 24 30 - - -20 641 291 45 - - -21 413 154 37 - - -22 1039 378 36 - - -23 5258 1808 34 - - -24 797 311 39 93 3 325 1522 424 28 - - -26 155 76 49 1075 2 027 402 168 42 78 3 428 392 161 41 96 2 229 140 50 36 - - -30 15 9 60 - - -31 112 29 26 - - -32 100 56 56 - - -33 6 3 50 - - -35 133 54 41 - - -36 16 3 19 - - -37 3 2 67 - - -38 34 10 29 - - -39 - - - - - -41 - - - - - -42 - - - - - -43 1 1 100 - - -45 501 169 34 - - -46 4 3 75 - - -47 9 2 22 - - -
TABLE 1.2NUMBER OF ESTABLISHMENTS SUBMITTING RETERNS UNDER
All IndustriesPAYMENT OF WAGES ACT, 1936 DURING 2012
Industry Code (NIC.
2008)
1.Andhra Pradesh 2.Assam
12
COVERED UNDER THE ACT
SUBMITTING RETURN
% RESPONSE RATE
COVERED UNDER THE ACT
SUBMITTING RETURN
% RESPONSE RATE
1 2 3 4 5 6 749 10 7 70 - - -50 - - - - - -51 - - - - - -52 204 41 20 - - -53 - - - - - -55 - - - - - -56 - - - - - -58 2 2 100 - - -59 6 5 83 - - -60 - - - - - -61 - - - - - -62 - - - - - -63 - - - - - -64 - - - - - -65 - - - - - -66 - - - - - -68 - - - - - -69 - - - - - -70 - - - - - -71 - - - - - -72 3 3 100 - - -73 - - - - - -74 - - - - - -75 - - - - - -77 - - - - - -78 - - - - - -79 - - - - - -80 - - - - - -81 - - - - - -82 7 5 71 - - -84 - - - - - -85 - - - - - -86 2 1 50 - - -87 - - - - - -88 - - - - - -90 4 2 50 - - -91 - - - - - -92 - - - - - -93 - - - - - -94 - - - - - -95 - - - - - -96 - - - - - -97 - - - - - -98 - - - - - -99 - - - - - -
TOTAL 30963 9852 32 1699 27 2Note:- -= Information not Reported
Industry Code (NIC.
2008)
1.Andhra Pradesh 2.Assam
TABLE 1.2
13
COVERED UNDER THE ACT
SUBMITTING RETURN
% RESPONSE RATE
COVERED UNDER THE ACT
SUBMITTING RETURN
% RESPONSE RATE
1 2 3 4 5 6 701 - - - 63 2 302 - - - - - -03 - - - - - -05 - - - - - -06 - - - - - -07 - - - - - -08 - - - 11 1 909 - - - 1 1 10010 - - - 581 31 511 - - - 19 4 2112 - - - 18 4 2213 1 1 100 973 61 614 - - - 886 54 615 1 1 100 232 38 1616 - - - 312 9 317 - - - 90 10 1118 - - - 67 5 719 - - - 37 3 820 - - - 303 40 1321 1 1 100 124 8 622 - - - 433 38 923 - - - 1114 32 324 6 6 100 813 56 725 1 1 100 928 56 626 - - - 168 18 1127 2 2 100 318 31 1028 - - - 525 47 929 - - - 469 45 1030 - - - 74 12 1631 3 3 100 48 2 432 - - - 50 10 2033 1 1 100 - - -35 - - - 8 1 1336 - - - - - -37 - - - - - -38 - - - - - -39 - - - - - -41 - - - - - -42 - - - - - -43 - - - - - -45 - - - 127 8 646 - - - - - -47 - - - - - -
TABLE 1.2
Industry Code (NIC. 2008)
3.Goa 4.Haryana
14
COVERED UNDER THE ACT
SUBMITTING RETURN
% RESPONSE RATE
COVERED UNDER THE ACT
SUBMITTING RETURN
% RESPONSE RATE
1 2 3 4 5 6 749 - - - - - -50 2 2 100 - - -51 - - - - - -52 - - - 104 3 353 - - - - - -55 4 4 100 - - -56 - - - - - -58 - - - - - -59 - - - - - -60 - - - - - -61 - - - - - -62 - - - - - -63 - - - - - -64 - - - - - -65 - - - - - -66 - - - - - -68 - - - - - -69 - - - - - -70 - - - - - -71 - - - - - -72 - - - - - -73 - - - - - -74 8 8 100 - - -75 - - - - - -77 - - - - - -78 - - - - - -79 - - - - - -80 - - - - - -81 - - - - - -82 - - - - - -84 - - - - - -85 - - - - - -86 - - - - - -87 - - - - - -88 - - - - - -90 - - - - - -91 - - - - - -92 - - - - - -93 - - - - - -94 - - - - - -95 - - - - - -96 - - - - - -97 - - - - - -98 - - - - - -99 - - - - - -
TOTAL 30 30 100 8896 630 7Note:- -= Information not Reported
3.Goa 4.HaryanaIndustry Code
(NIC. 2008)
TABLE 1.2
15
COVERED UNDER THE ACT
SUBMITTING RETURN
% RESPONSE RATE
COVERED UNDER THE ACT
SUBMITTING RETURN
% RESPONSE RATE
1 2 3 4 5 6 701 2 2 100 - - -02 - - - - - -03 - - - - - -05 - - - - - -06 - - - - - -07 - - - - - -08 1 1 100 - - -09 - - - - - -10 43 43 100 7 7 10011 12 12 100 2 2 10012 4 4 100 - - -13 37 37 100 4 4 10014 5 5 100 - - -15 24 24 100 1 1 10016 9 9 100 1 1 10017 71 71 100 4 4 10018 6 6 100 - - -19 1 1 100 1 1 10020 99 99 100 29 29 10021 148 148 100 8 8 10022 107 107 100 12 12 10023 9 9 100 1 1 10024 69 69 100 20 20 10025 44 44 100 13 13 10026 92 92 100 1 1 10027 164 164 100 9 9 10028 44 44 100 2 2 10029 32 32 100 1 1 10030 3 3 100 - - -31 7 7 100 - - -32 11 11 100 3 3 10033 - - - - - -35 11 11 100 - - -36 - - - - - -37 - - - - - -38 - - - - - -39 - - - - - -41 - - - - - -42 - - - - - -43 - - - 1 1 10045 7 7 100 - - -46 - - - - - -47 - - - - - -
TABLE 1.2
Industry Code (NIC. 2008)
6. Jammu & Kashmir5. Himachal Pradesh
16
COVERED UNDER THE ACT
SUBMITTING RETURN
% RESPONSE RATE
COVERED UNDER THE ACT
SUBMITTING RETURN
% RESPONSE RATE
1 2 3 4 5 6 749 - - - - - -50 - - - - - -51 - - - - - -52 - - - 2 2 10053 - - - - - -55 2 2 100 - - -56 - - - - - -58 - - - - - -59 - - - - - -60 - - - - - -61 - - - - - -62 - - - 1 1 10063 - - - - - -64 - - - - - -65 1 1 100 - - -66 - - - - - -68 - - - - - -69 - - - - - -70 - - - - - -71 - - - - - -72 - - - - - -73 - - - - - -74 - - - - - -75 - - - - - -77 - - - - - -78 - - - - - -79 - - - - - -80 - - - - - -81 - - - - - -82 1 1 100 1 1 10084 - - - - - -85 - - - - - -86 - - - - - -87 - - - - - -88 - - - - - -90 - - - - - -91 - - - - - -92 - - - - - -93 - - - - - -94 - - - - - -95 - - - - - -96 - - - - - -97 - - - - - -98 - - - - - -99 - - - - - -
TOTAL 1066 1066 100 124 124 100Note:- -= Information not Reported
6. Jammu & Kashmir5. Himachal PradeshIndustry Code
(NIC. 2008)
TABLE 1.2
17
COVERED UNDER THE ACT
SUBMITTING RETURN
% RESPONSE RATE
COVERED UNDER THE ACT
SUBMITTING RETURN
% RESPONSE RATE
1 2 3 4 5 6 701 160 15 9 575 200 3502 9 4 44 - - -03 - - - - - -05 - - - - - -06 - - - - - -07 - - - - - -08 85 9 11 - - -09 - - - - - -10 449 66 15 131 28 2111 14 4 29 13 9 6912 - - - - - -13 708 55 8 38 22 5814 - - - - - -15 - - - 22 12 5516 81 10 12 47 4 917 - - - - - -18 160 14 9 13 13 10019 - - - - - -20 13 8 62 24 1 421 2 1 50 15 2 1322 87 20 23 8 2 2523 41 17 41 117 14 1224 1 1 100 - - -25 - - - - - -26 2 2 100 - - -27 - - - - - -28 1375 252 18 194 16 829 - - - - - -30 - - - - - -31 - - - - - -32 - - - 2 2 10033 - - - - - -35 - - - - - -36 - - - - - -37 - - - - - -38 - - - - - -39 - - - - - -41 - - - - - -42 72 8 11 - - -43 - - - - - -45 - - - - - -46 95374 4853 5 - - -47 373 119 32 18428 84 0
TABLE 1.2
Industry Code (NIC. 2008)
8. Kerala 7. Karnataka
18
COVERED UNDER THE ACT
SUBMITTING RETURN
% RESPONSE RATE
COVERED UNDER THE ACT
SUBMITTING RETURN
% RESPONSE RATE
1 2 3 4 5 6 749 54 5 9 - - -50 - - - - - -51 - - - - - -52 - - - 2 1 5053 - - - - - -55 19 7 37 3 3 10056 2613 149 6 - - -58 - - - - - -59 63 21 33 - - -60 - - - - - -61 - - - - - -62 - - - - - -63 - - - - - -64 426 153 36 - - -65 - - - - - -66 - - - - - -68 - - - - - -69 - - - - - -70 - - - - - -71 - - - - - -72 - - - - - -73 - - - - - -74 - - - 14 14 10075 - - - - - -77 - - - - - -78 - - - - - -79 - - - - - -80 93 11 12 - - -81 - - - - - -82 - - - - - -84 - - - - - -85 - - - - - -86 296 50 17 63 5 887 - - - - - -88 - - - - - -90 - - - 4 4 10091 - - - - - -92 - - - - - -93 - - - - - -94 - - - - - -95 - - - - - -96 1 1 100 - - -97 - - - - - -98 - - - - - -99 - - - - - -
TOTAL 102571 5855 6 19713 436 2Note:- -= Information not Reported
TABLE 1.2
Industry Code (NIC. 2008)
8. Kerala 7. Karnataka
19
COVERED UNDER THE ACT
SUBMITTING RETURN
% RESPONSE RATE
COVERED UNDER THE ACT
SUBMITTING RETURN
% RESPONSE RATE
1 2 3 4 5 6 701 - - - - - -02 - - - - - -03 - - - - - -05 - - - - - -06 - - - - - -07 - - - - - -08 7 1 14 - - -09 - - - - - -10 1 1 100 821 155 1911 83 4 5 121 24 2012 20 1 5 20 3 1513 - - - 1581 173 1114 1 1 100 247 10 415 - - - 87 12 1416 - - - 1618 2 017 - - - - - -18 - - - 93 18 1919 15 1 7 60 19 3220 64 1 2 1 1 10021 10 1 10 137 40 2922 - - - 409 83 2023 2 1 50 2684 438 1624 45 1 2 702 132 1925 - - - 323 69 2126 - - - 80 17 2127 - - - 312 73 2328 - - - 283 55 1929 - - - 81 23 2830 - - - 28 9 3231 - - - 193 32 1732 - - - 276 31 1133 - - - - - -35 - - - 60 16 2736 - - - 14 1 737 - - - - - -38 - - - 7 1 1439 - - - - - -41 - - - - - -42 - - - - - -43 - - - - - -45 - - - 188 34 1846 - - - - - -47 125 2 2 - - -
TABLE 1.2
Industry Code (NIC. 2008)
9. Odisha 10. Rajasthan
20
COVERED UNDER THE ACT
SUBMITTING RETURN
% RESPONSE RATE
COVERED UNDER THE ACT
SUBMITTING RETURN
% RESPONSE RATE
1 2 3 4 5 6 749 - - - - - -50 - - - - - -51 - - - - - -52 - - - 30 3 1053 - - - - - -55 - - - - - -56 - - - - - -58 89 6 7 - - -59 - - - - - -60 - - - - - -61 - - - - - -62 - - - - - -63 - - - - - -64 - - - - - -65 - - - - - -66 - - - - - -68 - - - - - -69 - - - - - -70 - - - - - -71 - - - - - -72 - - - - - -73 - - - - - -74 - - - - - -75 - - - - - -77 - - - - - -78 - - - - - -79 - - - - - -80 - - - - - -81 - - - - - -82 - - - - - -84 - - - - - -85 - - - - - -86 - - - - - -87 - - - - - -88 - - - - - -90 - - - - - -91 - - - - - -92 - - - - - -93 - - - - - -94 - - - - - -95 - - - - - -96 - - - - - -97 - - - - - -98 - - - - - -99 - - - - - -
TOTAL 462 21 5 10456 1474 14Note:- -= Information not Reported
TABLE 1.2
Industry Code (NIC. 2008)
9. Odisha 10. Rajasthan
21
COVERED UNDER THE ACT
SUBMITTING RETURN
% RESPONSE RATE
COVERED UNDER THE ACT
SUBMITTING RETURN
% RESPONSE RATE
1 2 3 4 5 6 701 6 5 83 - - -02 - - - - - -03 - - - - - -05 - - - - - -06 - - - - - -07 - - - - - -08 6 6 100 - - -09 - - - - - -10 119 116 97 4 2 5011 - - - - - -12 - - - 8 2 2513 - - - - - -14 - - - - - -15 - - - - - -16 - - - - - -17 - - - - - -18 - - - - - -19 - - - - - -20 - - - - - -21 - - - - - -22 - - - 10 7 7023 - - - - - -24 1 1 100 5 3 6025 61 60 98 26 4 1526 2 2 100 - - -27 8 8 100 - - -28 8 8 100 - - -29 - - - - - -30 - - - - - -31 - - - - - -32 - - - - - -33 - - - - - -35 - - - - - -36 - - - - - -37 - - - - - -38 - - - - - -39 - - - - - -41 - - - - - -42 - - - - - -43 - - - - - -45 - - - 163 27 1746 - - - - - -47 - - - - - -
TABLE 1.2
11. Tamil NaduIndustry Code
(NIC. 2008)
12. Tripura
22
COVERED UNDER THE ACT
SUBMITTING RETURN
% RESPONSE RATE
COVERED UNDER THE ACT
SUBMITTING RETURN
% RESPONSE RATE
1 2 3 4 5 6 749 - - - - - -50 - - - - - -51 - - - - - -52 - - - - - -53 - - - - - -55 - - - - - -56 - - - - - -58 - - - 10 1 1059 - - - - - -60 - - - - - -61 - - - - - -62 - - - - - -63 - - - - - -64 - - - - - -65 - - - - - -66 - - - - - -68 - - - - - -69 - - - - - -70 - - - - - -71 - - - - - -72 - - - - - -73 - - - - - -74 - - - - - -75 - - - - - -77 - - - - - -78 - - - - - -79 - - - - - -80 - - - - - -81 - - - - - -82 - - - - - -84 - - - - - -85 - - - - - -86 - - - - - -87 - - - - - -88 - - - - - -90 - - - - - -91 - - - - - -92 - - - - - -93 - - - - - -94 - - - - - -95 - - - - - -96 - - - - - -97 - - - - - -98 - - - - - -99 - - - - - -
TOTAL 211 206 98 226 46 20Note:- -= Information not Reported
TABLE 1.2
Industry Code (NIC. 2008)
12. Tripura11. Tamil Nadu
23
COVERED UNDER THE ACT
SUBMITTING RETURN
% RESPONSE RATE
COVERED UNDER THE ACT
SUBMITTING RETURN
% RESPONSE RATE
1 2 3 4 5 6 701 - - - - - -02 - - - - - -03 - - - - - -05 - - - - - -06 - - - - - -07 - - - - - -08 - - - - - -09 - - - - - -10 - - - 288 31 1111 - - - 31 5 1612 - - - - - -13 - - - 445 49 1114 - - - - - -15 - - - - - -16 - - - - - -17 - - - - - -18 - - - - - -19 - - - - - -20 - - - - - -21 - - - - - -22 - - - - - -23 - - - - - -24 - - - - - -25 - - - - - -26 - - - - - -27 - - - - - -28 2 2 100 - - -29 - - - - - -30 - - - - - -31 - - - - - -32 - - - - - -33 - - - - - -35 - - - - - -36 - - - - - -37 - - - - - -38 - - - - - -39 - - - - - -41 - - - - - -42 - - - - - -43 - - - - - -45 - - - - - -46 - - - - - -47 - - - - - -
TABLE 1.2
Industry Code (NIC. 2008)
14. West Bengal 13. Uttrakhand
24
COVERED UNDER THE ACT
SUBMITTING RETURN
% RESPONSE RATE
COVERED UNDER THE ACT
SUBMITTING RETURN
% RESPONSE RATE
1 2 3 4 5 6 749 - - - - - -50 - - - - - -51 - - - - - -52 - - - 52 9 1753 - - - - - -55 - - - - - -56 - - - - - -58 - - - - - -59 - - - - - -60 - - - - - -61 - - - - - -62 - - - - - -63 - - - - - -64 - - - - - -65 - - - - - -66 - - - - - -68 - - - - - -69 - - - - - -70 - - - - - -71 - - - - - -72 - - - - - -73 - - - - - -74 - - - - - -75 - - - - - -77 - - - - - -78 - - - - - -79 - - - - - -80 - - - - - -81 - - - - - -82 - - - - - -84 - - - - - -85 - - - - - -86 - - - - - -87 - - - - - -88 - - - - - -90 - - - - - -91 - - - - - -92 - - - - - -93 - - - - - -94 - - - - - -95 - - - - - -96 - - - - - -97 - - - - - -98 - - - - - -99 - - - - - -
TOTAL 2 2 100 816 94 12Note:- -= Information not Reported
TABLE 1.2
14. West Bengal 13. Uttrakhand Industry Code
(NIC. 2008)
25
COVERED UNDER THE ACT
SUBMITTING RETURN
% RESPONSE RATE
COVERED UNDER THE ACT
SUBMITTING RETURN
% RESPONSE RATE
1 2 3 4 5 6 701 2 2 100 - - -02 - - - - - -03 - - - - - -05 - - - - - -06 - - - - - -07 - - - - - -08 - - - - - -09 - - - - - -10 - - - 5 5 10011 - - - 1 1 10012 - - - - - -13 - - - 1 1 10014 - - - - - -15 3 2 67 - - -16 - - - 11 11 10017 - - - 3 3 10018 - - - 5 5 10019 1 1 100 1 1 10020 - - - - - -21 - - - 2 2 10022 - - - 1 1 10023 - - - 2 2 10024 - - - 5 5 10025 - - - 14 14 10026 - - - - - -27 - - - 12 12 10028 - - - 18 18 10029 - - - 3 3 10030 - - - 2 2 10031 - - - - - -32 - - - 1 1 10033 - - - - - -35 - - - - - -36 - - - - - -37 - - - - - -38 - - - - - -39 - - - - - -41 - - - - - -42 - - - - - -43 - - - - - -45 - - - 9 9 10046 - - - - - -47 - - - - - -
TABLE 1.2
Industry Code (NIC. 2008)
16.Chandigarh15.A & N Islands
26
COVERED UNDER THE ACT
SUBMITTING RETURN
% RESPONSE RATE
COVERED UNDER THE ACT
SUBMITTING RETURN
% RESPONSE RATE
1 2 3 4 5 6 749 - - - - - -50 - - - - - -51 - - - - - -52 - - - - - -53 - - - - - -55 - - - - - -56 - - - - - -58 - - - - - -59 - - - - - -60 - - - - - -61 - - - - - -62 - - - - - -63 - - - - - -64 - - - - - -65 - - - - - -66 - - - - - -68 - - - - - -69 - - - - - -70 - - - - - -71 - - - - - -72 - - - - - -73 - - - - - -74 - - - - - -75 - - - - - -77 - - - - - -78 - - - - - -79 - - - - - -80 - - - - - -81 - - - - - -82 - - - - - -84 - - - - - -85 - - - - - -86 - - - - - -87 - - - - - -88 - - - - - -90 - - - - - -91 - - - - - -92 - - - - - -93 - - - - - -94 - - - - - -95 - - - - - -96 - - - - - -97 - - - - - -98 - - - - - -99 - - - - - -
TOTAL 6 5 83 96 96 100Note:- -= Information not Reported
TABLE 1.2
16.Chandigarh15.A & N Islands Industry Code
(NIC. 2008)
27
COVERED UNDER THE ACT
SUBMITTING RETURN
% RESPONSE RATE
COVERED UNDER THE ACT
SUBMITTING RETURN
% RESPONSE RATE
1 2 3 4 5 6 701 - - - - - -02 - - - - - -03 - - - - - -05 - - - - - -06 - - - - - -07 - - - - - -08 - - - - - -09 - - - - - -10 - - - 10 10 10011 - - - 1 1 10012 - - - 1 1 10013 1 1 100 2 2 10014 - - - 7 7 10015 - - - 18 18 10016 - - - 2 2 10017 - - - - - -18 - - - 20 20 10019 - - - 2 2 10020 6 6 100 2 2 10021 15 15 100 2 2 10022 59 59 100 19 19 10023 2 2 100 2 2 10024 10 10 100 16 16 10025 - - - 14 14 10026 - - - 5 5 10027 31 31 100 13 13 10028 8 8 100 11 11 10029 - - - 8 8 10030 - - - 2 2 10031 2 2 100 2 2 10032 10 10 100 4 4 10033 - - - 1 1 10035 - - - - - -36 - - - - - -37 - - - - - -38 - - - - - -39 - - - - - -41 - - - - - -42 - - - 1 1 10043 - - - - - -45 - - - 12 12 10046 - - - 2 2 10047 - - - 7 7 100
TABLE 1.2
18.DelhiIndustry Code
(NIC. 2008)
17.Daman & Diu
28
COVERED UNDER THE ACT
SUBMITTING RETURN
% RESPONSE RATE
COVERED UNDER THE ACT
SUBMITTING RETURN
% RESPONSE RATE
1 2 3 4 5 6 749 - - - - - -50 - - - - - -51 - - - - - -52 - - - - - -53 - - - - - -55 - - - - - -56 - - - 1 1 10058 - - - - - -59 - - - - - -60 - - - - - -61 - - - - - -62 - - - - - -63 - - - - - -64 - - - - - -65 - - - - - -66 - - - - - -68 - - - - - -69 - - - - - -70 - - - - - -71 - - - 1 1 10072 - - - - - -73 - - - - - -74 - - - 1 1 10075 - - - - - -77 - - - - - -78 - - - - - -79 - - - - - -80 - - - - - -81 - - - - - -82 - - - - - -84 - - - - - -85 - - - - - -86 - - - - - -87 - - - - - -88 - - - - - -90 - - - - - -91 - - - 1 1 10092 - - - - - -93 - - - - - -94 - - - - - -95 - - - - - -96 - - - - - -97 - - - - - -98 - - - - - -99 - - - - - -
TOTAL 144 144 100 190 190 100Note:- -= Information not Reported
TABLE 1.2
17.Daman & Diu 18.DelhiIndustry Code
(NIC. 2008)
29
COVERED UNDER THE ACT
SUBMITTING RETURN
% RESPONSE RATE
COVERED UNDER THE ACT
SUBMITTING RETURN
% RESPONSE RATE
1 2 3 4 5 6 701 - - - 977 286 2902 - - - 9 4 4403 - - - - - -05 - - - - - -06 - - - - - -07 - - - - - -08 - - - 739 137 1909 - - - 1 1 10010 - - - 15867 4512 2811 - - - 580 173 3012 - - - 78 21 2713 - - - 4329 607 1414 - - - 1281 119 915 3 3 100 720 116 1616 - - - 5016 804 1617 2 2 100 767 279 3618 - - - 642 196 3119 - - - 199 53 2720 7 7 100 1189 485 4121 1 1 100 878 383 4422 4 4 100 2188 730 3323 3 3 100 9235 2329 2524 2 2 100 2585 636 2525 2 2 100 2948 701 2426 11 11 100 1591 226 1427 6 6 100 1355 520 3828 4 4 100 2962 630 2129 2 2 100 736 164 2230 - - - 124 37 3031 - - - 367 77 2132 2 2 100 459 130 2833 - - - 8 5 6335 - - - 212 82 3936 - - - 30 4 1337 - - - 3 2 6738 - - - 41 11 2739 - - - - - -41 - - - - - -42 - - - 73 9 1243 - - - 2 2 10045 - - - 1010 269 2746 - - - 95380 4858 547 3 3 100 18942 214 1
TABLE 1.2…Concld.
19. All State/ UT19.PuducherryIndustry Code
(NIC. 2008)
30
COVERED UNDER THE ACT
SUBMITTING RETURN
% RESPONSE RATE
COVERED UNDER THE ACT
SUBMITTING RETURN
% RESPONSE RATE
1 2 3 4 5 6 749 - - - 64 12 1950 - - - 2 2 10051 - - - - - -52 - - - 394 59 1553 - - - - - -55 - - - 28 16 5756 - - - 2614 150 658 - - - 101 9 959 - - - 69 26 3860 - - - - - -61 - - - - - -62 - - - 1 1 10063 - - - - - -64 - - - 426 153 3665 - - - 1 1 10066 - - - - - -68 - - - - - -69 - - - - - -70 - - - - - -71 - - - 1 1 10072 - - - 3 3 10073 - - - - - -74 - - - 23 23 10075 - - - - - -77 - - - - - -78 - - - - - -79 - - - - - -80 - - - 93 11 1281 - - - - - -82 - - - 9 7 7884 - - - - - -85 - - - - - -86 - - - 361 56 1687 - - - - - -88 - - - - - -90 - - - 8 6 7591 - - - 1 1 10092 - - - - - -93 - - - - - -94 - - - - - -95 - - - - - -96 - - - 1 1 10097 - - - - - -98 - - - - - -99 - - - - - -
TOTAL 52 52 100 177723 20350 11Note:- -= Information not Reported
Industry Code (NIC. 2008)
TABLE 1.2…Concld.
19.Puducherry 19. All State/ UT
31
% RESPONSE RATE
1 2 3 4 51 ANDHRA PRADESH 29220 9360 322 ASSAM 1699 27 23 GOA 15 15 1004 HARYANA 8582 614 75 HIMACHAL PRADESH 1041 1041 1006 JAMMU & KASHMIR 119 119 1007 KARNATAKA 2933 450 158 KERALA 624 125 209 ODISHA 241 12 5
10 RAJASTHAN 10157 1419 1411 TAMILNADU 199 195 9812 TRIPURA 53 18 3413 UTTRAKHAND 2 2 10014 WEST BENGAL 764 85 1115 A.& N. ISLANDS 4 3 7516 CHANDIGARH 87 87 10017 DAMAN & DIU 144 144 10018 DELHI 163 163 10019 PUDUCHARRY 49 49 100
TOTAL 56096 13928 25Note:- Rest of the States/U.Ts not submited Annual Return
TABLE 1.3Number of Eastablishments Submitting Return under
The Payment of Wages Act, 1936 during 2012Manufacturing Industries
Sl.No. STATE NO OF UNITCOVERED UNDER
THE ACTSUBMITTING RETURN
32
COVERED UNDER THE ACT
SUBMITTING RETURN
% RESPONSE RATE
COVERED UNDER THE ACT
SUBMITTING RETURN
% RESPONSE RATE
1 2 3 4 5 6 710 13408 4017 30 - - -11 283 107 38 - - -12 7 6 86 - - -13 538 201 37 - - -14 135 42 31 - - -15 - - - 329 5 216 2907 744 26 28 12 4317 597 189 32 - - -18 278 115 41 - - -19 81 24 30 - - -20 641 291 45 - - -21 413 154 37 - - -22 1039 378 36 - - -23 5258 1808 34 - - -24 797 311 39 93 3 325 1522 424 28 - - -26 155 76 49 1075 2 027 402 168 42 78 3 428 392 161 41 96 2 229 140 50 36 - - -30 15 9 60 - - -31 112 29 26 - - -32 100 56 56 - - -
TOTAL 29220 9360 32 1699 27 2Note:- -= Information not Reported
PAYMENT OF WAGES ACT, 1936 DURING 2012
TABLE 1.4
NUMBER OF ESTABLISHMENTS SUBMITTING RETERNS UNDER THE
Industry Code (NIC.
2008)
1.Andhra Pradesh 2.AssamManufacturing Industries
33
COVERED UNDER THE ACT
SUBMITTING RETURN
% RESPONSE RATE
COVERED UNDER THE ACT
SUBMITTING RETURN
% RESPONSE RATE
1 2 3 4 5 6 710 - - - 581 31 511 - - - 19 4 2112 - - - 18 4 2213 1 1 100 973 61 614 - - - 886 54 615 1 1 100 232 38 1616 - - - 312 9 317 - - - 90 10 1118 - - - 67 5 719 - - - 37 3 820 - - - 303 40 1321 1 1 100 124 8 622 - - - 433 38 923 - - - 1114 32 324 6 6 100 813 56 725 1 1 100 928 56 626 - - - 168 18 1127 2 2 100 318 31 1028 - - - 525 47 929 - - - 469 45 1030 - - - 74 12 1631 3 3 100 48 2 432 - - - 50 10 20
TOTAL 15 15 100 8582 614 7Note:- -= Information not Reported
4.HaryanaIndustry Code
(NIC. 2008)
3.Goa
TABLE 1.4
34
COVERED UNDER THE ACT
SUBMITTING RETURN
% RESPONSE RATE
COVERED UNDER THE ACT
SUBMITTING RETURN
% RESPONSE RATE
1 2 3 4 5 6 710 43 43 100 7 7 10011 12 12 100 2 2 10012 4 4 100 - - -13 37 37 100 4 4 10014 5 5 100 - - -15 24 24 100 1 1 10016 9 9 100 1 1 10017 71 71 100 4 4 10018 6 6 100 - - -19 1 1 100 1 1 10020 99 99 100 29 29 10021 148 148 100 8 8 10022 107 107 100 12 12 10023 9 9 100 1 1 10024 69 69 100 20 20 10025 44 44 100 13 13 10026 92 92 100 1 1 10027 164 164 100 9 9 10028 44 44 100 2 2 10029 32 32 100 1 1 10030 3 3 100 - - -31 7 7 100 - - -32 11 11 100 3 3 100
TOTAL 1041 1041 100 119 119 100Note:- -= Information not Reported
TABLE 1.4
6. Jammu & KashmirIndustry Code
(NIC. 2008)
5. Himachal Pradesh

35
COVERED UNDER THE ACT
SUBMITTING RETURN
% RESPONSE RATE
COVERED UNDER THE ACT
SUBMITTING RETURN
% RESPONSE RATE
1 2 3 4 5 6 710 449 66 15 131 28 2111 14 4 29 13 9 6912 - - - - - -13 708 55 8 38 22 5814 - - - - - -15 - - - 22 12 5516 81 10 12 47 4 917 - - - - - -18 160 14 9 13 13 10019 - - - - - -20 13 8 62 24 1 421 2 1 50 15 2 1322 87 20 23 8 2 2523 41 17 41 117 14 1224 1 1 100 - - -25 - - - - - -26 2 2 100 - - -27 - - - - - -28 1375 252 18 194 16 829 - - - - - -30 - - - - - -31 - - - - - -32 - - - 2 2 100
TOTAL 2933 450 15 624 125 20Note:- -= Information not Reported
TABLE 1.4
Industry Code (NIC. 2008)
7. Karnataka 8. Kerala
36
COVERED UNDER THE ACT
SUBMITTING RETURN
% RESPONSE RATE
COVERED UNDER THE ACT
SUBMITTING RETURN
% RESPONSE RATE
1 2 3 4 5 6 710 1 1 100 821 155 1911 83 4 5 121 24 2012 20 1 5 20 3 1513 - - - 1581 173 1114 1 1 100 247 10 415 - - - 87 12 1416 - - - 1618 2 017 - - - - - -18 - - - 93 18 1919 15 1 7 60 19 3220 64 1 2 1 1 10021 10 1 10 137 40 2922 - - - 409 83 2023 2 1 50 2684 438 1624 45 1 2 702 132 1925 - - - 323 69 2126 - - - 80 17 2127 - - - 312 73 2328 - - - 283 55 1929 - - - 81 23 2830 - - - 28 9 3231 - - - 193 32 1732 - - - 276 31 11
TOTAL 241 12 5 10157 1419 14Note:- -= Information not Reported
Industry Code (NIC. 2008)
TABLE 1.4
9. Odisha 10. Rajasthan
37
COVERED UNDER THE ACT
SUBMITTING RETURN
% RESPONSE RATE
COVERED UNDER THE ACT
SUBMITTING RETURN
% RESPONSE RATE
1 2 3 4 5 6 710 119 116 97 4 2 5011 - - - - - -12 - - - 8 2 2513 - - - - - -14 - - - - - -15 - - - - - -16 - - - - - -17 - - - - - -18 - - - - - -19 - - - - - -20 - - - - - -21 - - - - - -22 - - - 10 7 7023 - - - - - -24 1 1 100 5 3 6025 61 60 98 26 4 1526 2 2 100 - - -27 8 8 100 - - -28 8 8 100 - - -29 - - - - - -30 - - - - - -31 - - - - - -32 - - - - - -
TOTAL 199 195 98 53 18 34Note:- -= Information not Reported
11. Tamil Nadu 12. Tripura
TABLE 1.4
Industry Code (NIC. 2008)
38
COVERED UNDER THE ACT
SUBMITTING RETURN
% RESPONSE RATE
COVERED UNDER THE ACT
SUBMITTING RETURN
% RESPONSE RATE
1 2 3 4 5 6 710 - - - 288 31 1111 - - - 31 5 1612 - - - - - -13 - - - 445 49 1114 - - - - - -15 - - - - - -16 - - - - - -17 - - - - - -18 - - - - - -19 - - - - - -20 - - - - - -21 - - - - - -22 - - - - - -23 - - - - - -24 - - - - - -25 - - - - - -26 - - - - - -27 - - - - - -28 2 2 100 - - -29 - - - - - -30 - - - - - -31 - - - - - -32 - - - - - -
TOTAL 2 2 100 764 85 11Note:- -= Information not Reported
Industry Code (NIC. 2008)
TABLE 1.4
13. Uttrakhand 14. West Bengal
39
COVERED UNDER THE ACT
SUBMITTING RETURN
% RESPONSE RATE
COVERED UNDER THE ACT
SUBMITTING RETURN
% RESPONSE RATE
1 2 3 4 5 6 710 - - - 5 5 10011 - - - 1 1 10012 - - - - - -13 - - - 1 1 10014 - - - - - -15 3 2 67 - - -16 - - - 11 11 10017 - - - 3 3 10018 - - - 5 5 10019 1 1 100 1 1 10020 - - - - - -21 - - - 2 2 10022 - - - 1 1 10023 - - - 2 2 10024 - - - 5 5 10025 - - - 14 14 10026 - - - - - -27 - - - 12 12 10028 - - - 18 18 10029 - - - 3 3 10030 - - - 2 2 10031 - - - - - -32 - - - 1 1 100
TOTAL 4 3 75 87 87 100Note:- -= Information not Reported
16.Chandigarh
TABLE 1.4
Industry Code (NIC. 2008)
15.A & N Islands
40
COVERED UNDER THE ACT
SUBMITTING RETURN
% RESPONSE RATE
COVERED UNDER THE ACT
SUBMITTING RETURN
% RESPONSE RATE
1 2 3 4 5 6 710 - - - 10 10 10011 - - - 1 1 10012 - - - 1 1 10013 1 1 100 2 2 10014 - - - 7 7 10015 - - - 18 18 10016 - - - 2 2 10017 - - - - - -18 - - - 20 20 10019 - - - 2 2 10020 6 6 100 2 2 10021 15 15 100 2 2 10022 59 59 100 19 19 10023 2 2 100 2 2 10024 10 10 100 16 16 10025 - - - 14 14 10026 - - - 5 5 10027 31 31 100 13 13 10028 8 8 100 11 11 10029 - - - 8 8 10030 - - - 2 2 10031 2 2 100 2 2 10032 10 10 100 4 4 100
TOTAL 144 144 100 163 163 100Note:- -= Information not Reported
Industry Code (NIC. 2008)
TABLE 1.4
18.Delhi17.Daman & Diu
41
COVERED UNDER
SUBMITTING RETURN
% RESPONSE
COVERED UNDER
SUBMITTING RETURN
% RESPONSE
1 2 3 4 5 6 710 - - - 15867 4512 2811 - - - 580 173 3012 - - - 78 21 2713 - - 100 4329 607 1414 - - 100 1281 119 915 3 3 100 720 116 1616 - - 100 5016 804 1617 2 2 100 767 279 3618 - - 100 642 196 3119 - - - 199 53 2720 7 7 100 1189 485 4121 1 1 100 878 383 4422 4 4 100 2188 730 3323 3 3 100 9235 2329 2524 2 2 100 2585 636 2525 2 2 100 2948 701 2426 11 11 100 1591 226 1427 6 6 100 1355 520 3828 4 4 100 2962 630 2129 2 2 100 736 164 2230 - - - 124 37 3031 - - 100 367 77 2132 2 2 100 459 130 28
TOTAL 49 49 100 56096 13928 25Note:- -= Information not Reported
TABLE 1.4…Concld.
Industry Code (NIC.
2008)
19.Puducherry 19. All State/ UT
42
1 2 3 4 51 ANDHRA PRADESH 3286082 126375590 1296616722 ASSAM - 215413 2154133 GOA - 429535 4295354 HARYANA - 21436727 214367275 HIMACHAL PRADESH - 25748873 257488736 JAMMU & KASHMIR 190658 3307791 34984497 KARNATAKA - 31523170 315231708 KERALA 524498 4434408 49589069 ODISHA - 105011 105011
10 RAJASTHAN 611843 43630968 4424281111 TAMILNADU 91373326 - 9137332612 TRIPURA - 329843 32984313 UTTRAKHAND - 2532 253214 WEST BENGAL - 14327389 1432738915 A.& N. ISLANDS 27000 7500 3450016 CHANDIGARH - 502195 50219517 DAMAN & DIU - 6303328 630332818 DELHI 17336 1222572 123990819 PUDUCHARRY - 1826997 1826997
TOTAL 96030743 281729842 377760585Note:- Rest of the States/U.Ts not submited Annual Return
TABLE 2.1NUMBER OF MANDAYS WORKED BY ESTABLISHMENTS DURING 2012
(BY SECTORS OF STATES/UNION TERRITORIES)
ALL INDUSTRIES.
Sl.No. STATE PUBLIC SECTOR PRIVATE SECTOR TOTAL
43
PUBLIC SECTOR
PRIVATE SECTOR
TOTAL PUBLIC SECTOR
PRIVATE SECTOR
TOTAL PUBLIC SECTOR
PRIVATE SECTOR
TOTAL
1 2 3 4 5 6 7 8 9 1001 3774 785643 789417 - - - - - -02 - - - - - - - - -03 - - - - - - - - -05 - - - - - - - - -06 - - - - - - - - -07 - - - - - - - - -08 - 621216 621216 - - - - - -09 - - - - - - - - -10 413083 40175425 40588508 - - - - - -11 - 2142547 2142547 - - - - - -12 - 705688 705688 - - - - - -13 21590 7227227 7248817 - - - - 5490 549014 - 4199186 4199186 - - - - - -15 - - - - 23481 23481 - 21816 2181616 - 1614034 1614034 - 112240 112240 - - -17 - 4159652 4159652 - - - - - -18 147583 1160088 1307671 - - - - - -19 51492 2241440 2292932 - - - - - -20 1208 10123623 10124831 - - - - - -21 - 5959002 5959002 - - - - 10908 1090822 60630 5797380 5858010 - - - - - -23 47865 9440123 9487988 - - - - - -24 - 5741623 5741623 - 37376 37376 - 89395 8939525 31266 5498244 5529510 - - - - 12744 1274426 - 3662069 3662069 - 14715 14715 - - -27 14100 3132478 3146578 - 16359 16359 - 28932 2893228 - 4123073 4123073 - 11242 11242 - - -29 60955 1883661 1944616 - - - - - -30 - 246151 246151 - - - - - -31 - 295629 295629 - - - - 67121 6712132 - 967707 967707 - - - - - -33 - 59568 59568 - - - - 305 30535 2366444 1046822 3413266 - - - - - -36 11438 8665 20103 - - - - - -37 - 5822 5822 - - - - - -38 - 88346 88346 - - - - - -39 - - - - - - - - -41 - - - - - - - - -42 - - - - - - - - -43 - 5184 5184 - - - - - -45 - 2004898 2004898 - - - - - -46 - 118363 118363 - - - - - -47 - 6900 6900 - - - - - -
TABLE 2.2NUMBER OF MANDAYS WORKED BY ESTABLISHMENTS DURING 2012
(BY SECTORS OF STATES/UNION TERRITORIES)All Industries
3.GoaNIC- 2008
1.Andhra Pradesh 2.Assam
44
PUBLIC SECTOR
PRIVATE SECTOR
TOTAL PUBLIC SECTOR
PRIVATE SECTOR
TOTAL PUBLIC SECTOR
PRIVATE SECTOR
TOTAL
1 2 3 4 5 6 7 2 3 449 13614 38478 52092 - - - - - -50 - - - - - - - 13365 1336551 - - - - - - - - -52 41040 350203 391243 - - - - - -53 - - - - - - - - -55 - - - - - - - 123619 12361956 - - - - - - - - -58 - 20230 20230 - - - - - -59 - 105096 105096 - - - - - -60 - - - - - - - - -61 - - - - - - - - -62 - - - - - - - - -63 - - - - - - - - -64 - - - - - - - - -65 - - - - - - - - -66 - - - - - - - - -68 - - - - - - - - -69 - - - - - - - - -70 - - - - - - - - -71 - - - - - - - - -72 - 333550 333550 - - - - - -73 - - - - - - - - -75 - - - - - - - 55840 5584074 - - - - - - - - -77 - - - - - - - - -78 - - - - - - - - -79 - - - - - - - - -80 - - - - - - - - -81 - - - - - - - - -82 - 272636 272636 - - - - - -84 - - - - - - - - -85 - - - - - - - - -86 - 3540 3540 - - - - - -87 - - - - - - - - -88 - - - - - - - - -90 - 4380 4380 - - - - - -91 - - - - - - - - -92 - - - - - - - - -93 - - - - - - - - -94 - - - - - - - - -95 - - - - - - - - -96 - - - - - - - - -97 - - - - - - - - -98 - - - - - - - - -99 - - - - - - - - -
TOTAL 3286082 126375590 129661672 - 215413 215413 - 429535 429535Note:- -= Information not Reported
TABLE 2.2
3.GoaNIC- 2008
1.Andhra Pradesh 2.Assam
45
PUBLIC SECTOR
PRIVATE SECTOR
TOTAL PUBLIC SECTOR
PRIVATE SECTOR
TOTAL PUBLIC SECTOR
PRIVATE SECTOR
TOTAL
1 2 3 4 5 6 7 8 9 1001 - 7145 7145 - 25307 25307 - - -02 - - - - - - - - -03 - - - - - - - - -05 - - - - - - - - -06 - - - - - - - - -07 - - - - - - - - -08 - 14598 14598 - 2545 2545 - - -09 - 12160 12160 - - - - - -10 - 291312 291312 - 1224822 1224822 - 64878 6487811 - 241815 241815 - 933487 933487 19866 19866 3973212 - 18800 18800 - 77806 77806 - - -13 - 2042639 2042639 - 3280439 3280439 4576 1797305 180188114 - 5770799 5770799 - 34831 34831 - - -15 - 2051130 2051130 - 873330 873330 - 17024 1702416 - 93529 93529 - 338444 338444 - 9120 912017 - 54420 54420 - 707520 707520 - 71381 7138118 - 34316 34316 - 109460 109460 - - -19 - 17897 17897 - 1003 1003 - 2093 209320 - 561064 561064 - 2133431 2133431 62099 355580 41767921 - 71869 71869 - 3635601 3635601 7904 217133 22503722 - 551064 551064 - 1277001 1277001 2490 99786 10227623 - 830932 830932 - 283150 283150 - 7677 767724 - 762359 762359 - 1141741 1141741 62129 236458 29858725 - 1153235 1153235 - 823768 823768 - 121921 12192126 - 1374406 1374406 - 2663851 2663851 - 10640 1064027 - 1055561 1055561 - 3421888 3421888 4256 175046 17930228 - 1445576 1445576 - 997472 997472 - 25872 2587229 - 1491345 1491345 - 439833 439833 - 2692 269230 - 672319 672319 - 85516 85516 - - -31 - 6824 6824 - 245938 245938 - - -32 - 708427 708427 - 144804 144804 11260 - 1126033 - - - - - - - - -35 - 4767 4767 - 364834 364834 - - -36 - - - - - - - - -37 - - - - - - - - -38 - - - - - - - - -39 - - - - - - - - -41 - - - - - - - - -42 - - - - - - - - -43 - - - - - - - 2432 243245 - 88894 88894 - 403886 403886 - - -46 - - - - - - - - -47 - - - - - - - - -
NIC- 2008 4.Haryana 5.Himachal Pradesh 6.Jammu & Kashmir
TABLE 2.2
46
PUBLIC SECTOR
PRIVATE SECTOR
TOTAL PUBLIC SECTOR
PRIVATE SECTOR
TOTAL PUBLIC SECTOR
PRIVATE SECTOR
TOTAL
1 2 3 4 5 6 7 2 3 449 - - - - - - - - -50 - - - - - - - - -51 - - - - - - - - -52 - 7525 7525 - - - 16078 38993 5507153 - - - - - - - - -55 - - - - 42822 42822 - - -56 - - - - - - - - -58 - - - - - - - - -59 - - - - - - - - -60 - - - - - - - - -61 - - - - - - - - -62 - - - - - - - 13084 1308463 - - - - - - - - -64 - - - - - - - - -65 - - - - 606 606 - - -66 - - - - - - - - -68 - - - - - - - - -69 - - - - - - - - -70 - - - - - - - - -71 - - - - - - - - -72 - - - - - - - - -73 - - - - - - - - -75 - - - - - - - - -74 - - - - - - - - -77 - - - - - - - - -78 - - - - - - - - -79 - - - - - - - - -80 - - - - - - - - -81 - - - - - - - - -82 - - - - 33737 33737 - 18811 1881184 - - - - - - - - -85 - - - - - - - - -86 - - - - - - - - -87 - - - - - - - - -88 - - - - - - - - -90 - - - - - - - - -91 - - - - - - - - -92 - - - - - - - - -93 - - - - - - - - -94 - - - - - - - - -95 - - - - - - - - -96 - - - - - - - - -97 - - - - - - - - -98 - - - - - - - - -99 - - - - - - - - -
TOTAL - 21436727 21436727 - 25748873 25748873 190658 3307791 3498449Note:- -= Information not Reported
NIC- 2008
TABLE 2.2
4.Haryana 5.Himachal Pradesh 6.Jammu & Kashmir
47
PUBLIC SECTOR
PRIVATE SECTOR
TOTAL PUBLIC SECTOR
PRIVATE SECTOR
TOTAL PUBLIC SECTOR
PRIVATE SECTOR
TOTAL
1 2 3 4 5 6 7 8 9 1001 - 37440 37440 524498 3129856 3654354 - - -02 - 8512 8512 - - - - - -03 - - - - - - - - -05 - - - - - - - - -06 - - - - - - - - -07 - - - - - - - - -08 - 18933 18933 - - - - 15756 1575609 - - - - - - - - -10 - 164131 164131 - 254074 254074 - 3612 361211 - 9517 9517 - 17980 17980 - 6378 637812 - - - - - - - 17690 1769013 - 652264 652264 - 131010 131010 - - -14 - - - - - - - 3672 367215 - - - - 318127 318127 - - -16 - 20940 20940 - 11902 11902 - - -17 - - - - - - - - -18 - 49438 49438 - 21960 21960 - - -19 - - - - - - - 3636 363620 - 466343 466343 - 2610 2610 - 1525 152521 - 2424 2424 - 7164 7164 - 3366 336622 - 45886 45886 - 31940 31940 - - -23 - 277690 277690 - 83077 83077 - 18668 1866824 - 22200 22200 - - - - 6710 671025 - - - - - - - - -26 - 24160 24160 - - - - - -27 - - - - - - - - -28 - 2300330 2300330 - 54733 54733 - - -29 - - - - - - - - -30 - - - - - - - - -31 - - - - - - - - -32 - - - - 3456 3456 - - -33 - - - - - - - - -35 - - - - - - - - -36 - - - - - - - - -37 - - - - - - - - -38 - - - - - - - - -39 - - - - - - - - -41 - - - - - - - - -42 - 72020 72020 - - - - - -43 - - - - - - - - -45 - - - - - - - - -46 - 24675413 24675413 - - - - - -47 - 310615 310615 - 167987 167987 - 15626 15626
NIC- 2008 7.Karnataka 8.Kerala 9.Odisha
TABLE 2.2
48
PUBLIC SECTOR
PRIVATE SECTOR
TOTAL PUBLIC SECTOR
PRIVATE SECTOR
TOTAL PUBLIC SECTOR
PRIVATE SECTOR
TOTAL
1 2 3 4 5 6 7 2 3 449 - 52925 52925 - - - - - -50 - - - - - - - - -51 - - - - - - - - -52 - - - - 532 532 - - -53 - - - - - - - - -55 - 20928 20928 - 5985 5985 - - -56 - 568045 568045 - - - - - -58 - - - - - - - 8372 837259 - 68620 68620 - - - - - -60 - - - - - - - - -61 - - - - - - - - -62 - - - - - - - - -63 - - - - - - - - -64 - 371472 371472 - - - - - -65 - - - - - - - - -66 - - - - - - - - -68 - - - - - - - - -69 - - - - - - - - -70 - - - - - - - - -71 - - - - - - - - -72 - - - - - - - - -73 - - - - - - - - -75 - - - - 28288 28288 - - -74 - - - - - - - - -77 - - - - - - - - -78 - - - - - - - - -79 - - - - - - - - -80 - 234720 234720 - - - - - -81 - - - - - - - - -82 - - - - - - - - -84 - - - - - - - - -85 - - - - - - - - -86 - 1044265 1044265 - 158147 158147 - - -87 - - - - - - - - -88 - - - - - - - - -90 - - - - 5580 5580 - - -91 - - - - - - - - -92 - - - - - - - - -93 - - - - - - - - -94 - - - - - - - - -95 - - - - - - - - -96 - 3939 3939 - - - - - -97 - - - - - - - - -98 - - - - - - - - -99 - - - - - - - - -
TOTAL - 31523170 31523170 524498 4434408 4958906 - 105011 105011Note:- -= Information not Reported
NIC- 2008 7.Karnataka 8.Kerala
TABLE 2.2
9.Odisha
49
PUBLIC SECTOR
PRIVATE SECTOR
TOTAL PUBLIC SECTOR
PRIVATE SECTOR
TOTAL PUBLIC SECTOR
PRIVATE SECTOR
TOTAL
1 2 3 4 5 6 7 8 9 1001 - - - 204525 - 204525 - - -02 - - - - - - - - -03 - - - - - - - - -05 - - - - - - - - -06 - - - - - - - - -07 - - - - - - - - -08 - - - 677484 - 677484 - - -09 - - - - - - - - -10 72643 1886088 1958731 58538421 - 58538421 - 6508 650811 - 382668 382668 - - - - - -12 - 123024 123024 - - - - 59598 5959813 - 12917790 12917790 - - - - - -14 - 577941 577941 - - - - - -15 - 605649 605649 - - - - - -16 - 2656 2656 - - - - - -17 - - - - - - - - -18 - 229959 229959 - - - - - -19 - 266105 266105 - - - - - -20 25986 - 25986 - - - - - -21 - 691446 691446 - - - - - -22 - 1220020 1220020 - - - - 125184 12518423 - 13308988 13308988 - - - - - -24 470509 2713121 3183630 17442 - 17442 - 32522 3252225 - 2292943 2292943 29292898 - 29292898 - 4398 439826 - 303450 303450 18180 - 18180 - - -27 - 1583628 1583628 1720692 - 1720692 - - -28 - 1832953 1832953 910284 - 910284 - - -29 - 769458 769458 - - - - - -30 - 200175 200175 - - - - - -31 - 296186 296186 - - - - - -32 - 498332 498332 - - - - - -33 - - - - - - - - -35 - 311457 311457 - - - - - -36 42705 - 42705 - - - - - -37 - - - - - - - - -38 - 7344 7344 - - - - - -39 - - - - - - - - -41 - - - - - - - - -42 - - - - - - - - -43 - - - - - - - - -45 - 445144 445144 - - - - 99863 9986346 - - - - - - - - -47 - - - - - - - - -
11.Tamil NaduNIC- 2008 10.Rajasthan 12.Tripura
TABLE 2.2
50
PUBLIC SECTOR
PRIVATE SECTOR
TOTAL PUBLIC SECTOR
PRIVATE SECTOR
TOTAL PUBLIC SECTOR
PRIVATE SECTOR
TOTAL
1 2 3 4 5 6 7 2 3 449 - - - - - - - - -50 - - - - - - - - -51 - - - - - - - - -52 - 164443 164443 - - - - - -53 - - - - - - - - -55 - - - - - - - - -56 - - - - - - - - -58 - - - - - - - 1770 177059 - - - - - - - - -60 - - - - - - - - -61 - - - - - - - - -62 - - - - - - - - -63 - - - - - - - - -64 - - - - - - - - -65 - - - - - - - - -66 - - - - - - - - -68 - - - - - - - - -69 - - - - - - - - -70 - - - - - - - - -71 - - - - - - - - -72 - - - - - - - - -73 - - - - - - - - -75 - - - - - - - - -74 - - - - - - - - -77 - - - - - - - - -78 - - - - - - - - -79 - - - - - - - - -80 - - - - - - - - -81 - - - - - - - - -82 - - - - - - - - -84 - - - - - - - - -85 - - - - - - - - -86 - - - - - - - - -87 - - - - - - - - -88 - - - - - - - - -90 - - - - - - - - -91 - - - - - - - - -92 - - - - - - - - -93 - - - - - - - - -94 - - - - - - - - -95 - - - - - - - - -96 - - - - - - - - -97 - - - - - - - - -98 - - - - - - - - -99 - - - - - - - - -
TOTAL 611843 43630968 44242811 91379926 - 91379926 - 329843 329843Note:- -= Information not Reported
11.Tamil Nadu 12.TripuraNIC- 2008 10.Rajasthan
TABLE 2.2
51
PUBLIC SECTOR
PRIVATE SECTOR
TOTAL PUBLIC SECTOR
PRIVATE SECTOR
TOTAL PUBLIC SECTOR
PRIVATE SECTOR
TOTAL
1 2 3 4 5 6 7 8 9 1001 - - - - - - 7500 7500 1500002 - - - - - - - - -03 - - - - - - - - -05 - - - - - - - - -06 - - - - - - - - -07 - - - - - - - - -08 - - - - - - - - -09 - - - - - - - - -10 - - - - 1527417 1527417 - - -11 - - - - 283107 283107 - - -12 - - - - - - - - -13 - - - - 12215729 12215729 - - -14 - - - - - - - - -15 - - - - - - 13500 - 1350016 - - - - - - - - -17 - - - - - - - - -18 - - - - - - - - -19 - - - - - - 6000 - 600020 - - - - - - - - -21 - - - - - - - - -22 - - - - - - - - -23 - - - - - - - - -24 - - - - - - - - -25 - - - - - - - - -26 - - - - - - - - -27 - - - - - - - - -28 - 2532 2532 - - - - - -29 - - - - - - - - -30 - - - - - - - - -31 - - - - - - - - -32 - - - - - - - - -33 - - - - - - - - -35 - - - - - - - - -36 - - - - - - - - -37 - - - - - - - - -38 - - - - - - - - -39 - - - - - - - - -41 - - - - - - - - -42 - - - - - - - - -43 - - - - - - - - -45 - - - - - - - - -46 - - - - - - - - -47 - - - - - - - - -
15.A & N IslandsNIC- 2008 13.Uttarakhand 14.West Bengal
TABLE 2.2
52
PUBLIC SECTOR
PRIVATE SECTOR
TOTAL PUBLIC SECTOR
PRIVATE SECTOR
TOTAL PUBLIC SECTOR
PRIVATE SECTOR
TOTAL
1 2 3 4 5 6 7 2 3 449 - - - - - - - - -50 - - - - - - - - -51 - - - - - - - - -52 - - - - 301136 301136 - - -53 - - - - - - - - -55 - - - - - - - - -56 - - - - - - - - -58 - - - - - - - - -59 - - - - - - - - -60 - - - - - - - - -61 - - - - - - - - -62 - - - - - - - - -63 - - - - - - - - -64 - - - - - - - - -65 - - - - - - - - -66 - - - - - - - - -68 - - - - - - - - -69 - - - - - - - - -70 - - - - - - - - -71 - - - - - - - - -72 - - - - - - - - -73 - - - - - - - - -75 - - - - - - - - -74 - - - - - - - - -77 - - - - - - - - -78 - - - - - - - - -79 - - - - - - - - -80 - - - - - - - - -81 - - - - - - - - -82 - - - - - - - - -84 - - - - - - - - -85 - - - - - - - - -86 - - - - - - - - -87 - - - - - - - - -88 - - - - - - - - -90 - - - - - - - - -91 - - - - - - - - -92 - - - - - - - - -93 - - - - - - - - -94 - - - - - - - - -95 - - - - - - - - -96 - - - - - - - - -97 - - - - - - - - -98 - - - - - - - - -99 - - - - - - - - -
TOTAL - 2532 2532 - 14327389 14327389 27000 7500 34500Note:- -= Information not Reported
15.A & N IslandsNIC- 2008 13.Uttarakhand 14.West Bengal
TABLE 2.2
53
PUBLIC SECTOR
PRIVATE SECTOR
TOTAL PUBLIC SECTOR
PRIVATE SECTOR
TOTAL PUBLIC SECTOR
PRIVATE SECTOR
TOTAL
1 2 3 4 5 6 7 8 9 1001 - - - - - - - - -02 - - - - - - - - -03 - - - - - - - - -05 - - - - - - - - -06 - - - - - - - - -07 - - - - - - - - -08 - - - - - - - - -09 - - - - - - - - -10 - 9940 9940 - - - - 49801 4980111 - 12542 12542 - - - - 6269 626912 - - - - - - 4858 - 485813 - 22032 22032 - 50247 50247 - 8948 894814 - - - - - - - 88515 8851515 - - - - - - - 116664 11666416 - 12368 12368 - - - - 16445 1644517 - 17981 17981 - - - - - -18 - 14931 14931 - - - - 143435 14343519 - 47580 47580 - - - - 3334 333420 - - - - 318973 318973 - 6180 618021 - 15482 15482 - 359594 359594 - 27138 2713822 - 2746 2746 - 990471 990471 - 108760 10876023 - 3291 3291 - 10691 10691 - 2596 259624 - 16725 16725 - 101500 101500 - 42008 4200825 - 47104 47104 - - - 831 64080 6491126 - - - - - - - 16041 1604127 - 44076 44076 - 1126476 1126476 - 107693 10769328 - 97305 97305 - 884304 884304 959 44338 4529729 - 25539 25539 - - - - 29221 2922130 - 19027 19027 - - - - 2096 209631 - - - - 52800 52800 1637 5132 676932 - 1591 1591 - 2408272 2408272 - 38066 3806633 - - - - - - 248 - 24835 - - - - - - - - -36 - - - - - - - - -37 - - - - - - - - -38 - - - - - - - - -39 - - - - - - - - -41 - - - - - - - - -42 - - - - - - 1655 - 165543 - - - - - - - - -45 - 91935 91935 - - - - 202840 20284046 - - - - - - - 7453 745347 - - - - - - 7148 33332 40480
18.DelhiNIC- 2008 16.Chandigarh 17.Daman & Diu
TABLE 2.2
54
PUBLIC SECTOR
PRIVATE SECTOR
TOTAL PUBLIC SECTOR
PRIVATE SECTOR
TOTAL PUBLIC SECTOR
PRIVATE SECTOR
TOTAL
1 2 3 4 5 6 7 2 3 449 - - - - - - - - -50 - - - - - - - - -51 - - - - - - - - -52 - - - - - - - - -53 - - - - - - - - -55 - - - - - - - - -56 - - - - - - - 19786 1978658 - - - - - - - - -59 - - - - - - - - -60 - - - - - - - - -61 - - - - - - - - -62 - - - - - - - - -63 - - - - - - - - -64 - - - - - - - - -65 - - - - - - - - -66 - - - - - - - - -68 - - - - - - - - -69 - - - - - - - - -70 - - - - - - - - -71 - - - - - - - 29024 2902472 - - - - - - - - -73 - - - - - - - - -75 - - - - - - - 2280 228074 - - - - - - - - -77 - - - - - - - - -78 - - - - - - - - -79 - - - - - - - - -80 - - - - - - - - -81 - - - - - - - - -82 - - - - - - - - -84 - - - - - - - - -85 - - - - - - - - -86 - - - - - - - - -87 - - - - - - - - -88 - - - - - - - - -90 - - - - - - - - -91 - - - - - - - 1099 109992 - - - - - - - - -93 - - - - - - - - -94 - - - - - - - - -95 - - - - - - - - -96 - - - - - - - - -97 - - - - - - - - -98 - - - - - - - - -99 - - - - - - - - -
TOTAL - 502195 502195 - 6303328 6303328 17336 1222572 1239908Note:- -= Information not Reported
18.Delhi
TABLE 2.2
16.Chandigarh 17.Daman & DiuNIC- 2008
55
PUBLIC SECTOR
PRIVATE SECTOR
TOTAL PUBLIC SECTOR
PRIVATE SECTOR
TOTAL
1 2 3 4 5 6 701 - - - 740297 3992891 473318802 - - - - 8512 851203 - - - - - -05 - - - - - -06 - - - - - -07 - - - - - -08 - - - 677484 673048 135053209 - - - - 12160 1216010 - - - 59024147 45658008 10468215511 - - - 19866 4056176 407604212 - - - 4858 1002606 100746413 - - - 26166 40351120 4037728614 - - - - 10674944 1067494415 - 49050 49050 13500 4076271 408977116 - - - - 2231678 223167817 - 27495 27495 - 5038449 503844918 - - - 147583 1763587 191117019 - - - 57492 2583088 264058020 - 563025 563025 89293 14532354 1462164721 - 58509 58509 7904 11059636 1106754022 - 131250 131250 63120 10381488 1044460823 - 158900 158900 47865 24425783 2447364824 - 167200 167200 550080 11110938 1166101825 - 163725 163725 29324995 10182161 3950715626 - 195720 195720 18180 8265052 828323227 - 144250 144250 1739048 10836387 1257543528 - 43205 43205 911243 11860935 1277217829 - 30875 30875 60955 4672624 473357930 - - - - 1225284 122528431 - - - 1637 969630 97126732 - 26125 26125 11260 4796780 480804033 - - - 248 59873 6012135 - - - 2366444 1727880 409432436 - - - 54143 8665 6280837 - - - - 5822 582238 - - - - 95690 9569039 - - - - - -41 - - - - - -42 - - - 1655 72020 7367543 - - - - 7616 761645 - - - - 3405128 340512846 - - - - 24801229 2480122947 - 67668 67668 7148 534460 541608
TABLE 2.2…Concld.
NIC- 2008 19. Puducherry 19. All State/ UT
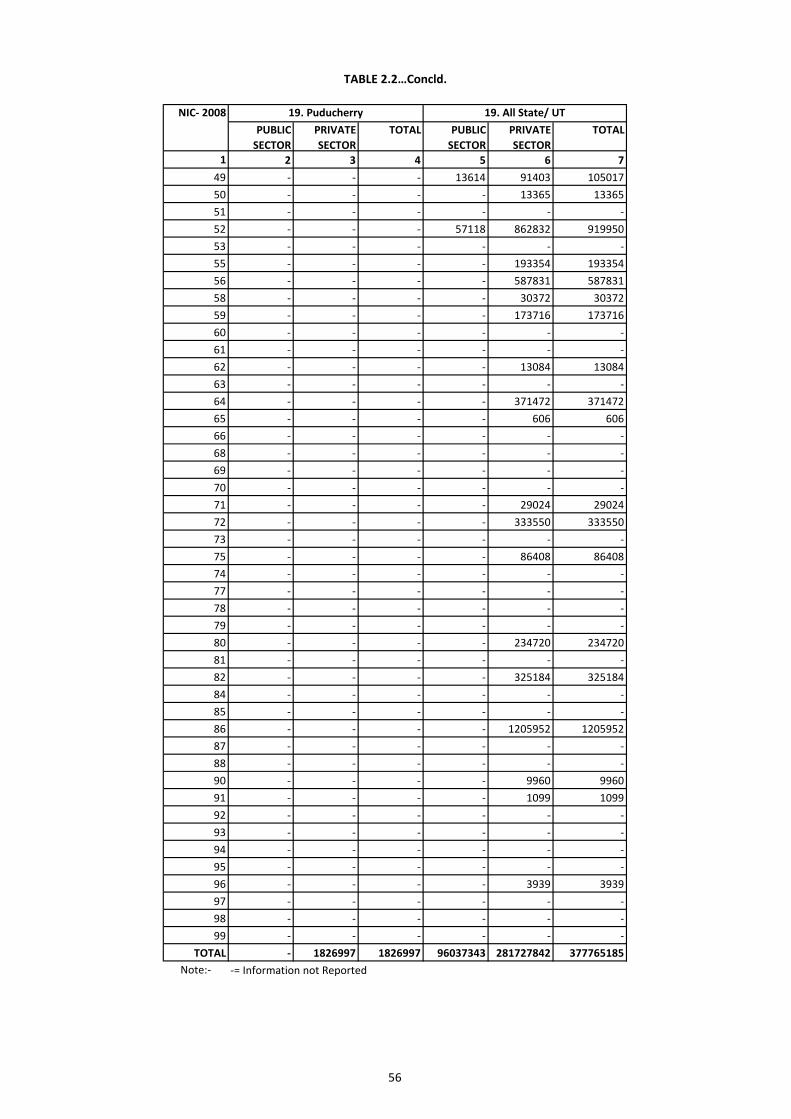
56
PUBLIC SECTOR
PRIVATE SECTOR
TOTAL PUBLIC SECTOR
PRIVATE SECTOR
TOTAL
1 2 3 4 5 6 749 - - - 13614 91403 10501750 - - - - 13365 1336551 - - - - - -52 - - - 57118 862832 91995053 - - - - - -55 - - - - 193354 19335456 - - - - 587831 58783158 - - - - 30372 3037259 - - - - 173716 17371660 - - - - - -61 - - - - - -62 - - - - 13084 1308463 - - - - - -64 - - - - 371472 37147265 - - - - 606 60666 - - - - - -68 - - - - - -69 - - - - - -70 - - - - - -71 - - - - 29024 2902472 - - - - 333550 33355073 - - - - - -75 - - - - 86408 8640874 - - - - - -77 - - - - - -78 - - - - - -79 - - - - - -80 - - - - 234720 23472081 - - - - - -82 - - - - 325184 32518484 - - - - - -85 - - - - - -86 - - - - 1205952 120595287 - - - - - -88 - - - - - -90 - - - - 9960 996091 - - - - 1099 109992 - - - - - -93 - - - - - -94 - - - - - -95 - - - - - -96 - - - - 3939 393997 - - - - - -98 - - - - - -99 - - - - - -
TOTAL - 1826997 1826997 96037343 281727842 377765185Note:- -= Information not Reported
TABLE 2.2…Concld.
NIC- 2008 19. Puducherry 19. All State/ UT
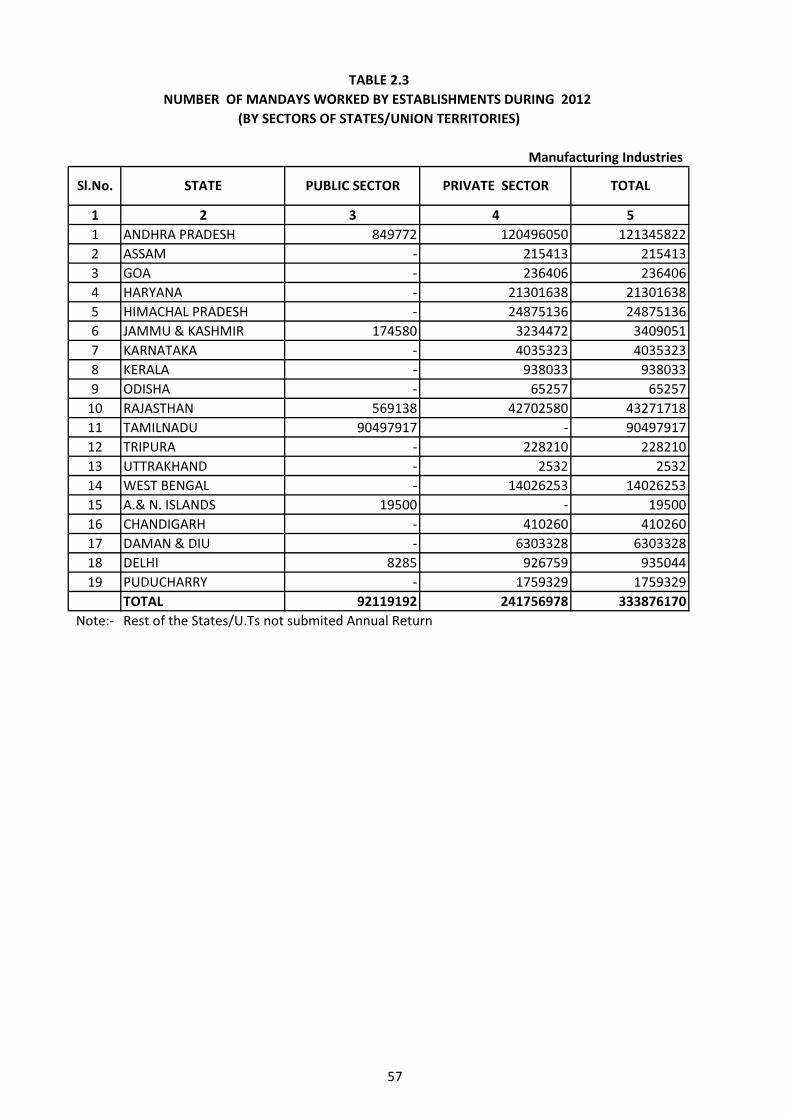
57
1 2 3 4 51 ANDHRA PRADESH 849772 120496050 1213458222 ASSAM - 215413 2154133 GOA - 236406 2364064 HARYANA - 21301638 213016385 HIMACHAL PRADESH - 24875136 248751366 JAMMU & KASHMIR 174580 3234472 34090517 KARNATAKA - 4035323 40353238 KERALA - 938033 9380339 ODISHA - 65257 65257
10 RAJASTHAN 569138 42702580 4327171811 TAMILNADU 90497917 - 9049791712 TRIPURA - 228210 22821013 UTTRAKHAND - 2532 253214 WEST BENGAL - 14026253 1402625315 A.& N. ISLANDS 19500 - 1950016 CHANDIGARH - 410260 41026017 DAMAN & DIU - 6303328 630332818 DELHI 8285 926759 93504419 PUDUCHARRY - 1759329 1759329
TOTAL 92119192 241756978 333876170Note:- Rest of the States/U.Ts not submited Annual Return
TABLE 2.3NUMBER OF MANDAYS WORKED BY ESTABLISHMENTS DURING 2012
(BY SECTORS OF STATES/UNION TERRITORIES)
Manufacturing Industries
Sl.No. STATE PUBLIC SECTOR PRIVATE SECTOR TOTAL
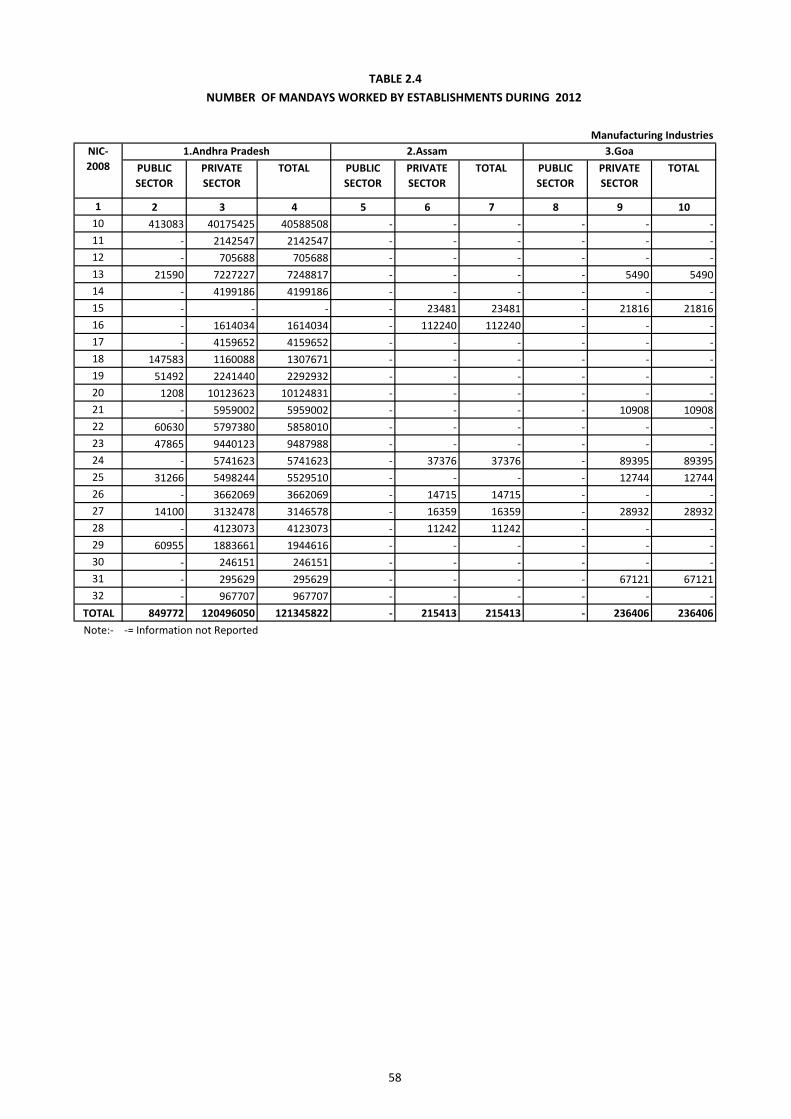
58
PUBLIC SECTOR
PRIVATE SECTOR
TOTAL PUBLIC SECTOR
PRIVATE SECTOR
TOTAL PUBLIC SECTOR
PRIVATE SECTOR
TOTAL
1 2 3 4 5 6 7 8 9 1010 413083 40175425 40588508 - - - - - -11 - 2142547 2142547 - - - - - -12 - 705688 705688 - - - - - -13 21590 7227227 7248817 - - - - 5490 549014 - 4199186 4199186 - - - - - -15 - - - - 23481 23481 - 21816 2181616 - 1614034 1614034 - 112240 112240 - - -17 - 4159652 4159652 - - - - - -18 147583 1160088 1307671 - - - - - -19 51492 2241440 2292932 - - - - - -20 1208 10123623 10124831 - - - - - -21 - 5959002 5959002 - - - - 10908 1090822 60630 5797380 5858010 - - - - - -23 47865 9440123 9487988 - - - - - -24 - 5741623 5741623 - 37376 37376 - 89395 8939525 31266 5498244 5529510 - - - - 12744 1274426 - 3662069 3662069 - 14715 14715 - - -27 14100 3132478 3146578 - 16359 16359 - 28932 2893228 - 4123073 4123073 - 11242 11242 - - -29 60955 1883661 1944616 - - - - - -30 - 246151 246151 - - - - - -31 - 295629 295629 - - - - 67121 6712132 - 967707 967707 - - - - - -
TOTAL 849772 120496050 121345822 - 215413 215413 - 236406 236406Note:- -= Information not Reported
3.GoaNIC- 2008
1.Andhra Pradesh 2.AssamManufacturing Industries
TABLE 2.4NUMBER OF MANDAYS WORKED BY ESTABLISHMENTS DURING 2012
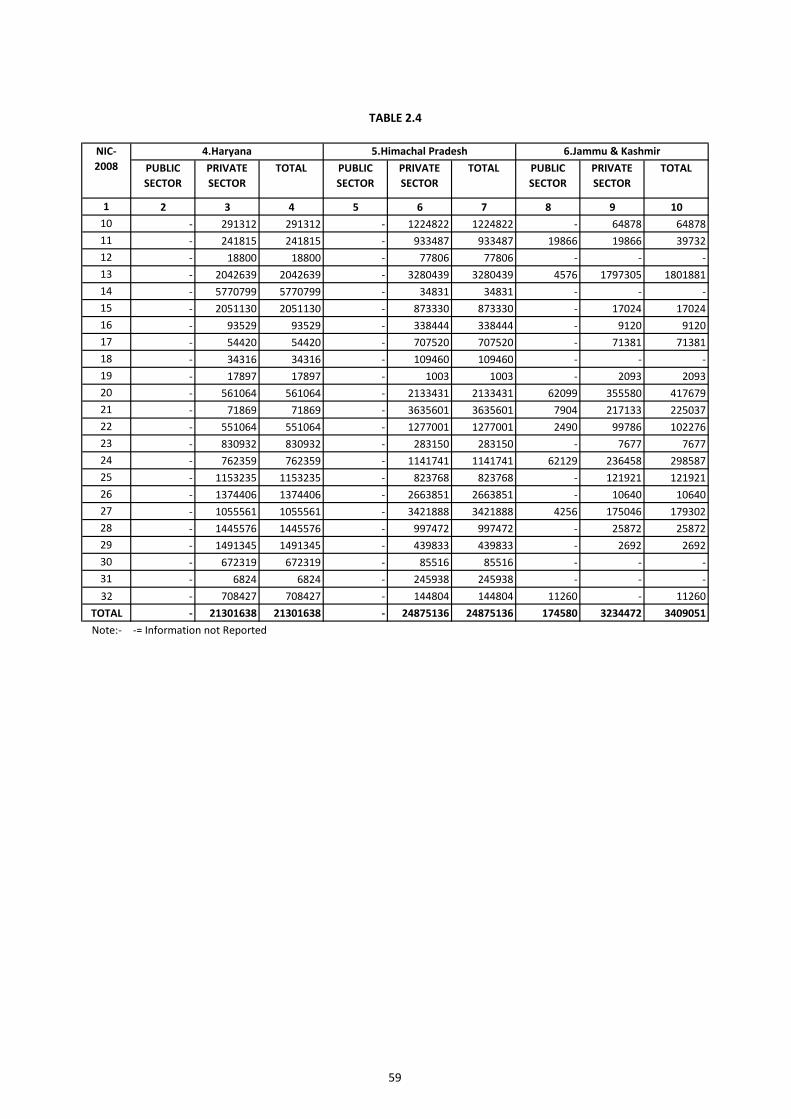
59
PUBLIC SECTOR
PRIVATE SECTOR
TOTAL PUBLIC SECTOR
PRIVATE SECTOR
TOTAL PUBLIC SECTOR
PRIVATE SECTOR
TOTAL
1 2 3 4 5 6 7 8 9 1010 - 291312 291312 - 1224822 1224822 - 64878 6487811 - 241815 241815 - 933487 933487 19866 19866 3973212 - 18800 18800 - 77806 77806 - - -13 - 2042639 2042639 - 3280439 3280439 4576 1797305 180188114 - 5770799 5770799 - 34831 34831 - - -15 - 2051130 2051130 - 873330 873330 - 17024 1702416 - 93529 93529 - 338444 338444 - 9120 912017 - 54420 54420 - 707520 707520 - 71381 7138118 - 34316 34316 - 109460 109460 - - -19 - 17897 17897 - 1003 1003 - 2093 209320 - 561064 561064 - 2133431 2133431 62099 355580 41767921 - 71869 71869 - 3635601 3635601 7904 217133 22503722 - 551064 551064 - 1277001 1277001 2490 99786 10227623 - 830932 830932 - 283150 283150 - 7677 767724 - 762359 762359 - 1141741 1141741 62129 236458 29858725 - 1153235 1153235 - 823768 823768 - 121921 12192126 - 1374406 1374406 - 2663851 2663851 - 10640 1064027 - 1055561 1055561 - 3421888 3421888 4256 175046 17930228 - 1445576 1445576 - 997472 997472 - 25872 2587229 - 1491345 1491345 - 439833 439833 - 2692 269230 - 672319 672319 - 85516 85516 - - -31 - 6824 6824 - 245938 245938 - - -32 - 708427 708427 - 144804 144804 11260 - 11260
TOTAL - 21301638 21301638 - 24875136 24875136 174580 3234472 3409051Note:- -= Information not Reported
NIC- 2008
4.Haryana 5.Himachal Pradesh 6.Jammu & Kashmir
TABLE 2.4
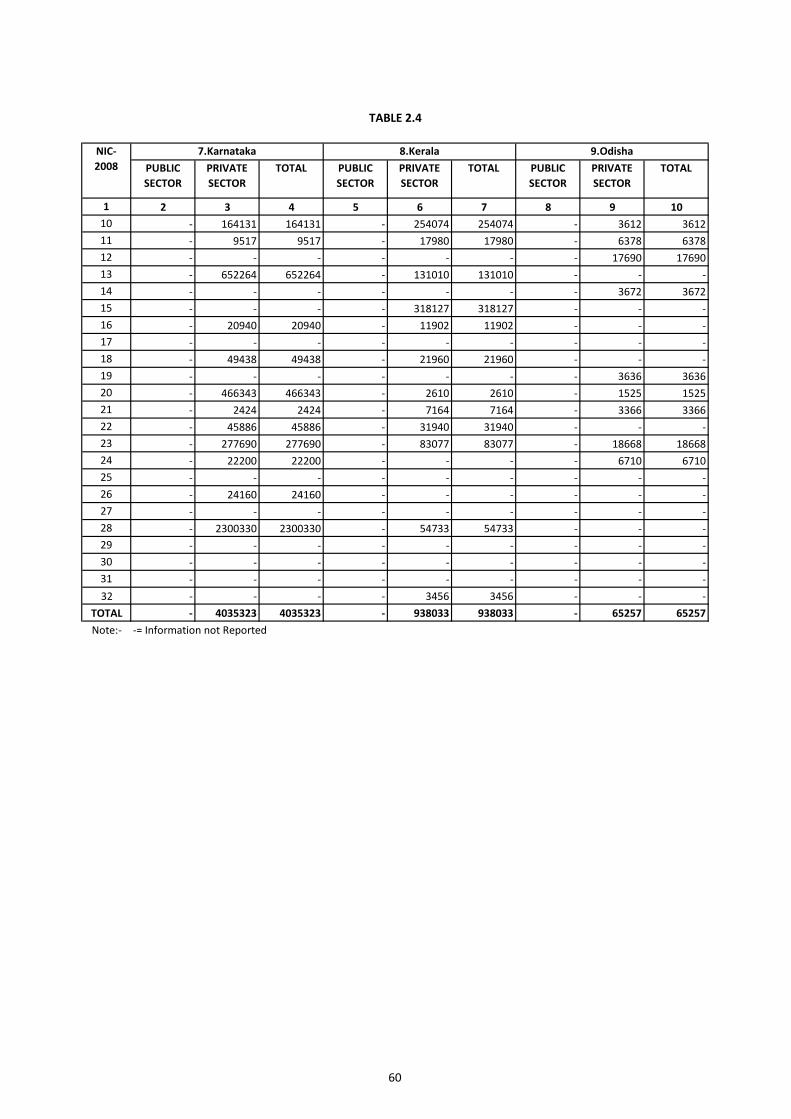
60
PUBLIC SECTOR
PRIVATE SECTOR
TOTAL PUBLIC SECTOR
PRIVATE SECTOR
TOTAL PUBLIC SECTOR
PRIVATE SECTOR
TOTAL
1 2 3 4 5 6 7 8 9 1010 - 164131 164131 - 254074 254074 - 3612 361211 - 9517 9517 - 17980 17980 - 6378 637812 - - - - - - - 17690 1769013 - 652264 652264 - 131010 131010 - - -14 - - - - - - - 3672 367215 - - - - 318127 318127 - - -16 - 20940 20940 - 11902 11902 - - -17 - - - - - - - - -18 - 49438 49438 - 21960 21960 - - -19 - - - - - - - 3636 363620 - 466343 466343 - 2610 2610 - 1525 152521 - 2424 2424 - 7164 7164 - 3366 336622 - 45886 45886 - 31940 31940 - - -23 - 277690 277690 - 83077 83077 - 18668 1866824 - 22200 22200 - - - - 6710 671025 - - - - - - - - -26 - 24160 24160 - - - - - -27 - - - - - - - - -28 - 2300330 2300330 - 54733 54733 - - -29 - - - - - - - - -30 - - - - - - - - -31 - - - - - - - - -32 - - - - 3456 3456 - - -
TOTAL - 4035323 4035323 - 938033 938033 - 65257 65257Note:- -= Information not Reported
8.Kerala 9.OdishaNIC- 2008
7.Karnataka
TABLE 2.4
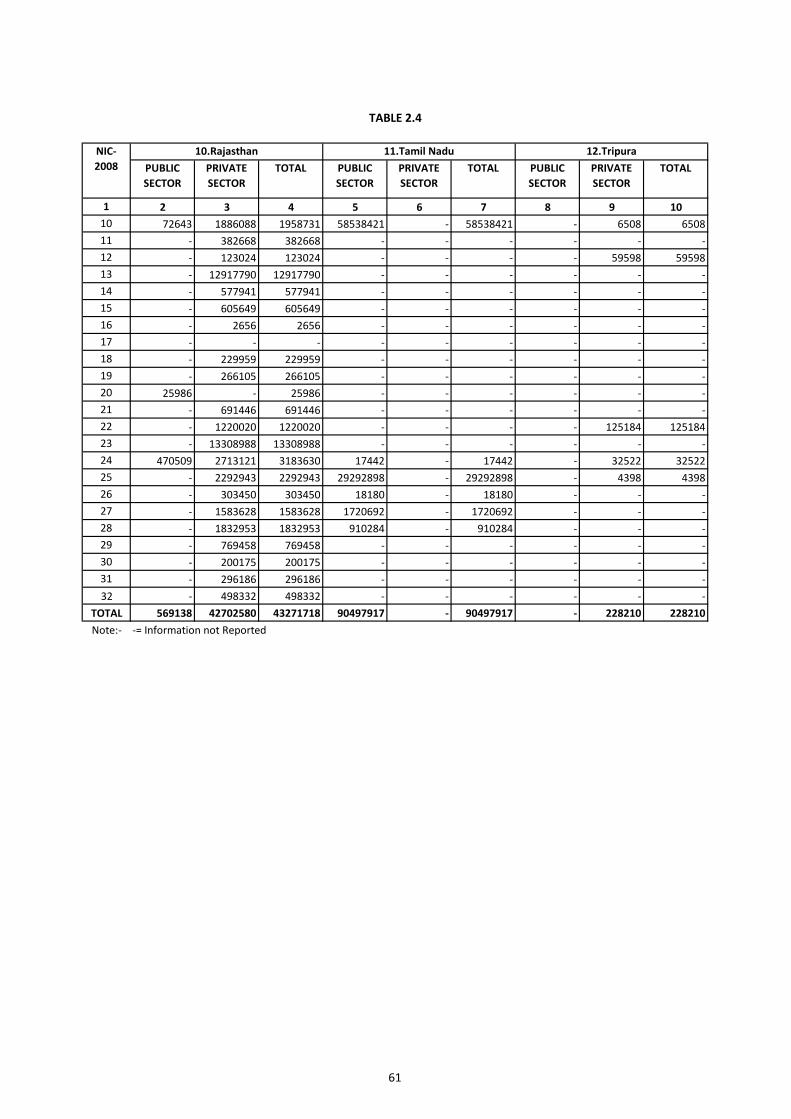
61
PUBLIC SECTOR
PRIVATE SECTOR
TOTAL PUBLIC SECTOR
PRIVATE SECTOR
TOTAL PUBLIC SECTOR
PRIVATE SECTOR
TOTAL
1 2 3 4 5 6 7 8 9 1010 72643 1886088 1958731 58538421 - 58538421 - 6508 650811 - 382668 382668 - - - - - -12 - 123024 123024 - - - - 59598 5959813 - 12917790 12917790 - - - - - -14 - 577941 577941 - - - - - -15 - 605649 605649 - - - - - -16 - 2656 2656 - - - - - -17 - - - - - - - - -18 - 229959 229959 - - - - - -19 - 266105 266105 - - - - - -20 25986 - 25986 - - - - - -21 - 691446 691446 - - - - - -22 - 1220020 1220020 - - - - 125184 12518423 - 13308988 13308988 - - - - - -24 470509 2713121 3183630 17442 - 17442 - 32522 3252225 - 2292943 2292943 29292898 - 29292898 - 4398 439826 - 303450 303450 18180 - 18180 - - -27 - 1583628 1583628 1720692 - 1720692 - - -28 - 1832953 1832953 910284 - 910284 - - -29 - 769458 769458 - - - - - -30 - 200175 200175 - - - - - -31 - 296186 296186 - - - - - -32 - 498332 498332 - - - - - -
TOTAL 569138 42702580 43271718 90497917 - 90497917 - 228210 228210Note:- -= Information not Reported
11.Tamil Nadu 12.TripuraNIC- 2008
10.Rajasthan
TABLE 2.4
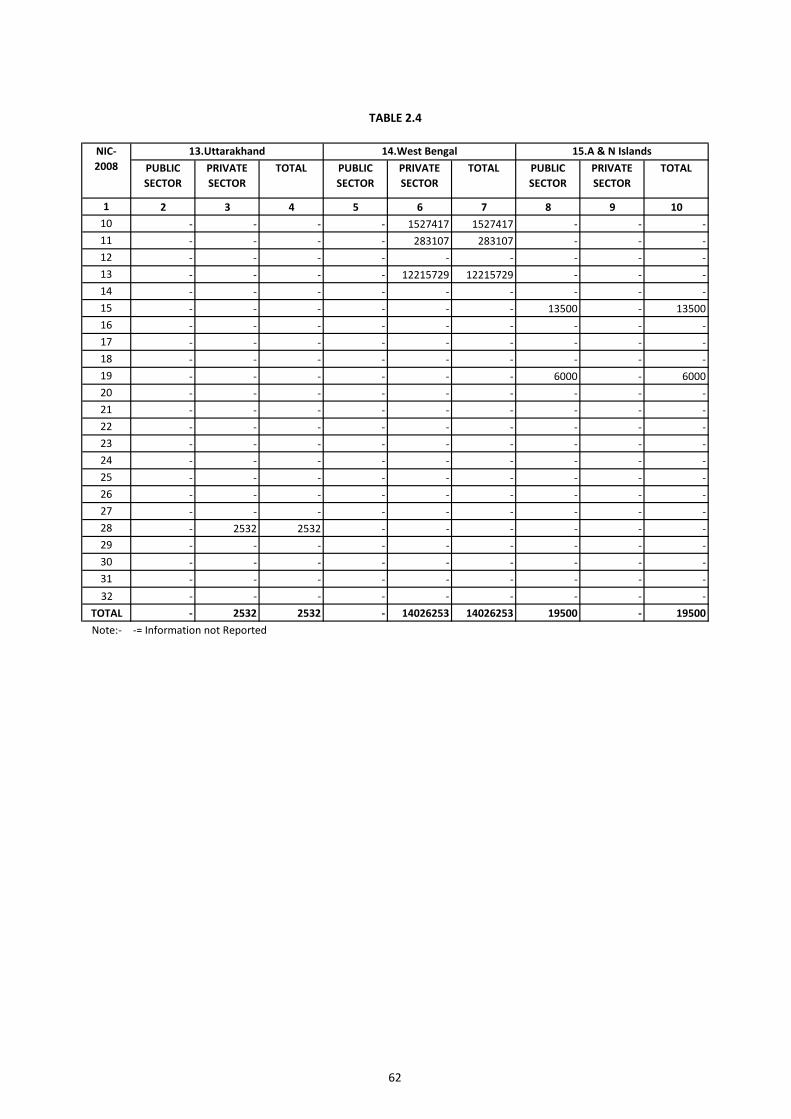
62
PUBLIC SECTOR
PRIVATE SECTOR
TOTAL PUBLIC SECTOR
PRIVATE SECTOR
TOTAL PUBLIC SECTOR
PRIVATE SECTOR
TOTAL
1 2 3 4 5 6 7 8 9 1010 - - - - 1527417 1527417 - - -11 - - - - 283107 283107 - - -12 - - - - - - - - -13 - - - - 12215729 12215729 - - -14 - - - - - - - - -15 - - - - - - 13500 - 1350016 - - - - - - - - -17 - - - - - - - - -18 - - - - - - - - -19 - - - - - - 6000 - 600020 - - - - - - - - -21 - - - - - - - - -22 - - - - - - - - -23 - - - - - - - - -24 - - - - - - - - -25 - - - - - - - - -26 - - - - - - - - -27 - - - - - - - - -28 - 2532 2532 - - - - - -29 - - - - - - - - -30 - - - - - - - - -31 - - - - - - - - -32 - - - - - - - - -
TOTAL - 2532 2532 - 14026253 14026253 19500 - 19500Note:- -= Information not Reported
NIC- 2008
13.Uttarakhand 14.West Bengal 15.A & N Islands
TABLE 2.4
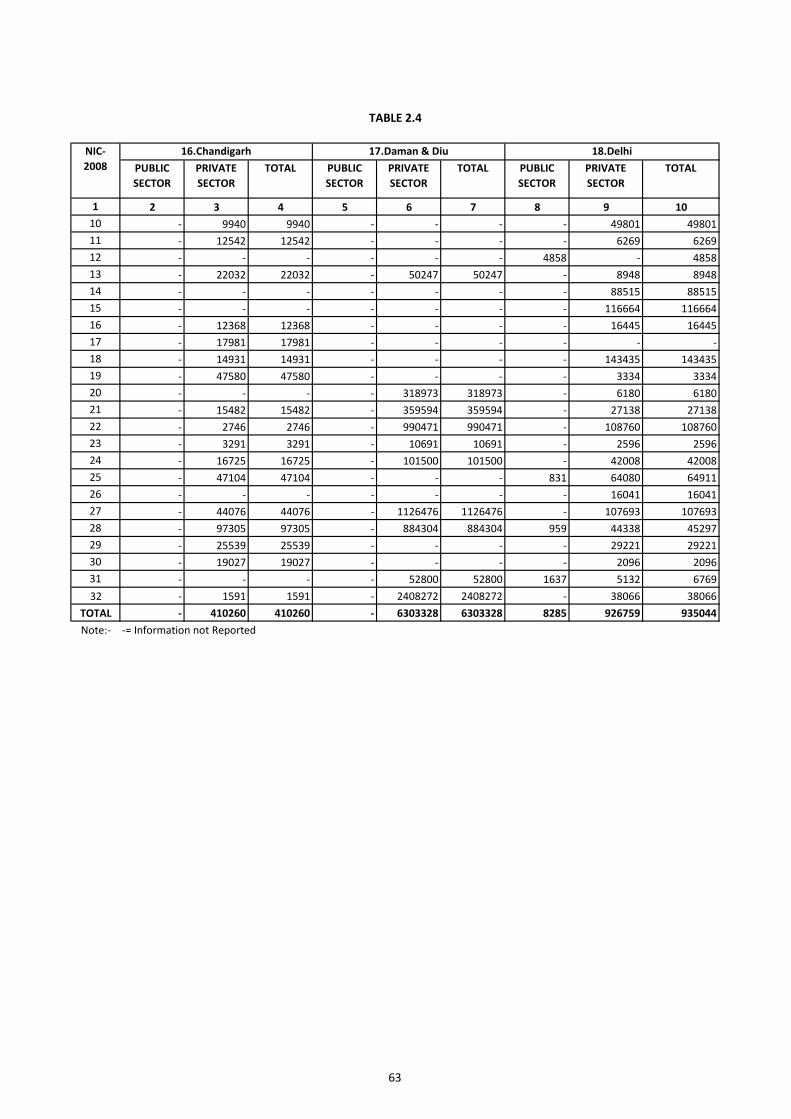
63
PUBLIC SECTOR
PRIVATE SECTOR
TOTAL PUBLIC SECTOR
PRIVATE SECTOR
TOTAL PUBLIC SECTOR
PRIVATE SECTOR
TOTAL
1 2 3 4 5 6 7 8 9 1010 - 9940 9940 - - - - 49801 4980111 - 12542 12542 - - - - 6269 626912 - - - - - - 4858 - 485813 - 22032 22032 - 50247 50247 - 8948 894814 - - - - - - - 88515 8851515 - - - - - - - 116664 11666416 - 12368 12368 - - - - 16445 1644517 - 17981 17981 - - - - - -18 - 14931 14931 - - - - 143435 14343519 - 47580 47580 - - - - 3334 333420 - - - - 318973 318973 - 6180 618021 - 15482 15482 - 359594 359594 - 27138 2713822 - 2746 2746 - 990471 990471 - 108760 10876023 - 3291 3291 - 10691 10691 - 2596 259624 - 16725 16725 - 101500 101500 - 42008 4200825 - 47104 47104 - - - 831 64080 6491126 - - - - - - - 16041 1604127 - 44076 44076 - 1126476 1126476 - 107693 10769328 - 97305 97305 - 884304 884304 959 44338 4529729 - 25539 25539 - - - - 29221 2922130 - 19027 19027 - - - - 2096 209631 - - - - 52800 52800 1637 5132 676932 - 1591 1591 - 2408272 2408272 - 38066 38066
TOTAL - 410260 410260 - 6303328 6303328 8285 926759 935044Note:- -= Information not Reported
16.Chandigarh 17.Daman & Diu 18.Delhi
TABLE 2.4
NIC- 2008
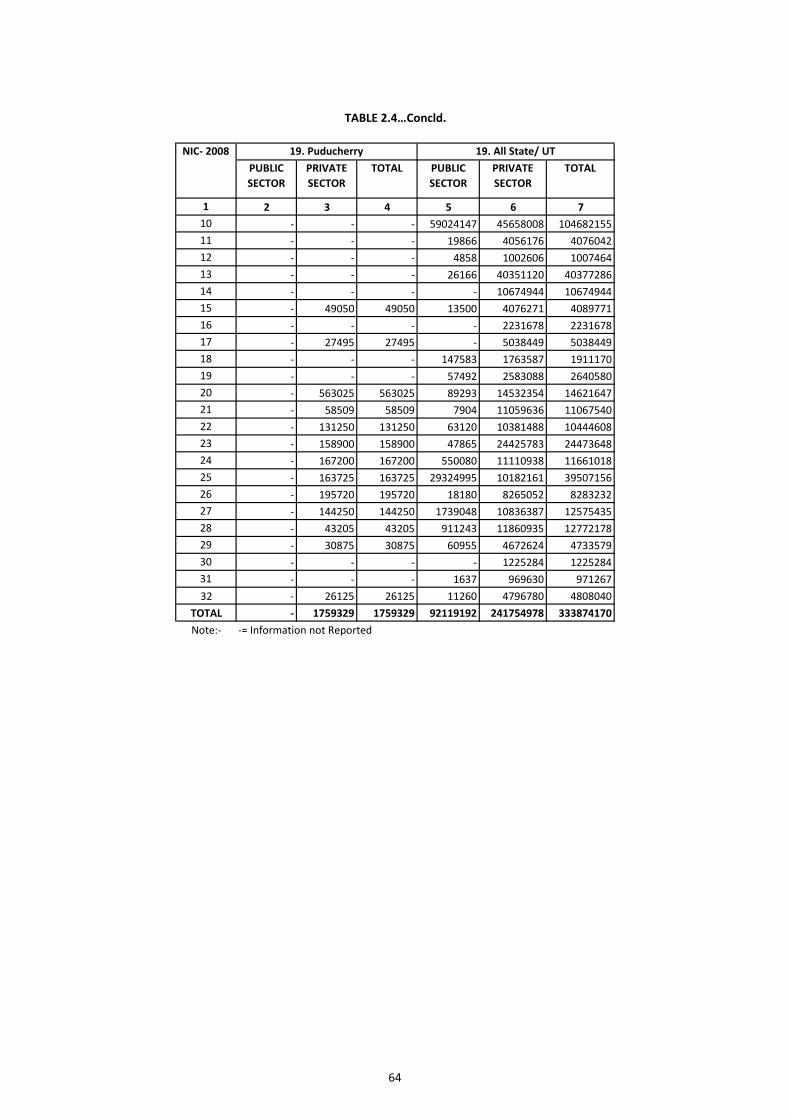
64
PUBLIC SECTOR
PRIVATE SECTOR
TOTAL PUBLIC SECTOR
PRIVATE SECTOR
TOTAL
1 2 3 4 5 6 710 - - - 59024147 45658008 10468215511 - - - 19866 4056176 407604212 - - - 4858 1002606 100746413 - - - 26166 40351120 4037728614 - - - - 10674944 1067494415 - 49050 49050 13500 4076271 408977116 - - - - 2231678 223167817 - 27495 27495 - 5038449 503844918 - - - 147583 1763587 191117019 - - - 57492 2583088 264058020 - 563025 563025 89293 14532354 1462164721 - 58509 58509 7904 11059636 1106754022 - 131250 131250 63120 10381488 1044460823 - 158900 158900 47865 24425783 2447364824 - 167200 167200 550080 11110938 1166101825 - 163725 163725 29324995 10182161 3950715626 - 195720 195720 18180 8265052 828323227 - 144250 144250 1739048 10836387 1257543528 - 43205 43205 911243 11860935 1277217829 - 30875 30875 60955 4672624 473357930 - - - - 1225284 122528431 - - - 1637 969630 97126732 - 26125 26125 11260 4796780 4808040
TOTAL - 1759329 1759329 92119192 241754978 333874170Note:- -= Information not Reported
NIC- 2008 19. Puducherry 19. All State/ UT
TABLE 2.4…Concld.
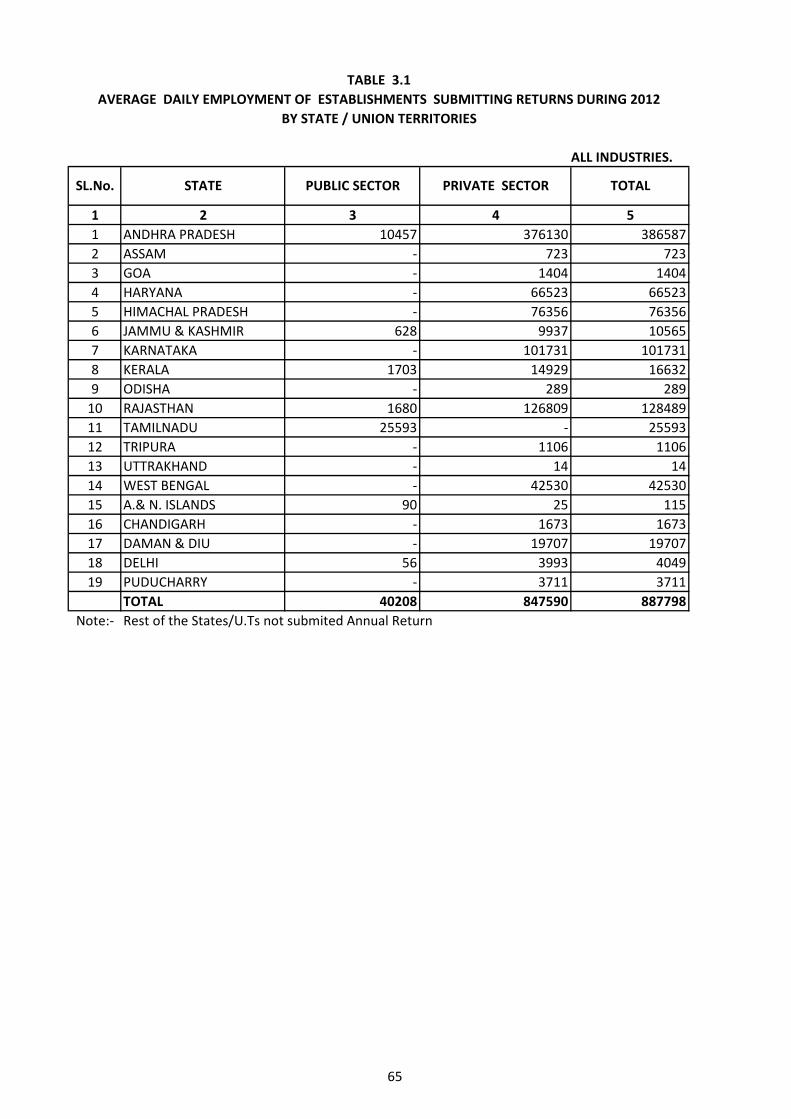
65
1 2 3 4 51 ANDHRA PRADESH 10457 376130 3865872 ASSAM - 723 7233 GOA - 1404 14044 HARYANA - 66523 665235 HIMACHAL PRADESH - 76356 763566 JAMMU & KASHMIR 628 9937 105657 KARNATAKA - 101731 1017318 KERALA 1703 14929 166329 ODISHA - 289 289
10 RAJASTHAN 1680 126809 12848911 TAMILNADU 25593 - 2559312 TRIPURA - 1106 110613 UTTRAKHAND - 14 1414 WEST BENGAL - 42530 4253015 A.& N. ISLANDS 90 25 11516 CHANDIGARH - 1673 167317 DAMAN & DIU - 19707 1970718 DELHI 56 3993 404919 PUDUCHARRY - 3711 3711
TOTAL 40208 847590 887798Note:- Rest of the States/U.Ts not submited Annual Return
TABLE 3.1AVERAGE DAILY EMPLOYMENT OF ESTABLISHMENTS SUBMITTING RETURNS DURING 2012
BY STATE / UNION TERRITORIES
ALL INDUSTRIES.
SL.No. STATE PUBLIC SECTOR PRIVATE SECTOR TOTAL
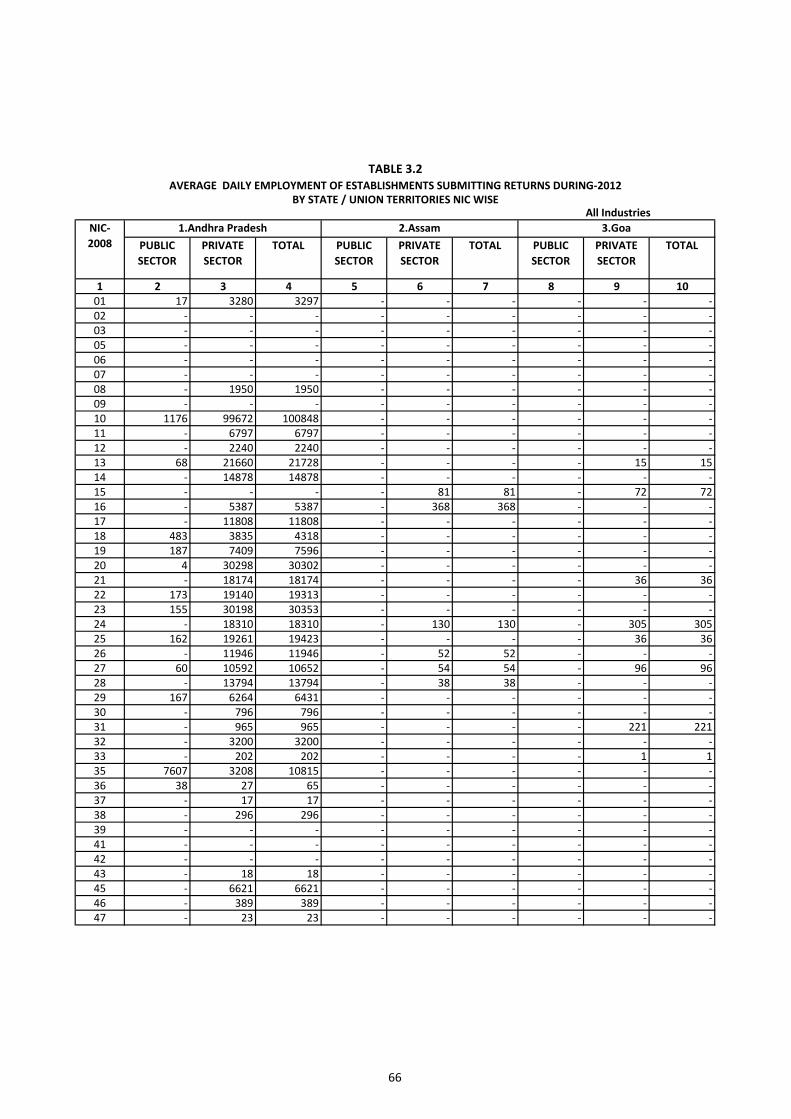
66
All Industries
PUBLIC SECTOR
PRIVATE SECTOR
TOTAL PUBLIC SECTOR
PRIVATE SECTOR
TOTAL PUBLIC SECTOR
PRIVATE SECTOR
TOTAL
1 2 3 4 5 6 7 8 9 1001 17 3280 3297 - - - - - -02 - - - - - - - - -03 - - - - - - - - -05 - - - - - - - - -06 - - - - - - - - -07 - - - - - - - - -08 - 1950 1950 - - - - - -09 - - - - - - - - -10 1176 99672 100848 - - - - - -11 - 6797 6797 - - - - - -12 - 2240 2240 - - - - - -13 68 21660 21728 - - - - 15 1514 - 14878 14878 - - - - - -15 - - - - 81 81 - 72 7216 - 5387 5387 - 368 368 - - -17 - 11808 11808 - - - - - -18 483 3835 4318 - - - - - -19 187 7409 7596 - - - - - -20 4 30298 30302 - - - - - -21 - 18174 18174 - - - - 36 3622 173 19140 19313 - - - - - -23 155 30198 30353 - - - - - -24 - 18310 18310 - 130 130 - 305 30525 162 19261 19423 - - - - 36 3626 - 11946 11946 - 52 52 - - -27 60 10592 10652 - 54 54 - 96 9628 - 13794 13794 - 38 38 - - -29 167 6264 6431 - - - - - -30 - 796 796 - - - - - -31 - 965 965 - - - - 221 22132 - 3200 3200 - - - - - -33 - 202 202 - - - - 1 135 7607 3208 10815 - - - - - -36 38 27 65 - - - - - -37 - 17 17 - - - - - -38 - 296 296 - - - - - -39 - - - - - - - - -41 - - - - - - - - -42 - - - - - - - - -43 - 18 18 - - - - - -45 - 6621 6621 - - - - - -46 - 389 389 - - - - - -47 - 23 23 - - - - - -
TABLE 3.2AVERAGE DAILY EMPLOYMENT OF ESTABLISHMENTS SUBMITTING RETURNS DURING-2012
BY STATE / UNION TERRITORIES NIC WISE
NIC- 2008
1.Andhra Pradesh 2.Assam 3.Goa
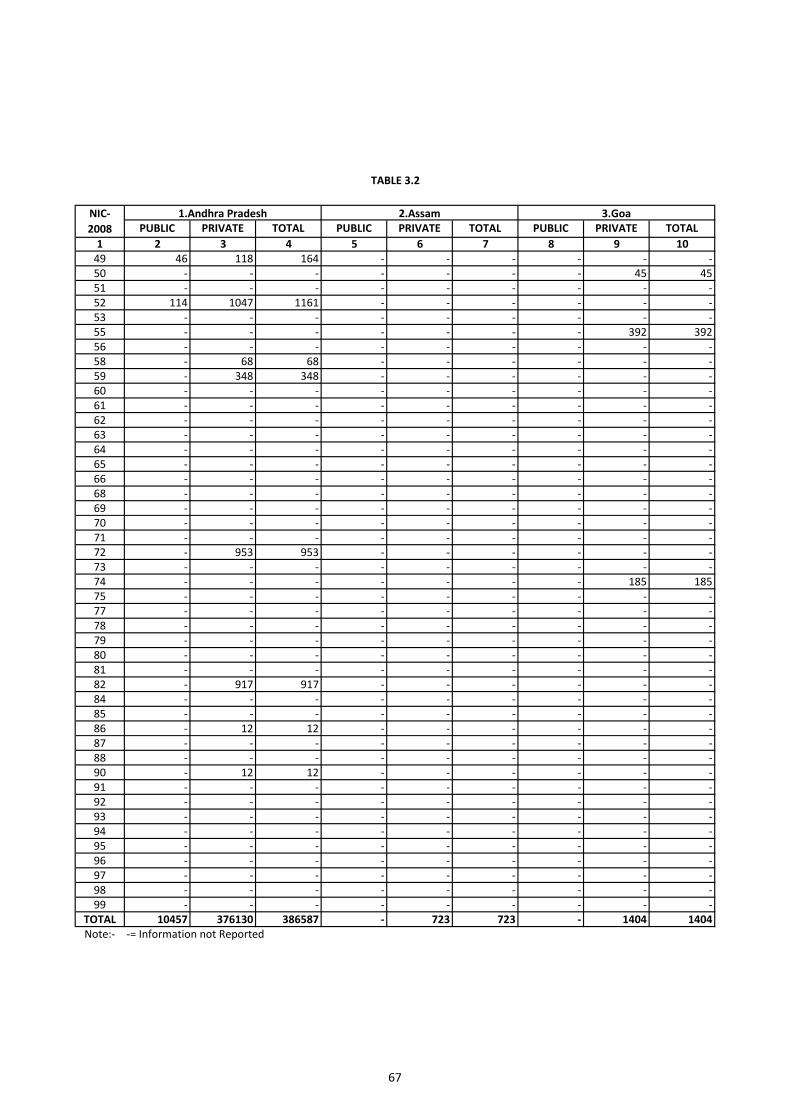
67
PUBLIC PRIVATE TOTAL PUBLIC PRIVATE TOTAL PUBLIC PRIVATE TOTAL1 2 3 4 5 6 7 8 9 10
49 46 118 164 - - - - - -50 - - - - - - - 45 4551 - - - - - - - - -52 114 1047 1161 - - - - - -53 - - - - - - - - -55 - - - - - - - 392 39256 - - - - - - - - -58 - 68 68 - - - - - -59 - 348 348 - - - - - -60 - - - - - - - - -61 - - - - - - - - -62 - - - - - - - - -63 - - - - - - - - -64 - - - - - - - - -65 - - - - - - - - -66 - - - - - - - - -68 - - - - - - - - -69 - - - - - - - - -70 - - - - - - - - -71 - - - - - - - - -72 - 953 953 - - - - - -73 - - - - - - - - -74 - - - - - - - 185 18575 - - - - - - - - -77 - - - - - - - - -78 - - - - - - - - -79 - - - - - - - - -80 - - - - - - - - -81 - - - - - - - - -82 - 917 917 - - - - - -84 - - - - - - - - -85 - - - - - - - - -86 - 12 12 - - - - - -87 - - - - - - - - -88 - - - - - - - - -90 - 12 12 - - - - - -91 - - - - - - - - -92 - - - - - - - - -93 - - - - - - - - -94 - - - - - - - - -95 - - - - - - - - -96 - - - - - - - - -97 - - - - - - - - -98 - - - - - - - - -99 - - - - - - - - -
TOTAL 10457 376130 386587 - 723 723 - 1404 1404Note:- -= Information not Reported
NIC- 2008
1.Andhra Pradesh 2.Assam 3.Goa
TABLE 3.2
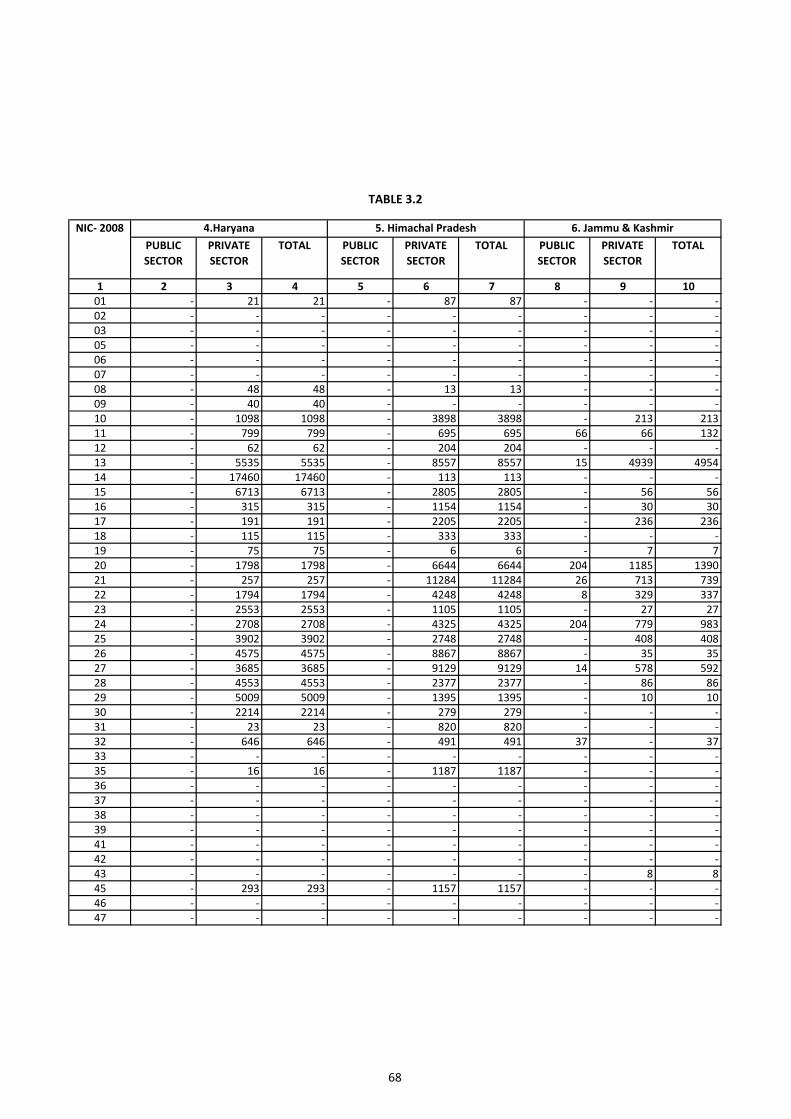
68
PUBLIC SECTOR
PRIVATE SECTOR
TOTAL PUBLIC SECTOR
PRIVATE SECTOR
TOTAL PUBLIC SECTOR
PRIVATE SECTOR
TOTAL
1 2 3 4 5 6 7 8 9 1001 - 21 21 - 87 87 - - -02 - - - - - - - - -03 - - - - - - - - -05 - - - - - - - - -06 - - - - - - - - -07 - - - - - - - - -08 - 48 48 - 13 13 - - -09 - 40 40 - - - - - -10 - 1098 1098 - 3898 3898 - 213 21311 - 799 799 - 695 695 66 66 13212 - 62 62 - 204 204 - - -13 - 5535 5535 - 8557 8557 15 4939 495414 - 17460 17460 - 113 113 - - -15 - 6713 6713 - 2805 2805 - 56 5616 - 315 315 - 1154 1154 - 30 3017 - 191 191 - 2205 2205 - 236 23618 - 115 115 - 333 333 - - -19 - 75 75 - 6 6 - 7 720 - 1798 1798 - 6644 6644 204 1185 139021 - 257 257 - 11284 11284 26 713 73922 - 1794 1794 - 4248 4248 8 329 33723 - 2553 2553 - 1105 1105 - 27 2724 - 2708 2708 - 4325 4325 204 779 98325 - 3902 3902 - 2748 2748 - 408 40826 - 4575 4575 - 8867 8867 - 35 3527 - 3685 3685 - 9129 9129 14 578 59228 - 4553 4553 - 2377 2377 - 86 8629 - 5009 5009 - 1395 1395 - 10 1030 - 2214 2214 - 279 279 - - -31 - 23 23 - 820 820 - - -32 - 646 646 - 491 491 37 - 3733 - - - - - - - - -35 - 16 16 - 1187 1187 - - -36 - - - - - - - - -37 - - - - - - - - -38 - - - - - - - - -39 - - - - - - - - -41 - - - - - - - - -42 - - - - - - - - -43 - - - - - - - 8 845 - 293 293 - 1157 1157 - - -46 - - - - - - - - -47 - - - - - - - - -
TABLE 3.2
NIC- 2008 4.Haryana 5. Himachal Pradesh 6. Jammu & Kashmir
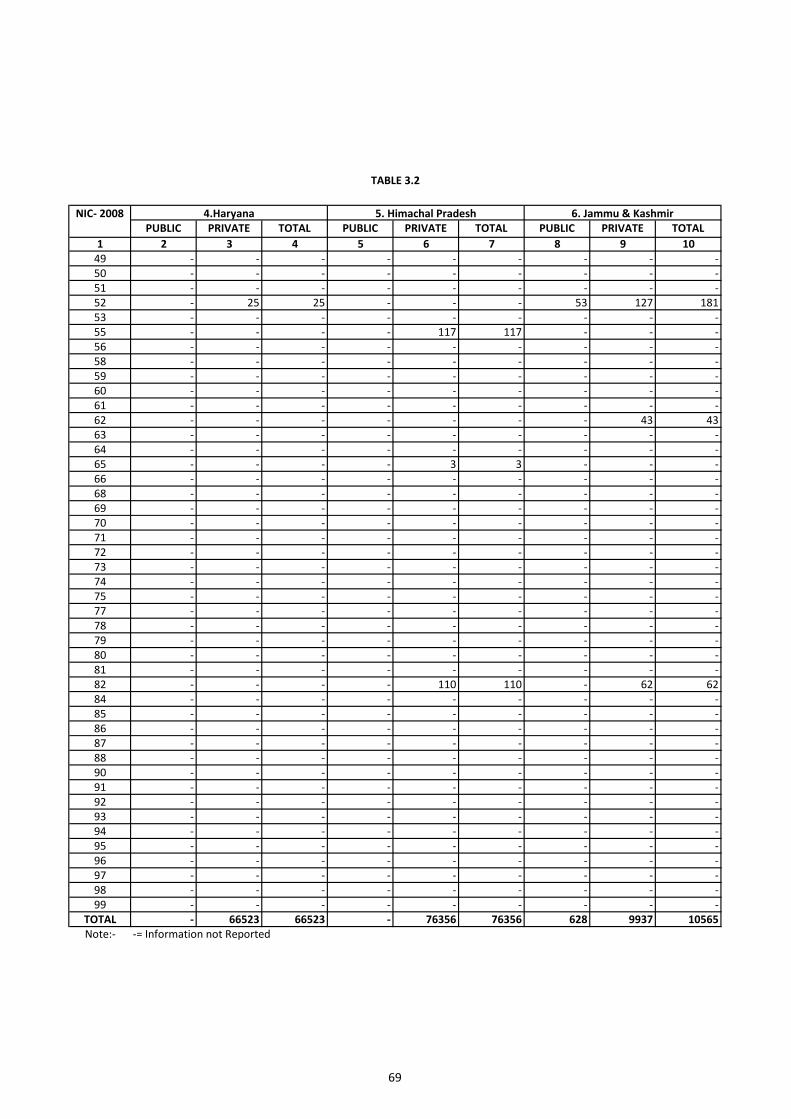
69
PUBLIC PRIVATE TOTAL PUBLIC PRIVATE TOTAL PUBLIC PRIVATE TOTAL1 2 3 4 5 6 7 8 9 10
49 - - - - - - - - -50 - - - - - - - - -51 - - - - - - - - -52 - 25 25 - - - 53 127 18153 - - - - - - - - -55 - - - - 117 117 - - -56 - - - - - - - - -58 - - - - - - - - -59 - - - - - - - - -60 - - - - - - - - -61 - - - - - - - - -62 - - - - - - - 43 4363 - - - - - - - - -64 - - - - - - - - -65 - - - - 3 3 - - -66 - - - - - - - - -68 - - - - - - - - -69 - - - - - - - - -70 - - - - - - - - -71 - - - - - - - - -72 - - - - - - - - -73 - - - - - - - - -74 - - - - - - - - -75 - - - - - - - - -77 - - - - - - - - -78 - - - - - - - - -79 - - - - - - - - -80 - - - - - - - - -81 - - - - - - - - -82 - - - - 110 110 - 62 6284 - - - - - - - - -85 - - - - - - - - -86 - - - - - - - - -87 - - - - - - - - -88 - - - - - - - - -90 - - - - - - - - -91 - - - - - - - - -92 - - - - - - - - -93 - - - - - - - - -94 - - - - - - - - -95 - - - - - - - - -96 - - - - - - - - -97 - - - - - - - - -98 - - - - - - - - -99 - - - - - - - - -
TOTAL - 66523 66523 - 76356 76356 628 9937 10565Note:- -= Information not Reported
4.Haryana 5. Himachal Pradesh 6. Jammu & KashmirNIC- 2008
TABLE 3.2
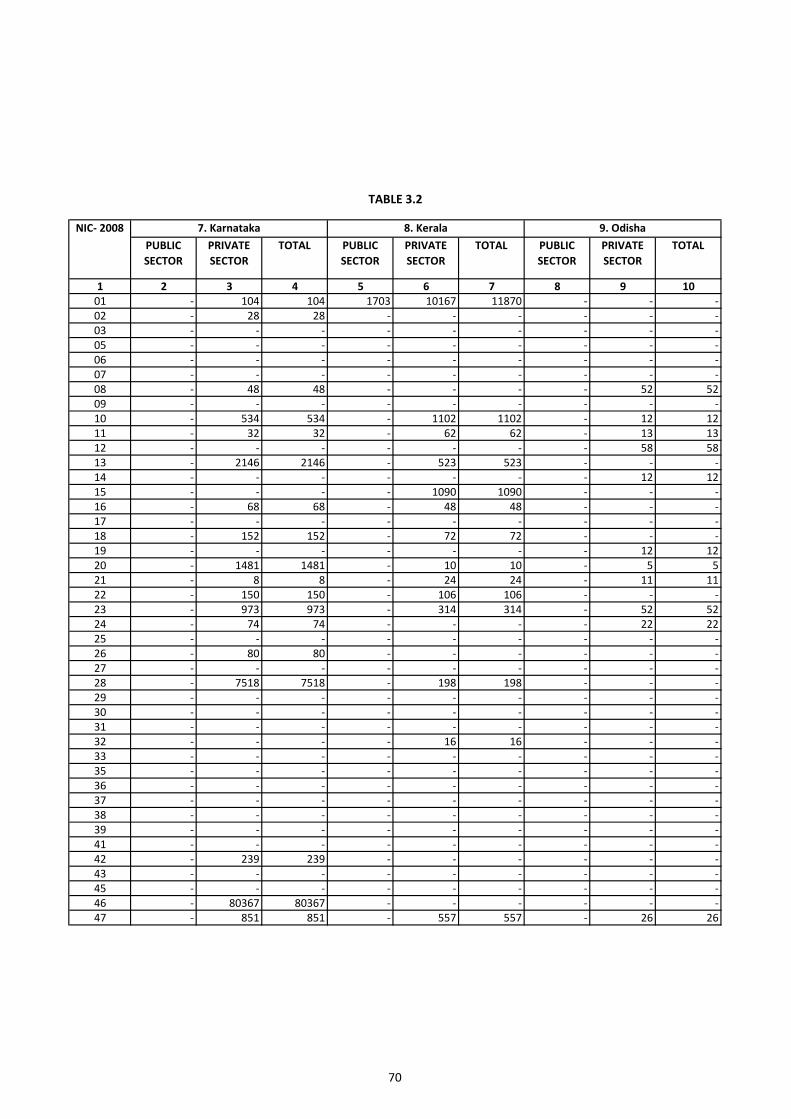
70
PUBLIC SECTOR
PRIVATE SECTOR
TOTAL PUBLIC SECTOR
PRIVATE SECTOR
TOTAL PUBLIC SECTOR
PRIVATE SECTOR
TOTAL
1 2 3 4 5 6 7 8 9 1001 - 104 104 1703 10167 11870 - - -02 - 28 28 - - - - - -03 - - - - - - - - -05 - - - - - - - - -06 - - - - - - - - -07 - - - - - - - - -08 - 48 48 - - - - 52 5209 - - - - - - - - -10 - 534 534 - 1102 1102 - 12 1211 - 32 32 - 62 62 - 13 1312 - - - - - - - 58 5813 - 2146 2146 - 523 523 - - -14 - - - - - - - 12 1215 - - - - 1090 1090 - - -16 - 68 68 - 48 48 - - -17 - - - - - - - - -18 - 152 152 - 72 72 - - -19 - - - - - - - 12 1220 - 1481 1481 - 10 10 - 5 521 - 8 8 - 24 24 - 11 1122 - 150 150 - 106 106 - - -23 - 973 973 - 314 314 - 52 5224 - 74 74 - - - - 22 2225 - - - - - - - - -26 - 80 80 - - - - - -27 - - - - - - - - -28 - 7518 7518 - 198 198 - - -29 - - - - - - - - -30 - - - - - - - - -31 - - - - - - - - -32 - - - - 16 16 - - -33 - - - - - - - - -35 - - - - - - - - -36 - - - - - - - - -37 - - - - - - - - -38 - - - - - - - - -39 - - - - - - - - -41 - - - - - - - - -42 - 239 239 - - - - - -43 - - - - - - - - -45 - - - - - - - - -46 - 80367 80367 - - - - - -47 - 851 851 - 557 557 - 26 26
9. Odisha
TABLE 3.2
NIC- 2008 7. Karnataka 8. Kerala
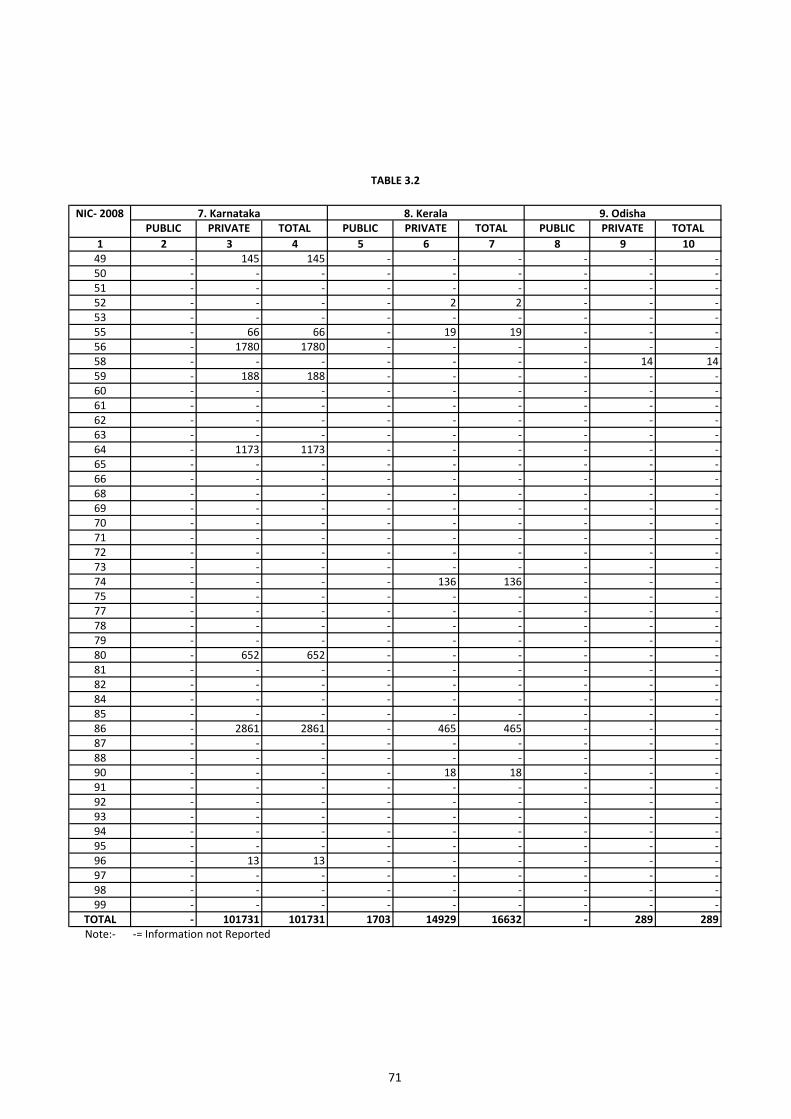
71
PUBLIC PRIVATE TOTAL PUBLIC PRIVATE TOTAL PUBLIC PRIVATE TOTAL1 2 3 4 5 6 7 8 9 10
49 - 145 145 - - - - - -50 - - - - - - - - -51 - - - - - - - - -52 - - - - 2 2 - - -53 - - - - - - - - -55 - 66 66 - 19 19 - - -56 - 1780 1780 - - - - - -58 - - - - - - - 14 1459 - 188 188 - - - - - -60 - - - - - - - - -61 - - - - - - - - -62 - - - - - - - - -63 - - - - - - - - -64 - 1173 1173 - - - - - -65 - - - - - - - - -66 - - - - - - - - -68 - - - - - - - - -69 - - - - - - - - -70 - - - - - - - - -71 - - - - - - - - -72 - - - - - - - - -73 - - - - - - - - -74 - - - - 136 136 - - -75 - - - - - - - - -77 - - - - - - - - -78 - - - - - - - - -79 - - - - - - - - -80 - 652 652 - - - - - -81 - - - - - - - - -82 - - - - - - - - -84 - - - - - - - - -85 - - - - - - - - -86 - 2861 2861 - 465 465 - - -87 - - - - - - - - -88 - - - - - - - - -90 - - - - 18 18 - - -91 - - - - - - - - -92 - - - - - - - - -93 - - - - - - - - -94 - - - - - - - - -95 - - - - - - - - -96 - 13 13 - - - - - -97 - - - - - - - - -98 - - - - - - - - -99 - - - - - - - - -
TOTAL - 101731 101731 1703 14929 16632 - 289 289Note:- -= Information not Reported
NIC- 2008 7. Karnataka
TABLE 3.2
8. Kerala 9. Odisha
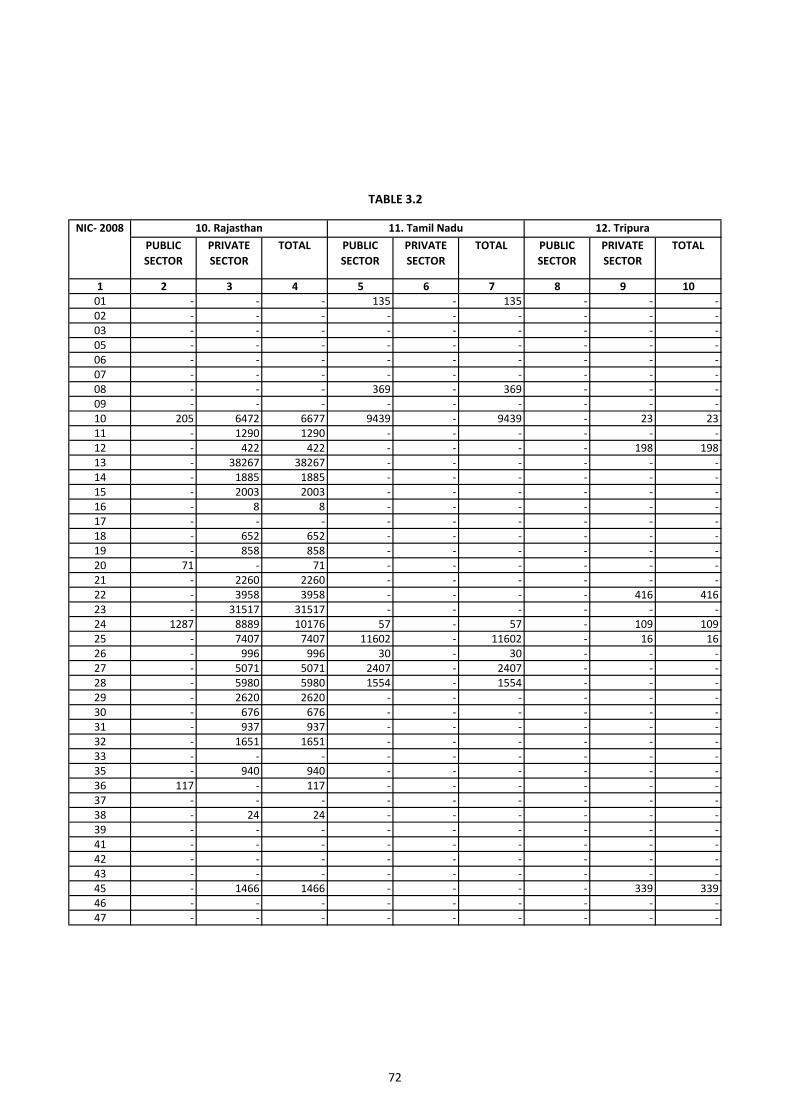
72
PUBLIC SECTOR
PRIVATE SECTOR
TOTAL PUBLIC SECTOR
PRIVATE SECTOR
TOTAL PUBLIC SECTOR
PRIVATE SECTOR
TOTAL
1 2 3 4 5 6 7 8 9 1001 - - - 135 - 135 - - -02 - - - - - - - - -03 - - - - - - - - -05 - - - - - - - - -06 - - - - - - - - -07 - - - - - - - - -08 - - - 369 - 369 - - -09 - - - - - - - - -10 205 6472 6677 9439 - 9439 - 23 2311 - 1290 1290 - - - - - -12 - 422 422 - - - - 198 19813 - 38267 38267 - - - - - -14 - 1885 1885 - - - - - -15 - 2003 2003 - - - - - -16 - 8 8 - - - - - -17 - - - - - - - - -18 - 652 652 - - - - - -19 - 858 858 - - - - - -20 71 - 71 - - - - - -21 - 2260 2260 - - - - - -22 - 3958 3958 - - - - 416 41623 - 31517 31517 - - - - - -24 1287 8889 10176 57 - 57 - 109 10925 - 7407 7407 11602 - 11602 - 16 1626 - 996 996 30 - 30 - - -27 - 5071 5071 2407 - 2407 - - -28 - 5980 5980 1554 - 1554 - - -29 - 2620 2620 - - - - - -30 - 676 676 - - - - - -31 - 937 937 - - - - - -32 - 1651 1651 - - - - - -33 - - - - - - - - -35 - 940 940 - - - - - -36 117 - 117 - - - - - -37 - - - - - - - - -38 - 24 24 - - - - - -39 - - - - - - - - -41 - - - - - - - - -42 - - - - - - - - -43 - - - - - - - - -45 - 1466 1466 - - - - 339 33946 - - - - - - - - -47 - - - - - - - - -
NIC- 2008 10. Rajasthan
TABLE 3.2
11. Tamil Nadu 12. Tripura
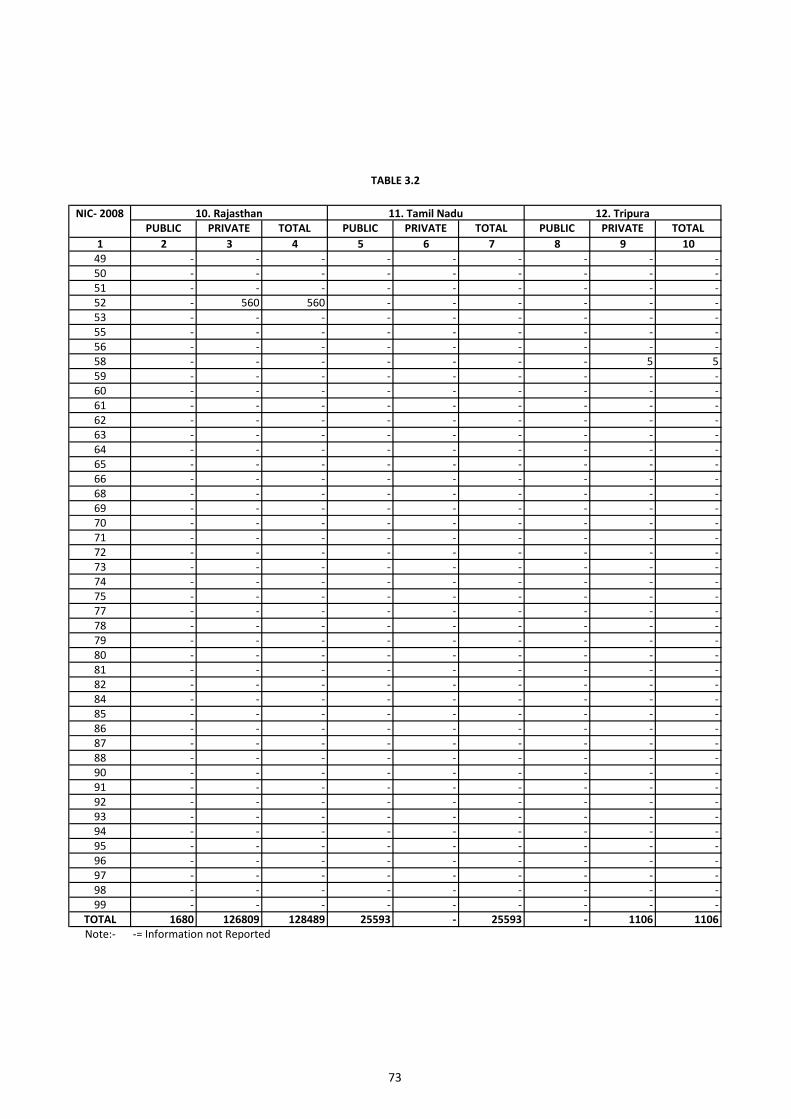
73
PUBLIC PRIVATE TOTAL PUBLIC PRIVATE TOTAL PUBLIC PRIVATE TOTAL1 2 3 4 5 6 7 8 9 10
49 - - - - - - - - -50 - - - - - - - - -51 - - - - - - - - -52 - 560 560 - - - - - -53 - - - - - - - - -55 - - - - - - - - -56 - - - - - - - - -58 - - - - - - - 5 559 - - - - - - - - -60 - - - - - - - - -61 - - - - - - - - -62 - - - - - - - - -63 - - - - - - - - -64 - - - - - - - - -65 - - - - - - - - -66 - - - - - - - - -68 - - - - - - - - -69 - - - - - - - - -70 - - - - - - - - -71 - - - - - - - - -72 - - - - - - - - -73 - - - - - - - - -74 - - - - - - - - -75 - - - - - - - - -77 - - - - - - - - -78 - - - - - - - - -79 - - - - - - - - -80 - - - - - - - - -81 - - - - - - - - -82 - - - - - - - - -84 - - - - - - - - -85 - - - - - - - - -86 - - - - - - - - -87 - - - - - - - - -88 - - - - - - - - -90 - - - - - - - - -91 - - - - - - - - -92 - - - - - - - - -93 - - - - - - - - -94 - - - - - - - - -95 - - - - - - - - -96 - - - - - - - - -97 - - - - - - - - -98 - - - - - - - - -99 - - - - - - - - -
TOTAL 1680 126809 128489 25593 - 25593 - 1106 1106Note:- -= Information not Reported
TABLE 3.2
NIC- 2008 10. Rajasthan 11. Tamil Nadu 12. Tripura
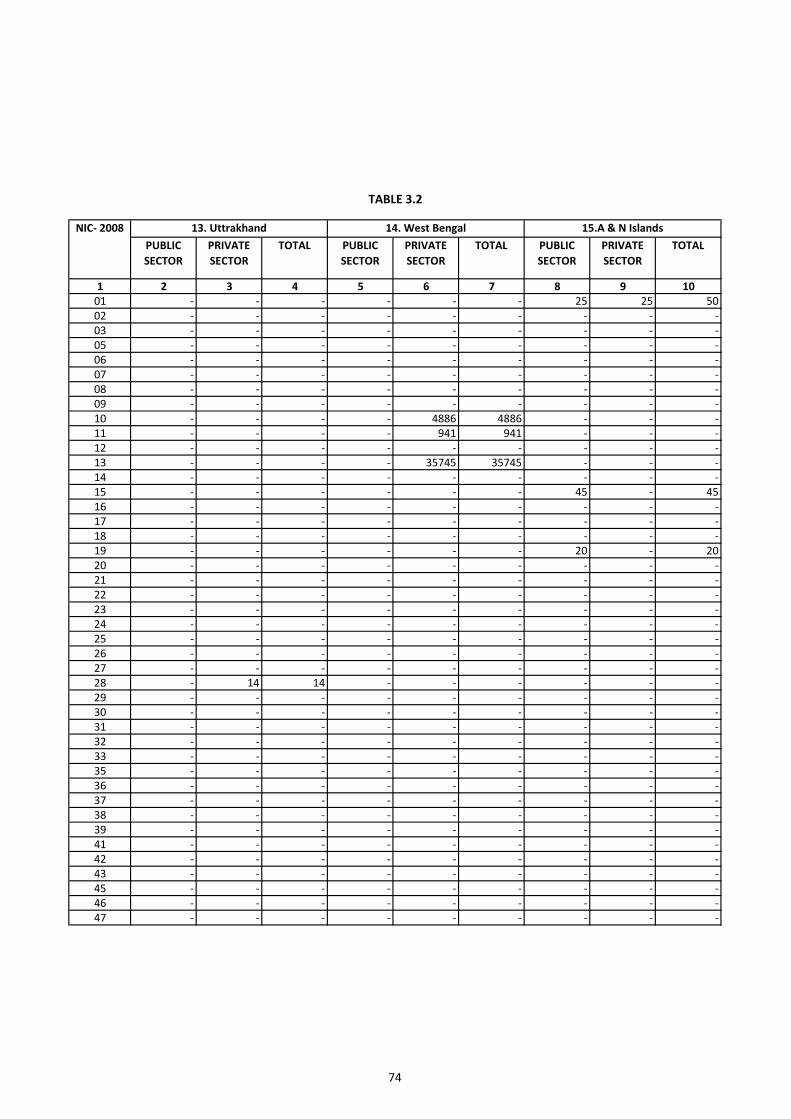
74
PUBLIC SECTOR
PRIVATE SECTOR
TOTAL PUBLIC SECTOR
PRIVATE SECTOR
TOTAL PUBLIC SECTOR
PRIVATE SECTOR
TOTAL
1 2 3 4 5 6 7 8 9 1001 - - - - - - 25 25 5002 - - - - - - - - -03 - - - - - - - - -05 - - - - - - - - -06 - - - - - - - - -07 - - - - - - - - -08 - - - - - - - - -09 - - - - - - - - -10 - - - - 4886 4886 - - -11 - - - - 941 941 - - -12 - - - - - - - - -13 - - - - 35745 35745 - - -14 - - - - - - - - -15 - - - - - - 45 - 4516 - - - - - - - - -17 - - - - - - - - -18 - - - - - - - - -19 - - - - - - 20 - 2020 - - - - - - - - -21 - - - - - - - - -22 - - - - - - - - -23 - - - - - - - - -24 - - - - - - - - -25 - - - - - - - - -26 - - - - - - - - -27 - - - - - - - - -28 - 14 14 - - - - - -29 - - - - - - - - -30 - - - - - - - - -31 - - - - - - - - -32 - - - - - - - - -33 - - - - - - - - -35 - - - - - - - - -36 - - - - - - - - -37 - - - - - - - - -38 - - - - - - - - -39 - - - - - - - - -41 - - - - - - - - -42 - - - - - - - - -43 - - - - - - - - -45 - - - - - - - - -46 - - - - - - - - -47 - - - - - - - - -
TABLE 3.2
14. West Bengal 15.A & N Islands NIC- 2008 13. Uttrakhand
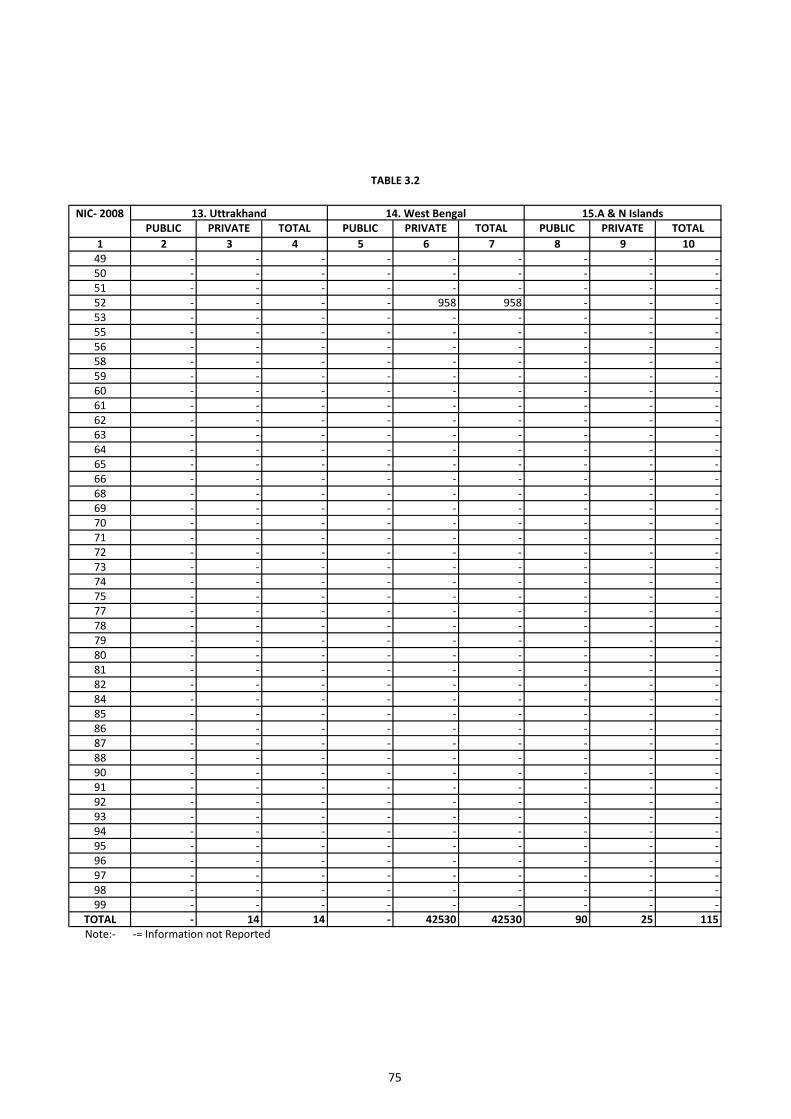
75
PUBLIC PRIVATE TOTAL PUBLIC PRIVATE TOTAL PUBLIC PRIVATE TOTAL1 2 3 4 5 6 7 8 9 10
49 - - - - - - - - -50 - - - - - - - - -51 - - - - - - - - -52 - - - - 958 958 - - -53 - - - - - - - - -55 - - - - - - - - -56 - - - - - - - - -58 - - - - - - - - -59 - - - - - - - - -60 - - - - - - - - -61 - - - - - - - - -62 - - - - - - - - -63 - - - - - - - - -64 - - - - - - - - -65 - - - - - - - - -66 - - - - - - - - -68 - - - - - - - - -69 - - - - - - - - -70 - - - - - - - - -71 - - - - - - - - -72 - - - - - - - - -73 - - - - - - - - -74 - - - - - - - - -75 - - - - - - - - -77 - - - - - - - - -78 - - - - - - - - -79 - - - - - - - - -80 - - - - - - - - -81 - - - - - - - - -82 - - - - - - - - -84 - - - - - - - - -85 - - - - - - - - -86 - - - - - - - - -87 - - - - - - - - -88 - - - - - - - - -90 - - - - - - - - -91 - - - - - - - - -92 - - - - - - - - -93 - - - - - - - - -94 - - - - - - - - -95 - - - - - - - - -96 - - - - - - - - -97 - - - - - - - - -98 - - - - - - - - -99 - - - - - - - - -
TOTAL - 14 14 - 42530 42530 90 25 115Note:- -= Information not Reported
NIC- 2008 13. Uttrakhand 14. West Bengal 15.A & N Islands
TABLE 3.2
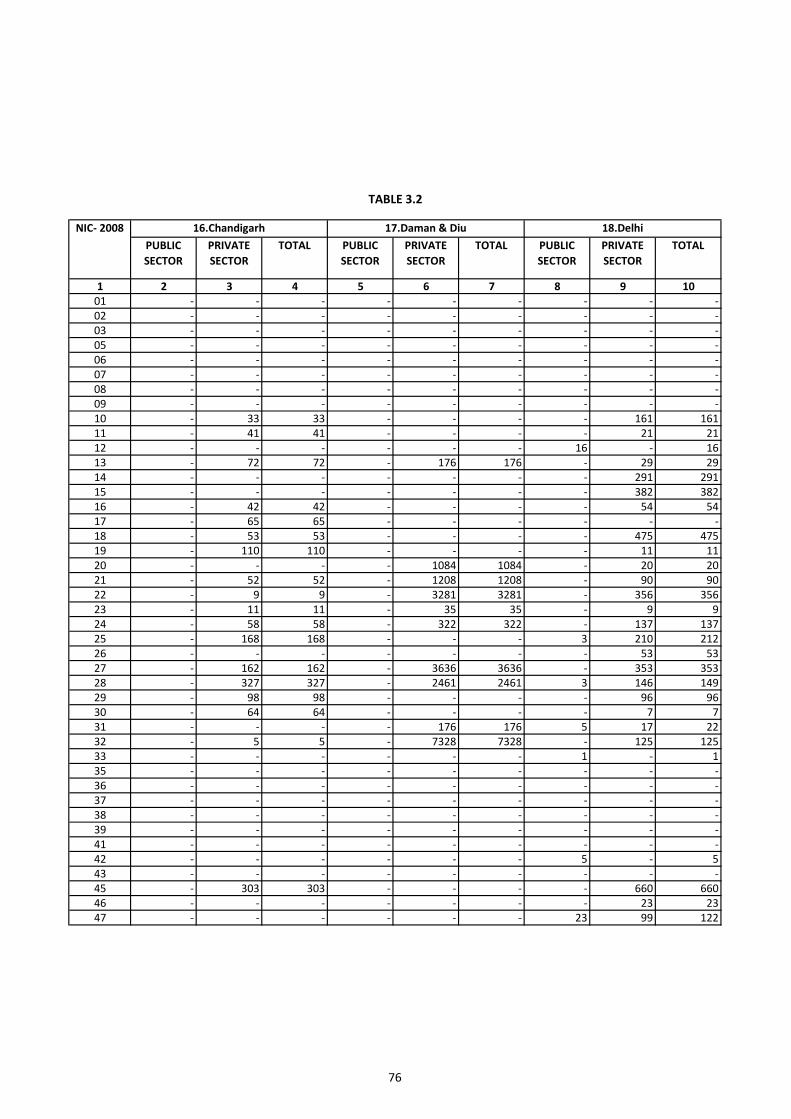
76
PUBLIC SECTOR
PRIVATE SECTOR
TOTAL PUBLIC SECTOR
PRIVATE SECTOR
TOTAL PUBLIC SECTOR
PRIVATE SECTOR
TOTAL
1 2 3 4 5 6 7 8 9 1001 - - - - - - - - -02 - - - - - - - - -03 - - - - - - - - -05 - - - - - - - - -06 - - - - - - - - -07 - - - - - - - - -08 - - - - - - - - -09 - - - - - - - - -10 - 33 33 - - - - 161 16111 - 41 41 - - - - 21 2112 - - - - - - 16 - 1613 - 72 72 - 176 176 - 29 2914 - - - - - - - 291 29115 - - - - - - - 382 38216 - 42 42 - - - - 54 5417 - 65 65 - - - - - -18 - 53 53 - - - - 475 47519 - 110 110 - - - - 11 1120 - - - - 1084 1084 - 20 2021 - 52 52 - 1208 1208 - 90 9022 - 9 9 - 3281 3281 - 356 35623 - 11 11 - 35 35 - 9 924 - 58 58 - 322 322 - 137 13725 - 168 168 - - - 3 210 21226 - - - - - - - 53 5327 - 162 162 - 3636 3636 - 353 35328 - 327 327 - 2461 2461 3 146 14929 - 98 98 - - - - 96 9630 - 64 64 - - - - 7 731 - - - - 176 176 5 17 2232 - 5 5 - 7328 7328 - 125 12533 - - - - - - 1 - 135 - - - - - - - - -36 - - - - - - - - -37 - - - - - - - - -38 - - - - - - - - -39 - - - - - - - - -41 - - - - - - - - -42 - - - - - - 5 - 543 - - - - - - - - -45 - 303 303 - - - - 660 66046 - - - - - - - 23 2347 - - - - - - 23 99 122
17.Daman & DiuNIC- 2008
TABLE 3.2
18.Delhi16.Chandigarh
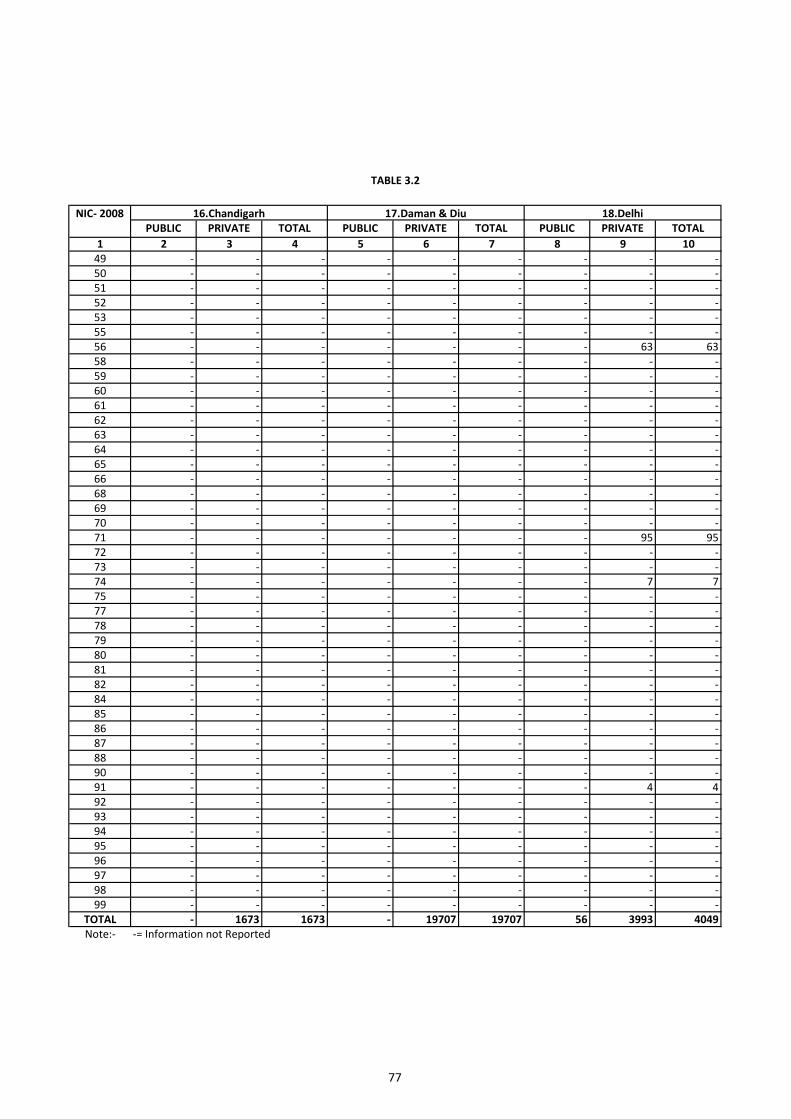
77
PUBLIC PRIVATE TOTAL PUBLIC PRIVATE TOTAL PUBLIC PRIVATE TOTAL1 2 3 4 5 6 7 8 9 10
49 - - - - - - - - -50 - - - - - - - - -51 - - - - - - - - -52 - - - - - - - - -53 - - - - - - - - -55 - - - - - - - - -56 - - - - - - - 63 6358 - - - - - - - - -59 - - - - - - - - -60 - - - - - - - - -61 - - - - - - - - -62 - - - - - - - - -63 - - - - - - - - -64 - - - - - - - - -65 - - - - - - - - -66 - - - - - - - - -68 - - - - - - - - -69 - - - - - - - - -70 - - - - - - - - -71 - - - - - - - 95 9572 - - - - - - - - -73 - - - - - - - - -74 - - - - - - - 7 775 - - - - - - - - -77 - - - - - - - - -78 - - - - - - - - -79 - - - - - - - - -80 - - - - - - - - -81 - - - - - - - - -82 - - - - - - - - -84 - - - - - - - - -85 - - - - - - - - -86 - - - - - - - - -87 - - - - - - - - -88 - - - - - - - - -90 - - - - - - - - -91 - - - - - - - 4 492 - - - - - - - - -93 - - - - - - - - -94 - - - - - - - - -95 - - - - - - - - -96 - - - - - - - - -97 - - - - - - - - -98 - - - - - - - - -99 - - - - - - - - -
TOTAL - 1673 1673 - 19707 19707 56 3993 4049Note:- -= Information not Reported
18.Delhi17.Daman & Diu
TABLE 3.2
NIC- 2008 16.Chandigarh
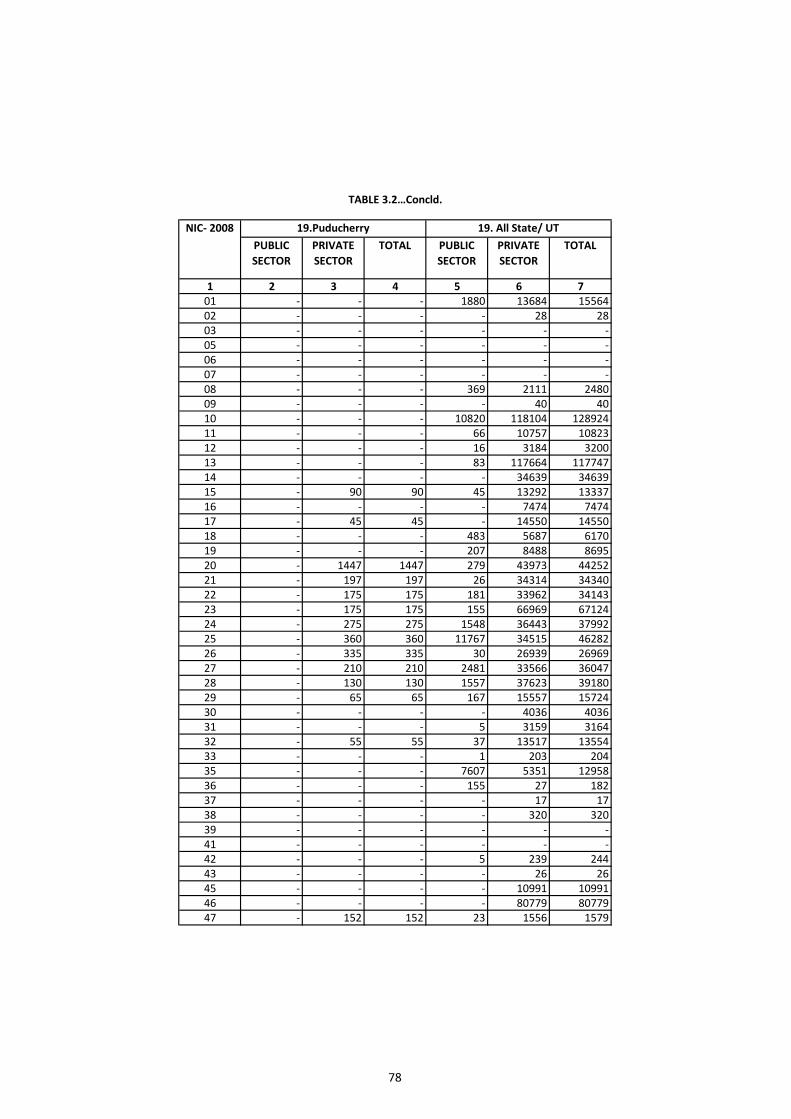
78
PUBLIC SECTOR
PRIVATE SECTOR
TOTAL PUBLIC SECTOR
PRIVATE SECTOR
TOTAL
1 2 3 4 5 6 701 - - - 1880 13684 1556402 - - - - 28 2803 - - - - - -05 - - - - - -06 - - - - - -07 - - - - - -08 - - - 369 2111 248009 - - - - 40 4010 - - - 10820 118104 12892411 - - - 66 10757 1082312 - - - 16 3184 320013 - - - 83 117664 11774714 - - - - 34639 3463915 - 90 90 45 13292 1333716 - - - - 7474 747417 - 45 45 - 14550 1455018 - - - 483 5687 617019 - - - 207 8488 869520 - 1447 1447 279 43973 4425221 - 197 197 26 34314 3434022 - 175 175 181 33962 3414323 - 175 175 155 66969 6712424 - 275 275 1548 36443 3799225 - 360 360 11767 34515 4628226 - 335 335 30 26939 2696927 - 210 210 2481 33566 3604728 - 130 130 1557 37623 3918029 - 65 65 167 15557 1572430 - - - - 4036 403631 - - - 5 3159 316432 - 55 55 37 13517 1355433 - - - 1 203 20435 - - - 7607 5351 1295836 - - - 155 27 18237 - - - - 17 1738 - - - - 320 32039 - - - - - -41 - - - - - -42 - - - 5 239 24443 - - - - 26 2645 - - - - 10991 1099146 - - - - 80779 8077947 - 152 152 23 1556 1579
NIC- 2008 19.Puducherry 19. All State/ UT
TABLE 3.2…Concld.
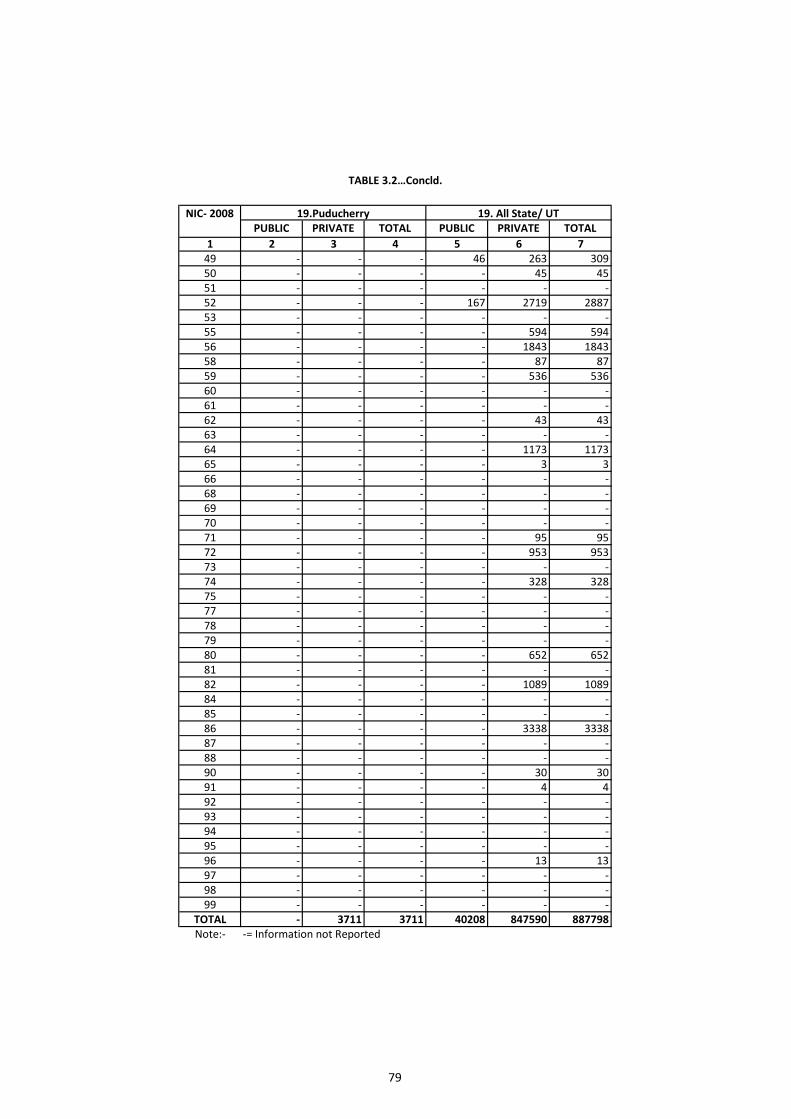
79
PUBLIC PRIVATE TOTAL PUBLIC PRIVATE TOTAL1 2 3 4 5 6 7
49 - - - 46 263 30950 - - - - 45 4551 - - - - - -52 - - - 167 2719 288753 - - - - - -55 - - - - 594 59456 - - - - 1843 184358 - - - - 87 8759 - - - - 536 53660 - - - - - -61 - - - - - -62 - - - - 43 4363 - - - - - -64 - - - - 1173 117365 - - - - 3 366 - - - - - -68 - - - - - -69 - - - - - -70 - - - - - -71 - - - - 95 9572 - - - - 953 95373 - - - - - -74 - - - - 328 32875 - - - - - -77 - - - - - -78 - - - - - -79 - - - - - -80 - - - - 652 65281 - - - - - -82 - - - - 1089 108984 - - - - - -85 - - - - - -86 - - - - 3338 333887 - - - - - -88 - - - - - -90 - - - - 30 3091 - - - - 4 492 - - - - - -93 - - - - - -94 - - - - - -95 - - - - - -96 - - - - 13 1397 - - - - - -98 - - - - - -99 - - - - - -
TOTAL - 3711 3711 40208 847590 887798Note:- -= Information not Reported
TABLE 3.2…Concld.
NIC- 2008 19.Puducherry 19. All State/ UT
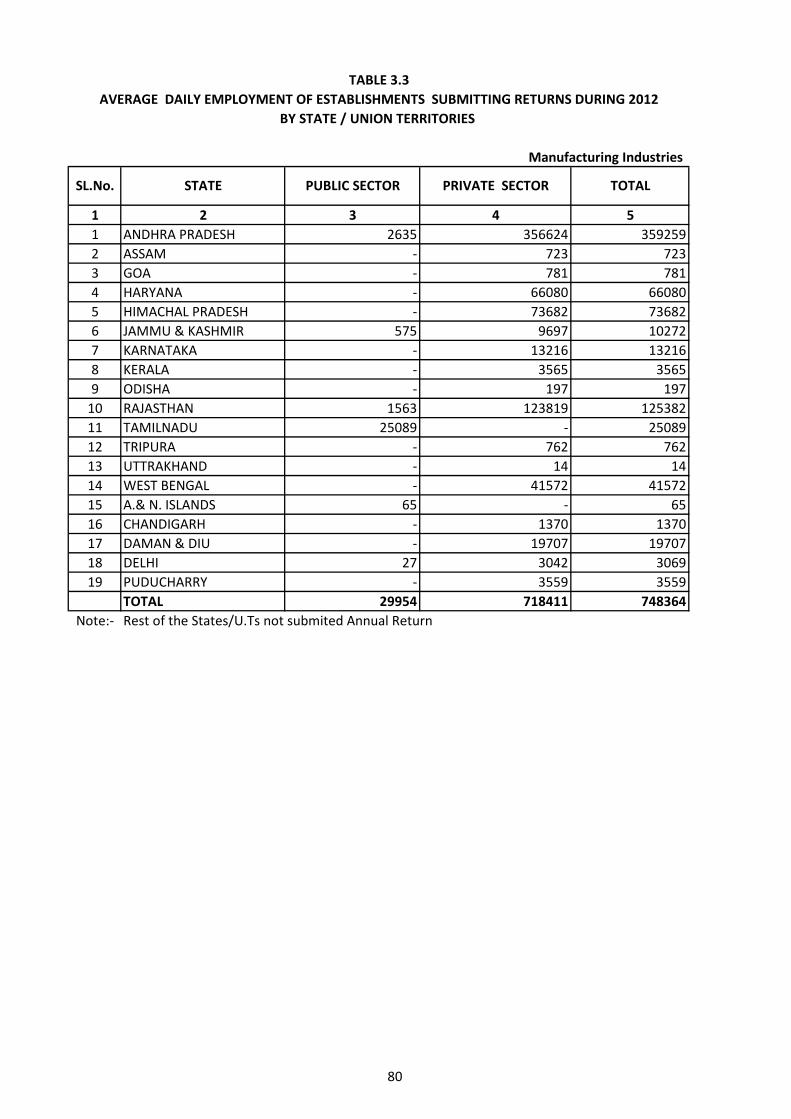
80
1 2 3 4 51 ANDHRA PRADESH 2635 356624 3592592 ASSAM - 723 7233 GOA - 781 7814 HARYANA - 66080 660805 HIMACHAL PRADESH - 73682 736826 JAMMU & KASHMIR 575 9697 102727 KARNATAKA - 13216 132168 KERALA - 3565 35659 ODISHA - 197 197
10 RAJASTHAN 1563 123819 12538211 TAMILNADU 25089 - 2508912 TRIPURA - 762 76213 UTTRAKHAND - 14 1414 WEST BENGAL - 41572 4157215 A.& N. ISLANDS 65 - 6516 CHANDIGARH - 1370 137017 DAMAN & DIU - 19707 1970718 DELHI 27 3042 306919 PUDUCHARRY - 3559 3559
TOTAL 29954 718411 748364Note:- Rest of the States/U.Ts not submited Annual Return
TABLE 3.3AVERAGE DAILY EMPLOYMENT OF ESTABLISHMENTS SUBMITTING RETURNS DURING 2012
BY STATE / UNION TERRITORIES
Manufacturing Industries
SL.No. STATE PUBLIC SECTOR PRIVATE SECTOR TOTAL
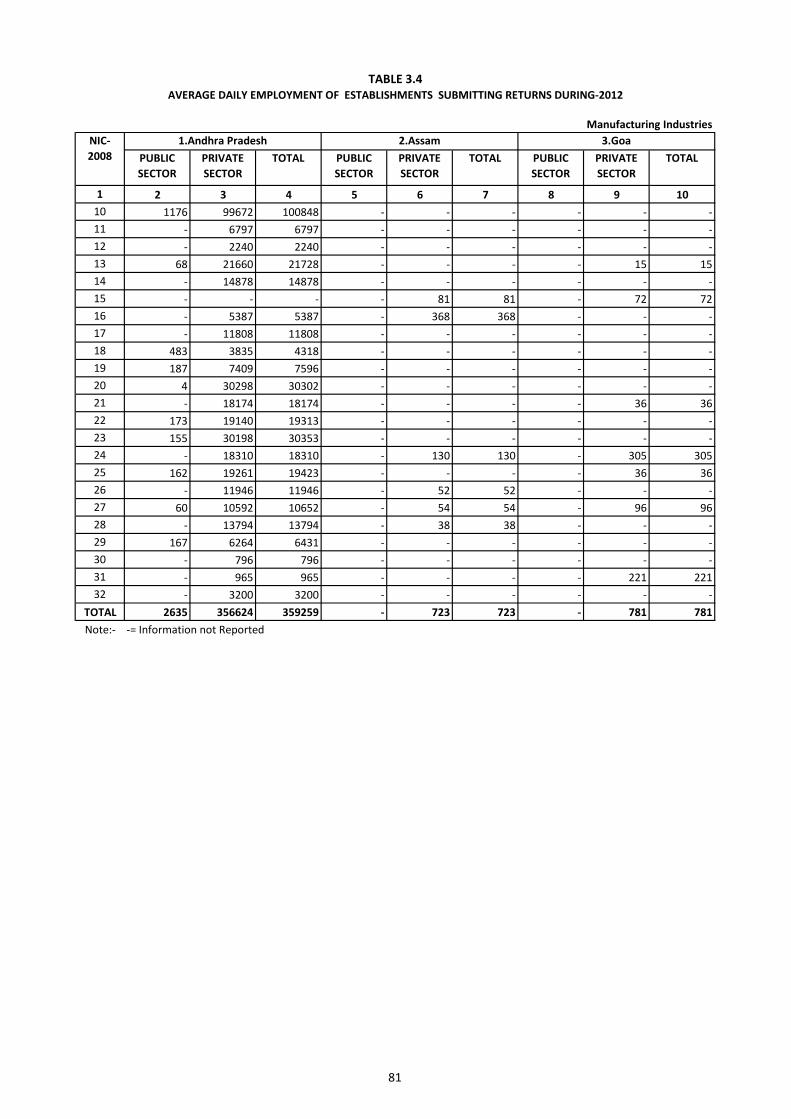
81
PUBLIC SECTOR
PRIVATE SECTOR
TOTAL PUBLIC SECTOR
PRIVATE SECTOR
TOTAL PUBLIC SECTOR
PRIVATE SECTOR
TOTAL
1 2 3 4 5 6 7 8 9 1010 1176 99672 100848 - - - - - -11 - 6797 6797 - - - - - -12 - 2240 2240 - - - - - -13 68 21660 21728 - - - - 15 1514 - 14878 14878 - - - - - -15 - - - - 81 81 - 72 7216 - 5387 5387 - 368 368 - - -17 - 11808 11808 - - - - - -18 483 3835 4318 - - - - - -19 187 7409 7596 - - - - - -20 4 30298 30302 - - - - - -21 - 18174 18174 - - - - 36 3622 173 19140 19313 - - - - - -23 155 30198 30353 - - - - - -24 - 18310 18310 - 130 130 - 305 30525 162 19261 19423 - - - - 36 3626 - 11946 11946 - 52 52 - - -27 60 10592 10652 - 54 54 - 96 9628 - 13794 13794 - 38 38 - - -29 167 6264 6431 - - - - - -30 - 796 796 - - - - - -31 - 965 965 - - - - 221 22132 - 3200 3200 - - - - - -
TOTAL 2635 356624 359259 - 723 723 - 781 781Note:- -= Information not Reported
NIC- 2008
1.Andhra Pradesh 2.Assam 3.GoaManufacturing Industries
TABLE 3.4AVERAGE DAILY EMPLOYMENT OF ESTABLISHMENTS SUBMITTING RETURNS DURING-2012
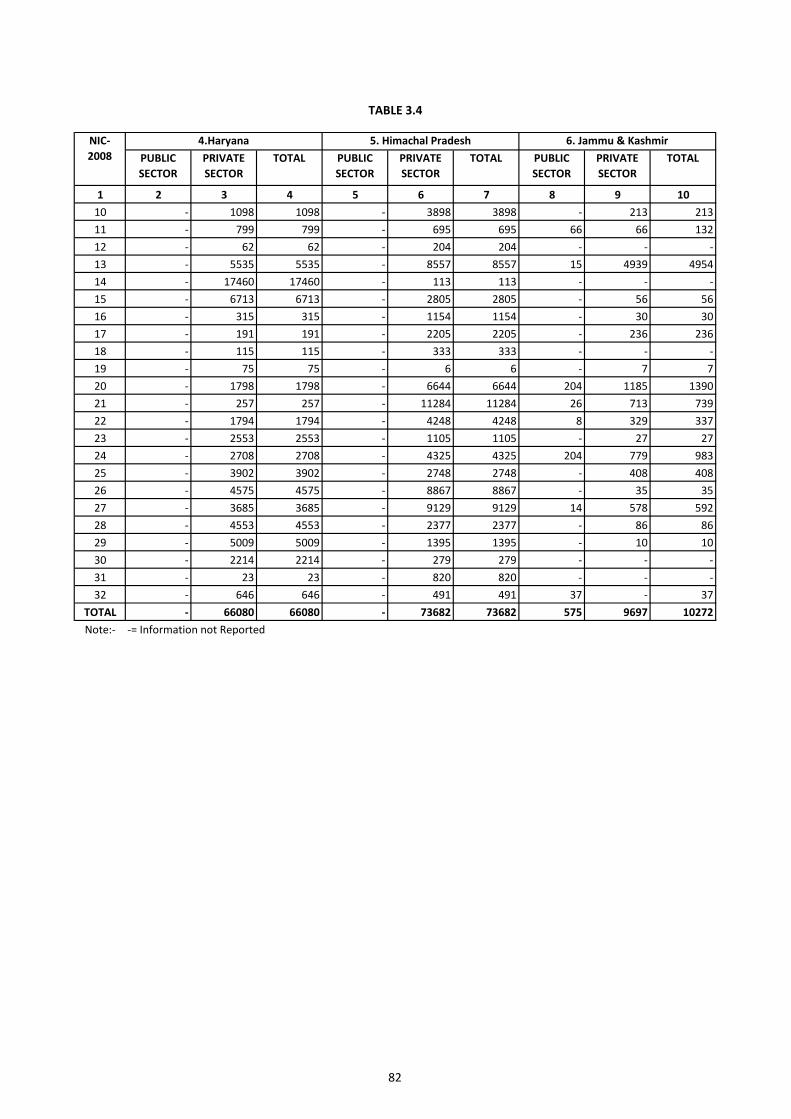
82
PUBLIC SECTOR
PRIVATE SECTOR
TOTAL PUBLIC SECTOR
PRIVATE SECTOR
TOTAL PUBLIC SECTOR
PRIVATE SECTOR
TOTAL
1 2 3 4 5 6 7 8 9 1010 - 1098 1098 - 3898 3898 - 213 21311 - 799 799 - 695 695 66 66 13212 - 62 62 - 204 204 - - -13 - 5535 5535 - 8557 8557 15 4939 495414 - 17460 17460 - 113 113 - - -15 - 6713 6713 - 2805 2805 - 56 5616 - 315 315 - 1154 1154 - 30 3017 - 191 191 - 2205 2205 - 236 23618 - 115 115 - 333 333 - - -19 - 75 75 - 6 6 - 7 720 - 1798 1798 - 6644 6644 204 1185 139021 - 257 257 - 11284 11284 26 713 73922 - 1794 1794 - 4248 4248 8 329 33723 - 2553 2553 - 1105 1105 - 27 2724 - 2708 2708 - 4325 4325 204 779 98325 - 3902 3902 - 2748 2748 - 408 40826 - 4575 4575 - 8867 8867 - 35 3527 - 3685 3685 - 9129 9129 14 578 59228 - 4553 4553 - 2377 2377 - 86 8629 - 5009 5009 - 1395 1395 - 10 1030 - 2214 2214 - 279 279 - - -31 - 23 23 - 820 820 - - -32 - 646 646 - 491 491 37 - 37
TOTAL - 66080 66080 - 73682 73682 575 9697 10272Note:- -= Information not Reported
NIC- 2008
4.Haryana 5. Himachal Pradesh 6. Jammu & Kashmir
TABLE 3.4
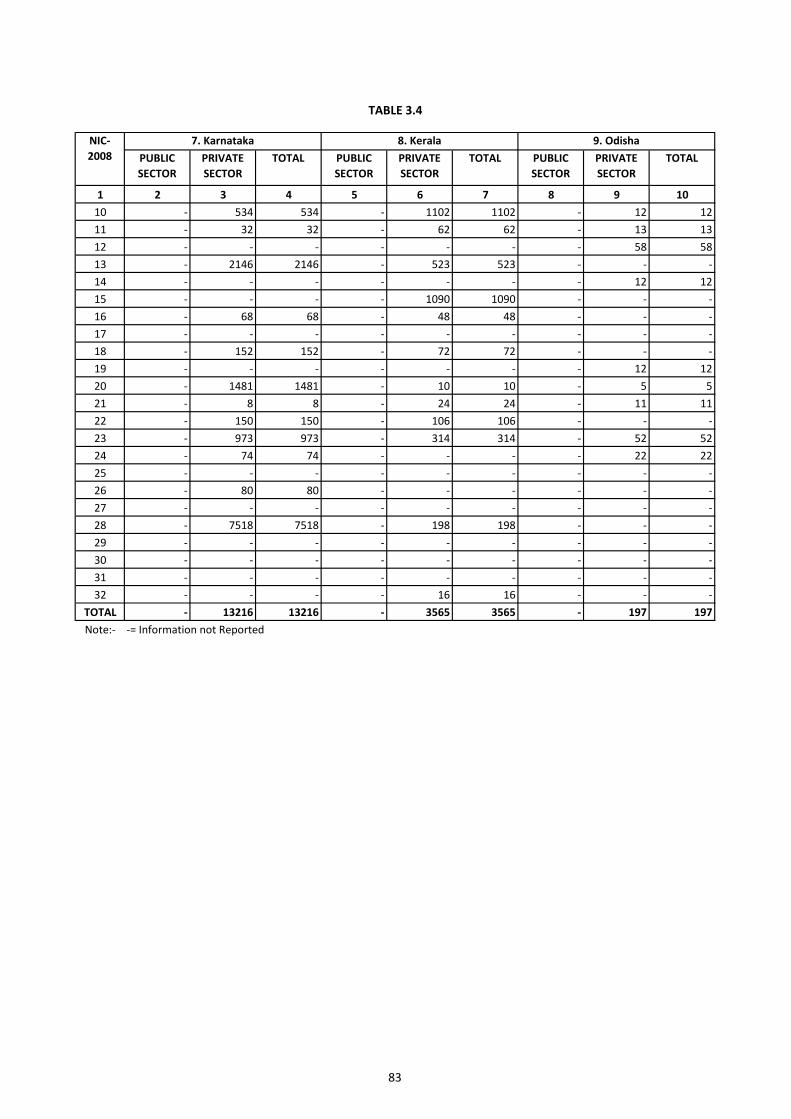
83
PUBLIC SECTOR
PRIVATE SECTOR
TOTAL PUBLIC SECTOR
PRIVATE SECTOR
TOTAL PUBLIC SECTOR
PRIVATE SECTOR
TOTAL
1 2 3 4 5 6 7 8 9 1010 - 534 534 - 1102 1102 - 12 1211 - 32 32 - 62 62 - 13 1312 - - - - - - - 58 5813 - 2146 2146 - 523 523 - - -14 - - - - - - - 12 1215 - - - - 1090 1090 - - -16 - 68 68 - 48 48 - - -17 - - - - - - - - -18 - 152 152 - 72 72 - - -19 - - - - - - - 12 1220 - 1481 1481 - 10 10 - 5 521 - 8 8 - 24 24 - 11 1122 - 150 150 - 106 106 - - -23 - 973 973 - 314 314 - 52 5224 - 74 74 - - - - 22 2225 - - - - - - - - -26 - 80 80 - - - - - -27 - - - - - - - - -28 - 7518 7518 - 198 198 - - -29 - - - - - - - - -30 - - - - - - - - -31 - - - - - - - - -32 - - - - 16 16 - - -
TOTAL - 13216 13216 - 3565 3565 - 197 197Note:- -= Information not Reported
NIC- 2008
7. Karnataka 8. Kerala 9. Odisha
TABLE 3.4
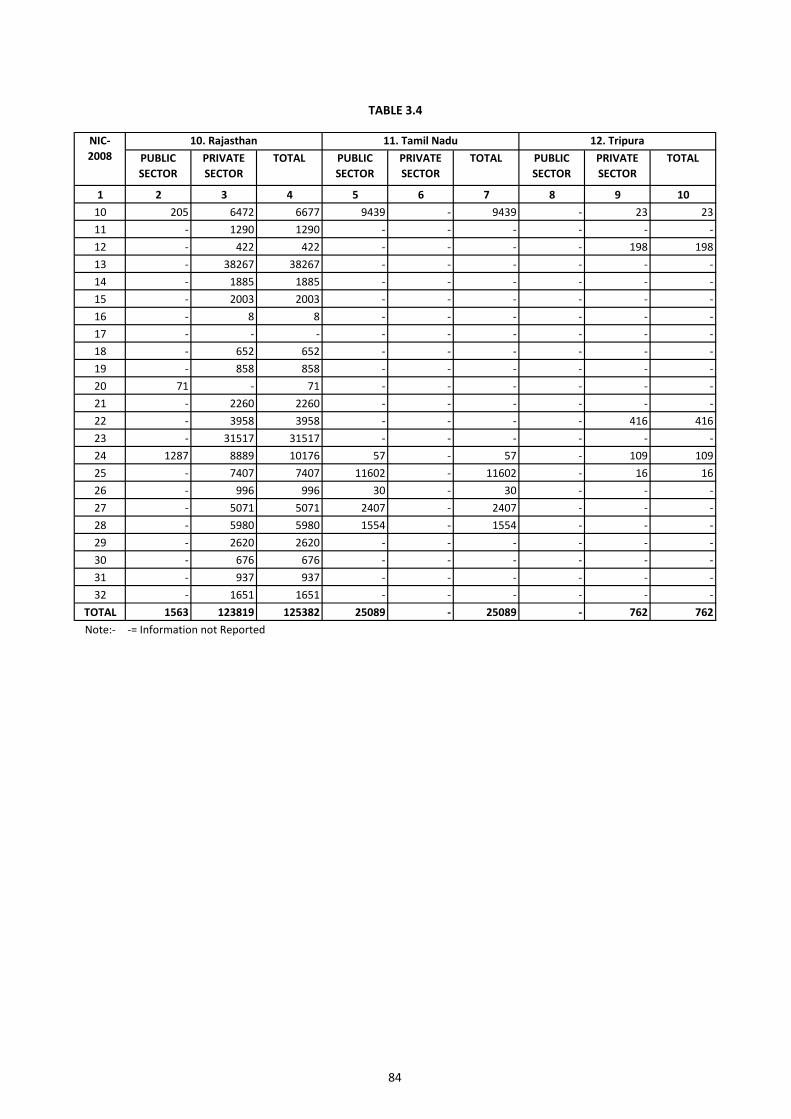
84
PUBLIC SECTOR
PRIVATE SECTOR
TOTAL PUBLIC SECTOR
PRIVATE SECTOR
TOTAL PUBLIC SECTOR
PRIVATE SECTOR
TOTAL
1 2 3 4 5 6 7 8 9 1010 205 6472 6677 9439 - 9439 - 23 2311 - 1290 1290 - - - - - -12 - 422 422 - - - - 198 19813 - 38267 38267 - - - - - -14 - 1885 1885 - - - - - -15 - 2003 2003 - - - - - -16 - 8 8 - - - - - -17 - - - - - - - - -18 - 652 652 - - - - - -19 - 858 858 - - - - - -20 71 - 71 - - - - - -21 - 2260 2260 - - - - - -22 - 3958 3958 - - - - 416 41623 - 31517 31517 - - - - - -24 1287 8889 10176 57 - 57 - 109 10925 - 7407 7407 11602 - 11602 - 16 1626 - 996 996 30 - 30 - - -27 - 5071 5071 2407 - 2407 - - -28 - 5980 5980 1554 - 1554 - - -29 - 2620 2620 - - - - - -30 - 676 676 - - - - - -31 - 937 937 - - - - - -32 - 1651 1651 - - - - - -
TOTAL 1563 123819 125382 25089 - 25089 - 762 762Note:- -= Information not Reported
NIC- 2008
10. Rajasthan 11. Tamil Nadu 12. Tripura
TABLE 3.4
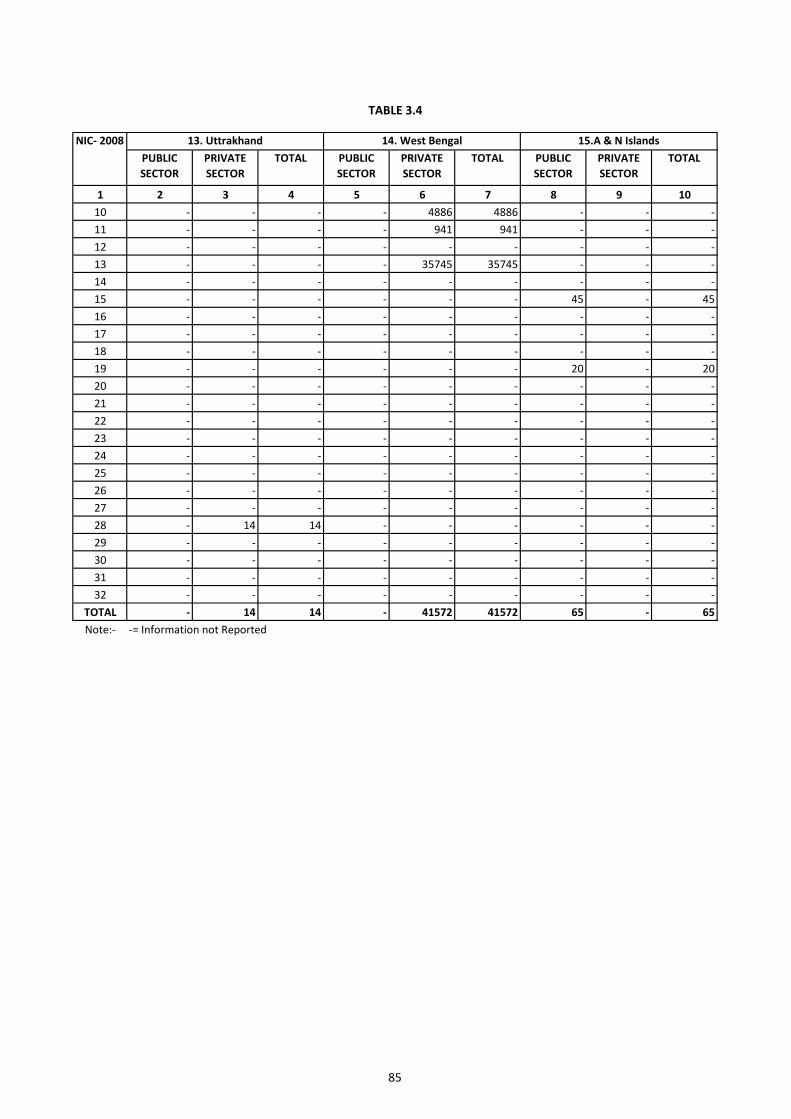
85
PUBLIC SECTOR
PRIVATE SECTOR
TOTAL PUBLIC SECTOR
PRIVATE SECTOR
TOTAL PUBLIC SECTOR
PRIVATE SECTOR
TOTAL
1 2 3 4 5 6 7 8 9 1010 - - - - 4886 4886 - - -11 - - - - 941 941 - - -12 - - - - - - - - -13 - - - - 35745 35745 - - -14 - - - - - - - - -15 - - - - - - 45 - 4516 - - - - - - - - -17 - - - - - - - - -18 - - - - - - - - -19 - - - - - - 20 - 2020 - - - - - - - - -21 - - - - - - - - -22 - - - - - - - - -23 - - - - - - - - -24 - - - - - - - - -25 - - - - - - - - -26 - - - - - - - - -27 - - - - - - - - -28 - 14 14 - - - - - -29 - - - - - - - - -30 - - - - - - - - -31 - - - - - - - - -32 - - - - - - - - -
TOTAL - 14 14 - 41572 41572 65 - 65Note:- -= Information not Reported
NIC- 2008 13. Uttrakhand 14. West Bengal 15.A & N Islands
TABLE 3.4
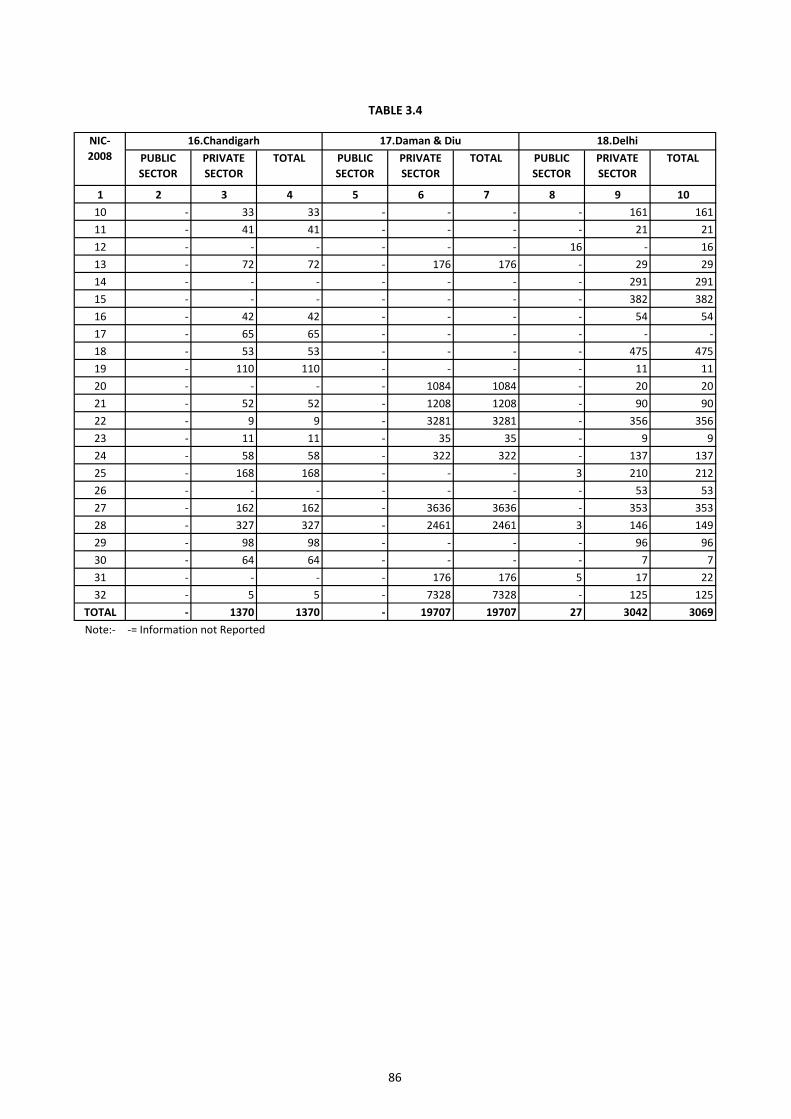
86
PUBLIC SECTOR
PRIVATE SECTOR
TOTAL PUBLIC SECTOR
PRIVATE SECTOR
TOTAL PUBLIC SECTOR
PRIVATE SECTOR
TOTAL
1 2 3 4 5 6 7 8 9 1010 - 33 33 - - - - 161 16111 - 41 41 - - - - 21 2112 - - - - - - 16 - 1613 - 72 72 - 176 176 - 29 2914 - - - - - - - 291 29115 - - - - - - - 382 38216 - 42 42 - - - - 54 5417 - 65 65 - - - - - -18 - 53 53 - - - - 475 47519 - 110 110 - - - - 11 1120 - - - - 1084 1084 - 20 2021 - 52 52 - 1208 1208 - 90 9022 - 9 9 - 3281 3281 - 356 35623 - 11 11 - 35 35 - 9 924 - 58 58 - 322 322 - 137 13725 - 168 168 - - - 3 210 21226 - - - - - - - 53 5327 - 162 162 - 3636 3636 - 353 35328 - 327 327 - 2461 2461 3 146 14929 - 98 98 - - - - 96 9630 - 64 64 - - - - 7 731 - - - - 176 176 5 17 2232 - 5 5 - 7328 7328 - 125 125
TOTAL - 1370 1370 - 19707 19707 27 3042 3069Note:- -= Information not Reported
TABLE 3.4
18.Delhi16.Chandigarh 17.Daman & DiuNIC- 2008
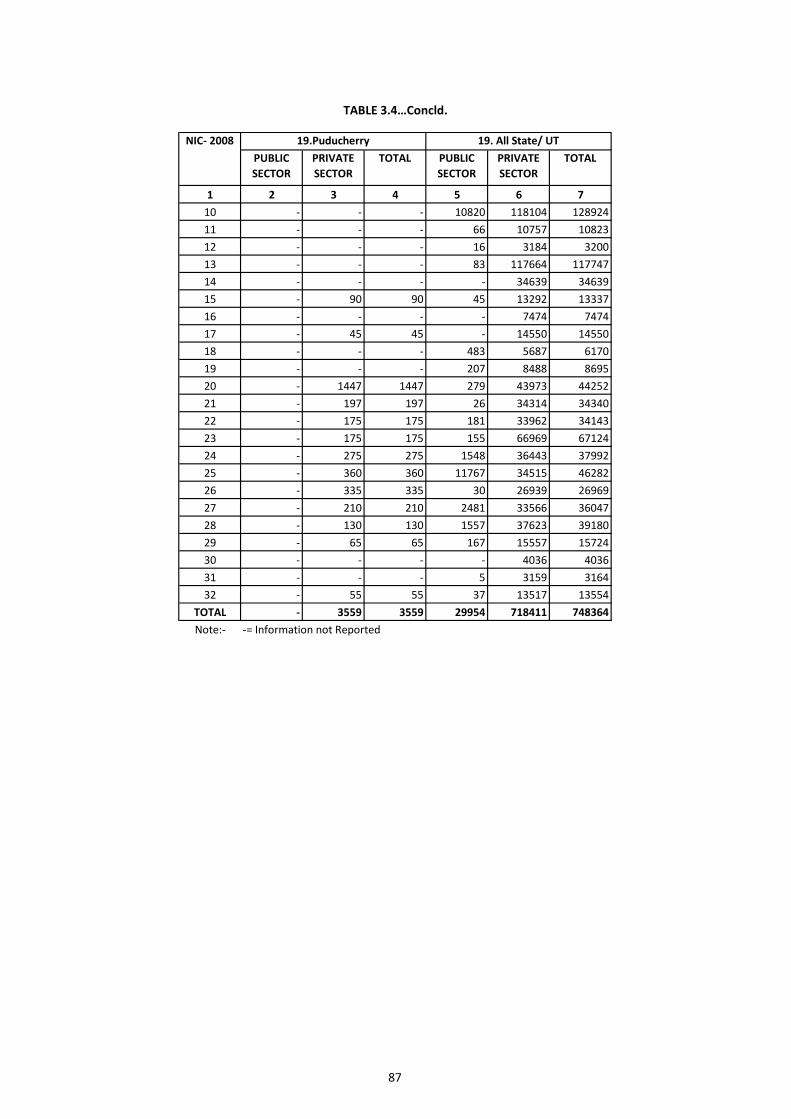
87
PUBLIC SECTOR
PRIVATE SECTOR
TOTAL PUBLIC SECTOR
PRIVATE SECTOR
TOTAL
1 2 3 4 5 6 710 - - - 10820 118104 12892411 - - - 66 10757 1082312 - - - 16 3184 320013 - - - 83 117664 11774714 - - - - 34639 3463915 - 90 90 45 13292 1333716 - - - - 7474 747417 - 45 45 - 14550 1455018 - - - 483 5687 617019 - - - 207 8488 869520 - 1447 1447 279 43973 4425221 - 197 197 26 34314 3434022 - 175 175 181 33962 3414323 - 175 175 155 66969 6712424 - 275 275 1548 36443 3799225 - 360 360 11767 34515 4628226 - 335 335 30 26939 2696927 - 210 210 2481 33566 3604728 - 130 130 1557 37623 3918029 - 65 65 167 15557 1572430 - - - - 4036 403631 - - - 5 3159 316432 - 55 55 37 13517 13554
TOTAL - 3559 3559 29954 718411 748364Note:- -= Information not Reported
NIC- 2008 19.Puducherry 19. All State/ UT
TABLE 3.4…Concld.
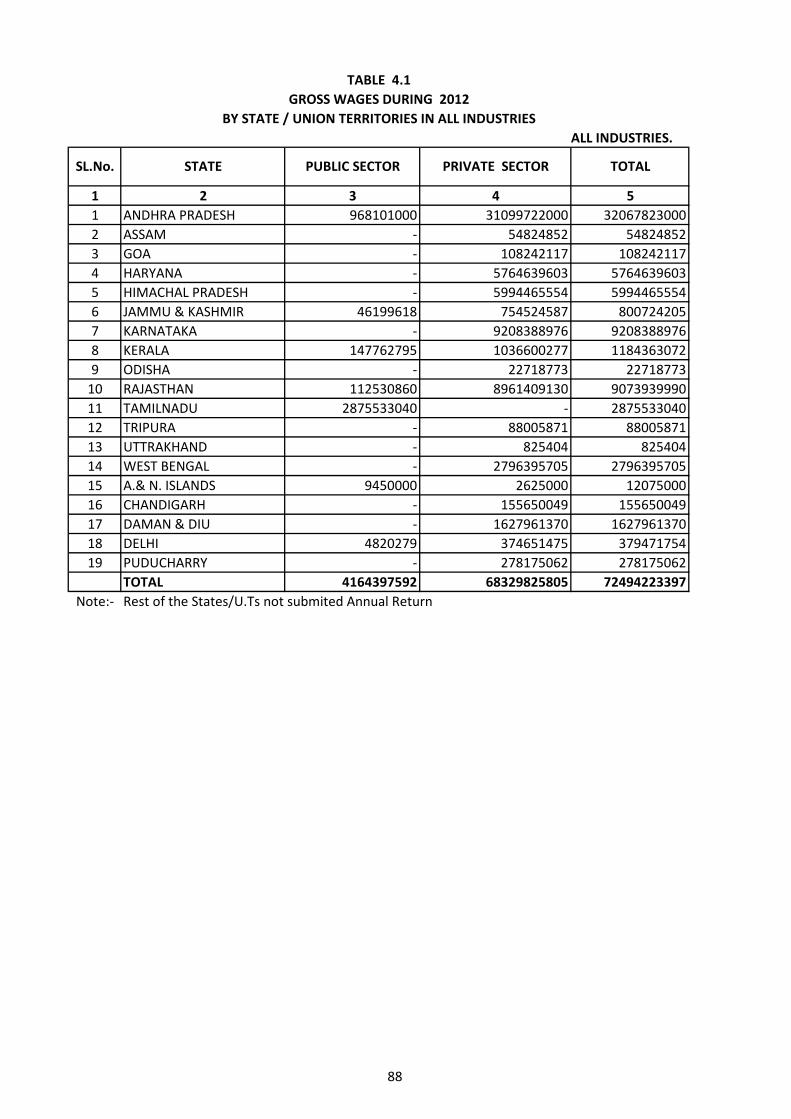
88
1 2 3 4 51 ANDHRA PRADESH 968101000 31099722000 320678230002 ASSAM - 54824852 548248523 GOA - 108242117 1082421174 HARYANA - 5764639603 57646396035 HIMACHAL PRADESH - 5994465554 59944655546 JAMMU & KASHMIR 46199618 754524587 8007242057 KARNATAKA - 9208388976 92083889768 KERALA 147762795 1036600277 11843630729 ODISHA - 22718773 22718773
10 RAJASTHAN 112530860 8961409130 907393999011 TAMILNADU 2875533040 - 287553304012 TRIPURA - 88005871 8800587113 UTTRAKHAND - 825404 82540414 WEST BENGAL - 2796395705 279639570515 A.& N. ISLANDS 9450000 2625000 1207500016 CHANDIGARH - 155650049 15565004917 DAMAN & DIU - 1627961370 162796137018 DELHI 4820279 374651475 37947175419 PUDUCHARRY - 278175062 278175062
TOTAL 4164397592 68329825805 72494223397Note:- Rest of the States/U.Ts not submited Annual Return
TABLE 4.1 GROSS WAGES DURING 2012
BY STATE / UNION TERRITORIES IN ALL INDUSTRIESALL INDUSTRIES.
SL.No. STATE PUBLIC SECTOR PRIVATE SECTOR TOTAL
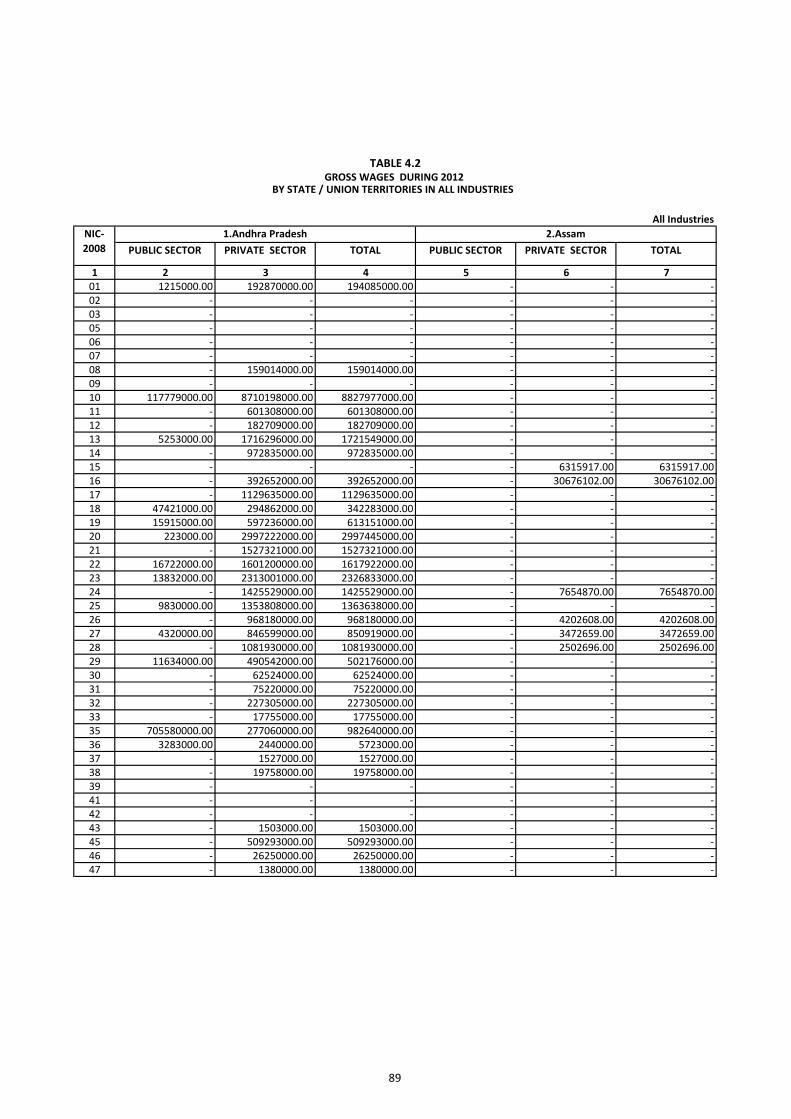
89
All Industries
PUBLIC SECTOR PRIVATE SECTOR TOTAL PUBLIC SECTOR PRIVATE SECTOR TOTAL
1 2 3 4 5 6 701 1215000.00 192870000.00 194085000.00 - - -02 - - - - - -03 - - - - - -05 - - - - - -06 - - - - - -07 - - - - - -08 - 159014000.00 159014000.00 - - -09 - - - - - -10 117779000.00 8710198000.00 8827977000.00 - - -11 - 601308000.00 601308000.00 - - -12 - 182709000.00 182709000.00 - - -13 5253000.00 1716296000.00 1721549000.00 - - -14 - 972835000.00 972835000.00 - - -15 - - - - 6315917.00 6315917.0016 - 392652000.00 392652000.00 - 30676102.00 30676102.0017 - 1129635000.00 1129635000.00 - - -18 47421000.00 294862000.00 342283000.00 - - -19 15915000.00 597236000.00 613151000.00 - - -20 223000.00 2997222000.00 2997445000.00 - - -21 - 1527321000.00 1527321000.00 - - -22 16722000.00 1601200000.00 1617922000.00 - - -23 13832000.00 2313001000.00 2326833000.00 - - -24 - 1425529000.00 1425529000.00 - 7654870.00 7654870.0025 9830000.00 1353808000.00 1363638000.00 - - -26 - 968180000.00 968180000.00 - 4202608.00 4202608.0027 4320000.00 846599000.00 850919000.00 - 3472659.00 3472659.0028 - 1081930000.00 1081930000.00 - 2502696.00 2502696.0029 11634000.00 490542000.00 502176000.00 - - -30 - 62524000.00 62524000.00 - - -31 - 75220000.00 75220000.00 - - -32 - 227305000.00 227305000.00 - - -33 - 17755000.00 17755000.00 - - -35 705580000.00 277060000.00 982640000.00 - - -36 3283000.00 2440000.00 5723000.00 - - -37 - 1527000.00 1527000.00 - - -38 - 19758000.00 19758000.00 - - -39 - - - - - -41 - - - - - -42 - - - - - -43 - 1503000.00 1503000.00 - - -45 - 509293000.00 509293000.00 - - -46 - 26250000.00 26250000.00 - - -47 - 1380000.00 1380000.00 - - -
TABLE 4.2GROSS WAGES DURING 2012
BY STATE / UNION TERRITORIES IN ALL INDUSTRIES
NIC- 2008
1.Andhra Pradesh 2.Assam
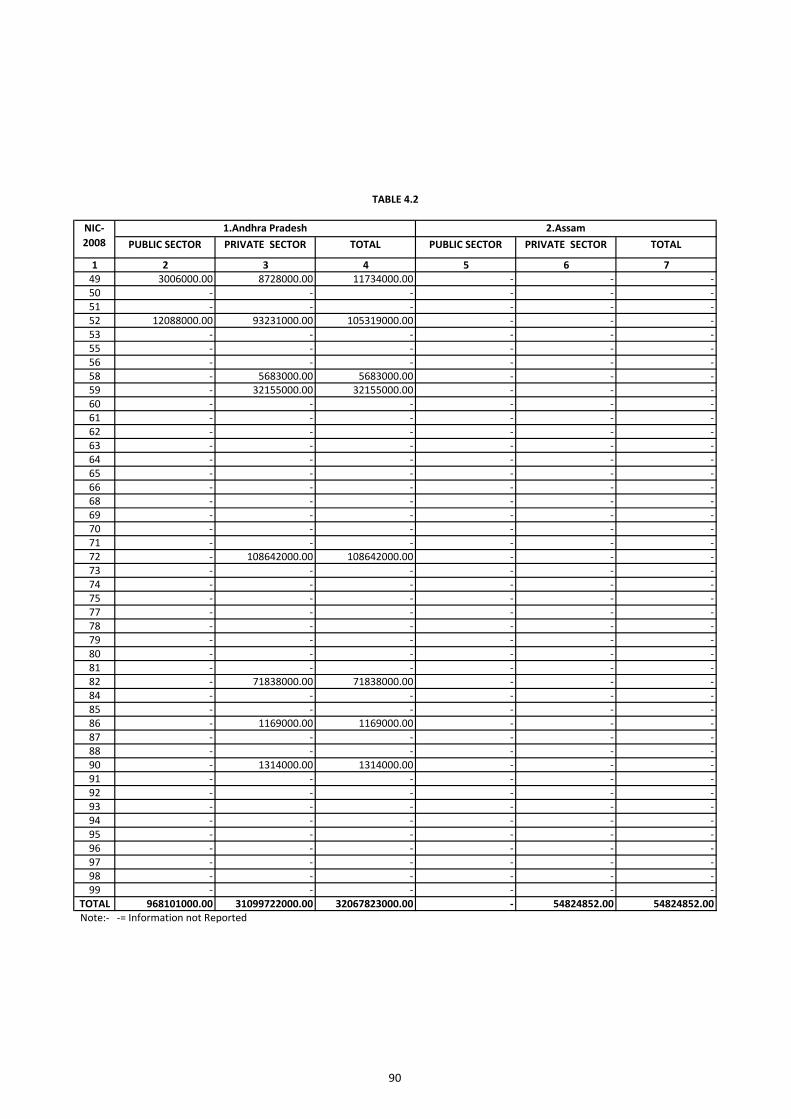
90
PUBLIC SECTOR PRIVATE SECTOR TOTAL PUBLIC SECTOR PRIVATE SECTOR TOTAL
1 2 3 4 5 6 749 3006000.00 8728000.00 11734000.00 - - -50 - - - - - -51 - - - - - -52 12088000.00 93231000.00 105319000.00 - - -53 - - - - - -55 - - - - - -56 - - - - - -58 - 5683000.00 5683000.00 - - -59 - 32155000.00 32155000.00 - - -60 - - - - - -61 - - - - - -62 - - - - - -63 - - - - - -64 - - - - - -65 - - - - - -66 - - - - - -68 - - - - - -69 - - - - - -70 - - - - - -71 - - - - - -72 - 108642000.00 108642000.00 - - -73 - - - - - -74 - - - - - -75 - - - - - -77 - - - - - -78 - - - - - -79 - - - - - -80 - - - - - -81 - - - - - -82 - 71838000.00 71838000.00 - - -84 - - - - - -85 - - - - - -86 - 1169000.00 1169000.00 - - -87 - - - - - -88 - - - - - -90 - 1314000.00 1314000.00 - - -91 - - - - - -92 - - - - - -93 - - - - - -94 - - - - - -95 - - - - - -96 - - - - - -97 - - - - - -98 - - - - - -99 - - - - - -
TOTAL 968101000.00 31099722000.00 32067823000.00 - 54824852.00 54824852.00Note:- -= Information not Reported
TABLE 4.2
NIC- 2008
1.Andhra Pradesh 2.Assam
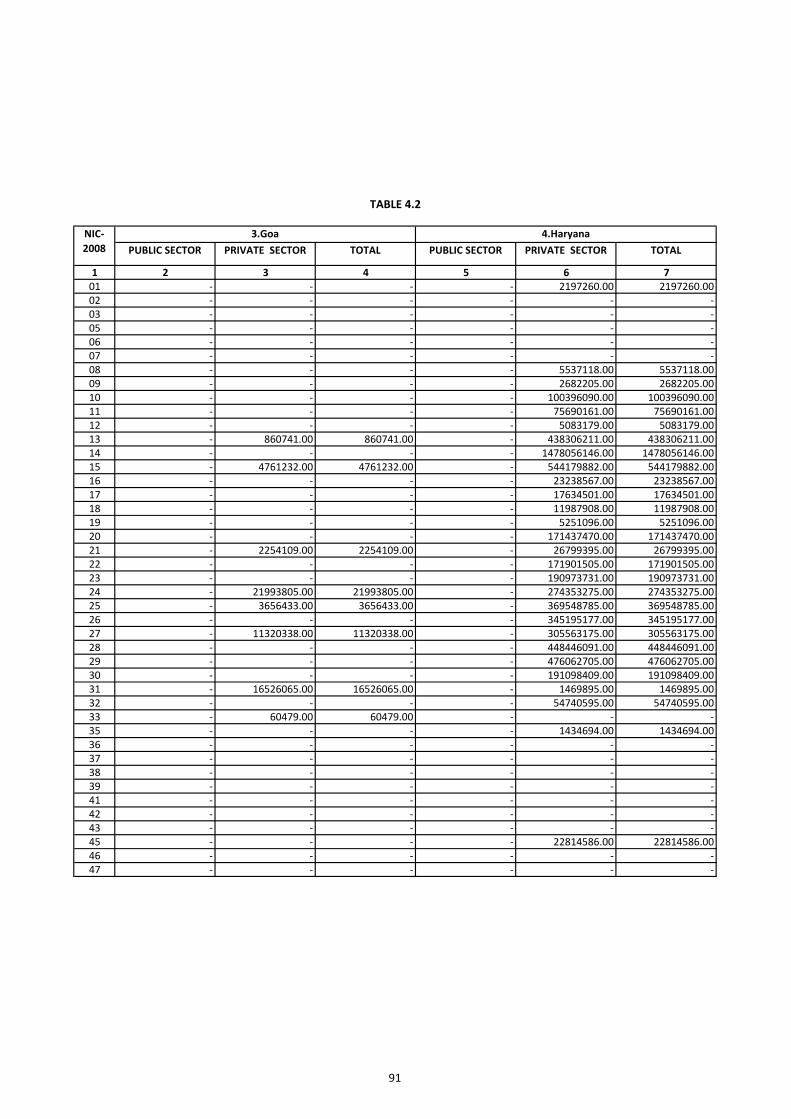
91
PUBLIC SECTOR PRIVATE SECTOR TOTAL PUBLIC SECTOR PRIVATE SECTOR TOTAL
1 2 3 4 5 6 701 - - - - 2197260.00 2197260.0002 - - - - - -03 - - - - - -05 - - - - - -06 - - - - - -07 - - - - - -08 - - - - 5537118.00 5537118.0009 - - - - 2682205.00 2682205.0010 - - - - 100396090.00 100396090.0011 - - - - 75690161.00 75690161.0012 - - - - 5083179.00 5083179.0013 - 860741.00 860741.00 - 438306211.00 438306211.0014 - - - - 1478056146.00 1478056146.0015 - 4761232.00 4761232.00 - 544179882.00 544179882.0016 - - - - 23238567.00 23238567.0017 - - - - 17634501.00 17634501.0018 - - - - 11987908.00 11987908.0019 - - - - 5251096.00 5251096.0020 - - - - 171437470.00 171437470.0021 - 2254109.00 2254109.00 - 26799395.00 26799395.0022 - - - - 171901505.00 171901505.0023 - - - - 190973731.00 190973731.0024 - 21993805.00 21993805.00 - 274353275.00 274353275.0025 - 3656433.00 3656433.00 - 369548785.00 369548785.0026 - - - - 345195177.00 345195177.0027 - 11320338.00 11320338.00 - 305563175.00 305563175.0028 - - - - 448446091.00 448446091.0029 - - - - 476062705.00 476062705.0030 - - - - 191098409.00 191098409.0031 - 16526065.00 16526065.00 - 1469895.00 1469895.0032 - - - - 54740595.00 54740595.0033 - 60479.00 60479.00 - - -35 - - - - 1434694.00 1434694.0036 - - - - - -37 - - - - - -38 - - - - - -39 - - - - - -41 - - - - - -42 - - - - - -43 - - - - - -45 - - - - 22814586.00 22814586.0046 - - - - - -47 - - - - - -
3.GoaNIC- 2008
4.Haryana
TABLE 4.2
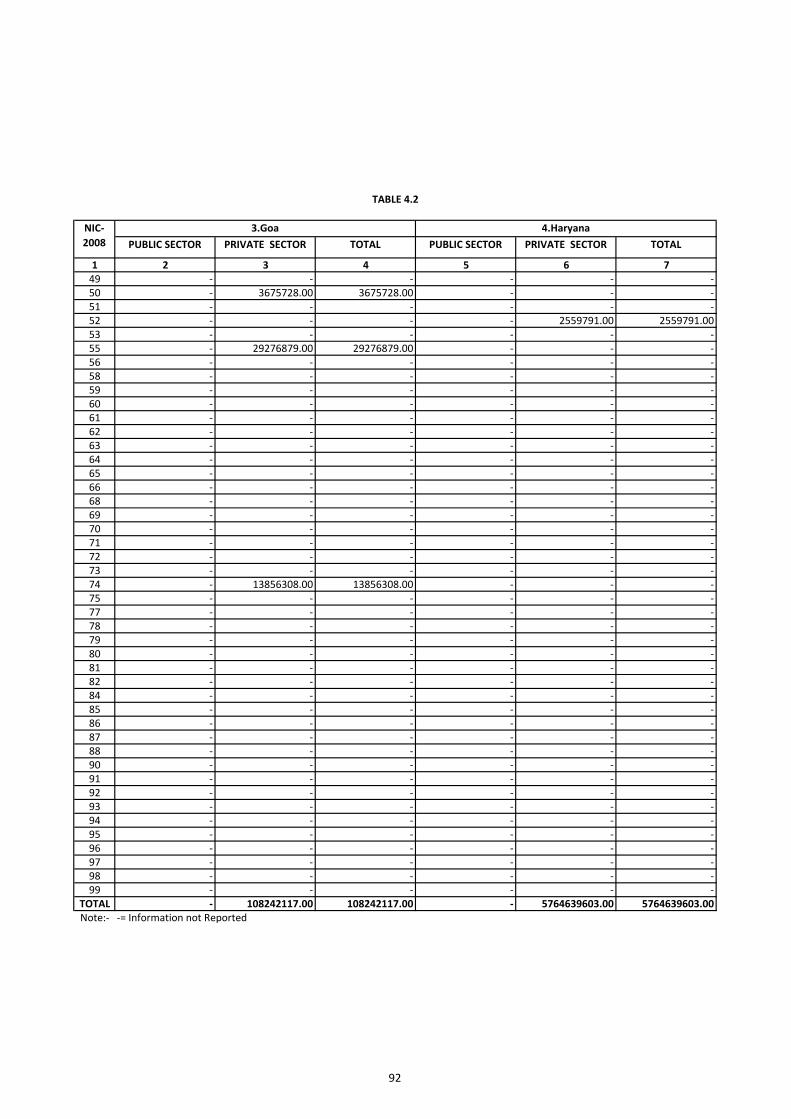
92
PUBLIC SECTOR PRIVATE SECTOR TOTAL PUBLIC SECTOR PRIVATE SECTOR TOTAL
1 2 3 4 5 6 749 - - - - - -50 - 3675728.00 3675728.00 - - -51 - - - - - -52 - - - - 2559791.00 2559791.0053 - - - - - -55 - 29276879.00 29276879.00 - - -56 - - - - - -58 - - - - - -59 - - - - - -60 - - - - - -61 - - - - - -62 - - - - - -63 - - - - - -64 - - - - - -65 - - - - - -66 - - - - - -68 - - - - - -69 - - - - - -70 - - - - - -71 - - - - - -72 - - - - - -73 - - - - - -74 - 13856308.00 13856308.00 - - -75 - - - - - -77 - - - - - -78 - - - - - -79 - - - - - -80 - - - - - -81 - - - - - -82 - - - - - -84 - - - - - -85 - - - - - -86 - - - - - -87 - - - - - -88 - - - - - -90 - - - - - -91 - - - - - -92 - - - - - -93 - - - - - -94 - - - - - -95 - - - - - -96 - - - - - -97 - - - - - -98 - - - - - -99 - - - - - -
TOTAL - 108242117.00 108242117.00 - 5764639603.00 5764639603.00Note:- -= Information not Reported
TABLE 4.2
3.GoaNIC- 2008
4.Haryana
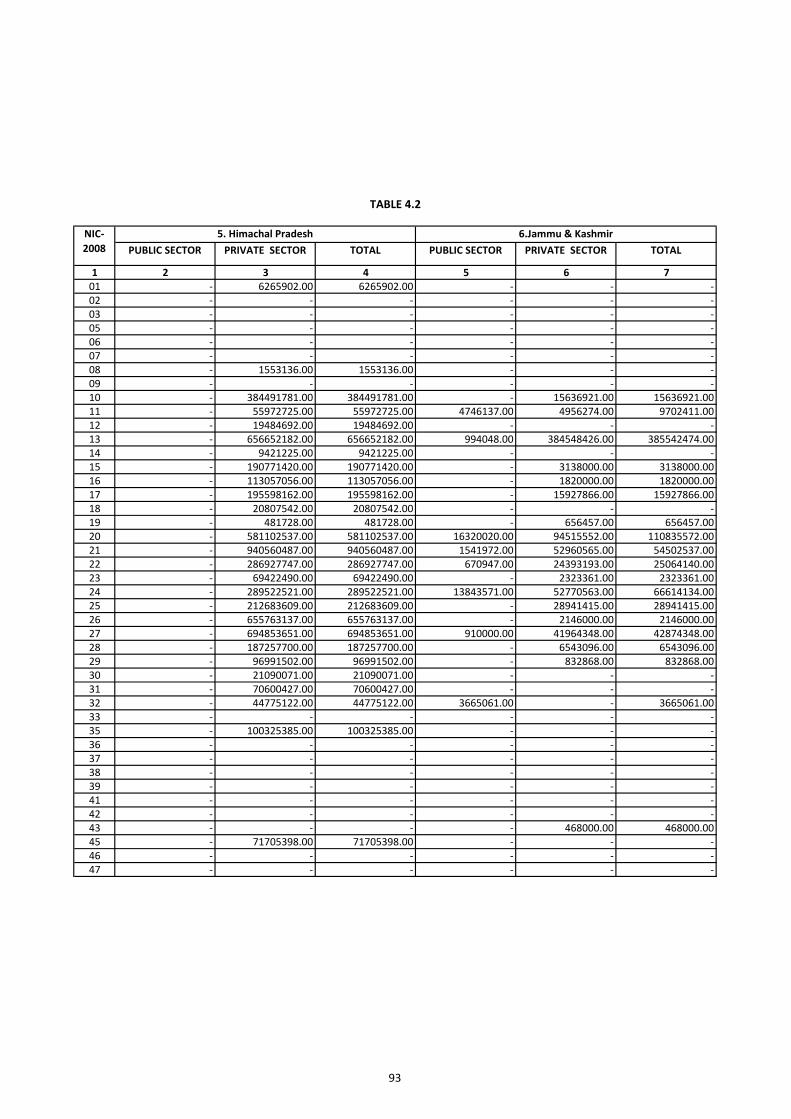
93
PUBLIC SECTOR PRIVATE SECTOR TOTAL PUBLIC SECTOR PRIVATE SECTOR TOTAL
1 2 3 4 5 6 701 - 6265902.00 6265902.00 - - -02 - - - - - -03 - - - - - -05 - - - - - -06 - - - - - -07 - - - - - -08 - 1553136.00 1553136.00 - - -09 - - - - - -10 - 384491781.00 384491781.00 - 15636921.00 15636921.0011 - 55972725.00 55972725.00 4746137.00 4956274.00 9702411.0012 - 19484692.00 19484692.00 - - -13 - 656652182.00 656652182.00 994048.00 384548426.00 385542474.0014 - 9421225.00 9421225.00 - - -15 - 190771420.00 190771420.00 - 3138000.00 3138000.0016 - 113057056.00 113057056.00 - 1820000.00 1820000.0017 - 195598162.00 195598162.00 - 15927866.00 15927866.0018 - 20807542.00 20807542.00 - - -19 - 481728.00 481728.00 - 656457.00 656457.0020 - 581102537.00 581102537.00 16320020.00 94515552.00 110835572.0021 - 940560487.00 940560487.00 1541972.00 52960565.00 54502537.0022 - 286927747.00 286927747.00 670947.00 24393193.00 25064140.0023 - 69422490.00 69422490.00 - 2323361.00 2323361.0024 - 289522521.00 289522521.00 13843571.00 52770563.00 66614134.0025 - 212683609.00 212683609.00 - 28941415.00 28941415.0026 - 655763137.00 655763137.00 - 2146000.00 2146000.0027 - 694853651.00 694853651.00 910000.00 41964348.00 42874348.0028 - 187257700.00 187257700.00 - 6543096.00 6543096.0029 - 96991502.00 96991502.00 - 832868.00 832868.0030 - 21090071.00 21090071.00 - - -31 - 70600427.00 70600427.00 - - -32 - 44775122.00 44775122.00 3665061.00 - 3665061.0033 - - - - - -35 - 100325385.00 100325385.00 - - -36 - - - - - -37 - - - - - -38 - - - - - -39 - - - - - -41 - - - - - -42 - - - - - -43 - - - - 468000.00 468000.0045 - 71705398.00 71705398.00 - - -46 - - - - - -47 - - - - - -
5. Himachal Pradesh 6.Jammu & KashmirNIC- 2008
TABLE 4.2

94
PUBLIC SECTOR PRIVATE SECTOR TOTAL PUBLIC SECTOR PRIVATE SECTOR TOTAL
1 2 3 4 5 6 749 - - - - - -50 - - - - - -51 - - - - - -52 - - - 3507862.00 10850237.00 14358099.0053 - - - - - -55 - 7733968.00 7733968.00 - - -56 - - - - - -58 - - - - - -59 - - - - - -60 - - - - - -61 - - - - - -62 - - - - 2458471.00 2458471.0063 - - - - - -64 - - - - - -65 - 224779.00 224779.00 - - -66 - - - - - -68 - - - - - -69 - - - - - -70 - - - - - -71 - - - - - -72 - - - - - -73 - - - - - -74 - - - - - -75 - - - - - -77 - - - - - -78 - - - - - -79 - - - - - -80 - - - - - -81 - - - - - -82 - 8367472.00 8367472.00 - 6672973.00 6672973.0084 - - - - - -85 - - - - - -86 - - - - - -87 - - - - - -88 - - - - - -90 - - - - - -91 - - - - - -92 - - - - - -93 - - - - - -94 - - - - - -95 - - - - - -96 - - - - - -97 - - - - - -98 - - - - - -99 - - - - - -
TOTAL - 5994465554.00 5994465554.00 46199618.00 754524587.00 800724205.00Note:- -= Information not Reported
TABLE 4.2
NIC- 2008
6.Jammu & Kashmir5. Himachal Pradesh
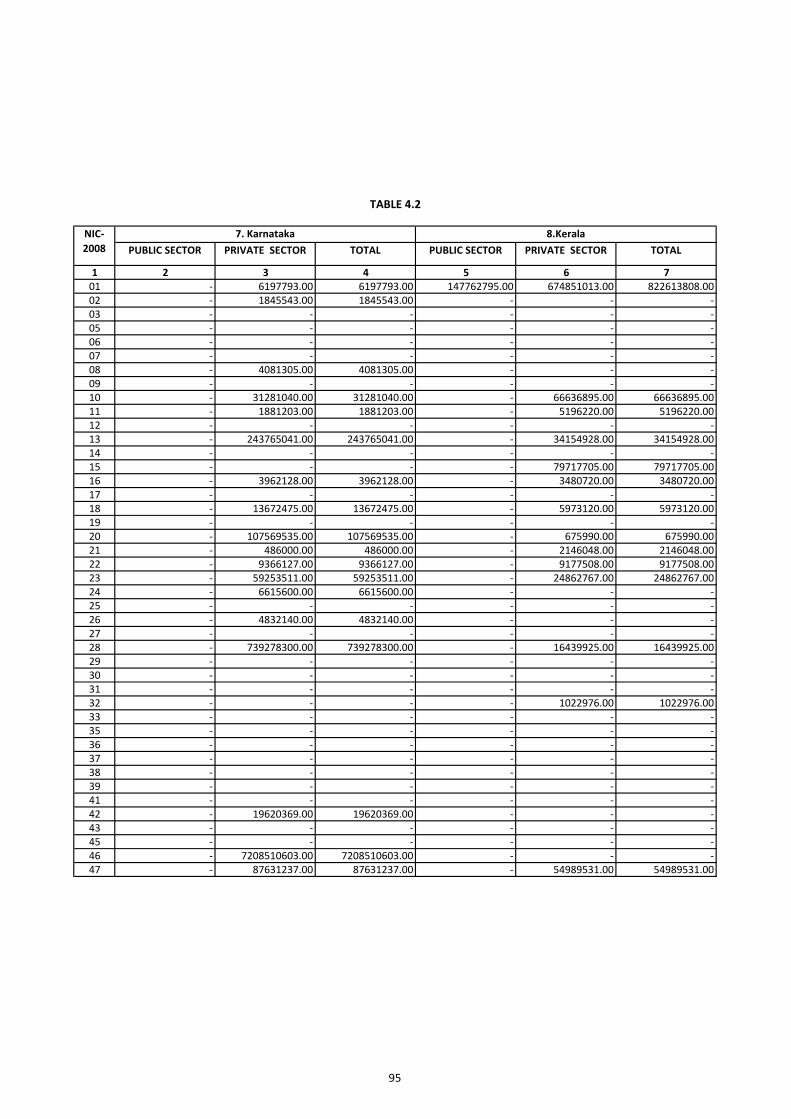
95
PUBLIC SECTOR PRIVATE SECTOR TOTAL PUBLIC SECTOR PRIVATE SECTOR TOTAL
1 2 3 4 5 6 701 - 6197793.00 6197793.00 147762795.00 674851013.00 822613808.0002 - 1845543.00 1845543.00 - - -03 - - - - - -05 - - - - - -06 - - - - - -07 - - - - - -08 - 4081305.00 4081305.00 - - -09 - - - - - -10 - 31281040.00 31281040.00 - 66636895.00 66636895.0011 - 1881203.00 1881203.00 - 5196220.00 5196220.0012 - - - - - -13 - 243765041.00 243765041.00 - 34154928.00 34154928.0014 - - - - - -15 - - - - 79717705.00 79717705.0016 - 3962128.00 3962128.00 - 3480720.00 3480720.0017 - - - - - -18 - 13672475.00 13672475.00 - 5973120.00 5973120.0019 - - - - - -20 - 107569535.00 107569535.00 - 675990.00 675990.0021 - 486000.00 486000.00 - 2146048.00 2146048.0022 - 9366127.00 9366127.00 - 9177508.00 9177508.0023 - 59253511.00 59253511.00 - 24862767.00 24862767.0024 - 6615600.00 6615600.00 - - -25 - - - - - -26 - 4832140.00 4832140.00 - - -27 - - - - - -28 - 739278300.00 739278300.00 - 16439925.00 16439925.0029 - - - - - -30 - - - - - -31 - - - - - -32 - - - - 1022976.00 1022976.0033 - - - - - -35 - - - - - -36 - - - - - -37 - - - - - -38 - - - - - -39 - - - - - -41 - - - - - -42 - 19620369.00 19620369.00 - - -43 - - - - - -45 - - - - - -46 - 7208510603.00 7208510603.00 - - -47 - 87631237.00 87631237.00 - 54989531.00 54989531.00
7. Karnataka 8.Kerala
TABLE 4.2
NIC- 2008
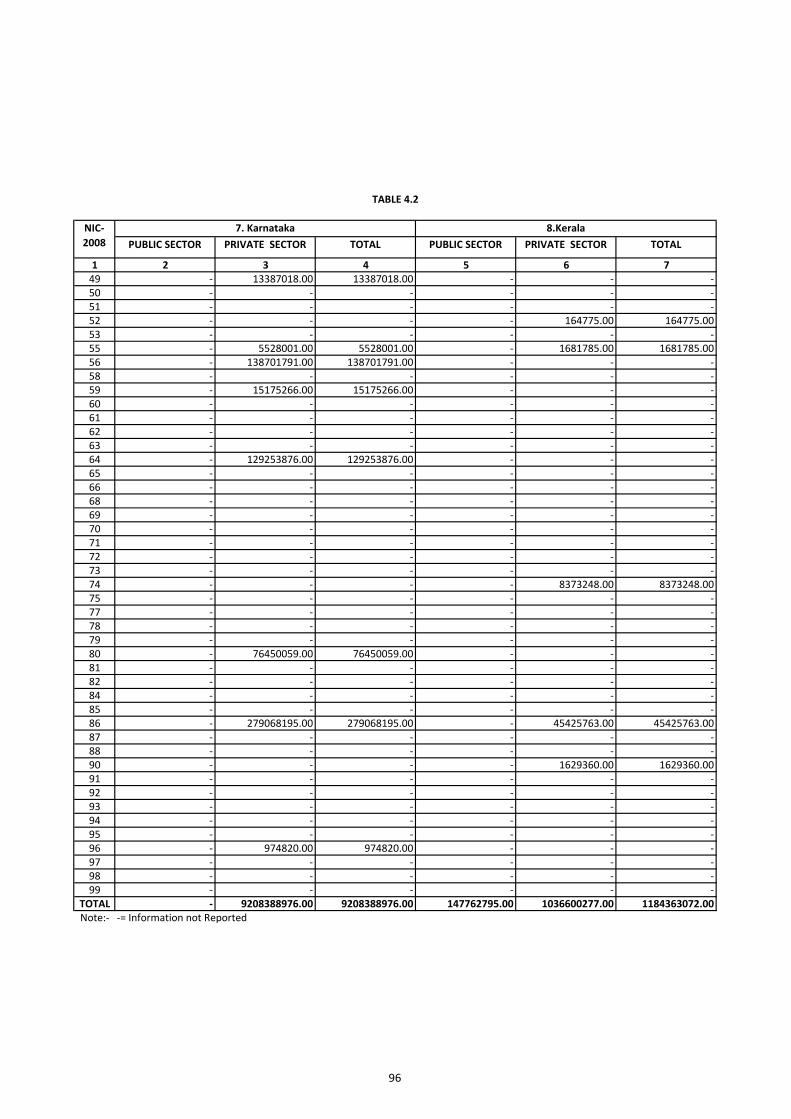
96
PUBLIC SECTOR PRIVATE SECTOR TOTAL PUBLIC SECTOR PRIVATE SECTOR TOTAL
1 2 3 4 5 6 749 - 13387018.00 13387018.00 - - -50 - - - - - -51 - - - - - -52 - - - - 164775.00 164775.0053 - - - - - -55 - 5528001.00 5528001.00 - 1681785.00 1681785.0056 - 138701791.00 138701791.00 - - -58 - - - - - -59 - 15175266.00 15175266.00 - - -60 - - - - - -61 - - - - - -62 - - - - - -63 - - - - - -64 - 129253876.00 129253876.00 - - -65 - - - - - -66 - - - - - -68 - - - - - -69 - - - - - -70 - - - - - -71 - - - - - -72 - - - - - -73 - - - - - -74 - - - - 8373248.00 8373248.0075 - - - - - -77 - - - - - -78 - - - - - -79 - - - - - -80 - 76450059.00 76450059.00 - - -81 - - - - - -82 - - - - - -84 - - - - - -85 - - - - - -86 - 279068195.00 279068195.00 - 45425763.00 45425763.0087 - - - - - -88 - - - - - -90 - - - - 1629360.00 1629360.0091 - - - - - -92 - - - - - -93 - - - - - -94 - - - - - -95 - - - - - -96 - 974820.00 974820.00 - - -97 - - - - - -98 - - - - - -99 - - - - - -
TOTAL - 9208388976.00 9208388976.00 147762795.00 1036600277.00 1184363072.00Note:- -= Information not Reported
TABLE 4.2
7. KarnatakaNIC- 2008
8.Kerala
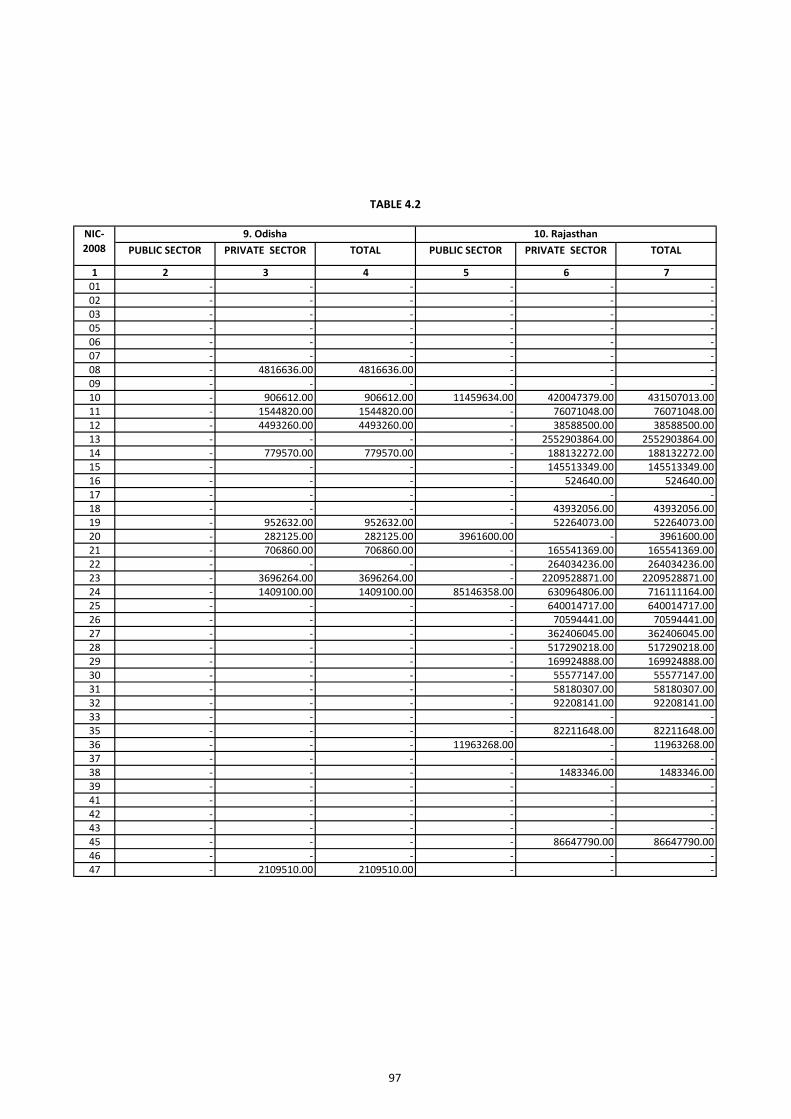
97
PUBLIC SECTOR PRIVATE SECTOR TOTAL PUBLIC SECTOR PRIVATE SECTOR TOTAL
1 2 3 4 5 6 701 - - - - - -02 - - - - - -03 - - - - - -05 - - - - - -06 - - - - - -07 - - - - - -08 - 4816636.00 4816636.00 - - -09 - - - - - -10 - 906612.00 906612.00 11459634.00 420047379.00 431507013.0011 - 1544820.00 1544820.00 - 76071048.00 76071048.0012 - 4493260.00 4493260.00 - 38588500.00 38588500.0013 - - - - 2552903864.00 2552903864.0014 - 779570.00 779570.00 - 188132272.00 188132272.0015 - - - - 145513349.00 145513349.0016 - - - - 524640.00 524640.0017 - - - - - -18 - - - - 43932056.00 43932056.0019 - 952632.00 952632.00 - 52264073.00 52264073.0020 - 282125.00 282125.00 3961600.00 - 3961600.0021 - 706860.00 706860.00 - 165541369.00 165541369.0022 - - - - 264034236.00 264034236.0023 - 3696264.00 3696264.00 - 2209528871.00 2209528871.0024 - 1409100.00 1409100.00 85146358.00 630964806.00 716111164.0025 - - - - 640014717.00 640014717.0026 - - - - 70594441.00 70594441.0027 - - - - 362406045.00 362406045.0028 - - - - 517290218.00 517290218.0029 - - - - 169924888.00 169924888.0030 - - - - 55577147.00 55577147.0031 - - - - 58180307.00 58180307.0032 - - - - 92208141.00 92208141.0033 - - - - - -35 - - - - 82211648.00 82211648.0036 - - - 11963268.00 - 11963268.0037 - - - - - -38 - - - - 1483346.00 1483346.0039 - - - - - -41 - - - - - -42 - - - - - -43 - - - - - -45 - - - - 86647790.00 86647790.0046 - - - - - -47 - 2109510.00 2109510.00 - - -
9. Odisha
TABLE 4.2
NIC- 2008
10. Rajasthan
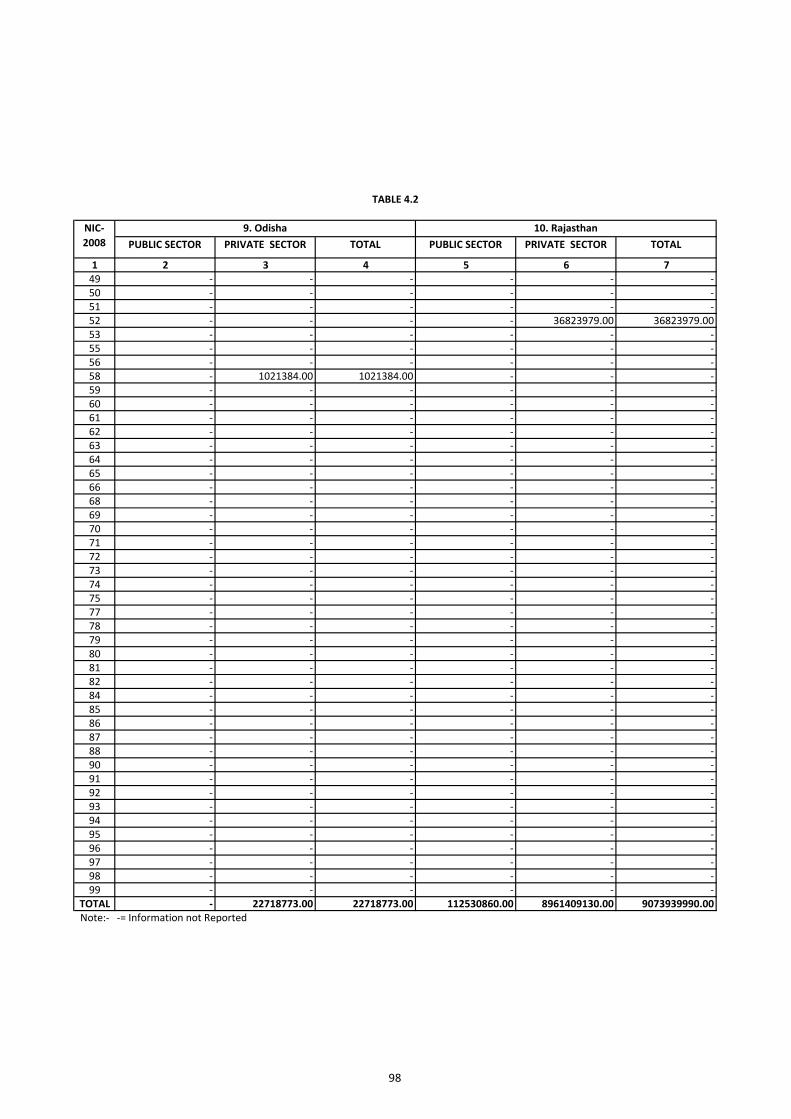
98
PUBLIC SECTOR PRIVATE SECTOR TOTAL PUBLIC SECTOR PRIVATE SECTOR TOTAL
1 2 3 4 5 6 749 - - - - - -50 - - - - - -51 - - - - - -52 - - - - 36823979.00 36823979.0053 - - - - - -55 - - - - - -56 - - - - - -58 - 1021384.00 1021384.00 - - -59 - - - - - -60 - - - - - -61 - - - - - -62 - - - - - -63 - - - - - -64 - - - - - -65 - - - - - -66 - - - - - -68 - - - - - -69 - - - - - -70 - - - - - -71 - - - - - -72 - - - - - -73 - - - - - -74 - - - - - -75 - - - - - -77 - - - - - -78 - - - - - -79 - - - - - -80 - - - - - -81 - - - - - -82 - - - - - -84 - - - - - -85 - - - - - -86 - - - - - -87 - - - - - -88 - - - - - -90 - - - - - -91 - - - - - -92 - - - - - -93 - - - - - -94 - - - - - -95 - - - - - -96 - - - - - -97 - - - - - -98 - - - - - -99 - - - - - -
TOTAL - 22718773.00 22718773.00 112530860.00 8961409130.00 9073939990.00Note:- -= Information not Reported
TABLE 4.2
10. Rajasthan9. OdishaNIC- 2008
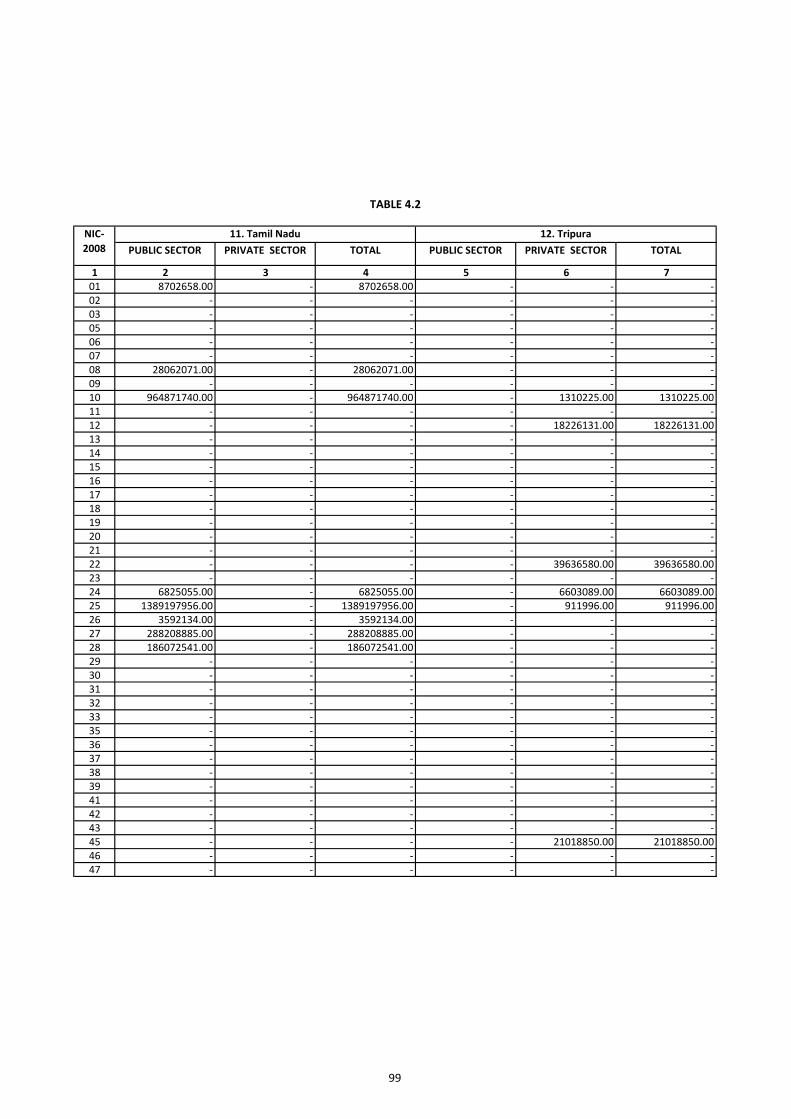
99
PUBLIC SECTOR PRIVATE SECTOR TOTAL PUBLIC SECTOR PRIVATE SECTOR TOTAL
1 2 3 4 5 6 701 8702658.00 - 8702658.00 - - -02 - - - - - -03 - - - - - -05 - - - - - -06 - - - - - -07 - - - - - -08 28062071.00 - 28062071.00 - - -09 - - - - - -10 964871740.00 - 964871740.00 - 1310225.00 1310225.0011 - - - - - -12 - - - - 18226131.00 18226131.0013 - - - - - -14 - - - - - -15 - - - - - -16 - - - - - -17 - - - - - -18 - - - - - -19 - - - - - -20 - - - - - -21 - - - - - -22 - - - - 39636580.00 39636580.0023 - - - - - -24 6825055.00 - 6825055.00 - 6603089.00 6603089.0025 1389197956.00 - 1389197956.00 - 911996.00 911996.0026 3592134.00 - 3592134.00 - - -27 288208885.00 - 288208885.00 - - -28 186072541.00 - 186072541.00 - - -29 - - - - - -30 - - - - - -31 - - - - - -32 - - - - - -33 - - - - - -35 - - - - - -36 - - - - - -37 - - - - - -38 - - - - - -39 - - - - - -41 - - - - - -42 - - - - - -43 - - - - - -45 - - - - 21018850.00 21018850.0046 - - - - - -47 - - - - - -
NIC- 2008
TABLE 4.2
12. Tripura11. Tamil Nadu
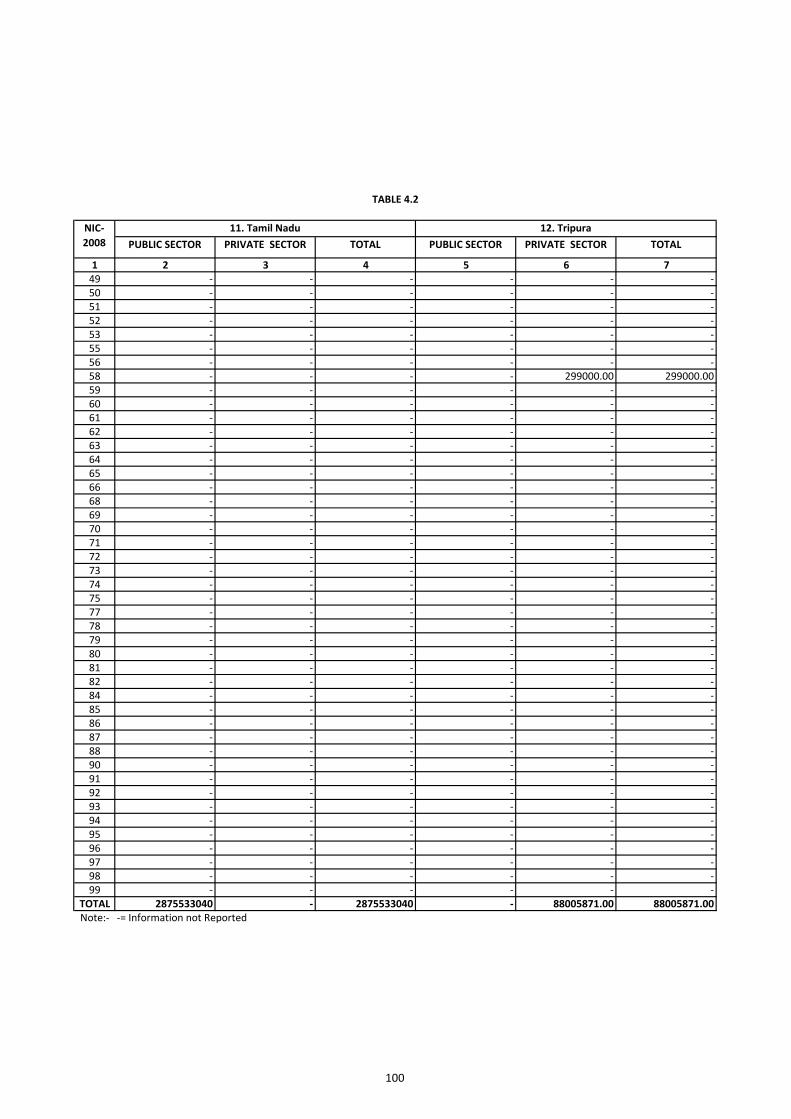
100
PUBLIC SECTOR PRIVATE SECTOR TOTAL PUBLIC SECTOR PRIVATE SECTOR TOTAL
1 2 3 4 5 6 749 - - - - - -50 - - - - - -51 - - - - - -52 - - - - - -53 - - - - - -55 - - - - - -56 - - - - - -58 - - - - 299000.00 299000.0059 - - - - - -60 - - - - - -61 - - - - - -62 - - - - - -63 - - - - - -64 - - - - - -65 - - - - - -66 - - - - - -68 - - - - - -69 - - - - - -70 - - - - - -71 - - - - - -72 - - - - - -73 - - - - - -74 - - - - - -75 - - - - - -77 - - - - - -78 - - - - - -79 - - - - - -80 - - - - - -81 - - - - - -82 - - - - - -84 - - - - - -85 - - - - - -86 - - - - - -87 - - - - - -88 - - - - - -90 - - - - - -91 - - - - - -92 - - - - - -93 - - - - - -94 - - - - - -95 - - - - - -96 - - - - - -97 - - - - - -98 - - - - - -99 - - - - - -
TOTAL 2875533040 - 2875533040 - 88005871.00 88005871.00Note:- -= Information not Reported
NIC- 2008
11. Tamil Nadu
TABLE 4.2
12. Tripura
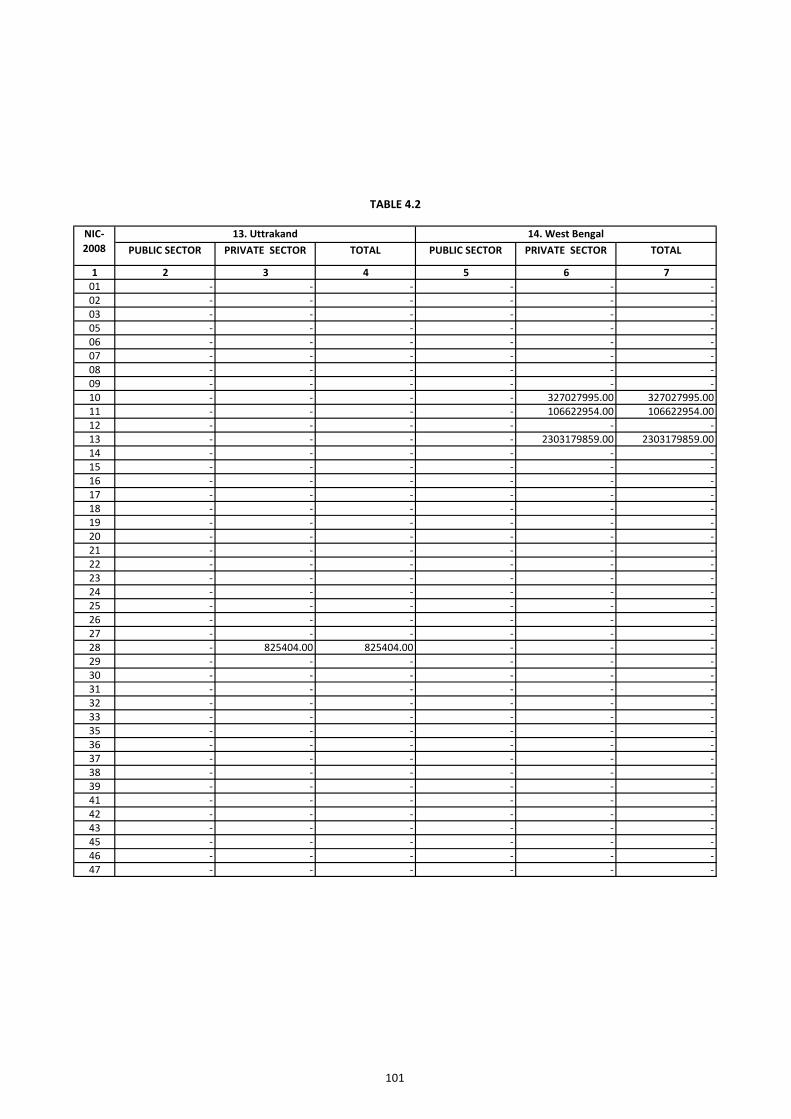
101
PUBLIC SECTOR PRIVATE SECTOR TOTAL PUBLIC SECTOR PRIVATE SECTOR TOTAL
1 2 3 4 5 6 701 - - - - - -02 - - - - - -03 - - - - - -05 - - - - - -06 - - - - - -07 - - - - - -08 - - - - - -09 - - - - - -10 - - - - 327027995.00 327027995.0011 - - - - 106622954.00 106622954.0012 - - - - - -13 - - - - 2303179859.00 2303179859.0014 - - - - - -15 - - - - - -16 - - - - - -17 - - - - - -18 - - - - - -19 - - - - - -20 - - - - - -21 - - - - - -22 - - - - - -23 - - - - - -24 - - - - - -25 - - - - - -26 - - - - - -27 - - - - - -28 - 825404.00 825404.00 - - -29 - - - - - -30 - - - - - -31 - - - - - -32 - - - - - -33 - - - - - -35 - - - - - -36 - - - - - -37 - - - - - -38 - - - - - -39 - - - - - -41 - - - - - -42 - - - - - -43 - - - - - -45 - - - - - -46 - - - - - -47 - - - - - -
TABLE 4.2
14. West Bengal NIC- 2008
13. Uttrakand
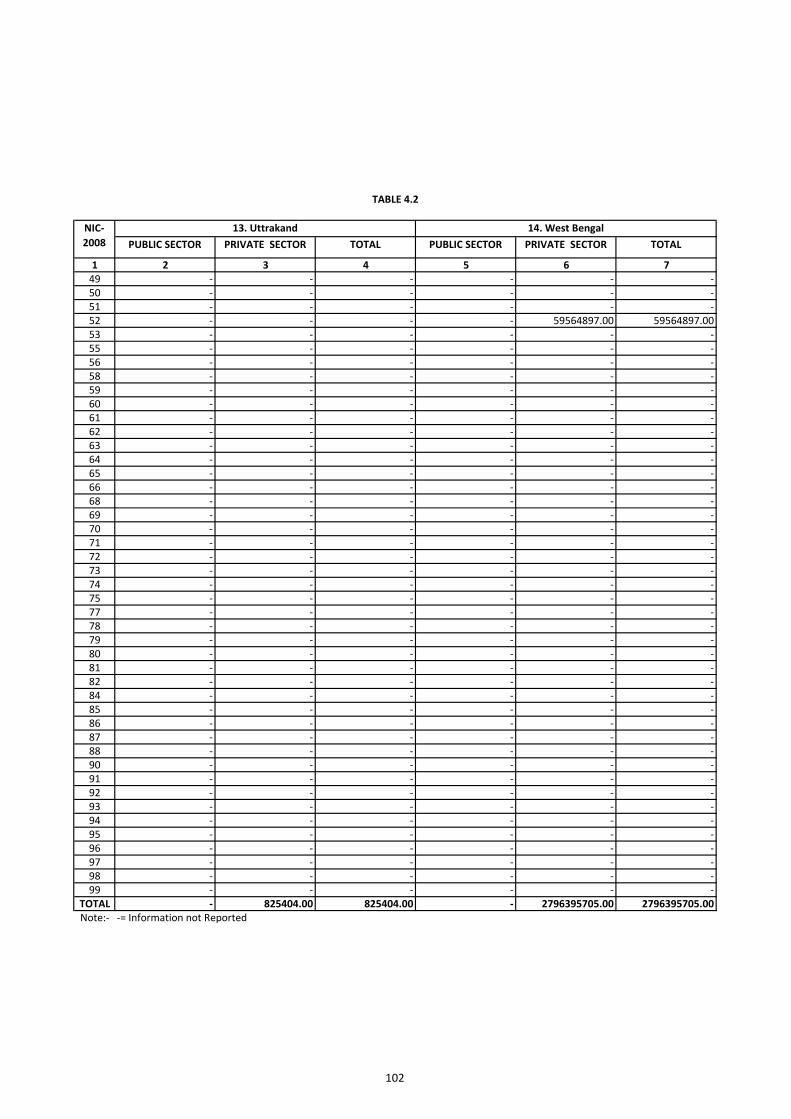
102
PUBLIC SECTOR PRIVATE SECTOR TOTAL PUBLIC SECTOR PRIVATE SECTOR TOTAL
1 2 3 4 5 6 749 - - - - - -50 - - - - - -51 - - - - - -52 - - - - 59564897.00 59564897.0053 - - - - - -55 - - - - - -56 - - - - - -58 - - - - - -59 - - - - - -60 - - - - - -61 - - - - - -62 - - - - - -63 - - - - - -64 - - - - - -65 - - - - - -66 - - - - - -68 - - - - - -69 - - - - - -70 - - - - - -71 - - - - - -72 - - - - - -73 - - - - - -74 - - - - - -75 - - - - - -77 - - - - - -78 - - - - - -79 - - - - - -80 - - - - - -81 - - - - - -82 - - - - - -84 - - - - - -85 - - - - - -86 - - - - - -87 - - - - - -88 - - - - - -90 - - - - - -91 - - - - - -92 - - - - - -93 - - - - - -94 - - - - - -95 - - - - - -96 - - - - - -97 - - - - - -98 - - - - - -99 - - - - - -
TOTAL - 825404.00 825404.00 - 2796395705.00 2796395705.00Note:- -= Information not Reported
TABLE 4.2
13. UttrakandNIC- 2008
14. West Bengal
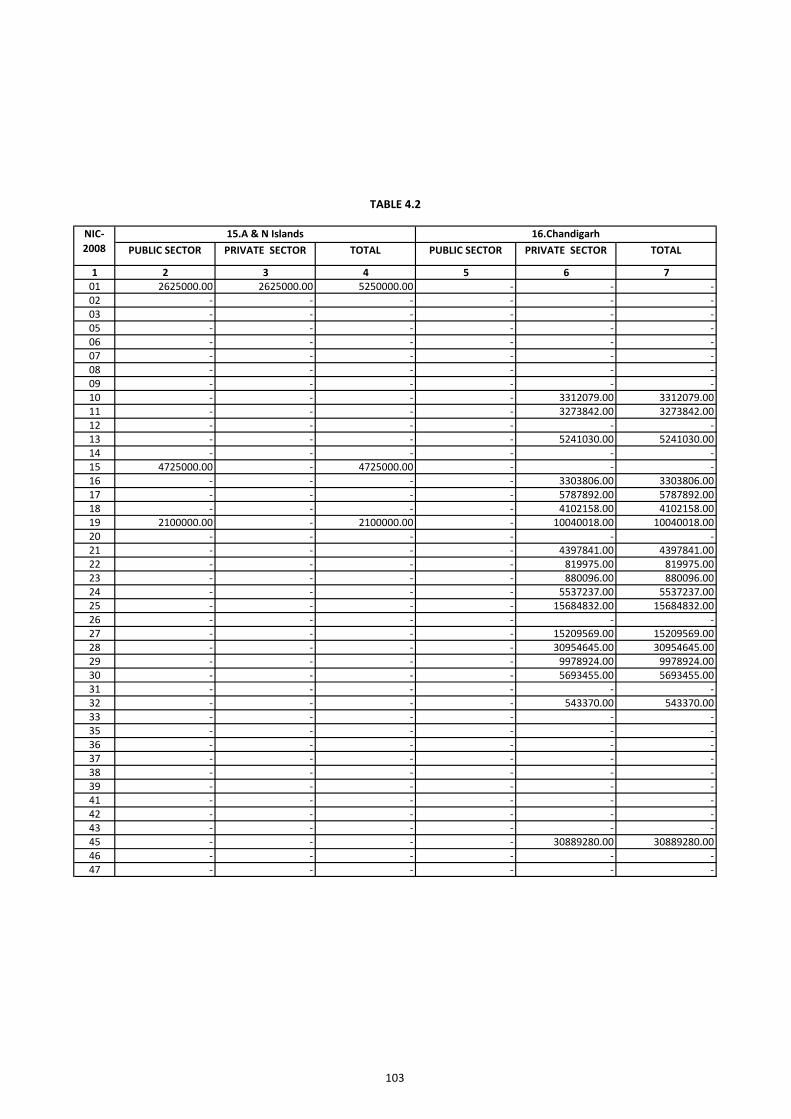
103
PUBLIC SECTOR PRIVATE SECTOR TOTAL PUBLIC SECTOR PRIVATE SECTOR TOTAL
1 2 3 4 5 6 701 2625000.00 2625000.00 5250000.00 - - -02 - - - - - -03 - - - - - -05 - - - - - -06 - - - - - -07 - - - - - -08 - - - - - -09 - - - - - -10 - - - - 3312079.00 3312079.0011 - - - - 3273842.00 3273842.0012 - - - - - -13 - - - - 5241030.00 5241030.0014 - - - - - -15 4725000.00 - 4725000.00 - - -16 - - - - 3303806.00 3303806.0017 - - - - 5787892.00 5787892.0018 - - - - 4102158.00 4102158.0019 2100000.00 - 2100000.00 - 10040018.00 10040018.0020 - - - - - -21 - - - - 4397841.00 4397841.0022 - - - - 819975.00 819975.0023 - - - - 880096.00 880096.0024 - - - - 5537237.00 5537237.0025 - - - - 15684832.00 15684832.0026 - - - - - -27 - - - - 15209569.00 15209569.0028 - - - - 30954645.00 30954645.0029 - - - - 9978924.00 9978924.0030 - - - - 5693455.00 5693455.0031 - - - - - -32 - - - - 543370.00 543370.0033 - - - - - -35 - - - - - -36 - - - - - -37 - - - - - -38 - - - - - -39 - - - - - -41 - - - - - -42 - - - - - -43 - - - - - -45 - - - - 30889280.00 30889280.0046 - - - - - -47 - - - - - -
16.Chandigarh15.A & N Islands NIC- 2008
TABLE 4.2
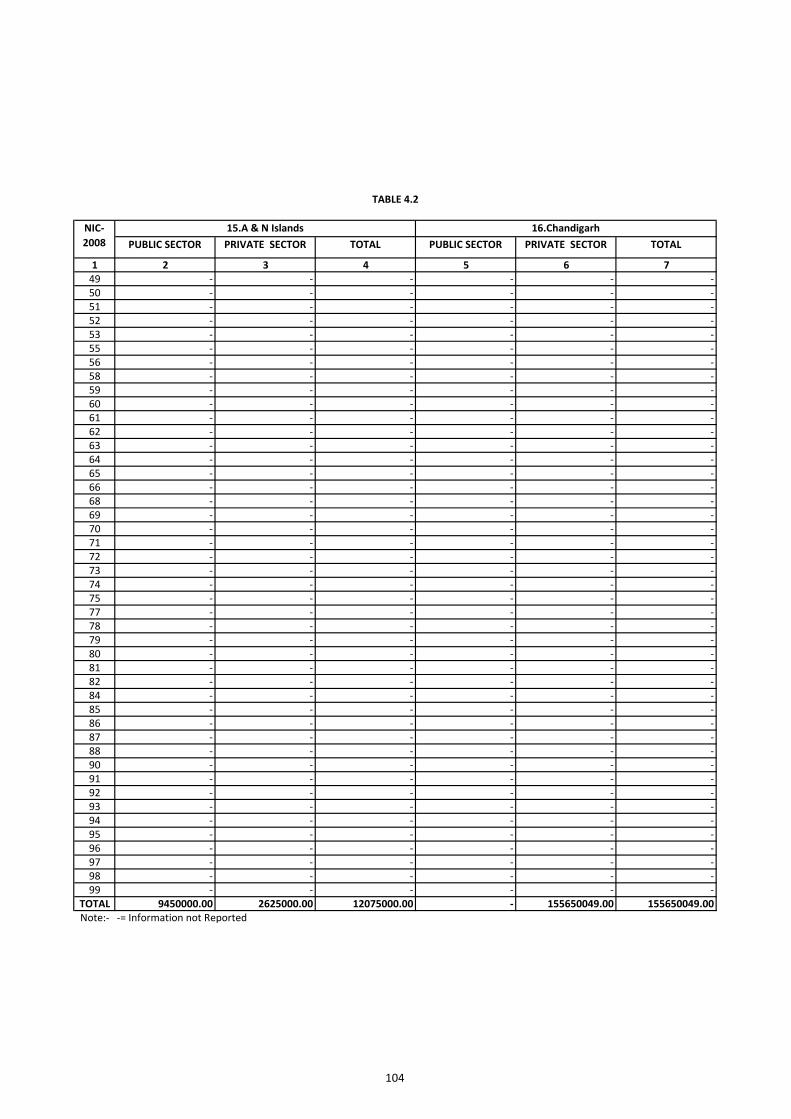
104
PUBLIC SECTOR PRIVATE SECTOR TOTAL PUBLIC SECTOR PRIVATE SECTOR TOTAL
1 2 3 4 5 6 749 - - - - - -50 - - - - - -51 - - - - - -52 - - - - - -53 - - - - - -55 - - - - - -56 - - - - - -58 - - - - - -59 - - - - - -60 - - - - - -61 - - - - - -62 - - - - - -63 - - - - - -64 - - - - - -65 - - - - - -66 - - - - - -68 - - - - - -69 - - - - - -70 - - - - - -71 - - - - - -72 - - - - - -73 - - - - - -74 - - - - - -75 - - - - - -77 - - - - - -78 - - - - - -79 - - - - - -80 - - - - - -81 - - - - - -82 - - - - - -84 - - - - - -85 - - - - - -86 - - - - - -87 - - - - - -88 - - - - - -90 - - - - - -91 - - - - - -92 - - - - - -93 - - - - - -94 - - - - - -95 - - - - - -96 - - - - - -97 - - - - - -98 - - - - - -99 - - - - - -
TOTAL 9450000.00 2625000.00 12075000.00 - 155650049.00 155650049.00Note:- -= Information not Reported
TABLE 4.2
16.Chandigarh15.A & N Islands NIC- 2008
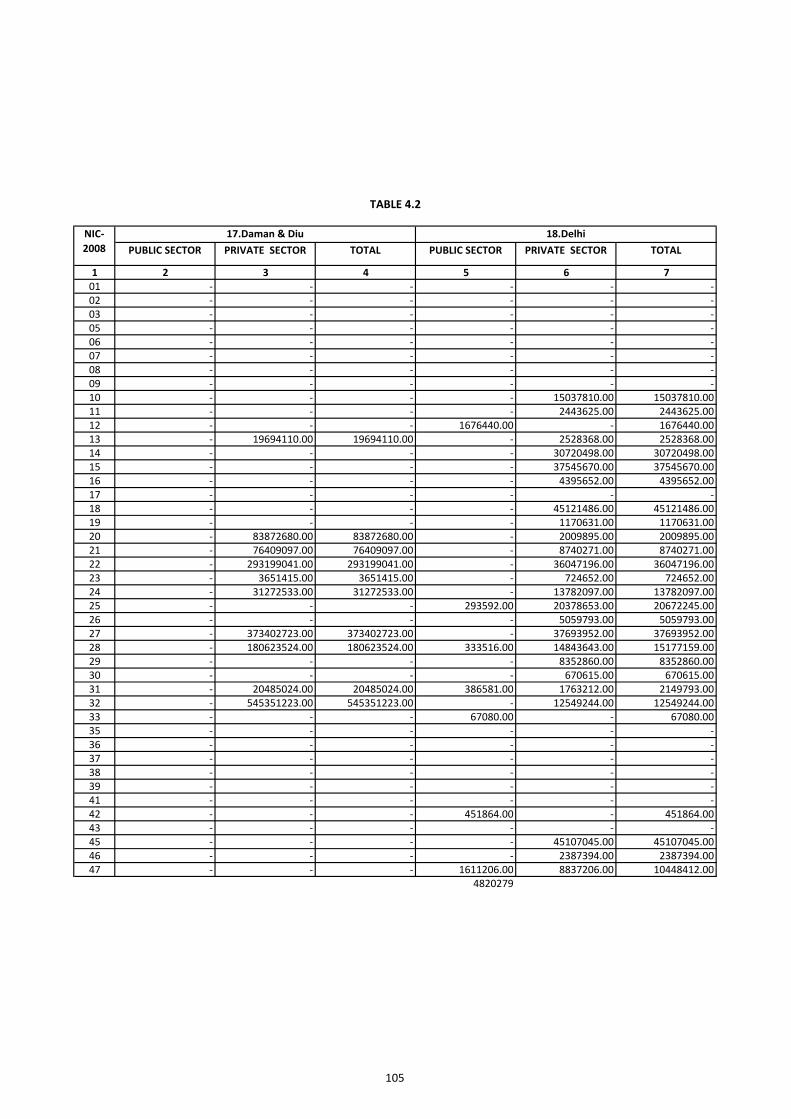
105
PUBLIC SECTOR PRIVATE SECTOR TOTAL PUBLIC SECTOR PRIVATE SECTOR TOTAL
1 2 3 4 5 6 701 - - - - - -02 - - - - - -03 - - - - - -05 - - - - - -06 - - - - - -07 - - - - - -08 - - - - - -09 - - - - - -10 - - - - 15037810.00 15037810.0011 - - - - 2443625.00 2443625.0012 - - - 1676440.00 - 1676440.0013 - 19694110.00 19694110.00 - 2528368.00 2528368.0014 - - - - 30720498.00 30720498.0015 - - - - 37545670.00 37545670.0016 - - - - 4395652.00 4395652.0017 - - - - - -18 - - - - 45121486.00 45121486.0019 - - - - 1170631.00 1170631.0020 - 83872680.00 83872680.00 - 2009895.00 2009895.0021 - 76409097.00 76409097.00 - 8740271.00 8740271.0022 - 293199041.00 293199041.00 - 36047196.00 36047196.0023 - 3651415.00 3651415.00 - 724652.00 724652.0024 - 31272533.00 31272533.00 - 13782097.00 13782097.0025 - - - 293592.00 20378653.00 20672245.0026 - - - - 5059793.00 5059793.0027 - 373402723.00 373402723.00 - 37693952.00 37693952.0028 - 180623524.00 180623524.00 333516.00 14843643.00 15177159.0029 - - - - 8352860.00 8352860.0030 - - - - 670615.00 670615.0031 - 20485024.00 20485024.00 386581.00 1763212.00 2149793.0032 - 545351223.00 545351223.00 - 12549244.00 12549244.0033 - - - 67080.00 - 67080.0035 - - - - - -36 - - - - - -37 - - - - - -38 - - - - - -39 - - - - - -41 - - - - - -42 - - - 451864.00 - 451864.0043 - - - - - -45 - - - - 45107045.00 45107045.0046 - - - - 2387394.00 2387394.0047 - - - 1611206.00 8837206.00 10448412.00
4820279
17.Daman & DiuNIC- 2008
TABLE 4.2
18.Delhi
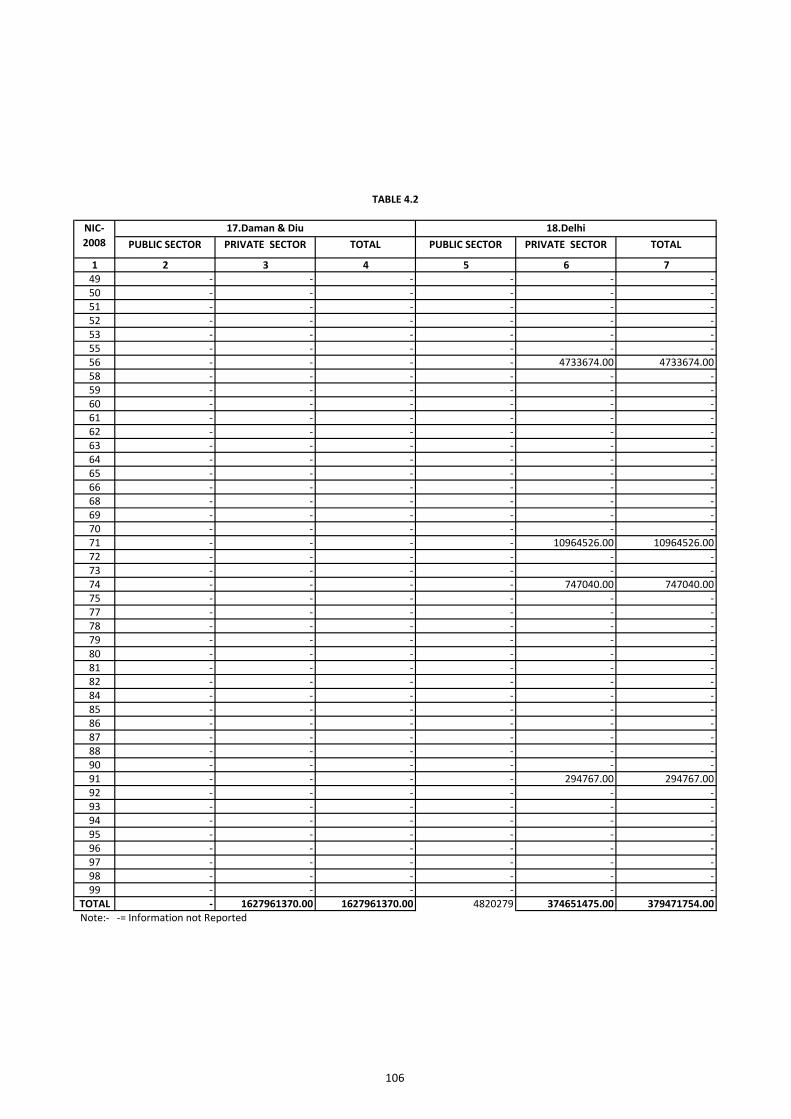
106
PUBLIC SECTOR PRIVATE SECTOR TOTAL PUBLIC SECTOR PRIVATE SECTOR TOTAL
1 2 3 4 5 6 749 - - - - - -50 - - - - - -51 - - - - - -52 - - - - - -53 - - - - - -55 - - - - - -56 - - - - 4733674.00 4733674.0058 - - - - - -59 - - - - - -60 - - - - - -61 - - - - - -62 - - - - - -63 - - - - - -64 - - - - - -65 - - - - - -66 - - - - - -68 - - - - - -69 - - - - - -70 - - - - - -71 - - - - 10964526.00 10964526.0072 - - - - - -73 - - - - - -74 - - - - 747040.00 747040.0075 - - - - - -77 - - - - - -78 - - - - - -79 - - - - - -80 - - - - - -81 - - - - - -82 - - - - - -84 - - - - - -85 - - - - - -86 - - - - - -87 - - - - - -88 - - - - - -90 - - - - - -91 - - - - 294767.00 294767.0092 - - - - - -93 - - - - - -94 - - - - - -95 - - - - - -96 - - - - - -97 - - - - - -98 - - - - - -99 - - - - - -
TOTAL - 1627961370.00 1627961370.00 4820279 374651475.00 379471754.00Note:- -= Information not Reported
TABLE 4.2
17.Daman & Diu 18.DelhiNIC- 2008
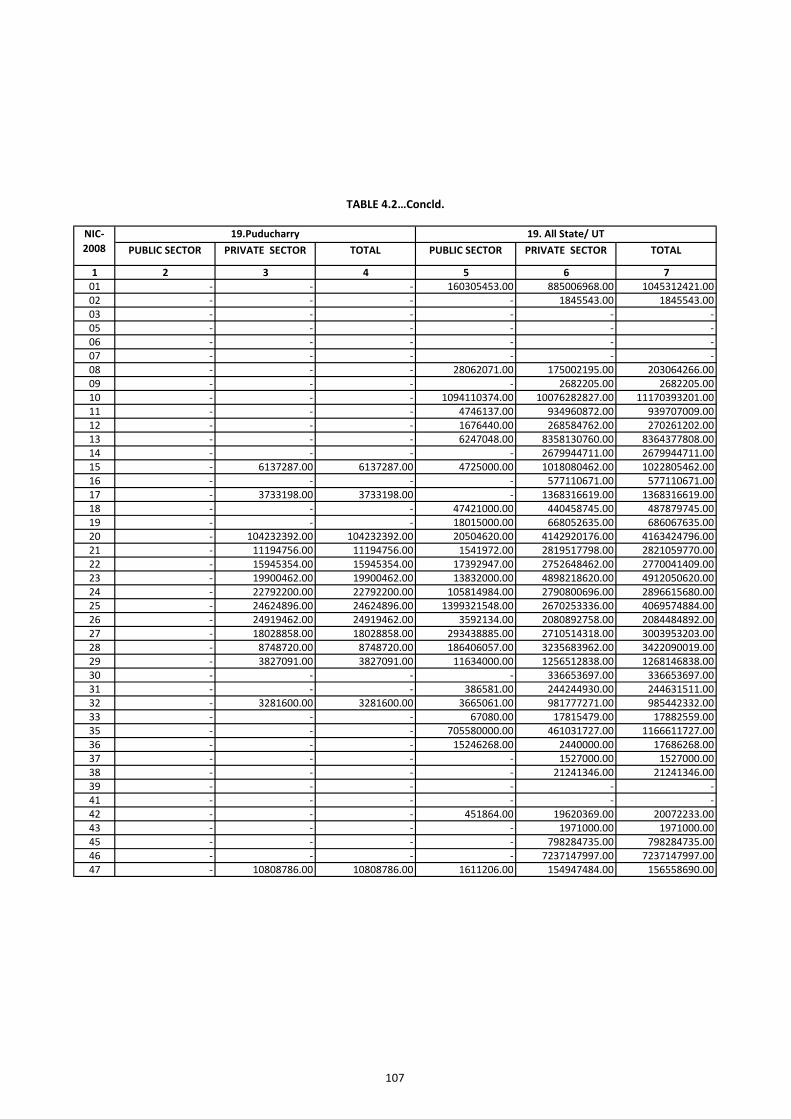
107
PUBLIC SECTOR PRIVATE SECTOR TOTAL PUBLIC SECTOR PRIVATE SECTOR TOTAL
1 2 3 4 5 6 701 - - - 160305453.00 885006968.00 1045312421.0002 - - - - 1845543.00 1845543.0003 - - - - - -05 - - - - - -06 - - - - - -07 - - - - - -08 - - - 28062071.00 175002195.00 203064266.0009 - - - - 2682205.00 2682205.0010 - - - 1094110374.00 10076282827.00 11170393201.0011 - - - 4746137.00 934960872.00 939707009.0012 - - - 1676440.00 268584762.00 270261202.0013 - - - 6247048.00 8358130760.00 8364377808.0014 - - - - 2679944711.00 2679944711.0015 - 6137287.00 6137287.00 4725000.00 1018080462.00 1022805462.0016 - - - - 577110671.00 577110671.0017 - 3733198.00 3733198.00 - 1368316619.00 1368316619.0018 - - - 47421000.00 440458745.00 487879745.0019 - - - 18015000.00 668052635.00 686067635.0020 - 104232392.00 104232392.00 20504620.00 4142920176.00 4163424796.0021 - 11194756.00 11194756.00 1541972.00 2819517798.00 2821059770.0022 - 15945354.00 15945354.00 17392947.00 2752648462.00 2770041409.0023 - 19900462.00 19900462.00 13832000.00 4898218620.00 4912050620.0024 - 22792200.00 22792200.00 105814984.00 2790800696.00 2896615680.0025 - 24624896.00 24624896.00 1399321548.00 2670253336.00 4069574884.0026 - 24919462.00 24919462.00 3592134.00 2080892758.00 2084484892.0027 - 18028858.00 18028858.00 293438885.00 2710514318.00 3003953203.0028 - 8748720.00 8748720.00 186406057.00 3235683962.00 3422090019.0029 - 3827091.00 3827091.00 11634000.00 1256512838.00 1268146838.0030 - - - - 336653697.00 336653697.0031 - - - 386581.00 244244930.00 244631511.0032 - 3281600.00 3281600.00 3665061.00 981777271.00 985442332.0033 - - - 67080.00 17815479.00 17882559.0035 - - - 705580000.00 461031727.00 1166611727.0036 - - - 15246268.00 2440000.00 17686268.0037 - - - - 1527000.00 1527000.0038 - - - - 21241346.00 21241346.0039 - - - - - -41 - - - - - -42 - - - 451864.00 19620369.00 20072233.0043 - - - - 1971000.00 1971000.0045 - - - - 798284735.00 798284735.0046 - - - - 7237147997.00 7237147997.0047 - 10808786.00 10808786.00 1611206.00 154947484.00 156558690.00
TABLE 4.2…Concld.
19.Puducharry 19. All State/ UTNIC- 2008
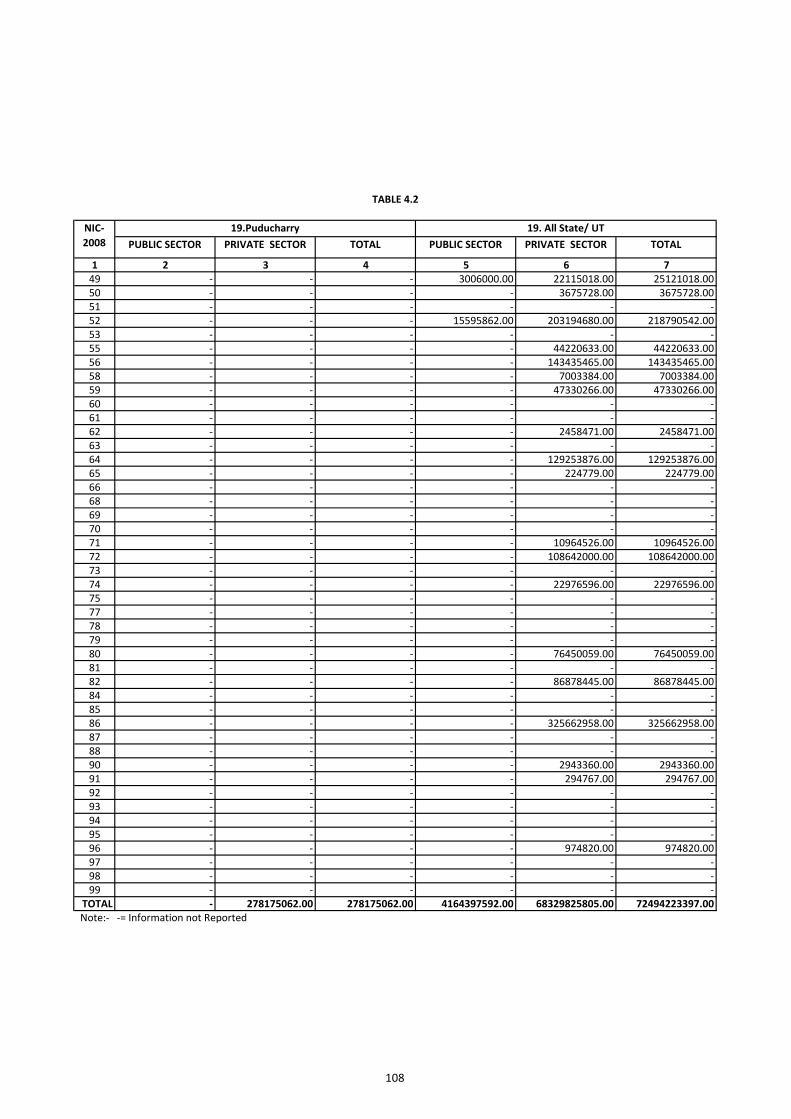
108
PUBLIC SECTOR PRIVATE SECTOR TOTAL PUBLIC SECTOR PRIVATE SECTOR TOTAL
1 2 3 4 5 6 749 - - - 3006000.00 22115018.00 25121018.0050 - - - - 3675728.00 3675728.0051 - - - - - -52 - - - 15595862.00 203194680.00 218790542.0053 - - - - - -55 - - - - 44220633.00 44220633.0056 - - - - 143435465.00 143435465.0058 - - - - 7003384.00 7003384.0059 - - - - 47330266.00 47330266.0060 - - - - - -61 - - - - - -62 - - - - 2458471.00 2458471.0063 - - - - - -64 - - - - 129253876.00 129253876.0065 - - - - 224779.00 224779.0066 - - - - - -68 - - - - - -69 - - - - - -70 - - - - - -71 - - - - 10964526.00 10964526.0072 - - - - 108642000.00 108642000.0073 - - - - - -74 - - - - 22976596.00 22976596.0075 - - - - - -77 - - - - - -78 - - - - - -79 - - - - - -80 - - - - 76450059.00 76450059.0081 - - - - - -82 - - - - 86878445.00 86878445.0084 - - - - - -85 - - - - - -86 - - - - 325662958.00 325662958.0087 - - - - - -88 - - - - - -90 - - - - 2943360.00 2943360.0091 - - - - 294767.00 294767.0092 - - - - - -93 - - - - - -94 - - - - - -95 - - - - - -96 - - - - 974820.00 974820.0097 - - - - - -98 - - - - - -99 - - - - - -
TOTAL - 278175062.00 278175062.00 4164397592.00 68329825805.00 72494223397.00Note:- -= Information not Reported
19.Puducharry 19. All State/ UTNIC- 2008
TABLE 4.2
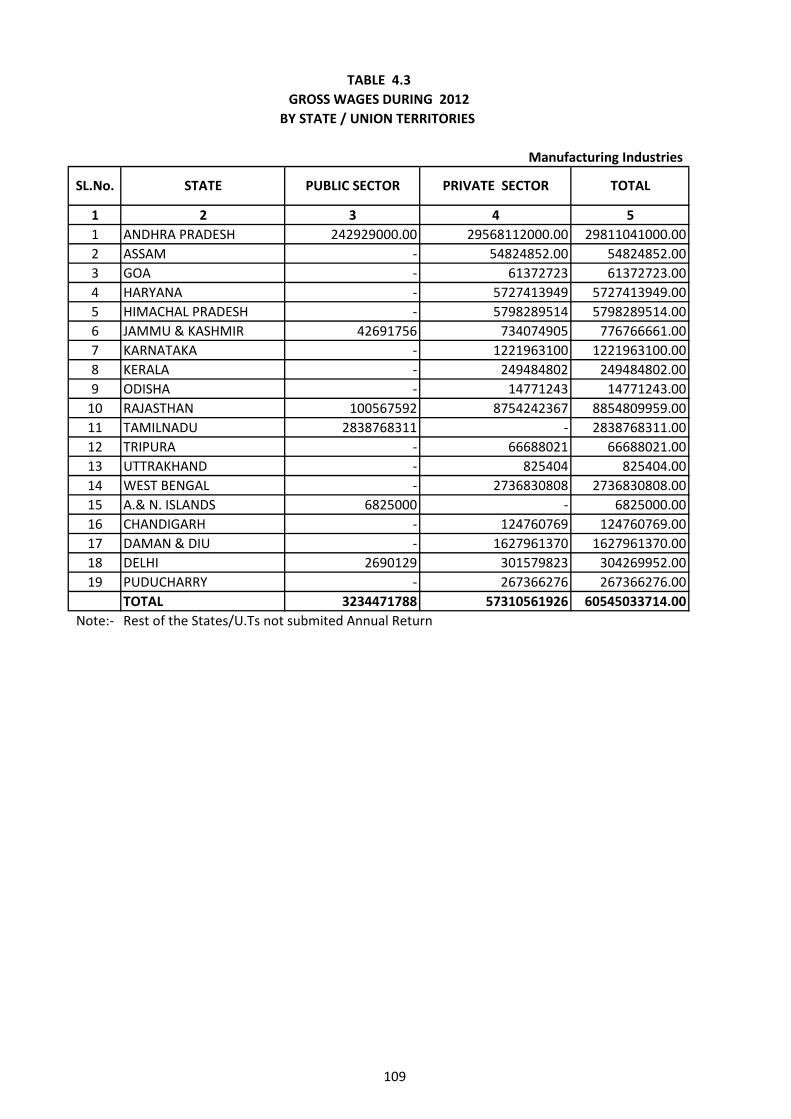
109
1 2 3 4 51 ANDHRA PRADESH 242929000.00 29568112000.00 29811041000.002 ASSAM - 54824852.00 54824852.003 GOA - 61372723 61372723.004 HARYANA - 5727413949 5727413949.005 HIMACHAL PRADESH - 5798289514 5798289514.006 JAMMU & KASHMIR 42691756 734074905 776766661.007 KARNATAKA - 1221963100 1221963100.008 KERALA - 249484802 249484802.009 ODISHA - 14771243 14771243.00
10 RAJASTHAN 100567592 8754242367 8854809959.0011 TAMILNADU 2838768311 - 2838768311.0012 TRIPURA - 66688021 66688021.0013 UTTRAKHAND - 825404 825404.0014 WEST BENGAL - 2736830808 2736830808.0015 A.& N. ISLANDS 6825000 - 6825000.0016 CHANDIGARH - 124760769 124760769.0017 DAMAN & DIU - 1627961370 1627961370.0018 DELHI 2690129 301579823 304269952.0019 PUDUCHARRY - 267366276 267366276.00
TOTAL 3234471788 57310561926 60545033714.00Note:- Rest of the States/U.Ts not submited Annual Return
TABLE 4.3 GROSS WAGES DURING 2012
BY STATE / UNION TERRITORIES
Manufacturing Industries
SL.No. STATE PUBLIC SECTOR PRIVATE SECTOR TOTAL
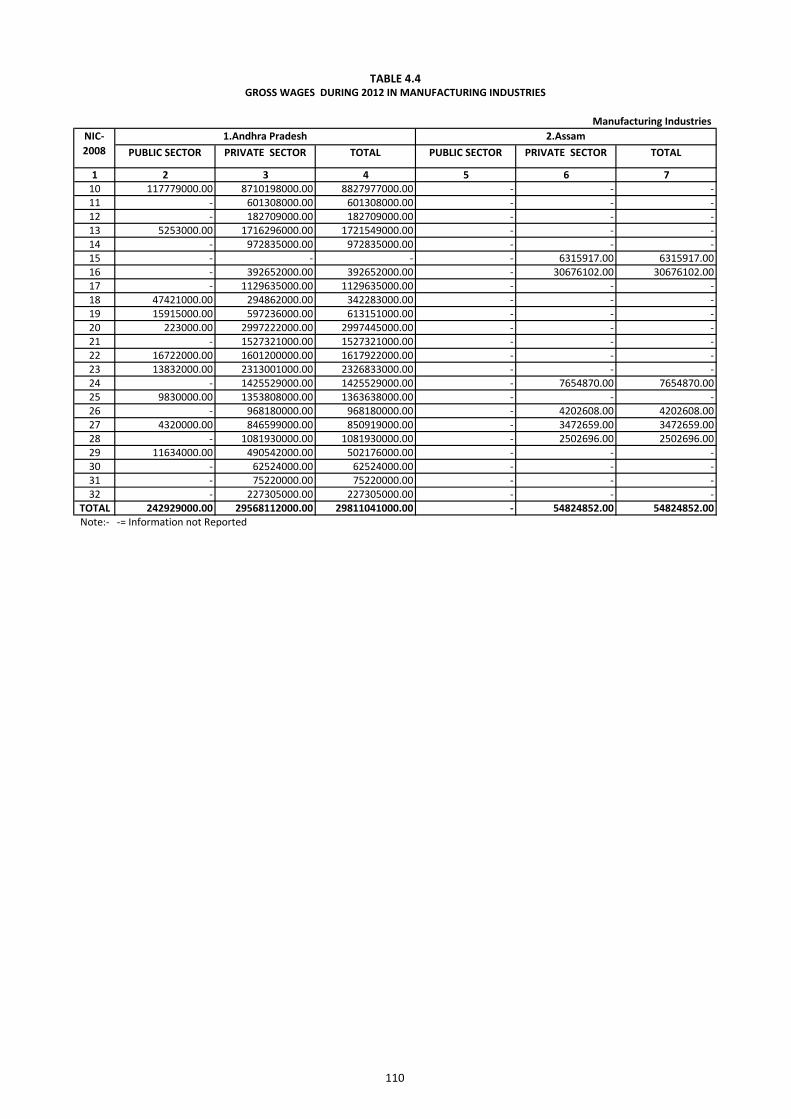
110
PUBLIC SECTOR PRIVATE SECTOR TOTAL PUBLIC SECTOR PRIVATE SECTOR TOTAL
1 2 3 4 5 6 710 117779000.00 8710198000.00 8827977000.00 - - -11 - 601308000.00 601308000.00 - - -12 - 182709000.00 182709000.00 - - -13 5253000.00 1716296000.00 1721549000.00 - - -14 - 972835000.00 972835000.00 - - -15 - - - - 6315917.00 6315917.0016 - 392652000.00 392652000.00 - 30676102.00 30676102.0017 - 1129635000.00 1129635000.00 - - -18 47421000.00 294862000.00 342283000.00 - - -19 15915000.00 597236000.00 613151000.00 - - -20 223000.00 2997222000.00 2997445000.00 - - -21 - 1527321000.00 1527321000.00 - - -22 16722000.00 1601200000.00 1617922000.00 - - -23 13832000.00 2313001000.00 2326833000.00 - - -24 - 1425529000.00 1425529000.00 - 7654870.00 7654870.0025 9830000.00 1353808000.00 1363638000.00 - - -26 - 968180000.00 968180000.00 - 4202608.00 4202608.0027 4320000.00 846599000.00 850919000.00 - 3472659.00 3472659.0028 - 1081930000.00 1081930000.00 - 2502696.00 2502696.0029 11634000.00 490542000.00 502176000.00 - - -30 - 62524000.00 62524000.00 - - -31 - 75220000.00 75220000.00 - - -32 - 227305000.00 227305000.00 - - -
TOTAL 242929000.00 29568112000.00 29811041000.00 - 54824852.00 54824852.00Note:- -= Information not Reported
TABLE 4.4GROSS WAGES DURING 2012 IN MANUFACTURING INDUSTRIES
NIC- 2008
1.Andhra Pradesh 2.AssamManufacturing Industries
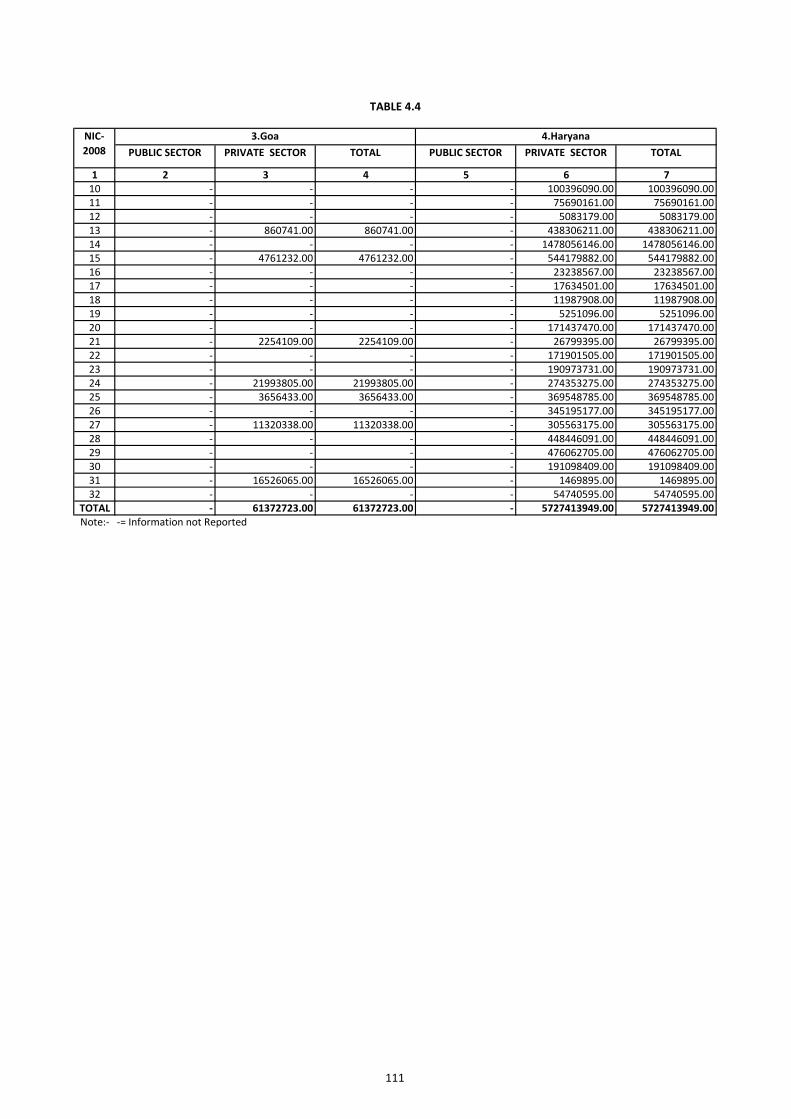
111
PUBLIC SECTOR PRIVATE SECTOR TOTAL PUBLIC SECTOR PRIVATE SECTOR TOTAL
1 2 3 4 5 6 710 - - - - 100396090.00 100396090.0011 - - - - 75690161.00 75690161.0012 - - - - 5083179.00 5083179.0013 - 860741.00 860741.00 - 438306211.00 438306211.0014 - - - - 1478056146.00 1478056146.0015 - 4761232.00 4761232.00 - 544179882.00 544179882.0016 - - - - 23238567.00 23238567.0017 - - - - 17634501.00 17634501.0018 - - - - 11987908.00 11987908.0019 - - - - 5251096.00 5251096.0020 - - - - 171437470.00 171437470.0021 - 2254109.00 2254109.00 - 26799395.00 26799395.0022 - - - - 171901505.00 171901505.0023 - - - - 190973731.00 190973731.0024 - 21993805.00 21993805.00 - 274353275.00 274353275.0025 - 3656433.00 3656433.00 - 369548785.00 369548785.0026 - - - - 345195177.00 345195177.0027 - 11320338.00 11320338.00 - 305563175.00 305563175.0028 - - - - 448446091.00 448446091.0029 - - - - 476062705.00 476062705.0030 - - - - 191098409.00 191098409.0031 - 16526065.00 16526065.00 - 1469895.00 1469895.0032 - - - - 54740595.00 54740595.00
TOTAL - 61372723.00 61372723.00 - 5727413949.00 5727413949.00Note:- -= Information not Reported
TABLE 4.4
3.GoaNIC- 2008
4.Haryana
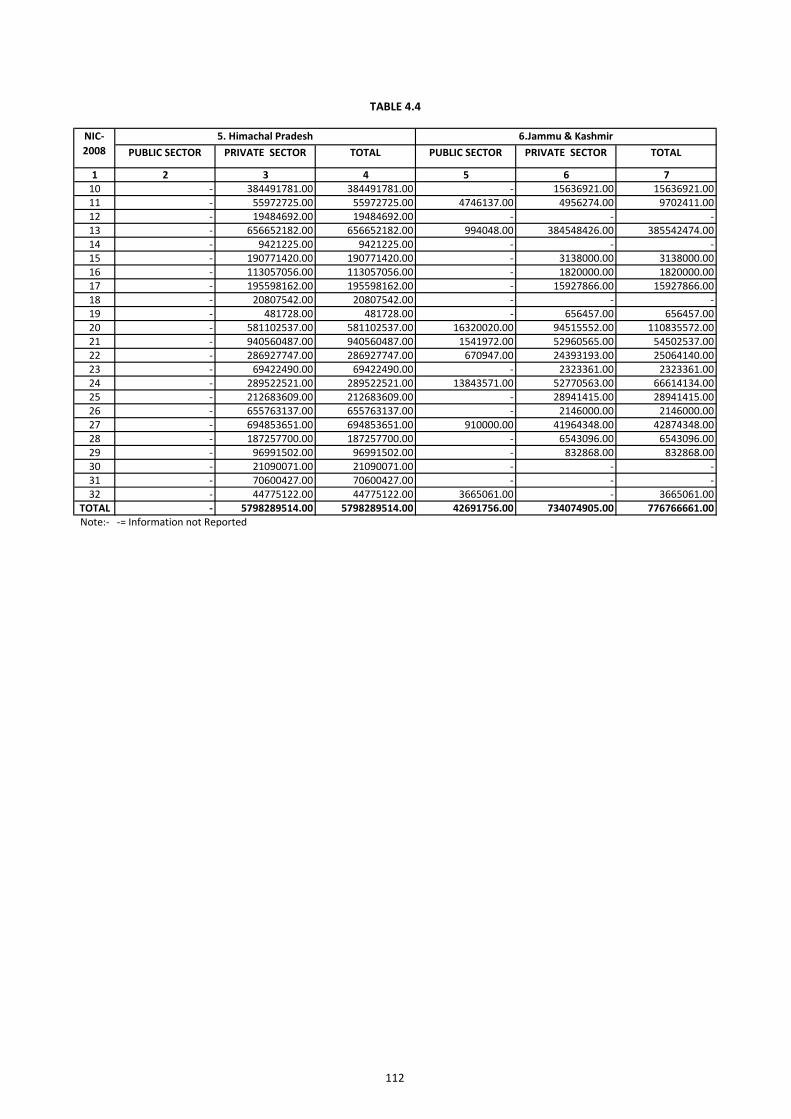
112
PUBLIC SECTOR PRIVATE SECTOR TOTAL PUBLIC SECTOR PRIVATE SECTOR TOTAL
1 2 3 4 5 6 710 - 384491781.00 384491781.00 - 15636921.00 15636921.0011 - 55972725.00 55972725.00 4746137.00 4956274.00 9702411.0012 - 19484692.00 19484692.00 - - -13 - 656652182.00 656652182.00 994048.00 384548426.00 385542474.0014 - 9421225.00 9421225.00 - - -15 - 190771420.00 190771420.00 - 3138000.00 3138000.0016 - 113057056.00 113057056.00 - 1820000.00 1820000.0017 - 195598162.00 195598162.00 - 15927866.00 15927866.0018 - 20807542.00 20807542.00 - - -19 - 481728.00 481728.00 - 656457.00 656457.0020 - 581102537.00 581102537.00 16320020.00 94515552.00 110835572.0021 - 940560487.00 940560487.00 1541972.00 52960565.00 54502537.0022 - 286927747.00 286927747.00 670947.00 24393193.00 25064140.0023 - 69422490.00 69422490.00 - 2323361.00 2323361.0024 - 289522521.00 289522521.00 13843571.00 52770563.00 66614134.0025 - 212683609.00 212683609.00 - 28941415.00 28941415.0026 - 655763137.00 655763137.00 - 2146000.00 2146000.0027 - 694853651.00 694853651.00 910000.00 41964348.00 42874348.0028 - 187257700.00 187257700.00 - 6543096.00 6543096.0029 - 96991502.00 96991502.00 - 832868.00 832868.0030 - 21090071.00 21090071.00 - - -31 - 70600427.00 70600427.00 - - -32 - 44775122.00 44775122.00 3665061.00 - 3665061.00
TOTAL - 5798289514.00 5798289514.00 42691756.00 734074905.00 776766661.00Note:- -= Information not Reported
TABLE 4.4
NIC- 2008
5. Himachal Pradesh 6.Jammu & Kashmir
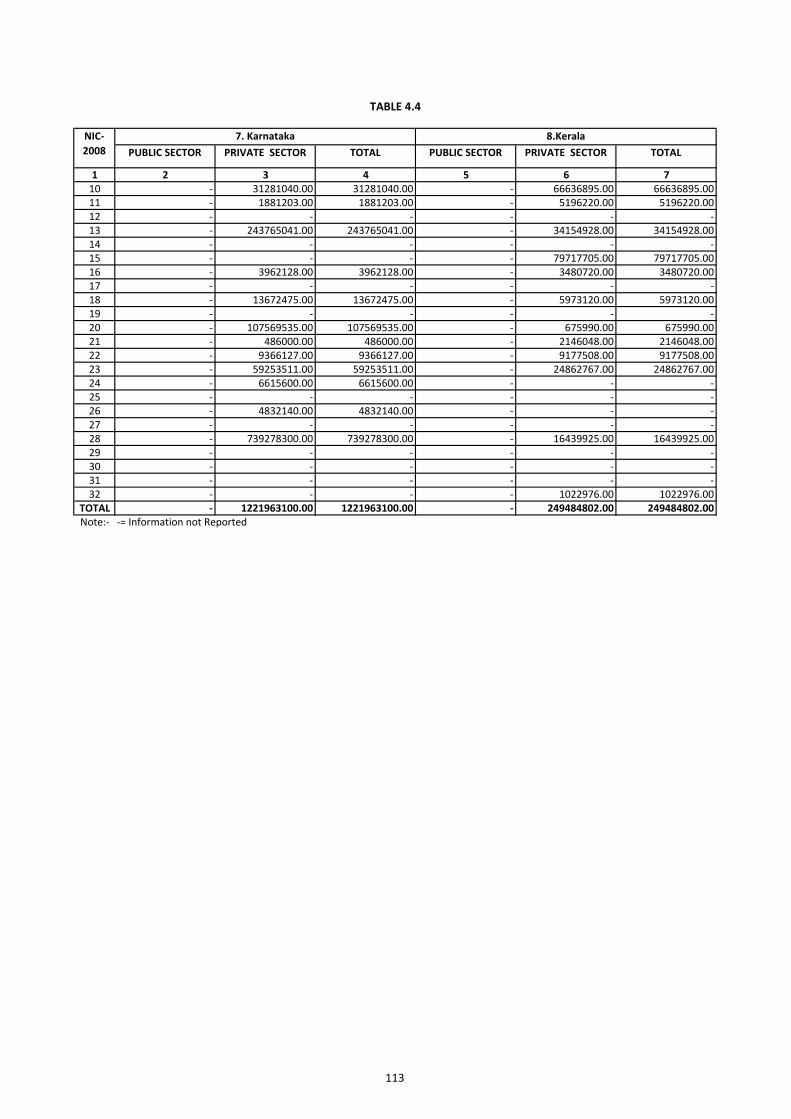
113
PUBLIC SECTOR PRIVATE SECTOR TOTAL PUBLIC SECTOR PRIVATE SECTOR TOTAL
1 2 3 4 5 6 710 - 31281040.00 31281040.00 - 66636895.00 66636895.0011 - 1881203.00 1881203.00 - 5196220.00 5196220.0012 - - - - - -13 - 243765041.00 243765041.00 - 34154928.00 34154928.0014 - - - - - -15 - - - - 79717705.00 79717705.0016 - 3962128.00 3962128.00 - 3480720.00 3480720.0017 - - - - - -18 - 13672475.00 13672475.00 - 5973120.00 5973120.0019 - - - - - -20 - 107569535.00 107569535.00 - 675990.00 675990.0021 - 486000.00 486000.00 - 2146048.00 2146048.0022 - 9366127.00 9366127.00 - 9177508.00 9177508.0023 - 59253511.00 59253511.00 - 24862767.00 24862767.0024 - 6615600.00 6615600.00 - - -25 - - - - - -26 - 4832140.00 4832140.00 - - -27 - - - - - -28 - 739278300.00 739278300.00 - 16439925.00 16439925.0029 - - - - - -30 - - - - - -31 - - - - - -32 - - - - 1022976.00 1022976.00
TOTAL - 1221963100.00 1221963100.00 - 249484802.00 249484802.00Note:- -= Information not Reported
NIC- 2008
TABLE 4.4
7. Karnataka 8.Kerala
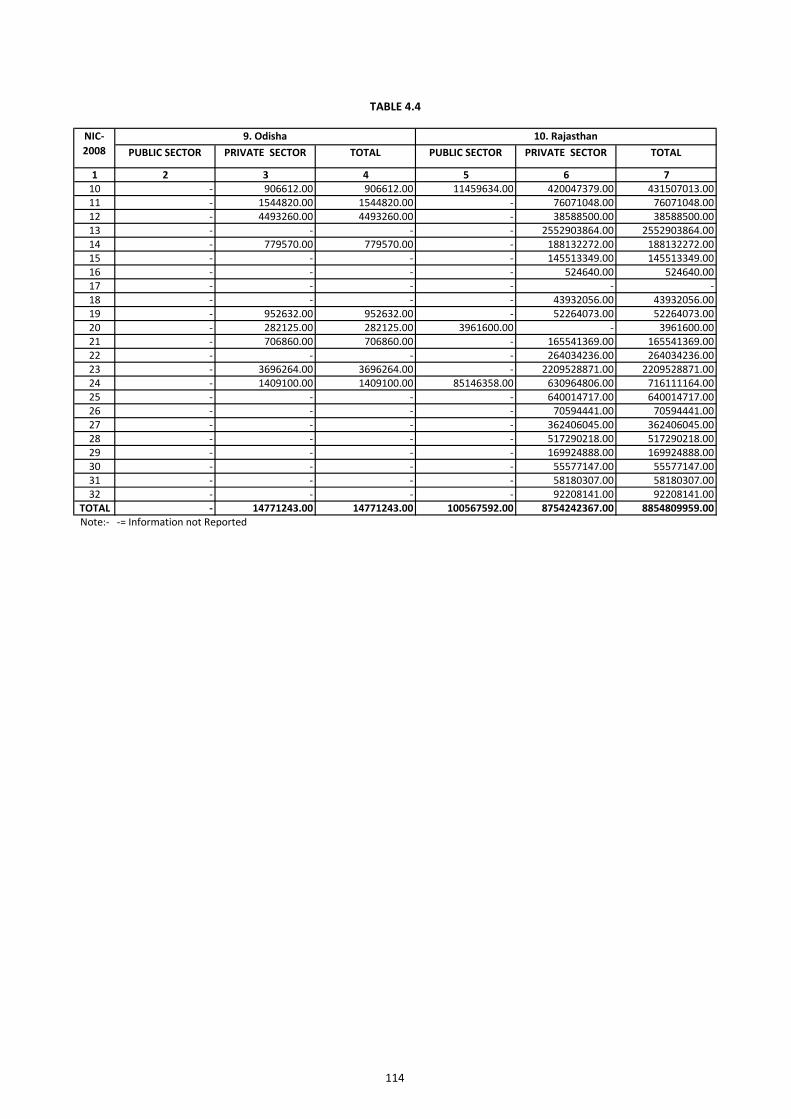
114
PUBLIC SECTOR PRIVATE SECTOR TOTAL PUBLIC SECTOR PRIVATE SECTOR TOTAL
1 2 3 4 5 6 710 - 906612.00 906612.00 11459634.00 420047379.00 431507013.0011 - 1544820.00 1544820.00 - 76071048.00 76071048.0012 - 4493260.00 4493260.00 - 38588500.00 38588500.0013 - - - - 2552903864.00 2552903864.0014 - 779570.00 779570.00 - 188132272.00 188132272.0015 - - - - 145513349.00 145513349.0016 - - - - 524640.00 524640.0017 - - - - - -18 - - - - 43932056.00 43932056.0019 - 952632.00 952632.00 - 52264073.00 52264073.0020 - 282125.00 282125.00 3961600.00 - 3961600.0021 - 706860.00 706860.00 - 165541369.00 165541369.0022 - - - - 264034236.00 264034236.0023 - 3696264.00 3696264.00 - 2209528871.00 2209528871.0024 - 1409100.00 1409100.00 85146358.00 630964806.00 716111164.0025 - - - - 640014717.00 640014717.0026 - - - - 70594441.00 70594441.0027 - - - - 362406045.00 362406045.0028 - - - - 517290218.00 517290218.0029 - - - - 169924888.00 169924888.0030 - - - - 55577147.00 55577147.0031 - - - - 58180307.00 58180307.0032 - - - - 92208141.00 92208141.00
TOTAL - 14771243.00 14771243.00 100567592.00 8754242367.00 8854809959.00Note:- -= Information not Reported
TABLE 4.4
NIC- 2008
9. Odisha 10. Rajasthan
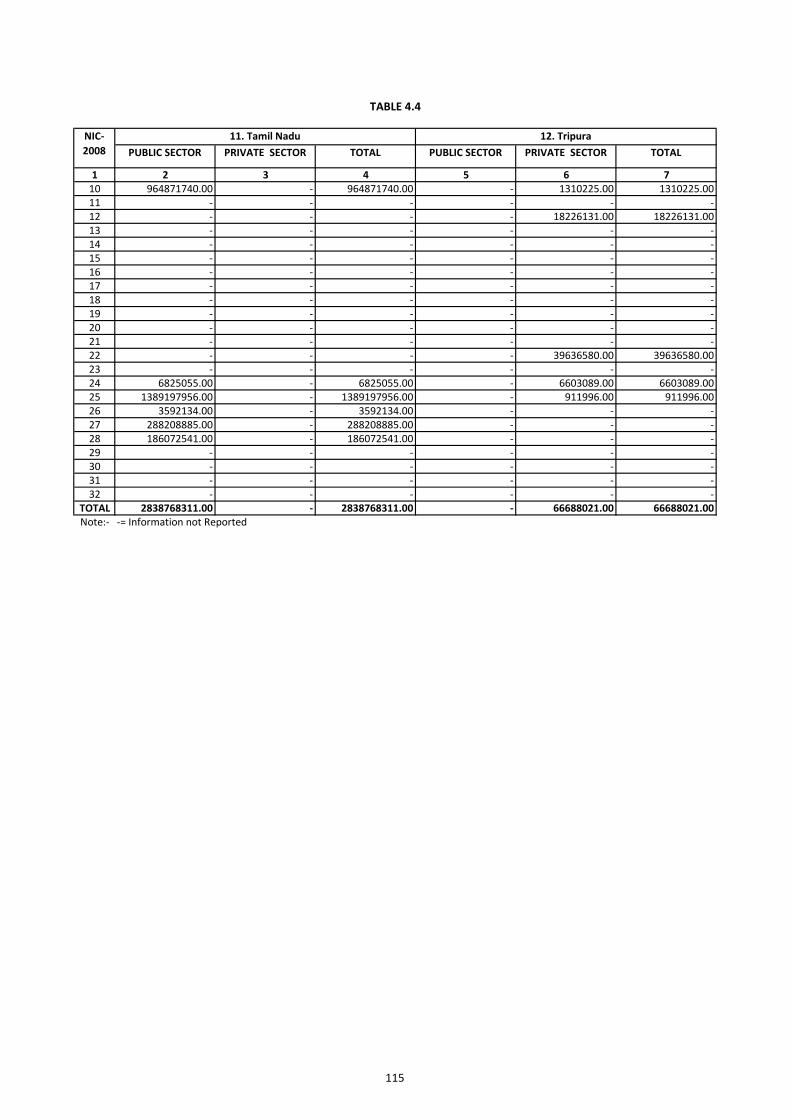
115
PUBLIC SECTOR PRIVATE SECTOR TOTAL PUBLIC SECTOR PRIVATE SECTOR TOTAL
1 2 3 4 5 6 710 964871740.00 - 964871740.00 - 1310225.00 1310225.0011 - - - - - -12 - - - - 18226131.00 18226131.0013 - - - - - -14 - - - - - -15 - - - - - -16 - - - - - -17 - - - - - -18 - - - - - -19 - - - - - -20 - - - - - -21 - - - - - -22 - - - - 39636580.00 39636580.0023 - - - - - -24 6825055.00 - 6825055.00 - 6603089.00 6603089.0025 1389197956.00 - 1389197956.00 - 911996.00 911996.0026 3592134.00 - 3592134.00 - - -27 288208885.00 - 288208885.00 - - -28 186072541.00 - 186072541.00 - - -29 - - - - - -30 - - - - - -31 - - - - - -32 - - - - - -
TOTAL 2838768311.00 - 2838768311.00 - 66688021.00 66688021.00Note:- -= Information not Reported
12. Tripura
TABLE 4.4
NIC- 2008
11. Tamil Nadu
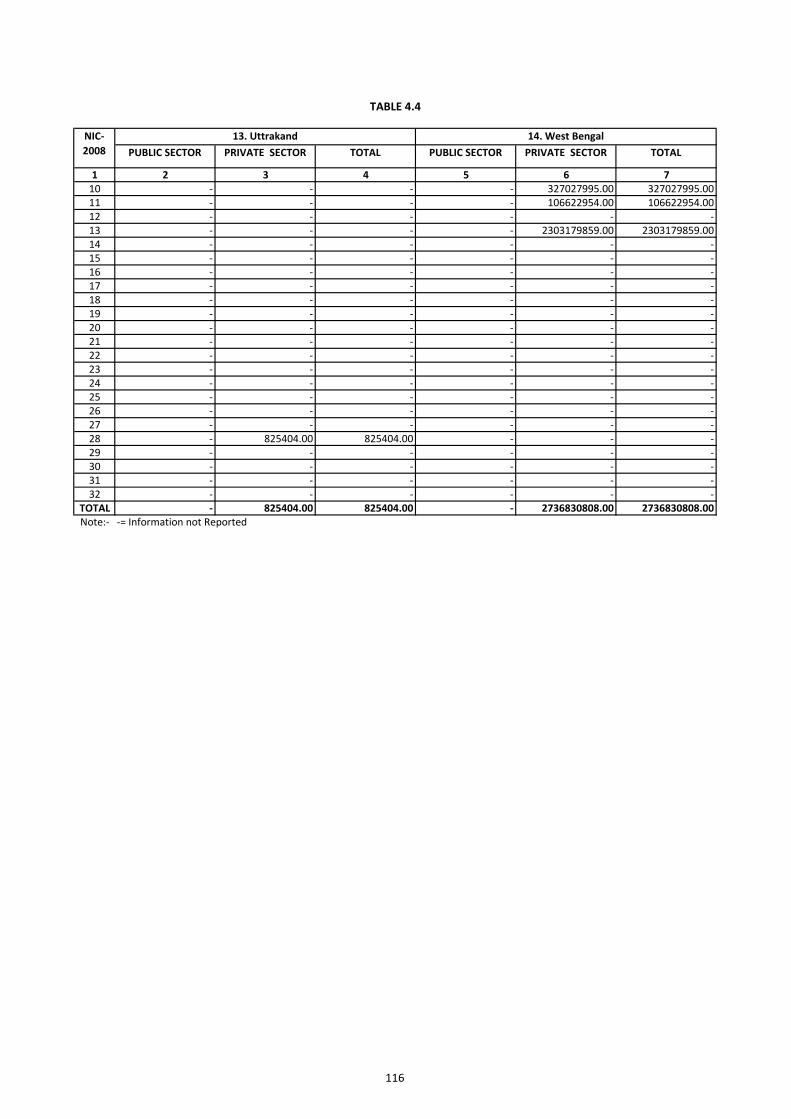
116
PUBLIC SECTOR PRIVATE SECTOR TOTAL PUBLIC SECTOR PRIVATE SECTOR TOTAL
1 2 3 4 5 6 710 - - - - 327027995.00 327027995.0011 - - - - 106622954.00 106622954.0012 - - - - - -13 - - - - 2303179859.00 2303179859.0014 - - - - - -15 - - - - - -16 - - - - - -17 - - - - - -18 - - - - - -19 - - - - - -20 - - - - - -21 - - - - - -22 - - - - - -23 - - - - - -24 - - - - - -25 - - - - - -26 - - - - - -27 - - - - - -28 - 825404.00 825404.00 - - -29 - - - - - -30 - - - - - -31 - - - - - -32 - - - - - -
TOTAL - 825404.00 825404.00 - 2736830808.00 2736830808.00Note:- -= Information not Reported
NIC- 2008
13. Uttrakand
TABLE 4.4
14. West Bengal
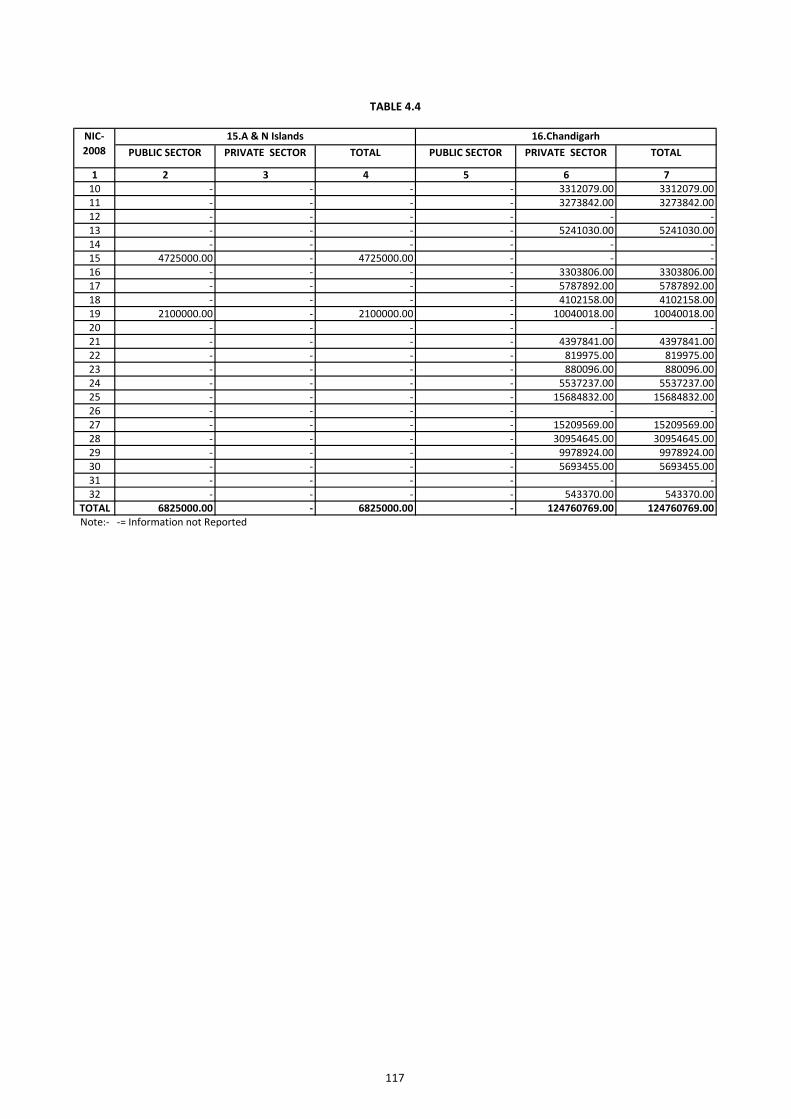
117
PUBLIC SECTOR PRIVATE SECTOR TOTAL PUBLIC SECTOR PRIVATE SECTOR TOTAL
1 2 3 4 5 6 710 - - - - 3312079.00 3312079.0011 - - - - 3273842.00 3273842.0012 - - - - - -13 - - - - 5241030.00 5241030.0014 - - - - - -15 4725000.00 - 4725000.00 - - -16 - - - - 3303806.00 3303806.0017 - - - - 5787892.00 5787892.0018 - - - - 4102158.00 4102158.0019 2100000.00 - 2100000.00 - 10040018.00 10040018.0020 - - - - - -21 - - - - 4397841.00 4397841.0022 - - - - 819975.00 819975.0023 - - - - 880096.00 880096.0024 - - - - 5537237.00 5537237.0025 - - - - 15684832.00 15684832.0026 - - - - - -27 - - - - 15209569.00 15209569.0028 - - - - 30954645.00 30954645.0029 - - - - 9978924.00 9978924.0030 - - - - 5693455.00 5693455.0031 - - - - - -32 - - - - 543370.00 543370.00
TOTAL 6825000.00 - 6825000.00 - 124760769.00 124760769.00Note:- -= Information not Reported
TABLE 4.4
15.A & N Islands NIC- 2008
16.Chandigarh
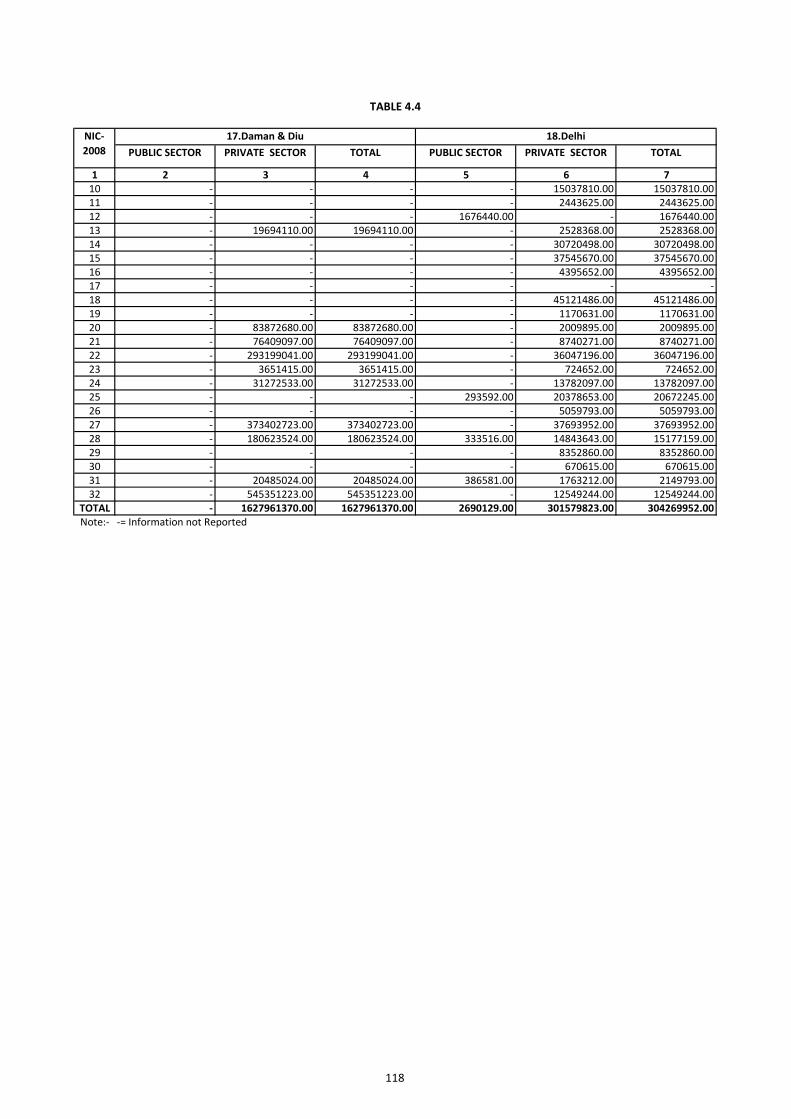
118
PUBLIC SECTOR PRIVATE SECTOR TOTAL PUBLIC SECTOR PRIVATE SECTOR TOTAL
1 2 3 4 5 6 710 - - - - 15037810.00 15037810.0011 - - - - 2443625.00 2443625.0012 - - - 1676440.00 - 1676440.0013 - 19694110.00 19694110.00 - 2528368.00 2528368.0014 - - - - 30720498.00 30720498.0015 - - - - 37545670.00 37545670.0016 - - - - 4395652.00 4395652.0017 - - - - - -18 - - - - 45121486.00 45121486.0019 - - - - 1170631.00 1170631.0020 - 83872680.00 83872680.00 - 2009895.00 2009895.0021 - 76409097.00 76409097.00 - 8740271.00 8740271.0022 - 293199041.00 293199041.00 - 36047196.00 36047196.0023 - 3651415.00 3651415.00 - 724652.00 724652.0024 - 31272533.00 31272533.00 - 13782097.00 13782097.0025 - - - 293592.00 20378653.00 20672245.0026 - - - - 5059793.00 5059793.0027 - 373402723.00 373402723.00 - 37693952.00 37693952.0028 - 180623524.00 180623524.00 333516.00 14843643.00 15177159.0029 - - - - 8352860.00 8352860.0030 - - - - 670615.00 670615.0031 - 20485024.00 20485024.00 386581.00 1763212.00 2149793.0032 - 545351223.00 545351223.00 - 12549244.00 12549244.00
TOTAL - 1627961370.00 1627961370.00 2690129.00 301579823.00 304269952.00Note:- -= Information not Reported
NIC- 2008
TABLE 4.4
17.Daman & Diu 18.Delhi
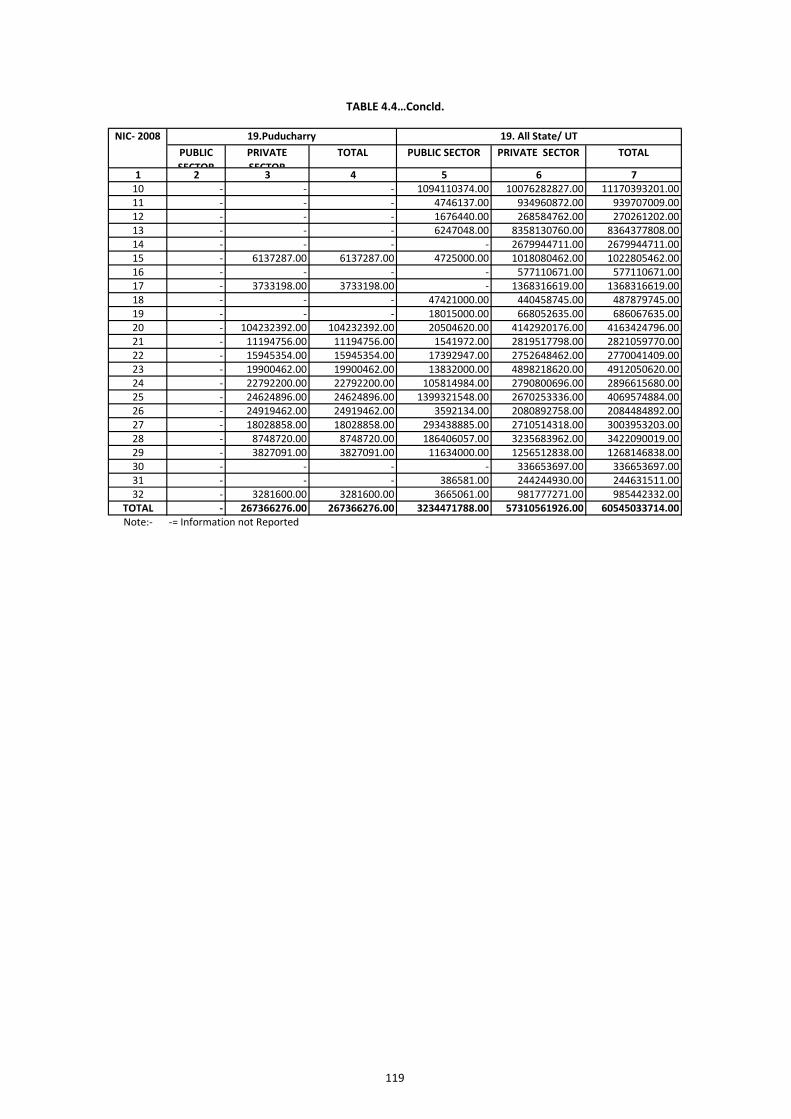
119
PUBLIC SECTOR
PRIVATE SECTOR
TOTAL PUBLIC SECTOR PRIVATE SECTOR TOTAL
1 2 3 4 5 6 710 - - - 1094110374.00 10076282827.00 11170393201.0011 - - - 4746137.00 934960872.00 939707009.0012 - - - 1676440.00 268584762.00 270261202.0013 - - - 6247048.00 8358130760.00 8364377808.0014 - - - - 2679944711.00 2679944711.0015 - 6137287.00 6137287.00 4725000.00 1018080462.00 1022805462.0016 - - - - 577110671.00 577110671.0017 - 3733198.00 3733198.00 - 1368316619.00 1368316619.0018 - - - 47421000.00 440458745.00 487879745.0019 - - - 18015000.00 668052635.00 686067635.0020 - 104232392.00 104232392.00 20504620.00 4142920176.00 4163424796.0021 - 11194756.00 11194756.00 1541972.00 2819517798.00 2821059770.0022 - 15945354.00 15945354.00 17392947.00 2752648462.00 2770041409.0023 - 19900462.00 19900462.00 13832000.00 4898218620.00 4912050620.0024 - 22792200.00 22792200.00 105814984.00 2790800696.00 2896615680.0025 - 24624896.00 24624896.00 1399321548.00 2670253336.00 4069574884.0026 - 24919462.00 24919462.00 3592134.00 2080892758.00 2084484892.0027 - 18028858.00 18028858.00 293438885.00 2710514318.00 3003953203.0028 - 8748720.00 8748720.00 186406057.00 3235683962.00 3422090019.0029 - 3827091.00 3827091.00 11634000.00 1256512838.00 1268146838.0030 - - - - 336653697.00 336653697.0031 - - - 386581.00 244244930.00 244631511.0032 - 3281600.00 3281600.00 3665061.00 981777271.00 985442332.00
TOTAL - 267366276.00 267366276.00 3234471788.00 57310561926.00 60545033714.00Note:- -= Information not Reported
TABLE 4.4…Concld.
NIC- 2008 19.Puducharry 19. All State/ UT
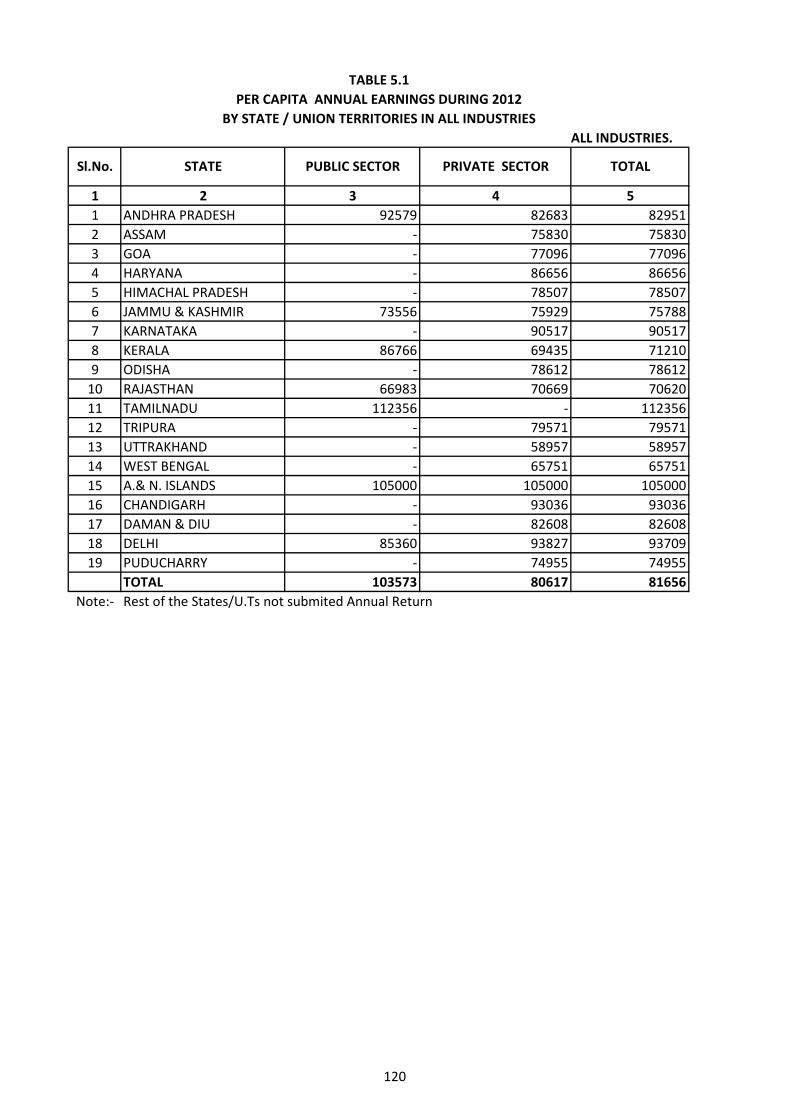
120
1 2 3 4 51 ANDHRA PRADESH 92579 82683 829512 ASSAM - 75830 758303 GOA - 77096 770964 HARYANA - 86656 866565 HIMACHAL PRADESH - 78507 785076 JAMMU & KASHMIR 73556 75929 757887 KARNATAKA - 90517 905178 KERALA 86766 69435 712109 ODISHA - 78612 78612
10 RAJASTHAN 66983 70669 7062011 TAMILNADU 112356 - 11235612 TRIPURA - 79571 7957113 UTTRAKHAND - 58957 5895714 WEST BENGAL - 65751 6575115 A.& N. ISLANDS 105000 105000 10500016 CHANDIGARH - 93036 9303617 DAMAN & DIU - 82608 8260818 DELHI 85360 93827 9370919 PUDUCHARRY - 74955 74955
TOTAL 103573 80617 81656Note:- Rest of the States/U.Ts not submited Annual Return
TABLE 5.1 PER CAPITA ANNUAL EARNINGS DURING 2012
BY STATE / UNION TERRITORIES IN ALL INDUSTRIESALL INDUSTRIES.
Sl.No. STATE PUBLIC SECTOR PRIVATE SECTOR TOTAL
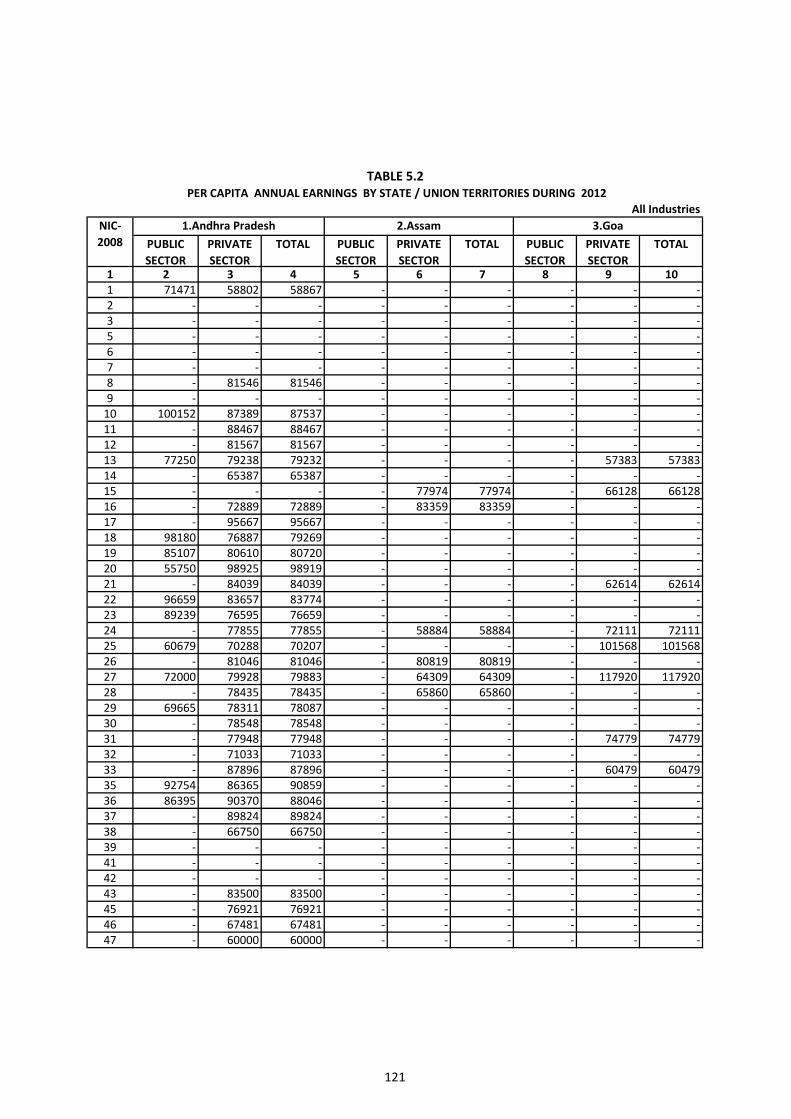
121
PUBLIC SECTOR
PRIVATE SECTOR
TOTAL PUBLIC SECTOR
PRIVATE SECTOR
TOTAL PUBLIC SECTOR
PRIVATE SECTOR
TOTAL
1 2 3 4 5 6 7 8 9 101 71471 58802 58867 - - - - - -2 - - - - - - - - -3 - - - - - - - - -5 - - - - - - - - -6 - - - - - - - - -7 - - - - - - - - -8 - 81546 81546 - - - - - -9 - - - - - - - - -
10 100152 87389 87537 - - - - - -11 - 88467 88467 - - - - - -12 - 81567 81567 - - - - - -13 77250 79238 79232 - - - - 57383 5738314 - 65387 65387 - - - - - -15 - - - - 77974 77974 - 66128 6612816 - 72889 72889 - 83359 83359 - - -17 - 95667 95667 - - - - - -18 98180 76887 79269 - - - - - -19 85107 80610 80720 - - - - - -20 55750 98925 98919 - - - - - -21 - 84039 84039 - - - - 62614 6261422 96659 83657 83774 - - - - - -23 89239 76595 76659 - - - - - -24 - 77855 77855 - 58884 58884 - 72111 7211125 60679 70288 70207 - - - - 101568 10156826 - 81046 81046 - 80819 80819 - - -27 72000 79928 79883 - 64309 64309 - 117920 11792028 - 78435 78435 - 65860 65860 - - -29 69665 78311 78087 - - - - - -30 - 78548 78548 - - - - - -31 - 77948 77948 - - - - 74779 7477932 - 71033 71033 - - - - - -33 - 87896 87896 - - - - 60479 6047935 92754 86365 90859 - - - - - -36 86395 90370 88046 - - - - - -37 - 89824 89824 - - - - - -38 - 66750 66750 - - - - - -39 - - - - - - - - -41 - - - - - - - - -42 - - - - - - - - -43 - 83500 83500 - - - - - -45 - 76921 76921 - - - - - -46 - 67481 67481 - - - - - -47 - 60000 60000 - - - - - -
TABLE 5.2 PER CAPITA ANNUAL EARNINGS BY STATE / UNION TERRITORIES DURING 2012
NIC- 2008
1.Andhra Pradesh 2.Assam 3.GoaAll Industries
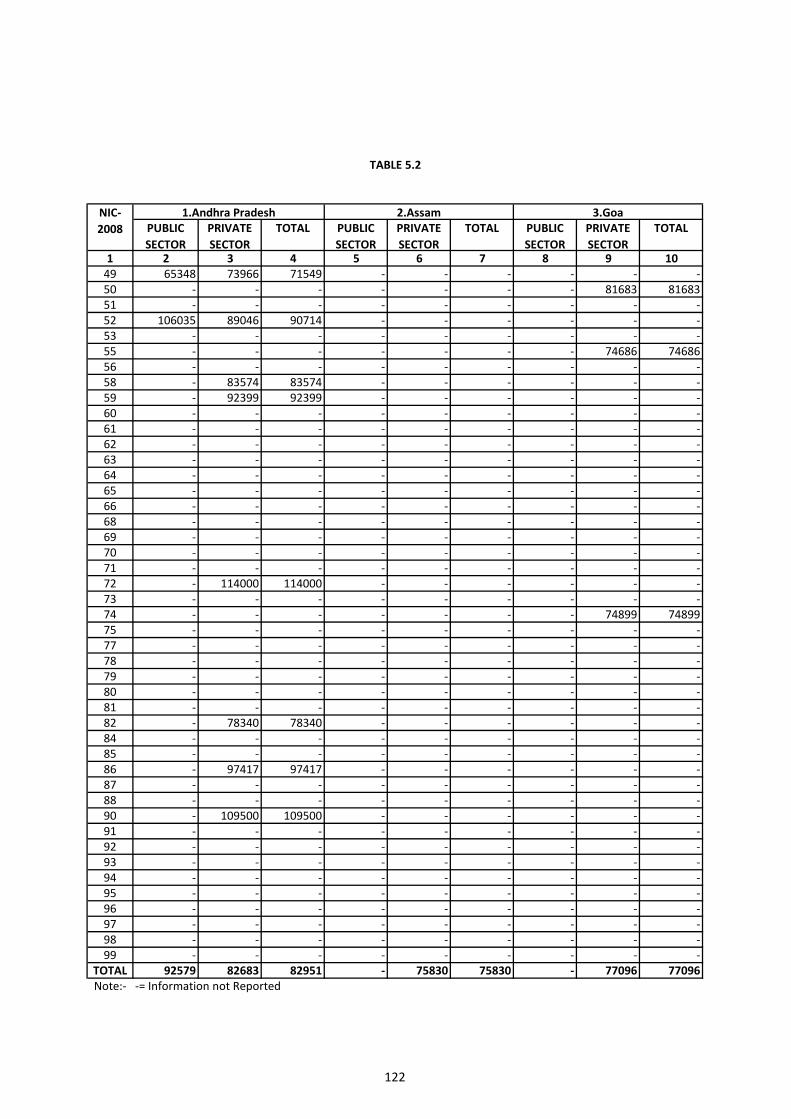
122
PUBLIC SECTOR
PRIVATE SECTOR
TOTAL PUBLIC SECTOR
PRIVATE SECTOR
TOTAL PUBLIC SECTOR
PRIVATE SECTOR
TOTAL
1 2 3 4 5 6 7 8 9 1049 65348 73966 71549 - - - - - -50 - - - - - - - 81683 8168351 - - - - - - - - -52 106035 89046 90714 - - - - - -53 - - - - - - - - -55 - - - - - - - 74686 7468656 - - - - - - - - -58 - 83574 83574 - - - - - -59 - 92399 92399 - - - - - -60 - - - - - - - - -61 - - - - - - - - -62 - - - - - - - - -63 - - - - - - - - -64 - - - - - - - - -65 - - - - - - - - -66 - - - - - - - - -68 - - - - - - - - -69 - - - - - - - - -70 - - - - - - - - -71 - - - - - - - - -72 - 114000 114000 - - - - - -73 - - - - - - - - -74 - - - - - - - 74899 7489975 - - - - - - - - -77 - - - - - - - - -78 - - - - - - - - -79 - - - - - - - - -80 - - - - - - - - -81 - - - - - - - - -82 - 78340 78340 - - - - - -84 - - - - - - - - -85 - - - - - - - - -86 - 97417 97417 - - - - - -87 - - - - - - - - -88 - - - - - - - - -90 - 109500 109500 - - - - - -91 - - - - - - - - -92 - - - - - - - - -93 - - - - - - - - -94 - - - - - - - - -95 - - - - - - - - -96 - - - - - - - - -97 - - - - - - - - -98 - - - - - - - - -99 - - - - - - - - -
TOTAL 92579 82683 82951 - 75830 75830 - 77096 77096Note:- -= Information not Reported
TABLE 5.2
NIC- 2008
1.Andhra Pradesh 2.Assam 3.Goa
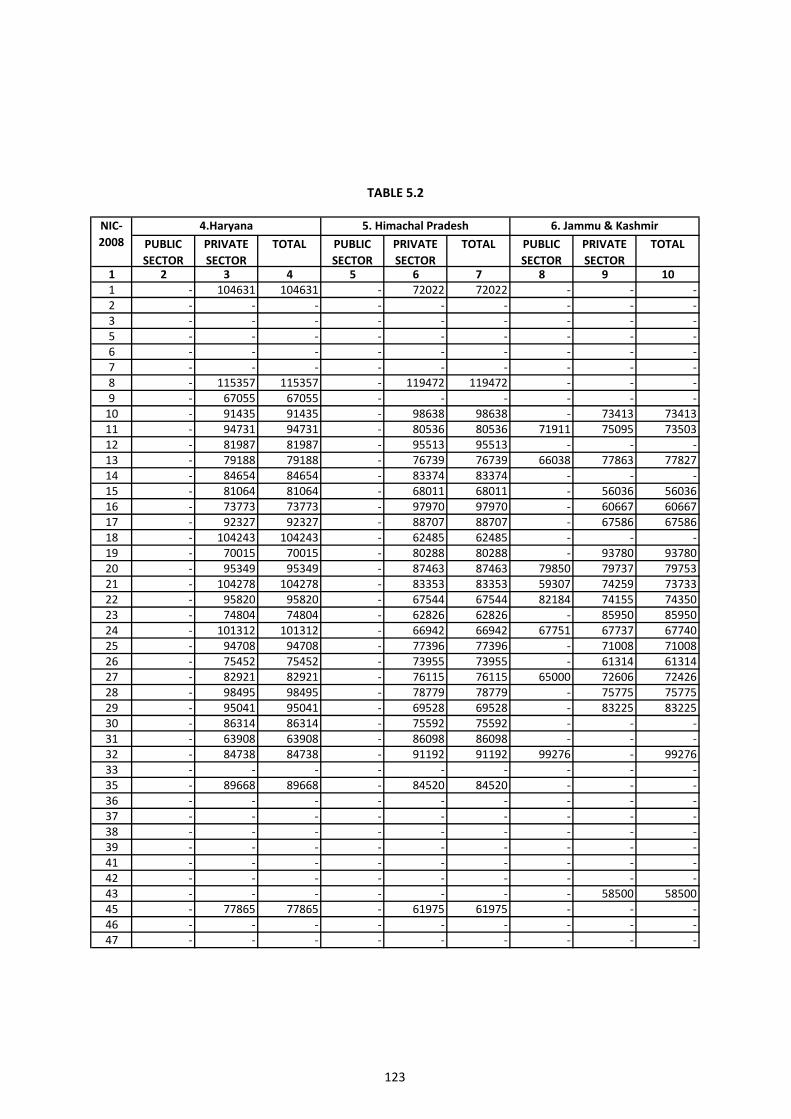
123
PUBLIC SECTOR
PRIVATE SECTOR
TOTAL PUBLIC SECTOR
PRIVATE SECTOR
TOTAL PUBLIC SECTOR
PRIVATE SECTOR
TOTAL
1 2 3 4 5 6 7 8 9 101 - 104631 104631 - 72022 72022 - - -2 - - - - - - - - -3 - - - - - - - - -5 - - - - - - - - -6 - - - - - - - - -7 - - - - - - - - -8 - 115357 115357 - 119472 119472 - - -9 - 67055 67055 - - - - - -
10 - 91435 91435 - 98638 98638 - 73413 7341311 - 94731 94731 - 80536 80536 71911 75095 7350312 - 81987 81987 - 95513 95513 - - -13 - 79188 79188 - 76739 76739 66038 77863 7782714 - 84654 84654 - 83374 83374 - - -15 - 81064 81064 - 68011 68011 - 56036 5603616 - 73773 73773 - 97970 97970 - 60667 6066717 - 92327 92327 - 88707 88707 - 67586 6758618 - 104243 104243 - 62485 62485 - - -19 - 70015 70015 - 80288 80288 - 93780 9378020 - 95349 95349 - 87463 87463 79850 79737 7975321 - 104278 104278 - 83353 83353 59307 74259 7373322 - 95820 95820 - 67544 67544 82184 74155 7435023 - 74804 74804 - 62826 62826 - 85950 8595024 - 101312 101312 - 66942 66942 67751 67737 6774025 - 94708 94708 - 77396 77396 - 71008 7100826 - 75452 75452 - 73955 73955 - 61314 6131427 - 82921 82921 - 76115 76115 65000 72606 7242628 - 98495 98495 - 78779 78779 - 75775 7577529 - 95041 95041 - 69528 69528 - 83225 8322530 - 86314 86314 - 75592 75592 - - -31 - 63908 63908 - 86098 86098 - - -32 - 84738 84738 - 91192 91192 99276 - 9927633 - - - - - - - - -35 - 89668 89668 - 84520 84520 - - -36 - - - - - - - - -37 - - - - - - - - -38 - - - - - - - - -39 - - - - - - - - -41 - - - - - - - - -42 - - - - - - - - -43 - - - - - - - 58500 5850045 - 77865 77865 - 61975 61975 - - -46 - - - - - - - - -47 - - - - - - - - -
TABLE 5.2
NIC- 2008
4.Haryana 5. Himachal Pradesh 6. Jammu & Kashmir
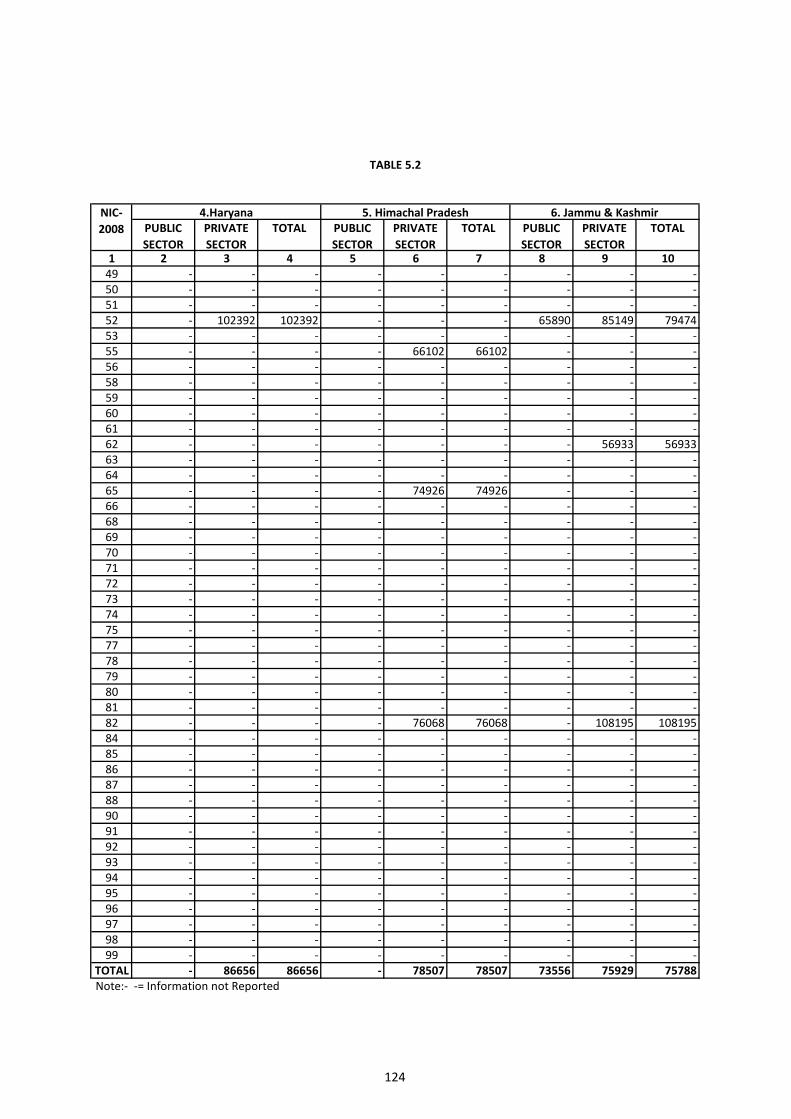
124
PUBLIC SECTOR
PRIVATE SECTOR
TOTAL PUBLIC SECTOR
PRIVATE SECTOR
TOTAL PUBLIC SECTOR
PRIVATE SECTOR
TOTAL
1 2 3 4 5 6 7 8 9 1049 - - - - - - - - -50 - - - - - - - - -51 - - - - - - - - -52 - 102392 102392 - - - 65890 85149 7947453 - - - - - - - - -55 - - - - 66102 66102 - - -56 - - - - - - - - -58 - - - - - - - - -59 - - - - - - - - -60 - - - - - - - - -61 - - - - - - - - -62 - - - - - - - 56933 5693363 - - - - - - - - -64 - - - - - - - - -65 - - - - 74926 74926 - - -66 - - - - - - - - -68 - - - - - - - - -69 - - - - - - - - -70 - - - - - - - - -71 - - - - - - - - -72 - - - - - - - - -73 - - - - - - - - -74 - - - - - - - - -75 - - - - - - - - -77 - - - - - - - - -78 - - - - - - - - -79 - - - - - - - - -80 - - - - - - - - -81 - - - - - - - - -82 - - - - 76068 76068 - 108195 10819584 - - - - - - - - -85 - - - - - - - - -86 - - - - - - - - -87 - - - - - - - - -88 - - - - - - - - -90 - - - - - - - - -91 - - - - - - - - -92 - - - - - - - - -93 - - - - - - - - -94 - - - - - - - - -95 - - - - - - - - -96 - - - - - - - - -97 - - - - - - - - -98 - - - - - - - - -99 - - - - - - - - -
TOTAL - 86656 86656 - 78507 78507 73556 75929 75788Note:- -= Information not Reported
TABLE 5.2
NIC- 2008
4.Haryana 5. Himachal Pradesh 6. Jammu & Kashmir
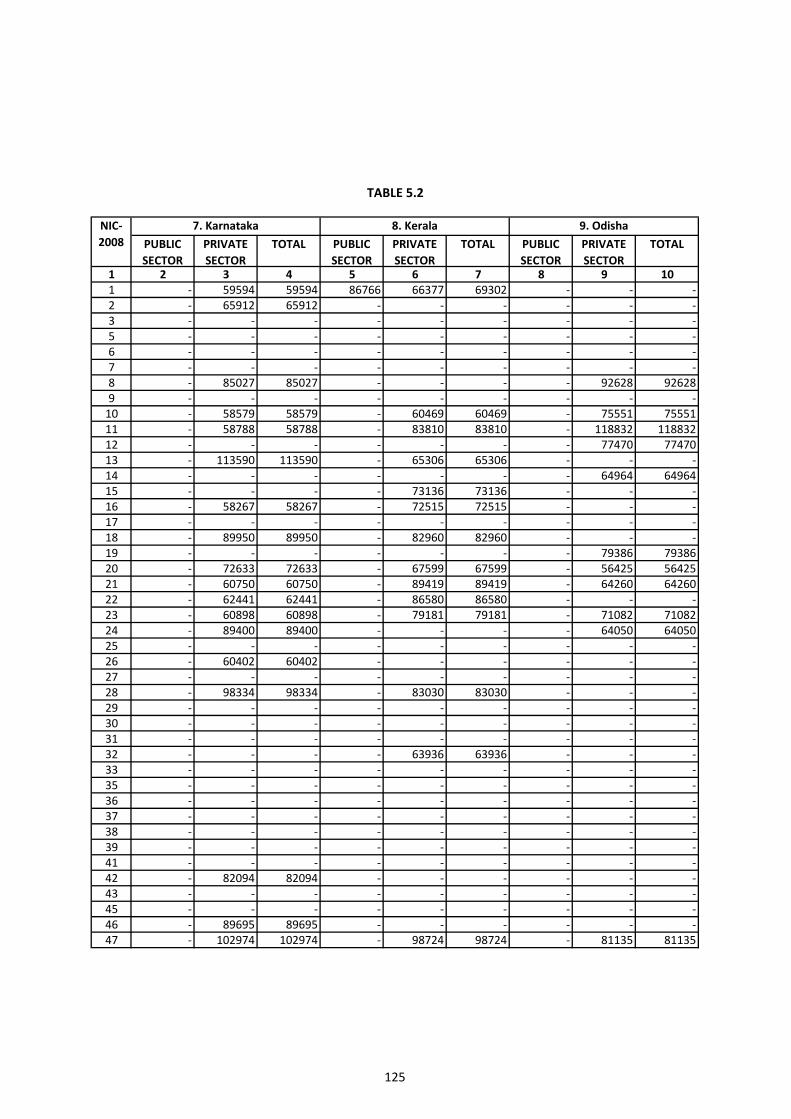
125
PUBLIC SECTOR
PRIVATE SECTOR
TOTAL PUBLIC SECTOR
PRIVATE SECTOR
TOTAL PUBLIC SECTOR
PRIVATE SECTOR
TOTAL
1 2 3 4 5 6 7 8 9 101 - 59594 59594 86766 66377 69302 - - -2 - 65912 65912 - - - - - -3 - - - - - - - - -5 - - - - - - - - -6 - - - - - - - - -7 - - - - - - - - -8 - 85027 85027 - - - - 92628 926289 - - - - - - - - -
10 - 58579 58579 - 60469 60469 - 75551 7555111 - 58788 58788 - 83810 83810 - 118832 11883212 - - - - - - - 77470 7747013 - 113590 113590 - 65306 65306 - - -14 - - - - - - - 64964 6496415 - - - - 73136 73136 - - -16 - 58267 58267 - 72515 72515 - - -17 - - - - - - - - -18 - 89950 89950 - 82960 82960 - - -19 - - - - - - - 79386 7938620 - 72633 72633 - 67599 67599 - 56425 5642521 - 60750 60750 - 89419 89419 - 64260 6426022 - 62441 62441 - 86580 86580 - - -23 - 60898 60898 - 79181 79181 - 71082 7108224 - 89400 89400 - - - - 64050 6405025 - - - - - - - - -26 - 60402 60402 - - - - - -27 - - - - - - - - -28 - 98334 98334 - 83030 83030 - - -29 - - - - - - - - -30 - - - - - - - - -31 - - - - - - - - -32 - - - - 63936 63936 - - -33 - - - - - - - - -35 - - - - - - - - -36 - - - - - - - - -37 - - - - - - - - -38 - - - - - - - - -39 - - - - - - - - -41 - - - - - - - - -42 - 82094 82094 - - - - - -43 - - - - - - - - -45 - - - - - - - - -46 - 89695 89695 - - - - - -47 - 102974 102974 - 98724 98724 - 81135 81135
TABLE 5.2
7. Karnataka 8. Kerala 9. OdishaNIC- 2008
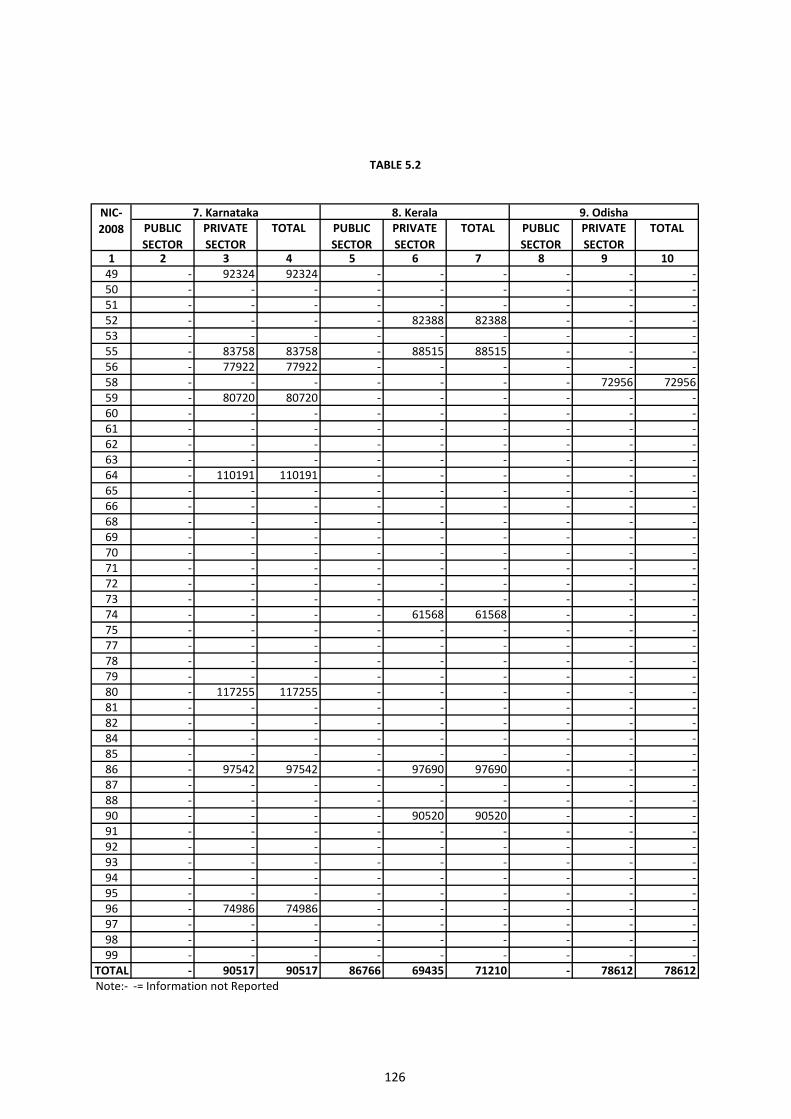
126
PUBLIC SECTOR
PRIVATE SECTOR
TOTAL PUBLIC SECTOR
PRIVATE SECTOR
TOTAL PUBLIC SECTOR
PRIVATE SECTOR
TOTAL
1 2 3 4 5 6 7 8 9 1049 - 92324 92324 - - - - - -50 - - - - - - - - -51 - - - - - - - - -52 - - - - 82388 82388 - - -53 - - - - - - - - -55 - 83758 83758 - 88515 88515 - - -56 - 77922 77922 - - - - - -58 - - - - - - - 72956 7295659 - 80720 80720 - - - - - -60 - - - - - - - - -61 - - - - - - - - -62 - - - - - - - - -63 - - - - - - - - -64 - 110191 110191 - - - - - -65 - - - - - - - - -66 - - - - - - - - -68 - - - - - - - - -69 - - - - - - - - -70 - - - - - - - - -71 - - - - - - - - -72 - - - - - - - - -73 - - - - - - - - -74 - - - - 61568 61568 - - -75 - - - - - - - - -77 - - - - - - - - -78 - - - - - - - - -79 - - - - - - - - -80 - 117255 117255 - - - - - -81 - - - - - - - - -82 - - - - - - - - -84 - - - - - - - - -85 - - - - - - - - -86 - 97542 97542 - 97690 97690 - - -87 - - - - - - - - -88 - - - - - - - - -90 - - - - 90520 90520 - - -91 - - - - - - - - -92 - - - - - - - - -93 - - - - - - - - -94 - - - - - - - - -95 - - - - - - - - -96 - 74986 74986 - - - - - -97 - - - - - - - - -98 - - - - - - - - -99 - - - - - - - - -
TOTAL - 90517 90517 86766 69435 71210 - 78612 78612Note:- -= Information not Reported
TABLE 5.2
NIC- 2008
7. Karnataka 8. Kerala 9. Odisha
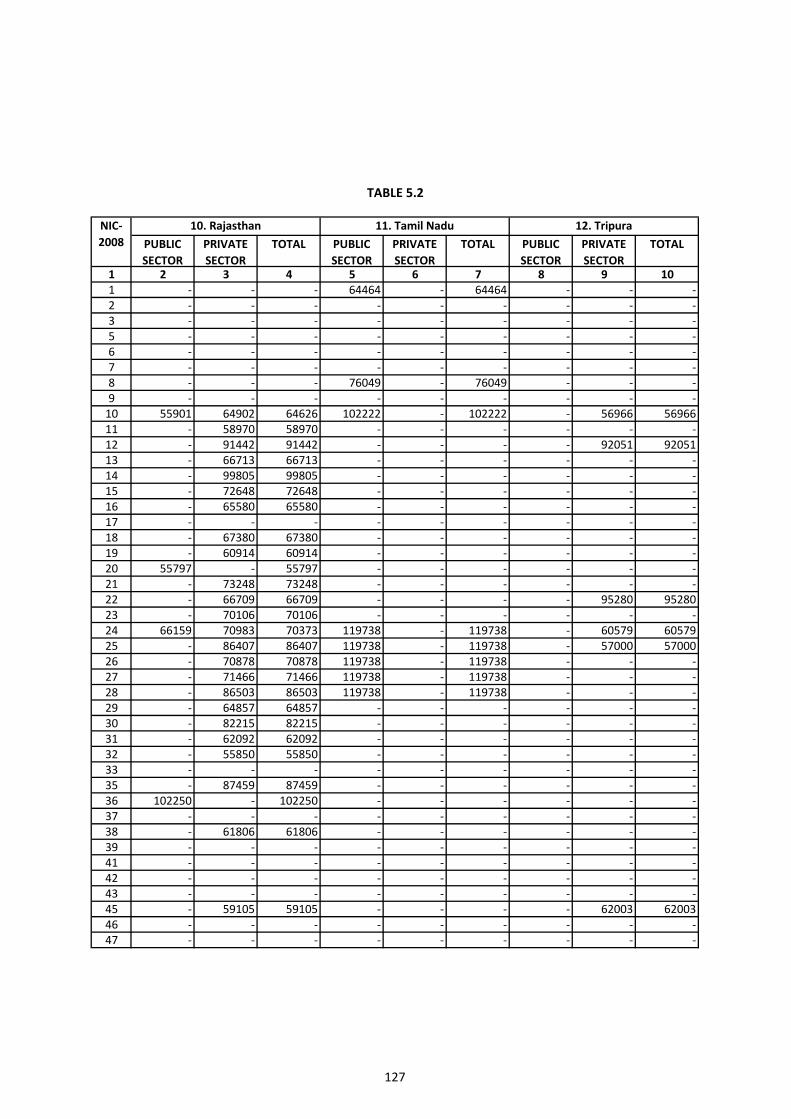
127
PUBLIC SECTOR
PRIVATE SECTOR
TOTAL PUBLIC SECTOR
PRIVATE SECTOR
TOTAL PUBLIC SECTOR
PRIVATE SECTOR
TOTAL
1 2 3 4 5 6 7 8 9 101 - - - 64464 - 64464 - - -2 - - - - - - - - -3 - - - - - - - - -5 - - - - - - - - -6 - - - - - - - - -7 - - - - - - - - -8 - - - 76049 - 76049 - - -9 - - - - - - - - -
10 55901 64902 64626 102222 - 102222 - 56966 5696611 - 58970 58970 - - - - - -12 - 91442 91442 - - - - 92051 9205113 - 66713 66713 - - - - - -14 - 99805 99805 - - - - - -15 - 72648 72648 - - - - - -16 - 65580 65580 - - - - - -17 - - - - - - - - -18 - 67380 67380 - - - - - -19 - 60914 60914 - - - - - -20 55797 - 55797 - - - - - -21 - 73248 73248 - - - - - -22 - 66709 66709 - - - - 95280 9528023 - 70106 70106 - - - - - -24 66159 70983 70373 119738 - 119738 - 60579 6057925 - 86407 86407 119738 - 119738 - 57000 5700026 - 70878 70878 119738 - 119738 - - -27 - 71466 71466 119738 - 119738 - - -28 - 86503 86503 119738 - 119738 - - -29 - 64857 64857 - - - - - -30 - 82215 82215 - - - - - -31 - 62092 62092 - - - - - -32 - 55850 55850 - - - - - -33 - - - - - - - - -35 - 87459 87459 - - - - - -36 102250 - 102250 - - - - - -37 - - - - - - - - -38 - 61806 61806 - - - - - -39 - - - - - - - - -41 - - - - - - - - -42 - - - - - - - - -43 - - - - - - - - -45 - 59105 59105 - - - - 62003 6200346 - - - - - - - - -47 - - - - - - - - -
TABLE 5.2
NIC- 2008
10. Rajasthan 12. Tripura11. Tamil Nadu
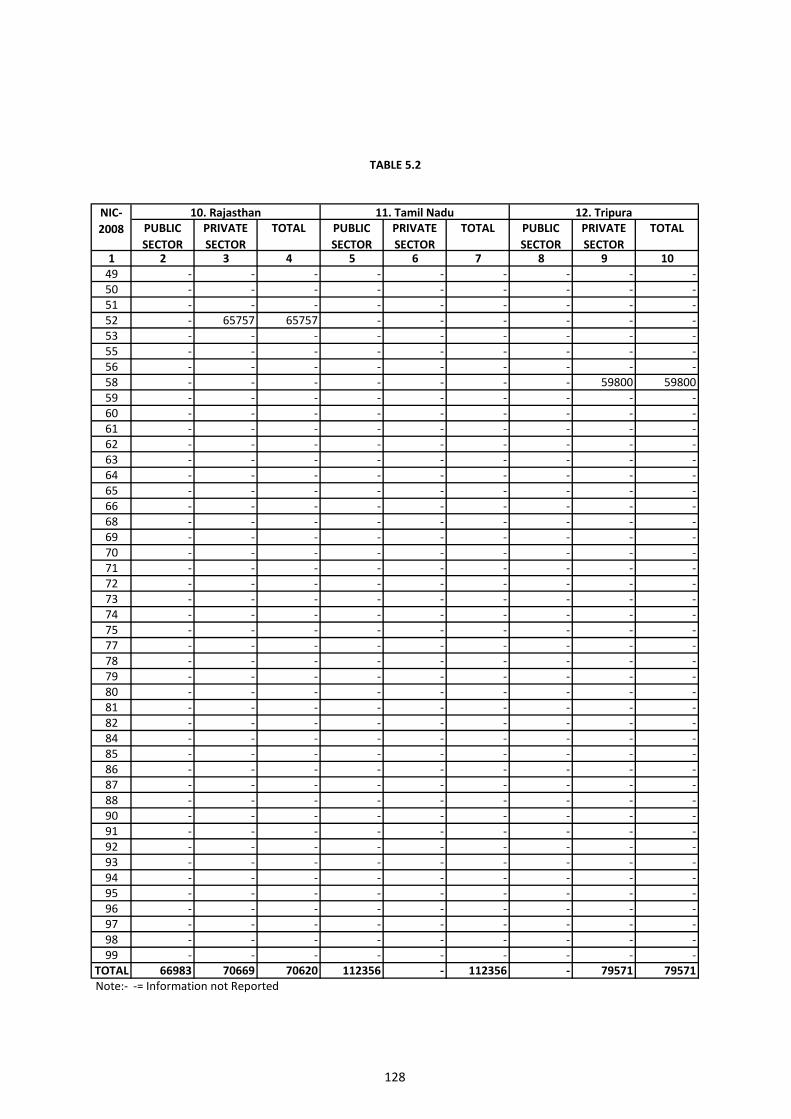
128
PUBLIC SECTOR
PRIVATE SECTOR
TOTAL PUBLIC SECTOR
PRIVATE SECTOR
TOTAL PUBLIC SECTOR
PRIVATE SECTOR
TOTAL
1 2 3 4 5 6 7 8 9 1049 - - - - - - - - -50 - - - - - - - - -51 - - - - - - - - -52 - 65757 65757 - - - - - -53 - - - - - - - - -55 - - - - - - - - -56 - - - - - - - - -58 - - - - - - - 59800 5980059 - - - - - - - - -60 - - - - - - - - -61 - - - - - - - - -62 - - - - - - - - -63 - - - - - - - - -64 - - - - - - - - -65 - - - - - - - - -66 - - - - - - - - -68 - - - - - - - - -69 - - - - - - - - -70 - - - - - - - - -71 - - - - - - - - -72 - - - - - - - - -73 - - - - - - - - -74 - - - - - - - - -75 - - - - - - - - -77 - - - - - - - - -78 - - - - - - - - -79 - - - - - - - - -80 - - - - - - - - -81 - - - - - - - - -82 - - - - - - - - -84 - - - - - - - - -85 - - - - - - - - -86 - - - - - - - - -87 - - - - - - - - -88 - - - - - - - - -90 - - - - - - - - -91 - - - - - - - - -92 - - - - - - - - -93 - - - - - - - - -94 - - - - - - - - -95 - - - - - - - - -96 - - - - - - - - -97 - - - - - - - - -98 - - - - - - - - -99 - - - - - - - - -
TOTAL 66983 70669 70620 112356 - 112356 - 79571 79571Note:- -= Information not Reported
TABLE 5.2
NIC- 2008
10. Rajasthan 11. Tamil Nadu 12. Tripura
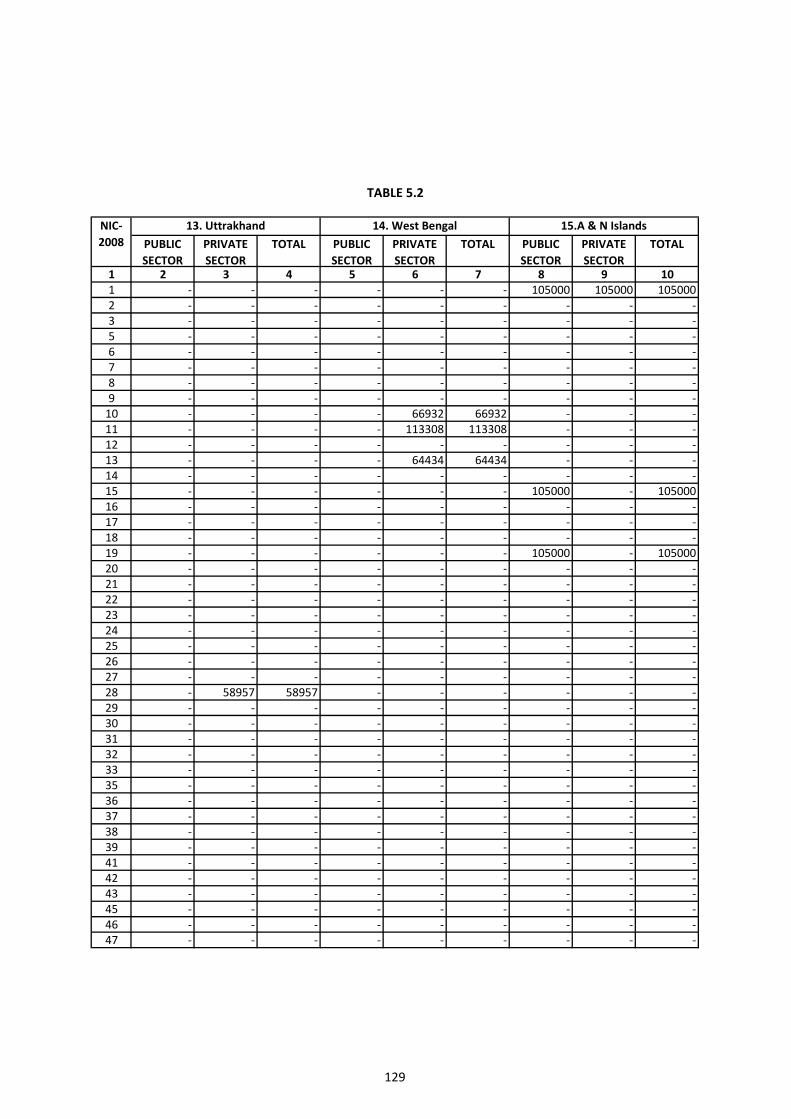
129
PUBLIC SECTOR
PRIVATE SECTOR
TOTAL PUBLIC SECTOR
PRIVATE SECTOR
TOTAL PUBLIC SECTOR
PRIVATE SECTOR
TOTAL
1 2 3 4 5 6 7 8 9 101 - - - - - - 105000 105000 1050002 - - - - - - - - -3 - - - - - - - - -5 - - - - - - - - -6 - - - - - - - - -7 - - - - - - - - -8 - - - - - - - - -9 - - - - - - - - -
10 - - - - 66932 66932 - - -11 - - - - 113308 113308 - - -12 - - - - - - - - -13 - - - - 64434 64434 - - -14 - - - - - - - - -15 - - - - - - 105000 - 10500016 - - - - - - - - -17 - - - - - - - - -18 - - - - - - - - -19 - - - - - - 105000 - 10500020 - - - - - - - - -21 - - - - - - - - -22 - - - - - - - - -23 - - - - - - - - -24 - - - - - - - - -25 - - - - - - - - -26 - - - - - - - - -27 - - - - - - - - -28 - 58957 58957 - - - - - -29 - - - - - - - - -30 - - - - - - - - -31 - - - - - - - - -32 - - - - - - - - -33 - - - - - - - - -35 - - - - - - - - -36 - - - - - - - - -37 - - - - - - - - -38 - - - - - - - - -39 - - - - - - - - -41 - - - - - - - - -42 - - - - - - - - -43 - - - - - - - - -45 - - - - - - - - -46 - - - - - - - - -47 - - - - - - - - -
TABLE 5.2
14. West Bengal 15.A & N Islands NIC- 2008
13. Uttrakhand
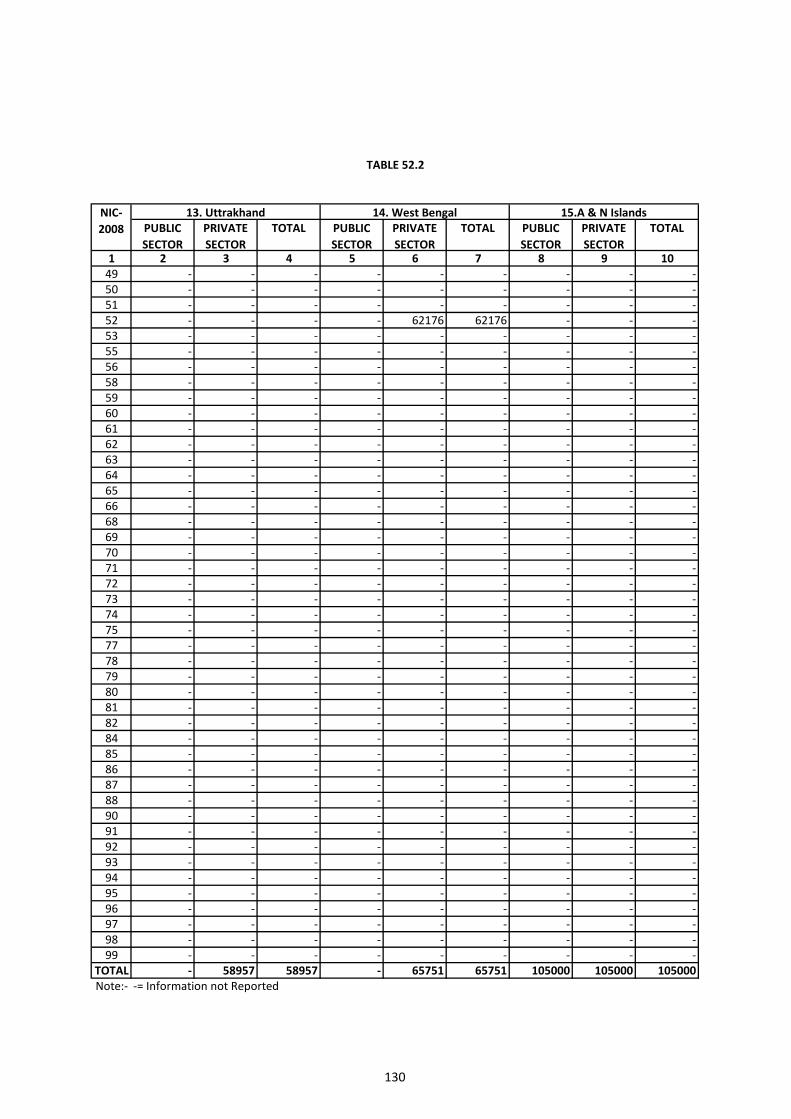
130
PUBLIC SECTOR
PRIVATE SECTOR
TOTAL PUBLIC SECTOR
PRIVATE SECTOR
TOTAL PUBLIC SECTOR
PRIVATE SECTOR
TOTAL
1 2 3 4 5 6 7 8 9 1049 - - - - - - - - -50 - - - - - - - - -51 - - - - - - - - -52 - - - - 62176 62176 - - -53 - - - - - - - - -55 - - - - - - - - -56 - - - - - - - - -58 - - - - - - - - -59 - - - - - - - - -60 - - - - - - - - -61 - - - - - - - - -62 - - - - - - - - -63 - - - - - - - - -64 - - - - - - - - -65 - - - - - - - - -66 - - - - - - - - -68 - - - - - - - - -69 - - - - - - - - -70 - - - - - - - - -71 - - - - - - - - -72 - - - - - - - - -73 - - - - - - - - -74 - - - - - - - - -75 - - - - - - - - -77 - - - - - - - - -78 - - - - - - - - -79 - - - - - - - - -80 - - - - - - - - -81 - - - - - - - - -82 - - - - - - - - -84 - - - - - - - - -85 - - - - - - - - -86 - - - - - - - - -87 - - - - - - - - -88 - - - - - - - - -90 - - - - - - - - -91 - - - - - - - - -92 - - - - - - - - -93 - - - - - - - - -94 - - - - - - - - -95 - - - - - - - - -96 - - - - - - - - -97 - - - - - - - - -98 - - - - - - - - -99 - - - - - - - - -
TOTAL - 58957 58957 - 65751 65751 105000 105000 105000Note:- -= Information not Reported
TABLE 52.2
NIC- 2008
13. Uttrakhand 14. West Bengal 15.A & N Islands
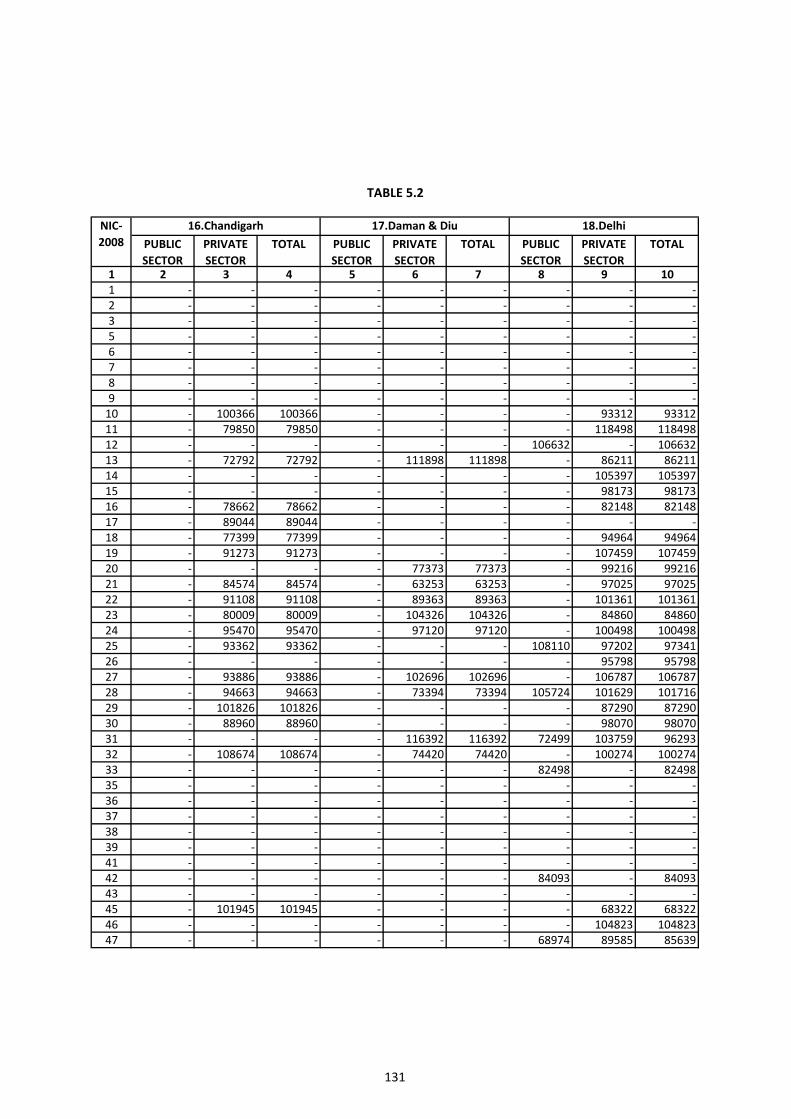
131
PUBLIC SECTOR
PRIVATE SECTOR
TOTAL PUBLIC SECTOR
PRIVATE SECTOR
TOTAL PUBLIC SECTOR
PRIVATE SECTOR
TOTAL
1 2 3 4 5 6 7 8 9 101 - - - - - - - - -2 - - - - - - - - -3 - - - - - - - - -5 - - - - - - - - -6 - - - - - - - - -7 - - - - - - - - -8 - - - - - - - - -9 - - - - - - - - -
10 - 100366 100366 - - - - 93312 9331211 - 79850 79850 - - - - 118498 11849812 - - - - - - 106632 - 10663213 - 72792 72792 - 111898 111898 - 86211 8621114 - - - - - - - 105397 10539715 - - - - - - - 98173 9817316 - 78662 78662 - - - - 82148 8214817 - 89044 89044 - - - - - -18 - 77399 77399 - - - - 94964 9496419 - 91273 91273 - - - - 107459 10745920 - - - - 77373 77373 - 99216 9921621 - 84574 84574 - 63253 63253 - 97025 9702522 - 91108 91108 - 89363 89363 - 101361 10136123 - 80009 80009 - 104326 104326 - 84860 8486024 - 95470 95470 - 97120 97120 - 100498 10049825 - 93362 93362 - - - 108110 97202 9734126 - - - - - - - 95798 9579827 - 93886 93886 - 102696 102696 - 106787 10678728 - 94663 94663 - 73394 73394 105724 101629 10171629 - 101826 101826 - - - - 87290 8729030 - 88960 88960 - - - - 98070 9807031 - - - - 116392 116392 72499 103759 9629332 - 108674 108674 - 74420 74420 - 100274 10027433 - - - - - - 82498 - 8249835 - - - - - - - - -36 - - - - - - - - -37 - - - - - - - - -38 - - - - - - - - -39 - - - - - - - - -41 - - - - - - - - -42 - - - - - - 84093 - 8409343 - - - - - - - - -45 - 101945 101945 - - - - 68322 6832246 - - - - - - - 104823 10482347 - - - - - - 68974 89585 85639
16.Chandigarh 17.Daman & DiuNIC- 2008
TABLE 5.2
18.Delhi
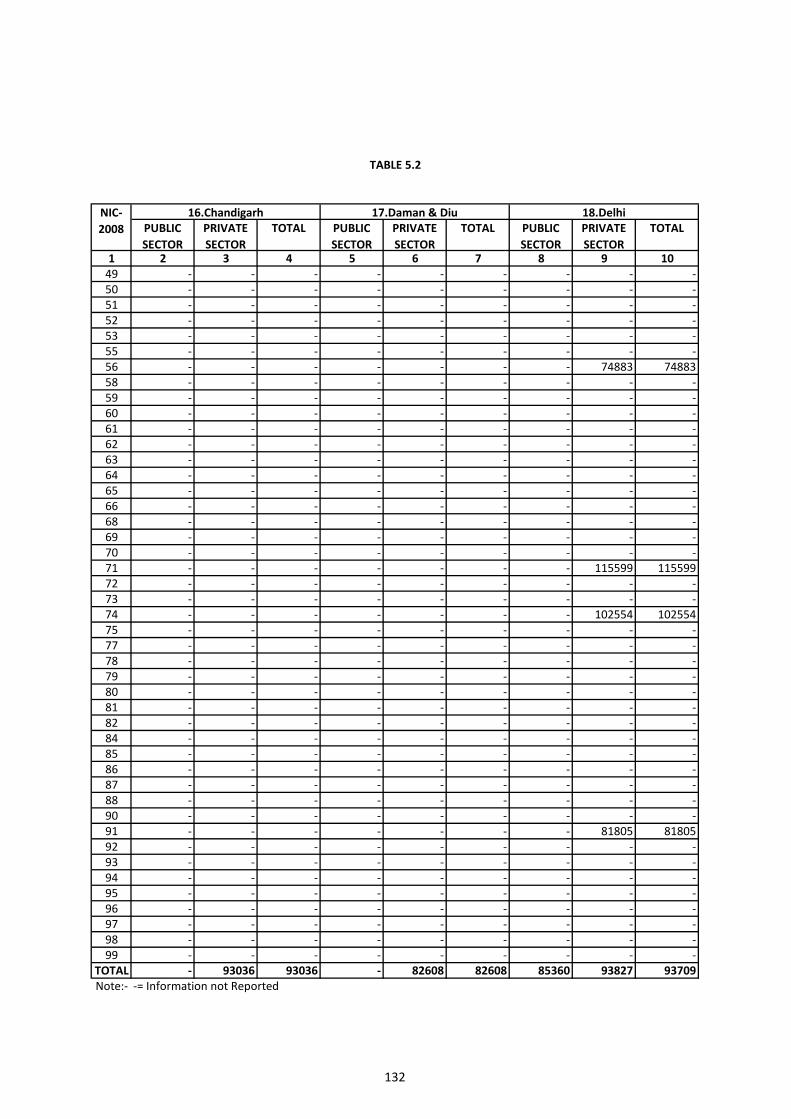
132
PUBLIC SECTOR
PRIVATE SECTOR
TOTAL PUBLIC SECTOR
PRIVATE SECTOR
TOTAL PUBLIC SECTOR
PRIVATE SECTOR
TOTAL
1 2 3 4 5 6 7 8 9 1049 - - - - - - - - -50 - - - - - - - - -51 - - - - - - - - -52 - - - - - - - - -53 - - - - - - - - -55 - - - - - - - - -56 - - - - - - - 74883 7488358 - - - - - - - - -59 - - - - - - - - -60 - - - - - - - - -61 - - - - - - - - -62 - - - - - - - - -63 - - - - - - - - -64 - - - - - - - - -65 - - - - - - - - -66 - - - - - - - - -68 - - - - - - - - -69 - - - - - - - - -70 - - - - - - - - -71 - - - - - - - 115599 11559972 - - - - - - - - -73 - - - - - - - - -74 - - - - - - - 102554 10255475 - - - - - - - - -77 - - - - - - - - -78 - - - - - - - - -79 - - - - - - - - -80 - - - - - - - - -81 - - - - - - - - -82 - - - - - - - - -84 - - - - - - - - -85 - - - - - - - - -86 - - - - - - - - -87 - - - - - - - - -88 - - - - - - - - -90 - - - - - - - - -91 - - - - - - - 81805 8180592 - - - - - - - - -93 - - - - - - - - -94 - - - - - - - - -95 - - - - - - - - -96 - - - - - - - - -97 - - - - - - - - -98 - - - - - - - - -99 - - - - - - - - -
TOTAL - 93036 93036 - 82608 82608 85360 93827 93709Note:- -= Information not Reported
NIC- 2008
16.Chandigarh 17.Daman & Diu 18.Delhi
TABLE 5.2
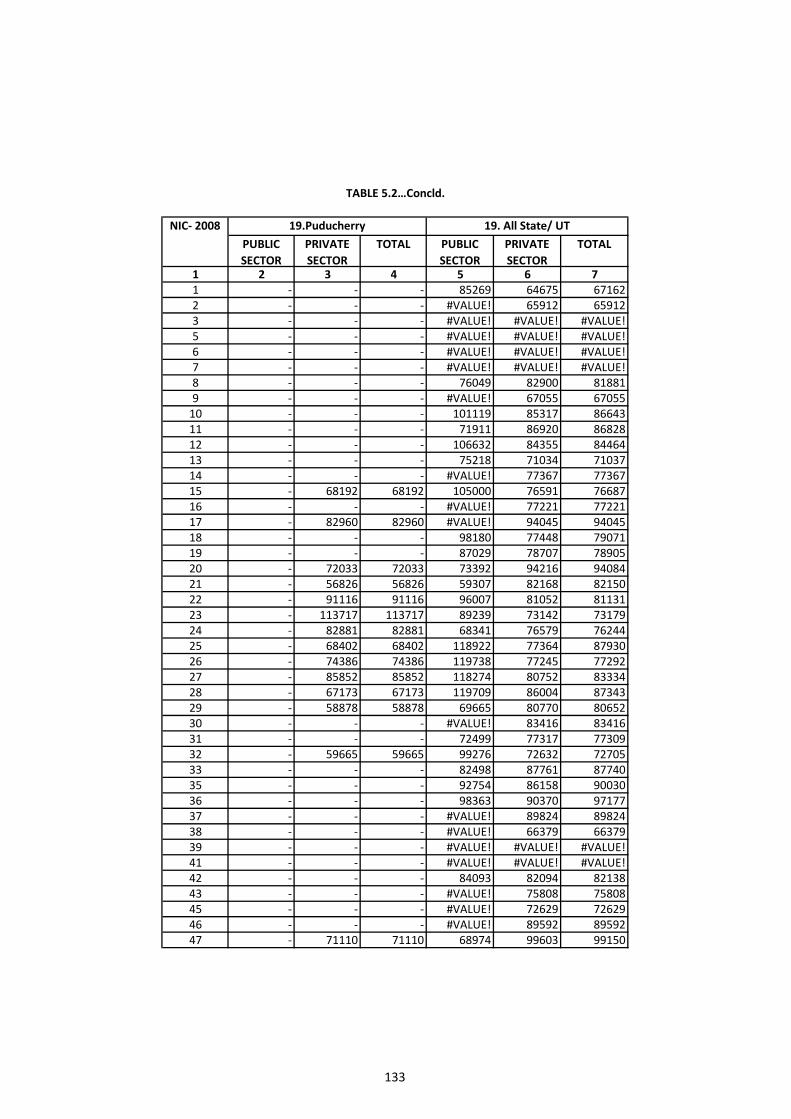
133
PUBLIC SECTOR
PRIVATE SECTOR
TOTAL PUBLIC SECTOR
PRIVATE SECTOR
TOTAL
1 2 3 4 5 6 71 - - - 85269 64675 671622 - - - #VALUE! 65912 659123 - - - #VALUE! #VALUE! #VALUE!5 - - - #VALUE! #VALUE! #VALUE!6 - - - #VALUE! #VALUE! #VALUE!7 - - - #VALUE! #VALUE! #VALUE!8 - - - 76049 82900 818819 - - - #VALUE! 67055 67055
10 - - - 101119 85317 8664311 - - - 71911 86920 8682812 - - - 106632 84355 8446413 - - - 75218 71034 7103714 - - - #VALUE! 77367 7736715 - 68192 68192 105000 76591 7668716 - - - #VALUE! 77221 7722117 - 82960 82960 #VALUE! 94045 9404518 - - - 98180 77448 7907119 - - - 87029 78707 7890520 - 72033 72033 73392 94216 9408421 - 56826 56826 59307 82168 8215022 - 91116 91116 96007 81052 8113123 - 113717 113717 89239 73142 7317924 - 82881 82881 68341 76579 7624425 - 68402 68402 118922 77364 8793026 - 74386 74386 119738 77245 7729227 - 85852 85852 118274 80752 8333428 - 67173 67173 119709 86004 8734329 - 58878 58878 69665 80770 8065230 - - - #VALUE! 83416 8341631 - - - 72499 77317 7730932 - 59665 59665 99276 72632 7270533 - - - 82498 87761 8774035 - - - 92754 86158 9003036 - - - 98363 90370 9717737 - - - #VALUE! 89824 8982438 - - - #VALUE! 66379 6637939 - - - #VALUE! #VALUE! #VALUE!41 - - - #VALUE! #VALUE! #VALUE!42 - - - 84093 82094 8213843 - - - #VALUE! 75808 7580845 - - - #VALUE! 72629 7262946 - - - #VALUE! 89592 8959247 - 71110 71110 68974 99603 99150
TABLE 5.2…Concld.
NIC- 2008 19.Puducherry 19. All State/ UT
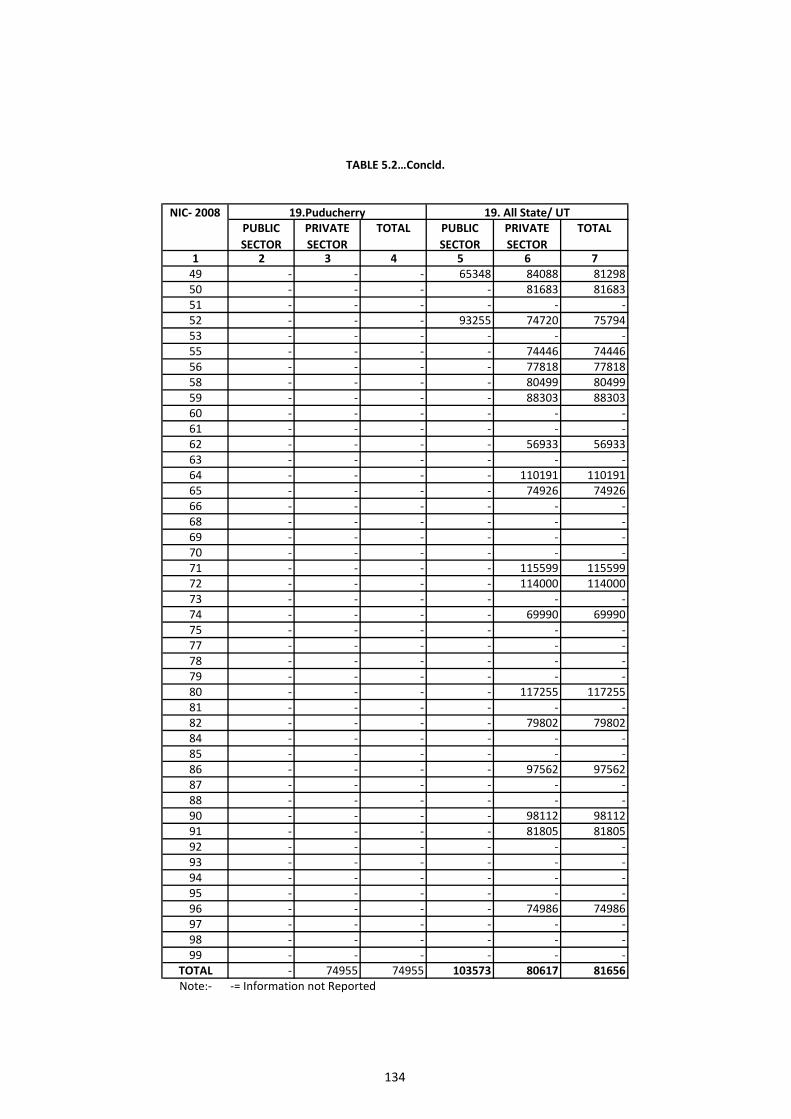
134
PUBLIC SECTOR
PRIVATE SECTOR
TOTAL PUBLIC SECTOR
PRIVATE SECTOR
TOTAL
1 2 3 4 5 6 749 - - - 65348 84088 8129850 - - - - 81683 8168351 - - - - - -52 - - - 93255 74720 7579453 - - - - - -55 - - - - 74446 7444656 - - - - 77818 7781858 - - - - 80499 8049959 - - - - 88303 8830360 - - - - - -61 - - - - - -62 - - - - 56933 5693363 - - - - - -64 - - - - 110191 11019165 - - - - 74926 7492666 - - - - - -68 - - - - - -69 - - - - - -70 - - - - - -71 - - - - 115599 11559972 - - - - 114000 11400073 - - - - - -74 - - - - 69990 6999075 - - - - - -77 - - - - - -78 - - - - - -79 - - - - - -80 - - - - 117255 11725581 - - - - - -82 - - - - 79802 7980284 - - - - - -85 - - - - - -86 - - - - 97562 9756287 - - - - - -88 - - - - - -90 - - - - 98112 9811291 - - - - 81805 8180592 - - - - - -93 - - - - - -94 - - - - - -95 - - - - - -96 - - - - 74986 7498697 - - - - - -98 - - - - - -99 - - - - - -
TOTAL - 74955 74955 103573 80617 81656Note:- -= Information not Reported
19.Puducherry 19. All State/ UTNIC- 2008
TABLE 5.2…Concld.
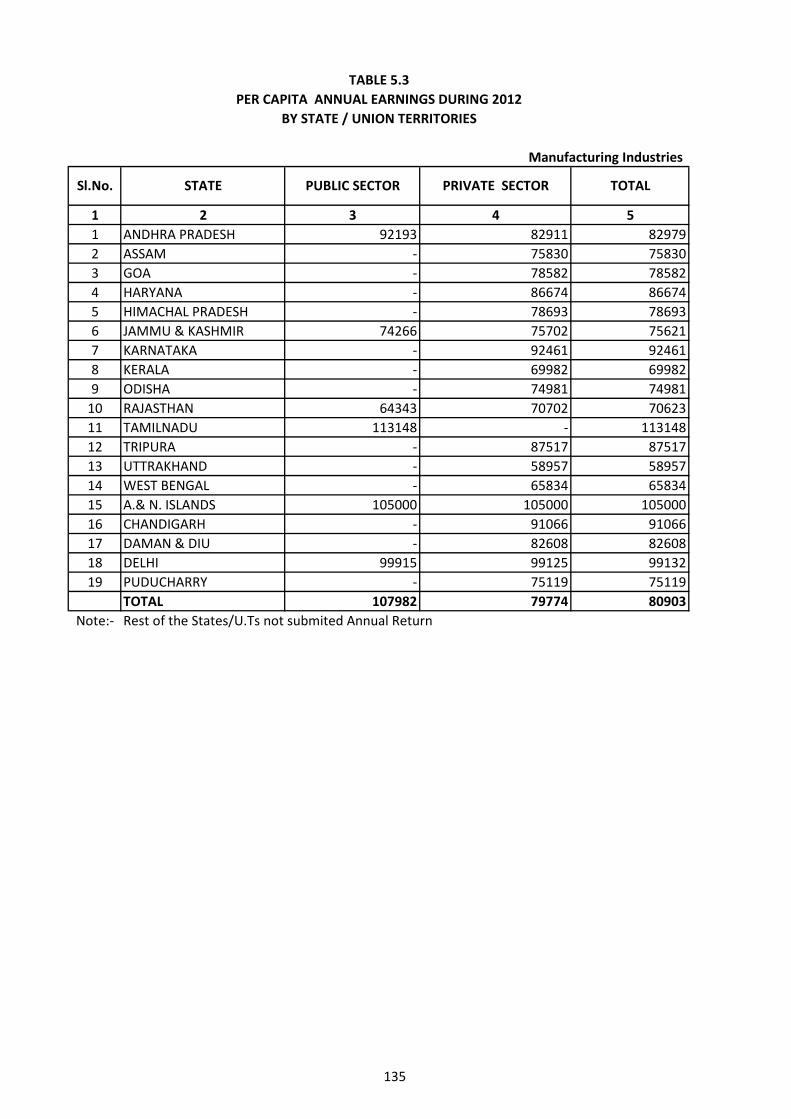
135
1 2 3 4 51 ANDHRA PRADESH 92193 82911 829792 ASSAM - 75830 758303 GOA - 78582 785824 HARYANA - 86674 866745 HIMACHAL PRADESH - 78693 786936 JAMMU & KASHMIR 74266 75702 756217 KARNATAKA - 92461 924618 KERALA - 69982 699829 ODISHA - 74981 74981
10 RAJASTHAN 64343 70702 7062311 TAMILNADU 113148 - 11314812 TRIPURA - 87517 8751713 UTTRAKHAND - 58957 5895714 WEST BENGAL - 65834 6583415 A.& N. ISLANDS 105000 105000 10500016 CHANDIGARH - 91066 9106617 DAMAN & DIU - 82608 8260818 DELHI 99915 99125 9913219 PUDUCHARRY - 75119 75119
TOTAL 107982 79774 80903Note:- Rest of the States/U.Ts not submited Annual Return
TABLE 5.3 PER CAPITA ANNUAL EARNINGS DURING 2012
BY STATE / UNION TERRITORIES
Manufacturing Industries
Sl.No. STATE PUBLIC SECTOR PRIVATE SECTOR TOTAL
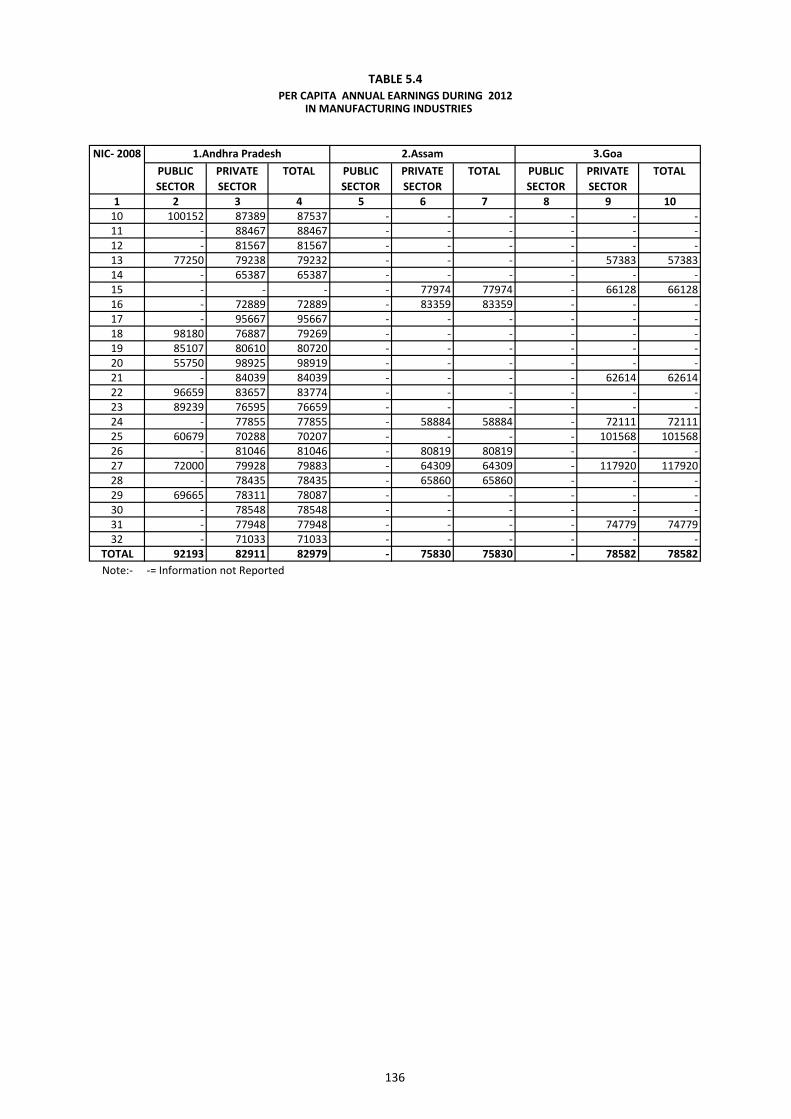
136
PUBLIC SECTOR
PRIVATE SECTOR
TOTAL PUBLIC SECTOR
PRIVATE SECTOR
TOTAL PUBLIC SECTOR
PRIVATE SECTOR
TOTAL
1 2 3 4 5 6 7 8 9 1010 100152 87389 87537 - - - - - -11 - 88467 88467 - - - - - -12 - 81567 81567 - - - - - -13 77250 79238 79232 - - - - 57383 5738314 - 65387 65387 - - - - - -15 - - - - 77974 77974 - 66128 6612816 - 72889 72889 - 83359 83359 - - -17 - 95667 95667 - - - - - -18 98180 76887 79269 - - - - - -19 85107 80610 80720 - - - - - -20 55750 98925 98919 - - - - - -21 - 84039 84039 - - - - 62614 6261422 96659 83657 83774 - - - - - -23 89239 76595 76659 - - - - - -24 - 77855 77855 - 58884 58884 - 72111 7211125 60679 70288 70207 - - - - 101568 10156826 - 81046 81046 - 80819 80819 - - -27 72000 79928 79883 - 64309 64309 - 117920 11792028 - 78435 78435 - 65860 65860 - - -29 69665 78311 78087 - - - - - -30 - 78548 78548 - - - - - -31 - 77948 77948 - - - - 74779 7477932 - 71033 71033 - - - - - -
TOTAL 92193 82911 82979 - 75830 75830 - 78582 78582Note:- -= Information not Reported
TABLE 5.4 PER CAPITA ANNUAL EARNINGS DURING 2012
IN MANUFACTURING INDUSTRIES
NIC- 2008 1.Andhra Pradesh 2.Assam 3.Goa
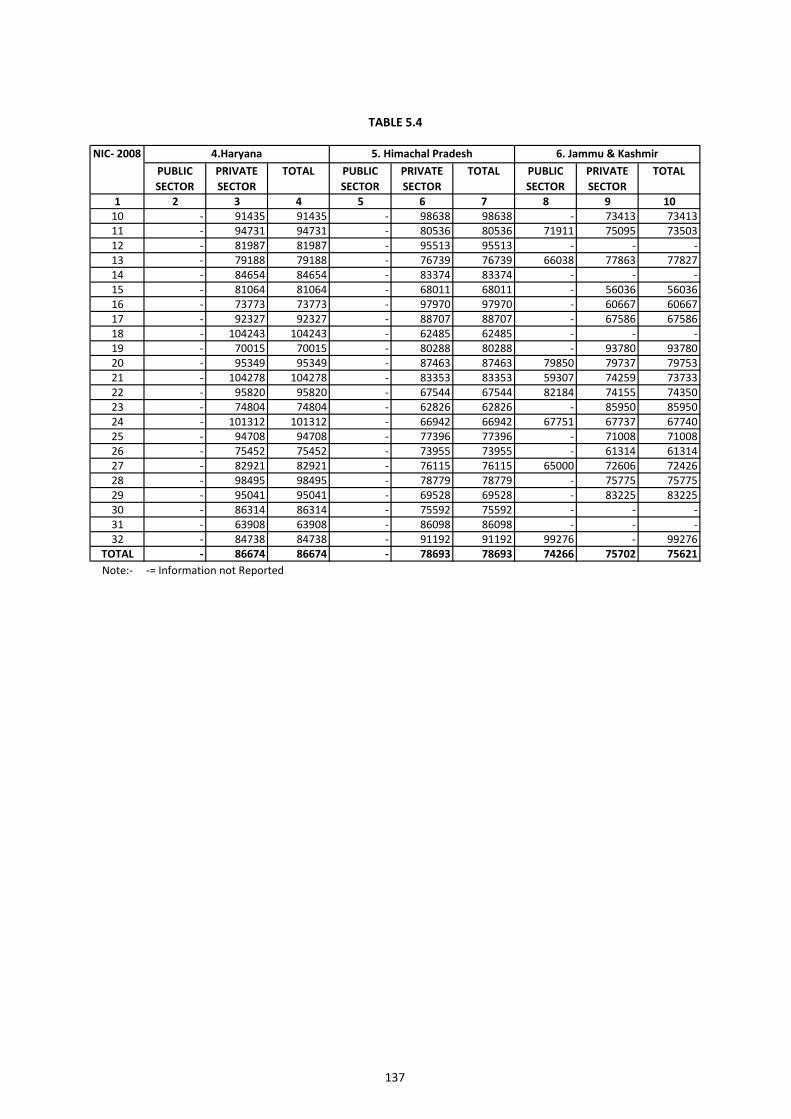
137
PUBLIC SECTOR
PRIVATE SECTOR
TOTAL PUBLIC SECTOR
PRIVATE SECTOR
TOTAL PUBLIC SECTOR
PRIVATE SECTOR
TOTAL
1 2 3 4 5 6 7 8 9 1010 - 91435 91435 - 98638 98638 - 73413 7341311 - 94731 94731 - 80536 80536 71911 75095 7350312 - 81987 81987 - 95513 95513 - - -13 - 79188 79188 - 76739 76739 66038 77863 7782714 - 84654 84654 - 83374 83374 - - -15 - 81064 81064 - 68011 68011 - 56036 5603616 - 73773 73773 - 97970 97970 - 60667 6066717 - 92327 92327 - 88707 88707 - 67586 6758618 - 104243 104243 - 62485 62485 - - -19 - 70015 70015 - 80288 80288 - 93780 9378020 - 95349 95349 - 87463 87463 79850 79737 7975321 - 104278 104278 - 83353 83353 59307 74259 7373322 - 95820 95820 - 67544 67544 82184 74155 7435023 - 74804 74804 - 62826 62826 - 85950 8595024 - 101312 101312 - 66942 66942 67751 67737 6774025 - 94708 94708 - 77396 77396 - 71008 7100826 - 75452 75452 - 73955 73955 - 61314 6131427 - 82921 82921 - 76115 76115 65000 72606 7242628 - 98495 98495 - 78779 78779 - 75775 7577529 - 95041 95041 - 69528 69528 - 83225 8322530 - 86314 86314 - 75592 75592 - - -31 - 63908 63908 - 86098 86098 - - -32 - 84738 84738 - 91192 91192 99276 - 99276
TOTAL - 86674 86674 - 78693 78693 74266 75702 75621Note:- -= Information not Reported
TABLE 5.4
NIC- 2008 4.Haryana 5. Himachal Pradesh 6. Jammu & Kashmir
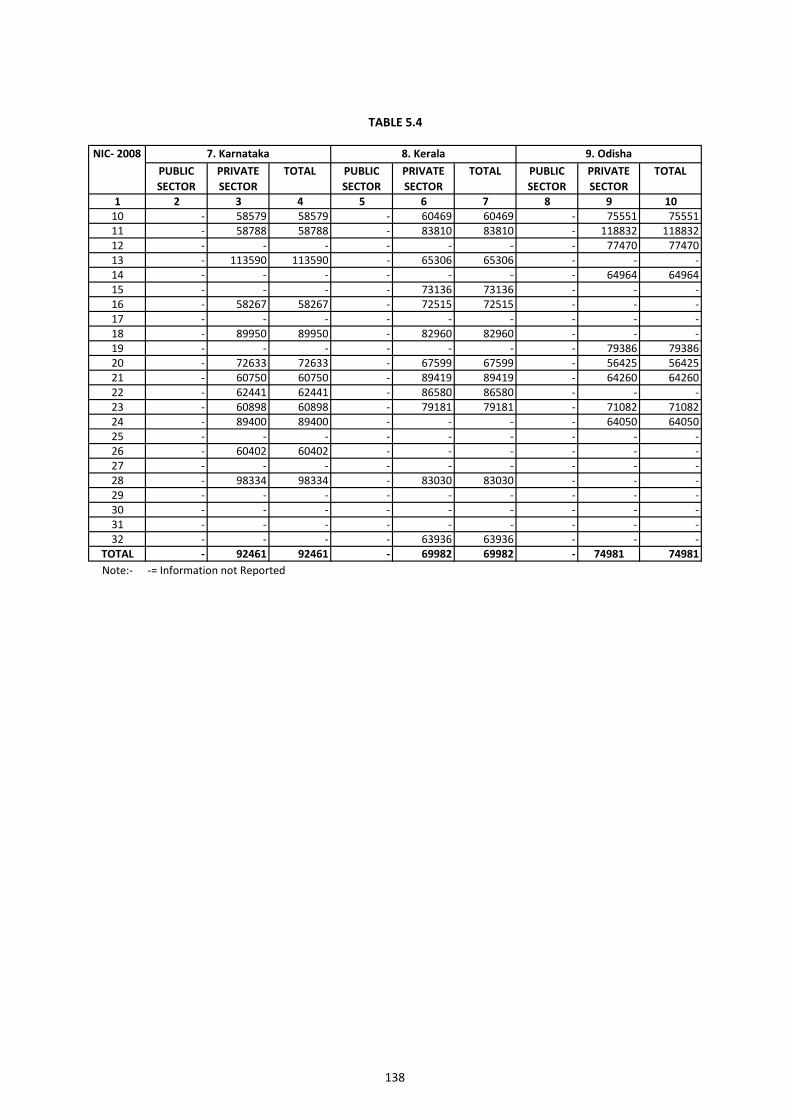
138
PUBLIC SECTOR
PRIVATE SECTOR
TOTAL PUBLIC SECTOR
PRIVATE SECTOR
TOTAL PUBLIC SECTOR
PRIVATE SECTOR
TOTAL
1 2 3 4 5 6 7 8 9 1010 - 58579 58579 - 60469 60469 - 75551 7555111 - 58788 58788 - 83810 83810 - 118832 11883212 - - - - - - - 77470 7747013 - 113590 113590 - 65306 65306 - - -14 - - - - - - - 64964 6496415 - - - - 73136 73136 - - -16 - 58267 58267 - 72515 72515 - - -17 - - - - - - - - -18 - 89950 89950 - 82960 82960 - - -19 - - - - - - - 79386 7938620 - 72633 72633 - 67599 67599 - 56425 5642521 - 60750 60750 - 89419 89419 - 64260 6426022 - 62441 62441 - 86580 86580 - - -23 - 60898 60898 - 79181 79181 - 71082 7108224 - 89400 89400 - - - - 64050 6405025 - - - - - - - - -26 - 60402 60402 - - - - - -27 - - - - - - - - -28 - 98334 98334 - 83030 83030 - - -29 - - - - - - - - -30 - - - - - - - - -31 - - - - - - - - -32 - - - - 63936 63936 - - -
TOTAL - 92461 92461 - 69982 69982 - 74981 74981Note:- -= Information not Reported
TABLE 5.4
NIC- 2008 7. Karnataka 8. Kerala 9. Odisha
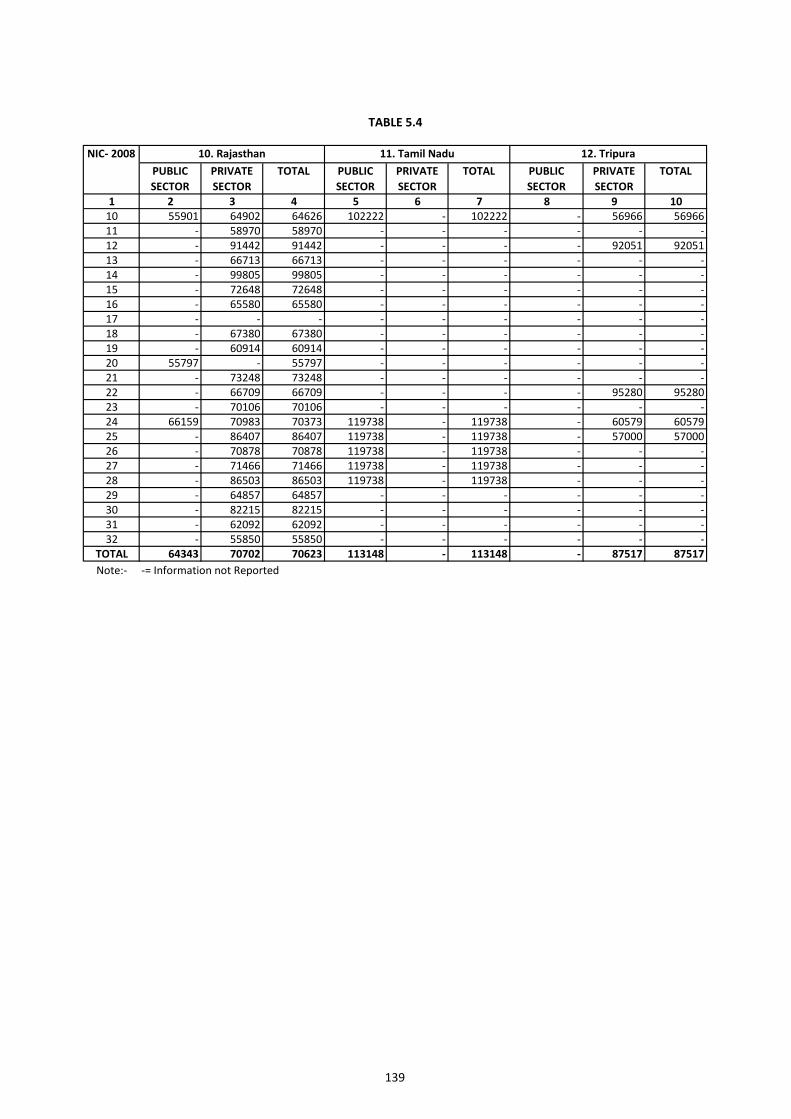
139
PUBLIC SECTOR
PRIVATE SECTOR
TOTAL PUBLIC SECTOR
PRIVATE SECTOR
TOTAL PUBLIC SECTOR
PRIVATE SECTOR
TOTAL
1 2 3 4 5 6 7 8 9 1010 55901 64902 64626 102222 - 102222 - 56966 5696611 - 58970 58970 - - - - - -12 - 91442 91442 - - - - 92051 9205113 - 66713 66713 - - - - - -14 - 99805 99805 - - - - - -15 - 72648 72648 - - - - - -16 - 65580 65580 - - - - - -17 - - - - - - - - -18 - 67380 67380 - - - - - -19 - 60914 60914 - - - - - -20 55797 - 55797 - - - - - -21 - 73248 73248 - - - - - -22 - 66709 66709 - - - - 95280 9528023 - 70106 70106 - - - - - -24 66159 70983 70373 119738 - 119738 - 60579 6057925 - 86407 86407 119738 - 119738 - 57000 5700026 - 70878 70878 119738 - 119738 - - -27 - 71466 71466 119738 - 119738 - - -28 - 86503 86503 119738 - 119738 - - -29 - 64857 64857 - - - - - -30 - 82215 82215 - - - - - -31 - 62092 62092 - - - - - -32 - 55850 55850 - - - - - -
TOTAL 64343 70702 70623 113148 - 113148 - 87517 87517Note:- -= Information not Reported
TABLE 5.4
11. Tamil NaduNIC- 2008 10. Rajasthan 12. Tripura
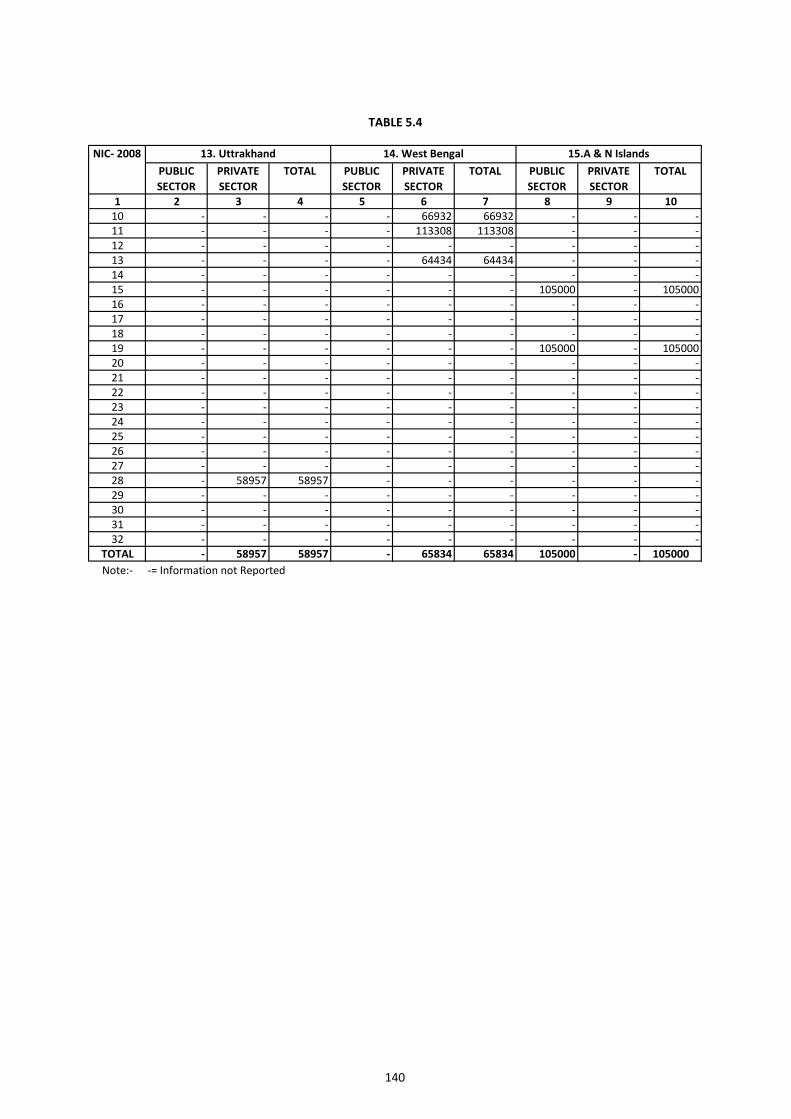
140
PUBLIC SECTOR
PRIVATE SECTOR
TOTAL PUBLIC SECTOR
PRIVATE SECTOR
TOTAL PUBLIC SECTOR
PRIVATE SECTOR
TOTAL
1 2 3 4 5 6 7 8 9 1010 - - - - 66932 66932 - - -11 - - - - 113308 113308 - - -12 - - - - - - - - -13 - - - - 64434 64434 - - -14 - - - - - - - - -15 - - - - - - 105000 - 10500016 - - - - - - - - -17 - - - - - - - - -18 - - - - - - - - -19 - - - - - - 105000 - 10500020 - - - - - - - - -21 - - - - - - - - -22 - - - - - - - - -23 - - - - - - - - -24 - - - - - - - - -25 - - - - - - - - -26 - - - - - - - - -27 - - - - - - - - -28 - 58957 58957 - - - - - -29 - - - - - - - - -30 - - - - - - - - -31 - - - - - - - - -32 - - - - - - - - -
TOTAL - 58957 58957 - 65834 65834 105000 - 105000Note:- -= Information not Reported
TABLE 5.4
NIC- 2008 13. Uttrakhand 14. West Bengal 15.A & N Islands
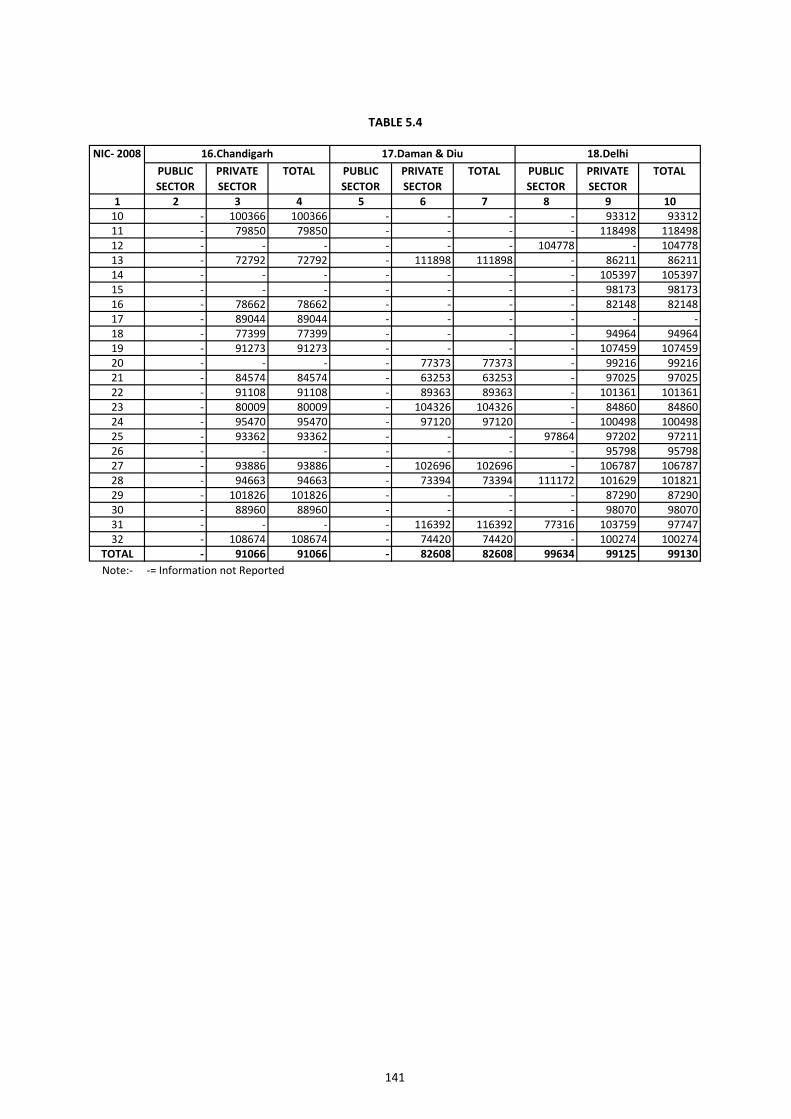
141
PUBLIC SECTOR
PRIVATE SECTOR
TOTAL PUBLIC SECTOR
PRIVATE SECTOR
TOTAL PUBLIC SECTOR
PRIVATE SECTOR
TOTAL
1 2 3 4 5 6 7 8 9 1010 - 100366 100366 - - - - 93312 9331211 - 79850 79850 - - - - 118498 11849812 - - - - - - 104778 - 10477813 - 72792 72792 - 111898 111898 - 86211 8621114 - - - - - - - 105397 10539715 - - - - - - - 98173 9817316 - 78662 78662 - - - - 82148 8214817 - 89044 89044 - - - - - -18 - 77399 77399 - - - - 94964 9496419 - 91273 91273 - - - - 107459 10745920 - - - - 77373 77373 - 99216 9921621 - 84574 84574 - 63253 63253 - 97025 9702522 - 91108 91108 - 89363 89363 - 101361 10136123 - 80009 80009 - 104326 104326 - 84860 8486024 - 95470 95470 - 97120 97120 - 100498 10049825 - 93362 93362 - - - 97864 97202 9721126 - - - - - - - 95798 9579827 - 93886 93886 - 102696 102696 - 106787 10678728 - 94663 94663 - 73394 73394 111172 101629 10182129 - 101826 101826 - - - - 87290 8729030 - 88960 88960 - - - - 98070 9807031 - - - - 116392 116392 77316 103759 9774732 - 108674 108674 - 74420 74420 - 100274 100274
TOTAL - 91066 91066 - 82608 82608 99634 99125 99130Note:- -= Information not Reported
16.Chandigarh 17.Daman & Diu 18.Delhi
TABLE 5.4
NIC- 2008
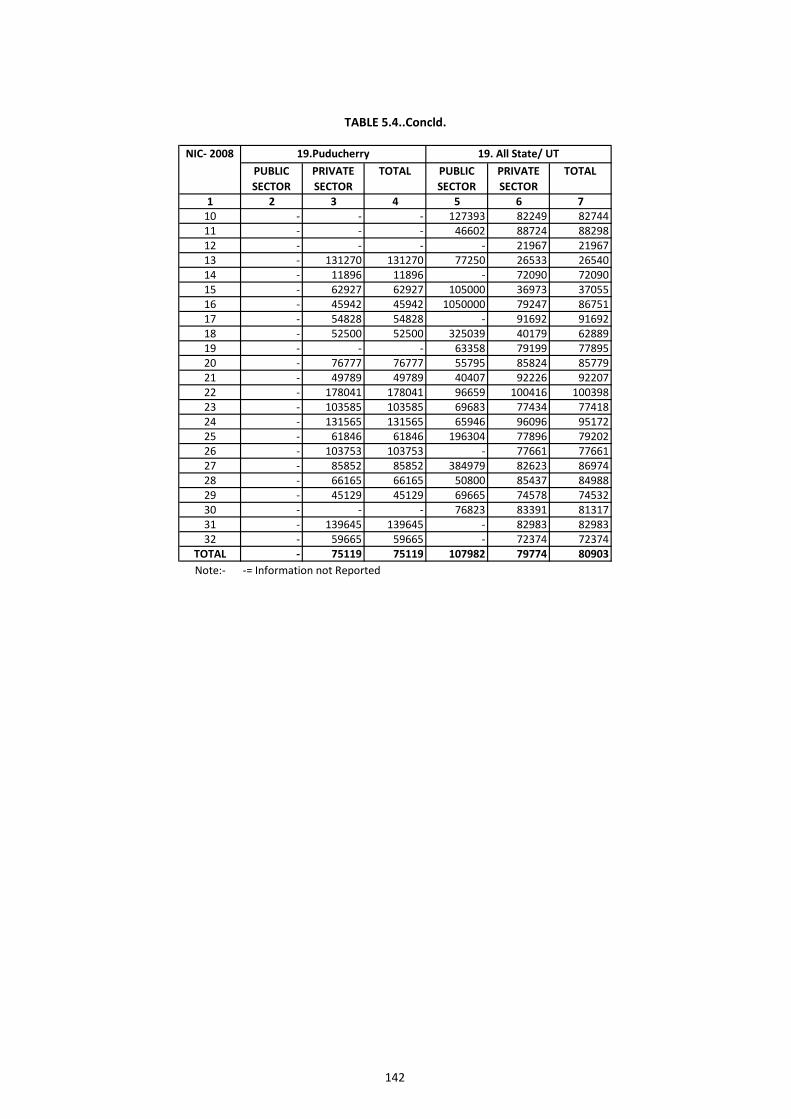
142
PUBLIC SECTOR
PRIVATE SECTOR
TOTAL PUBLIC SECTOR
PRIVATE SECTOR
TOTAL
1 2 3 4 5 6 710 - - - 127393 82249 8274411 - - - 46602 88724 8829812 - - - - 21967 2196713 - 131270 131270 77250 26533 2654014 - 11896 11896 - 72090 7209015 - 62927 62927 105000 36973 3705516 - 45942 45942 1050000 79247 8675117 - 54828 54828 - 91692 9169218 - 52500 52500 325039 40179 6288919 - - - 63358 79199 7789520 - 76777 76777 55795 85824 8577921 - 49789 49789 40407 92226 9220722 - 178041 178041 96659 100416 10039823 - 103585 103585 69683 77434 7741824 - 131565 131565 65946 96096 9517225 - 61846 61846 196304 77896 7920226 - 103753 103753 - 77661 7766127 - 85852 85852 384979 82623 8697428 - 66165 66165 50800 85437 8498829 - 45129 45129 69665 74578 7453230 - - - 76823 83391 8131731 - 139645 139645 - 82983 8298332 - 59665 59665 - 72374 72374
TOTAL - 75119 75119 107982 79774 80903Note:- -= Information not Reported
TABLE 5.4..Concld.
NIC- 2008 19.Puducherry 19. All State/ UT
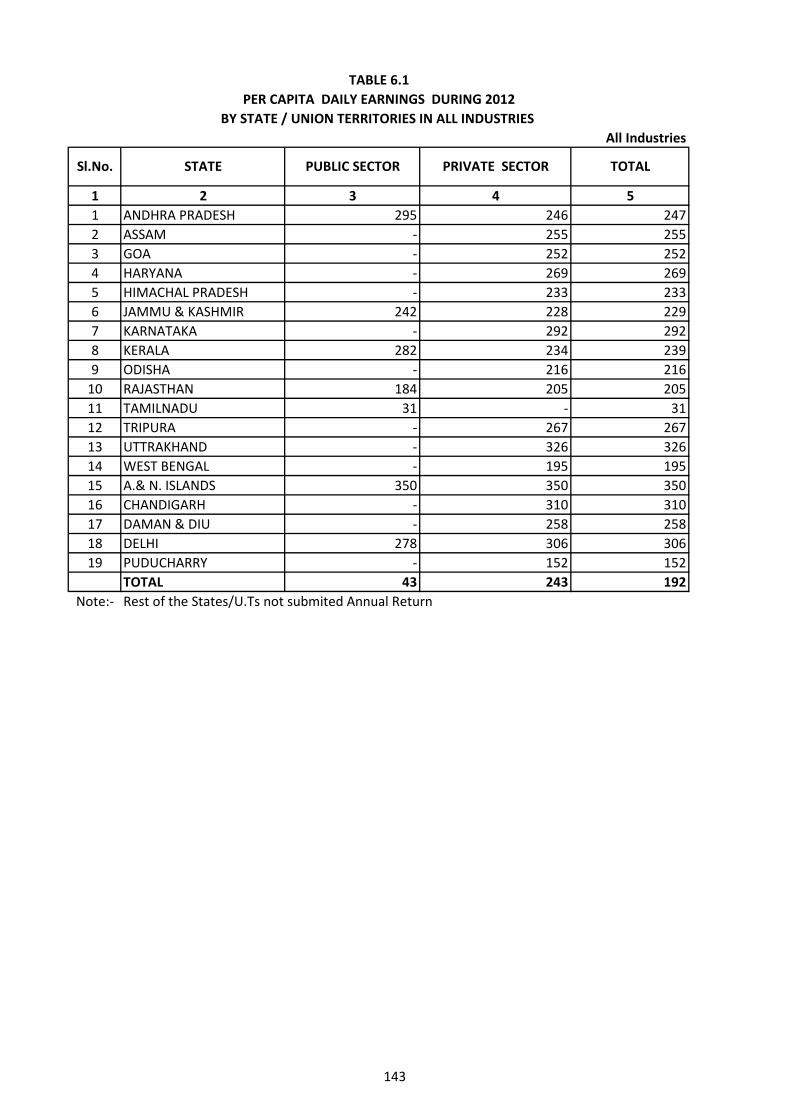
143
1 2 3 4 51 ANDHRA PRADESH 295 246 2472 ASSAM - 255 2553 GOA - 252 2524 HARYANA - 269 2695 HIMACHAL PRADESH - 233 2336 JAMMU & KASHMIR 242 228 2297 KARNATAKA - 292 2928 KERALA 282 234 2399 ODISHA - 216 216
10 RAJASTHAN 184 205 20511 TAMILNADU 31 - 3112 TRIPURA - 267 26713 UTTRAKHAND - 326 32614 WEST BENGAL - 195 19515 A.& N. ISLANDS 350 350 35016 CHANDIGARH - 310 31017 DAMAN & DIU - 258 25818 DELHI 278 306 30619 PUDUCHARRY - 152 152
TOTAL 43 243 192Note:- Rest of the States/U.Ts not submited Annual Return
TABLE 6.1 PER CAPITA DAILY EARNINGS DURING 2012
BY STATE / UNION TERRITORIES IN ALL INDUSTRIES All Industries
Sl.No. STATE PUBLIC SECTOR PRIVATE SECTOR TOTAL
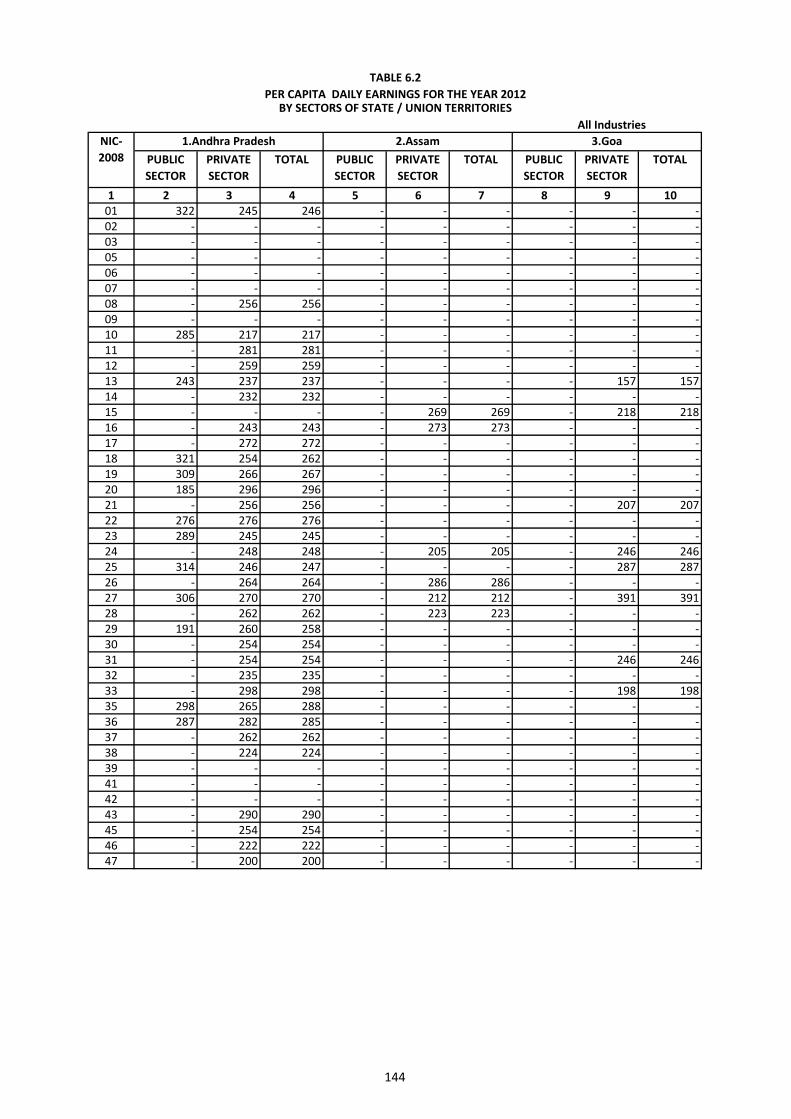
144
All Industries
PUBLIC SECTOR
PRIVATE SECTOR
TOTAL PUBLIC SECTOR
PRIVATE SECTOR
TOTAL PUBLIC SECTOR
PRIVATE SECTOR
TOTAL
1 2 3 4 5 6 7 8 9 1001 322 245 246 - - - - - -02 - - - - - - - - -03 - - - - - - - - -05 - - - - - - - - -06 - - - - - - - - -07 - - - - - - - - -08 - 256 256 - - - - - -09 - - - - - - - - -10 285 217 217 - - - - - -11 - 281 281 - - - - - -12 - 259 259 - - - - - -13 243 237 237 - - - - 157 15714 - 232 232 - - - - - -15 - - - - 269 269 - 218 21816 - 243 243 - 273 273 - - -17 - 272 272 - - - - - -18 321 254 262 - - - - - -19 309 266 267 - - - - - -20 185 296 296 - - - - - -21 - 256 256 - - - - 207 20722 276 276 276 - - - - - -23 289 245 245 - - - - - -24 - 248 248 - 205 205 - 246 24625 314 246 247 - - - - 287 28726 - 264 264 - 286 286 - - -27 306 270 270 - 212 212 - 391 39128 - 262 262 - 223 223 - - -29 191 260 258 - - - - - -30 - 254 254 - - - - - -31 - 254 254 - - - - 246 24632 - 235 235 - - - - - -33 - 298 298 - - - - 198 19835 298 265 288 - - - - - -36 287 282 285 - - - - - -37 - 262 262 - - - - - -38 - 224 224 - - - - - -39 - - - - - - - - -41 - - - - - - - - -42 - - - - - - - - -43 - 290 290 - - - - - -45 - 254 254 - - - - - -46 - 222 222 - - - - - -47 - 200 200 - - - - - -
TABLE 6.2 PER CAPITA DAILY EARNINGS FOR THE YEAR 2012
BY SECTORS OF STATE / UNION TERRITORIES
NIC- 2008
1.Andhra Pradesh 2.Assam 3.Goa
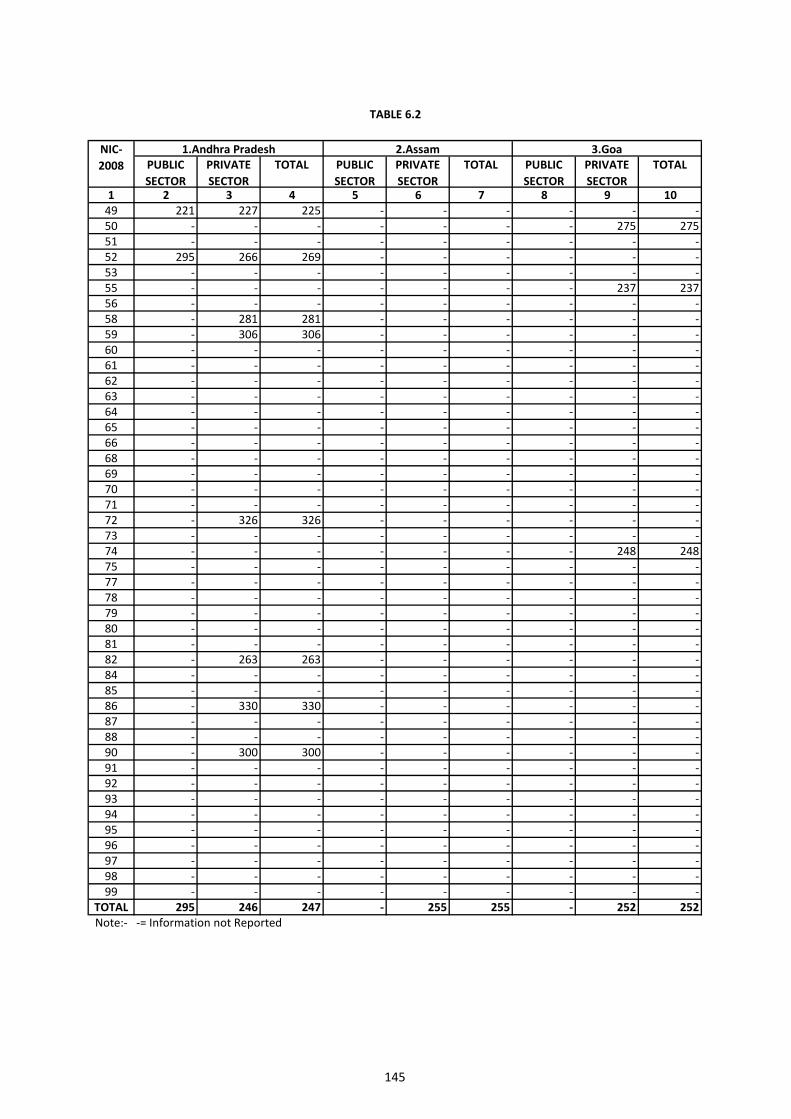
145
PUBLIC SECTOR
PRIVATE SECTOR
TOTAL PUBLIC SECTOR
PRIVATE SECTOR
TOTAL PUBLIC SECTOR
PRIVATE SECTOR
TOTAL
1 2 3 4 5 6 7 8 9 1049 221 227 225 - - - - - -50 - - - - - - - 275 27551 - - - - - - - - -52 295 266 269 - - - - - -53 - - - - - - - - -55 - - - - - - - 237 23756 - - - - - - - - -58 - 281 281 - - - - - -59 - 306 306 - - - - - -60 - - - - - - - - -61 - - - - - - - - -62 - - - - - - - - -63 - - - - - - - - -64 - - - - - - - - -65 - - - - - - - - -66 - - - - - - - - -68 - - - - - - - - -69 - - - - - - - - -70 - - - - - - - - -71 - - - - - - - - -72 - 326 326 - - - - - -73 - - - - - - - - -74 - - - - - - - 248 24875 - - - - - - - - -77 - - - - - - - - -78 - - - - - - - - -79 - - - - - - - - -80 - - - - - - - - -81 - - - - - - - - -82 - 263 263 - - - - - -84 - - - - - - - - -85 - - - - - - - - -86 - 330 330 - - - - - -87 - - - - - - - - -88 - - - - - - - - -90 - 300 300 - - - - - -91 - - - - - - - - -92 - - - - - - - - -93 - - - - - - - - -94 - - - - - - - - -95 - - - - - - - - -96 - - - - - - - - -97 - - - - - - - - -98 - - - - - - - - -99 - - - - - - - - -
TOTAL 295 246 247 - 255 255 - 252 252Note:- -= Information not Reported
TABLE 6.2
NIC- 2008
1.Andhra Pradesh 2.Assam 3.Goa
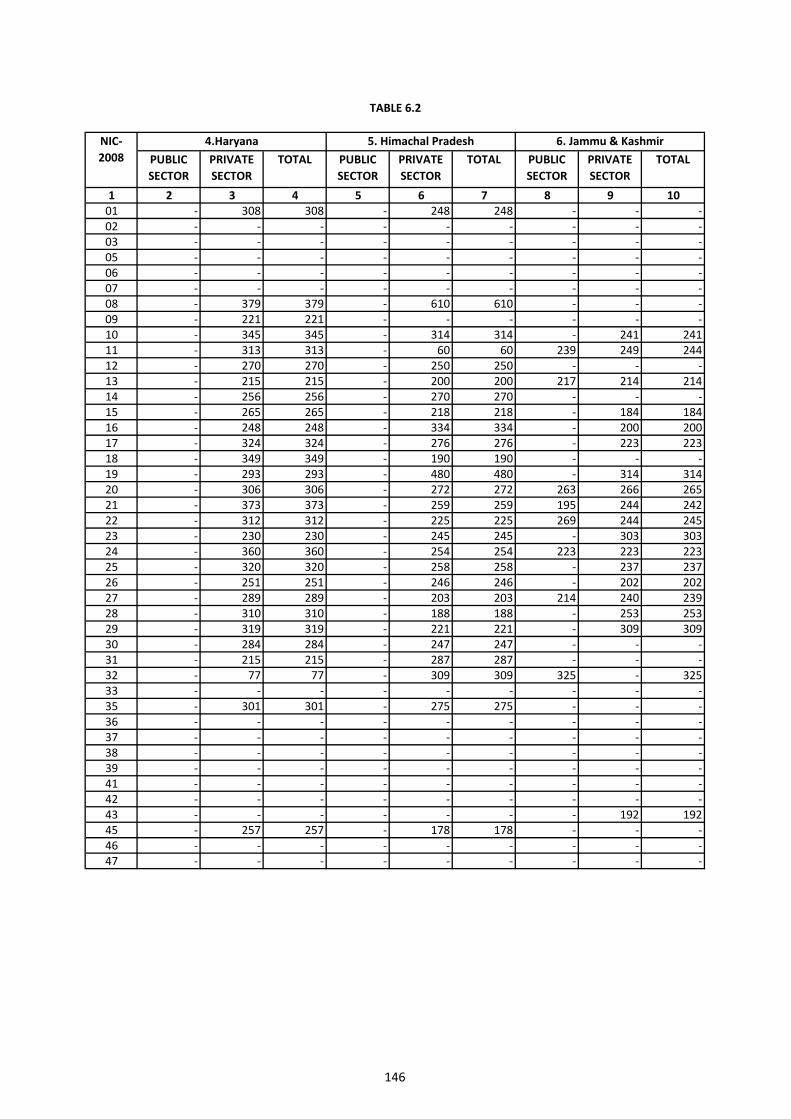
146
PUBLIC SECTOR
PRIVATE SECTOR
TOTAL PUBLIC SECTOR
PRIVATE SECTOR
TOTAL PUBLIC SECTOR
PRIVATE SECTOR
TOTAL
1 2 3 4 5 6 7 8 9 1001 - 308 308 - 248 248 - - -02 - - - - - - - - -03 - - - - - - - - -05 - - - - - - - - -06 - - - - - - - - -07 - - - - - - - - -08 - 379 379 - 610 610 - - -09 - 221 221 - - - - - -10 - 345 345 - 314 314 - 241 24111 - 313 313 - 60 60 239 249 24412 - 270 270 - 250 250 - - -13 - 215 215 - 200 200 217 214 21414 - 256 256 - 270 270 - - -15 - 265 265 - 218 218 - 184 18416 - 248 248 - 334 334 - 200 20017 - 324 324 - 276 276 - 223 22318 - 349 349 - 190 190 - - -19 - 293 293 - 480 480 - 314 31420 - 306 306 - 272 272 263 266 26521 - 373 373 - 259 259 195 244 24222 - 312 312 - 225 225 269 244 24523 - 230 230 - 245 245 - 303 30324 - 360 360 - 254 254 223 223 22325 - 320 320 - 258 258 - 237 23726 - 251 251 - 246 246 - 202 20227 - 289 289 - 203 203 214 240 23928 - 310 310 - 188 188 - 253 25329 - 319 319 - 221 221 - 309 30930 - 284 284 - 247 247 - - -31 - 215 215 - 287 287 - - -32 - 77 77 - 309 309 325 - 32533 - - - - - - - - -35 - 301 301 - 275 275 - - -36 - - - - - - - - -37 - - - - - - - - -38 - - - - - - - - -39 - - - - - - - - -41 - - - - - - - - -42 - - - - - - - - -43 - - - - - - - 192 19245 - 257 257 - 178 178 - - -46 - - - - - - - - -47 - - - - - - - - -
4.Haryana 5. Himachal Pradesh 6. Jammu & Kashmir
TABLE 6.2
NIC- 2008
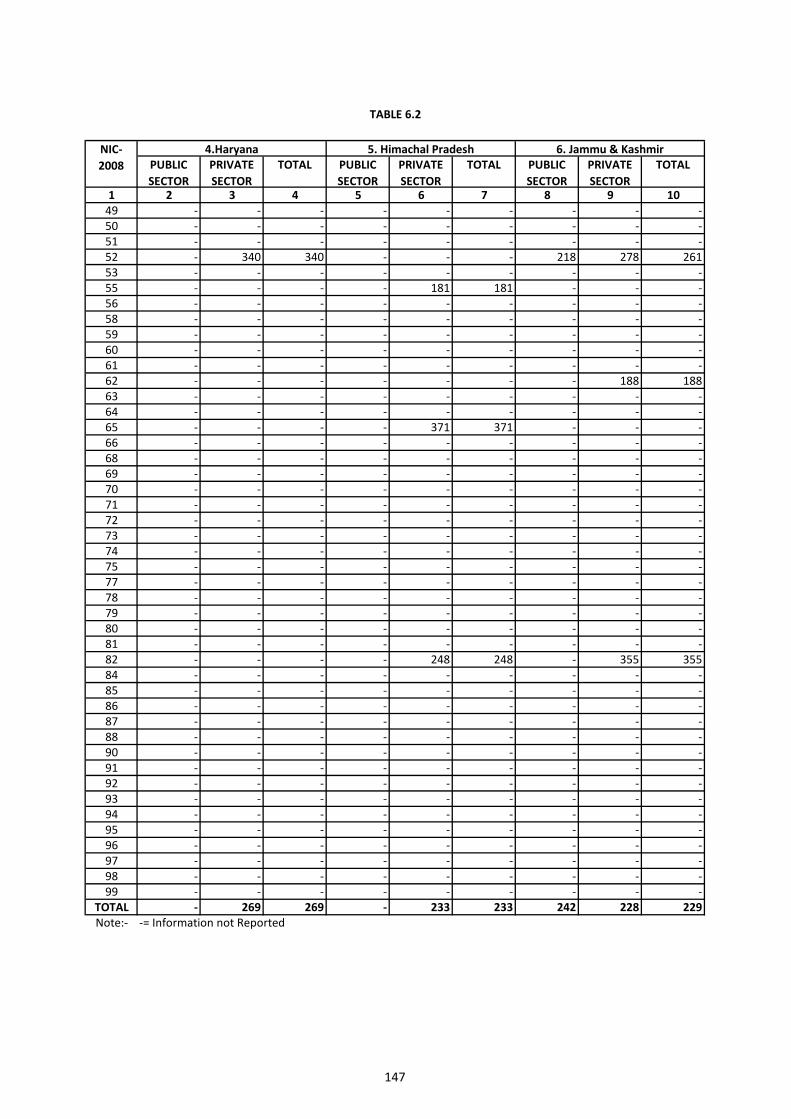
147
PUBLIC SECTOR
PRIVATE SECTOR
TOTAL PUBLIC SECTOR
PRIVATE SECTOR
TOTAL PUBLIC SECTOR
PRIVATE SECTOR
TOTAL
1 2 3 4 5 6 7 8 9 1049 - - - - - - - - -50 - - - - - - - - -51 - - - - - - - - -52 - 340 340 - - - 218 278 26153 - - - - - - - - -55 - - - - 181 181 - - -56 - - - - - - - - -58 - - - - - - - - -59 - - - - - - - - -60 - - - - - - - - -61 - - - - - - - - -62 - - - - - - - 188 18863 - - - - - - - - -64 - - - - - - - - -65 - - - - 371 371 - - -66 - - - - - - - - -68 - - - - - - - - -69 - - - - - - - - -70 - - - - - - - - -71 - - - - - - - - -72 - - - - - - - - -73 - - - - - - - - -74 - - - - - - - - -75 - - - - - - - - -77 - - - - - - - - -78 - - - - - - - - -79 - - - - - - - - -80 - - - - - - - - -81 - - - - - - - - -82 - - - - 248 248 - 355 35584 - - - - - - - - -85 - - - - - - - - -86 - - - - - - - - -87 - - - - - - - - -88 - - - - - - - - -90 - - - - - - - - -91 - - - - - - - - -92 - - - - - - - - -93 - - - - - - - - -94 - - - - - - - - -95 - - - - - - - - -96 - - - - - - - - -97 - - - - - - - - -98 - - - - - - - - -99 - - - - - - - - -
TOTAL - 269 269 - 233 233 242 228 229Note:- -= Information not Reported
TABLE 6.2
4.Haryana 5. Himachal Pradesh 6. Jammu & KashmirNIC- 2008
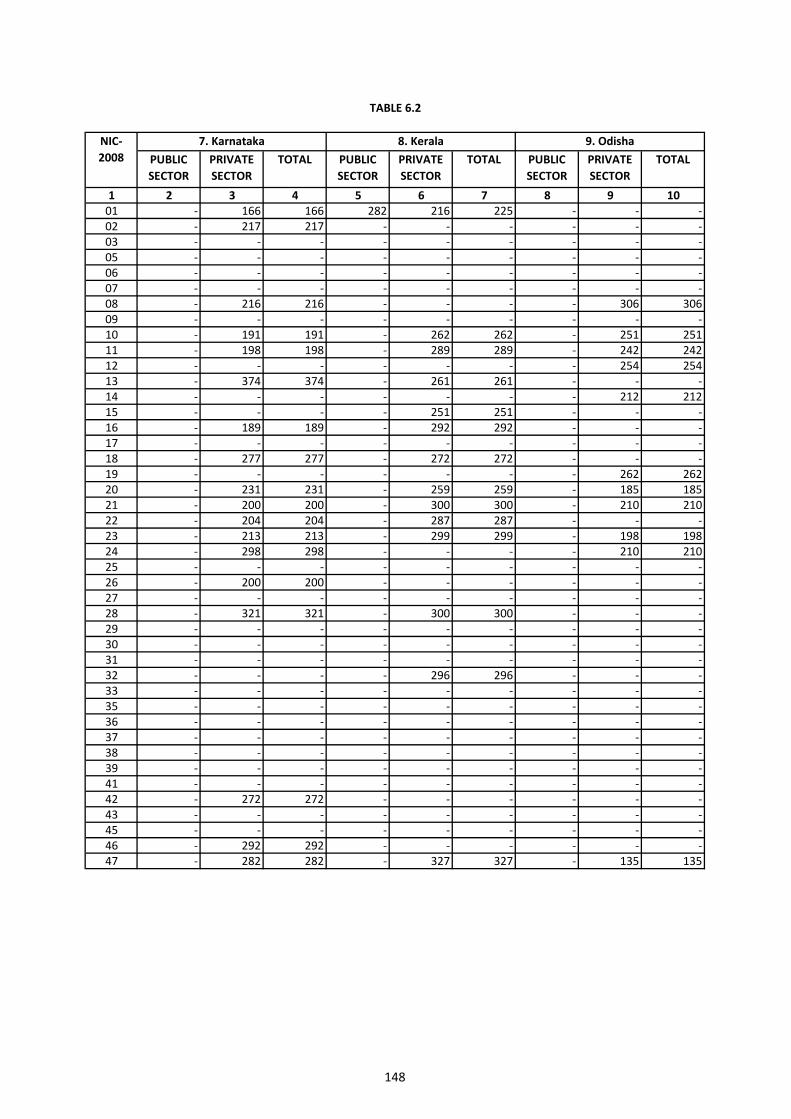
148
PUBLIC SECTOR
PRIVATE SECTOR
TOTAL PUBLIC SECTOR
PRIVATE SECTOR
TOTAL PUBLIC SECTOR
PRIVATE SECTOR
TOTAL
1 2 3 4 5 6 7 8 9 1001 - 166 166 282 216 225 - - -02 - 217 217 - - - - - -03 - - - - - - - - -05 - - - - - - - - -06 - - - - - - - - -07 - - - - - - - - -08 - 216 216 - - - - 306 30609 - - - - - - - - -10 - 191 191 - 262 262 - 251 25111 - 198 198 - 289 289 - 242 24212 - - - - - - - 254 25413 - 374 374 - 261 261 - - -14 - - - - - - - 212 21215 - - - - 251 251 - - -16 - 189 189 - 292 292 - - -17 - - - - - - - - -18 - 277 277 - 272 272 - - -19 - - - - - - - 262 26220 - 231 231 - 259 259 - 185 18521 - 200 200 - 300 300 - 210 21022 - 204 204 - 287 287 - - -23 - 213 213 - 299 299 - 198 19824 - 298 298 - - - - 210 21025 - - - - - - - - -26 - 200 200 - - - - - -27 - - - - - - - - -28 - 321 321 - 300 300 - - -29 - - - - - - - - -30 - - - - - - - - -31 - - - - - - - - -32 - - - - 296 296 - - -33 - - - - - - - - -35 - - - - - - - - -36 - - - - - - - - -37 - - - - - - - - -38 - - - - - - - - -39 - - - - - - - - -41 - - - - - - - - -42 - 272 272 - - - - - -43 - - - - - - - - -45 - - - - - - - - -46 - 292 292 - - - - - -47 - 282 282 - 327 327 - 135 135
NIC- 2008
TABLE 6.2
7. Karnataka 8. Kerala 9. Odisha
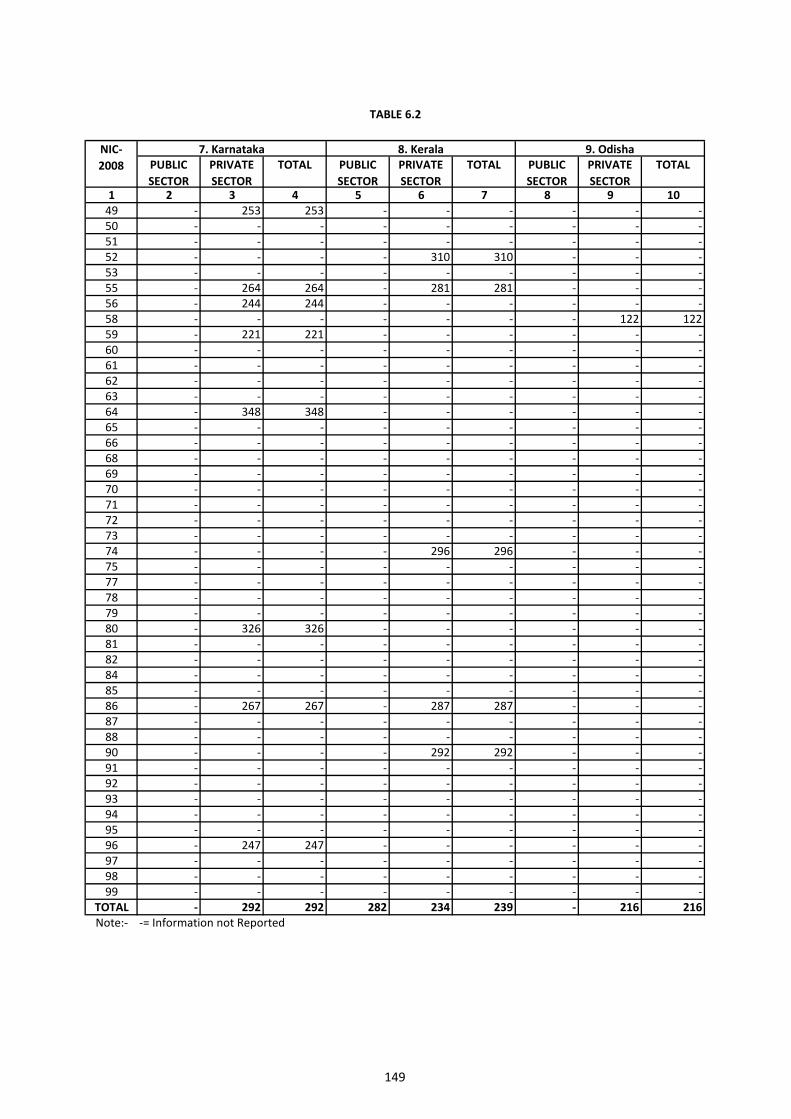
149
PUBLIC SECTOR
PRIVATE SECTOR
TOTAL PUBLIC SECTOR
PRIVATE SECTOR
TOTAL PUBLIC SECTOR
PRIVATE SECTOR
TOTAL
1 2 3 4 5 6 7 8 9 1049 - 253 253 - - - - - -50 - - - - - - - - -51 - - - - - - - - -52 - - - - 310 310 - - -53 - - - - - - - - -55 - 264 264 - 281 281 - - -56 - 244 244 - - - - - -58 - - - - - - - 122 12259 - 221 221 - - - - - -60 - - - - - - - - -61 - - - - - - - - -62 - - - - - - - - -63 - - - - - - - - -64 - 348 348 - - - - - -65 - - - - - - - - -66 - - - - - - - - -68 - - - - - - - - -69 - - - - - - - - -70 - - - - - - - - -71 - - - - - - - - -72 - - - - - - - - -73 - - - - - - - - -74 - - - - 296 296 - - -75 - - - - - - - - -77 - - - - - - - - -78 - - - - - - - - -79 - - - - - - - - -80 - 326 326 - - - - - -81 - - - - - - - - -82 - - - - - - - - -84 - - - - - - - - -85 - - - - - - - - -86 - 267 267 - 287 287 - - -87 - - - - - - - - -88 - - - - - - - - -90 - - - - 292 292 - - -91 - - - - - - - - -92 - - - - - - - - -93 - - - - - - - - -94 - - - - - - - - -95 - - - - - - - - -96 - 247 247 - - - - - -97 - - - - - - - - -98 - - - - - - - - -99 - - - - - - - - -
TOTAL - 292 292 282 234 239 - 216 216Note:- -= Information not Reported
TABLE 6.2
8. Kerala 9. OdishaNIC- 2008
7. Karnataka
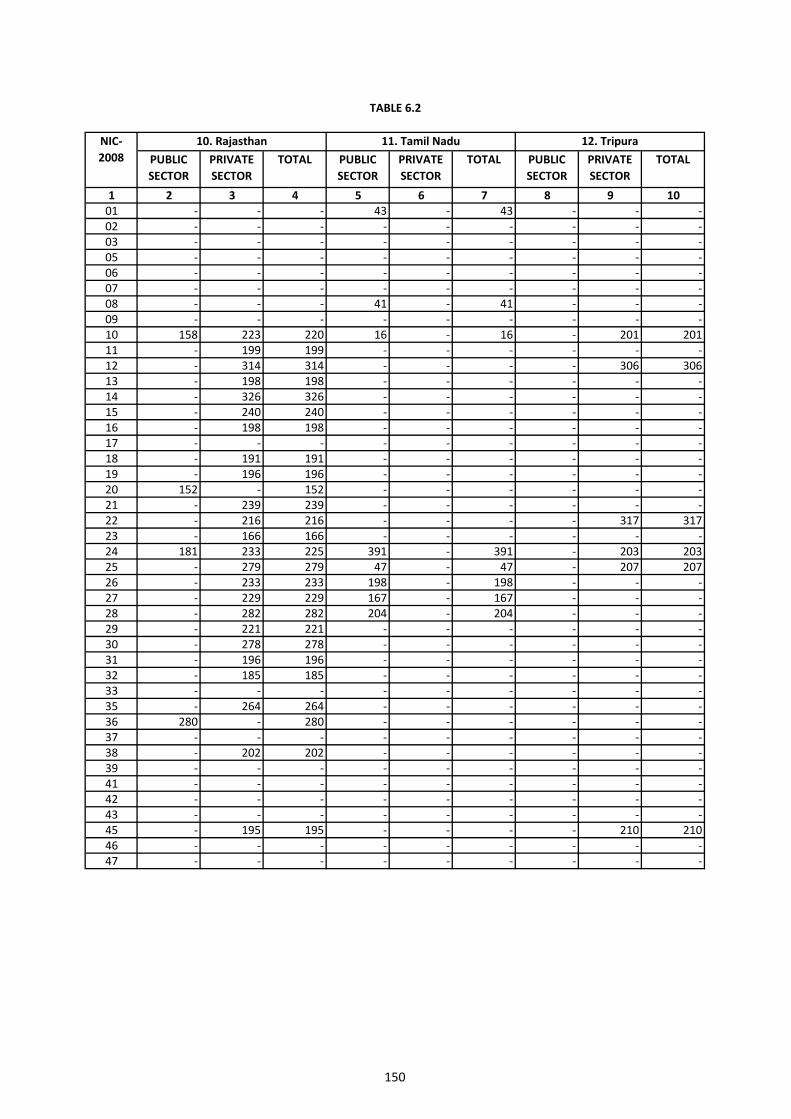
150
PUBLIC SECTOR
PRIVATE SECTOR
TOTAL PUBLIC SECTOR
PRIVATE SECTOR
TOTAL PUBLIC SECTOR
PRIVATE SECTOR
TOTAL
1 2 3 4 5 6 7 8 9 1001 - - - 43 - 43 - - -02 - - - - - - - - -03 - - - - - - - - -05 - - - - - - - - -06 - - - - - - - - -07 - - - - - - - - -08 - - - 41 - 41 - - -09 - - - - - - - - -10 158 223 220 16 - 16 - 201 20111 - 199 199 - - - - - -12 - 314 314 - - - - 306 30613 - 198 198 - - - - - -14 - 326 326 - - - - - -15 - 240 240 - - - - - -16 - 198 198 - - - - - -17 - - - - - - - - -18 - 191 191 - - - - - -19 - 196 196 - - - - - -20 152 - 152 - - - - - -21 - 239 239 - - - - - -22 - 216 216 - - - - 317 31723 - 166 166 - - - - - -24 181 233 225 391 - 391 - 203 20325 - 279 279 47 - 47 - 207 20726 - 233 233 198 - 198 - - -27 - 229 229 167 - 167 - - -28 - 282 282 204 - 204 - - -29 - 221 221 - - - - - -30 - 278 278 - - - - - -31 - 196 196 - - - - - -32 - 185 185 - - - - - -33 - - - - - - - - -35 - 264 264 - - - - - -36 280 - 280 - - - - - -37 - - - - - - - - -38 - 202 202 - - - - - -39 - - - - - - - - -41 - - - - - - - - -42 - - - - - - - - -43 - - - - - - - - -45 - 195 195 - - - - 210 21046 - - - - - - - - -47 - - - - - - - - -
TABLE 6.2
10. Rajasthan 11. Tamil NaduNIC- 2008
12. Tripura
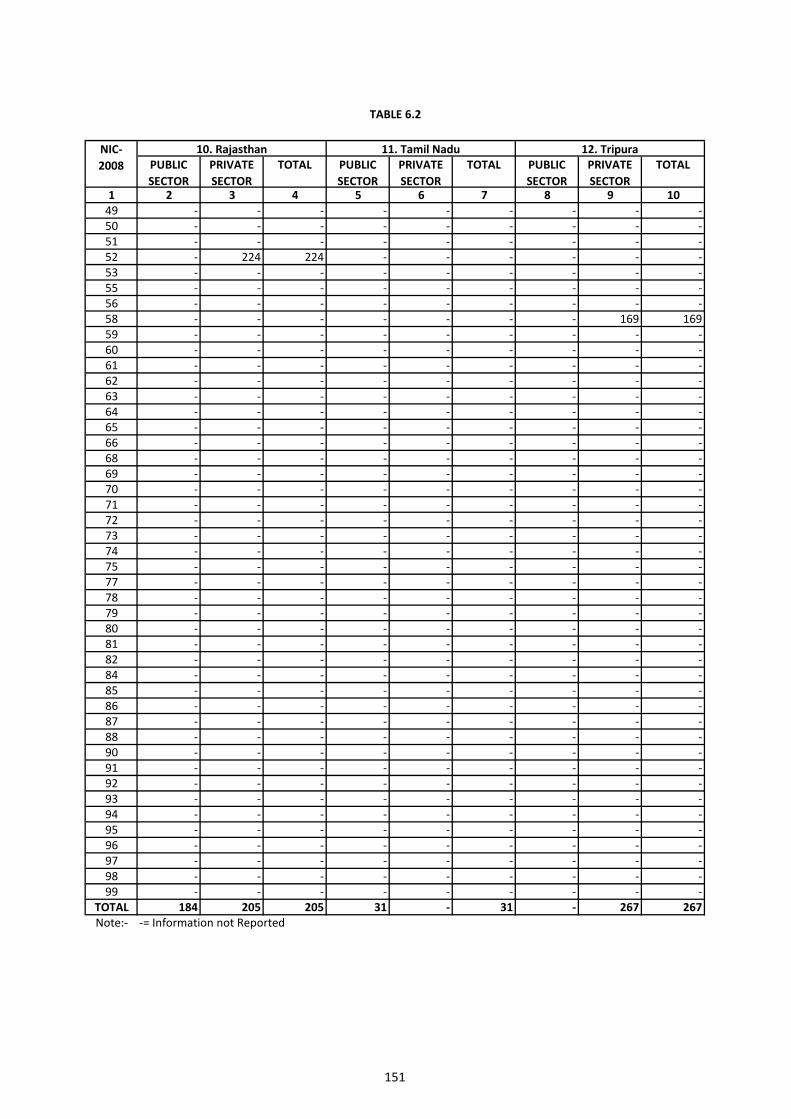
151
PUBLIC SECTOR
PRIVATE SECTOR
TOTAL PUBLIC SECTOR
PRIVATE SECTOR
TOTAL PUBLIC SECTOR
PRIVATE SECTOR
TOTAL
1 2 3 4 5 6 7 8 9 1049 - - - - - - - - -50 - - - - - - - - -51 - - - - - - - - -52 - 224 224 - - - - - -53 - - - - - - - - -55 - - - - - - - - -56 - - - - - - - - -58 - - - - - - - 169 16959 - - - - - - - - -60 - - - - - - - - -61 - - - - - - - - -62 - - - - - - - - -63 - - - - - - - - -64 - - - - - - - - -65 - - - - - - - - -66 - - - - - - - - -68 - - - - - - - - -69 - - - - - - - - -70 - - - - - - - - -71 - - - - - - - - -72 - - - - - - - - -73 - - - - - - - - -74 - - - - - - - - -75 - - - - - - - - -77 - - - - - - - - -78 - - - - - - - - -79 - - - - - - - - -80 - - - - - - - - -81 - - - - - - - - -82 - - - - - - - - -84 - - - - - - - - -85 - - - - - - - - -86 - - - - - - - - -87 - - - - - - - - -88 - - - - - - - - -90 - - - - - - - - -91 - - - - - - - - -92 - - - - - - - - -93 - - - - - - - - -94 - - - - - - - - -95 - - - - - - - - -96 - - - - - - - - -97 - - - - - - - - -98 - - - - - - - - -99 - - - - - - - - -
TOTAL 184 205 205 31 - 31 - 267 267Note:- -= Information not Reported
TABLE 6.2
NIC- 2008
10. Rajasthan 11. Tamil Nadu 12. Tripura
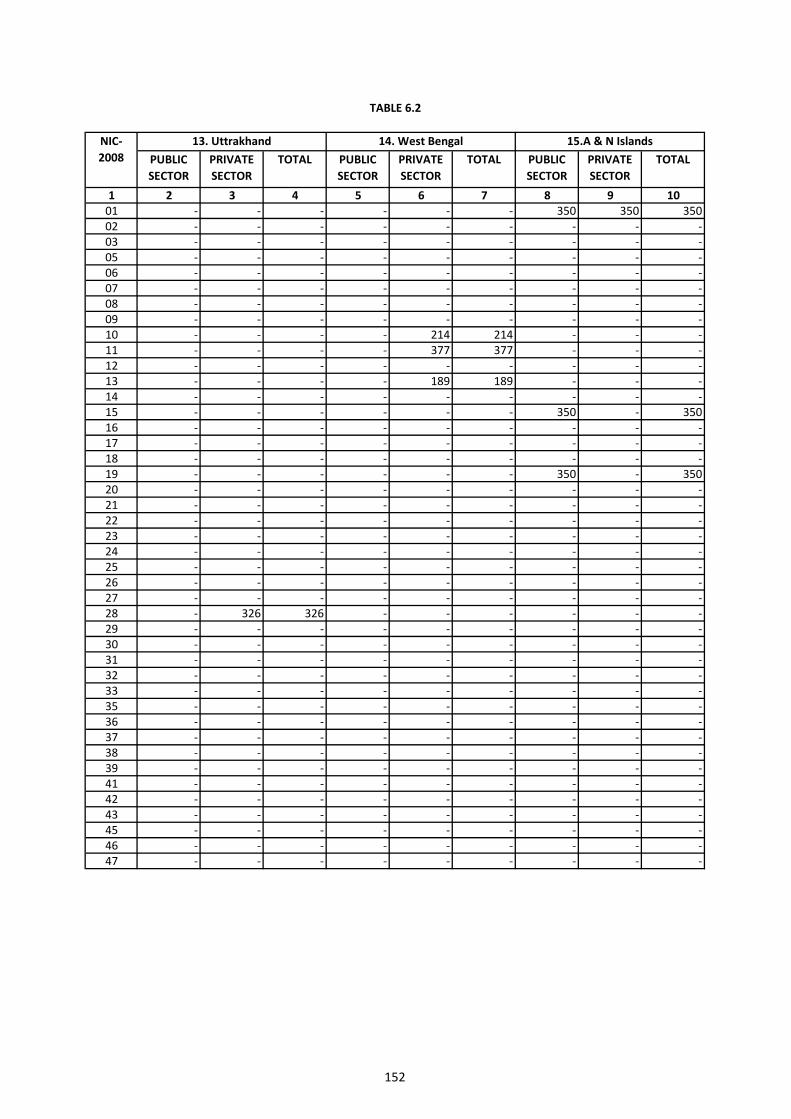
152
PUBLIC SECTOR
PRIVATE SECTOR
TOTAL PUBLIC SECTOR
PRIVATE SECTOR
TOTAL PUBLIC SECTOR
PRIVATE SECTOR
TOTAL
1 2 3 4 5 6 7 8 9 1001 - - - - - - 350 350 35002 - - - - - - - - -03 - - - - - - - - -05 - - - - - - - - -06 - - - - - - - - -07 - - - - - - - - -08 - - - - - - - - -09 - - - - - - - - -10 - - - - 214 214 - - -11 - - - - 377 377 - - -12 - - - - - - - - -13 - - - - 189 189 - - -14 - - - - - - - - -15 - - - - - - 350 - 35016 - - - - - - - - -17 - - - - - - - - -18 - - - - - - - - -19 - - - - - - 350 - 35020 - - - - - - - - -21 - - - - - - - - -22 - - - - - - - - -23 - - - - - - - - -24 - - - - - - - - -25 - - - - - - - - -26 - - - - - - - - -27 - - - - - - - - -28 - 326 326 - - - - - -29 - - - - - - - - -30 - - - - - - - - -31 - - - - - - - - -32 - - - - - - - - -33 - - - - - - - - -35 - - - - - - - - -36 - - - - - - - - -37 - - - - - - - - -38 - - - - - - - - -39 - - - - - - - - -41 - - - - - - - - -42 - - - - - - - - -43 - - - - - - - - -45 - - - - - - - - -46 - - - - - - - - -47 - - - - - - - - -
TABLE 6.2
NIC- 2008
13. Uttrakhand 14. West Bengal 15.A & N Islands
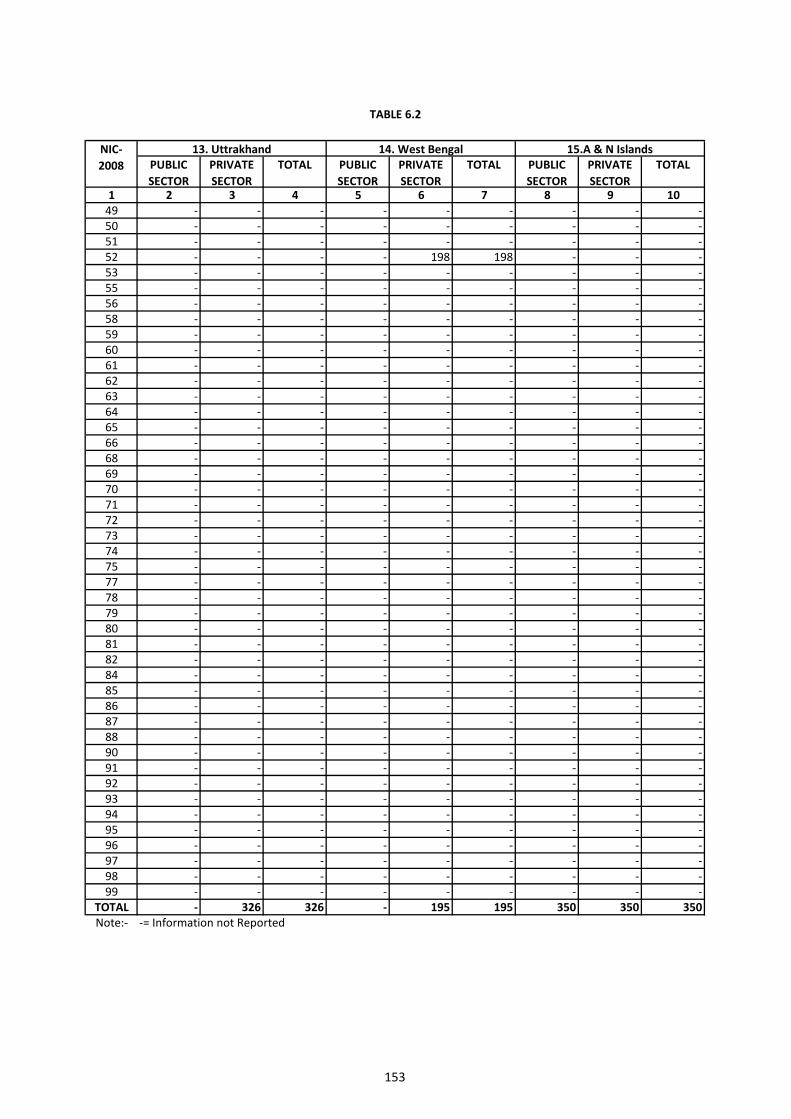
153
PUBLIC SECTOR
PRIVATE SECTOR
TOTAL PUBLIC SECTOR
PRIVATE SECTOR
TOTAL PUBLIC SECTOR
PRIVATE SECTOR
TOTAL
1 2 3 4 5 6 7 8 9 1049 - - - - - - - - -50 - - - - - - - - -51 - - - - - - - - -52 - - - - 198 198 - - -53 - - - - - - - - -55 - - - - - - - - -56 - - - - - - - - -58 - - - - - - - - -59 - - - - - - - - -60 - - - - - - - - -61 - - - - - - - - -62 - - - - - - - - -63 - - - - - - - - -64 - - - - - - - - -65 - - - - - - - - -66 - - - - - - - - -68 - - - - - - - - -69 - - - - - - - - -70 - - - - - - - - -71 - - - - - - - - -72 - - - - - - - - -73 - - - - - - - - -74 - - - - - - - - -75 - - - - - - - - -77 - - - - - - - - -78 - - - - - - - - -79 - - - - - - - - -80 - - - - - - - - -81 - - - - - - - - -82 - - - - - - - - -84 - - - - - - - - -85 - - - - - - - - -86 - - - - - - - - -87 - - - - - - - - -88 - - - - - - - - -90 - - - - - - - - -91 - - - - - - - - -92 - - - - - - - - -93 - - - - - - - - -94 - - - - - - - - -95 - - - - - - - - -96 - - - - - - - - -97 - - - - - - - - -98 - - - - - - - - -99 - - - - - - - - -
TOTAL - 326 326 - 195 195 350 350 350Note:- -= Information not Reported
TABLE 6.2
NIC- 2008
13. Uttrakhand 14. West Bengal 15.A & N Islands
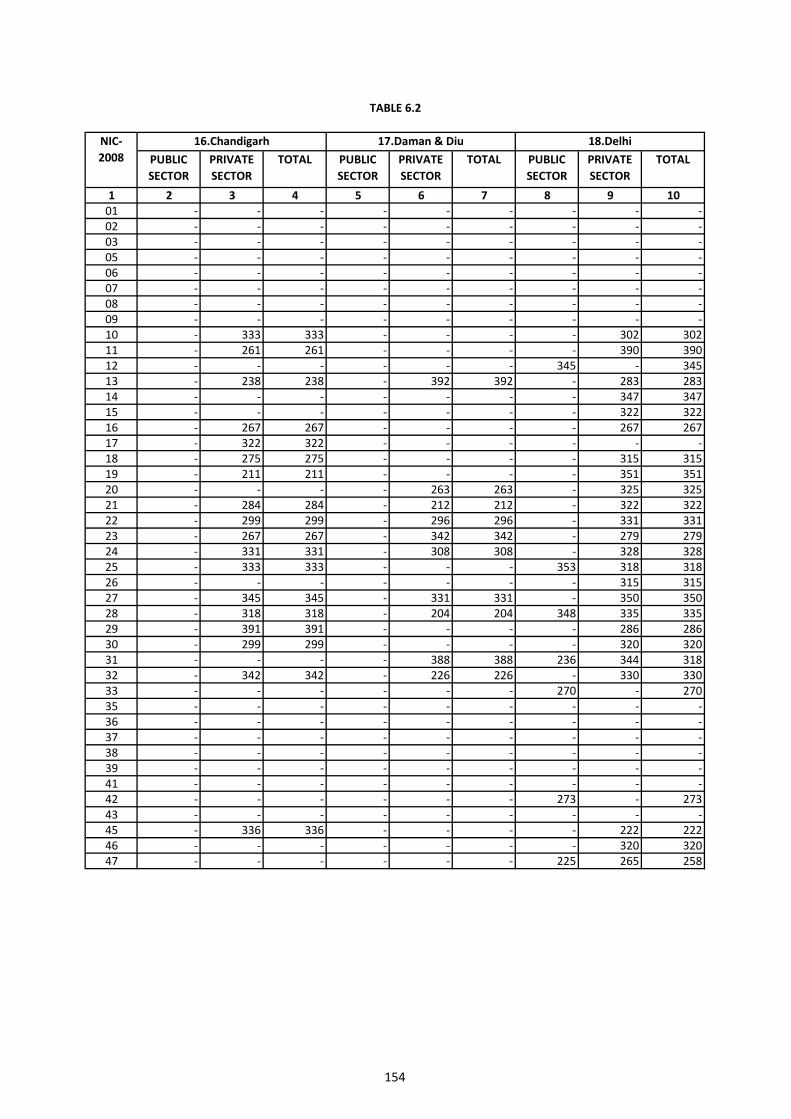
154
PUBLIC SECTOR
PRIVATE SECTOR
TOTAL PUBLIC SECTOR
PRIVATE SECTOR
TOTAL PUBLIC SECTOR
PRIVATE SECTOR
TOTAL
1 2 3 4 5 6 7 8 9 1001 - - - - - - - - -02 - - - - - - - - -03 - - - - - - - - -05 - - - - - - - - -06 - - - - - - - - -07 - - - - - - - - -08 - - - - - - - - -09 - - - - - - - - -10 - 333 333 - - - - 302 30211 - 261 261 - - - - 390 39012 - - - - - - 345 - 34513 - 238 238 - 392 392 - 283 28314 - - - - - - - 347 34715 - - - - - - - 322 32216 - 267 267 - - - - 267 26717 - 322 322 - - - - - -18 - 275 275 - - - - 315 31519 - 211 211 - - - - 351 35120 - - - - 263 263 - 325 32521 - 284 284 - 212 212 - 322 32222 - 299 299 - 296 296 - 331 33123 - 267 267 - 342 342 - 279 27924 - 331 331 - 308 308 - 328 32825 - 333 333 - - - 353 318 31826 - - - - - - - 315 31527 - 345 345 - 331 331 - 350 35028 - 318 318 - 204 204 348 335 33529 - 391 391 - - - - 286 28630 - 299 299 - - - - 320 32031 - - - - 388 388 236 344 31832 - 342 342 - 226 226 - 330 33033 - - - - - - 270 - 27035 - - - - - - - - -36 - - - - - - - - -37 - - - - - - - - -38 - - - - - - - - -39 - - - - - - - - -41 - - - - - - - - -42 - - - - - - 273 - 27343 - - - - - - - - -45 - 336 336 - - - - 222 22246 - - - - - - - 320 32047 - - - - - - 225 265 258
18.Delhi16.Chandigarh 17.Daman & Diu
TABLE 6.2
NIC- 2008
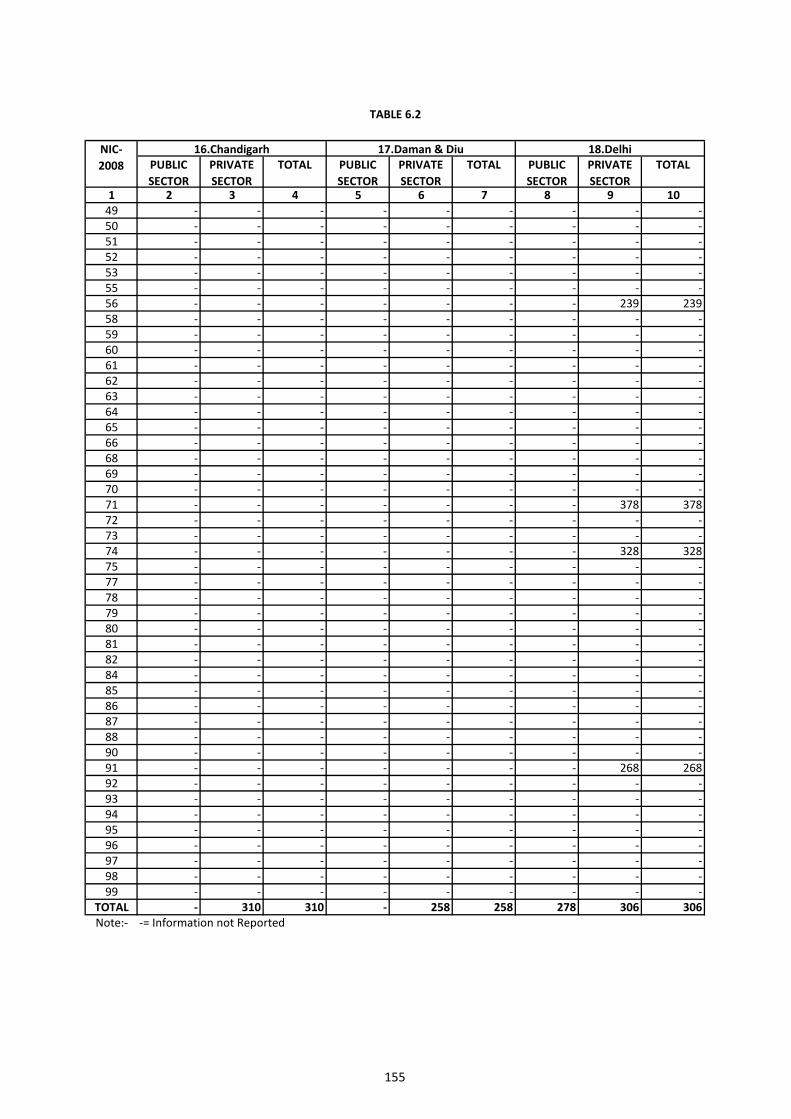
155
PUBLIC SECTOR
PRIVATE SECTOR
TOTAL PUBLIC SECTOR
PRIVATE SECTOR
TOTAL PUBLIC SECTOR
PRIVATE SECTOR
TOTAL
1 2 3 4 5 6 7 8 9 1049 - - - - - - - - -50 - - - - - - - - -51 - - - - - - - - -52 - - - - - - - - -53 - - - - - - - - -55 - - - - - - - - -56 - - - - - - - 239 23958 - - - - - - - - -59 - - - - - - - - -60 - - - - - - - - -61 - - - - - - - - -62 - - - - - - - - -63 - - - - - - - - -64 - - - - - - - - -65 - - - - - - - - -66 - - - - - - - - -68 - - - - - - - - -69 - - - - - - - - -70 - - - - - - - - -71 - - - - - - - 378 37872 - - - - - - - - -73 - - - - - - - - -74 - - - - - - - 328 32875 - - - - - - - - -77 - - - - - - - - -78 - - - - - - - - -79 - - - - - - - - -80 - - - - - - - - -81 - - - - - - - - -82 - - - - - - - - -84 - - - - - - - - -85 - - - - - - - - -86 - - - - - - - - -87 - - - - - - - - -88 - - - - - - - - -90 - - - - - - - - -91 - - - - - - - 268 26892 - - - - - - - - -93 - - - - - - - - -94 - - - - - - - - -95 - - - - - - - - -96 - - - - - - - - -97 - - - - - - - - -98 - - - - - - - - -99 - - - - - - - - -
TOTAL - 310 310 - 258 258 278 306 306Note:- -= Information not Reported
NIC- 2008
16.Chandigarh 17.Daman & Diu 18.Delhi
TABLE 6.2
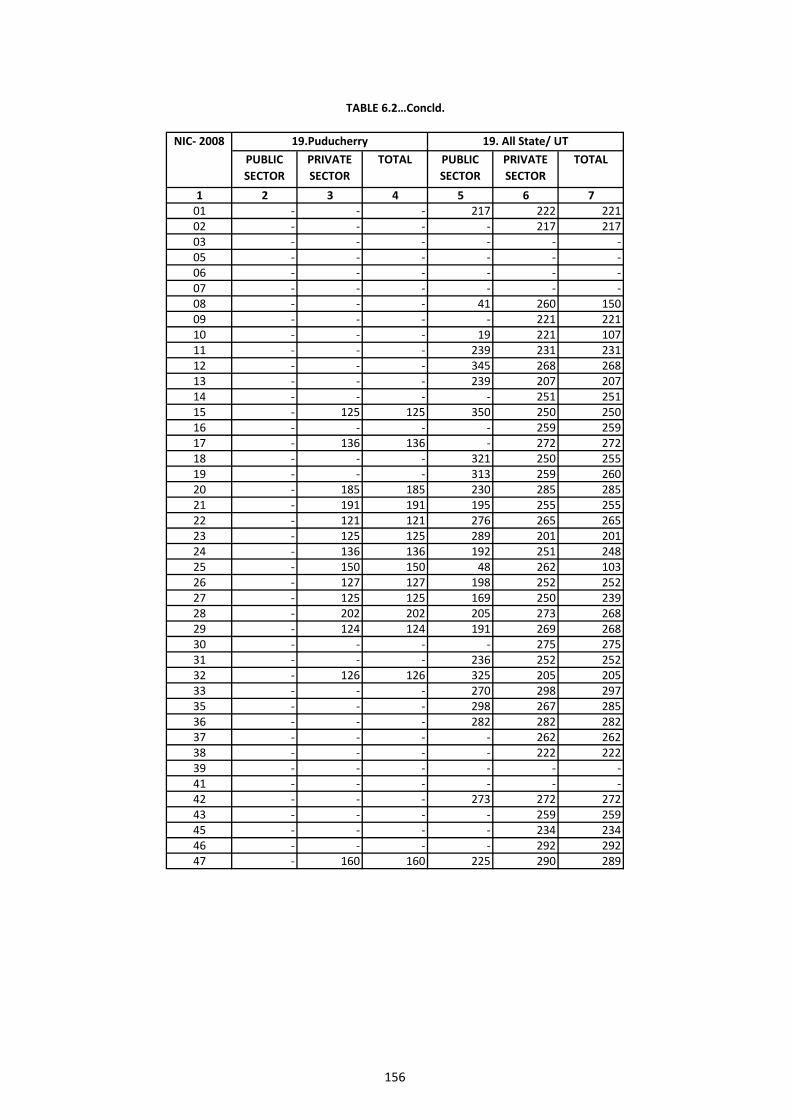
156
PUBLIC SECTOR
PRIVATE SECTOR
TOTAL PUBLIC SECTOR
PRIVATE SECTOR
TOTAL
1 2 3 4 5 6 701 - - - 217 222 22102 - - - - 217 21703 - - - - - -05 - - - - - -06 - - - - - -07 - - - - - -08 - - - 41 260 15009 - - - - 221 22110 - - - 19 221 10711 - - - 239 231 23112 - - - 345 268 26813 - - - 239 207 20714 - - - - 251 25115 - 125 125 350 250 25016 - - - - 259 25917 - 136 136 - 272 27218 - - - 321 250 25519 - - - 313 259 26020 - 185 185 230 285 28521 - 191 191 195 255 25522 - 121 121 276 265 26523 - 125 125 289 201 20124 - 136 136 192 251 24825 - 150 150 48 262 10326 - 127 127 198 252 25227 - 125 125 169 250 23928 - 202 202 205 273 26829 - 124 124 191 269 26830 - - - - 275 27531 - - - 236 252 25232 - 126 126 325 205 20533 - - - 270 298 29735 - - - 298 267 28536 - - - 282 282 28237 - - - - 262 26238 - - - - 222 22239 - - - - - -41 - - - - - -42 - - - 273 272 27243 - - - - 259 25945 - - - - 234 23446 - - - - 292 29247 - 160 160 225 290 289
NIC- 2008 19.Puducherry 19. All State/ UT
TABLE 6.2…Concld.
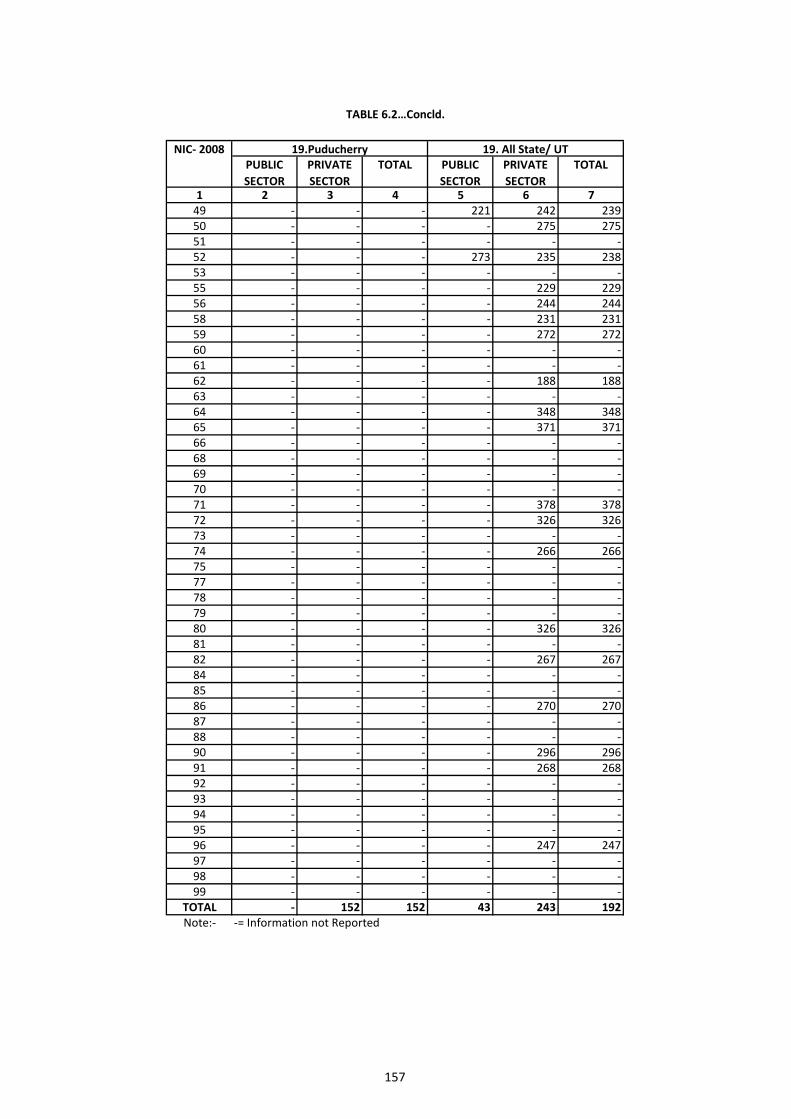
157
PUBLIC SECTOR
PRIVATE SECTOR
TOTAL PUBLIC SECTOR
PRIVATE SECTOR
TOTAL
1 2 3 4 5 6 749 - - - 221 242 23950 - - - - 275 27551 - - - - - -52 - - - 273 235 23853 - - - - - -55 - - - - 229 22956 - - - - 244 24458 - - - - 231 23159 - - - - 272 27260 - - - - - -61 - - - - - -62 - - - - 188 18863 - - - - - -64 - - - - 348 34865 - - - - 371 37166 - - - - - -68 - - - - - -69 - - - - - -70 - - - - - -71 - - - - 378 37872 - - - - 326 32673 - - - - - -74 - - - - 266 26675 - - - - - -77 - - - - - -78 - - - - - -79 - - - - - -80 - - - - 326 32681 - - - - - -82 - - - - 267 26784 - - - - - -85 - - - - - -86 - - - - 270 27087 - - - - - -88 - - - - - -90 - - - - 296 29691 - - - - 268 26892 - - - - - -93 - - - - - -94 - - - - - -95 - - - - - -96 - - - - 247 24797 - - - - - -98 - - - - - -99 - - - - - -
TOTAL - 152 152 43 243 192Note:- -= Information not Reported
19.Puducherry 19. All State/ UTNIC- 2008
TABLE 6.2…Concld.
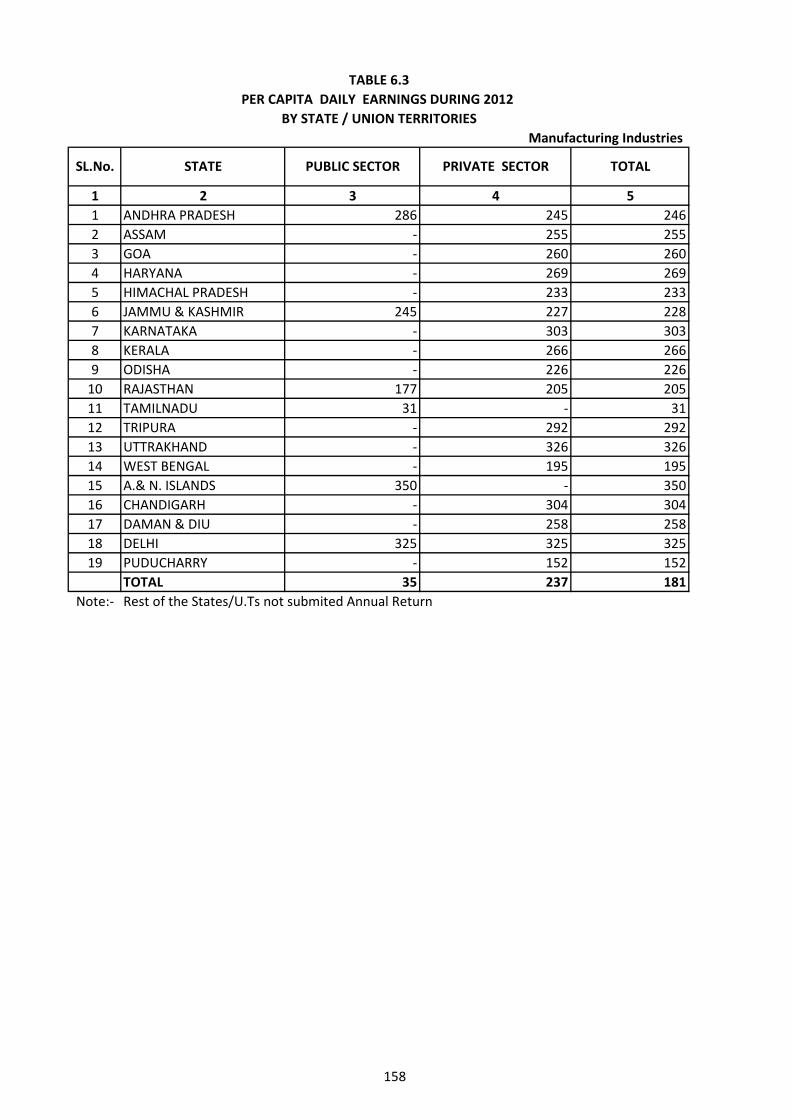
158
1 2 3 4 51 ANDHRA PRADESH 286 245 2462 ASSAM - 255 2553 GOA - 260 2604 HARYANA - 269 2695 HIMACHAL PRADESH - 233 2336 JAMMU & KASHMIR 245 227 2287 KARNATAKA - 303 3038 KERALA - 266 2669 ODISHA - 226 226
10 RAJASTHAN 177 205 20511 TAMILNADU 31 - 3112 TRIPURA - 292 29213 UTTRAKHAND - 326 32614 WEST BENGAL - 195 19515 A.& N. ISLANDS 350 - 35016 CHANDIGARH - 304 30417 DAMAN & DIU - 258 25818 DELHI 325 325 32519 PUDUCHARRY - 152 152
TOTAL 35 237 181Note:- Rest of the States/U.Ts not submited Annual Return
TABLE 6.3PER CAPITA DAILY EARNINGS DURING 2012
BY STATE / UNION TERRITORIESManufacturing Industries
SL.No. STATE PUBLIC SECTOR PRIVATE SECTOR TOTAL
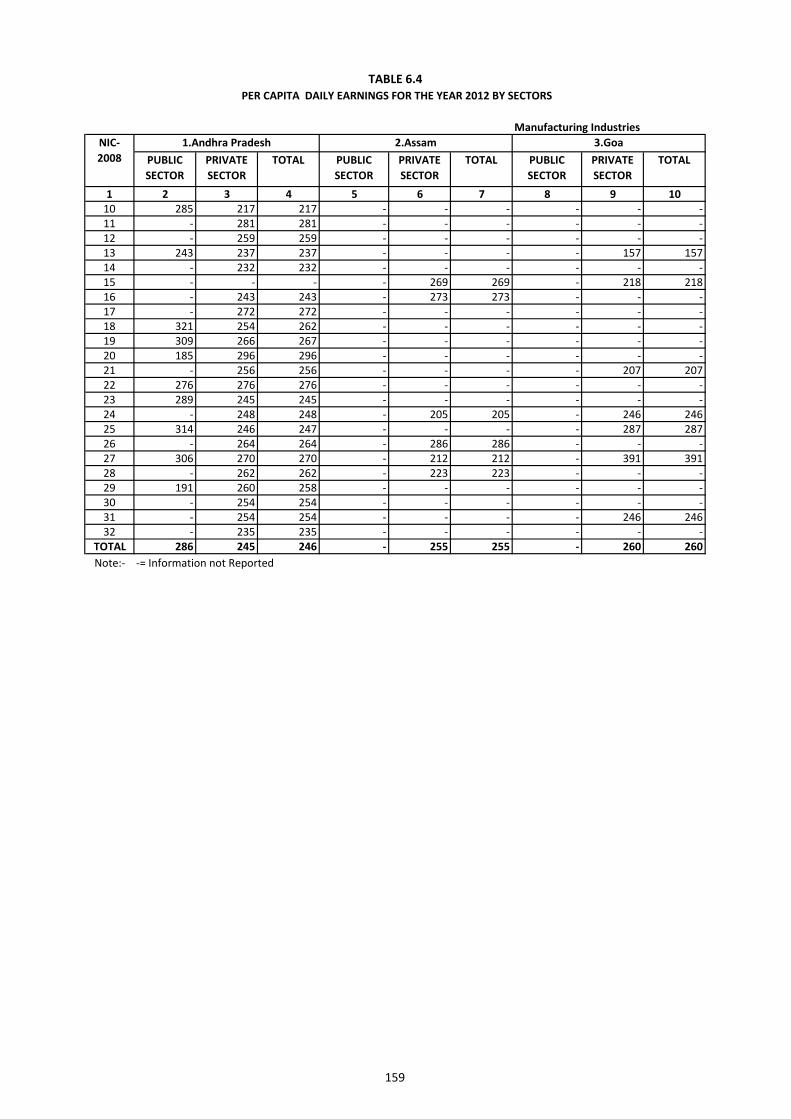
159
Manufacturing Industries
PUBLIC SECTOR
PRIVATE SECTOR
TOTAL PUBLIC SECTOR
PRIVATE SECTOR
TOTAL PUBLIC SECTOR
PRIVATE SECTOR
TOTAL
1 2 3 4 5 6 7 8 9 1010 285 217 217 - - - - - -11 - 281 281 - - - - - -12 - 259 259 - - - - - -13 243 237 237 - - - - 157 15714 - 232 232 - - - - - -15 - - - - 269 269 - 218 21816 - 243 243 - 273 273 - - -17 - 272 272 - - - - - -18 321 254 262 - - - - - -19 309 266 267 - - - - - -20 185 296 296 - - - - - -21 - 256 256 - - - - 207 20722 276 276 276 - - - - - -23 289 245 245 - - - - - -24 - 248 248 - 205 205 - 246 24625 314 246 247 - - - - 287 28726 - 264 264 - 286 286 - - -27 306 270 270 - 212 212 - 391 39128 - 262 262 - 223 223 - - -29 191 260 258 - - - - - -30 - 254 254 - - - - - -31 - 254 254 - - - - 246 24632 - 235 235 - - - - - -
TOTAL 286 245 246 - 255 255 - 260 260Note:- -= Information not Reported
TABLE 6.4 PER CAPITA DAILY EARNINGS FOR THE YEAR 2012 BY SECTORS
NIC- 2008
1.Andhra Pradesh 2.Assam 3.Goa
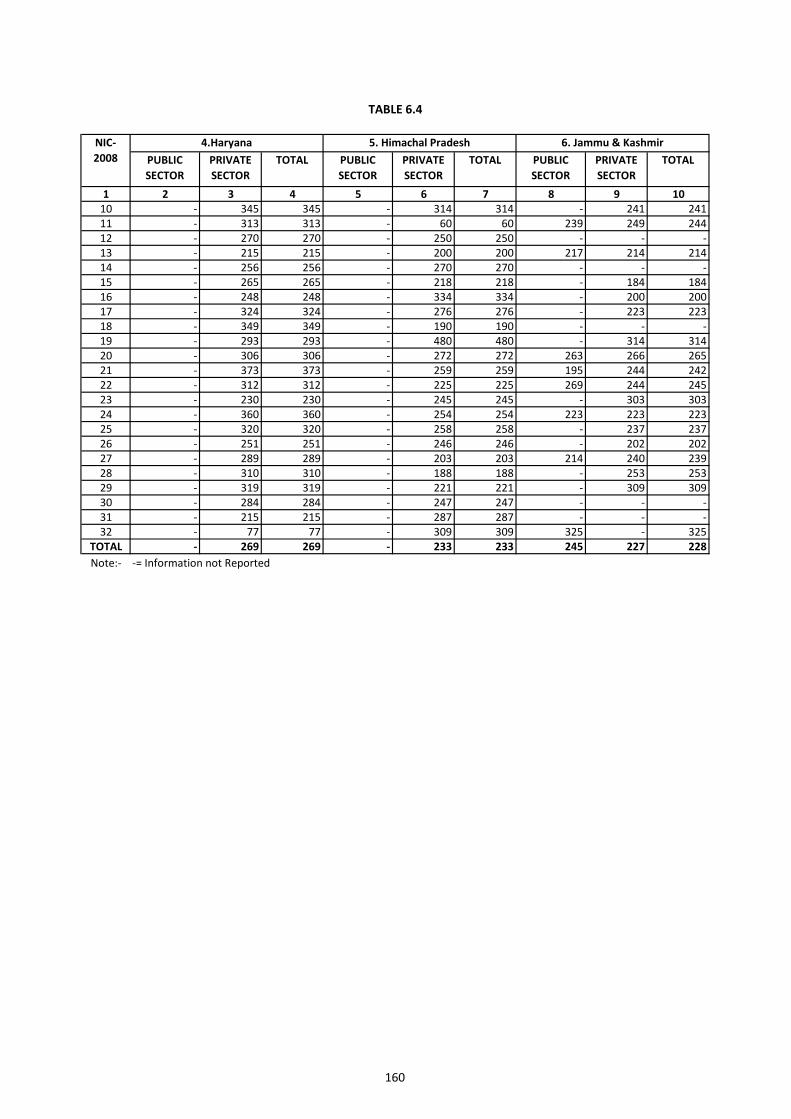
160
PUBLIC SECTOR
PRIVATE SECTOR
TOTAL PUBLIC SECTOR
PRIVATE SECTOR
TOTAL PUBLIC SECTOR
PRIVATE SECTOR
TOTAL
1 2 3 4 5 6 7 8 9 1010 - 345 345 - 314 314 - 241 24111 - 313 313 - 60 60 239 249 24412 - 270 270 - 250 250 - - -13 - 215 215 - 200 200 217 214 21414 - 256 256 - 270 270 - - -15 - 265 265 - 218 218 - 184 18416 - 248 248 - 334 334 - 200 20017 - 324 324 - 276 276 - 223 22318 - 349 349 - 190 190 - - -19 - 293 293 - 480 480 - 314 31420 - 306 306 - 272 272 263 266 26521 - 373 373 - 259 259 195 244 24222 - 312 312 - 225 225 269 244 24523 - 230 230 - 245 245 - 303 30324 - 360 360 - 254 254 223 223 22325 - 320 320 - 258 258 - 237 23726 - 251 251 - 246 246 - 202 20227 - 289 289 - 203 203 214 240 23928 - 310 310 - 188 188 - 253 25329 - 319 319 - 221 221 - 309 30930 - 284 284 - 247 247 - - -31 - 215 215 - 287 287 - - -32 - 77 77 - 309 309 325 - 325
TOTAL - 269 269 - 233 233 245 227 228Note:- -= Information not Reported
TABLE 6.4
NIC- 2008
4.Haryana 5. Himachal Pradesh 6. Jammu & Kashmir
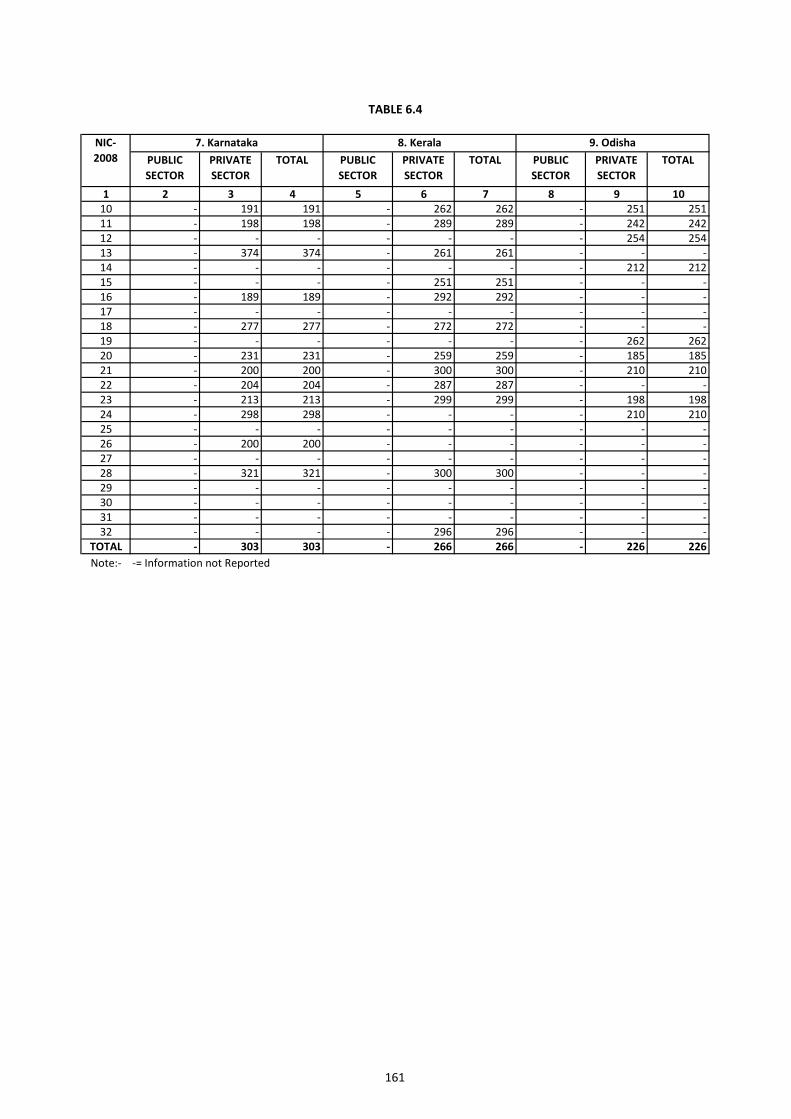
161
PUBLIC SECTOR
PRIVATE SECTOR
TOTAL PUBLIC SECTOR
PRIVATE SECTOR
TOTAL PUBLIC SECTOR
PRIVATE SECTOR
TOTAL
1 2 3 4 5 6 7 8 9 1010 - 191 191 - 262 262 - 251 25111 - 198 198 - 289 289 - 242 24212 - - - - - - - 254 25413 - 374 374 - 261 261 - - -14 - - - - - - - 212 21215 - - - - 251 251 - - -16 - 189 189 - 292 292 - - -17 - - - - - - - - -18 - 277 277 - 272 272 - - -19 - - - - - - - 262 26220 - 231 231 - 259 259 - 185 18521 - 200 200 - 300 300 - 210 21022 - 204 204 - 287 287 - - -23 - 213 213 - 299 299 - 198 19824 - 298 298 - - - - 210 21025 - - - - - - - - -26 - 200 200 - - - - - -27 - - - - - - - - -28 - 321 321 - 300 300 - - -29 - - - - - - - - -30 - - - - - - - - -31 - - - - - - - - -32 - - - - 296 296 - - -
TOTAL - 303 303 - 266 266 - 226 226Note:- -= Information not Reported
TABLE 6.4
NIC- 2008
7. Karnataka 8. Kerala 9. Odisha
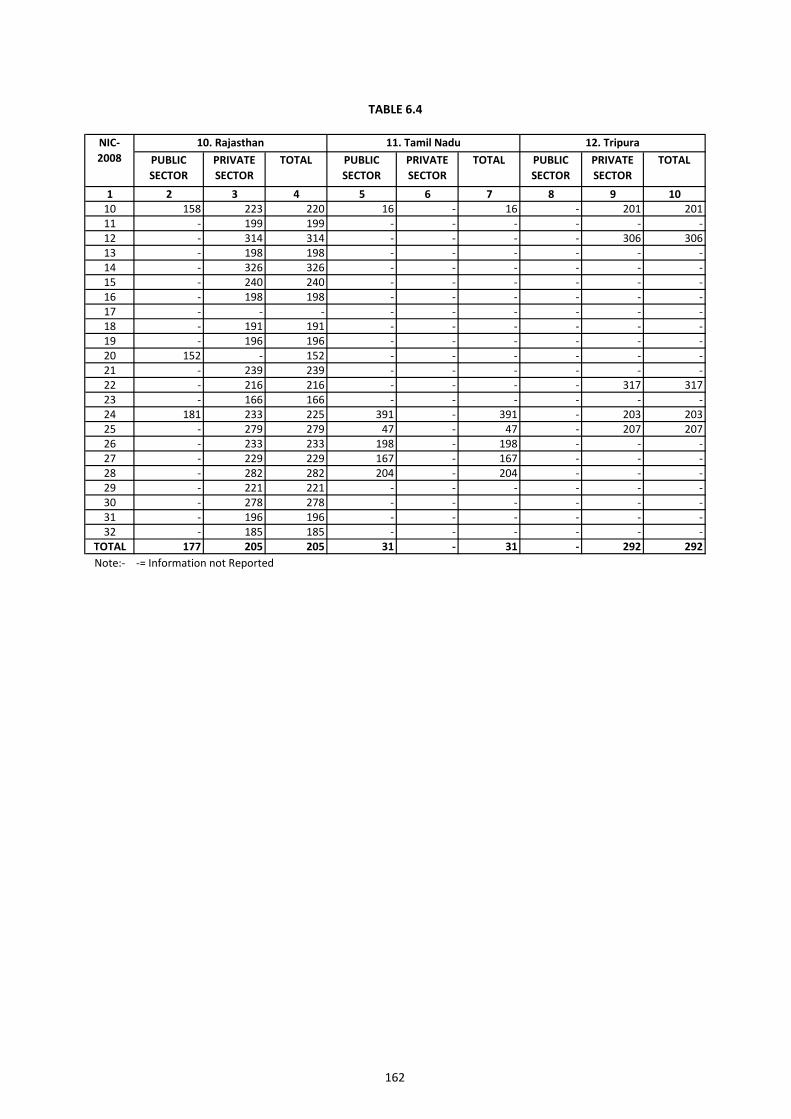
162
PUBLIC SECTOR
PRIVATE SECTOR
TOTAL PUBLIC SECTOR
PRIVATE SECTOR
TOTAL PUBLIC SECTOR
PRIVATE SECTOR
TOTAL
1 2 3 4 5 6 7 8 9 1010 158 223 220 16 - 16 - 201 20111 - 199 199 - - - - - -12 - 314 314 - - - - 306 30613 - 198 198 - - - - - -14 - 326 326 - - - - - -15 - 240 240 - - - - - -16 - 198 198 - - - - - -17 - - - - - - - - -18 - 191 191 - - - - - -19 - 196 196 - - - - - -20 152 - 152 - - - - - -21 - 239 239 - - - - - -22 - 216 216 - - - - 317 31723 - 166 166 - - - - - -24 181 233 225 391 - 391 - 203 20325 - 279 279 47 - 47 - 207 20726 - 233 233 198 - 198 - - -27 - 229 229 167 - 167 - - -28 - 282 282 204 - 204 - - -29 - 221 221 - - - - - -30 - 278 278 - - - - - -31 - 196 196 - - - - - -32 - 185 185 - - - - - -
TOTAL 177 205 205 31 - 31 - 292 292Note:- -= Information not Reported
TABLE 6.4
NIC- 2008
10. Rajasthan 11. Tamil Nadu 12. Tripura

163
PUBLIC SECTOR
PRIVATE SECTOR
TOTAL PUBLIC SECTOR
PRIVATE SECTOR
TOTAL PUBLIC SECTOR
PRIVATE SECTOR
TOTAL
1 2 3 4 5 6 7 8 9 1010 - - - - 214 214 - - -11 - - - - 377 377 - - -12 - - - - - - - - -13 - - - - 189 189 - - -14 - - - - - - - - -15 - - - - - - 350 - 35016 - - - - - - - - -17 - - - - - - - - -18 - - - - - - - - -19 - - - - - - 350 - 35020 - - - - - - - - -21 - - - - - - - - -22 - - - - - - - - -23 - - - - - - - - -24 - - - - - - - - -25 - - - - - - - - -26 - - - - - - - - -27 - - - - - - - - -28 - 326 326 - - - - - -29 - - - - - - - - -30 - - - - - - - - -31 - - - - - - - - -32 - - - - - - - - -
TOTAL - 326 326 - 195 195 350 - 350Note:- -= Information not Reported
TABLE 6.4
NIC- 2008
13. Uttrakhand 14. West Bengal 15.A & N Islands
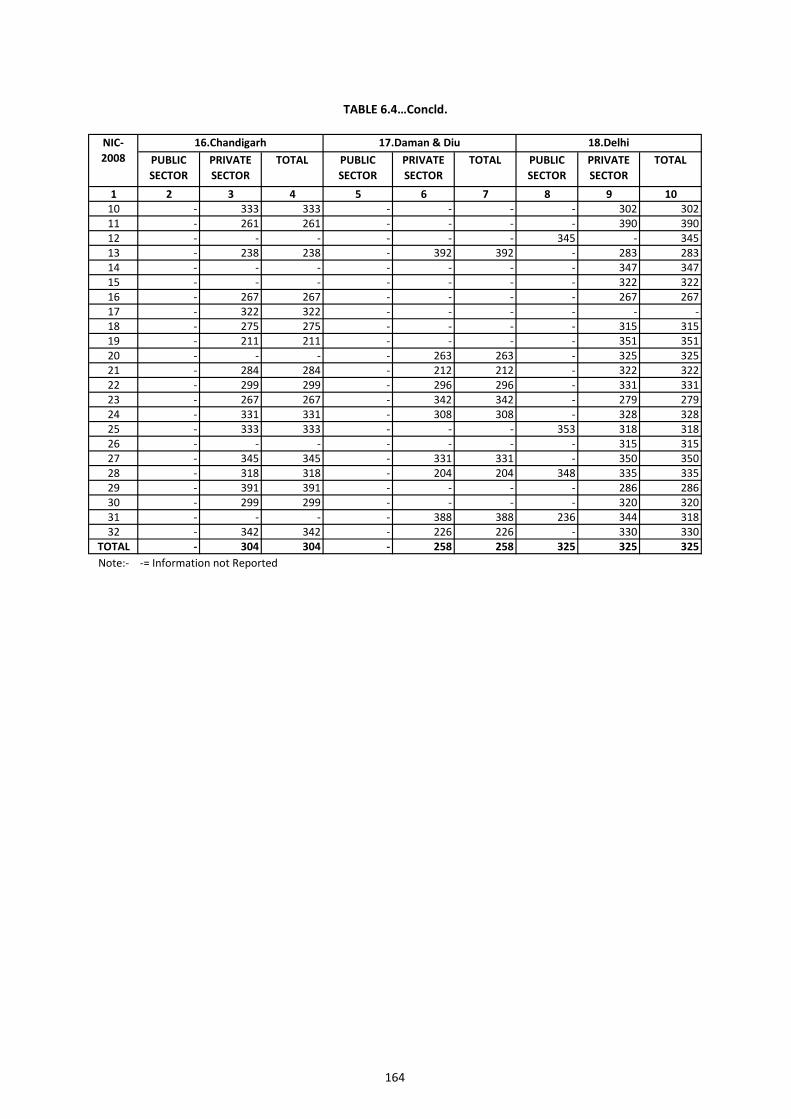
164
PUBLIC SECTOR
PRIVATE SECTOR
TOTAL PUBLIC SECTOR
PRIVATE SECTOR
TOTAL PUBLIC SECTOR
PRIVATE SECTOR
TOTAL
1 2 3 4 5 6 7 8 9 1010 - 333 333 - - - - 302 30211 - 261 261 - - - - 390 39012 - - - - - - 345 - 34513 - 238 238 - 392 392 - 283 28314 - - - - - - - 347 34715 - - - - - - - 322 32216 - 267 267 - - - - 267 26717 - 322 322 - - - - - -18 - 275 275 - - - - 315 31519 - 211 211 - - - - 351 35120 - - - - 263 263 - 325 32521 - 284 284 - 212 212 - 322 32222 - 299 299 - 296 296 - 331 33123 - 267 267 - 342 342 - 279 27924 - 331 331 - 308 308 - 328 32825 - 333 333 - - - 353 318 31826 - - - - - - - 315 31527 - 345 345 - 331 331 - 350 35028 - 318 318 - 204 204 348 335 33529 - 391 391 - - - - 286 28630 - 299 299 - - - - 320 32031 - - - - 388 388 236 344 31832 - 342 342 - 226 226 - 330 330
TOTAL - 304 304 - 258 258 325 325 325Note:- -= Information not Reported
TABLE 6.4…Concld.
NIC- 2008
16.Chandigarh 17.Daman & Diu 18.Delhi
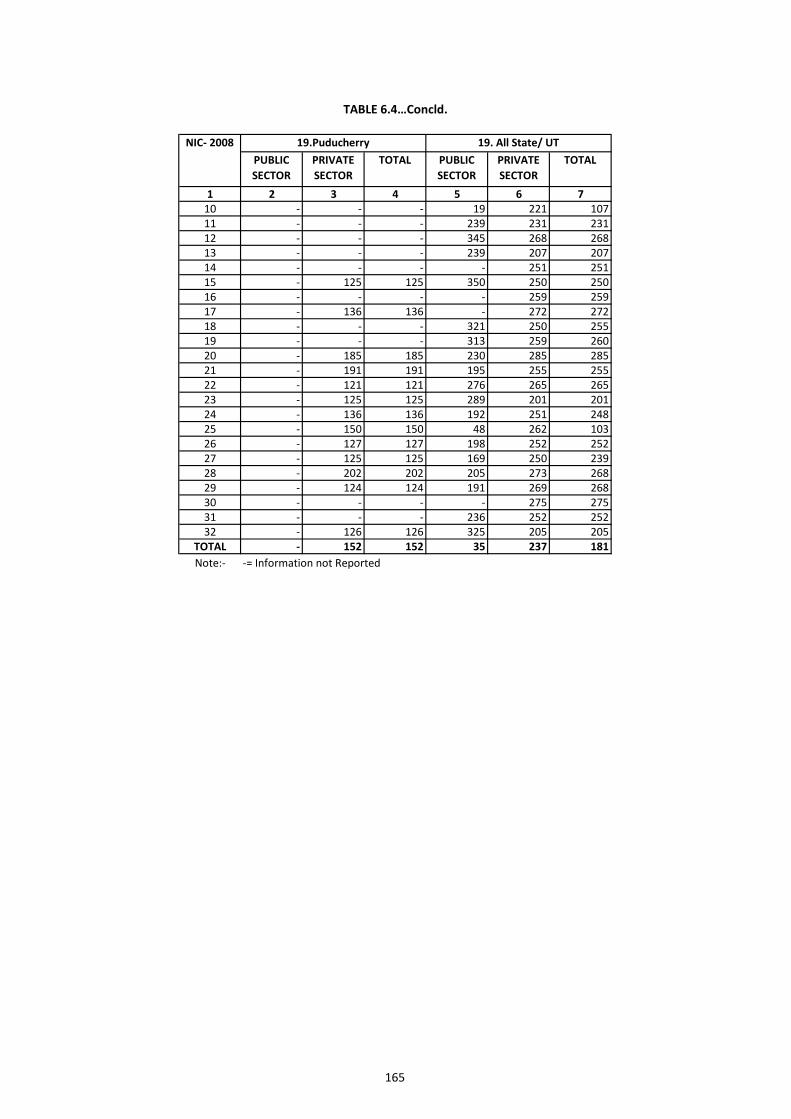
165
PUBLIC SECTOR
PRIVATE SECTOR
TOTAL PUBLIC SECTOR
PRIVATE SECTOR
TOTAL
1 2 3 4 5 6 710 - - - 19 221 10711 - - - 239 231 23112 - - - 345 268 26813 - - - 239 207 20714 - - - - 251 25115 - 125 125 350 250 25016 - - - - 259 25917 - 136 136 - 272 27218 - - - 321 250 25519 - - - 313 259 26020 - 185 185 230 285 28521 - 191 191 195 255 25522 - 121 121 276 265 26523 - 125 125 289 201 20124 - 136 136 192 251 24825 - 150 150 48 262 10326 - 127 127 198 252 25227 - 125 125 169 250 23928 - 202 202 205 273 26829 - 124 124 191 269 26830 - - - - 275 27531 - - - 236 252 25232 - 126 126 325 205 205
TOTAL - 152 152 35 237 181Note:- -= Information not Reported
TABLE 6.4…Concld.
NIC- 2008 19.Puducherry 19. All State/ UT
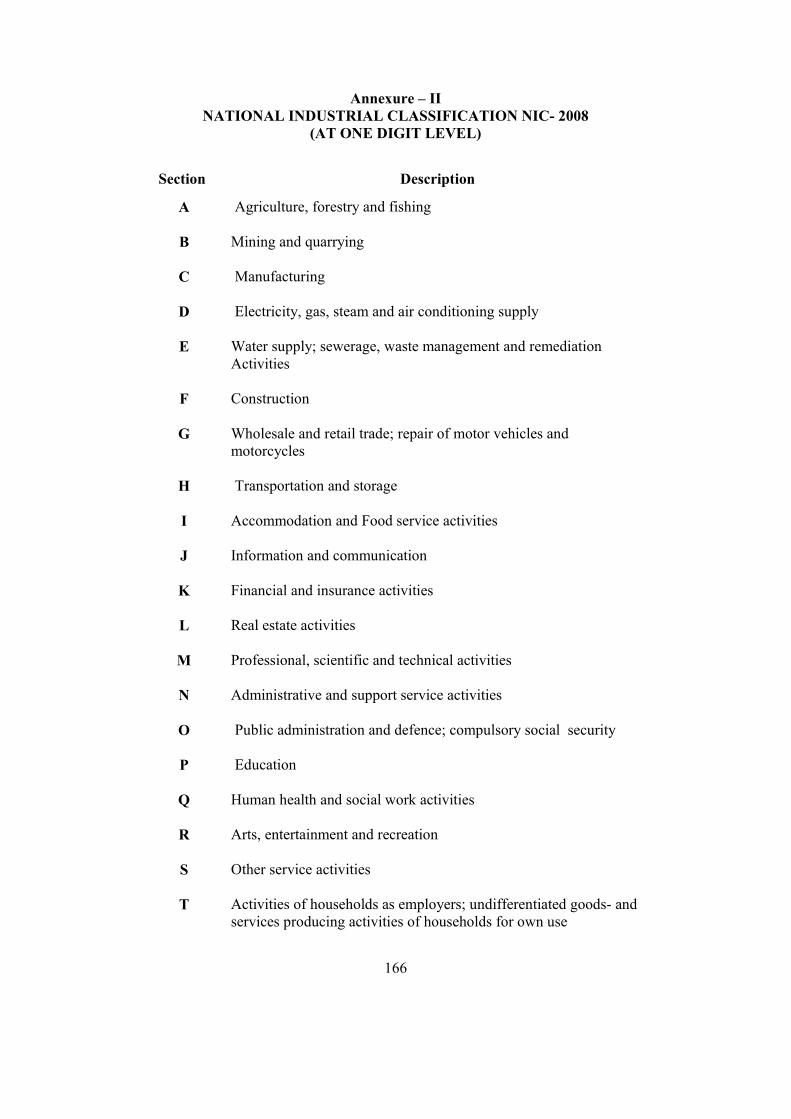
166
Annexure – II NATIONAL INDUSTRIAL CLASSIFICATION NIC- 2008
(AT ONE DIGIT LEVEL)
Section Description
A
Agriculture, forestry and fishing
B
Mining and quarrying
C
Manufacturing
D
Electricity, gas, steam and air conditioning supply
E
Water supply; sewerage, waste management and remediation Activities
F
Construction
G
Wholesale and retail trade; repair of motor vehicles and motorcycles
H
Transportation and storage
I
Accommodation and Food service activities
J
Information and communication
K
Financial and insurance activities
L
Real estate activities
M
Professional, scientific and technical activities
N
Administrative and support service activities
O
Public administration and defence; compulsory social security
P
Education
Q
Human health and social work activities
R
Arts, entertainment and recreation
S
Other service activities
T Activities of households as employers; undifferentiated goods- and services producing activities of households for own use
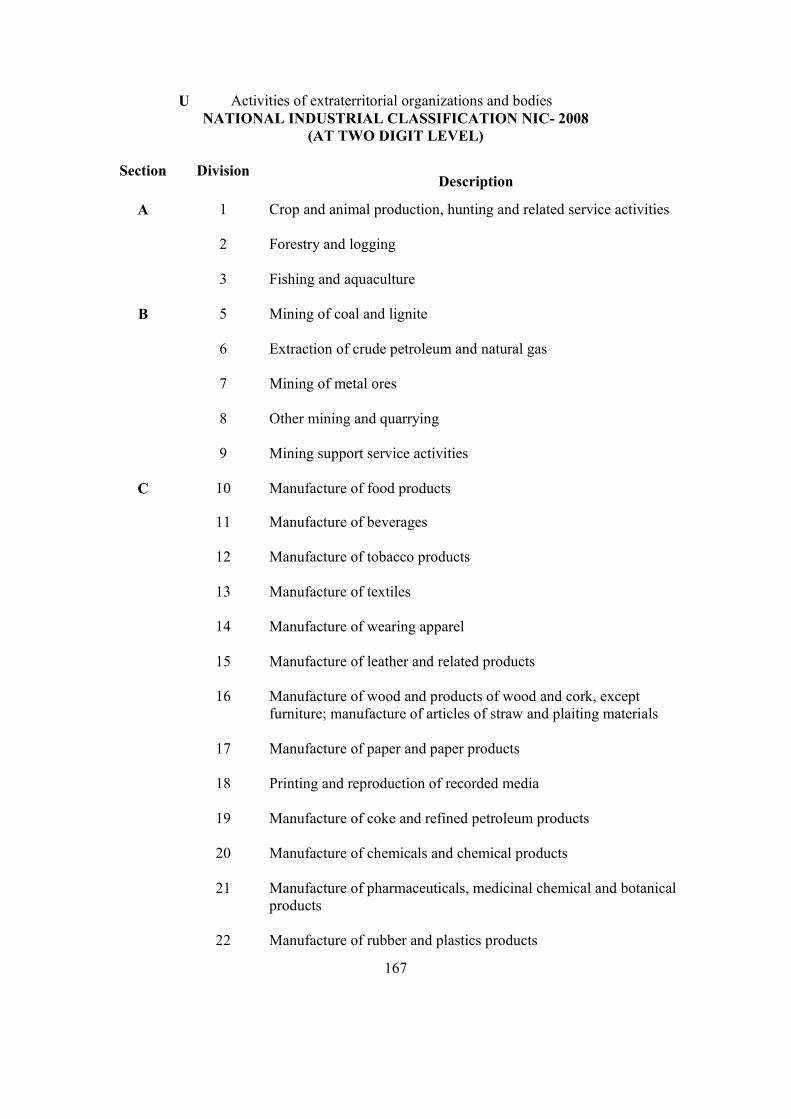
167
U Activities of extraterritorial organizations and bodies NATIONAL INDUSTRIAL CLASSIFICATION NIC- 2008
(AT TWO DIGIT LEVEL)
Section Division Description
A 1 Crop and animal production, hunting and related service activities
2 Forestry and logging
3 Fishing and aquaculture
B 5 Mining of coal and lignite
6 Extraction of crude petroleum and natural gas
7 Mining of metal ores
8 Other mining and quarrying
9 Mining support service activities
C 10 Manufacture of food products
11 Manufacture of beverages
12 Manufacture of tobacco products
13 Manufacture of textiles
14 Manufacture of wearing apparel
15 Manufacture of leather and related products
16 Manufacture of wood and products of wood and cork, except furniture; manufacture of articles of straw and plaiting materials
17 Manufacture of paper and paper products
18 Printing and reproduction of recorded media
19 Manufacture of coke and refined petroleum products
20 Manufacture of chemicals and chemical products
21 Manufacture of pharmaceuticals, medicinal chemical and botanical products
22 Manufacture of rubber and plastics products
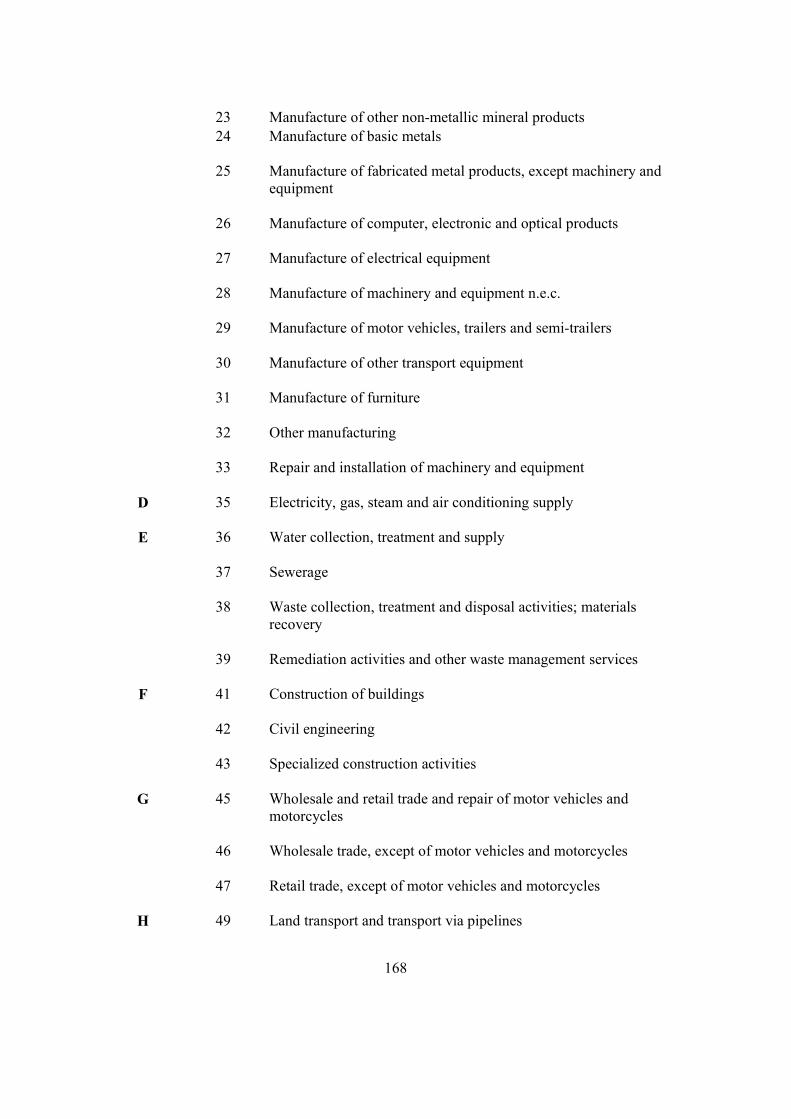
168
23 Manufacture of other non-metallic mineral products
24 Manufacture of basic metals
25 Manufacture of fabricated metal products, except machinery and equipment
26 Manufacture of computer, electronic and optical products
27 Manufacture of electrical equipment
28 Manufacture of machinery and equipment n.e.c.
29 Manufacture of motor vehicles, trailers and semi-trailers
30 Manufacture of other transport equipment
31 Manufacture of furniture
32 Other manufacturing
33 Repair and installation of machinery and equipment
D 35 Electricity, gas, steam and air conditioning supply
E 36 Water collection, treatment and supply
37 Sewerage
38 Waste collection, treatment and disposal activities; materials recovery
39 Remediation activities and other waste management services
F 41 Construction of buildings
42 Civil engineering
43 Specialized construction activities
G 45 Wholesale and retail trade and repair of motor vehicles and motorcycles
46 Wholesale trade, except of motor vehicles and motorcycles
47 Retail trade, except of motor vehicles and motorcycles
H 49 Land transport and transport via pipelines
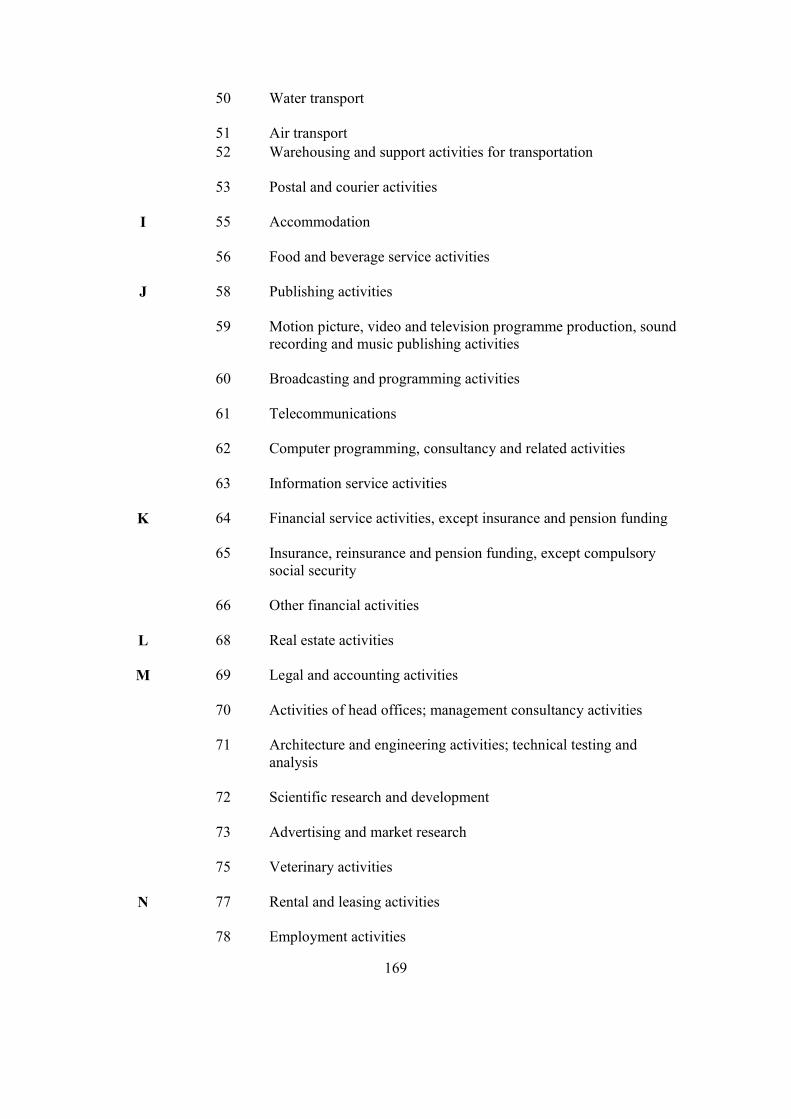
169
50 Water transport
51 Air transport
52 Warehousing and support activities for transportation
53 Postal and courier activities
I 55 Accommodation
56 Food and beverage service activities
J 58 Publishing activities
59 Motion picture, video and television programme production, sound recording and music publishing activities
60 Broadcasting and programming activities
61 Telecommunications
62 Computer programming, consultancy and related activities
63 Information service activities
K 64 Financial service activities, except insurance and pension funding
65 Insurance, reinsurance and pension funding, except compulsory social security
66 Other financial activities
L 68 Real estate activities
M 69 Legal and accounting activities
70 Activities of head offices; management consultancy activities
71 Architecture and engineering activities; technical testing and analysis
72 Scientific research and development
73 Advertising and market research
75 Veterinary activities
N 77 Rental and leasing activities
78 Employment activities
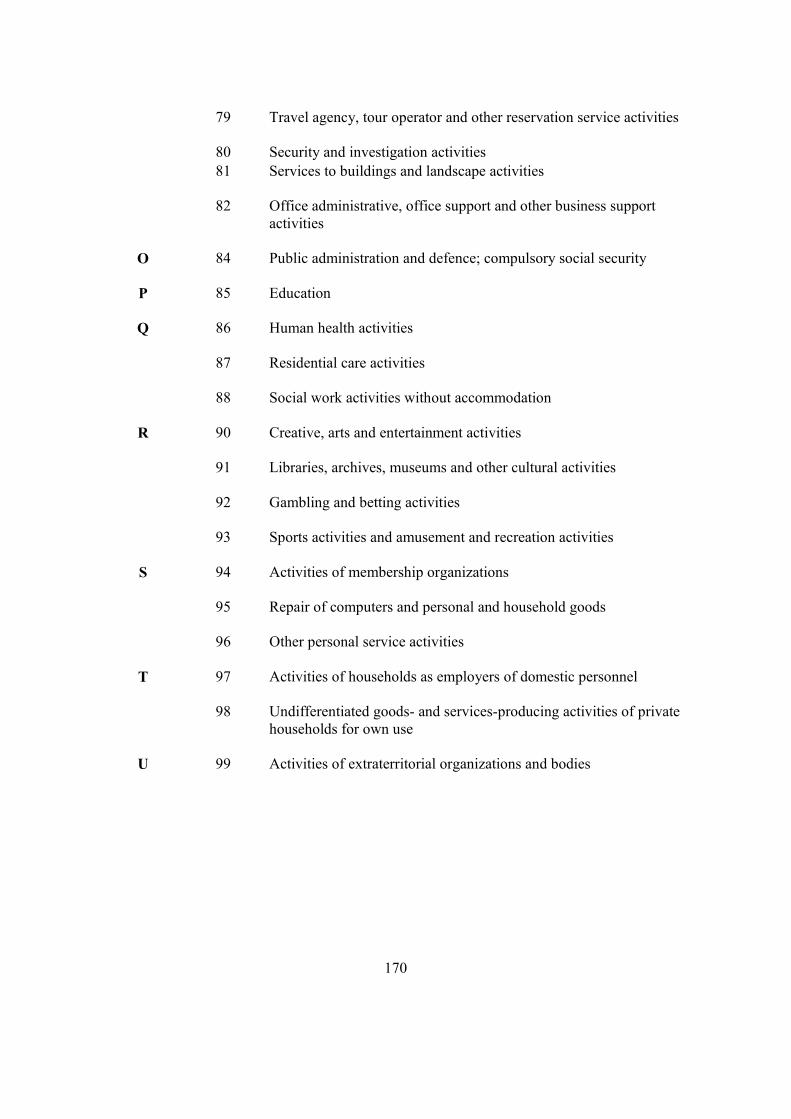
170
79 Travel agency, tour operator and other reservation service activities
80 Security and investigation activities
81 Services to buildings and landscape activities
82 Office administrative, office support and other business support activities
O 84 Public administration and defence; compulsory social security
P 85 Education
Q 86 Human health activities
87 Residential care activities
88 Social work activities without accommodation
R 90 Creative, arts and entertainment activities
91 Libraries, archives, museums and other cultural activities
92 Gambling and betting activities
93 Sports activities and amusement and recreation activities
S 94 Activities of membership organizations
95 Repair of computers and personal and household goods
96 Other personal service activities
T 97 Activities of households as employers of domestic personnel
98 Undifferentiated goods- and services-producing activities of private households for own use
U 99 Activities of extraterritorial organizations and bodies
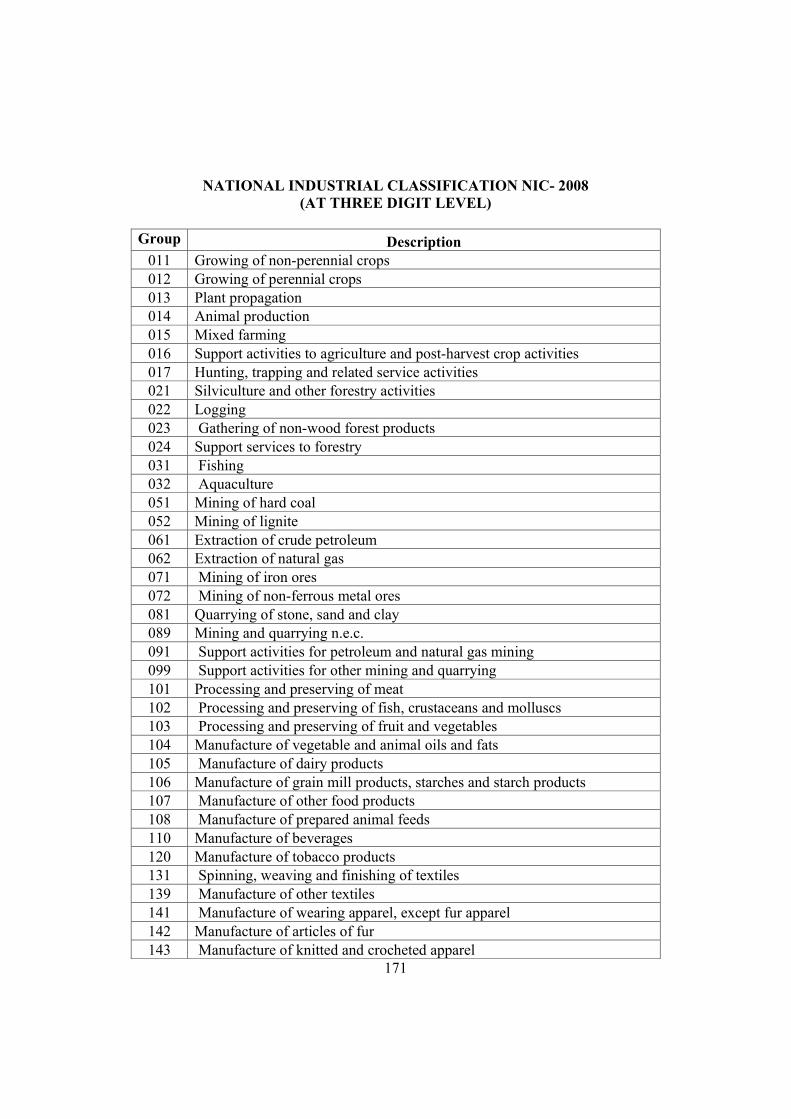
171
NATIONAL INDUSTRIAL CLASSIFICATION NIC- 2008 (AT THREE DIGIT LEVEL)
Group Description
011 Growing of non-perennial crops 012 Growing of perennial crops 013 Plant propagation 014 Animal production 015 Mixed farming 016 Support activities to agriculture and post-harvest crop activities 017 Hunting, trapping and related service activities 021 Silviculture and other forestry activities 022 Logging 023 Gathering of non-wood forest products 024 Support services to forestry 031 Fishing 032 Aquaculture 051 Mining of hard coal 052 Mining of lignite 061 Extraction of crude petroleum 062 Extraction of natural gas 071 Mining of iron ores 072 Mining of non-ferrous metal ores 081 Quarrying of stone, sand and clay 089 Mining and quarrying n.e.c. 091 Support activities for petroleum and natural gas mining 099 Support activities for other mining and quarrying 101 Processing and preserving of meat 102 Processing and preserving of fish, crustaceans and molluscs 103 Processing and preserving of fruit and vegetables 104 Manufacture of vegetable and animal oils and fats 105 Manufacture of dairy products 106 Manufacture of grain mill products, starches and starch products 107 Manufacture of other food products 108 Manufacture of prepared animal feeds 110 Manufacture of beverages 120 Manufacture of tobacco products 131 Spinning, weaving and finishing of textiles 139 Manufacture of other textiles 141 Manufacture of wearing apparel, except fur apparel 142 Manufacture of articles of fur 143 Manufacture of knitted and crocheted apparel
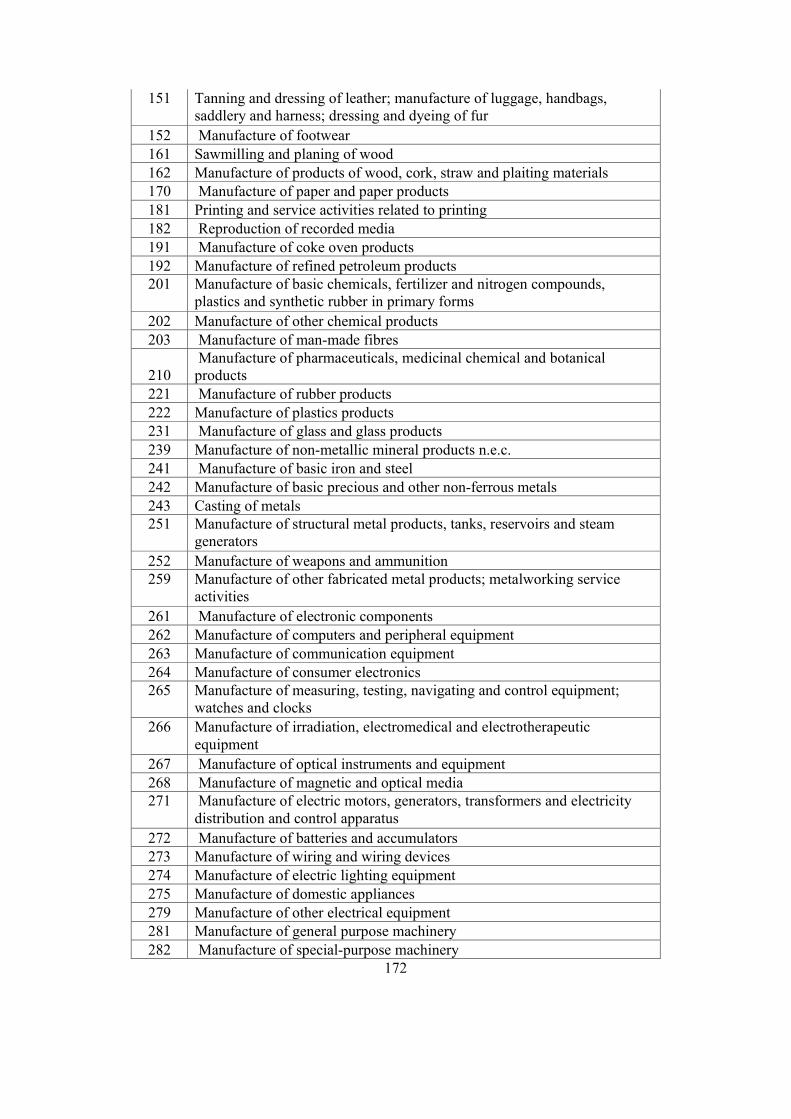
172
151 Tanning and dressing of leather; manufacture of luggage, handbags, saddlery and harness; dressing and dyeing of fur
152 Manufacture of footwear 161 Sawmilling and planing of wood 162 Manufacture of products of wood, cork, straw and plaiting materials 170 Manufacture of paper and paper products 181 Printing and service activities related to printing 182 Reproduction of recorded media 191 Manufacture of coke oven products 192 Manufacture of refined petroleum products 201 Manufacture of basic chemicals, fertilizer and nitrogen compounds,
plastics and synthetic rubber in primary forms
202 Manufacture of other chemical products 203 Manufacture of man-made fibres
210 Manufacture of pharmaceuticals, medicinal chemical and botanical products
221 Manufacture of rubber products 222 Manufacture of plastics products 231 Manufacture of glass and glass products 239 Manufacture of non-metallic mineral products n.e.c. 241 Manufacture of basic iron and steel 242 Manufacture of basic precious and other non-ferrous metals 243 Casting of metals 251 Manufacture of structural metal products, tanks, reservoirs and steam
generators
252 Manufacture of weapons and ammunition 259 Manufacture of other fabricated metal products; metalworking service
activities
261 Manufacture of electronic components 262 Manufacture of computers and peripheral equipment 263 Manufacture of communication equipment 264 Manufacture of consumer electronics 265 Manufacture of measuring, testing, navigating and control equipment;
watches and clocks
266 Manufacture of irradiation, electromedical and electrotherapeutic equipment
267 Manufacture of optical instruments and equipment 268 Manufacture of magnetic and optical media 271 Manufacture of electric motors, generators, transformers and electricity
distribution and control apparatus
272 Manufacture of batteries and accumulators 273 Manufacture of wiring and wiring devices 274 Manufacture of electric lighting equipment 275 Manufacture of domestic appliances 279 Manufacture of other electrical equipment 281 Manufacture of general purpose machinery 282 Manufacture of special-purpose machinery
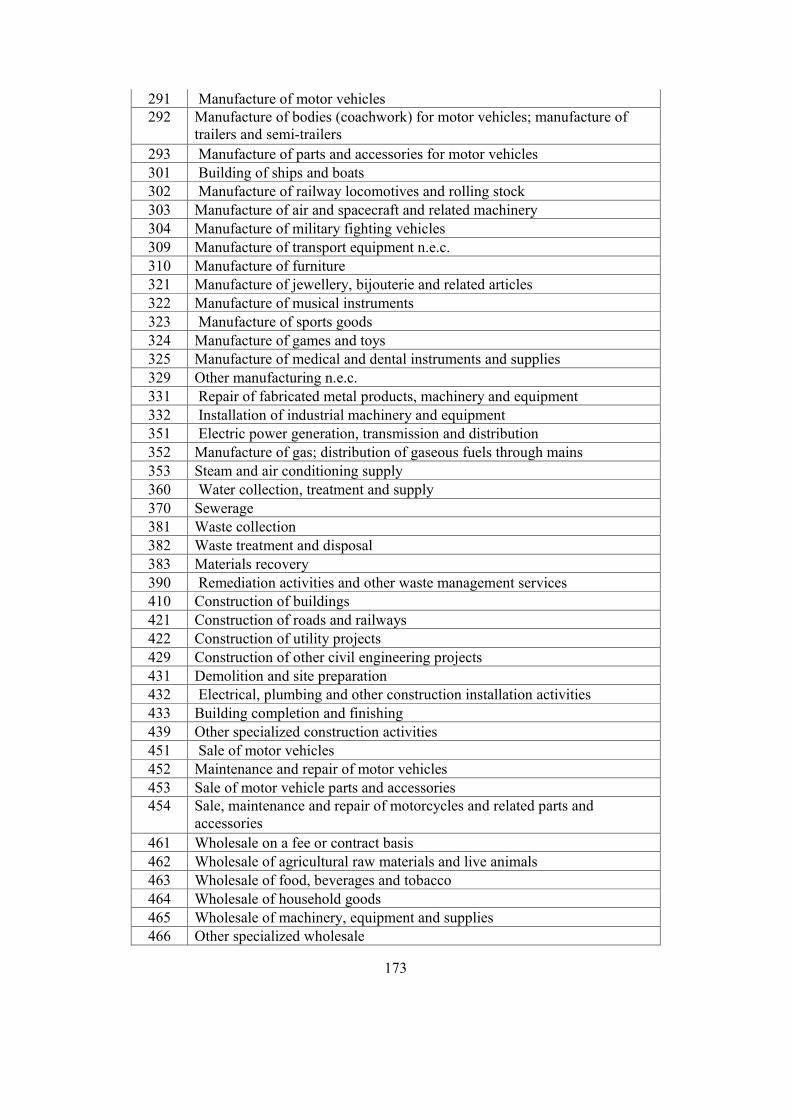
173
291 Manufacture of motor vehicles 292 Manufacture of bodies (coachwork) for motor vehicles; manufacture of
trailers and semi-trailers
293 Manufacture of parts and accessories for motor vehicles 301 Building of ships and boats 302 Manufacture of railway locomotives and rolling stock 303 Manufacture of air and spacecraft and related machinery 304 Manufacture of military fighting vehicles 309 Manufacture of transport equipment n.e.c. 310 Manufacture of furniture 321 Manufacture of jewellery, bijouterie and related articles 322 Manufacture of musical instruments 323 Manufacture of sports goods 324 Manufacture of games and toys 325 Manufacture of medical and dental instruments and supplies 329 Other manufacturing n.e.c. 331 Repair of fabricated metal products, machinery and equipment 332 Installation of industrial machinery and equipment 351 Electric power generation, transmission and distribution 352 Manufacture of gas; distribution of gaseous fuels through mains 353 Steam and air conditioning supply 360 Water collection, treatment and supply 370 Sewerage 381 Waste collection 382 Waste treatment and disposal 383 Materials recovery 390 Remediation activities and other waste management services 410 Construction of buildings 421 Construction of roads and railways 422 Construction of utility projects 429 Construction of other civil engineering projects 431 Demolition and site preparation 432 Electrical, plumbing and other construction installation activities 433 Building completion and finishing 439 Other specialized construction activities 451 Sale of motor vehicles 452 Maintenance and repair of motor vehicles 453 Sale of motor vehicle parts and accessories 454 Sale, maintenance and repair of motorcycles and related parts and
accessories
461 Wholesale on a fee or contract basis 462 Wholesale of agricultural raw materials and live animals 463 Wholesale of food, beverages and tobacco 464 Wholesale of household goods 465 Wholesale of machinery, equipment and supplies 466 Other specialized wholesale
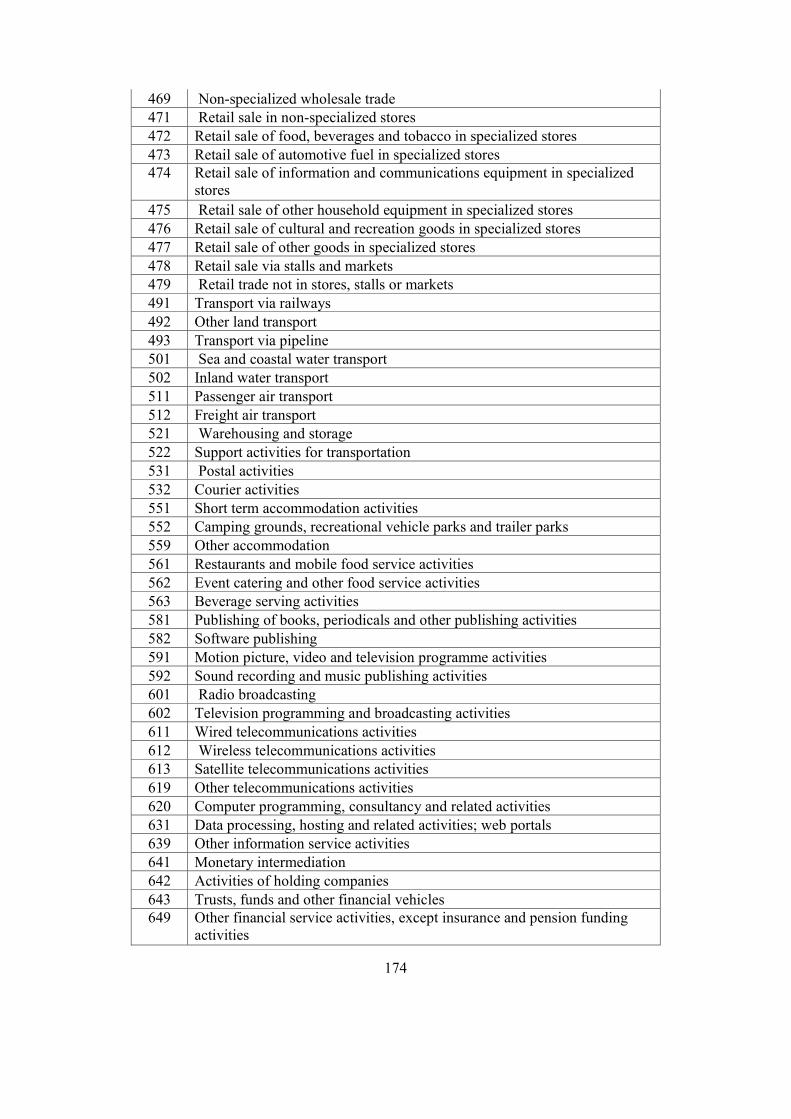
174
469 Non-specialized wholesale trade 471 Retail sale in non-specialized stores 472 Retail sale of food, beverages and tobacco in specialized stores 473 Retail sale of automotive fuel in specialized stores 474 Retail sale of information and communications equipment in specialized
stores
475 Retail sale of other household equipment in specialized stores 476 Retail sale of cultural and recreation goods in specialized stores 477 Retail sale of other goods in specialized stores 478 Retail sale via stalls and markets 479 Retail trade not in stores, stalls or markets 491 Transport via railways 492 Other land transport 493 Transport via pipeline 501 Sea and coastal water transport 502 Inland water transport 511 Passenger air transport 512 Freight air transport 521 Warehousing and storage 522 Support activities for transportation 531 Postal activities 532 Courier activities 551 Short term accommodation activities 552 Camping grounds, recreational vehicle parks and trailer parks 559 Other accommodation 561 Restaurants and mobile food service activities 562 Event catering and other food service activities 563 Beverage serving activities 581 Publishing of books, periodicals and other publishing activities 582 Software publishing 591 Motion picture, video and television programme activities 592 Sound recording and music publishing activities 601 Radio broadcasting 602 Television programming and broadcasting activities 611 Wired telecommunications activities 612 Wireless telecommunications activities 613 Satellite telecommunications activities 619 Other telecommunications activities 620 Computer programming, consultancy and related activities 631 Data processing, hosting and related activities; web portals 639 Other information service activities 641 Monetary intermediation 642 Activities of holding companies 643 Trusts, funds and other financial vehicles 649 Other financial service activities, except insurance and pension funding
activities
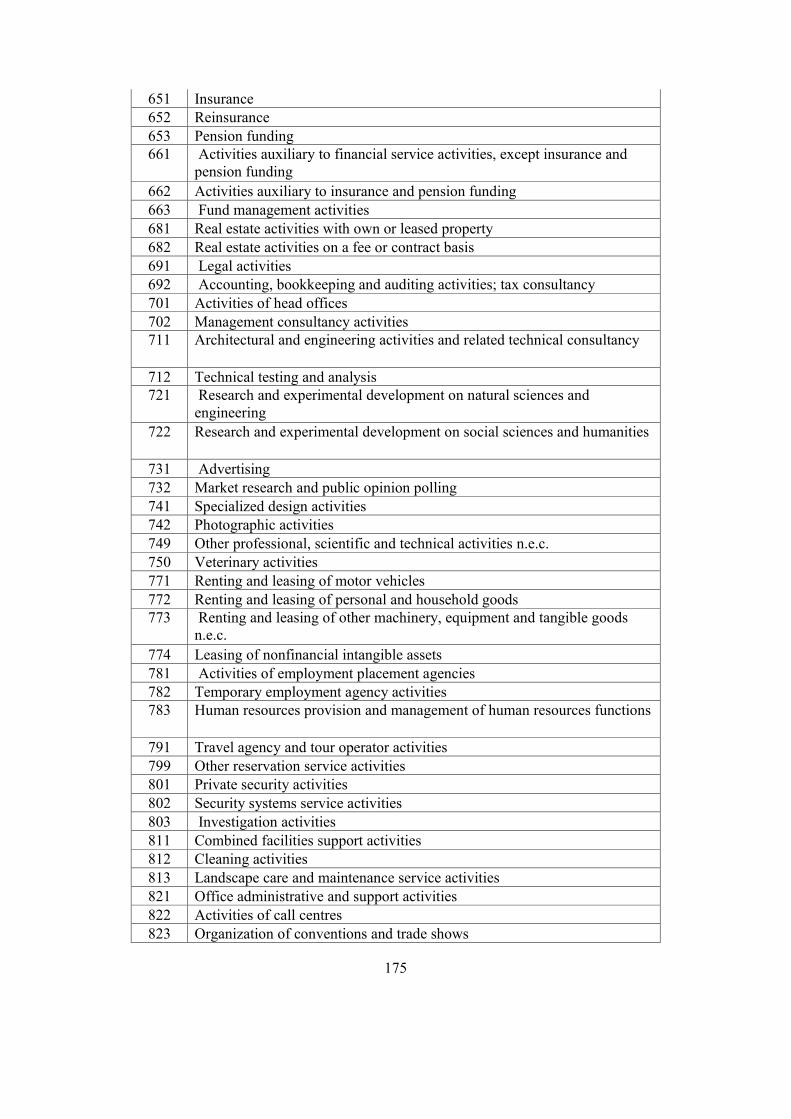
175
651 Insurance 652 Reinsurance 653 Pension funding 661 Activities auxiliary to financial service activities, except insurance and
pension funding
662 Activities auxiliary to insurance and pension funding 663 Fund management activities 681 Real estate activities with own or leased property 682 Real estate activities on a fee or contract basis 691 Legal activities 692 Accounting, bookkeeping and auditing activities; tax consultancy 701 Activities of head offices 702 Management consultancy activities 711 Architectural and engineering activities and related technical consultancy
712 Technical testing and analysis 721 Research and experimental development on natural sciences and
engineering
722 Research and experimental development on social sciences and humanities
731 Advertising 732 Market research and public opinion polling 741 Specialized design activities 742 Photographic activities 749 Other professional, scientific and technical activities n.e.c. 750 Veterinary activities 771 Renting and leasing of motor vehicles 772 Renting and leasing of personal and household goods 773 Renting and leasing of other machinery, equipment and tangible goods
n.e.c.
774 Leasing of nonfinancial intangible assets 781 Activities of employment placement agencies 782 Temporary employment agency activities 783 Human resources provision and management of human resources functions
791 Travel agency and tour operator activities 799 Other reservation service activities 801 Private security activities 802 Security systems service activities 803 Investigation activities 811 Combined facilities support activities 812 Cleaning activities 813 Landscape care and maintenance service activities 821 Office administrative and support activities 822 Activities of call centres 823 Organization of conventions and trade shows
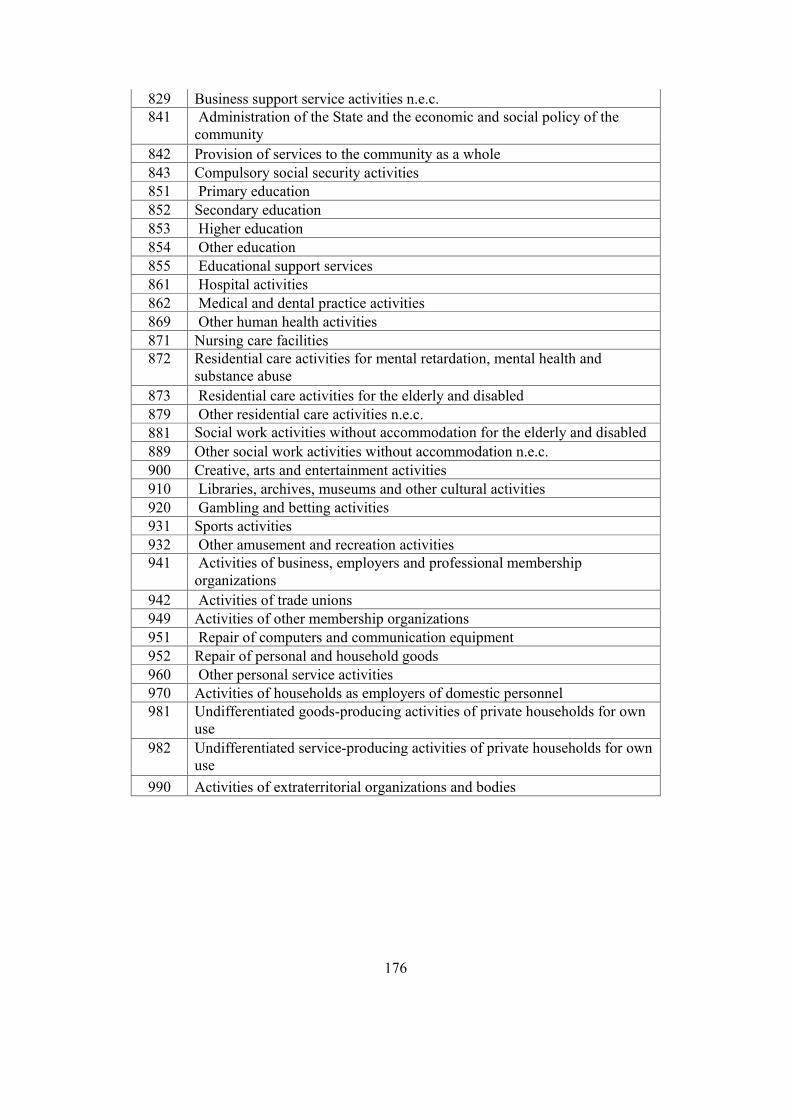
176
829 Business support service activities n.e.c. 841 Administration of the State and the economic and social policy of the
community
842 Provision of services to the community as a whole 843 Compulsory social security activities 851 Primary education 852 Secondary education 853 Higher education 854 Other education 855 Educational support services 861 Hospital activities 862 Medical and dental practice activities 869 Other human health activities 871 Nursing care facilities 872 Residential care activities for mental retardation, mental health and
substance abuse
873 Residential care activities for the elderly and disabled 879 Other residential care activities n.e.c. 881 Social work activities without accommodation for the elderly and disabled
889 Other social work activities without accommodation n.e.c. 900 Creative, arts and entertainment activities 910 Libraries, archives, museums and other cultural activities 920 Gambling and betting activities 931 Sports activities 932 Other amusement and recreation activities 941 Activities of business, employers and professional membership
organizations
942 Activities of trade unions 949 Activities of other membership organizations 951 Repair of computers and communication equipment 952 Repair of personal and household goods 960 Other personal service activities 970 Activities of households as employers of domestic personnel 981 Undifferentiated goods-producing activities of private households for own
use
982 Undifferentiated service-producing activities of private households for own use
990 Activities of extraterritorial organizations and bodies
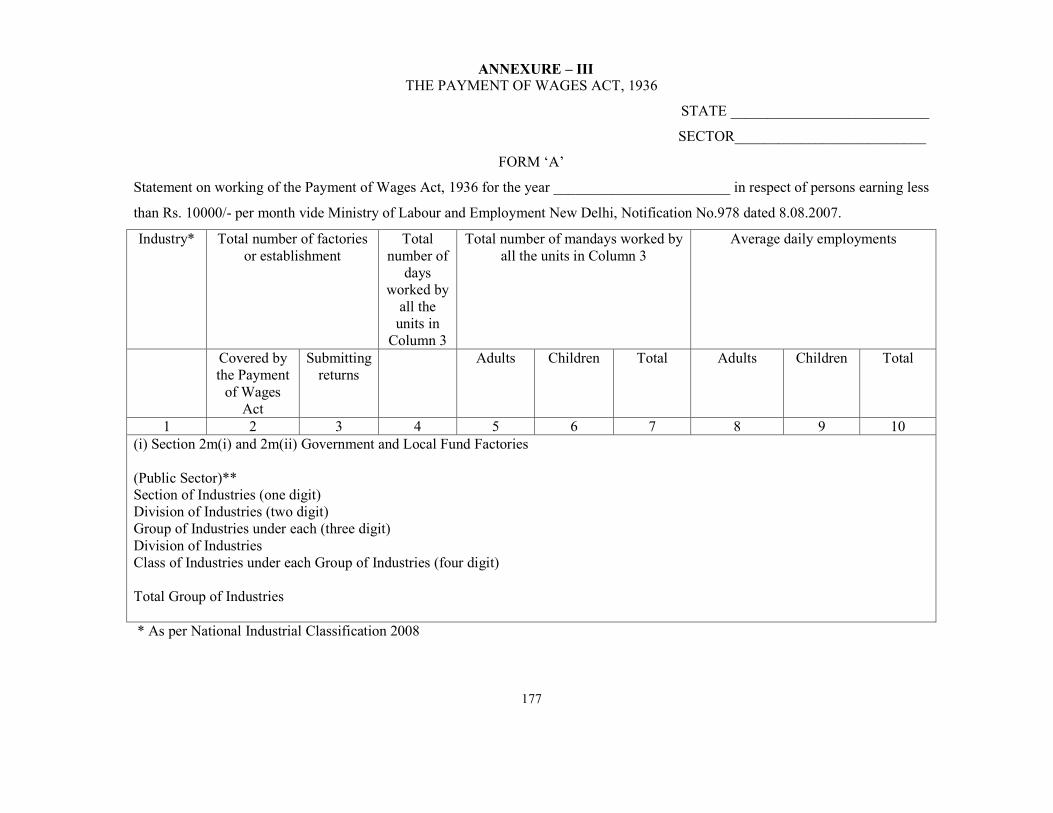
177
ANNEXURE – III THE PAYMENT OF WAGES ACT, 1936
STATE ___________________________
SECTOR__________________________
FORM ‘A’
Statement on working of the Payment of Wages Act, 1936 for the year ________________________ in respect of persons earning less
than Rs. 10000/- per month vide Ministry of Labour and Employment New Delhi, Notification No.978 dated 8.08.2007.
Industry* Total number of factories or establishment
Total number of
days worked by
all the units in
Column 3
Total number of mandays worked by all the units in Column 3
Average daily employments
Covered by the Payment
of Wages Act
Submitting returns
Adults Children Total Adults Children Total
1 2 3 4 5 6 7 8 9 10 (i) Section 2m(i) and 2m(ii) Government and Local Fund Factories (Public Sector)** Section of Industries (one digit) Division of Industries (two digit) Group of Industries under each (three digit) Division of Industries Class of Industries under each Group of Industries (four digit) Total Group of Industries * As per National Industrial Classification 2008
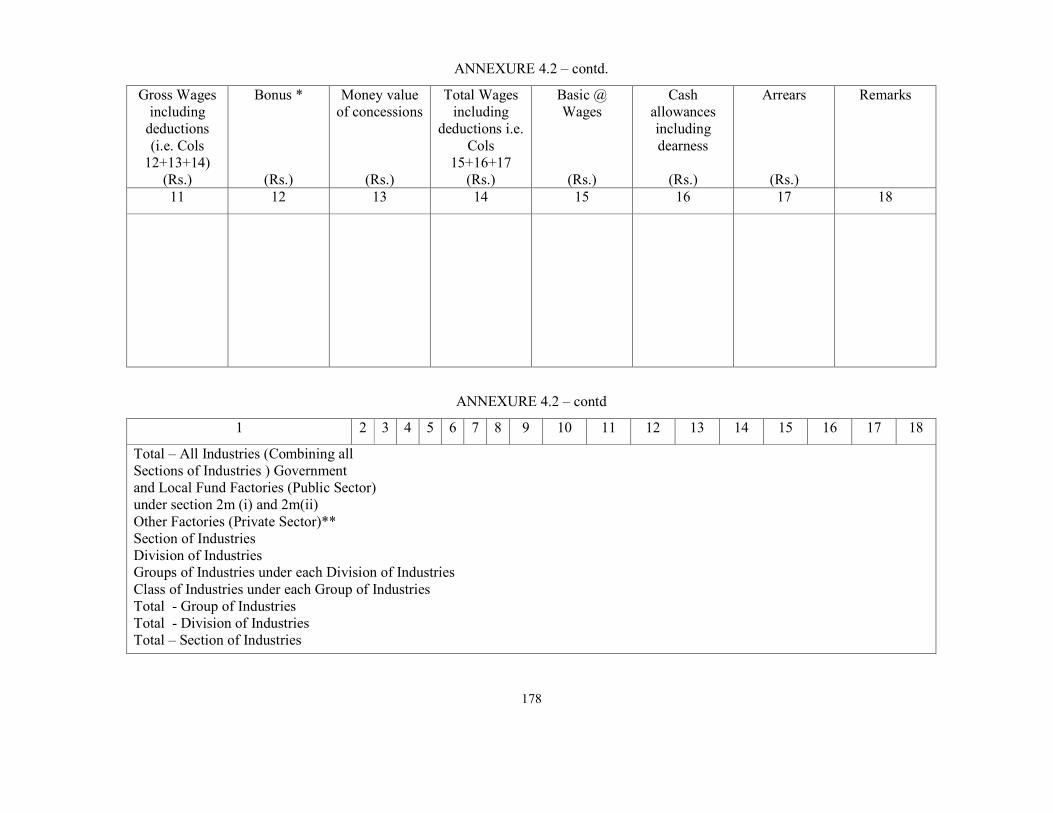
178
ANNEXURE 4.2 – contd.
Gross Wages including
deductions (i.e. Cols
12+13+14) (Rs.)
Bonus *
(Rs.)
Money value of concessions
(Rs.)
Total Wages including
deductions i.e. Cols
15+16+17 (Rs.)
Basic @ Wages
(Rs.)
Cash allowances including dearness
(Rs.)
Arrears
(Rs.)
Remarks
11 12 13 14 15 16 17 18
ANNEXURE 4.2 – contd
1 2 3 4 5 6 7 8 9 10 11 12 13 14 15 16 17 18
Total – All Industries (Combining all Sections of Industries ) Government and Local Fund Factories (Public Sector) under section 2m (i) and 2m(ii) Other Factories (Private Sector)** Section of Industries Division of Industries Groups of Industries under each Division of Industries Class of Industries under each Group of Industries Total - Group of Industries Total - Division of Industries Total – Section of Industries
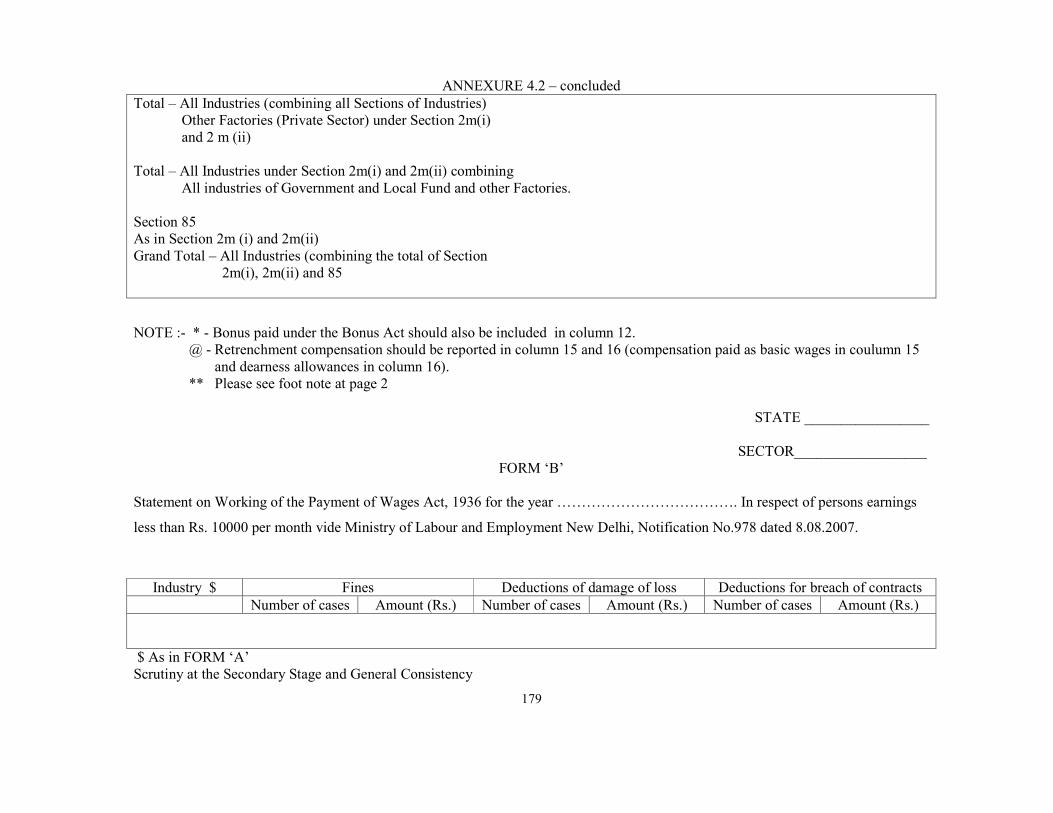
179
ANNEXURE 4.2 – concluded
Total – All Industries (combining all Sections of Industries) Other Factories (Private Sector) under Section 2m(i) and 2 m (ii) Total – All Industries under Section 2m(i) and 2m(ii) combining All industries of Government and Local Fund and other Factories. Section 85 As in Section 2m (i) and 2m(ii) Grand Total – All Industries (combining the total of Section 2m(i), 2m(ii) and 85
NOTE :- * - Bonus paid under the Bonus Act should also be included in column 12. @ - Retrenchment compensation should be reported in column 15 and 16 (compensation paid as basic wages in coulumn 15 and dearness allowances in column 16). ** Please see foot note at page 2
STATE _________________
SECTOR__________________ FORM ‘B’
Statement on Working of the Payment of Wages Act, 1936 for the year ………………………………. In respect of persons earnings
less than Rs. 10000 per month vide Ministry of Labour and Employment New Delhi, Notification No.978 dated 8.08.2007.
Industry $ Fines Deductions of damage of loss Deductions for breach of contracts Number of cases Amount (Rs.) Number of cases Amount (Rs.) Number of cases Amount (Rs.)
$ As in FORM ‘A’ Scrutiny at the Secondary Stage and General Consistency
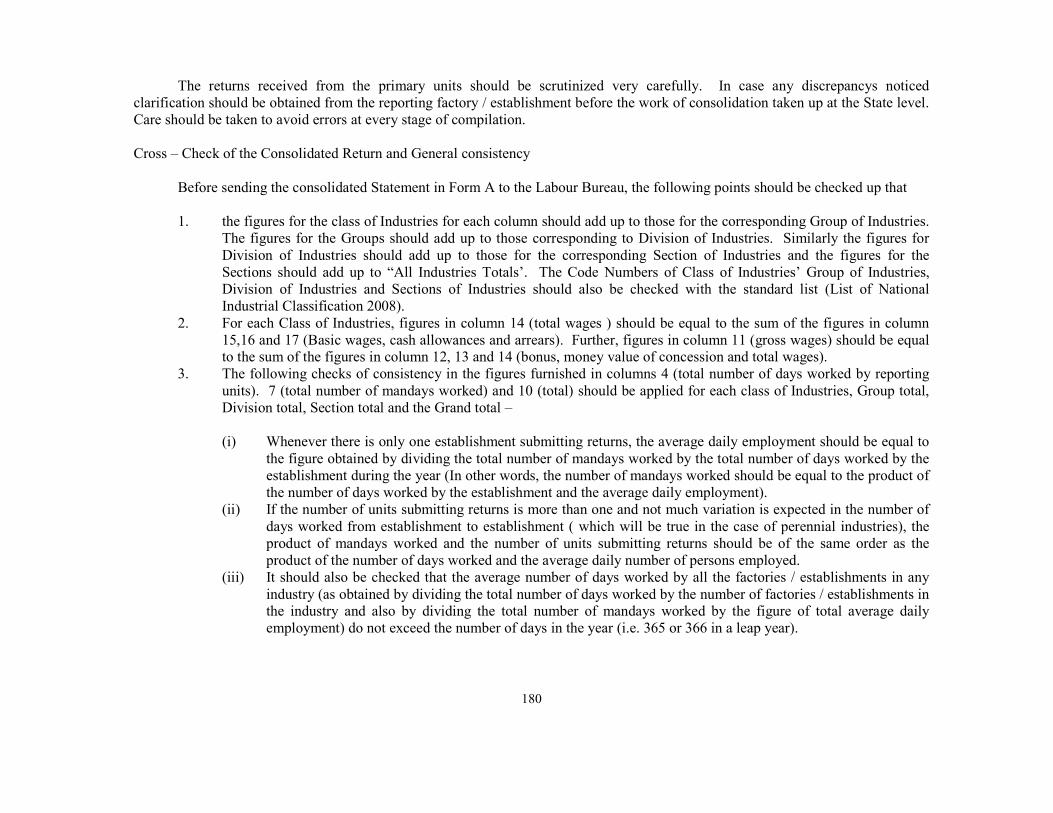
180
The returns received from the primary units should be scrutinized very carefully. In case any discrepancys noticed clarification should be obtained from the reporting factory / establishment before the work of consolidation taken up at the State level. Care should be taken to avoid errors at every stage of compilation. Cross – Check of the Consolidated Return and General consistency Before sending the consolidated Statement in Form A to the Labour Bureau, the following points should be checked up that
1. the figures for the class of Industries for each column should add up to those for the corresponding Group of Industries. The figures for the Groups should add up to those corresponding to Division of Industries. Similarly the figures for Division of Industries should add up to those for the corresponding Section of Industries and the figures for the Sections should add up to “All Industries Totals’. The Code Numbers of Class of Industries’ Group of Industries, Division of Industries and Sections of Industries should also be checked with the standard list (List of National Industrial Classification 2008).
2. For each Class of Industries, figures in column 14 (total wages ) should be equal to the sum of the figures in column 15,16 and 17 (Basic wages, cash allowances and arrears). Further, figures in column 11 (gross wages) should be equal to the sum of the figures in column 12, 13 and 14 (bonus, money value of concession and total wages).
3. The following checks of consistency in the figures furnished in columns 4 (total number of days worked by reporting units). 7 (total number of mandays worked) and 10 (total) should be applied for each class of Industries, Group total, Division total, Section total and the Grand total –
(i) Whenever there is only one establishment submitting returns, the average daily employment should be equal to
the figure obtained by dividing the total number of mandays worked by the total number of days worked by the establishment during the year (In other words, the number of mandays worked should be equal to the product of the number of days worked by the establishment and the average daily employment).
(ii) If the number of units submitting returns is more than one and not much variation is expected in the number of days worked from establishment to establishment ( which will be true in the case of perennial industries), the product of mandays worked and the number of units submitting returns should be of the same order as the product of the number of days worked and the average daily number of persons employed.
(iii) It should also be checked that the average number of days worked by all the factories / establishments in any industry (as obtained by dividing the total number of days worked by the number of factories / establishments in the industry and also by dividing the total number of mandays worked by the figure of total average daily employment) do not exceed the number of days in the year (i.e. 365 or 366 in a leap year).
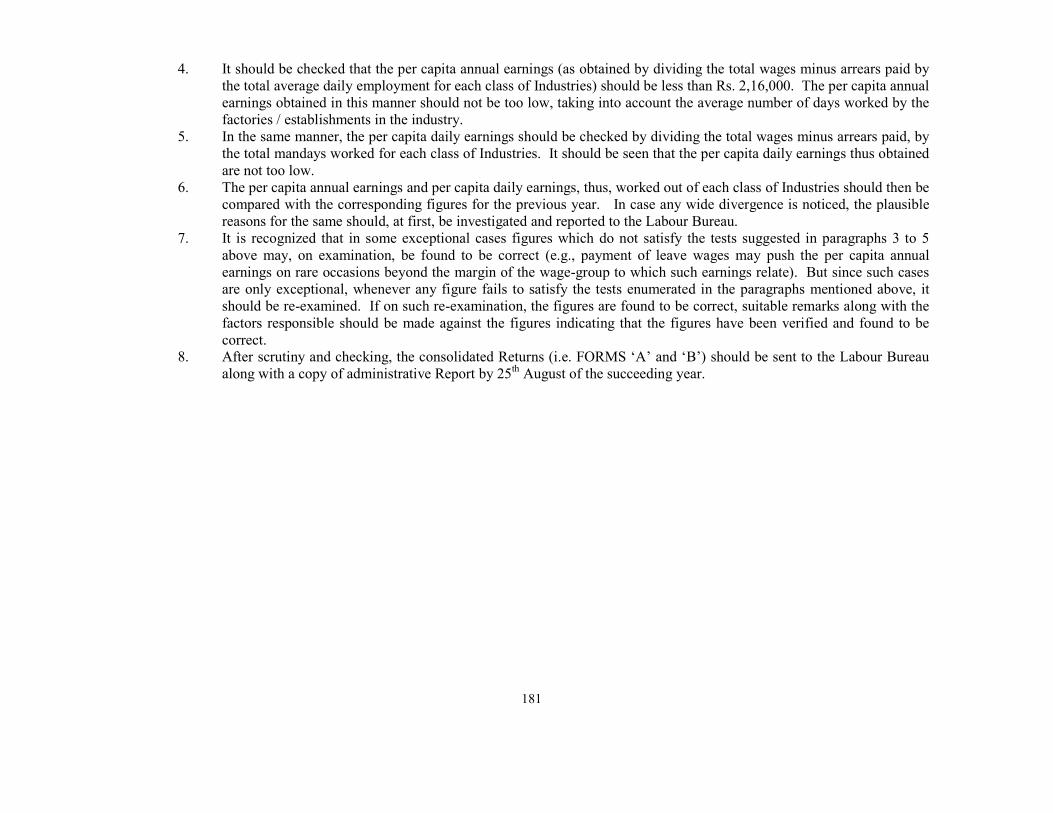
181
4. It should be checked that the per capita annual earnings (as obtained by dividing the total wages minus arrears paid by the total average daily employment for each class of Industries) should be less than Rs. 2,16,000. The per capita annual earnings obtained in this manner should not be too low, taking into account the average number of days worked by the factories / establishments in the industry.
5. In the same manner, the per capita daily earnings should be checked by dividing the total wages minus arrears paid, by the total mandays worked for each class of Industries. It should be seen that the per capita daily earnings thus obtained are not too low.
6. The per capita annual earnings and per capita daily earnings, thus, worked out of each class of Industries should then be compared with the corresponding figures for the previous year. In case any wide divergence is noticed, the plausible reasons for the same should, at first, be investigated and reported to the Labour Bureau.
7. It is recognized that in some exceptional cases figures which do not satisfy the tests suggested in paragraphs 3 to 5 above may, on examination, be found to be correct (e.g., payment of leave wages may push the per capita annual earnings on rare occasions beyond the margin of the wage-group to which such earnings relate). But since such cases are only exceptional, whenever any figure fails to satisfy the tests enumerated in the paragraphs mentioned above, it should be re-examined. If on such re-examination, the figures are found to be correct, suitable remarks along with the factors responsible should be made against the figures indicating that the figures have been verified and found to be correct.
8. After scrutiny and checking, the consolidated Returns (i.e. FORMS ‘A’ and ‘B’) should be sent to the Labour Bureau along with a copy of administrative Report by 25th August of the succeeding year.
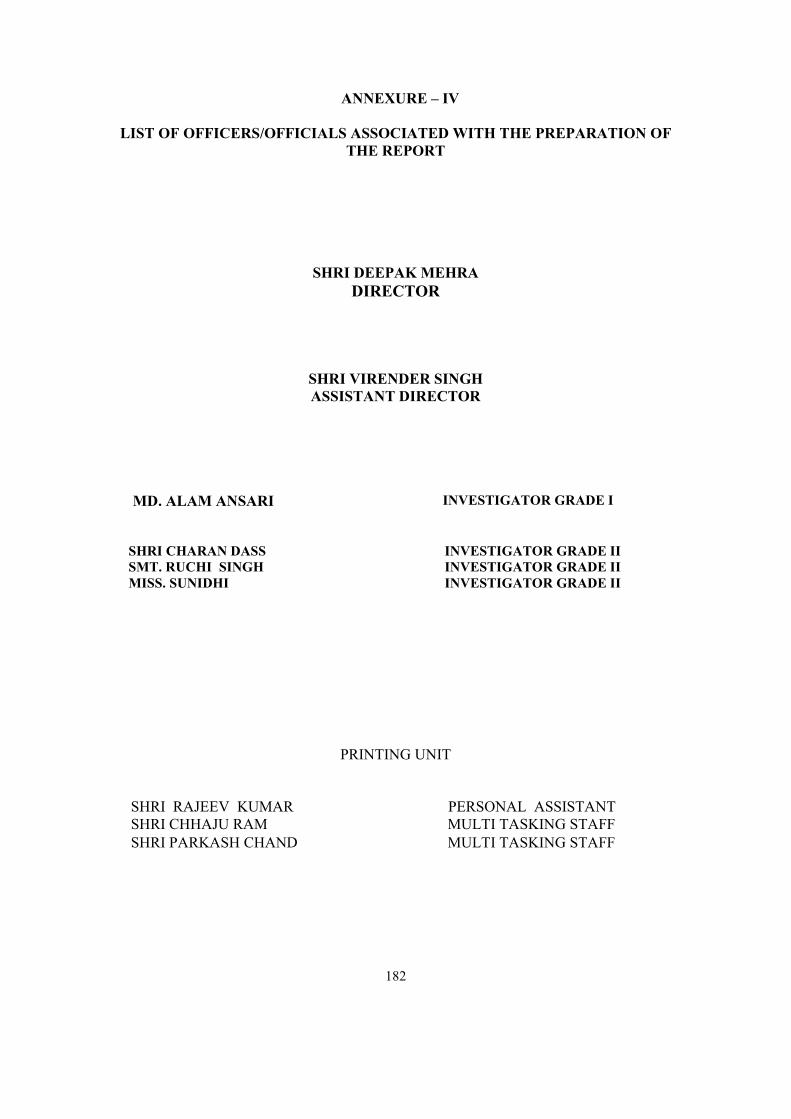
182
ANNEXURE – IV
LIST OF OFFICERS/OFFICIALS ASSOCIATED WITH THE PREPARATION OF THE REPORT
SHRI DEEPAK MEHRA DIRECTOR
SHRI VIRENDER SINGH ASSISTANT DIRECTOR
MD. ALAM ANSARI INVESTIGATOR GRADE I
SHRI CHARAN DASS SMT. RUCHI SINGH MISS. SUNIDHI
INVESTIGATOR GRADE II INVESTIGATOR GRADE II INVESTIGATOR GRADE II
PRINTING UNIT
SHRI RAJEEV KUMAR PERSONAL ASSISTANT SHRI CHHAJU RAM MULTI TASKING STAFF SHRI PARKASH CHAND MULTI TASKING STAFF