PREFACE AND ACKNOWLEDGEMENTS - Erasmus ... R.R.H. (343922).docx · Web viewThis paper investigates...
71
ERASMUS UNIVERSITY ROTTERDAM ERASMUS SCHOOL OF ECONOMICS MSc Economics & Business Master Specialisation Financial Economics Assessment of the Relationship Between Stock Prices And Oil Prices: An Investigation of the Japanese Automobile Manufacturers 1
Transcript of PREFACE AND ACKNOWLEDGEMENTS - Erasmus ... R.R.H. (343922).docx · Web viewThis paper investigates...

ERASMUS UNIVERSITY ROTTERDAMERASMUS SCHOOL OF ECONOMICSMSc Economics & BusinessMaster Specialisation Financial Economics
Assessment of the Relationship Between Stock Prices And Oil Prices: An Investigation of the Japanese Automobile Manufacturers
Author: R.R.H.LamhotStudent number: 343922ARThesis supervisor: Mehtap Kilic MSc LLMFinish date: August 4, 2011
1

PREFACE AND ACKNOWLEDGEMENTS
This thesis is about the influences of high oil prices on stock prices. I choose to combine economics with
a energy since I am interested in this topic. Moreover, I am interested in the automotive industries so that
it is interesting for me to analyze their performance. I have to finish my thesis to obtain my master degree
in Erasmus School of Economics. Without help and support that are given to me, this thesis would not be
perfectly done. Therefore, I would like to acknowledge for several individuals that offered their
comments and insights on my research. I wish to thank to my thesis supervisor Mehtap Kilic for her
feedbacks and spares her time during my thesis. My special thanks to my family in Indonesia who always
support me everytime while finishing my thesis. I would like to thank to Wienda Ayu Pramithasari for her
support that are given to me. I also would like to acknowledge to Rachel Liong who helps me finding the
data and helping about the statistics. I dedicate the best paper that I have ever done to them.
“He has made everything beautiful in its time. He has also set the eternity in the human heart; yet, no one can fathom what God has done from beginning to end”
NON-PLAGIARISM STATEMENTBy submitting this thesis the author declares to have written this thesis completely by himself/herself, and not to have used sources or resources other than the ones mentioned. All sources used, quotes and citations that were literally taken from publications, or that were in close accordance with the meaning of those publications, are indicated as such.
COPYRIGHT STATEMENTThe author has copyright of this thesis, but also acknowledges the intellectual copyright of contributions made by the thesis supervisor, which may include important research ideas and data. Author and thesis supervisor will have made clear agreements about issues such as confidentiality.
Electronic versions of the thesis are in principle available for inclusion in any EUR thesis database and repository, such as the Master Thesis Repository of the Erasmus University Rotterdam
2

ABSTRACT
This paper investigates the relationship between stock prices of Japanese automobile manufacturers and
crude oil prices. The thesis gives an idea how well the manufacturers perform while oil prices remains
volatile and to what extend oil prices should be looked as a crucial benchmark for Japanese auto industry
managers. A Fama and French three factor model which will extend to four factor of oil is used as
methodology to study its influence on stock returns of Japanese automobile industries. The results exhibit
that oil prices have a non-linear relationship with stock prices of Japanese auto companies. Surprisingly,
the results were positive during the occurence of Iraq invasion 2003. Furthermore, the boom in sales sales
of hybrid cars positively influence on stock prices of hybrid automakers when the recent rise in crude oil
prices.
Keywords: [Oil prices, Fama-French, Japan, Automobile manufacturers, Hybrid Cars]http://www.aeaweb.org/journal/jel_class_system.html ]
3

Table of ContentsPREFACE AND ACKNOWLEDGEMENTS........................................................................................2
ABSTRACT............................................................................................................................................3
LIST OF TABLES..................................................................................................................................5
LIST OF FIGURES.................................................................................................................................6
1. Introduction.........................................................................................................................................7
2. Literature Review..............................................................................................................................10
2.1. Oil prices and the economic growth...........................................................................................10
2.2. Oil prices and the stock market..................................................................................................11
2.3. Fama French three factor model................................................................................................13
3. Research Motivation..........................................................................................................................15
4. Hypothesis.........................................................................................................................................18
5. Data and Methodology......................................................................................................................20
5.1. Data Description.........................................................................................................................20
5.2. Methodology..............................................................................................................................22
6. Results...............................................................................................................................................27
6.1. Descriptive Statistics..................................................................................................................27
6.2. Regression Results.....................................................................................................................29
6.3. The Influence of the Hybrid Car................................................................................................32
7. Analyses and Interpretations.............................................................................................................35
7.1. Unusual events as external factors.............................................................................................35
7.2. Hybrid cars as an internal factor................................................................................................37
8. Conclusions.......................................................................................................................................40
REFERENCES......................................................................................................................................42
4

LIST OF TABLES
Table 1: Market shares of the top automobile manufacturers from 2007 to 2010.......................................16
Table 2: Toyota total sales of hybrid cars in Japan during fiscal year 2000–2010 (in thousand)...............21
Table 3 : Time Phases for Iraq war, credit crisis, and booming sales of hybrid car....................................22
Table 4 : Summary statistics – full sample..................................................................................................27
Table 5: Correlations – full sample..............................................................................................................28
Table 6: Regression results for the auto index............................................................................................30
Table 7: Hybrid car index............................................................................................................................33
Table 8: Regression results of Toyota index...............................................................................................34
Table 9: Regression results of Honda index................................................................................................34
Table 10: Regression results of Toyota and Honda after booming till before the earthquake....................34
5

LIST OF FIGURES
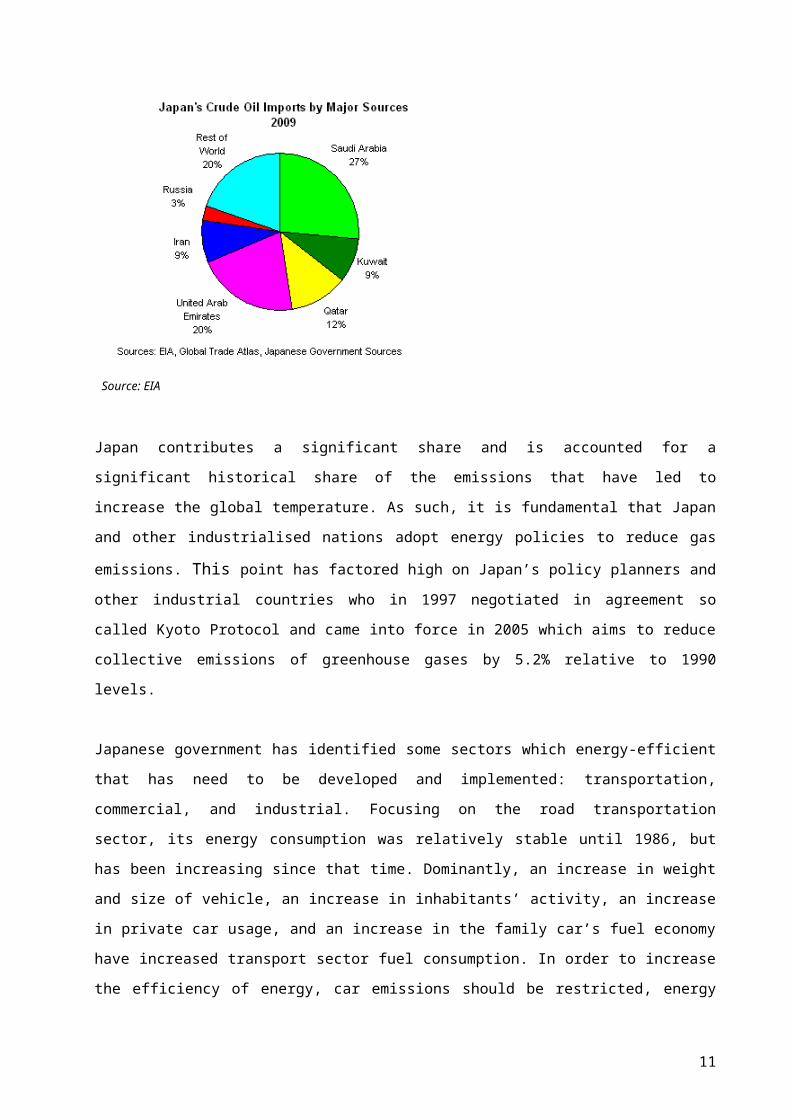
Figure 1: Major sources of crude oil imports by Japan.................................................................................8
Figure 2: Dubai crude oil price from 2001-2011.........................................................................................26
Figure 3: Returns on the market index.........................................................................................................28
Figure 4: Returns on the auto index.............................................................................................................29
6

1. Introduction
The world is dismal by recent histories. Ever since the credit crisis which was triggered by a liquidity
shortfall in the USA banking system, most of predominant economies for both developed and developing
countries were drowned in times of recession. This crisis is the worst tragedy since the great depression of
1929. Oil shocks have also contributed to global recessions in last thirty years. While the recent topic in
news was regarding on political instabilities in the Egypt, this has aggravated the problems facing the
global economy. The political risk weakens the value currency of the developing countries and moreover
affects commodity prices. Out of the major commodities, crude oil is a sensitive commodity. Oil is a
source of energy which is used in many routine activities of households or industries. It is used either as a
raw material for various industries or consumed by the product of these industries which are proxy by
energy prices and transportation prices respectively. Both prices influence cash flow and profitability
where linked to the price of oil. Therefore, for all these reasons oil shocks and its relationship to the
global economy receive important consideration on macroeconomic research.
The upsurge in the oil prices plays an important role which it would negatively affect the performance of
automotive manufacturers (see for example Boudette and White, 2005 and Cameron and Schnusenberg,
2008). Richard Heinberg states that oil provides 97 percent of the transportation fuels that operate the
vehicles in the nation’s highway. Thus, the increase in the oil prices also affect the type of vehicles
demanded by the customer and the way those vehicles are designed. Consumers demand for more fuel
vehicles seem reasonable as the oil prices continue to rise. The upsurge in the oil prices undoubtfully
affects the profit margin of the companies. The auto manufacturers clearly concern fuel efficient cars
because the automakers compete with each other to fullfill the consumers’ demands for more fuel
efficient consumer conscious at reasonable price. While apart of the realization increased consumer
demand for efficient vehicles, an investigation of the relationship between stock prices and oil prices of
Japanese automobile manufacturers is also valuable.
The economy of Japan is the third largest in the world ($5.391 trillion) in terms of GDP and Purchasing
Power Parity. However, Koike et al (2008) shows that Japan has limited domestic oil reserves.
Consequently, Japan’s industrial sector relies heavily on overseas supplies and must import substantial
amount of crude oil and natural gas. In 2009, Japan ranked second in terms of oil imported which came
mainly from Middle East. Because of the country’s lack of domestic oil reserves, the Japanese oil
companies have sought in participation in exploration and overseas oil production primarily located in the
Middle East and South East Asia.
7

Figure 1: Major sources of crude oil imports by Japan
Source: EIA
Japan contributes a significant share and is accounted for a significant historical share of the emissions
that have led to increase the global temperature. As such, it is fundamental that Japan and other
industrialised nations adopt energy policies to reduce gas emissions. This point has factored high on
Japan’s policy planners and other industrial countries who in 1997 negotiated in agreement so called
Kyoto Protocol and came into force in 2005 which aims to reduce collective emissions of greenhouse
gases by 5.2% relative to 1990 levels.
Japanese government has identified some sectors which energy-efficient that has need to be developed
and implemented: transportation, commercial, and industrial. Focusing on the road transportation sector,
its energy consumption was relatively stable until 1986, but has been increasing since that time.
Dominantly, an increase in weight and size of vehicle, an increase in inhabitants’ activity, an increase in
private car usage, and an increase in the family car’s fuel economy have increased transport sector fuel
consumption. In order to increase the efficiency of energy, car emissions should be restricted, energy
efficient vehicle should be initiated, and car travel should be shifted to public transport. Separately, fuel
prices in Japan is tremendously expensive because gasoline is high taxed. Furthermore, by bearing high
tax, the authorities may help to reduce greenhouse emissions and participate to combat climate change.
The purpose of this paper to investigate the relationship between crude oil prices and stock prices of
Japanese automobile manufacturers. The returns will give an idea how well the automobile manufacturers
perform while crude oil prices remain instable which have an effect on the profitablity of the stock prices’
of automobile manufacturers. Secondly, if whether oil prices should be considered as crucial benchmark
for Japanese auto industry managers and Japanese policy authorities. This paper will use Fama and
8

French three factor model which will extend to four factor of oil is included to study its influence on the
stock returns of Japanese automobile industries.
The thesis is divided into eight chapters. In chapter 2, a literature study is conducted. I will concentrate on
some literature which has been written on this particular topic. Many research has been done in the sector
of impacts of oil prices on the stock prices to which we will refer during the thesis and use those papers as
references. Chapter 3 explains the motivation to conduct the research. It gives specific details about
Japanese market and current situation in there. In chapter 4, four hypotheses are conducted for our
research. Some unusual events as external factors are tested in order to know whether they influence the
relationship between the stock price and the oil price. Furthermore, we would like to conduct research
whether an internal factor such as booming sales of hybrid cars effect the relationship in the midst
upsurge in crude oil price.
Chapter 5 covers the research methodology part of the paper. The research is conducted based on the
Cameron and Schnusenberg (2008) model. In this chapter, I examine how to construct all these regression
variables. The auto index is constructed by taking price weighted average daily stock prices. The market
index is conducted with data of the TOPIX index within a time range from December, 29 2000 until
March 31, 2011. The TOPIX index is chosen because it is an important index for the Tokyo Stock
Exchange (TSE) in Japan. The SMB and the HML are constructed based on the formula from Ken and
French’s website. The oil index is calculated with data of the Middle East crude oil price. The net
producers of the Middle East crude oil determine the export price of crude oil for Japan on the basis of the
spot price for Dubai crude oil.
In chapter 6, the results of the regression are showed and, furthermore, interpret the results in the text.
Chapter 7 presents some discussions about the result are given and I synchronize the regression results
under the real circumstances. Furthermore, we serve some conclusion which is served in chapter 8.
9

2. Literature Review
2.1. Oil prices and the economic growth
Among the extreme supply shocks impacting the world economies, since the 1970s there has been a sharp
increase in the price of oil. Hamilton (1983) stated that oil supply shocks were a contributing factor to the
recession in the USA. Kim et al. (1992) also supported the research suggesting that these shocks had
played a significant role with regards to economic fluctuations over the past three decades. However,
Hooker’s (1996) contribution only showed its relationship specifically when oil prices failed to Granger
cause macroeconomic variables when data samples were extended past the mid-1980s. This was due to
the decreasing nominal price in 1981, followed by a market collapse in 1985 which the relationship
between the increase in oil and economic fluctuations seemed less convincing. This instability problem
has been investigated by several authors such as Mork (1994) and Hamilton (1996). They argued that a
breakdown of the oil prices-macroeconomics relationship reveals a non-linear relationship, thus
proposing an alternative so-called asymmetric relationship. Cunado et al. (2003) used this transformation
to investigate the oil price-economic growth relationship within some European and Asian countries.
Hamilton (2003) declared that since the oil prices and macroeconomics relationship is non-linear, the
effect of oil price increases is bigger than oil price decreases. Furthermore, Hamilton developed a flexible
approach for capturing the relationship between oil price shocks and economic growth in post-war US
data.
Many papers have investigated the relationship between price of oil and economic growth in Japan. Early
studies involved linear relationship models. Darby (1982) estimated the long run oil effects in 1975 and a
year after. The results attributed to a decrease in real income relative to the increase in oil price.
Burbridge and Harrison (1984) used a seven–variable auto regressive (VAR) model to investigate the
response of industrial production to an oil price shock from 1976-1982. However, various recent studies
have shifted to non-linear studies for investigating the relationship between oil price and economic
growth. Mork (1994) pioneered a non-linear study and investigated the existence of asymmetry in the
relationship between oil prices and economic growth in Japan. Lee et al. (2001) argued that
approximately around 30% to 50% of the negative impacts on Japanese output in the mid 1970s were
triggered by monetary policies after the oil price shocks. Rodriguez and Sanchez (2005) used a seven-
variable autoregressive (VAR) model to estimate the linkage between the GDP and the oil price shocks
that occured from 1972-2001. They found a negative correlation between oil prices and the Japanese
GDP. Cunado and Garcia (2005) analyzed the granger-causality between oil prices and macroeconomic
variables (economic growth and inflation) for six Asian countries over the period 1975-2002. They
summarized that oil prices have a significant effect on both macroeconomic activities, even though the
impact is limited to the short run and is more significant if oil price shocks are defined in local currencies.
10
They also examined a net exporter (Malaysia) and net importers (Japan, Singapore, South Korea,
Thailand, and Phillipines) to see whether an oil price-macroeconomy relationship in emerging Asian
countries is dependent on the difference between net import and net export behaviors of each country. In
addition, Hanabusa (2009) investigated the price of oil is useful in predicting in economic growth rate in
Japan. The change in the oil price can give information for the domestic economy.
As has been suggested, oil prices influence the macroeconomic variable. This impact is perceived
sequentially by major industries in the local as well as global economy. There are some industries which
use oil as an input (e.g. petroleum refinery and chemical industry), and there are those which use oil as an
output (e.g. petroleum industry). Thus, the shocks can either present itself in the supply side or the
demand side. Lee and Ni (2002) investigated the effects of oil price shocks on supply and demand in 14
manufacturing industries. Using VAR models, they indicated that where industries using oil as an input,
oil price shocks severely reduced supply. In other industries (e.g. automobile industry) the contrary
occurred where oil price shocks reduced demand. This study was expanded by Rodriguez (2008), who
examined the dynamic effects of oil price shocks on outputs of manufacturing industries in six OECD
countries. The results demonstrated that the industrial outputs of France, Germany, Italy, and Spain had a
diverse pattern of responses to oil price shocks, yet they were widely similar in the UK and the USA.
2.2. Oil prices and the stock market
Apart from the studies revealing that oil price shocks have a significant impact on an economy’s
performance, relatively few economists have provided market participants with a framework that
identifies how oil-price changes affect the stock market. Jones et al. (1996) gave a theoretical grounding,
suggesting that oil price shocks affect stock market returns through their expected earnings. They focused
on testing the reaction of advanced stock markets (US, UK, Japan, and Canada) to oil price shocks on the
basis of the standard cash flow dividend valuation model. They found that for the US and Canada, the
reaction can be ascertained by the impact of oil shocks on cash flow. The outcome for Japan and the UK
on the other hand were indecisive. Huang et al. (1996) adjusted an unrestricted VAR model, which
confirmed that a significant relationship between some US oil company stock returns and oil price
changes. However, they found no evidence of a relationship between oil prices and the S&P 500 market.
Sadorsky (2001) used a multifactor market model and considered the risk premium, exchange rates, and
interest rates, along with oil prices themselves, as major determinants of oil and gas stock returns. He
reported a statistically significant positive relationship between oil prices and stock returns of oil and gas
firms. El Sharif et al. (2005) investigated the correlation between oil prices and stock returns of
companies that listed on the London Stock Exchange. Through the empirical findings they found that
there was a significant positive association between oil prices and oil-related stock returns.
11

Notably, stock prices exhibit asymmetrically to changes in oil prices. This means that higher oil prices are
negatively related with stock prices. For example, Papapetrou (2001) studied the dynamic interaction
between oil price, real stock prices, and interest rates in Greece. Papapetrou found that oil price shocks
have a negative impact on stock prices since they negatively affect the output in the form of industrial
production and employment growth. Maghyereh et al. (2007) found that oil prices affected the stock
prices indexed in the GCC (Gulf Cooperation Council) countries, in a nonlinear fashion, and supported
the statistical analysis of a non-linear modeling relationship between oil prices and the economy. This
result was also consistent with the outcome from Mork et al. (1994). Nandha and Faff (2008) argued that
oil price shocks can have adverse effects on a firm’s output, and therefore on a firm’s profitability and
also revealed that increases in oil prices negatively impact stock returns for all industries including
mining, oil, and gas industries. Furthermore, Bjornland (2008) denoted that oil prices may affect stock
prices only through an indirect manner via monetary policy shocks, whilst Cong et al. (2008) found
evidence that oil prices do not show significantly impact on the majority of stocks in the Chinese markets.
They did however find an association within the manufacturing sector.
The above results indicate a positive or a negative relationship between oil price shocks and stock returns,
which should come as no surprise. Understandably, it is confirmed that the price enhances the cash flow
of oil firms and proves beneficial for them. More precisely, there was Park and Ratti’s (2008) detailed
study on the effects of oil shocks on stock markets in the US and 13 European countries, using monthly
data within the period 1986 to 2005. Their results showed a statistically significant impact of oil price
shocks on real stock returns within one month of the event date. Using similar evidence, Miller and Ratti
(2009) delved the long run relationship between the crude oil prices and international stock markets
within the period 1971 to 2008. They observed a clear long run relationship for six OECD countries, and
suggested that stock market indices respond negatively to increases in the oil price over the long run.
Nevertheless, this seems to be less likely after year 1999. The findings supported a presumption of change
in the relationship between real oil prices and stock returns in the last decade which might suggest the
presence of stock market bubbles and/or oil price bubbles since the turn of the century. Thus, by looking
at this linkage between oil price shocks and stock returns, it can lead several investors to predict the
direction of the stock market in case of an unexpected move in oil prices.
To study the affect of oil price changes on stock fluctuations in oil importing countries, several
researchers distinguish between developed countries and developing countries, in response to oil price
volatility. Maghyereh (2004) discovered the relationship between oil prices, and stock market returns for
22 emerging countries within the period 1998 to 2004. He showed that an elevated intensity of energy
consumption in a country results in an elevated response to oil price changes. Maghyereh conducted the
experiment based on the efficient market hypothesis, which states that stock markets in emerging markets
are inefficient in the conveyance of new information with regard to the oil market, and stock market
12
returns in these markets are not rationally alert to changes in crude oil prices. Park and Ratti (2008) found
that oil prices play a critical role in the stock market of oil importing countries. Furthermore, they
summarized that stock markets in oil exporting oil countries are less affected by oil prices relative to oil
importing countries and are also less sensitive to interest rate changes. Additionally, Fayyad and Daly
(2010) performed an investigation into the relationship between oil prices and stock market returns,
comparing GCC countries with the UK and USA, by applying VAR analysis. They employed daily
market data from September 2005 until February 2010. Their empirical findings suggested that the
predictive power of oil for stock return are aggravated after a rise in oil prices and during the Global
Financial Crises. Hereafter, they also concluded that Qatar and the UAE show more perceptiveness to oil
shocks with regard to the GCC countries; a relation which also holds between the UK and developed
countries.
2.3. Fama French three factor model
In the portfolio management field, Fama and French have researched extensive studies on the subject of
equity price returns. These studies aimed at enhancing the results explained by CAPM, which uses a
single factor, beta, to compare the excess returns of a portfolio with the overall market return. In
comparison, Fama and French (1993) presented three factors model and Fama and French (1996) gave an
outstanding summary and showed that along with the market risk premium, most of the returns in a
portfolio can be determined by cross section returns on stock, using market capitalization and book to
market value factors. They started with the observation that: (i) the small cap stocks are represented by
SMB (small minus big), and HML (high minus low) factors. Small firms have low market capitalization.
Value stocks have low market value relative to fundamentals (earnings, dividend, and book value) and
has given higher average returns over growth stocks which have high market value relative to
fundamentals. However, Cochrane (2005) stated that book values essentially track past investment
expenditures so that book values is a better divisor for individual firm than other fundamentals. They ran
regressions on stock return data from the period 1963 until 1990. Their analysis reveals that small cap
stocks and high book-to-market equity stocks have higher average returns, because of unmeasured risk
factors. Consequently, market capitalization and book-to-market value were also indeed proxy for
sensitivity to common risk factors in stock returns. Fama and French (1996) argued that in their three
factors model, size and Book-to-Market ratios play an important role in explaining cross sectional
differences in expected returns for non financial firms. As a result, the Fama and French three factors
model explains the expected stock returns in any markets better than the CAPM model. Cochrane (2005)
argued that CAPM model that use portfolio returns might be successful in describing asset returns, but the
model might not be able to explain these returns, because the model leave suspicious questions on the
rationale behind the return-based factors.
13

Not all researchers concluded that those factors provide a satisfactory explanation for the size (SMB) and
Book-to-market (HML) factors in the three factor model. Lakonishok, Shleifer, and Vishny (1994)
suggested that the prices of low book-to-market stocks are more fascinating than high book-to-market
stocks, as proposed by Fama and French (1993). Thus, it may attract naive investors who push up prices
and lower the expected returns of the securities. Knez and Ready (1997) found that the risk premiums of
size which estimated by Fama and French (1993) disappear. They also explained for further research that
size effect may also involve into the firm’s growth. Another research was conducted by Daniel and
Titman (1997), who suggested that the risk premiums on small size and high book-to-market do not arise
because of the co-movements of these stocks with pervasive factors. Moreover, Daniel, Titman, and Wei
(2001) also rejected the Fama and French three factor model by using the Japanese capital market.
The asset pricing model does not compare all possible outcomes. It only considers the mean and variance
for the outcomes. Therefore, mean-variance framework is clearly not a good description of reality
because the assumption of normal distribution is not possible in the reality. Investors should think about
the higher moments for instance skewness and kurtosis that also determine the risk factor. However,
investors still use the asset pricing model due to its simplicity and the framework is hard enough for some
people. In addition, Tsiang (1972) exhibited that the asset pricing approximation is valuable although it is
not a good description of reality. Tsiang argued that the asset pricing model which considers mean-
variance approximation will only fail in extreme observation, in other words the extreme observation is
rare.
The above literatures examine the relationship between oil prices and stock markets. Additionally, they
examine how this impact is perceived across various industries. Nonetheless, there are still a few papers
which discuss the impact of oil prices on the transportation industries, which are some of the heaviest
consumer of oil. Cameron and Schnusenberg (2008) investigated the relationship between the oil prices
and stock prices of automobile manufacturers in the US. They added an oil price factor to the Fama and
French three factor model over the period March 2001 to September 2008. The factor was measured by
the change in WTI crude oil prices in excessive risk free rate, or alternatively was measured by the excess
return on energy ETF. The index comprising of SUV vehicles was chosen as the dependent variable. In
general, their result exhibited an inverse relationship between oil prices and stock returns of automobile
manufacturers in the US. The result was statistically significant for manufacturers of SUV vehicles, while
using the excess return on energy ETF instead of price of crude oil as the fourth factor. They have divided
their time period into before and after the start of the second Iraq war, when the impact of oil prices on
the stock returns of automobile manufacturers in the US seemed to be notably coherent following the
invasion of Iraq in March of 2003.
14

In summary, there are various theories on what relationship between crude oil price and economic
implications are. Nevertheless, there is still limited consensus explaining the relationship between crude
oil prices and stock returns of automobile manufacturers in Japan.
3. Research Motivation
The aforementioned literature motivates the author to conduct further research into this popular topic. The
media (i.e. television, magazines and newspapers) mention the crude oil price every day. Crude oil price
is a highly sensitive to world circumstances. Therefore, crude oil price shows the interesting and
important economic implications it embeds. The early works in crude oil prices focused on
macroeconomic implications (see, for example, Hamilton 2003; Cunado and Garcia 2005). In light of
this, it would be interesting to explore the influence of crude oil prices on oil importing countries (see, for
example, Park and Ratti 2008).
Japan is the third largest oil importing country in the world behind the United States and China. In 2010,
the Energy Information Administration (EIA) stated that Japan relied on oil imports to meet 45 percent of
its energy needs. Japan imports oil, usually either Dubai Crude or Oman Crude, mainly from the Middle
East (i.e. Iran, the United Arab Emirates and Oman). Japan maintains government-controlled oil stocks to
ensure against a supply interruption. At the end of 2010, the total oil stocks in Japan were 596 million
barrels with 54 percent being government stocks and 46 percent belonging to commercial stocks. The
limitation of the domestic oil reserve causes Japan to depend heavily on oil from overseas supplies to
support its household and industry consumption needs. Therefore Japan plays a crucial role in oil
demand, which contributes to the fluctuation of oil prices in the world. The important thing that
influences oil price is the balance between supply and demand. As in general, many developed countries
influence global demand of oil. For instance, if Japanese economic activities are halted, Japan will reduce
its demand of oil and eventually will decrease the oil price in the short run.
Moreover, oil as a commodity is highly volatile. It tends to either be in oversupply or shortage supply.
When there is a shortage, we expect the price of oil bids up to the highest while when the market is
ample, price is expected to arrive at the lowest that producers will accept. However, supply and demand
are not alone in driving up the oil price. Tremendous unusual events influence the oil price movements.
For example, ever since Oil embargo 1973 and recently, the economic activities of emerging markets
such as India and China have grown and continue to demand more and more crude oil , also leading to a
higher oil price. As the price has risen, many countries including Japan were demanded less oil.
For the purpose of analysis, the author decided to choose automobile manufacturers, because Japanese
automobile manufacturers are the most prominent such manufacturers in Asia, and in the world. As an
15

evidence, Japan’s auto manufacturers have grown constantly over a long time and have surpassed the US
auto industry by overtaking General Motors of the US as the leading producer of cars in the world by
2008. In the Japanese market, automobile manufacturing is an integrated industry because it relies on
many supporting industries to produce the great diversity of materials and components it uses. According
to the Japan Automobile Manufacturers Association (JAMA), almost 8 percent of Japan’s working
population is involved in auto industry related work. Furthermore, auto production accounts for 17
percent of the total value of Japan’s manufacturing shipments and for approximately 37 percent of the
value of the machinery industries’ combined shipments. Therefore, the automotive industry is one of the
Japanese economy’s core industrial sectors. The globalization of Japanese auto manufacturing also
contributes significantly to local as well as global economies. In light of this, it will be interesting to see
whether the macroeconomic aspect given to the oil price creates any impact on the stock performance of
auto companies and any impact on the investor.
There are fourteen auto companies listed as members in JAMA. These automobile companies produce
passenger cars, buses and trucks. This thesis will focus on passenger vehicles, since these vehicles are the
most attractive vehicles for consumers with various incomes, indicating that the consumer of this type of
car is more likely to be sensitive to the price. Japan’s auto companies have grown in producing passenger
cars (e.g. standard cars, small cars and mini cars), which are primarily less expensive if compared to those
of its competitors, especially European and US auto companies. This is supported by JAMA statistical
data, which shows that within the period from 2007 until 2010 the production of passenger cars reaps 94
percent of the domestic marketshares. There are eight automobile companies who focus on producing
passenger cars listed in JAMA. They are Toyota, Honda, Nissan, Suzuki, Mazda, Daihatsu, Mitsubishi,
and Fuji Heavy Industries. In 2010, according to JAMA, the trend showed that Toyota, Honda and Nissan
are the top three auto companies based on their market shares in Japan. Toyota was the biggest
automobile company in Japan with the largest market share amount of 32.78 percent, followed by Honda
and Nissan ranked in second and third positions with the market shares of 13.85 percent and 13.81
percent respectively.
Table 1: Market shares of the top automobile manufacturers from 2007 to 2010
In the past few years,
Japanese auto companies
have made a concerted
Source : JAMA
No. Manufacturers 2007 2008 2009 2010
1 Toyota 28.98% 28.39% 29.21% 30.91%
2 Honda 11.62% 12.29% 13.57% 13.07%
3 Nissan 13.47% 13.34% 13.01% 13.02%
4 Suzuki 12.54% 13.19% 13.39% 12.5%
5 Daihatsu 11.71% 12.64% 12.94% 12.28%
6 Mazda 4.75% 4.81% 4.43% 4.51%
7 Mitsubishi 4.23% 3.73% 3.47% 3.55%
8 Fuji Heavy Industries 4.22% 4.07% 3.76% 3.57%
Total Market Share 91.52% 92.46% 93.78% 93.41%16

effort to help counter global warming and to improve air quality. The announcement of the Kyoto
Protocol in 1997 recognised that global warming must be addressed and that one way of dealing with the
climate change problem is by reducing emissions of carbon. Tanaka et al (2007) stated that Japan is one
of the highest producers of CO2 emissions in the world,with the highest source of emissions coming from
the industrial and transportation sectors. Tanaka mentioned that, according to the Kyoto Protocol, by
2012 Japan is required to reduce its level of emissions to a point 6 percent below that of 1990. Tanaka
also mentioned that the transportation sector, which is the second highest contributor, also exhibited the
highest rate of increase from 1990 to 2004. The highest emissions are contributed by the use of passenger
cars. Therefore, reducing the CO2 emissions of passenger cars would make a significant contribution
toward reducing the overall CO2 emissions in Japan.
To reduce CO2 emissions, the automobile manufacturers put much attention into the development of
hybrid cars. Japan’s automakers, particulary the top players (Toyota and Honda), are continuously
developing and promoting vehicles to reduce the environmental impact. These two top producers claim
that the combination of an electric motor and a conventional engine causes cars to need less fuel. Georg
(2008) stated that hybrid cars should be produced in order to respond to the environmental problems
caused by engine emissions, air pollution, and noise in urban areas. The hybrid vehicles market expanded
rapidly as the Japanese automobile manufacturers created massive cumulative sales of hybrid electric
vehicles around the world. In the fiscal year 2011, Toyota Motor Company (TMC), which includes the
Lexus brand, announced that its global cumulative sales of hybrid cars had surpassed more than 3.03
million units. Similarly, Honda Motor Company, which started to sell its first hybrid car, the Honda
Insight, in 1999 and has since developed other hybrid cars, had global cumulative sales of 300,000 units
by 2009. Therefore, the automobile manufacturers that are targeting the hybrid market are accelerating
their development strategies.
Nevertheless, looking at the market by region, the sales figures of both Toyota and Honda on their official
websites explicitly say that the largest market shares of hybrid vehicles are not in Japan. The largest
market share of hybrid vehicles is in the US, followed by Japan and Europe in second and third rank
respectively. It is interesting to analyze the market share of hybrid vehicles in Japan because the market
for hybrid cars will continue to grow and will for some time remain at peak level. Moreover, the
government proposed to reduce the share of oil consumed in the transportation sector. In light of this, we
will analyze whether the peaked sales of hybrid cars influence the relationship between oil price and stock
price.
Unusual events also influence on oil prices movements. By 2003, the Iraq invasion was confirmed. The
war that was motivated by the drive to end Saddam Hussein’s regime impacted on the oil price because
Iraq is one of the largest oil producers in the Middle-East. The war caused the oil price to increase above
17

$30 during 2003, according to the NYMEX index. This was the first time that the oil price had risen
above $25 since the mid 1980s. Thus, the increase in oil price affected the demand of oil, especially by oil
importing countries (i.e. Japan). Moreover, few years after the 2003 Iraq invasion, the credit crisis
attacked the world’s economy in 2008. The crisis was triggered by the peak in US housing sales prices
during mid 2006. The crisis hit the economic activities not only in the US but also in other developed
countries. In light of this, this thesis will also research whether the Iraq invasion 2003 and the financial
crisis 2008 had an influence on the relationship between the oil price and the stock price of Japanese
automobile manufacturers.
In summary, the purpose of this thesis is to provide evidence that will contribute to the effort of
explaining the impact of boom in sales of hybrid vehicles on the relationship between oil prices and stock
prices. Moreover, the thesis will also contribute toward explaining the oil factor in the Japanese market
under Fama French three factor model, specifically, whether the behavior of Japanese auto
manufacturers’ stock prices and its relationship with oil factor under some unusual events ( Iraq invasion
2003 and credit crisis 2008) is consistent or not. In regard of this, the thesis will try to answer four
research hypotheses that are constructed in the next chapter.
4. Hypothesis
Based on the Fama-French three factor model, Cameron and Schnusenberg (2008) used the SMB, HML,
and market risk premium risk factors, and as an extension they applied a fourth factor model by adding
oil price factor. For the first hypothesis, this thesis will apply the same hypothesis as Cameron and
Schnusenberg examined. Thus, the paper hypothesizes whether oil prices will have a relationship with the
stock return of Japanese auto manufacturers or not.
Hypothesis 1:
H0 : There is no relationship between oil prices and stock prices of Japanese automobile manufacturers.
H1 : There is a relationship between oil prices and Japanese automakers’ stock prices.
There are many factors (internal and external) that move stock prices up and down. The skyrocket in the
oil prices and the increase in environmental awareness have changed the situation, so that Japanese
manufacturers have to create new products to distribute in the market. As discussed earlier, Japanese auto
manufacturers have successfully sold the hybrid cars in the domestic market since their introduction in
the late 1990s. Clearly, this internal factor may influence the movement of stock prices. For this purpose,
another hypothesis is whether the boom in sales of hybrid cars has an influence on the relationship
between oil prices and stock prices of the Japanese automobile companies who massively produce hybrid
cars (Toyota and Honda). Thus, the second hypothesis is as follows:
18
Hypothesis 2:
H0: The boom in sales of hybrid cars has no influence on the relationship between oil prices and stock
prices of Japanese automobile manufacturers.
H1: The boom in sales of hybrid cars has an influence on the relationship between oil prices and stock
prices of Japanese hybrid cars manufacturers.
Furthermore, the time frame of research is divided into two parts. The purpose is to see the influence of
external factors on the relationship between stock prices and oil prices. Firstly, according to their paper,
Cameron and Schnusenberg (2008) analyzed a considerable amount of oil price data from the pre to post
Iraq war period. They hypothesized that in the post-war invasion, an inverse relationship between oil
prices and US auto manufacturer stock prices is more negative than a relationship in the pre-war invasion.
Apart from the Iraq invasion, there was a credit crisis that was triggered by subprime mortgages in 2008.
Previous research (see for example Fayyad and Daly 2010) has investigated the impact of the credit crisis
on the relationship between oil prices and stock returns with regard to GCC countries, the UK and the US.
Therefore, it would be interesting to investigate whether both events might have had an influence on the
relationship beween the oil price and the stock price of Japanese automotive companies. For this purpose,
the third and fourth hypotheses are constructed as follows:
Hypothesis 3:
H0: The Iraq invasion 2003 had no influence on the relationship between oil prices and stock prices of
Japanese automobile manufacturers.
H1: The Iraq invasion 2003 had an influence on the relationship between oil prices and the stock prices of
Japanese automobile manufacturers.
Hypothesis 4:
H0: The credit crisis 2008 had no influence on the relationship between oil prices and stock prices of
Japanese automobile manufacturers.
H1: The credit crisis 2008 had an influence on the relationship between oil prices and stock prices of
automobile manufacturers in Japan.
5. Data and Methodology
5.1. Data Description
Cameron and Schnusenberg (2008) used the Fama-French three factors as obtained from Ken French’s
website.The factors from the website represent the US market relative to other markets. Nevertheless, the
19

author argues that it is inappropriate to use these factors from that website since they are collected from
US data; therefore the data cannot be representative of Japan’s capital market. Thus, before doing such an
analysis, the data used should directly represent Japan’s capital market. Specifically, the Tokyo Stock
Exchange can be a representative market because it is the largest stock exchange in Japan.The basic data
used is compiled from daily returns on a value weighted portfolio index of all stock listed on the first
section of the Tokyo Stock Exchange. Secondly, Daniel et al. (2001) argued that the daily Gensaki rate is
used as a benchmark for the risk free rate in the Japanese market since there is no risk free rate in Japan
comparable to that of the US Treasury bill rates. Chiao and Hueng (2004) also used a 30-day Gensaki risk
free rate as a benchmark for the risk free rate in Japan. Therefore, Gensaki risk free rate is crucial for the
financial securities market in Japan. In addition, Nowman (2002) also used a Gensaki rate as a proxy for
the Japanese short-term interest rate. All these data are required to calculate the Fama-French three
factors that are retrieved from DataStream. In this research, the daily prices are chosen which are better
representative for calculating the log returns of auto index, market index, and oil price index, which were
included in the Fama-French factors. The proposed period of the daily closing prices started from
December 29, 2000 to March 31, 2011. For each of the companies, the data of the daily closing prices are
retrieved from DataStream.
To analyze the credit crisis event, the daily data are divided into three distinct sub-periods called “pre-
crisis”, “crisis”, and “post crisis”. The time frame of the crisis focuses three years before and one year
after the crisis. Nevertheless, there are many different opinions about the exact starting date of the credit
crisis. Enlightment comes from Manda (2010), who analyzed the US stock volatility during the credit
crisis era with the starting point on March 17, 2008, because on that date the US investment bank Bear
Stearns & Co was taken by JP Morgan.The crisis ended on April 1, 2009, indicated by the fact that the
S&P index has rebounded from its lowest value at the end of March 2009. Similarly, in analyzing the Iraq
invasion, the data divided into three phases and the time frame of the war is taken to start from January 1,
2001 and end on July 29, 2005. The time phases for both events are summarized as follows:
While analyzing the sales boom of hybrid cars, the research is focused into two distinct sub-periods called
“before sales booming” and “after sales booming”. Owing to the data availability on the sales of hybrid
cars, the thesis makes some restrictions. The yearly sales data of hybrid cars are collected from the
official websites of Toyota and Honda, the Japan Automobile Dealers Association (JADA), and JAMA.
From the table 3, it shows that Toyota outperforms its major competitor concerning sales of hybrid cars.
The outperforming of Toyota is also caused by introducing many new hybrid vehicles from its Lexus
brand for instance the most prominent Lexus RX 400 hybrid that makes sales of hybrid cars become
stronger. Moreover, JADA exhibits that Toyota Prius often ranks first in the sales of cars in the Japanese
market. Nevertheless, the success of Honda is not followed by Toyota, where the biggest sales of hybrid
car were achieved in April 2009 by the third generation of Honda Insight.
20

Hereafter, the method used to determine the time frame ofthe sales boom is by percentage of hybrid car
sales. In Japan, the government’s fiscal year runs within the period April 1 to March 31. Table 2 defines
the automobile companies’ (Toyota and Honda) percentage of sales and unit sales of hybrid cars in Japan
starting from the fiscal year 2000 until 2011.
Table 2: Toyota total sales of hybrid cars in Japan during fiscal year 2000–2010 (in thousand)
Toyota HondaPercentage of sales Unit Sales Percentage of sales Unit Sales
2000 1.04% 12.5 0.19% 1.3972001 1.52% 18.5 0.06% 0.4572002 1.41% 20 0.29% 2.3692003 1.78% 27.2 0.13% 0.8372004 4.37% 68.7 0.07% 0.4942005 3.85% 58.5 0.73% 4.8832006 5.15% 72.4 0.91% 5.8742007 6.02% 82 0.66% 3.9672008 8.94% 104.4 1.51% 8.2432009 18.06% 251.1 15.51% 96.6162010 34.50% 433.6 9.04% 51.49
Source: JADA, JAMA, HONDA, TOYOTA
From the above table, the sales percentage of hybrid cars by Toyota and Honda reached its peak by the
fiscal year 2009 compared with previous years. This condition is also supported by the hybrid cars
website1, which states that 2009 was recorded as the breakthrough year for gas-electric hybrid cars. The
website informs that Toyota Prius was Japan’s top selling automobile in earlier 2009 for the first time
since its debut in 1997 and Honda Insight ranked fifth with 93,283 units sold since its first production in
1999. Thus, Toyota and Honda start their sales booming of hybrid cars in fiscal year 2009. In conclusion,
the time phases for both events are summarized as follows:
Table 3 : Time Phases for Iraq war, credit crisis, and booming sales of hybrid car
Iraq War Start Date End Date
Pre War 1/1/2001 3/18/2003
War 3/19/2003 5/1/2003
Post War 5/2/2003 7/29/2005
Credit Crisis Start Date End Date
1 www.hybridcars.com
21

Pre Crisis 8/1/2005 3/14/2008
Crisis 3/17/2008 4/1/2009
Post Crisis 4/2/2009 12/31/2010
Influence of Hybrid car Start Date End Date
Before the boom sales 1/01/2001 3/31/2009
After the boom sales 1/01/2010 3/31/2011
Source: Manda (2010), EIA
5.2. Methodology
The Fama-French three factor model has been extensively used as a tool for measuring returns based on
the firm’s market capitalization and the BE/ME ratio in the Japanese stock market (for example works see
Mohammed et al 2007; Pham 2007). From the OLS estimation model, the excess return of Japanese
automobile companies is a dependent variable proxy. The independent variables are excess market return,
SMB (small minus big), and HML (high minus low), which are categorized as Fama-French factors.
Furthermore, Pennachi (2008) stated that one of the most important anomalies is caused by macro-
economic factors that are motivated by the fact that the market portfolio proxy is not perfect, and, hence,
the relation between consumption and marginal utility of that consumption is not perfect as the asset
pricing model suggests. Therefore, another way to operationalize is by using the commodity prices such
as oil prices that can be used as a proxy for consumption. Mathematically, the equation can be written as
follows:
Ra-Rf = αt + β1(Rm-Rf) + β2(SMB) + β3(HML)+ β4(Oil Price Factor) + εt
To carry out the test, the research methodology adopts the same process as Cameron and Schnusenberg
(2008) and applies the approach to the automobile manufacturers in Japan with several adjustments
considering the compatibility of the data set. Cameron and Schunsenberg (2008) retrieved the data for
market index, SMB, and HML from Fama’s website. This sophisticated model is not feasible in this
sample case, as the data from the website is solely dictated by the availability of data. Moreover, the
details of constructing the data of the automobile index, the Fama-French factors, and the oil price factor
are discussed as follows:
A. Excess Return on the Auto Index
To examine the excess return on the Japanese automobile manufacturers index, the return on auto index is
calculated by taking a weighted average of a market capitalization. A stock market portfolio weighted by
the market value of the eight automobile companies in the porftolio. Market value is the market share
22
price multiplied by the number shares outstanding. Larger companies have greater portion of the
portfolio. The data of the daily market value for each of the eight automobile manufacturers from the
period December 29, 2000 until March 31, 2011 are retrieved from DataStream. Further step, the daily
market value of all eight companies is summed for the proposed time period and the total market value is
chosen to be a divisor. The auto index is calculated by taking the log returns of daily closing prices of
automobile manufacturers and multiplied by the weighted average of market capitalization. Moreover, the
calculation is repeated every day within the proposed time to compute the auto index. Finally, to obtain
the excess return on the auto index, the return on the auto index of Japanese automobile companies should
be subtracted by the Gensaki risk free rate.
B. Excess Return on the Market
Pennachi (2008) argued that market risk premium is computed by subtracting the market index by the risk
free rate. Market portfolio is unobservable, therefore, a broad index is needed as an approximation to
market portfolio which contains all assets there. To compute Japan’s market return index, the investors
could choose whether to use the average price weighted of the Nikkei 225 index or the TOPIX, which are
the prominent stock market indexes for the Tokyo Stock Exchange (TSE). The Nikkei 225 is published
by newspaper, the so-called Nihon-Keizai Shimbun, and its unit is measured in yen. The Nikkei 225 index
has been calculated on a daily basis and it is computed by taking the average price weighted index.
Therefore, the Nikkei 225 index is severely affected by high-priced stocks.
The TOPIX stock market index is commonly used in Japan’s financial market because it is published by
TSE. According to the TSE website, the TOPIX accounts for 1,700 companies listed on the TSE first
section and its unit is measured by point. The TOPIX stock market index is computed by taking the
fluctuations of adjusted market capitalization weighted index. Therefore, the TOPIX is most affected by
issues with high aggregate market value. The calculation method of the world index is often used: the free
float adjusted market capitalization weighted. Thus, the TOPIX index has a crucial usage as an assets
benchmark to evaluate and standardize asset management. The Japanese government uses the TOPIX as
their leading economic indicator. Moreover, pension fund managers and investment fund managers use
the TOPIX index as a benchmark to evaluate their Japanese market portfolio.
For the purpose of analysis, the TOPIX index seems suitable as a benchmark to calculate the Japanese
market return index. As a support, Pham (2007) used the TOPIX index to calculate market index.
Furthermore, Japan’s market return index is calculated by taking the log returns of the daily closing price
index of the TOPIX index within the period December 29, 2000 to March 31, 2011. To obtain the excess
market return, the log returns of the daily closing prices of the TOPIX index should be substracted by a
30-day Gensaki risk free rate.
23

C. The SMB and the HML
As discussed in the earlier sub-chapter, the author took the portfolio of the companies that were listed on
the Tokyo Stock Exchange as representative of the Japanese financial market. In the Tokyo Stock
Exchange, the listed companies are divided into three sections (i.e. first section, second section, and
mothers). The first section is for large companies, while the second section is for middle sized companies.
The last section is dedicated to small companies that have small growth and emerging stocks. In 2010
there were 1,695 companies listed on the first section of the Tokyo Stock Exchange. However, the
number of companies changed slightly owing to the delisting of companies every year (for example in
2009 there were 1,687 companies listed in the first section).
We propose to limit the number of selected companies by considering the criteria as mentioned on the
TSE website, for instance number of shareholders, market capitalization, shareholder’s equity, and no
false statements or fair representations. The website mentions many types of market index (i.e. TOPIX
30, TOPIX 100, TOPIX mid400, etc.). The TOPIX Core 30 contains the most liquid and highly market
capitalized stocks in the Japanese capital market. The TOPIX Large 70 serves a data of 70 companies that
are the most liquid and highly market capitalized stocks in the Japanese capital market, including the
companies listed on the TOPIX Core 30. The TOPIX 100 contains the data of companies from both the
TOPIX Core 30 and the TOPIX Large 70. Additionally, the companies listed on the TOPIX 100 are
believed to serve financial reports according to Japan’s standard financial reporting system. These
companies cover 33 industry sectors (i.e. mining, construction, foods, automotive, etc.) in Japan.
Therefore, it is wisely to use the companies listed on the TOPIX 100 as an indicator to represent the
Japanese stock market.
The CAPM model only uses a single factor, beta, to compare market portfolio as a whole. The beta
explains the causality between market risk premium and excess return. As an extension, the Fama-French
three factor model introduces SMB (small minus big) and HML (high minus low) factors. They provide
how to compute these variables on their website. According to Cameron and Schnusenberg (2008), as
cited from French (1993), the SMB and HML factors are constructed using the six valueweighted stock
portfolio formed by two market equity (e.g. size of the equity market and book-to-market benchmark
porftolios) whereas there are any distortion from costs, transaction fees, or taxes.
The SMB factor attempts to explain excess returns made by the portfolio manager. The portfolio manager
divides the portfolio of companies based on their size of equity market. Therefore, market value is used to
compute the size of the equity market. This thesis uses the same methodology according to the Fama-
French website to obtain SMB and HML. The market capitalization (size of equity market) breakpoint
24

determines the buy range for the “small” and “big” portfolios. The SMB denotes the first 50 percent of
companies as “small” size companies and the other 50 percent as “big” size companies. Another factor,
HML, shows the spread in excess returns between value and growth stocks. HML accounts that
companies with value stocks (high book value relative to their book value) seem to earn excess returns
over growth stocks. Therefore, HML is calculated by B/M ratios by dividing the book value by the
market value.
For each of the companies, the author retrieves the market value and book value data of each of the
companies from DataStream within the period December 29, 2000 to March 31, 2011. A portfolio of
companies is divided using the B/M ratios as the benchmark, with the criteria on the basis of 30:40:30
percentiles. The first 30 percent of the companies are called “low stocks”, the next 40 percent “medium
stocks”, and the last 30 percent “high stocks”. Furthermore, these steps created the six portfolios divided
into building blocks; small-low, small-medium, and small-high, and value stocks; big-low, big-medium,
and big-high.
Further step, the daily log returns of those companies that constituted the value and growth portfolios of
each year were calculated. The daily log returns were calculated by taking the daily closing prices of each
of the companies under scrutiny. The method used to determine daily SMB and HML is to take the
average daily log returns of each companies under portfolios made within the proposed time period.
Furthermore, the Fama-French (1993) determination of small minus big (SMB) and high minus low
(HML) were obtained by applying the following formulas:
SMB = 1/3*(Small/Low + Small/Medium + Small/High) – 1/3*(Big/Low +
Big/Medium + Big/High)
HML = ½*(Small/High + Big/High) – ½*(Small/Low + Big/Low)
D. Oil factor
Ono (2004) stated that Japan imports crude oil mainly from the Middle East which costs less than from
West Texas Intermediate (WTI) and Brent Crude. The WTI is well known as a benchmark of the US
market.The Brent Crude is used as a benchmark of the European market and Dubai Crude oil as a
benchmark of crude oil price for the Asian market. Ono (2004) also stated that Middle-East crude oil
accounts for almost 90% of crude oil imports in Japan. Koyama (2011) argued that the Middle-East
countries who are oil producers determine the export price of crude oil for Asia on the basis average spot
25

price of Dubai Crude price. As a consequence, the import price of crude oil in Japan is based on Dubai
Crude price. Therefore, we have to pay attention to the fact that the Asian market is more dependent on
Middle East oil than Europe and North America.
Figure 2 shows the price of Dubai crude oil. Dubai Crude oil, so-called Dubai Fateh, is heavy oil with a
high content of sulfur. In contrast, Both WTI and Brent are light and sweet crude oil. However, regarding
specific quality data, WTI is lighter than Brent. That is why the WTI price is higher than the Brent price
and the Dubai Fateh price. Ono (2004) stated the difference price between WTI and Dubai crude oil has
been US$3 to US$6 per barrel.
Figure 2: Dubai crude oil price from 2001-2011
0
20
40
60
80
100
120
140
2001 2002 2003 2004 2005 2006 2007 2008 2009 2010
Crude Oil-Dubai Fateh U$/BBL
Market participants have made successful efforts to set the Dubai Crude price as a benchmark, for
example utilize Upper Zakum crude oil as an alternative to Dubai Crude oil because of the declining
production of Dubai Crude oil, listed as Oman Crude oil on the Dubai Merchantile Exchange since the
middle 2007.
In short, Dubai Crude oil is more suitable as a benchmark for the computation of oil factors in the
Japanese capital market. The daily closing prices of Dubai Fateh crude oil are retrieved from DataStream
within the proposed period. Furthermore, because crude oil price is based on the US dollars, hence, these
prices were converted to Japanese yen by using the daily yen–US dollar exchange rate to give the
reflection in the import price of crude oil in Japan. Furthermore, after computing the log returns of the
daily closing prices, the daily log returns are subtracted by the daily Gensaki risk free rate to obtain the
excess return of oil.
26

6. Results
6.1. Descriptive Statistics
Table 4 reports the summary statistics of the important variables generated by implementing the
methodology and data within the proposed period from the section above. Table 4 describes returns of the
risk factors over the entire period. The average daily market premium is -0.0016%. The daily premium
related with HML risk factor is slightly larger than the daily risk premium associated with SMB risk
factor which are 0.0000607% and 0.0000055%, respectively. The market premium has the highest level
of volatility while the HML porftolio has the highest level of excess return.
Table 4 : Summary statistics – full sample
Ra-Rf Rm-Rf SMB HML Roil-Rf
Mean -0.001545 -0.001636 0.000055 0.0000607 -0.001243
Standard Deviation 0.008495 0.006644 0.002704 0.002461 0.009789
Table 5 shows the correlation between dependent variable and independent variables within the proposed
time period. The table shows that market index, SMB, and oil index have a positive correlation with the
auto index. In additional, only HML has a negative correlation with the auto index.The strongest
correlation is occured between the auto index and the market index which its correlation coefficient is
larger than 0.5. Moreover, the table also shows the correlation between independent variable and another
independent variable. The table exhibits that all independent variables are imperfectly correlated each
other which showed all correlations between each independent variables are smaller than 0.5 or larger
than -0.5. Thus, correlation between all these independent variables may not violate multicollinearity.
Table 5: Correlations – full sample
Ra-Rf Rm-Rf SMB HML Roil-Rf
Ra-Rf 1.000000 0.834985 0.271618 -0.161200 0.042262
Rm-Rf 0.834985 1.000000 0.362222 -0.181277 0.083818
SMB 0.271618 0.362222 1.000000 -0.159023 -0.006478
HML -0.161200 -0.181277 -0.159023 1.000000 -0.023679
Roil-Rf 0.042262 0.083818 -0.0006478 -0.023679 1.000000
Figure 3 and figure 4 describe that the auto index almost mimics the market index. The existence of a
positive relationship between the auto index and the market index, and high level of statistical
27

significance in terms of the regression results could be explained both figures. Therefore, automobile
companies give the biggest boost to the TOPIX index. Daisuke Shimazu, as cited by Bloomberg, said that
Toyota as the largest company in Japan, has a big influence on the TOPIX index because of its weighting
index.
Figure 3: Returns on the market index
-.06
-.04
-.02
.00
.02
.04
.06
01 02 03 04 05 06 07 08 09 10
market index
Figure 4: Returns on the auto index
28

-.06
-.04
-.02
.00
.02
.04
.06
.08
01 02 03 04 05 06 07 08 09 10
auto index
6.2. Regression Results
In this section, the regression results are described by using the equation mentioned in Chapter 5. The
below table shows the results of the auto index that consists of eight automobile companies by using the
Fama-French three factor equation (the market index, the SMB, and the HML) and the fourth oil factor.
The first column shows the regression for the entire time period from January 2001 to March 2011. The
adjusted R squared is 69 percent, which is higher than the results from the study on North American
automobile manufacturers (see Cameron and Schnusenberg 2008). Moreover, the regression shows a
statistically significant adverse relationship between Dubai Fateh crude oil prices and the excess stock
returns of automobile companies. Under ceteris paribus, a 1 percent increase in the Dubai oil price index
will decrease the auto index of the top eight Japanese automobile companies by 0.02 percent.
Apart from the results of the oil index, the market index results a positive beta and statistically significant.
The coefficient of the market index is slightly higher than one, which implies the automobile
manufacturers’ stock prices are significantly correlated with the TOPIX index. Under ceteris paribus,
when the market premium rises by 1 percent, it will increase the stock returns of automobile
manufacturers by 1.08 percent. The Fama-French factors, the SMB and the HML show a negative
relationship with the auto index, but only the SMB is statistically significant while Cameron and
Schnusenberg (2008) exhibited a positive relationship between both the SMB and the HML with the auto
index, and the HML was significant.
29

Table 6: Regression results for the auto index
C Rm-Rf SMB HML Roil-Rf Adj.R
squrd
All years 0.000208 1.085167 -0.120176 -0.047843 -0.025565 0.698885
(2.217306)* (73.56156)† (-3.339248)† (-1.301585) (-2.763565)†
Pre war 0.000228 0.925609 -0.025978 -0.029308 -0.084207 0.499592
(0.964227) (21.52849)† (-0.320799) (-0.370183) (-2.814125)†
War 0.000097 1.265170 -0.737408 -0.659433 0.029536 0.869882
(1.295360) (9.423210)† (-2.523124)* (-1.664973)** (0.641503)
Post war 0.000109 0.978009 -0.510083 -0.256959 -0.009071 0.562714
(0.691366) (24.92480)† (-7.137577)† (-3.254556)† (-0.411130)
Pre crisis 0.000103 1.032094 -0.377062 -0.152802 -0.017858 0.775610
(0.688717) (46.54738)† (-6.257983)† (-2.509766)* (-0.900993)
Crisis 0.001106 1.214547 0.192704 0.145583 -0.008122 0.807615
(2.331183)* (27.83575)† (1.603663) (1.046078) (-0.408838)
Post crisis 0.000279 1.218585 -0.041657 -0.010157 -0.044974 0.718833
(1.500727) (28.79834)* (-0.440811) (-0.095560) (-1.912426)**
t statistics are in parentheses; †,* and ** denote that t-statistics are statistically significant at the 1%, 5%, and10%
level of significance respectively.
Table 6 gives the regression results for all three phases to investigate the influence of the Iraq invasion
2003. The results show a negative relationship between the Dubai Crude oil index and the auto index in
the pre-war period and the post-war period. But, the result is statistically significant only in the pre-war
period. It implies the political instabilites conditions that were occured during pre-invasion of Iraq
significantly affected on the relationship between oil prices and stock prices of Japanese automakers. In
the post-war period, oil prices were expected to become more negative explanatory variable of the stock
prices of automobile companies. However, the coefficient of oil index during the post-war period is less
negative than the coefficient of oil index during the pre-war period and is not significant. But, the
adjusted r-squared shows significant increased from 49 percent in the pre-war stage to 56 percent in the
post-war stage which explicitly explained the oil index explains better the auto index in the post-war
period.
Within both phases, the results indicate that stock prices of automobile companies are adversely affected
by crude oil prices during the pre-war phase and the post-war phase. A 1 percent increase in the Dubai oil
price index, will decrease stock performance of automobile companies by 0.08 percent and 0.009 percent
respectively, before and after the invasion. Additionally, an interesting outcome is during the occurence
of Iraq war where the oil index shows a positive relationship with the auto index. A 1 percent increase in
30

the Dubai oil price index will increase stock performance of automobile companies by 0.029 percent,
under ceteris paribus. However, the term is statistically insignificant that implies the occurence of Iraq
invasion 2003 had no influence on the relationship between stock prices of Japanese auto manufacturers
and crude oil prices. In addition, when the invasion of Iraq was occured, the adjusted r-squared reached
its peak at 86 percent.
Further result, all phases show a positive and statistically significant relationship between the market
index and the auto index. Both the pre-war phase and the post-war phase, the respective market betas are
almost one, which means that stock prices of automobile manufacturers are as risky as the average on the
stock market. During the pre-war stage and the post-war stage, the coefficient shows that if there was an
increase in the market index by 1 percent, a stock performance of the Japanese automobile companies
would increase by 0.92 percent and 0.97 percent respectively. However, during the Iraq invasion, the
regression exhibited higher coefficient relationship between the market index and the automobile
manufacturers’ stock prices which will increase by 1.26 percent. Thus, the auto index consisting of eight
automobile companies during the war period is slightly riskier than the index in both the pre-war period
and the post-war period. Thus, the result implies that stock prices of Japanese automobile companies is
highly correlated with the TOPIX index.
In terms of the other Fama-French factors, the SMB and the HML, The results show the same trend
across the entire time period and exhibit negative relationships between the auto index and the SMB or
the HML for all three phases. The coefficient of the SMB and the HML during the post-war period are
smaller than during the pre-war period. Moreover, it is important to note that in the occurence of the war,
the coefficient of the SMB and the HML turned out to be more negative than in the post-war period. The
HML factor is significant during the war and the post-war period. Therefore, we may conclude that, in
general, investors look at the stocks of Japanese automobile companies as growth stocks (low B/M) rather
than value stocks.
Moving towards the credit crisis event, table 6 also gives clear results. The crisis is divided by three sub-
periods (pre-crisis, crisis, and post-crisis). The results show an impressive adjusted r-squared for all
phases. The adjusted r-squared is 80 percent when the financial crisis is occured while occurs while the
adjusted r- squareds in the pre-crisis and post-crisis periods are 77 percent and 71 percent respectively.
Furthermore, the auto index has a negative relationship with the Dubai Crude oil index in all phases. We
expect that the oil index in the occurence of crisis was smaller (more negative) than the oil index in the
post-crisis period and the pre-crisis period. Surprisingly, The coefficient of oil index in the post-crisis
period exhibits the smallest coefficient whereas the oil index in the pre-crisis period is smaller (more
negative) than the oil index when the crisis took place. Eventhough the adjusted r-squared is the highest
31

when the occurence of financial crisis, the coefficient of oil factor is less negative than the oil index’s
coefficient in the pre-crisis period and post-crisis period.
Coefficient of the oil index in the occurence of crisis implies when the oil index increases by 1 percent,
the auto index will decrease by -0.008 percent. Further test, we found that the size of oil index in the pre-
crisis period is less negative than in the post-crisis period and conclude that the most negative relationship
between the oil index and auto index occured in the post-crisis period. A 1 percent increase in the Dubai
oil price index will decrease stock performance of automobile companies by 0.044 percent. However,
only the post-crisis is statistically significant. The result implies the late reaction from market participants
during the post-crisis period had an influence on the relationship between stock prices of automobile
manufacturers and oil prices.
Moreover, the market index exhibits a positive relationship with the auto index where the coefficient is
almost one and remains statistically significant for all sub-periods. It implies that the stock prices of
automobile manufacturers are as risky as the Japanese stock market on average. The highest market beta
occurs in the post-crisis period. A 1 percent increase in the market index, the stock prices of the
automobile companies increase by 1.218 percent. Additionally, in terms of the SMB and the HML, the
regression exhibits a positive relationship between both risk factors and the auto index in the occurence of
crisis. However, it is not statistically significant. A positive coefficient of the HML implies that investors
look at the automobile manufacturers’ stock prices as value stocks rather than growth stocks. On the
contrary, the SMB and the HML are negatively correlated with the auto index in the post-crisis period and
the pre-crisis period. Furthermore, the size of both the SMB and the HML in the pre-crisis period is
smaller than in the post-crisis period and both coefficients are statistically significant.
6.3. The Influence of the Hybrid Car
This section discusses the influence of hybrid car sales on stock performance of Japanese automakers.
Table 3 in Chapter 5 shows the percentage sales of hybrid cars by Toyota and Honda from 2001 until
2011. From the table, it can be concluded that the sales of hybrid cars boomed in Japan in the fiscal year
2009. Both Toyota and Honda successfully sold hybrid cars in Japan: 251 million and 96 million
respectively. Further test, table 7 shows the regression between the hybrid cars index and the Fama-
French three factors and the fourth oil factor.
Table 7: Hybrid car index
C Rm-Rf SMB HML Roil-Rf Adj r squared
32

Before
booming
-0.00017 0.858059 -0.153717 0.007440 -0.013368 0.669134
(-1.87205)** (62.4609)† (-4.6162)† (0.2167) (-1.5725)
After
booming
-0.000269 0.778336 -0.318006 -0.162700 0.031617 0.702424
(-1.704621) (25.53912)† (-3.267477)* (-1.684991)** (-1.449703)
t-statistics in parentheses ; †,* and ** denote that t statistics are statistically significant at the 1%, 5%, and 10% level
of significance
Table 7 shows that the adjusted r-squared significantly improve from 66 percent before the boomed sales
to 70 percent after the boomed sales. The regression shows that the relationship between the oil index and
the dependent variable (the hybrid car index) is negative and statistically insignificant before the boom in
sales of hybrid cars. Under ceteris paribus, 1 percent increase of the Dubai oil price index will decrease
the stock performance of hybrid car companies by 0.013 percent. Furthermore, we expect the
skyrocketing of crude oil prices will trigger the hybrid car sales so the profit of the hybrid car
manufacturers explicitly influenced by the sales. The result clearly confirms that an inverse relationship
changes to a linear relationship between the oil index and the auto index after the boomed sales of hybrid
cars. The coefficient shows a 1 percent increase of the crude oil price index will increase the stock returns
of hybrid car manufacturers by 0.03 percent. However, the result is not statistically significant. Therefore,
the results from the above table provide evidence that there is no influence of the boom in sales of hybrid
cars in Japan (particularly before the boomed sales and after the boomed sales) on the relationship
between the oil index and the hybrid automakers index.
Furthermore, the coefficient of the market index is almost one in both before booming sales and after
booming sales of hybrid cars. However, after the boom in sales of hybrid cars, the market beta is smaller
than the market beta before the boom in sales. In addition, both market betas are statistically significant
eventhough the t-statistic becomes smaller after the booming sales. The market beta can be interpreted as
when a market index increases by 1 percent, the stock prices of the hybrid car manufacturers increase by
0.85 percent and 0.77 percent respectively before the sales boom and after the sales boom.
Moreover, the results of other Fama-French factors, namely size anomaly, captures a negative
relationship between the SMB and the hybrid car index for both phases but it is only statistically
significant after the booming hybrid car sales period. For value anomaly, the HML coefficient gives a
positive relationship with the hybrid car auto index before the booming sales period but it is not
statistically significant. On the contrary, the HML coefficient is negative and statistically significant after
the booming sales.
33

Table 8: Regression results of Toyota index
C Rm-Rf SMB HML Roil-Rf Adj. R-sqrd
Before
booming
-0.000518 0.657796 -0.133377 0.042136 -0.000358 0.650790
(-7.183302)* (60.23442)* (-5.038594)* (1.544634) (-0.052919)
After
booming
-0.000563 0.543302 -0.271863 -0.022105 0.021145 0.606791
(-4.180966)* (20.92371)* (-3.278573)* (-0.268696) (1.137923)
t-statistics in parentheses ; * denotes that t statistics are statistically significant at the 1% level of significance
Table 9: Regression results of Honda index
C Rm-rf SMB HML Roil-rf Adj. R-sqrd
Before
booming
-0.001015 0.336052 -0.094312 0.049545 0.031609 0.525984
(-21.03060)* (45.94637)* (5.319689)* (2.711833)* (6.983943)*
After
booming
-0.000807 0.234641 -0.044951 -0.140312 0.010923 0.585428
(-12.53853)* (18.89131)* (-1.133267) (-3.565532)* (-1.228868)
t-statistics in parentheses ; * denotes that t statistics are statistically significant at the 1% level of significance
Table 10: Regression results of Toyota and Honda after booming till before the earthquake
C Rm-rf SMB HML Roil-rf Adj. R-sqrd
Toyota index -0.000561 0.575109 -0.198044 0.109084 0.003689 0.517268(-4.119869)* (16.72494)* (-2.119763)* (1.180658) (0.195188)
Honda index -0.000754 0.287406 -0.016983 -0.032694 0.013202 0.606536(-12.18119)* (18.36860)* (-0.399484) (-0.777671) (1.535063)
t-statistics in parentheses ; * denotes that t statistics are statistically significant at the 1% level of significance
To give better understand of this internal factor, Toyota and Honda are regressed separately by using
Fama French factors and oil factor as exhibited in table 8 and table 9, respectively. Eventhough the oil
price was volatile and has risen starting from 2001 till 2008, the correlation between stock prices of
Toyota and crude oil prices was not really disreputable. Table 8 obviously indicates that the relationship
between crude oil prices and stock prices of hybrid car companies is non-linear before the boom in sales
of hybrid cars whereas the relationship turns to be a linear one after the boom period. Understandable, our
expectation about the influence of hybrid cars on the stock prices of hybrid car companies is in line.
Under ceteris paribus, an increase of oil index by 1 percent before the boom in sales of hybrid cars, it will
decrease the stock performance of Toyota by 0.00035 percent while it will increase the Toyota’s stock
prices by 0.02 percent after the boom in hybrid cars’ sales.
34

Compared with its rival, Honda’s stock prices seems to perform better than the Toyota’s before the boom
in sales of hybrid cars. It can be seen from table 9 that the Honda exhibits a linear relationship between its
stock prices and crude oil prices during both periods. Moreover, a positive coefficient of the oil index
slightly decreases from 0.031 percent before the booming sales to 0.01percent after the booming sales of
hybrid cars. However, it has to be noted that the coefficient of the oil index is significant only before the
booming hybrid car sales period. Furthermore a concise explanation about the boom in sales of hybrid
for both companies will be explained in the next chapter.
7. Analyses and Interpretations
This chapter discusses the possible reasons for the outcome of the regression results above. This section
will only focus on the relationship between stock prices and crude oil prices. Furthermore, the results are
going to be compared with the real situations at that time in order to give better understanding of the
reasons lying behind the causal relationship.
7.1. Unusual events as external factors
Firstly, the auto index and the market index are influenced by the same macro-economic factors that
investors have considered. The regression results exhibit a negative relationship between crude oil prices
and stock performance of automobile companies for the whole time period. It implies that the increase of
the oil price is a serious problem for Japan, as it is heavily dependent on overseas supplies. The higher oil
prices worsen the stock performance of Japanese automakers. Oil is perceived as an output and an input
by the automakers. Their activities need the supply of oil. The industries’ activities may be hampered as
more expensive oil prices reflect on higher transportation costs and production costs which can diminish
earnings. Sedan and small cars are primary products of Japanese automobile companies. These are
claimed only use less fuel compared with SUV vehicles (see Cameron and Schnusenberg, 2008 for an
analysis of SUV vehicles). The price of automobile in Japan is relatively inexpensive. However, high
automobile tax and high gasoline prices in Japan hamper the sales of vehicles in Japan. Nonetheless, the
decrease in stock returns is unavoidable owing to higher oil prices. Thus, the causal relationship implies
that an increased in the Dubai crude oil prices will have a detrimental effect on Japanese auto
manufacturers’ stock prices.
Secondly, crude oil prices go up whenever supply and demand become tight. Moreover, crude oil prices
rise when the market anticipates a shortage or an oversupply due to unusual events such as war. The
turmoil that happened in Iraq in mid 2003 caused problems for Japan because Iraq is responsible for a
large portion of the global oil reserves, so that there was an adverse affect between the stock prices of
35

automakers and crude oil prices. During the pre-war phase, political tensions resulted in increasing oil
prices. Figure 3 shows that the Dubai crude oil price was between 17 US$/barrel and 30 US$/barrel in the
pre-war period. Surprisingly, when the invasion occured, a linear relationship was demonstrated between
stock prices and crude oil prices.
On the first day of the Iraq invasion, March 19, 2003, Dubai crude oil price was 30.28 US$/barrel or
equivalent to 2,552 Japanese Yen. The Dubai crude oil price slightly dropped on the last day of the
invasion stayed at 24.11 US$/barrel which was equivalent to 2,033 Japanese Yen. Strictly speaking, the
crude oil price surprisingly went down during war and so did the automobile manufacturers’ stock price.
The price of crude oil fell due to the fact that demand may have been eroding under pressure from higher
crude oil prices. The Iraq war has reduced the production of oil and has been blamed for increasing oil
prices. However in reality, the reserves of oil in Iraq was unaffected when the invasion was occured.
Therefore, there was no shortage of oil due to war. In addition, the Iraqi war coincided with the start of a
sharp rise in imports of crude oil due to the booming economies of China and India and experts say this
alignment of factors may have kept prices permanently high after the Iraq invasion. The increment in the
oil prices slumps the stock performance of Japanese automakers. However, it has to be remembered that
the result is statistically significant only during the pre-war period.
Thirdly, figure 3 shows that the Dubai crude oil price drastically increased during the credit crisis. By
looking at traditional models, oil price as a macro-economic factor is really sensitive and only moves as a
result of news. So, when news enters the market, the oil price reacts. When there is a large news shock
(like the situation of a financial crisis), it has a large effect on prices for that period. Following this line of
thinking, when information arrives at the market, prices should ajdust without any form of trade. Buyers
found it easier to speculate on oil prices as Tokyo Commodity Exchange (TOCOM) introduced futures
and options with regard to commodities. Buyers start to speculate in oil markets as they know that the
price of oil will go up. The results are not surprising. Dubai crude oil price reached its peak at 136.82
US$/barrel. During the financial crisis, the further increase in oil price was driven by supply and demand
conditions with regard to oil in the Middle-East market. According to Economist Intelligence Unit (EIU),
world oil demand was falling. It is estimated that demand fell by 0.2 percent in 2008 and expected to
decrease by 0.4 percent in 2009. Moreover, plummeting world demand is mainly driven by falling
consumption in developed countries. For instance, Japan reduced its oil consumption from 4.9 million to
4.4 million barrels/day by 2008 and 2009 respectively.
According to the law of demand and supply, lower demand would decrease the price. However, the oil
price was skyrocketing. This was because many oil exporting countries pegged their currency to the US
Dollar. The US Dollar was weak due to the financial crisis, so oil revenue decreased and cost increased.
As a result, OPEC countries must had to raise the price of oil to maintain the profit margin. Eventhough
36

the demand for oil by Non-OECD countries is expected to grow, it would not be sheltered from the
consequences of financial crisis turmoil, as the demand grows at a slower pace over short-to-medium
term.
As a consequence, the increase in the oil prices during the crisis affect the demand of vehicles. Many
Japan automakers slashed their production during the economic crisis and delayed investments in new
factories. According to the Toyota official website, Toyota’s production decreased by 2.2 million units in
the fiscal year 2008. They also cut forecasting of profits, dismissed nonstaff workers and delayed
investments. Nissan and Suzuki also cut their production by 80,000 vehicles and 30,000 vehicles,
respectively during the same year. Even worse, automakers usually raise funds through bonds and
goverment loans to pay their debts. Yasuhiro Matsumoto, a senior analyst at Shinsei Securities Co. in
Tokyo stated in Bloomberg that “the government loans combined with the sale of bonds shows how much
Toyota fears the upsurge in the oil prices during financial crisis”.
After the crisis, the oil price went down to 49.76 US$/barrel and remained to be volatile. However, there
are several reasons to believe that oil prices may continue to rise in the future. It reached its peak of 90.67
US$/barrel on December 31,2010. Compared with other phases, the Dubai crude oil price was lower after
the crisis occured. However, the negative level relationship between the auto index and the oil index is in
the post-crisis period is bigger than during other phases. This puzzle seems to be due to a market delayed
reaction. This means that stock prices of Japanese automobile manufacturers reacted after the occurence
of the event. Peng (2002) argued that information capacity constraints cause a delay in the response of
asset prices to fundamental and firm specific shocks. However, market participants have somewhat to
believe that oil prices may continue to rise in the future.
7.2. Hybrid cars as an internal factor
The influence of hybrid cars has become more interesting topic as, in general, the regression exhibits a
negative relationship within the oil price and the stock price of hybrid companies before the booming
sales of hybrid car whilst the positive relationship occurs after the booming sales of hybrid cars. As we
have discussed earlier, we have separated the regression for each Toyota and Honda
Toyota chose to pursue hybrid development because, in comparison with other alternative fuesl such as
bioethanol and biodiesel, the development of a hybrid will have much lower levels of CO 2 emissions. The
number of hybrid cars sold has increased rapidly every year. Table 2 in chapter 5 shows that in fiscal year
2001, Toyota sold merely 18,500 units. At that time, the number of hybrid cars were still small due to
hybrid cars were not focusingly sold in Japan. By early 2004s, the price of crude oil imported by Japan
increased from 19.8 US$/barrel to 28.65 US$/barrel and caused Toyota to focus on hybrid car sales in the
domestic market. As a result, sales of Toyota hybrid cars continued to rise by about 68,700 units by fiscal
37

year 2004. Moreover, Toyota sold 72,400 units in the fiscal year 2006 when the Dubai crude oil price was
around 65 US$/barrel. Thus, skyrocketing in oil prices seem to give more opportunities for Toyota to
increase the sales of environmentally friendly vehicles. Consumers demand more fuel efficient vehicles
because of high oil prices so that the hybrid automakers compete each other to meet the consumers’
demand. In fiscal year 2008, Toyota and its Lexus brand successfully sold around 104,000 units hybrid
vehicles, while the crude oil price was at above 100 US$/barrel due to the financial crisis of 2008.
Summarizing the situation, high oil prices have a positive side-effect for Toyota’s profit which boosts the
sales of hybrid cars.
On the other hand, Japanese government is responsible for the Kyoto Protocol with regard to
environmental awareness. On January 2009, the Japanese government introduced subsidies and tax
incentives which boosted the sales of Toyota Prius. These tax incentive pushed consumers to sell their old
cars for fuel efficient cars. However, the government promised to stimulus the sales incentives of hybrid
cars until September 2010. As a consequence, tax incentive from the government and high oil prices
provided a tailwind for buyers of hybrid cars as indicated by the many buyers who took advantage of the
offer with regard to the Toyota Prius. In other words, consumers who drive the vehicles that relatively use
high fuel substitute their cars with the hybrid vehicles.
The increasing of crude oil price and especially a peaked during 2008 is followed by the increase in the
sales of hybrid vehicles made by Toyota. However, Konji Endo a managing director of advanced research
in Tokyo, as cited in Bloomberg stated that the Toyota Prius earned the lowest operating profit compared
with other Toyota products unexpectedly. The reason is due to high R&D cost that has incurred since the
hybrid car project began. As Toyota heavily focuses on production of hybrid cars at the cost of other
models is negative which means Toyota may see a decline in its operating profit. Consequently, the stock
price movement of Toyota is also impacted on with regard to the R&D cost. However, it is important to
remember that the coefficient of oil index is not statistically significant before the booming of the hybrid
cars.
Toyota started recording profit from the sales of hybrid cars on its Prius third generation model that
introduced by the mid year 2009. Price competition from rival hybrid automakers has also made it
difficult for Toyota to capitalize on the success of the model. Consequently, the President of Toyota
announced on Toyota’s official website that the price of the third generation of Prius was to be cut by 12
percent. As a result, the sales of hybrid cars in Japan tremendously increased with the percentage sales
rising from 18.06 percent to 34.50 percent by the fiscal year 2009 and fiscal year 2010 respectively.
Although the Japanese government only supported the incentives until September 2010, Toyota
successfully recorded 433,600 units of hybrid cars in Japan by the fiscal year 2010. Surprisingly, JADA
ranked Toyota Prius in the first place in terms of the highest car sales in Japan from September 2010 until
December 2010 eventhough it was ranked in second place early in 2011. This implie that consumers still
38

want to see an improvement in hybrid cars. With rapidly shooting the oil price creates “a hole” in the
pocket of consumers, new vehicle buyers are more than ever interested in cheaper fuel engines. Many
people would like to see the cost of its vehicle itself make it “better value for money”.
After the boom in sales of the hybrid vehicles, the crude oil price is highly sensitive. On January 25,
2011, the delivery price of Dubai crude oil was a 93.16 US$/barrel. The rise in the Dubai crude oil price
is due to the political instabilities that occured in the Middle-East (i.e. Egypt and Libya). The political
tensions continued to rise further and the price of Dubai crude oil finally reached a level of 109
US$/barrel by the end of March 2011. Indeed, this condition reduces the demand for Dubai crude oil.
Japan demanded less Dubai crude oil during the Middle-East turmoil due to high cost of crude oil. In
response, there has been a high demand for Toyota hybrid vehicles. A frantic number of hybrid car sold is
indicated by the regression results that the coefficient of the oil index is positively related with the stock
prices of Toyota but statistically insignificant.
On the other hand, Honda has concentrated more on the development of small hybrid cars. From table 2,
we can see the difference in unit sales of hybrid cars between Toyota and Honda is large. From 1999 until
2008, Honda did not really focus on the development of hybrid cars. This can be seen by the small
number of hybrid cars sold in Japan. Even worse, In 2006 Honda stopped to produce the Honda Insight.
From JADA, the production of Honda hybrid cars such as the Honda insight and Honda Civic Hybrid are
never ranked among the “best 30” vehicles sold in Japan before the boom in sales of hybrid cars. Honda
is more focused to sell hybrid cars in North America.
Honda set the price of its hybrid products lower than that of Toyota. It made the Honda Insight as the
most affordable hybrid car at that time. As every hybrid carmaker cautiously with the technology, Honda
awares of the R&D costs of producing a hybrid car. Honda’s technology is referred to as Integrated Motor
Assist (IMA), the company has put a lot of effort into reducing its costs. Thus, pushing the costs of the
IMA down is one pratical way since it would cost a lot more to come up with another hybrid powertrain.
As a result, eventhough Honda only sells small numbers of hybrid cars before the boom, its effort to
reduce the R&D costs can create returns. The positive relationship between the stock price of Honda and
the oil price is influenced by the number of hybrid cars sold. When oil price increases, it improves the
sales of hybrid cars and boosts the stock returns of Honda.
Similarly, the oil index exhibit a linear relationship with the Honda index after the boom in sales of
hybrid cars. Under ceteris paribus, table 9 shows an increase by 1% in oil index, it will increase the
Honda’s stock returns by 0.010 percent. By the early 2009s, the demand for hybrid car was so high due to
the government incentive to encourage the sale of green cars. In response, Honda Insight was successfully
sold and, moreover, Honda planned to produce more hybrid cars by 2010. It seems Honda may continue a
successful story of its hybrid car’s sales.
39

Unfortunately, on March 11, 2011 Japan was attacked by Tohoku earthquake that halted every industries
activities. Eventhough the main assembly of hybrid plant is located outside the earthquake area, however,
the main supplier of hybrid’s batteries is located near the earthquake area. According to Bloomberg,
Toyota recorded itself as the most affected automaker by the earthquake where the production was shut
down and Toyota’s vehicle sales dropped by 57 percent by March 2011. Toyota also had to postpone its
new product, Toyota Prius Alpha, due to earthquake. But most of this problem was hampered the
production activities of Honda especially its R&D center is located in the earthquake area. As a results,
Honda expects decreasing on its operating profit. Table 10 shows the regression of Toyota and Honda
from the period of after the booming sales of hybrid cars till the day before the occurence of the
earthquake. As a result, the coefficient of oil index is slightly larger than the coefficient of oil index
before the earthquake occured.
8. Conclusions
The increment in crude oil prices in the past several years plays a major role in the automotive industries.
Indeed, the automotive industries are highly sensitive to oil prices change. In this paper, the relationship
between stock performance of Japanese automobile companies and crude oil prices is investigated.
Specifically, this thesis aims to answer the question of whether the external factors such as Iraq invasion
2003 and financial crisis 2008 affect the relationship. Moreover, whether the hybrid car manufacturers is
certainly not vulnerable to the surge in oil prices.
The empirical result provides evidence that the upsurge in crude oil prices reduce the Japanese
automobile manufacturers’ stock prices. During the Iraq invasion, the result determines that crude oil
prices have an inverse relationship with excess stock returns of Japanese automakers in the pre-war and
the post-war periods. During the post-war period, the oil index is larger (less negative) than the oil index
in the pre-war period. Furthermore, crude oil prices have a linear relationship with excess returns of
Japanese automakers when the invasion took place. Surprisingly, the relationship between stock prices
and oil prices is statistically significant only during the pre-war period. It implies the political instabilities
before the occurence of invasion influence on the relationship between oil prices and stock prices of
Japanese automakers.
Another event, financial crisis 2008, also causes an inverse relationship between the auto index and the
oil index. A coefficient of the oil index in the crisis period exhibits the largest coefficient. Meanwhile the
oil index in the pre-crisis period is larger (less negative) than the oil index in the post-crisis period but, it
is important to remember that the significant result is only during the post-crisis period. The result implies
that market delayed reaction after the crisis period affects the relationship between oil prices and stock
prices of automakers.
40
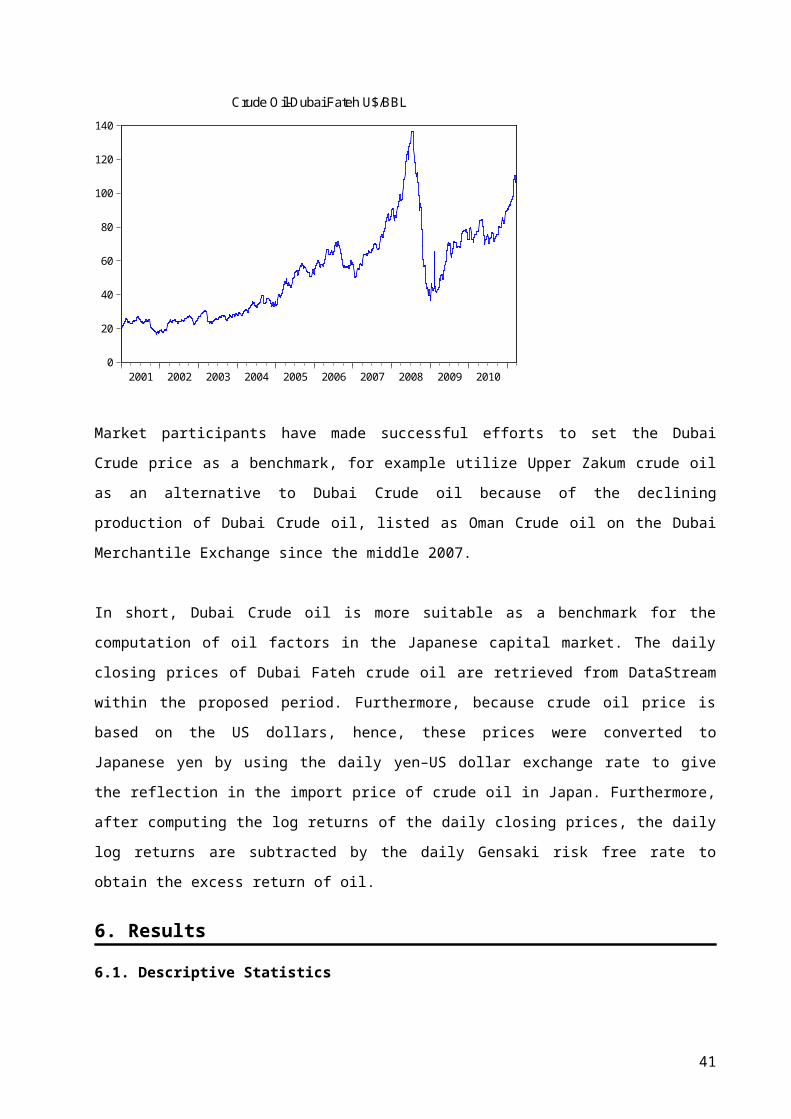
Moreover, Japanese government awares to reduce CO2 emissions by supporting tax incentives for green
cars. To analyze the influence of hybrid cars on the relationship betweeen stock prices of hybrid
automakers and crude oil prices, the regression is divided into two phases. In general, the conclusion is:
crude oil prices have an inverse relationship with stock prices of Japanese hybrid automakers before the
boom in sales of hybrid cars whereas a relationship turns to be a linear after the boom in sales of hybrid
car. The skyrocketing in the oil prices boosts the sales of hybrid cars which have a positive side-effect for
the hybrid automakers. Consumers demand more to have fuel efficient vehicles because of high oil prices.
With rapidly shooting the oil price creates “a hole” in the pocket of consumers, new vehicle buyers are
more than ever interested in cheaper fuel engines. However, both results are insignificant.
REFERENCES
Burbridge, J., and Harrison, A. (1984), “Testing for the effects of oil-price rises using vector
autoregressions”, International Economic Review, 25:459-484
Cameron, K. and Schnusenberg, O. (2009), “Oil prices, SUVs, and Iraq: An invastigation of automobile
manufacturer oil price sensitivity”, Energy Economics, 31:375-381
41

Chiao, C. and Hueng, C.J. (2004), “Overreaction effects independent of risk and characteristics: evidence
from the Japanese stock market”, Japan and the World Economy, 17:431-455
Cochrane, John H. (2005), “Asset pricing: revised edition”, Princeton University Press, USA
Cong, R.G., Wei, Y.M., Jiao, J.L., and Fan, Y. (2008), “ Relationships between oil price shocks and stoc
market: An empirical analysis from China”, Energy Policy, 36:3544-3553
Cunado, J., and Perez de Garcia, F. (2003), “Do oil price shocks matter?Evidence for some European
countries”, Energy Economics, 25:137-154
Cunado, J. and Perez de Garcia, F. (2005), “Oil prices, economic activity and inflation:evidence for some
Asian countries”, The quarterly Review of Economics and Finance, 45(1):65-83
Daniel, K., Titman, S. and John Wei, K.C. (2001), “Explaining the cross-section of stock returns in Japan:
Factors or characteristics?”, Journal of Finance, 56:743-766
Darby, M. (1982), “The price of oil and world inflation and recession”, American Economic Review,
72:738-751
Driesprong, G., Jacobsen, B., and Maat, B. (2007), “Striking oil: Another puzzle”, Journal of Financial
Economics, 89:307-327
Energy Information Administration (2011), “Japan energy data, statistics, and analysis”, [online]
Available at: < http://www.eia.gov/countries/country-data.cfm?fips=JA> [Accessed March 2011]
Economist Intelligence Unit (2011), “The impact of the global financial crisis on the world oil market and
its implications for the GCC countries”,[online] Available
at:<http://www.un.org/regionalcommissions/crisis/escwacri1.pdf> [Accessed August 2011]
El-Sharif, I., Brown, D., Burton, B., Nixon, B., and Russell, A. (2005), “Evidence on the nature and
extent of the relationship between oil prices and equity values in the UK”, Energy Economics, 27:819-
839
Fama, E.F. and French, K.R. (1992), “The cross section of expected stock returns”, Journal of Finance,
47:427-465
Fama, E.F. and French, K.R. (1996), “Multifactor explanations of asset pricing anomalies”, Journal of
Finance, 51:55-84
French, K.R. (2005), Home page. At: http://mba.tuck.dartmouth.edu/pages/faculty/ken.french/Data_Library/f-
f_factors.html
Fayyad, A., and Daly, K. (2009), “The impact of oil price shocks on stock market returns: Comparing
GCC countries with the UK and USA”, Emerging Markets Review, 12:61-78
Georg, K.H. (2008), “The history of alternative fuels in transportation: The case of electric and hybrid
cars”, Utilities Policy, 16:63-71
Hanabusa, K. (2009), “Causality relationship between the price of oil and economic growth in Japan”,
Energy Policy, 37:1953-1957
Hamilton, J.D. (1983), “Oil and the macroeconomy since World War II”, Journal of Political Economy,
91:228-248
42
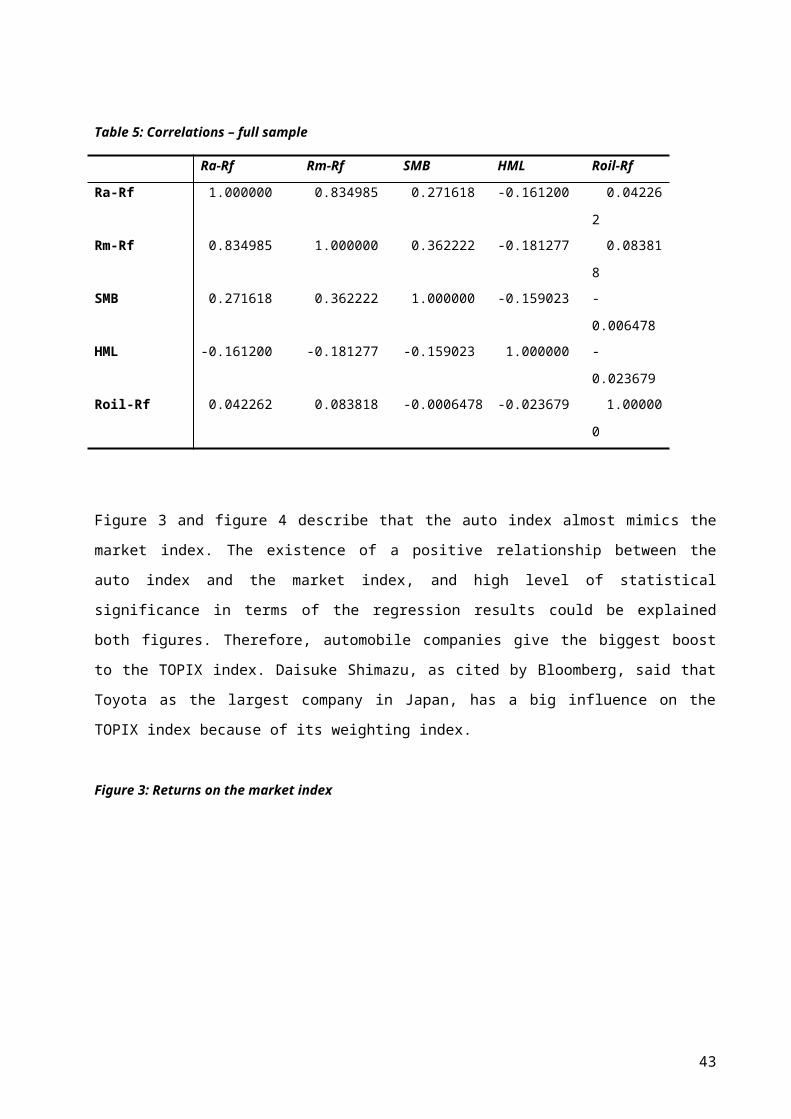
Hamilton, J.D. (2003), “What is an oil shock?”, Journal of Econometrics, 113:363-398
Huang, R.D., Masulis, R.W., and Stoll, H.R. (1996), “Energy shocks and financial markets”, Journal of
Futures Markets, 16:1-27
Honda Worldwide (2005), “Honda vehicle sales in Japan”, [online] Available at: <
http://www.hondanews.com/channels/corporate-worldwide-operations/releases/japan-honda-vehicle-
sales-in-japan> [Accessed May 2011]
Hooker, M.A., (1996), “What happened to the oil price-macroeconomy relationship”, Journal of
Monetary Economics, 38:195-213
Japan Automotive Dealers Association (JADA), [online] Available at: <
http://www.jada.or.jp/index.html> [Accessed May 2011]
Japan Automobile Manufacturers Association (JAMA), [online] Available at: < http://www.jama-
english.jp/> [Accessed May 2011]
Kim, I., and Loungani, P. (1992), “The role of energy in real business cycle models”, Journal of
Monetary Economics, 29:173-189
Lee, K. and Ni, S. (2002), “On the dynamic effects of oil price shocks: a study using industry level data”,
Journal of Monetary Economics, 49:823-852
Lee, B.R., Lee, K., and Ratti, R.A. (2001), “Monetary policy, oil price shocks, and Japanese economy”,
Japan and the World Economy, 13:321-349
Maghyereh, A., Al-Kandari, A. (2007), “Oil prices and stock markets in GCC countries: new evidence
from nonlinear co-integration analysis”, Managerial Finance, 33:449-460
Manda, K. (2010), “Stock volatility during the 2008 financial crisis”,at:
http://w4.stern.nyu.edu/glucksman/docs/Manda2010.pdf [Accessed May 2011]
Miller, J.I. and Ratti, R.A. (2009), “Crude oil and stock markets: Stability, instability, and bubbles”,
Energy Economics, 31:559-568
Mork, K. (1994), “Business cycles and the oil market”, Energy Journal, 15:15-38
Nishizawa, K. and Tsunetomi, K. (2010), “Japanese stocks fall as Toyota leads declining in record
trading”,Bloomberg,[online],at:<http://www.bloomberg.com/apps/news?
pid=newsarchive&sid=alFOU0NeCTgE> [Accessed 20 July 2011]
Ono, M. (n.d.), “Rising crude oil prices affect the Japanese economy”, Economic Research Department
Papapetrou, E. (2001), “Oil price shocks, stock market, economic activity, and employment in Greece”,
Energy Economics, 23:511-532
Park, J. and Ratti, R.A. (2008), “Oil price shocks and stock markets in the US and 13 European
countries”, Energy Economics, 30:2587-2608
Pham, Long, V. (2007), “Constructing Fama-French factors from style indexes: Japanese evidence”,
Economics Buletin. at: http://economicsbulletin.vanderbilt.edu/2007/volume7/EB-06G00069A.pdf
[Accessed 15 May 2011]
Pennachi, G. (2008), “Theory of asset pricing”, Pearson Education, USA
43

Rebeca, J.R., and Sanchez, M. (2005), “Oil price shocks and real GDP growth: empirical evidence for
some OECD countries”, Applied Economics, 37:201-228
Sadorsky, P. (2001), “Oil price shocks and stock market activity”, Energy Economics, 21:9-469
Tanaka, P. and Shigeta, Y. (2007), “Upcoming advances in the hybrid vehicle market”, NRI Paper, No.
114
Toyota Motor Company, (2011) “ Worldwide sales of TMC hybrids top 3 million units”, [online]
Available at: < http://www2.toyota.co.jp/en/news/11/03/0308.html> [Accessed June 2011]
Ueno, K. and Komatsu, T. (2010), “Toyota Prius leaps to no.1 in Japan on incentives (update 2)”,
Bloomberg, [online], at :<http://www.bloomberg.com/apps/news?pid=newsarchive&sid=a1kPj_bJW8aI>
[Accessed 20 July 2011]
44

45