PREDICTIVE MODELS FOR NORMALIZED SHEAR MODULUS AND … · PREDICTIVE MODELS FOR NORMALIZED SHEAR...
14
Acta Geodyn. Geomater., Vol. 14, No. 1 (185), 27–40, 2017 DOI: 10.13168/AGG.2016.0025 journal homepage: https://www.irsm.cas.cz/acta ORIGINAL PAPER PREDICTIVE MODELS FOR NORMALIZED SHEAR MODULUS AND DAMPING RATIO OF MODELED ROCKFILL MATERIALS Ata AGHAEI ARAEI 1) * and Ahmadreza GHODRATI 2) 1) Head of Geotechnical Department, Road, Housing and Urban Development Research Center (BHRC), Tehran, Iran 2) Institute of Building and Housing, Road, Housing and Urban Development Research Center (BHRC), Tehran, Iran *Corresponding author‘s e-mail: [email protected] ABSTRACT This study presents predictive models for estimating normalized shear modulus and damping ratio of three compacted remodeled rockfill materials using modified hyperbolic and nonlinear multiple regression methods. The predictive models uses the results of dynamic triaxial tests carried out on cylindrical samples. Tested materials were obtained from the locations of a number of Concrete Faced Rockfill Dams (CFRDs) constructed in Iran. The laboratory test results show that the shear modulus and especially the damping behavior, are influenced by the frequency of loading. The loading frequency and confining pressure were the most important factors that affect dynamic properties of the rockfill materials. In the preliminary part of this paper, the modified hyperbolic method has been considered for developing the predictive models. The predictions did not have enough precision. There were limitations while selecting γ r , the reference shear strain at G/G O =0.5, due to the loading frequency and confining pressure effects. Therefore, results were presented using nonlinear multiple regression approach. The comparison of results shows that the nonlinear multiple regression method is very effective in modeling dynamic properties of soils such as the shear modulus and damping ratio than the classical hyperbolic models. ARTICLE INFO Article history: Received 7 March 2016 Accepted 18 July 2016 Available online 23 August 2016 Keywords: Normalized shear modulus Damping ratio Hyperbolic model Nonlinear multiple regression model Rockfill material Cite this article as: Aghaei Araei A, Ghodrati A: Predictive models for normalized shear modulus and damping ratio of modeled rockfill materials.Acta Geodyn. Geomater., 14, No. 1 (185), 27–40, 2017. DOI: 10.13168/AGG.2016.0025 pressure, stress induced isotropy, strength, size and shape of particles, loading frequency and wave forms are identified as important parameters. Further, shear strain (γ), effective confining pressure ( 3 σ ′ ) and loading frequency are considered as the most important factors that affect the dynamic properties of gravelly soils (Aghaei Araei et al., 2012a). The variation of shear modulus and damping with shear strain level, G/G 0 -γ and D-γ curves, are used as fundamental input parameters in computer programs (Schnabel et al., 1972; Idriss et al., 1973 and Hudson et al., 1994), and numerical analysis for soil modeling and many other seismic response analysis studies. For example, it is a common practice to adopt the upper and lower bounds of the G/G 0 -γ and D- γ curves proposed by Seed and Idriss (1970), Seed et al. (1986) or Rollins et al. (1998) for granular soils. The similar curves presented by Sun et al. (1988), Vucetic and Dobry (1991) or Stokoe et al. (2004) are also used for soils with variable plasticity index. Alternatively, equations of empirical or analytical models are often utilized. In these models the normalized shear modulus and the damping ratio are commonly expressed as a function of the shear strain amplitude, γ, the mean effective confining pressure, m σ ′ , and plasticity index, PI. Seed and Idriss (1970) published the first database of shear modulus degradation curves for sands. The S-shaped curves were obtained from 75 tests of a total of 30 sands, with a wide range of 1. INTRODUCTION A number of rockfill dams and Concrete Faced Rockfill Dams (CFRDs) have been constructed in near faults regions which are vulnerable to earthquakes. Therefore, the seismic design of these dams at these earthquake prone regions has become an important issue. The normalized modulus degradation (G/G O ) and damping ratio (D) increase from small to large shear strains (γ) are both the key parameters to the fundamental understanding of soil behavior. Soil stiffness is represented by shear modulus and usually expressed in normalized form (divided by the small strain shear modulus, G 0 ). The G/G 0 curve is normally used to explain the shear stiffness for a wide range of shear strain. The damping ratio (D) represents the energy dissipated by the soil. Mechanisms that contribute to material damping are friction between soil particles, strain rate effect, and nonlinear soil behavior (Zhang et al., 2005). In past, investigators have used cyclic triaxial or resonant column tests to determine the factors that affect normalized shear modulus and damping ratio for various materials, namely, gravels (Seed et al., 1986; Rollins et al., 1998; Aghaei Araei et al., 2010, 2011a, b, 2012 a, b, c), sands (Wilson, 1988; Kokusho, 1980), loess (Hardcastle and Sharma, 1998) and clays (Idriss et al., 1978; Kokusho et al., 1982, Vucetic and Dobry, 1991; Teachavorasinskun. 2001). Based on the literature review, following factors namely mineralogical composition, dry density, grain size distribution, drainage conditions, moisture content, confining
Transcript of PREDICTIVE MODELS FOR NORMALIZED SHEAR MODULUS AND … · PREDICTIVE MODELS FOR NORMALIZED SHEAR...
Acta Geodyn. Geomater., Vol. 14, No. 1 (185), 27–40, 2017
DOI: 10.13168/AGG.2016.0025
journal homepage: https://www.irsm.cas.cz/acta
ORIGINAL PAPER
PREDICTIVE MODELS FOR NORMALIZED SHEAR MODULUS AND DAMPING RATIO OF MODELED ROCKFILL MATERIALS
Ata AGHAEI ARAEI 1) * and Ahmadreza GHODRATI 2)
1) Head of Geotechnical Department, Road, Housing and Urban Development Research Center (BHRC), Tehran, Iran 2) Institute of Building and Housing, Road, Housing and Urban Development Research Center (BHRC), Tehran, Iran
*Corresponding author‘s e-mail: [email protected]
ABSTRACT
This study presents predictive models for estimating normalized shear modulus and dampingratio of three compacted remodeled rockfill materials using modified hyperbolic and nonlinearmultiple regression methods. The predictive models uses the results of dynamic triaxial testscarried out on cylindrical samples. Tested materials were obtained from the locations ofa number of Concrete Faced Rockfill Dams (CFRDs) constructed in Iran. The laboratory testresults show that the shear modulus and especially the damping behavior, are influenced by thefrequency of loading. The loading frequency and confining pressure were the most importantfactors that affect dynamic properties of the rockfill materials. In the preliminary part of thispaper, the modified hyperbolic method has been considered for developing the predictivemodels. The predictions did not have enough precision. There were limitations while selecting γr,the reference shear strain at G/GO=0.5, due to the loading frequency and confining pressureeffects. Therefore, results were presented using nonlinear multiple regression approach. Thecomparison of results shows that the nonlinear multiple regression method is very effective inmodeling dynamic properties of soils such as the shear modulus and damping ratio than theclassical hyperbolic models.
ARTICLE INFO
Article history:
Received 7 March 2016 Accepted 18 July 2016 Available online 23 August 2016
Keywords: Normalized shear modulus Damping ratio Hyperbolic model Nonlinear multiple regression model Rockfill material
Cite this article as: Aghaei Araei A, Ghodrati A: Predictive models for normalized shear modulus and damping ratio of modeled rockfill materials.Acta Geodyn. Geomater., 14, No. 1 (185), 27–40, 2017. DOI: 10.13168/AGG.2016.0025
pressure, stress induced isotropy, strength, size andshape of particles, loading frequency and wave formsare identified as important parameters. Further, shearstrain (γ), effective confining pressure ( 3σ ′ ) and
loading frequency are considered as the mostimportant factors that affect the dynamic properties ofgravelly soils (Aghaei Araei et al., 2012a).
The variation of shear modulus and dampingwith shear strain level, G/G0-γ and D-γ curves, areused as fundamental input parameters in computerprograms (Schnabel et al., 1972; Idriss et al., 1973 andHudson et al., 1994), and numerical analysis for soilmodeling and many other seismic response analysisstudies. For example, it is a common practice to adoptthe upper and lower bounds of the G/G0-γ and D-γ curves proposed by Seed and Idriss (1970), Seed etal. (1986) or Rollins et al. (1998) for granular soils.The similar curves presented by Sun et al. (1988),Vucetic and Dobry (1991) or Stokoe et al. (2004) arealso used for soils with variable plasticity index.Alternatively, equations of empirical or analyticalmodels are often utilized. In these models thenormalized shear modulus and the damping ratio arecommonly expressed as a function of the shear strainamplitude, γ, the mean effective confining pressure,
mσ ′ , and plasticity index, PI.
Seed and Idriss (1970) published the firstdatabase of shear modulus degradation curves forsands. The S-shaped curves were obtained from 75tests of a total of 30 sands, with a wide range of
1. INTRODUCTION
A number of rockfill dams and Concrete FacedRockfill Dams (CFRDs) have been constructed innear faults regions which are vulnerable toearthquakes. Therefore, the seismic design of thesedams at these earthquake prone regions has become animportant issue. The normalized modulus degradation(G/GO) and damping ratio (D) increase from small tolarge shear strains (γ) are both the key parameters tothe fundamental understanding of soil behavior. Soilstiffness is represented by shear modulus and usuallyexpressed in normalized form (divided by the smallstrain shear modulus, G0). The G/G0 curve is normallyused to explain the shear stiffness for a wide range ofshear strain. The damping ratio (D) represents theenergy dissipated by the soil. Mechanisms thatcontribute to material damping are friction betweensoil particles, strain rate effect, and nonlinear soilbehavior (Zhang et al., 2005). In past, investigatorshave used cyclic triaxial or resonant column tests todetermine the factors that affect normalized shearmodulus and damping ratio for various materials,namely, gravels (Seed et al., 1986; Rollins et al.,1998; Aghaei Araei et al., 2010, 2011a, b, 2012 a, b,c), sands (Wilson, 1988; Kokusho, 1980), loess(Hardcastle and Sharma, 1998) and clays (Idriss et al.,1978; Kokusho et al., 1982, Vucetic and Dobry, 1991;Teachavorasinskun. 2001). Based on the literaturereview, following factors namely mineralogicalcomposition, dry density, grain size distribution,drainage conditions, moisture content, confining
A. Aghaei Araei and A. Ghodrati
28
1500 kPa, respectively) revealed that, the shearmodulus and especially the damping ratio behavior areinfluenced by the frequency of loading. Increase inloading frequency increases shear modulus at lowstrain, but the effect of frequency decreases as strainincreases. The damping ratio increases considerablyby increasing the loading frequency. The shearmodulus increased remarkably by increasing theconfining pressure but the damping ratio negligiblychanges.
However, none of the suggested models onliterature reflect the relationship between the loadingfrequency and the shear modulus and dampingbehavior of gravelly soils. In this study, first,a modified hyperbolic model has been used toestimate the shear modulus and damping behavior ofhigh compacted modeled rockfill materials. Despiteefforts made in appropriate coefficients selection, thepredictions results did not have enough accuracy.Moreover, there are problems and limitations whileselecting parameter γr because of loading frequencyand confining pressure effects. In other words, insome cases, especially at high confining pressure andhigh loading frequency, the ratio G/G0=0.5 couldn’tbe reached and parameter γr has been determined byan engineering judgment. Therefore, a differentapproach namely, nonlinear multiple regressionmethod has been evaluated in predicting the shearmodulus and damping ratio of gravelly materials onvarious shear strain levels. Based on the triaxial testresults on gravelly material, the confining pressure,loading frequency and shear strain are considered asthe most important parameters that affect the shearmodulus and damping ratio.
The proposed D-γ and G/G0-γ equations in thispaper can be utilized in SHAKE family computerprograms. They can also be used in numerical analysisfor modeling soil behavior or other seismic responseanalysis. The presented data and equations can be veryhelpful along with other studies (carried out on coarsegrain materials e.g. Seed et al. (1986) and Rollins etal. (1998)), with a special focus on the effects of theloading frequency and high confining pressure.
2. MATERIAL AND METHODS
In this study, the data obtained from testedgravelly samples. The materials were prepared fromthree shell of the under construction Upper and LowerSiah-Bisheh High CFRDs in Iran. Herein thesematerials are named S.SBU, S.SBLII and S.SBLIV,respectively. The S.SBU were produced by quarryblasting and used in shell materials of the Upper Siah-Bisheh CFRD. The S.SBLII (from quarry No.II) andthe S.SBLIV (from quarry No.IV) materials were alsoproduced by quarry blasting and used for the LowerSiah-Bisheh CFRD. Individual particles are composedof “lime and volcanic rocks” and “lime rock”,respectively. The gradation curves of the materials fortriaxial testing were obtained with the maximumparticle size of 50 mm (1/6 diameter of large-scaletriaxial specimen, 30 cm). All materials have the samegradation. D10, D30, D50 and D85 values are 0.5, 2.5,
confining pressure, relative density and void ratio.Hardin and Drnevich (1972a) and Hardin andDrnevich (1972b) proposed two of the most widelyused models (i.e. hyperbolic model) in numericalanalyses. Later Darendeli (1997), Darendeli (2001)and Anderson (1974) have suggested the modifiedhyperbolic model.
Khouri (1984), Aggur and Zhang (2006) andOkur and Ansal (2007) determined damping behaviorof granular and cohesive soils for a given shear strainlevel from the corresponding G/GO ratio using first orsecond order polynomial relationships alternativelyexponential expressions.
Darendeli (2001) presented a more sophisticatedmodel in a modified form where the soil is assumed toexhibit mass behavior. The fitting parameters weredetermined from experimental data on intact soils ofvariable plasticity index. Later, Meng (2003) verifiedhis model for granular soils.
Zhang et al. (2005) presented predictiveequations for estimating normalized shear modulusand damping ratio of sands and clays. Their equationsare also based on a modified hyperbolic model, whichincludes some variables namely shear strainamplitude, confining pressure, and plasticity index(PI). The damping ratio is also expressed in terms ofa polynomial function of normalized shear modulusand minimum damping ratio. Comparisons betweenthese predictive equations and the earlier publishedexpressions shows that the effect of confining stress ismore significant, while the effect of PI is lesssignificant in modeling dynamic soil behavior.
Vardanega et al. (2013) presented the analysis ofsemi empirical expressions for Gmax in a simpleexpression form that uses only a void-ratio functionand a confining-stress function. They complieda database of 67 tests on 21 clays and silts usingresults of undrained shear stress-strain tests on fine-grained soils.
Other methods have also been used to predict theG and D of soils. Jafarian et al. (2014) used a newaspect of modeling called artificial neural network. Intheir study, a radial basis function (RBF) neuralnetwork model was developed to predict thenormalized shear modulus of cohesive soils. Akbulutet al. (2004) also used a neuro-fuzzy network to modelthe shear modulus and damping ratio behavior ofsand. Three predictive systems, adaptive neuro-fuzzyinference system (ANFIS), multi-layer perceptron(MLP) and multiple regression analysis method(MRM) were trained to predict the maximum shearmodulus and the minimum damping coefficient.
There is not much research in the literature aboutthe effects of frequency on the behavior of gravellymaterials via large triaxial tests. The less informationeven available on high confining pressures (AghaeiAraei 2012a). Consequently, predictive models havenot been developed to estimate shear modulus anddamping ratio for the above conditions. Extensivetriaxial testing by Aghaei Araei et al. (2011a, 2011band 2012a) on gravels (e.g. frequency and confiningpressure change from 0.1 to 10 Hz and 100 to
PREDICTIVE MODELS FOR NORMALIZED SHEAR MODULUS AND DAMPING RATIO … .
29
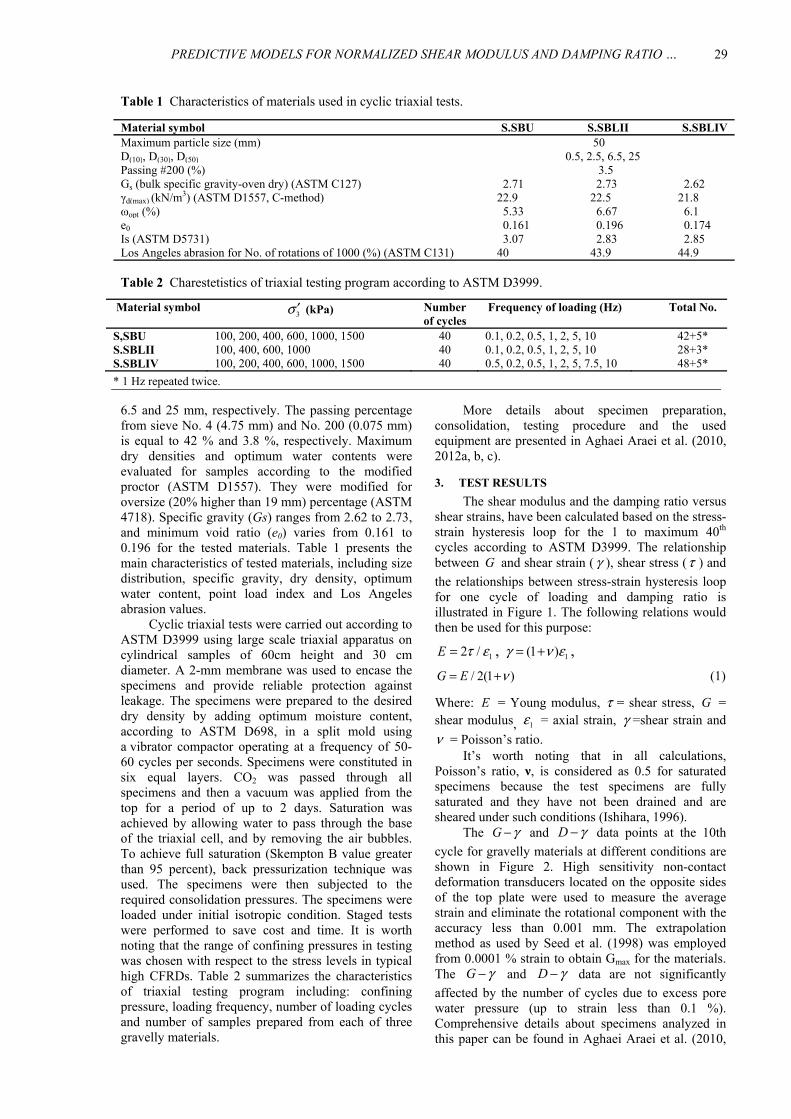
Table 1 Characteristics of materials used in cyclic triaxial tests.
S.SBLIV S.SBLII S.SBU Material symbol 50 Maximum particle size (mm)
0.5, 2.5, 6.5, 25 D(10), D(30), D(50)
03.5 Passing #200 (%) 02.62 02.73 02.71 Gs (bulk specific gravity-oven dry) (ASTM C127) 21.8 22.5 22.9 γd(max) (kN/m3) (ASTM D1557, C-method) 06.1 06.67 05.33 ωopt (%) 00.174 00.196 00.161 e0
02.85 02.83 03.07 Is (ASTM D5731) 44.9 43.9 40 Los Angeles abrasion for No. of rotations of 1000 (%) (ASTM C131)
Table 2 Charestetistics of triaxial testing program according to ASTM D3999.
Material symbol 3σ ′ (kPa) Number
of cycles Frequency of loading (Hz) Total No.
S,SBU 100, 200, 400, 600, 1000, 1500 40 0.1, 0.2, 0.5, 1, 2, 5, 10 42+5* S.SBLII 100, 400, 600, 1000 40 0.1, 0.2, 0.5, 1, 2, 5, 10 28+3* S.SBLIV 100, 200, 400, 600, 1000, 1500 40 0.5, 0.2, 0.5, 1, 2, 5, 7.5, 10 48+5*
* 1 Hz repeated twice.
More details about specimen preparation,consolidation, testing procedure and the usedequipment are presented in Aghaei Araei et al. (2010,2012a, b, c).
3. TEST RESULTS
The shear modulus and the damping ratio versusshear strains, have been calculated based on the stress-strain hysteresis loop for the 1 to maximum 40th
cycles according to ASTM D3999. The relationshipbetween G and shear strain ( γ ), shear stress (τ ) and
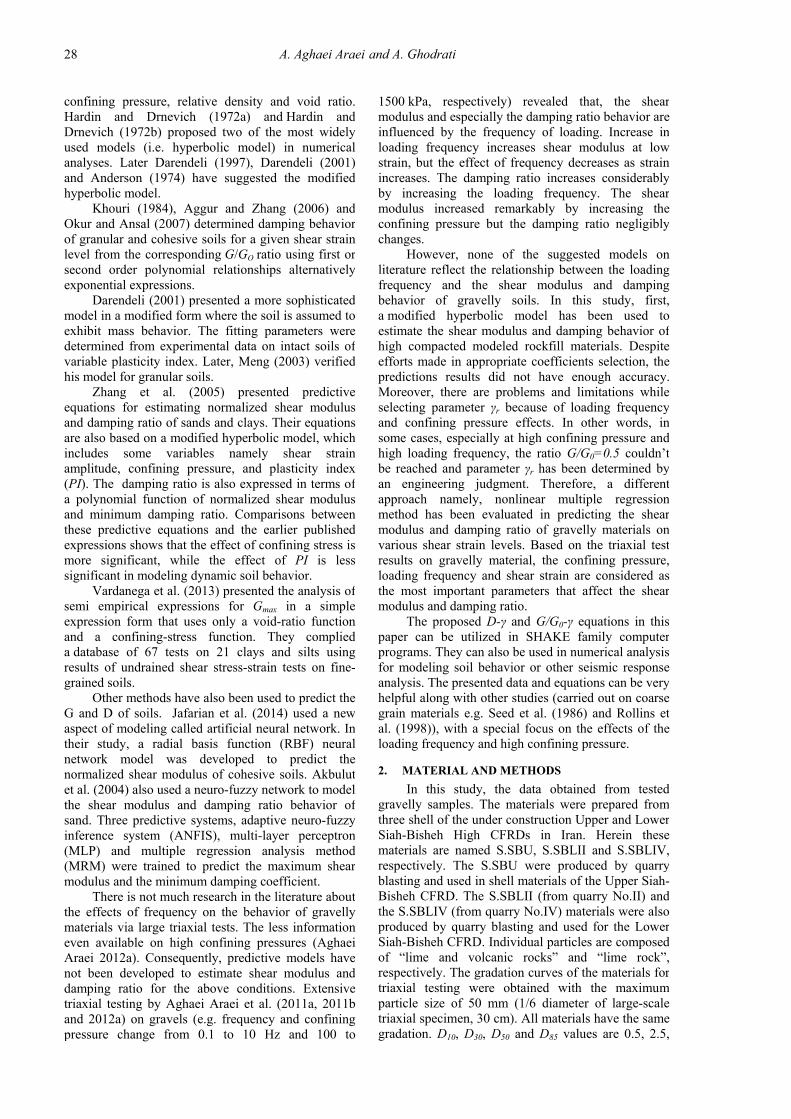
the relationships between stress-strain hysteresis loopfor one cycle of loading and damping ratio isillustrated in Figure 1. The following relations wouldthen be used for this purpose:
12 /E τ ε= , 1(1 )γ ν ε= + ,
/ 2(1 )G E ν= + (1)
Where: E = Young modulus, τ = shear stress, G =shear modulus, 1ε = axial strain, γ =shear strain and
ν = Poisson’s ratio. It’s worth noting that in all calculations,
Poisson’s ratio, ν, is considered as 0.5 for saturatedspecimens because the test specimens are fullysaturated and they have not been drained and aresheared under such conditions (Ishihara, 1996).
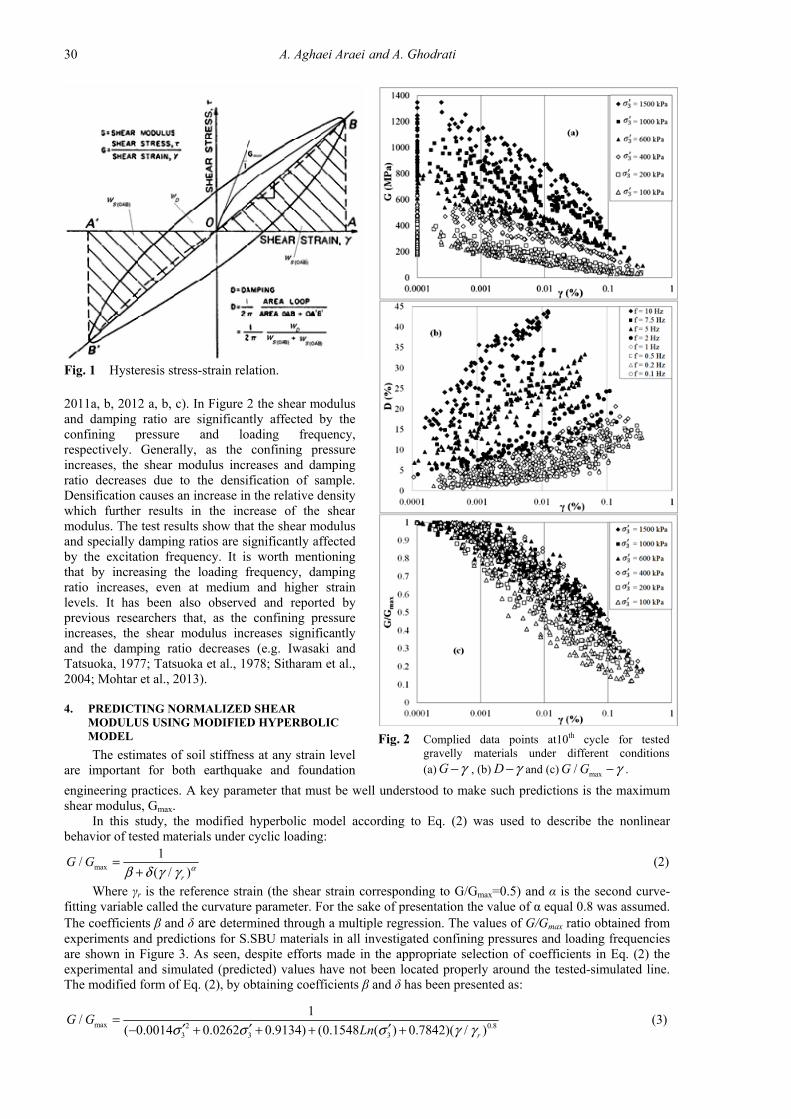
The G γ− and D γ− data points at the 10th
cycle for gravelly materials at different conditions areshown in Figure 2. High sensitivity non-contactdeformation transducers located on the opposite sidesof the top plate were used to measure the averagestrain and eliminate the rotational component with theaccuracy less than 0.001 mm. The extrapolationmethod as used by Seed et al. (1998) was employedfrom 0.0001 % strain to obtain Gmax for the materials.The G γ− and D γ− data are not significantly
affected by the number of cycles due to excess porewater pressure (up to strain less than 0.1 %).Comprehensive details about specimens analyzed inthis paper can be found in Aghaei Araei et al. (2010,
6.5 and 25 mm, respectively. The passing percentagefrom sieve No. 4 (4.75 mm) and No. 200 (0.075 mm)is equal to 42 % and 3.8 %, respectively. Maximumdry densities and optimum water contents wereevaluated for samples according to the modifiedproctor (ASTM D1557). They were modified foroversize (20% higher than 19 mm) percentage (ASTM4718). Specific gravity (Gs) ranges from 2.62 to 2.73,and minimum void ratio (e0) varies from 0.161 to0.196 for the tested materials. Table 1 presents themain characteristics of tested materials, including sizedistribution, specific gravity, dry density, optimumwater content, point load index and Los Angelesabrasion values.
Cyclic triaxial tests were carried out according toASTM D3999 using large scale triaxial apparatus oncylindrical samples of 60cm height and 30 cmdiameter. A 2-mm membrane was used to encase thespecimens and provide reliable protection againstleakage. The specimens were prepared to the desireddry density by adding optimum moisture content,according to ASTM D698, in a split mold usinga vibrator compactor operating at a frequency of 50-60 cycles per seconds. Specimens were constituted insix equal layers. CO2 was passed through allspecimens and then a vacuum was applied from thetop for a period of up to 2 days. Saturation wasachieved by allowing water to pass through the baseof the triaxial cell, and by removing the air bubbles.To achieve full saturation (Skempton B value greaterthan 95 percent), back pressurization technique wasused. The specimens were then subjected to therequired consolidation pressures. The specimens wereloaded under initial isotropic condition. Staged testswere performed to save cost and time. It is worthnoting that the range of confining pressures in testingwas chosen with respect to the stress levels in typicalhigh CFRDs. Table 2 summarizes the characteristicsof triaxial testing program including: confiningpressure, loading frequency, number of loading cyclesand number of samples prepared from each of threegravelly materials.
A. Aghaei Araei and A. Ghodrati
30
Fig. 1 Hysteresis stress-strain relation.
2011a, b, 2012 a, b, c). In Figure 2 the shear modulus and damping ratio are significantly affected by the confining pressure and loading frequency, respectively. Generally, as the confining pressure increases, the shear modulus increases and damping ratio decreases due to the densification of sample. Densification causes an increase in the relative density which further results in the increase of the shear modulus. The test results show that the shear modulus and specially damping ratios are significantly affected by the excitation frequency. It is worth mentioning that by increasing the loading frequency, damping ratio increases, even at medium and higher strain levels. It has been also observed and reported by previous researchers that, as the confining pressure increases, the shear modulus increases significantly and the damping ratio decreases (e.g. Iwasaki and Tatsuoka, 1977; Tatsuoka et al., 1978; Sitharam et al.,2004; Mohtar et al., 2013).
4. PREDICTING NORMALIZED SHEAR
MODULUS USING MODIFIED HYPERBOLIC MODEL
The estimates of soil stiffness at any strain level are important for both earthquake and foundation
Fig. 2 Complied data points at10th cycle for tested gravelly materials under different conditions (a) G γ− , (b) D γ− and (c) max/G G γ− .
engineering practices. A key parameter that must be well understood to make such predictions is the maximum shear modulus, Gmax.
In this study, the modified hyperbolic model according to Eq. (2) was used to describe the nonlinear behavior of tested materials under cyclic loading:
max
1/
( / )r
G G αβ δ γ γ=
+ (2)
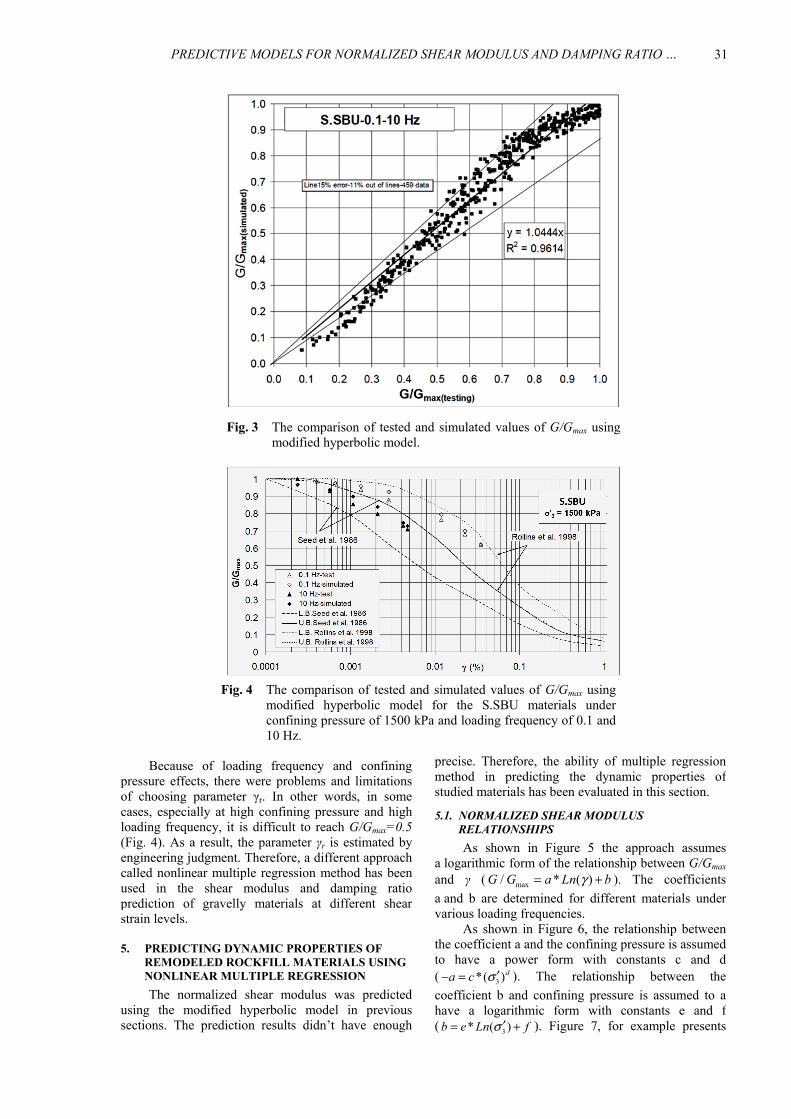
Where γr is the reference strain (the shear strain corresponding to G/Gmax=0.5) and α is the second curve-fitting variable called the curvature parameter. For the sake of presentation the value of α equal 0.8 was assumed. The coefficients β and δ are determined through a multiple regression. The values of G/Gmax ratio obtained from experiments and predictions for S.SBU materials in all investigated confining pressures and loading frequencies are shown in Figure 3. As seen, despite efforts made in the appropriate selection of coefficients in Eq. (2) the experimental and simulated (predicted) values have not been located properly around the tested-simulated line. The modified form of Eq. (2), by obtaining coefficients β and δ has been presented as:
max 2 0.83 3 3
1/
( 0.0014 0.0262 0.9134) (0.1548 ( ) 0.7842)( / )r
G GLnσ σ σ γ γ
=′ ′ ′− + + + +
(3)
PREDICTIVE MODELS FOR NORMALIZED SHEAR MODULUS AND DAMPING RATIO … .
31
Fig. 3 The comparison of tested and simulated values of G/Gmax using modified hyperbolic model.
Fig. 4 The comparison of tested and simulated values of G/Gmax using modified hyperbolic model for the S.SBU materials under confining pressure of 1500 kPa and loading frequency of 0.1 and 10 Hz.
precise. Therefore, the ability of multiple regression method in predicting the dynamic properties of studied materials has been evaluated in this section.
5.1. NORMALIZED SHEAR MODULUS RELATIONSHIPS
As shown in Figure 5 the approach assumes a logarithmic form of the relationship between G/Gmax
and γ ( max/ * ( )G G a Ln bγ= + ). The coefficients
a and b are determined for different materials under various loading frequencies.
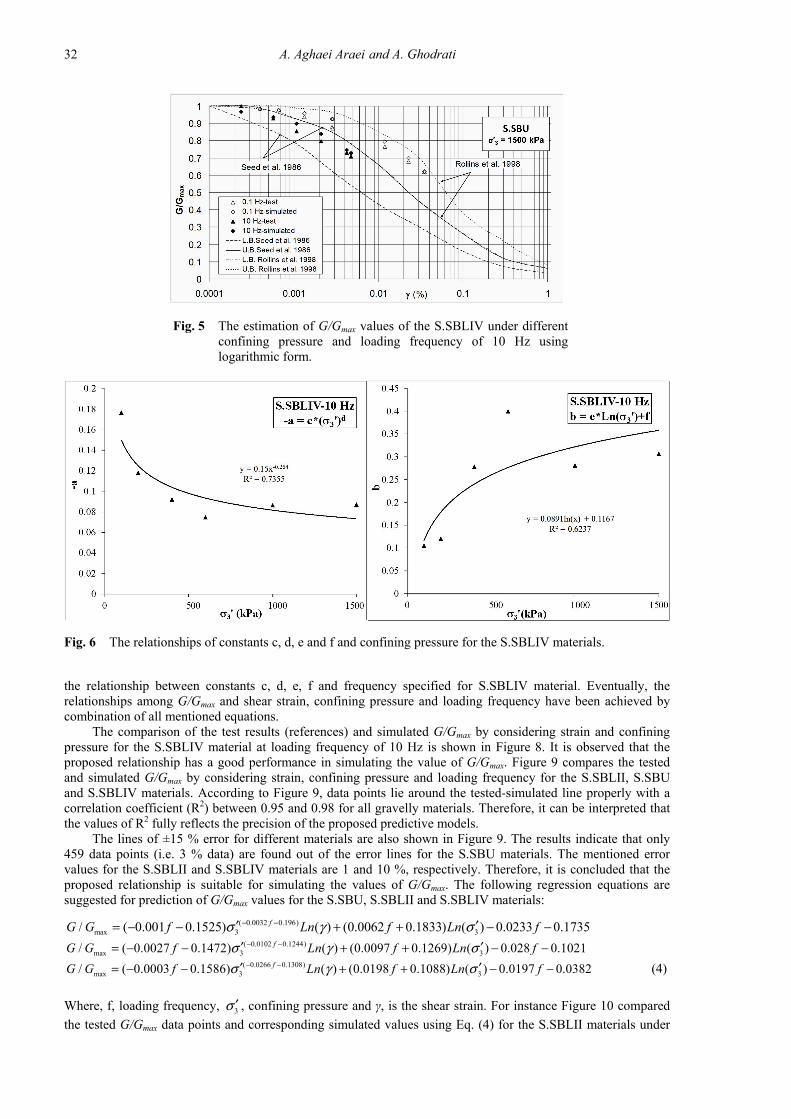
As shown in Figure 6, the relationship between the coefficient a and the confining pressure is assumed to have a power form with constants c and d ( 3*( )da c σ ′− = ). The relationship between the
coefficient b and confining pressure is assumed to a have a logarithmic form with constants e and f ( 3* ( )b e Ln fσ ′= + ). Figure 7, for example presents
Because of loading frequency and confining pressure effects, there were problems and limitations of choosing parameter γr. In other words, in some cases, especially at high confining pressure and high loading frequency, it is difficult to reach G/Gmax=0.5(Fig. 4). As a result, the parameter γr is estimated by engineering judgment. Therefore, a different approach called nonlinear multiple regression method has been used in the shear modulus and damping ratio prediction of gravelly materials at different shear strain levels.
5. PREDICTING DYNAMIC PROPERTIES OF
REMODELED ROCKFILL MATERIALS USING NONLINEAR MULTIPLE REGRESSION
The normalized shear modulus was predicted using the modified hyperbolic model in previous sections. The prediction results didn’t have enough
A. Aghaei Araei and A. Ghodrati
32
Fig. 5 The estimation of G/Gmax values of the S.SBLIV under differentconfining pressure and loading frequency of 10 Hz usinglogarithmic form.
Fig. 6 The relationships of constants c, d, e and f and confining pressure for the S.SBLIV materials.
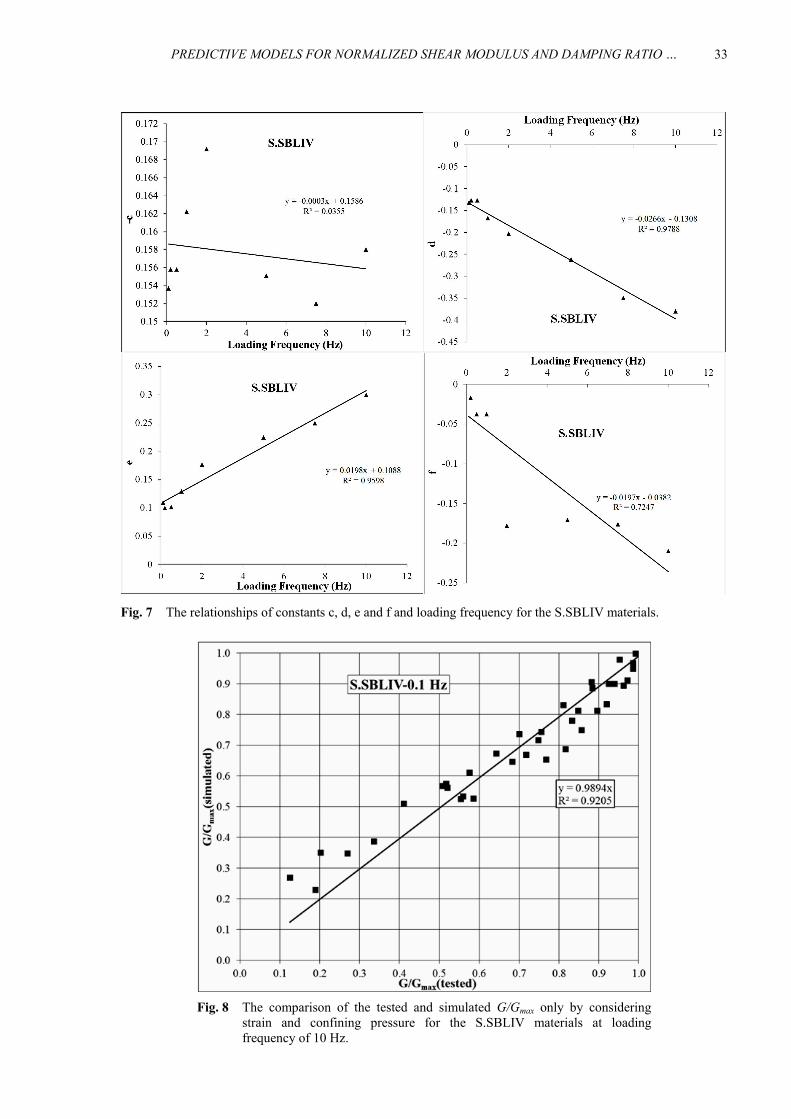
the relationship between constants c, d, e, f and frequency specified for S.SBLIV material. Eventually, therelationships among G/Gmax and shear strain, confining pressure and loading frequency have been achieved bycombination of all mentioned equations.
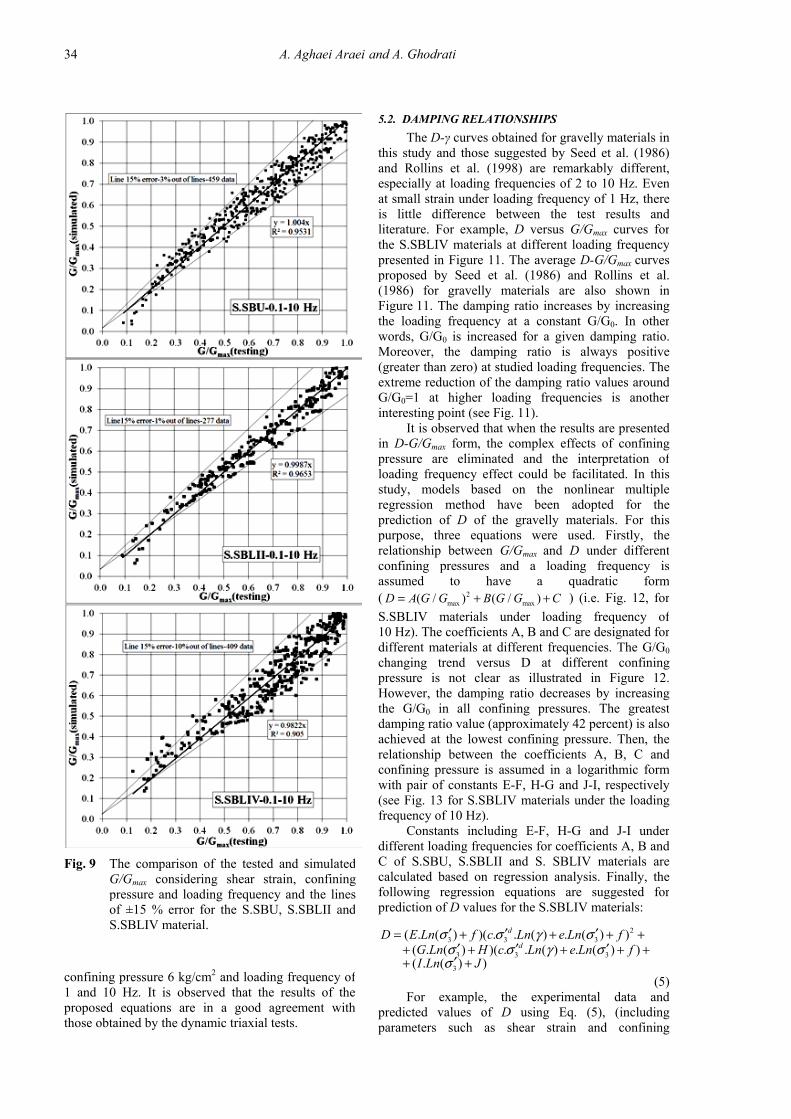
The comparison of the test results (references) and simulated G/Gmax by considering strain and confiningpressure for the S.SBLIV material at loading frequency of 10 Hz is shown in Figure 8. It is observed that theproposed relationship has a good performance in simulating the value of G/Gmax. Figure 9 compares the testedand simulated G/Gmax by considering strain, confining pressure and loading frequency for the S.SBLII, S.SBUand S.SBLIV materials. According to Figure 9, data points lie around the tested-simulated line properly with acorrelation coefficient (R2) between 0.95 and 0.98 for all gravelly materials. Therefore, it can be interpreted thatthe values of R2 fully reflects the precision of the proposed predictive models.
The lines of ±15 % error for different materials are also shown in Figure 9. The results indicate that only459 data points (i.e. 3 % data) are found out of the error lines for the S.SBU materials. The mentioned errorvalues for the S.SBLII and S.SBLIV materials are 1 and 10 %, respectively. Therefore, it is concluded that theproposed relationship is suitable for simulating the values of G/Gmax. The following regression equations aresuggested for prediction of G/Gmax values for the S.SBU, S.SBLII and S.SBLIV materials:
( 0.0032 0.196)max 3 3/ ( 0.001 0.1525) ( ) (0.0062 0.1833) ( ) 0.0233 0.1735fG G f Ln f Ln fσ γ σ− −′ ′= − − + + − −
( 0.0102 0.1244)max 3 3/ ( 0.0027 0.1472) ( ) (0.0097 0.1269) ( ) 0.028 0.1021fG G f Ln f Ln fσ γ σ− −′ ′= − − + + − −
( 0.0266 0.1308)max 3 3/ ( 0.0003 0.1586) ( ) (0.0198 0.1088) ( ) 0.0197 0.0382fG G f Ln f Ln fσ γ σ− −′ ′= − − + + − − (4)
Where, f, loading frequency, 3σ ′ , confining pressure and γ, is the shear strain. For instance Figure 10 compared
the tested G/Gmax data points and corresponding simulated values using Eq. (4) for the S.SBLII materials under
PREDICTIVE MODELS FOR NORMALIZED SHEAR MODULUS AND DAMPING RATIO … .
33
Fig. 7 The relationships of constants c, d, e and f and loading frequency for the S.SBLIV materials.
Fig. 8 The comparison of the tested and simulated G/Gmax only by consideringstrain and confining pressure for the S.SBLIV materials at loadingfrequency of 10 Hz.
Fig. 7 The relationships of constants c, d, e and f and loading frequency for the S.SBLIV materials.
A. Aghaei Araei and A. Ghodrati
34
5.2. DAMPING RELATIONSHIPS
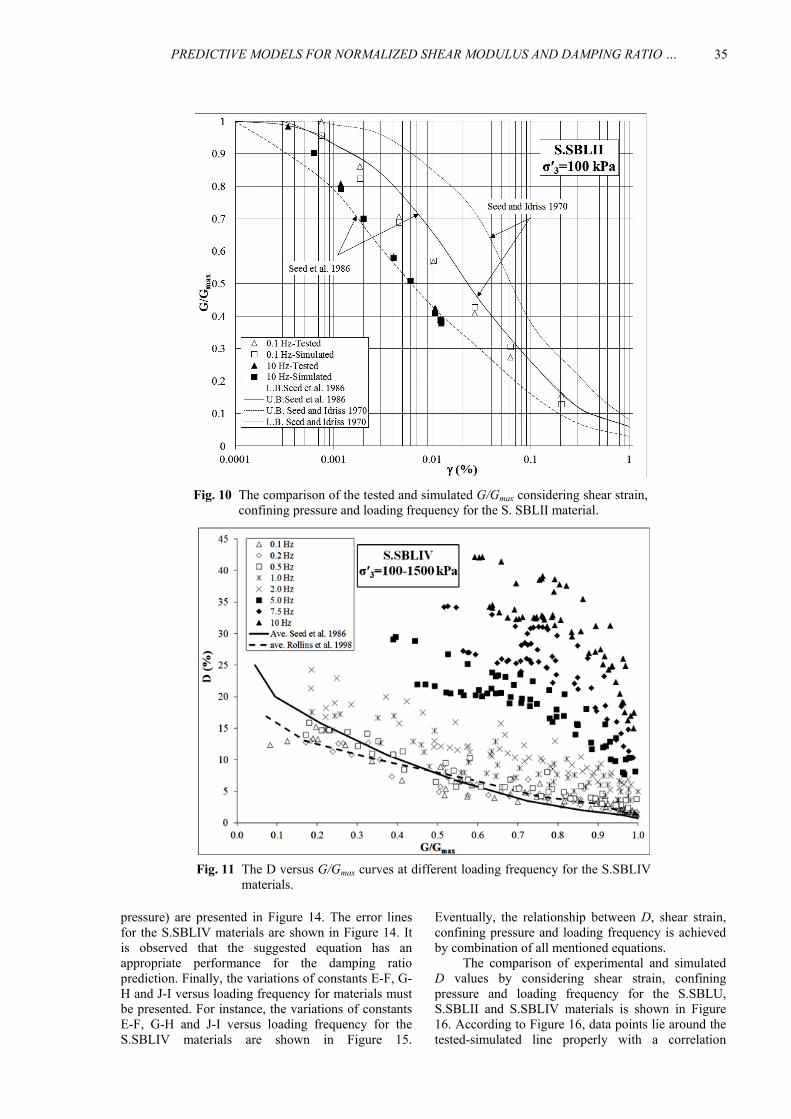
The D-γ curves obtained for gravelly materials inthis study and those suggested by Seed et al. (1986)and Rollins et al. (1998) are remarkably different,especially at loading frequencies of 2 to 10 Hz. Evenat small strain under loading frequency of 1 Hz, thereis little difference between the test results andliterature. For example, D versus G/Gmax curves forthe S.SBLIV materials at different loading frequencypresented in Figure 11. The average D-G/Gmax curvesproposed by Seed et al. (1986) and Rollins et al.(1986) for gravelly materials are also shown inFigure 11. The damping ratio increases by increasingthe loading frequency at a constant G/G0. In otherwords, G/G0 is increased for a given damping ratio.Moreover, the damping ratio is always positive(greater than zero) at studied loading frequencies. Theextreme reduction of the damping ratio values aroundG/G0=1 at higher loading frequencies is anotherinteresting point (see Fig. 11).
It is observed that when the results are presentedin D-G/Gmax form, the complex effects of confiningpressure are eliminated and the interpretation ofloading frequency effect could be facilitated. In thisstudy, models based on the nonlinear multipleregression method have been adopted for theprediction of D of the gravelly materials. For thispurpose, three equations were used. Firstly, therelationship between G/Gmax and D under differentconfining pressures and a loading frequency isassumed to have a quadratic form( 2
max max( / ) ( / )D A G G B G G C= + + ) (i.e. Fig. 12, for
S.SBLIV materials under loading frequency of10 Hz). The coefficients A, B and C are designated fordifferent materials at different frequencies. The G/G0
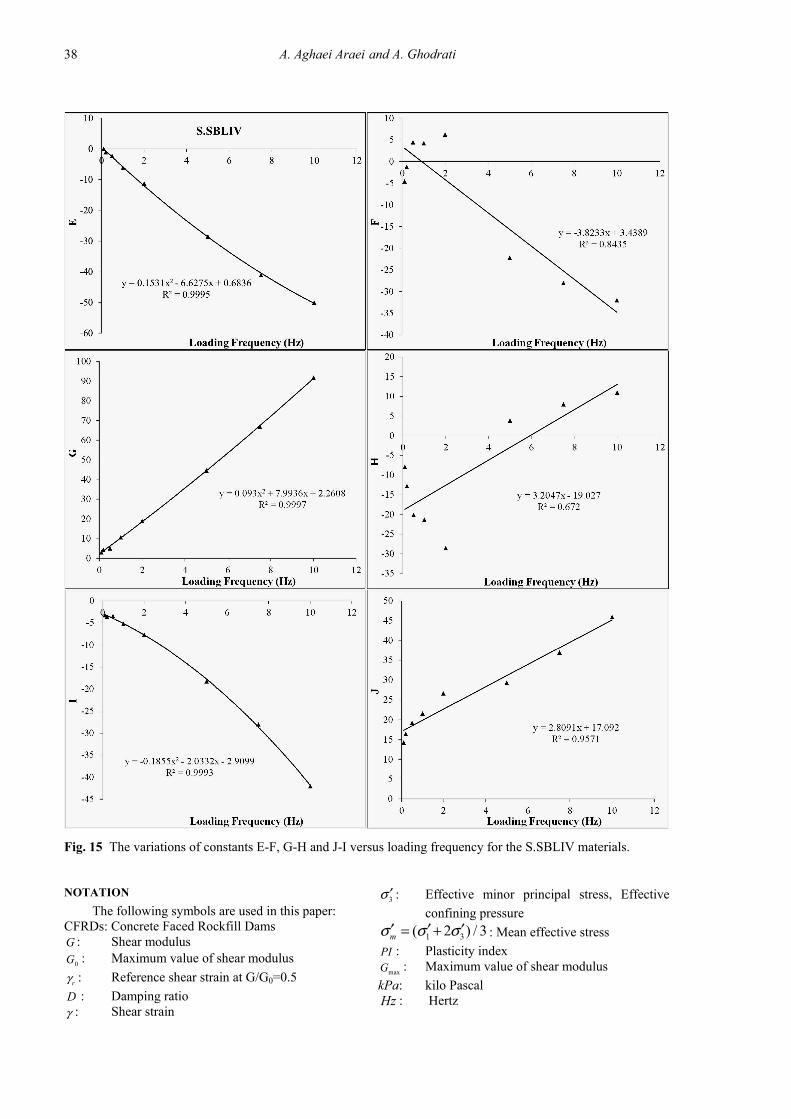
changing trend versus D at different confiningpressure is not clear as illustrated in Figure 12.However, the damping ratio decreases by increasingthe G/G0 in all confining pressures. The greatestdamping ratio value (approximately 42 percent) is alsoachieved at the lowest confining pressure. Then, therelationship between the coefficients A, B, C andconfining pressure is assumed in a logarithmic formwith pair of constants E-F, H-G and J-I, respectively(see Fig. 13 for S.SBLIV materials under the loadingfrequency of 10 Hz).
Constants including E-F, H-G and J-I underdifferent loading frequencies for coefficients A, B andC of S.SBU, S.SBLII and S. SBLIV materials arecalculated based on regression analysis. Finally, thefollowing regression equations are suggested forprediction of D values for the S.SBLIV materials:
23 3 3
3 3 3
3
( . ( ) )( . . ( ) . ( ) )( . ( ) )( . . ( ) . ( ) )( . ( ) )
d
dD E Ln f c Ln e Ln f
G Ln H c Ln e Ln fI Ln J
σ σ γ σσ σ γ σσ
′ ′ ′= + + + +′ ′ ′+ + + + +′+ +
(5)For example, the experimental data and
predicted values of D using Eq. (5), (includingparameters such as shear strain and confining
Fig. 9 The comparison of the tested and simulatedG/Gmax considering shear strain, confiningpressure and loading frequency and the linesof ±15 % error for the S.SBU, S.SBLII andS.SBLIV material.
confining pressure 6 kg/cm2 and loading frequency of1 and 10 Hz. It is observed that the results of theproposed equations are in a good agreement withthose obtained by the dynamic triaxial tests.
PREDICTIVE MODELS FOR NORMALIZED SHEAR MODULUS AND DAMPING RATIO … .
35
Fig. 11 The D versus G/Gmax curves at different loading frequency for the S.SBLIVmaterials.
Fig. 10 The comparison of the tested and simulated G/Gmax considering shear strain, confining pressure and loading frequency for the S. SBLII material.
Eventually, the relationship between D, shear strain,confining pressure and loading frequency is achievedby combination of all mentioned equations.
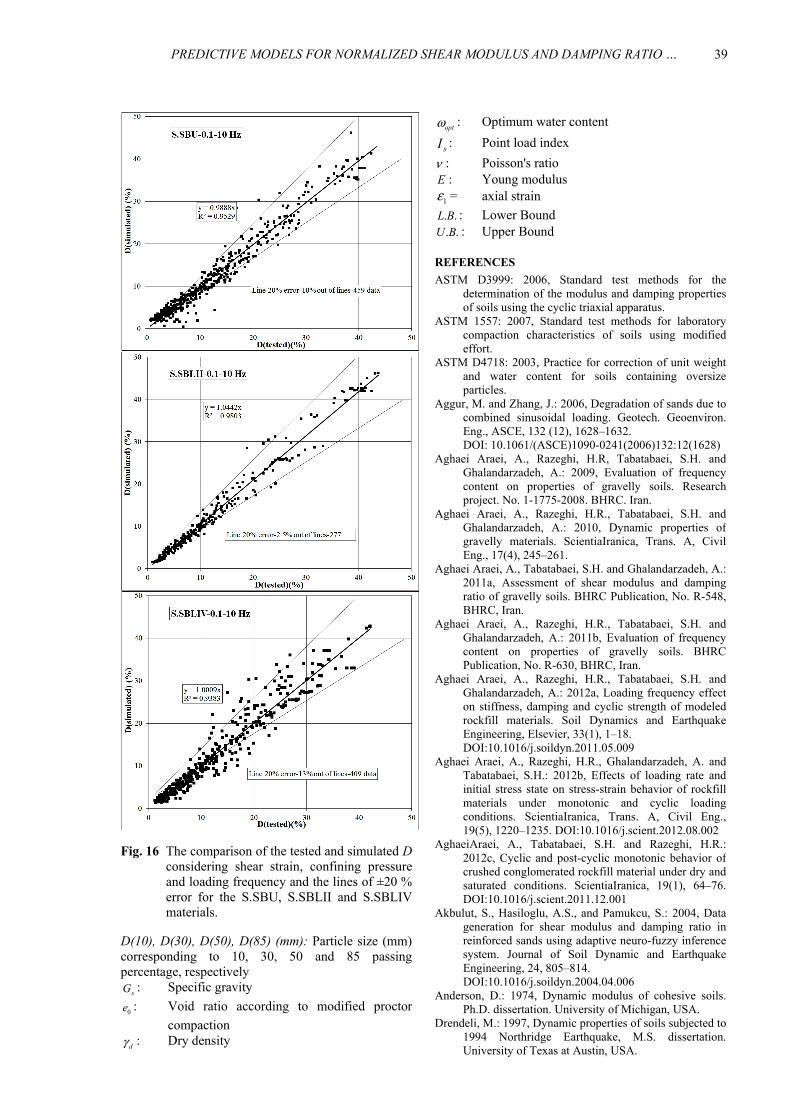
The comparison of experimental and simulatedD values by considering shear strain, confiningpressure and loading frequency for the S.SBLU,S.SBLII and S.SBLIV materials is shown in Figure16. According to Figure 16, data points lie around thetested-simulated line properly with a correlation
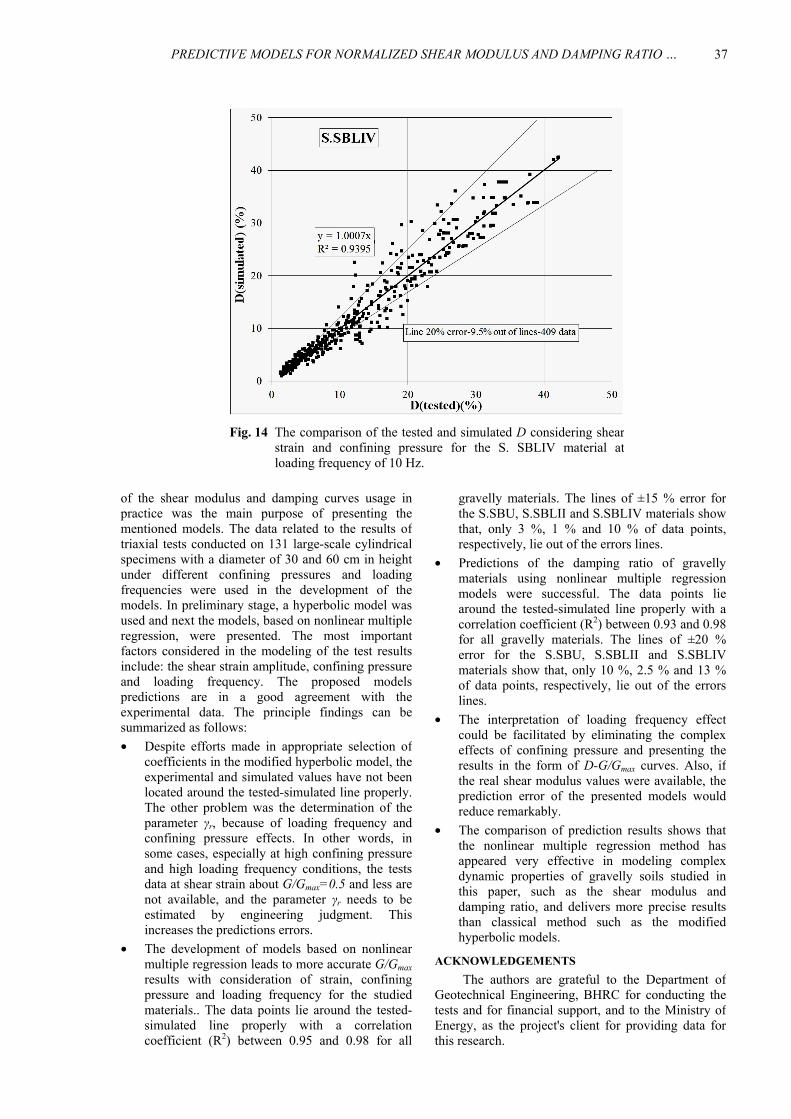
pressure) are presented in Figure 14. The error linesfor the S.SBLIV materials are shown in Figure 14. Itis observed that the suggested equation has anappropriate performance for the damping ratioprediction. Finally, the variations of constants E-F, G-H and J-I versus loading frequency for materials mustbe presented. For instance, the variations of constantsE-F, G-H and J-I versus loading frequency for theS.SBLIV materials are shown in Figure 15.

A. Aghaei Araei and A. Ghodrati
36
Fig. 12 The quadratic form of D for the S.SBLIV materials at loading frequency of10 Hz.
Fig. 13 The relationships of coefficients A, B, C and confining pressurefor the S.SBLIV materials at loading frequency of 10 Hz.
It should be noted that, part of the increase ofdamping ratio prediction error is related to the use ofshear modulus formula. It is obvious that, if the realshear modulus values were available, the predictionerror of the presented models would reduceremarkably.
6. SUMMARY AND CONCLUSIONS
This study presented predictive models toestimate the results of G/Gmax-γ and D behavior ofcompacted modeled rockfill materials. The facilitation
coefficient (R2) between 0.93 and 0.98 for all gravellymaterials. Therefore, it can be interpreted that thevalues of R2 fully reflect the complete agreementbetween simulated results and the measured D values.The lines of ±20 % error for materials S.SBU are alsoshown in Figure 16. It is observed that only 10 % ofdata points lies out of the errors lines. The mentionederror values for the S.SBLII and S.SBLIV materialsare 2.5 % and 13 %, respectively. Therefore, it isconcluded that the proposed relationship is suitablefor simulating the D values under different conditions.
PREDICTIVE MODELS FOR NORMALIZED SHEAR MODULUS AND DAMPING RATIO … .
37
Fig. 14 The comparison of the tested and simulated D considering shearstrain and confining pressure for the S. SBLIV material atloading frequency of 10 Hz.
gravelly materials. The lines of ±15 % error forthe S.SBU, S.SBLII and S.SBLIV materials showthat, only 3 %, 1 % and 10 % of data points,respectively, lie out of the errors lines.
• Predictions of the damping ratio of gravellymaterials using nonlinear multiple regressionmodels were successful. The data points liearound the tested-simulated line properly with acorrelation coefficient (R2) between 0.93 and 0.98for all gravelly materials. The lines of ±20 %error for the S.SBU, S.SBLII and S.SBLIVmaterials show that, only 10 %, 2.5 % and 13 %of data points, respectively, lie out of the errorslines.
• The interpretation of loading frequency effectcould be facilitated by eliminating the complexeffects of confining pressure and presenting theresults in the form of D-G/Gmax curves. Also, ifthe real shear modulus values were available, theprediction error of the presented models wouldreduce remarkably.
• The comparison of prediction results shows thatthe nonlinear multiple regression method hasappeared very effective in modeling complexdynamic properties of gravelly soils studied inthis paper, such as the shear modulus anddamping ratio, and delivers more precise resultsthan classical method such as the modifiedhyperbolic models.
ACKNOWLEDGEMENTS
The authors are grateful to the Department ofGeotechnical Engineering, BHRC for conducting thetests and for financial support, and to the Ministry ofEnergy, as the project's client for providing data forthis research.
of the shear modulus and damping curves usage inpractice was the main purpose of presenting thementioned models. The data related to the results oftriaxial tests conducted on 131 large-scale cylindricalspecimens with a diameter of 30 and 60 cm in heightunder different confining pressures and loadingfrequencies were used in the development of themodels. In preliminary stage, a hyperbolic model wasused and next the models, based on nonlinear multipleregression, were presented. The most importantfactors considered in the modeling of the test resultsinclude: the shear strain amplitude, confining pressureand loading frequency. The proposed modelspredictions are in a good agreement with theexperimental data. The principle findings can besummarized as follows:
• Despite efforts made in appropriate selection ofcoefficients in the modified hyperbolic model, theexperimental and simulated values have not beenlocated around the tested-simulated line properly.The other problem was the determination of theparameter γr, because of loading frequency andconfining pressure effects. In other words, insome cases, especially at high confining pressureand high loading frequency conditions, the testsdata at shear strain about G/Gmax=0.5 and less arenot available, and the parameter γr needs to beestimated by engineering judgment. Thisincreases the predictions errors.
• The development of models based on nonlinearmultiple regression leads to more accurate G/Gmax
results with consideration of strain, confiningpressure and loading frequency for the studiedmaterials.. The data points lie around the tested-simulated line properly with a correlationcoefficient (R2) between 0.95 and 0.98 for all
A. Aghaei Araei and A. Ghodrati
38
Fig. 15 The variations of constants E-F, G-H and J-I versus loading frequency for the S.SBLIV materials.
3σ ′ : Effective minor principal stress, Effective
confining pressure
1 3( 2 ) / 3mσ σ σ′ ′ ′= + : Mean effective stress
PI : Plasticity index
maxG : Maximum value of shear modulus
kPa: kilo Pascal Hz : Hertz
NOTATION
The following symbols are used in this paper: CFRDs: Concrete Faced Rockfill Dams G : Shear modulus
0G : Maximum value of shear modulus
rγ : Reference shear strain at G/G0=0.5
D : Damping ratio γ : Shear strain
PREDICTIVE MODELS FOR NORMALIZED SHEAR MODULUS AND DAMPING RATIO … .
39
optω : Optimum water content
sI : Point load index
ν : Poisson's ratio E : Young modulus
1ε = axial strain
. .L B : Lower Bound . .U B : Upper Bound
REFERENCES
ASTM D3999: 2006, Standard test methods for thedetermination of the modulus and damping propertiesof soils using the cyclic triaxial apparatus.
ASTM 1557: 2007, Standard test methods for laboratorycompaction characteristics of soils using modifiedeffort.
ASTM D4718: 2003, Practice for correction of unit weightand water content for soils containing oversizeparticles.
Aggur, M. and Zhang, J.: 2006, Degradation of sands due tocombined sinusoidal loading. Geotech. Geoenviron.Eng., ASCE, 132 (12), 1628–1632. DOI: 10.1061/(ASCE)1090-0241(2006)132:12(1628)
Aghaei Araei, A., Razeghi, H.R, Tabatabaei, S.H. andGhalandarzadeh, A.: 2009, Evaluation of frequencycontent on properties of gravelly soils. Researchproject. No. 1-1775-2008. BHRC. Iran.
Aghaei Araei, A., Razeghi, H.R., Tabatabaei, S.H. andGhalandarzadeh, A.: 2010, Dynamic properties ofgravelly materials. ScientiaIranica, Trans. A, CivilEng., 17(4), 245–261.
Aghaei Araei, A., Tabatabaei, S.H. and Ghalandarzadeh, A.:2011a, Assessment of shear modulus and dampingratio of gravelly soils. BHRC Publication, No. R-548,BHRC, Iran.
Aghaei Araei, A., Razeghi, H.R., Tabatabaei, S.H. andGhalandarzadeh, A.: 2011b, Evaluation of frequencycontent on properties of gravelly soils. BHRCPublication, No. R-630, BHRC, Iran.
Aghaei Araei, A., Razeghi, H.R., Tabatabaei, S.H. andGhalandarzadeh, A.: 2012a, Loading frequency effecton stiffness, damping and cyclic strength of modeledrockfill materials. Soil Dynamics and EarthquakeEngineering, Elsevier, 33(1), 1–18. DOI:10.1016/j.soildyn.2011.05.009
Aghaei Araei, A., Razeghi, H.R., Ghalandarzadeh, A. andTabatabaei, S.H.: 2012b, Effects of loading rate andinitial stress state on stress-strain behavior of rockfillmaterials under monotonic and cyclic loadingconditions. ScientiaIranica, Trans. A, Civil Eng.,19(5), 1220–1235. DOI:10.1016/j.scient.2012.08.002
AghaeiAraei, A., Tabatabaei, S.H. and Razeghi, H.R.:2012c, Cyclic and post-cyclic monotonic behavior ofcrushed conglomerated rockfill material under dry andsaturated conditions. ScientiaIranica, 19(1), 64–76.DOI:10.1016/j.scient.2011.12.001
Akbulut, S., Hasiloglu, A.S., and Pamukcu, S.: 2004, Datageneration for shear modulus and damping ratio inreinforced sands using adaptive neuro-fuzzy inferencesystem. Journal of Soil Dynamic and EarthquakeEngineering, 24, 805–814. DOI:10.1016/j.soildyn.2004.04.006
Anderson, D.: 1974, Dynamic modulus of cohesive soils.Ph.D. dissertation. University of Michigan, USA.
Drendeli, M.: 1997, Dynamic properties of soils subjected to1994 Northridge Earthquake, M.S. dissertation.University of Texas at Austin, USA.
Fig. 16 The comparison of the tested and simulated Dconsidering shear strain, confining pressureand loading frequency and the lines of ±20 %error for the S.SBU, S.SBLII and S.SBLIVmaterials.
D(10), D(30), D(50), D(85) (mm): Particle size (mm)corresponding to 10, 30, 50 and 85 passingpercentage, respectively
sG : Specific gravity
0e : Void ratio according to modified proctor
compaction
dγ : Dry density
A. Aghaei Araei and A. Ghodrati
40
Rollins, K.M., Evans, M.D., Diehl, N.B. and Daily, W.D.:1998, Shear modulus and damping relationships forgravels. Journal of Geotechnical and Geoenviron-mental Engineering, ASCE, 124(5), 398–405. DOI: 10.1061/(ASCE)1090-0241(1998)124:5(396)
Shenabel, P., Lysmer, J., and Seed, H.: 1972, SHAKE: Acomputer program for earthquake response analysis ofhorizontally layered site. Berkeley, University ofCalifornia, USA.
Seed, H.B., and Idriss, I.M.: 1970, Soil moduli and dampingfactors for dynamic response analysis. Report EERC,70-10, Berkeley, CA, USA: University of California.
Seed, H.B., Wong, R.T, Idriss, I.M. and Tokimatsu, K.:1986, Moduli and damping factors for dynamicanalysis of cohesionless soils. Journal of GeotechnicalEngineering, 112(11), 1016–1032. DOI: 10.1061/(ASCE)0733-9410(1986)112:11(1016)
Sitharam, T.G., GovindaRaju, L. and Murthy, B.R.S.: 2004,Evaluation of liquefaction potential and dynamicproperties of silty sand using cyclic triaxial testing.Geotechnical Testing Journal, 27, No. 5, Paper IDGTJ11894. DOI: 10.1520/GTJ11894
Stokoe, K., Drendeli, M., Gilbert, R., Meng, F.Y. and Choi,W.K.: 2004, Development of a new family ofnormalized modulus reduction and material dampingcurves. In: Proceedings of the NSF/PEERInternational Workshop on Uncertainties in NonlinearSoil Properties and their Impact on ModelingDynamic Soil Response, University of California atBerkeley, Berkeley, California, USA.
Sun, J., Golesorkhi, R. and Seed, H.: 1988, Dynamic moduliand damping ratios of cohesive soils. Report,UCB/EERC-88/15.University of California, Berkeley,USA.
Tatsuoka, F., Iwasaki, T. and Takagi, Y.: 1978, Hystereticdamping of sands under cyclic loading and its relationto shear modulus. Soils and Foundations, 18(2), 25–30. DOI: 10.3208/sandf1972.18.2_25
Teachavorasinskun, S., Thongchim, P. and Lukkunaprasit,P.: 2001, Shear modulus and damping ratio of a clayduring undrained cyclic loading. Géotechnique, 51(5),467–470. DOI: 10.1680/geot.51.5.467.39968
Vardanega, P.J. and Bolton, M.D.: 2013, Stiffness of claysand silts: Normalizing shear modulus and shear strain.Journal of Geotechnical and GeoenvironmentalEngineering, 139, 1575–1589. DOI: 10.1061/(ASCE)GT.1943-5606.0000887
Vucetic, M. and Dobry, R.: 1991, Effect of soil plasticity oncyclic response. J. Geotech. Eng., 117 (1), 89–107.DOI: 10.1061/(ASCE)0733-9410
Wilson, J.M.R.: 1988, A theoretical and experimentalinvestigation into the behaviour of soils. PhD thesis,University of Cambridge, UK.
Zhang, J., Andrus, R. and Juang, C.: 2005, Normalizedshear modulus and material damping ratiorelationships. J. Geotech. Geoenviron. Eng., ASCE,131, 453–464. DOI: 10.1016/j.sandf.2013.10.007
Drendeli, M.: 2001, Development of a new family ofnormalized modulus reduction and material dampingcurves. Ph.D. dissertation, University of Texas atAustin, USA.
Hardcastle, J.H. and Sharma, S.: 1998, Shear modulus anddamping of unsaturated loess. GeotechnicalEarthquake Engineering and Soil Dynamics III, ASCEGeotechnical Special Publication 75, 178–188.
Hardin, B. and Drenvich, V.: 1972a, Shear modulus anddamping in soils: Measurement and parameter effects.J. Soil Mech. Found., ASCE, 18 (SM6), 603–642.
Hardin, B. and Drenvich, V.: 1972b, Shear modulus anddamping in soils: Design equations and curves. J. SoilMech. Found., ASCE, 98 (SM7), 667–692.
Hudson, M., Idriss, I., and Beikae, M.: 1994, User’s manualfor QUAD4M: a computer program to evaluate theseismic response of soil structures using finite elementprocedures and incorporating a compliant base.University of California, Davis, USA.
Idriss, I., Lysmer, J., Hwang, R., and Seed, H.: 1973,QUAD4: A computer program for evaluating theseismic response of soil structures by variabledamping finite element procedures. EERC Report, 73–16. University of California, Berkeley, USA.
Idriss, I.M., Dobry, R. and Singh, R.D.: 1978, Nonlinearbehavior of soft clays during cyclic loading. Journal ofthe Geotechnical Engineering Division, ASCE,104(12), 1427–1447.
Ishihara, K.G.: 1996, Soil behavior in earthquakeengineering. Oxford, Clarendon Press.
Iwasaki, T. and Tatsuoka, F.: 1977, Effects of grain size andgrading on dynamic shear moduli of sands. Soils andFoundations, 17, No. 3, 19–35.
Jafarian, Y., Haddad, A. and Javadian, H.: 2014, Predictivemodel for normalized shear modulus of cohesive soils,Acta Geodyn. Geomater., 11, No. 1 (173), 89–100.DOI: 10.13168/AGG.2013.0057
Khouri, N.: 1984, Dynamic properties of soils. M.S.dissertation. Department of Civil Engineering,Syracuse University.
Kokusho, T.: 1980, Cyclic triaxial test of dynamic s range.Soils and Foundations, 20(2), 45–60.
Kokusho, T., Yoshida, Y. and Esashi, Y.: 1982, Dynamicproperties of soft clay for wide strain range. Soils andFoundations, 22(4), 1–18.
Meng, F.Y.: 2003, Dynamic properties of sandy andgravelly soils. Ph.D. dissertation, University of Texas,Austin, USA.
Mohtar, C.S.E., Denevich, V.P., Santagata, M. and Bobet,A.: 2013, Combined resonant column and cyclictriaxial tests for measuring undrained shear modulusreduction of sand with plastic fines. GeotechnicalTesting Journal, ASTM, 36(4), 1–9. DOI: 10.1520/GTJ20120129
Okur, D. and Ansal, A.: 2007, Stiffness degradation ofnatural fine grained soils during cyclic loading. SoilDyn. Earthquake Eng., 27, 843–854. DOI:10.1016/j.soildyn.2007.01.005