Predictive Maintenance with MATLAB · Pump Health Monitoring System Spectral analysis and filtering...
71
1 © 2015 The MathWorks, Inc. Predictive Maintenance with MATLAB Amit Doshi, Senior Application Engineer – Data Analytics MathWorks India [email protected]
Transcript of Predictive Maintenance with MATLAB · Pump Health Monitoring System Spectral analysis and filtering...

1© 2015 The MathWorks, Inc.
Predictive Maintenance with
MATLAB
Amit Doshi,
Senior Application Engineer – Data Analytics
MathWorks India

3
Agenda:
1. What is Predictive Maintenance? Who is benefiting by doing it?
2. How can you develop a predictive maintenance algorithm using MATLAB?
3. How can you get started quickly?
4
Predictive maintenance
Preventive maintenance
Reactive maintenance
Types of maintenance

5
Time
Machine
health
Reactive maintenance
xFailure

6
Time
Machine
health
Reactive maintenance
xFailure
Aircraft
engine

7
Time
Machine
health
Reactive maintenance
Preventive maintenance
Time
Machine
health
xFailure
?
?

8
Time
Machine
health
Reactive maintenance
xFailure
Preventive maintenance
Time
Machine
health
x Still usable
condition

9
Time
Machine
health
Reactive maintenance
xFailure
Preventive maintenance
Time
Machine
health
x Still usable
condition
Predictive maintenance
Time
Machine
health
xnow
Predicted
failure
Optimum time to
do maintenance

10
Condition
Monitoring
Remaining
Useful Life
Estimation
A Predictive Maintenance Algorithm Answers
These Questions
Why is my
machine behaving
abnormally?
How much longer
can I operate my
machine ?
Anomaly
Detection
Is my machine
operating
normally?
For example:
I need help.
One of my cylinders is blocked.
I will shut down your line in 15 hours.

11
Predictive Maintenance Success Stories
Online engine health monitoring
▪ Real-time analytics integrated with enterprise
service systems
▪ Predict sub-system performance (oil, fuel,
liftoff, mechanical health, controls
Pump Health Monitoring System
▪ Spectral analysis and filtering on binary sensor data
and neural network model prediction
▪ More than $10 million projected savings
Production machinery failure warning
▪ Reduce waste and machine downtime
▪ MATLAB based HMI warns operators of
potential failures
▪ > 200,000 € savings per year

12
Link to user story

13
Transocean uses MATLAB tools to transition from preventative
maintenance to CPM* for a critical deep sea drilling component*Condition and Performance Monitoring
Challenges
• Minimize unplanned downtime of the component
• Use as-close-to-real-time data for CPM
• Deploy CPM solution to components in other locations
Solution
▪ Monitoring data from the drill is collected in a PI archive. MATLAB is used
to create an app that takes in the data, preprocesses the data, and
generates a quality indicator.
▪ The app is deployed onto MATLAB Production Server for real-time use;
results are stored back on the PI archive.
Results
Able to move to CPM for their component(s) with improved decision-making
capabilities through faster access to data and quicker analytics deployment.
Interfacing directly with data in PI gives you increased
performance at the cost of having to write/deal with
low-level code (“getting under the hood”). It was noted
that using MATLAB parallel tools (which entails a
higher-level interface) was not only easier but also it
provided “hands-down” faster performance than
interfacing with PI directly.
Link to Expo Talk
Drilling data is stored in an OSISoft PI Archive. MATLAB
Production Server is used in the application specific
processing

14
Condition
Monitoring
Remaining
Useful Life
Estimation
Predictive Maintenance Toolbox for Developing Algorithms
Why is my
machine behaving
abnormally?
How much longer
can I operate my
machine ?
Anomaly
Detection
Is my machine
operating
normally?

15
Workflow for Developing a Predictive Maintenance Algorithm
Acquire
Data
Preprocess
Data
Identify
FeaturesTrain
Model
Deploy &
Integrate
Machine Learning

16
Agenda:
1. What is Predictive Maintenance? Who is benefiting by doing it?
2. How can you develop a predictive maintenance algorithm using MATLAB?
3. How can you get started quickly?

17
Condition
Monitoring
Remaining
Useful Life
Estimation
Develop Predictive Maintenance Algorithm: Use cases
Why is my
machine behaving
abnormally?
How much longer
can I operate my
machine ?
Anomaly
Detection
Is my machine
operating
normally?

18
Condition
Monitoring
Develop Predictive Maintenance Algorithm for -
Why is my
machine behaving
abnormally?
Predictive
maintenance
algorithm
Identify
fault type
Determine what
needs to be fixed
Condition indicators
Use case 1: Fault Classification
19
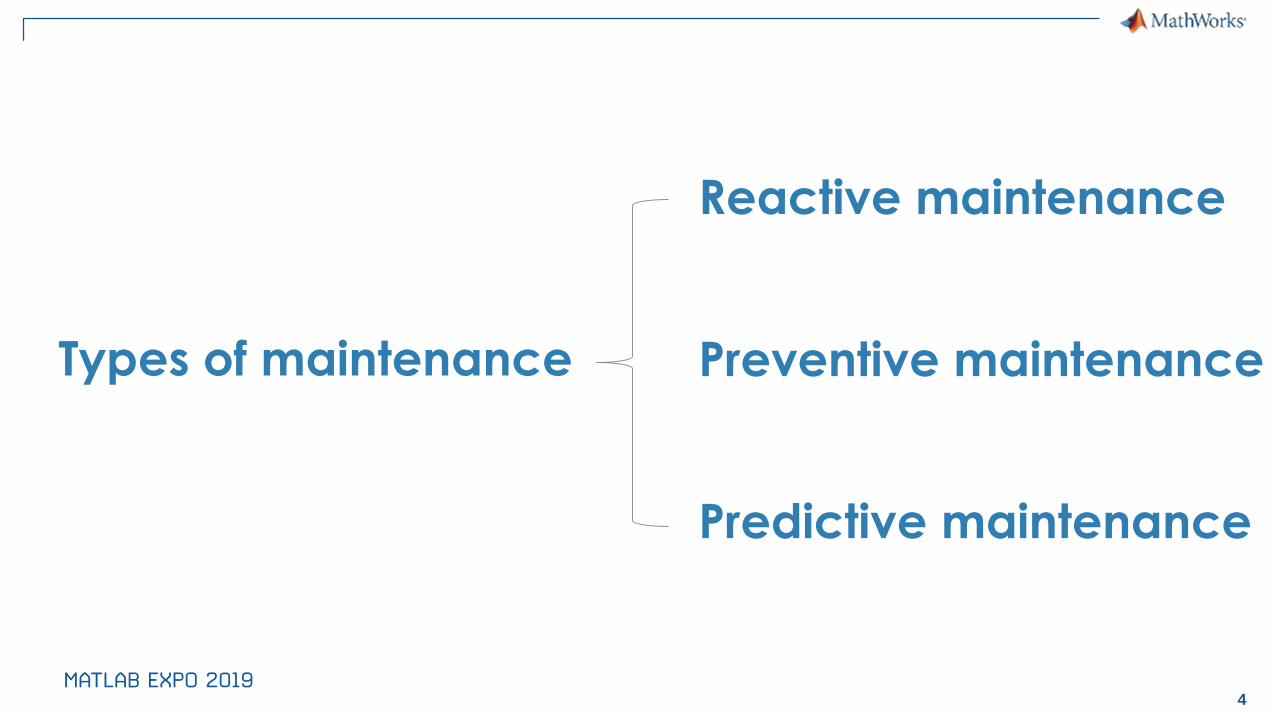
Remaining
Useful Life
Estimation
Develop Predictive Maintenance Algorithm for -
Use case 2: Remaining useful life
How much longer
can I operate my
machine ?
Estimate
remaining useful life
Time
Machine
health
Current
condition
Remaining useful life
xx x
x
Predictive
maintenance
algorithm
Condition indicators

20

21
Time
Sensor data
Predictive Maintenance Algorithm
Preprocess
Data
Identify
ConditionIndicators
Train
Model
Deploy &
Integrate
Triplex pump
Temperature
Pressure
Flow
Collect data using sensorshealthy
+faulty
*For simplification purposes, healthy and faulty
operation are represented by single
measurements. In a realistic scenario, there
may be hundreds of measurements for bothtypes of operations.
Acquire Data
Sensor Data
Generated
Data

22
AcquireData
Predictive Maintenance Algorithm
Preprocess
Data
Identify
ConditionIndicators
Train
Model
Deploy &
Integrate
Triplex pump
Temperature
Pressure
Flow
Collect data using sensorshealthy
+faulty
Time
Sensor data
*Quality data->Robust Algorithms

23
AcquireData
Predictive Maintenance Algorithm
Preprocess
Data
Identify
ConditionIndicators
Train
Model
Deploy &
Integrate
Triplex pump
Temperature
Pressure
Flow
Collect data using sensorshealthy
+faulty
Time
Sensor data

24
Time
Sensor data
AcquireData
Predictive Maintenance Algorithm
Preprocess
Data
Identify
ConditionIndicators
Train
Model
Deploy &
Integrate
Triplex pump
Temperature
Pressure
Flow
Collect data using sensorshealthy
+faulty
Operating temperature: 30°F
Fluid viscosity: Low
Operating temperature: 90°F
Fluid viscosity: High
25
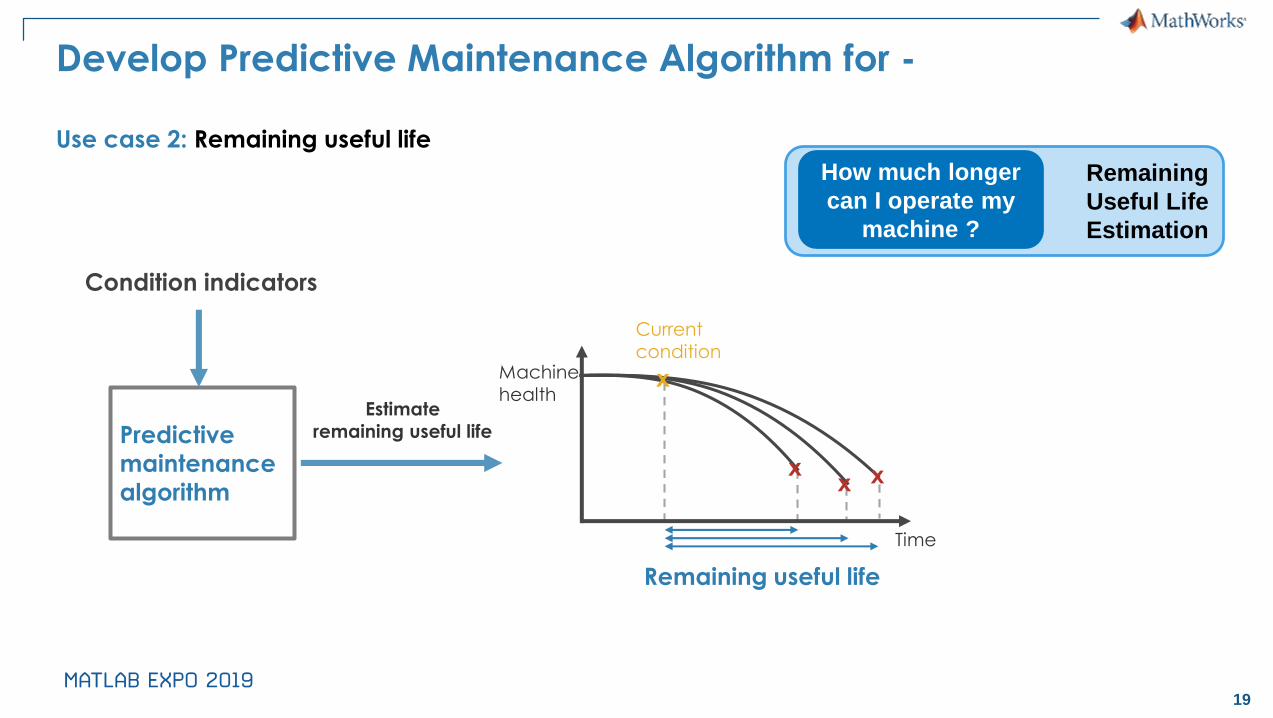
AcquireData
Predictive Maintenance Algorithm
Preprocess
Data
Identify
ConditionIndicators
Train
Model
Deploy &
Integrate
Triplex pumpTime
Sensor data
What if real failure data is not available?

26
Time
Sensor data
AcquireData
Predictive Maintenance Algorithm
Preprocess
Data
Identify
ConditionIndicators
Train
Model
Deploy &
Integrate
Triplex pumpTime
Sensor data
Inject faults1Seal leakage2Blocked inlet3Worn bearing Mathematical model
of the triplex pump
(Digital Twin)
Refine model
1
2
3
Time
Synthetic data

27
240 measurements of
flow and pressure with a
duration of 1.2 seconds
Flow Pressure
Health condition (fault code)
• Healthy (0)
• Blocked inlet (010)
• Worn bearing (001)
• Seal Leakage (100)
• Blocked inlet, worn bearing (011)
• Seal leakage, worn bearing (101)
• Seal leakage, blocked inlet (110)
• Seal leakage, blocked inlet, worn bearing (111)
Learn further: Data Ensembles

28
Predictive Maintenance Algorithm
Preprocess
Data
Identify
ConditionIndicators
Train
Model
Deploy &
Integrate
Acquire Data
Sensor Data
Generated
Data
Challenges
▪ Data clean up
– Poorly formatted files
– Irregularly sampled data
– Redundant data, outliers, missing data etc.
▪ Data specific processing
– Signals: Smoothing, resampling, denoising, Wavelet transforms, etc.
– Images: Image registration, morphological filtering, deblurring, etc.
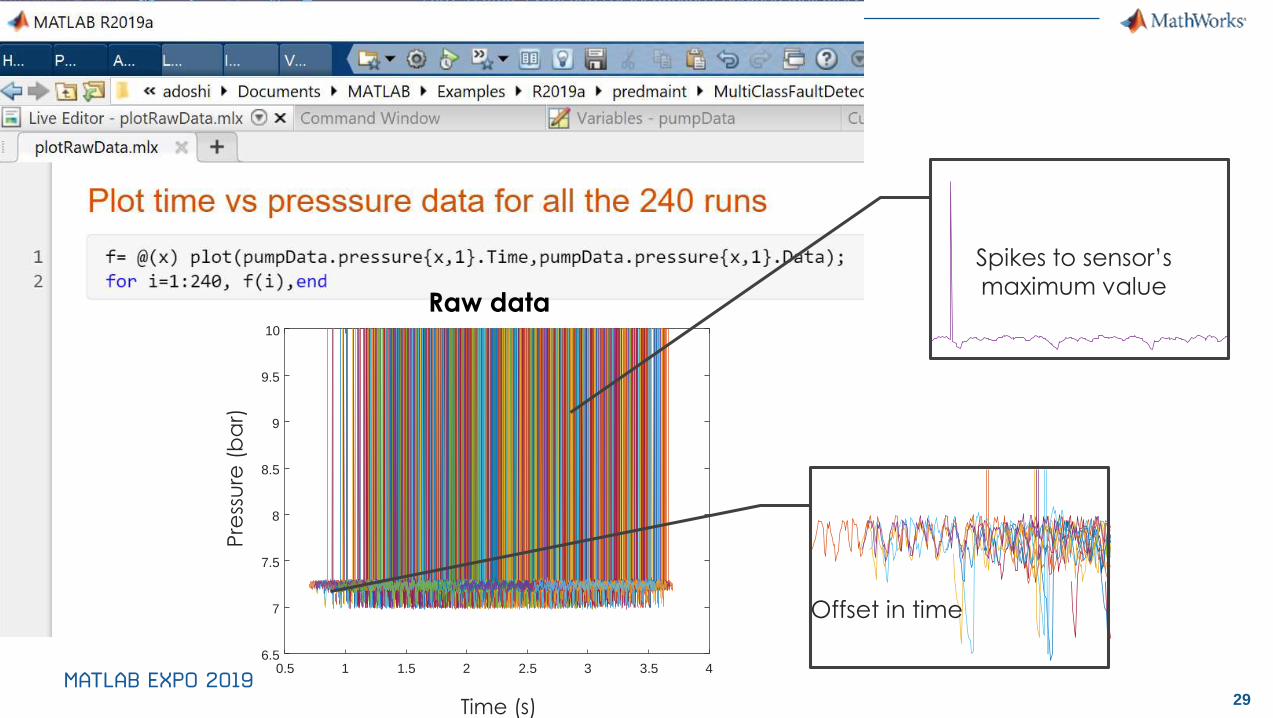
29
0.5 1 1.5 2 2.5 3 3.5 4
Time (s)
6.5
7
7.5
8
8.5
9
9.5
10
Raw data
Pre
ssu
re (
ba
r)Spikes to sensor’s
maximum value
Offset in time

30

31
0.5 1 1.5 2 2.5 3 3.5 4
Time (s)
6.5
7
7.5
8
8.5
9
9.5
10
Raw data
Pre
ssu
re (
ba
r)
Time (s)
Preprocessed data
Pre
ssu
re (
ba
r)
0 0.2 0.4 0.6 0.8 1 1.26.95
7
7.05
7.1
7.15
7.2
7.25
7.3
7.35

32
Predictive Maintenance Algorithm
Preprocess
Data
Identify
ConditionIndicators
Train
Model
Deploy &
Integrate
Acquire Data
Sensor Data
Generated
Data
• What are Condition Indicators?
• Why are they important?
• How to identify significant ones?

33
Identify condition indicators
Time
Condition indicator
Time
Raw data
Healthy
operation
Faulty operation
Healthy
operation
Faulty operation
A condition indicator can be any feature that is useful -
• for distinguishing normal from faulty operation or
• for predicting remaining useful life

34
Signal-Based Condition Indicators
Time-domainfeatures
Frequency-domainfeatures
Time-frequencydomain features
Mean
Standard deviation
Skewness
Root-mean square
. . .
Kurtosis

35
0.62 0.63 0.64 0.65 0.66 0.67 0.68 0.69 0.7 0.71 0.72
7
7.05
7.1
7.15
7.2
7.25
7.3
0.62 0.63 0.64 0.65 0.66 0.67 0.68 0.69 0.7 0.71 0.72
7
7.05
7.1
7.15
7.2
7.25
7.3
0.62 0.63 0.64 0.65 0.66 0.67 0.68 0.69 0.7 0.71 0.72
7
7.05
7.1
7.15
7.2
7.25
7.3
0.62 0.63 0.64 0.65 0.66 0.67 0.68 0.69 0.7 0.71 0.72
7
7.05
7.1
7.15
7.2
7.25
7.3
0.62 0.63 0.64 0.65 0.66 0.67 0.68 0.69 0.7 0.71 0.72
7
7.05
7.1
7.15
7.2
7.25
7.3
0.62 0.63 0.64 0.65 0.66 0.67 0.68 0.69 0.7 0.71 0.72
7
7.05
7.1
7.15
7.2
7.25
7.3
Blocked Inlet
Blocked Inlet, Worn Bearing
Seal Leakage Seal Leakage, Blocked Inlet
Seal Leakage, Worn Bearing
Worn Bearing
Pre
ssu
re (
ba
r)P
ress
ure
(b
ar)
Pre
ssu
re (
ba
r)
Pre
ssu
re (
ba
r)P
ress
ure
(b
ar)
Pre
ssu
re (
ba
r)Time (s) Time (s)
0.62 0.63 0.64 0.65 0.66 0.67 0.68 0.69 0.7 0.71 0.72
7
7.05
7.1
7.15
7.2
7.25
7.3
0.62 0.63 0.64 0.65 0.66 0.67 0.68 0.69 0.7 0.71 0.72
7
7.05
7.1
7.15
7.2
7.25
7.3
0.62 0.63 0.64 0.65 0.66 0.67 0.68 0.69 0.7 0.71 0.72
7
7.05
7.1
7.15
7.2
7.25
7.3
0.62 0.63 0.64 0.65 0.66 0.67 0.68 0.69 0.7 0.71 0.72
7
7.05
7.1
7.15
7.2
7.25
7.3
0.62 0.63 0.64 0.65 0.66 0.67 0.68 0.69 0.7 0.71 0.72
7
7.05
7.1
7.15
7.2
7.25
7.3
0.62 0.63 0.64 0.65 0.66 0.67 0.68 0.69 0.7 0.71 0.72
7
7.05
7.1
7.15
7.2
7.25
7.3
Blocked Inlet
Blocked Inlet, Worn Bearing
Seal Leakage Seal Leakage, Blocked Inlet
Seal Leakage, Worn Bearing
Worn Bearing
Pre
ssu
re (
ba
r)P
ress
ure
(b
ar)
Pre
ssu
re (
ba
r)
Pre
ssu
re (
ba
r)P
ress
ure
(b
ar)
Pre
ssu
re (
ba
r)Time (s) Time (s)
Healthy
Faulty
Increasing
fault severity

36
0.62 0.63 0.64 0.65 0.66 0.67 0.68 0.69 0.7 0.71 0.72
7
7.05
7.1
7.15
7.2
7.25
7.3
Blocked Inlet
Pre
ssu
re (
ba
r)
0.62 0.63 0.64 0.65 0.66 0.67 0.68 0.69 0.7 0.71 0.72
7
7.05
7.1
7.15
7.2
7.25
7.3
Blocked Inlet
Pre
ssu
re (
ba
r)
Blocked Inlet Healthy
7.225
7.23
7.235
7.24
7.245
7.25
MEAN
No overlap
Median
25th percentile
75th percentile
Minimum
Maximum
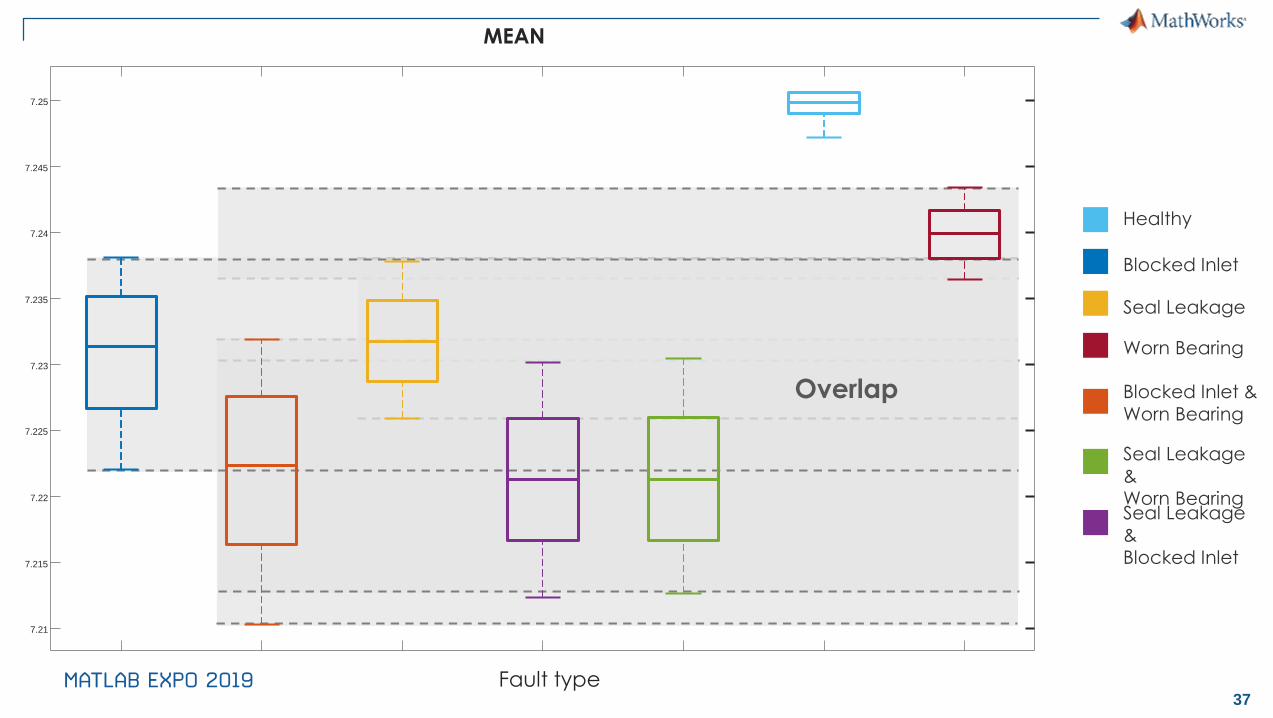
37
7.21
7.215
7.22
7.225
7.23
7.235
7.24
7.245
7.25
MEAN
Healthy
Blocked Inlet
Seal Leakage
Worn Bearing
Blocked Inlet &
Worn Bearing
Seal Leakage
&
Worn BearingSeal Leakage
&
Blocked Inlet
Fault type
Overlap

38
MEAN VARIANCE
KURTOSIS
Healthy
Blocked Inlet
Seal
LeakageWorn Bearing
Blocked Inlet &
Worn Bearing
Seal Leakage
&
Worn BearingSeal Leakage
&
Blocked Inlet
7.21
7.215
7.22
7.225
7.23
7.235
7.24
7.245
7.25
SKEWNESS
-2
-1.8
-1.6
-1.4
-1.2
-1
-0.8
-0.6
-0.4
-0.2
0
1
2
3
4
5
6
10-3
2
3
4
5
6
7
Fault type Fault type
Fault type Fault type
Outlier
Outlier

39
Healthy
Blocked Inlet
Seal Leakage
Worn Bearing
Blocked Inlet, Worn Bearing
Seal Leakage, Worn Bearing
Seal Leakage, Blocked Inlet
Mean
Va
ria
nc
e

41
Signal-Based Condition Indicators
Time-domainfeatures
Frequency-domainfeatures
Time-frequencydomain features
Mean
Standard deviation
Skewness
Root-mean square
. . .
Kurtosis
Learn more about Condition Indicators

42
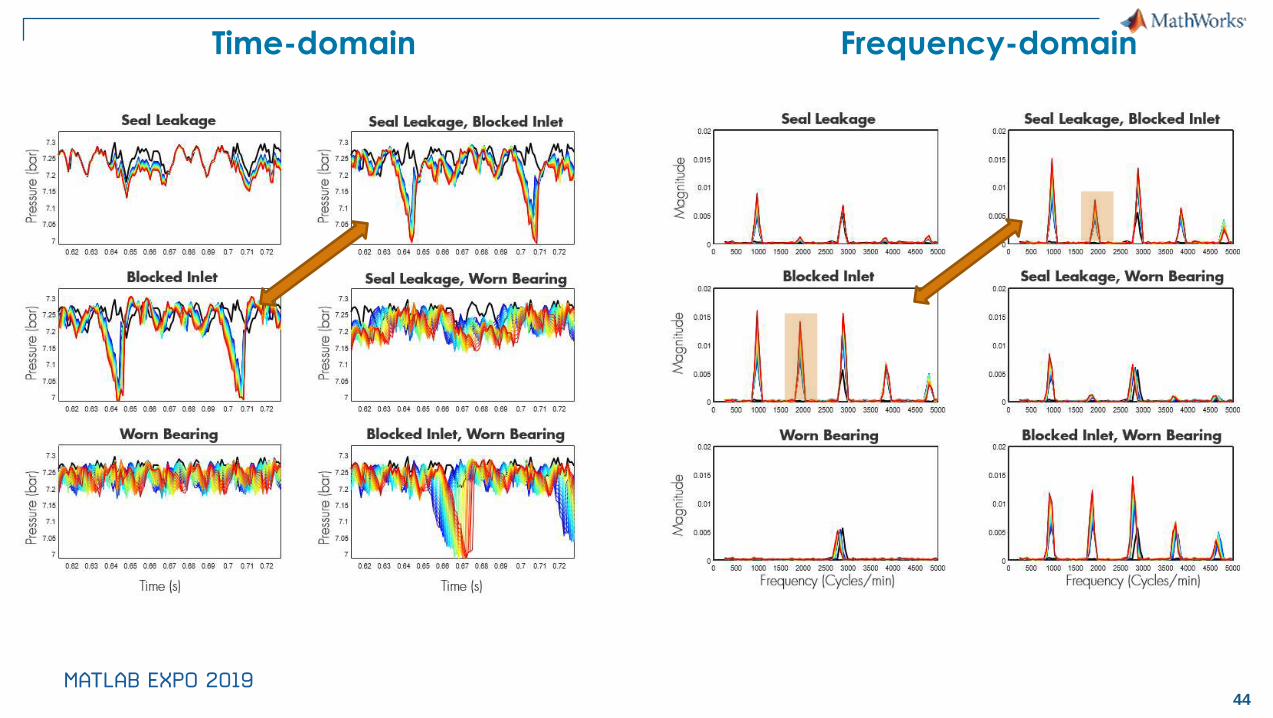
Three different
vibration sources:
- Bearing
- Motor shaft
- Disc
• In time-domain, we observe
the combined effect of
different sources of vibration.
DiscBearing Motor
shaft
DiscBearing
Motor
shaft
Machine with rotating
components
Time
Am
plit
ud
eA
mp
litu
de
Frequency
• Using frequency-domain
analysis, we can
distinguish different
sources of vibration.
NominalFaulty
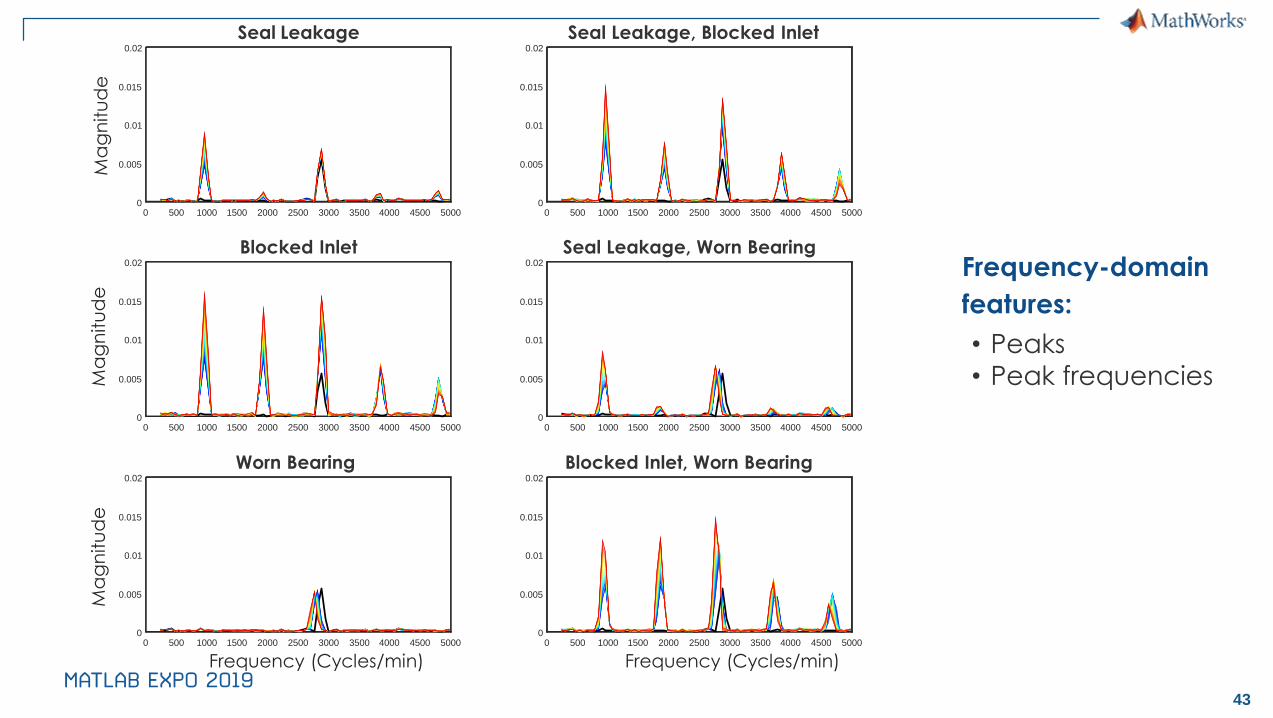
43
Frequency-domain
features:
• Peaks
• Peak frequencies
0 500 1000 1500 2000 2500 3000 3500 4000 4500 50000
0.005
0.01
0.015
0.02
Blocked Inlet
0 500 1000 1500 2000 2500 3000 3500 4000 4500 5000
Frequency (Cycles/min)
0
0.005
0.01
0.015
0.02
Blocked Inlet, Worn Bearing
0 500 1000 1500 2000 2500 3000 3500 4000 4500 50000
0.005
0.01
0.015
0.02
Seal Leakage
0 500 1000 1500 2000 2500 3000 3500 4000 4500 50000
0.005
0.01
0.015
0.02
Seal Leakage, Blocked Inlet
0 500 1000 1500 2000 2500 3000 3500 4000 4500 50000
0.005
0.01
0.015
0.02
Seal Leakage, Worn Bearing
0 500 1000 1500 2000 2500 3000 3500 4000 4500 5000
Frequency (Cycles/min)
0
0.005
0.01
0.015
0.02
Worn Bearing
Ma
gn
itu
de
Ma
gn
itu
de
Ma
gn
itu
de
44
Time-domain Frequency-domain

46
Signal-Based Condition Indicators
Time-domainfeatures
Frequency-domainfeatures
Time-frequencydomain features
Power bandwidth
Peak values
Peak frequencies
Mean frequency
Spectral entropy
Spectral kurtosis
Harmonics. . .
. . .
Mean
Standard deviation
Skewness
Root-mean square
. . .
Kurtosis
Learn more about Condition Indicators

47
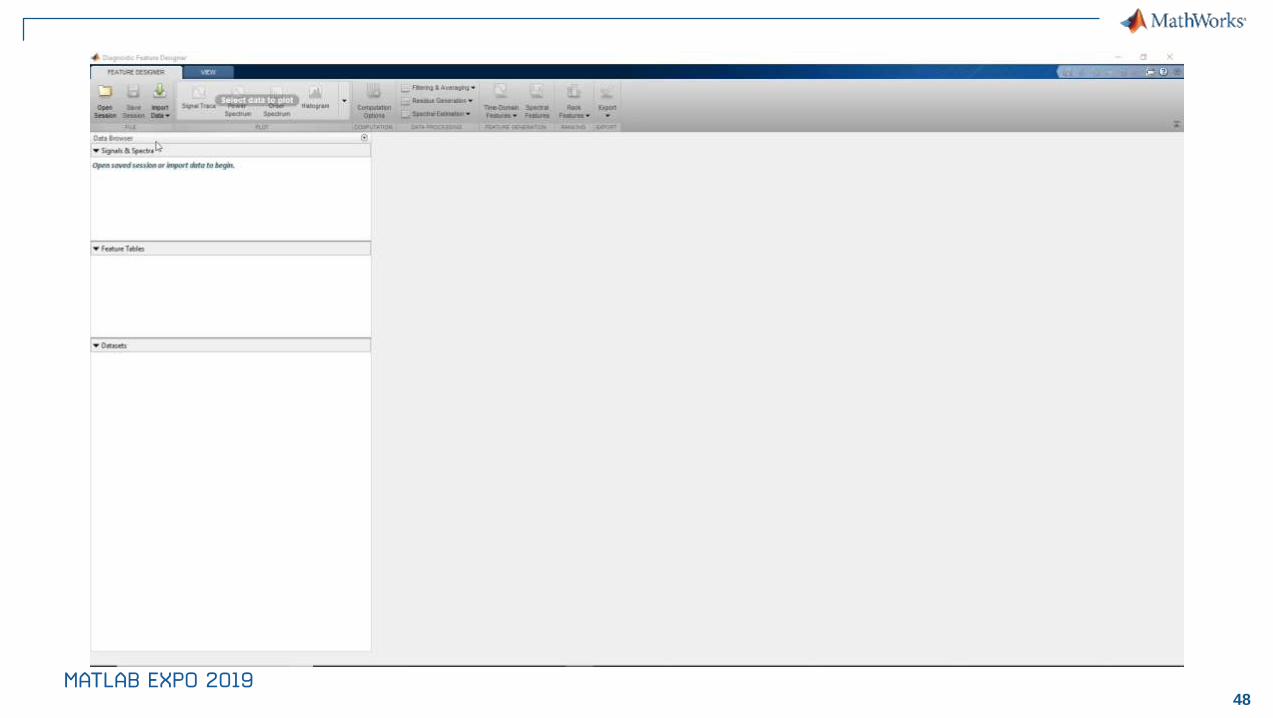
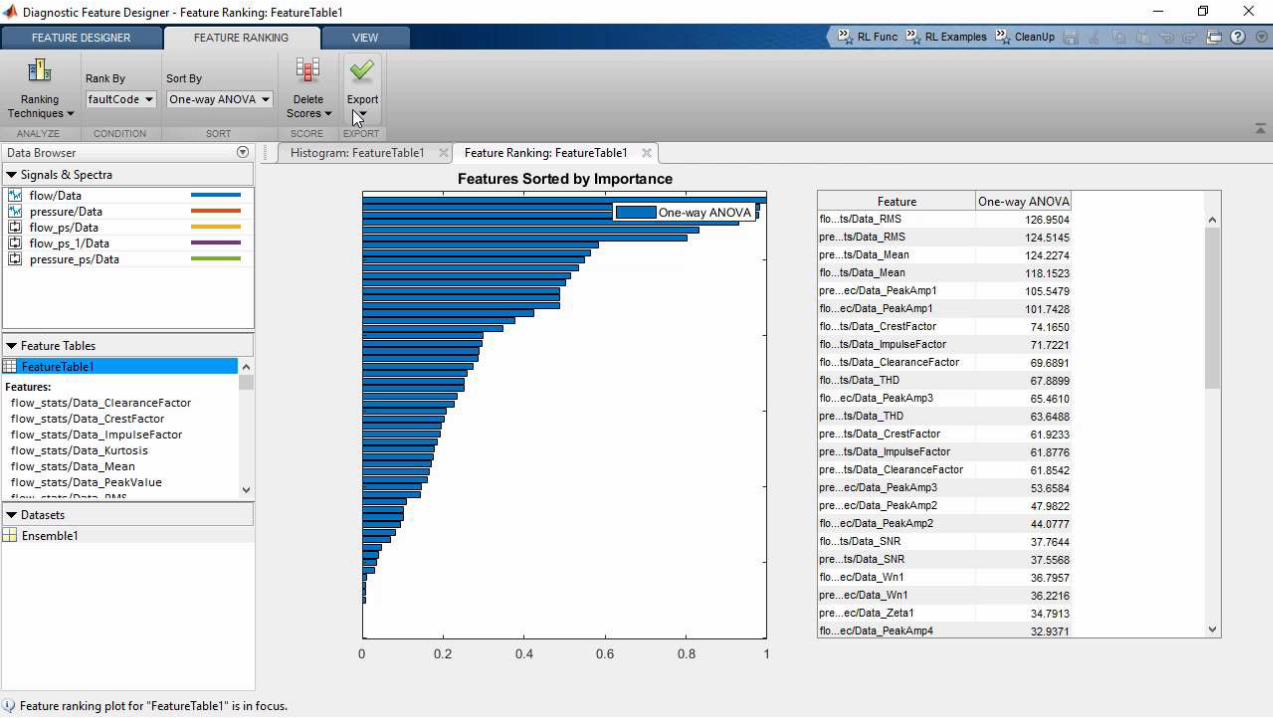
Diagnostic Feature Designer AppPredictive Maintenance Toolbox R2019a
▪ Extract, visualize, and rank
features from sensor data
▪ Use both statistical and
dynamic modeling methods
▪ Work with out-of-memory data
▪ Explore and discover
techniques without writing
MATLAB code
48

49
Predictive Maintenance Algorithm
Preprocess
Data
Identify
ConditionIndicators
Train
Model
Deploy &
Integrate
Acquire Data
Sensor Data
Generated
Data

50
MODEL
PREDICTION
Machine Learning Workflow
Train: Iterate till you find the best model using historical data
Predict: Integrate trained models into applications
MODELSUPERVISED
LEARNING
CLASSIFICATION
REGRESSION
PREPROCESS
DATA
SUMMARY
STATISTICS
PCAFILTERS
CLUSTER
ANALYSIS
HISTORICAL
DATA
PREPROCESS
DATA
SUMMARY
STATISTICS
PCAFILTERS
CLUSTER
ANALYSIS
NEW
DATA
Machine learning uses data and produces a program to perform a task

51
Machine
Learning
Supervised
Learning
Classification
Regression
Unsupervised
Learning
Group and interpretdata based only
on input data
Develop predictivemodel based on bothinput and output data
Type of Learning Categories of Algorithms
Condition
Indicator
Machine Learning: Types
Regression

52
53
Video showing App in action

54
Summary: Develop Predictive Maintenance Algorithm:
Use case 1: Fault Classification
Classification Learner App
Diagnostic Feature
Designer

55
Remaining
Useful Life
Estimation
Develop Predictive Maintenance Algorithm: Use case 2
How much longer
can I operate my
machine ?
Estimate
remaining useful life
Time
Machine
health
Current
condition
Remaining useful life
xx x
x
Predictive
maintenance
algorithm
Condition indicators

56
Time
Machine deterioration
profile
Remaining useful life (RUL)
Current condition
Failure condition
[ Number of days ]
[ Miles ]
[ Cycles ]
…
Co
nd
itio
n in
dic
ato
r
What is RUL?

57
Healthy state Failure
RUL Estimator Models
Similarity model Degradation model
Survival model
Safetythreshold
Healthy state Failure
Healthy state Failure

58
RUL Methods and when to use themRequirement: Need to know what constitutes failure data

59

60
Acquire
Data
Predictive Maintenance Algorithm
Preprocess
Data
Identify
ConditionIndicators
Train
ModelDeploy &Integrate
Edge deviceCloud

61
Deploy & Integrate analytics using MATLAB:
MATLAB
Runtime
C, C++ HDL PLC
Embedded Hardware
C/C++ ++ExcelAdd-in Java
Hadoop/
Spark.NET
MATLABProduction
Server
StandaloneApplication
Enterprise Systems
Python

62
Feature Extraction Algorithm at the Edge
Asset w. smart
sensors
▪ 1 day ~ 1.3 GB
▪ 20 sensors/pump ~26 GB/day
▪ 3 pumps ~ 78 GB/day
Pump flow sensor 1 sec ~ 1000 samples ~16kB
Challenge:
Data transmission cost is pretty high
Solution:
Extract only relevant information and send it to predictive model

63
Video showing Codegen with MATLAB Coder

64
Video showing Codegen with MATLAB Coder

65
Code Deployment for Machine Learning
▪ SVM Classification
▪ Linear Classification
▪ Linear Regression
▪ Generalized Linear Regr.
▪ Decision trees
▪ Ensembles for Class.
▪ Ensembles for Regr.
▪ SVM Regression
▪ KNN Classification
▪ Gaussian Process Regr.
▪ Discriminant Analysis
▪ Non-tree Ensembles
▪ KNN with kd-tree
Deploy trained models as standalone C/C++ code

66
What do your end users want?
Flexible Deployment
▪ Maintenance needs simple, quick
information
– Hand held devices, Alarms
▪ Operations needs a birds-eye view
– Integration with IT & OT systems
▪ Customers expect easy to digest
information
– Automated reports
Dashboards &
Hand held DevicesFleet & Inventory Analysis
Azure
Blob
Azure
SQL
Data Sources Analytics Platforms
Azure
IoT Hub
AWS
Kinesis
Streaming Data
67
Agenda:
1. What is Predictive Maintenance? Who is benefiting by doing it?
2. How can you develop a predictive maintenance algorithm using MATLAB?
3. How can you get started quickly?

68
MathWorks can help you get started TODAY
▪ Examples
▪ Documentation
▪ Tutorials & Workshops
▪ Consulting
▪ Tech Talk Series

69
Training ServicesExploit the full potential of MathWorks products
Flexible delivery options:
▪ Public training available in several cities
▪ Onsite training with standard or
customized courses
▪ Web-based training with live, interactive
instructor-led courses
More than 48 course offerings:
▪ Introductory and intermediate training on MATLAB, Simulink,
Stateflow, code generation, and Polyspace products
▪ Specialized courses in control design, signal processing, parallel computing,
code generation, communications, financial analysis,
and other areas
www.mathworks.in/training

70
Machine Learning with MATLAB
▪ This two-day course focuses on data analytics and machine learning techniques in MATLAB. The
course demonstrates the use of unsupervised learning to discover features in large data sets and
supervised learning to build predictive models. Topics include:
▪ Organizing and preprocessing data
▪ Clustering data
▪ Creating classification and regression models
▪ Interpreting and evaluating models
▪ Simplifying data sets
▪ Using ensembles to improve model performance

71
Statistical Methods in MATLAB
After this 2-day course you will be able to:
Import, visualize, explore, and model data
▪ Fit probability distributions to data, and perform
hypothesis tests
▪ Develop and fit regression models to data
▪ Generate random numbers
and perform simulations

72
Summary: Why MATLAB for Predictive Maintenance?
▪ Dedicated toolbox for data preprocessing and feature extraction and developing
predictive models
▪ Apps to make the task simple
▪ Support for taking these algorithm to edge and enterprise
▪ Get started quickly…examples, training and consulting

73
▪ Scan this QR Code or log onto link below
(link also sent to your phone and email)
▪ http://bit.ly/expo19-feedback
▪ Enter the registration id number displayed
on your badge
▪ Provide feedback for this session
Please provide feedback for this block of sessions

74© 2015 The MathWorks, Inc.
Speaker Details:
Email: [email protected]
LinkedIn: https://www.linkedin.com/in/amit-doshi/