Predictive Maintenance 4.0 Beyond the hype: PdM 4.0 ... · Beyond the hype . 2018 PdM 4.0: Beyond...
19
Predictive Maintenance 4.0 Beyond the hype: PdM 4.0 delivers results September 2018
Transcript of Predictive Maintenance 4.0 Beyond the hype: PdM 4.0 ... · Beyond the hype . 2018 PdM 4.0: Beyond...

Predictive Maintenance 4.0Beyond the hype: PdM 4.0 delivers results
September 2018
Contents Foreword
Contents Foreword
Foreword .................................................................................................................. 3
Summary .................................................................................................................. 4
Chapter 1: Introduction ............................................................................................. 6
Case Infrabel ........................................................................................................... 10
Chapter 2: Key findings ............................................................................................ 12
Case Sitech ............................................................................................................. 22
Chapter 3: Recommendations ................................................................................. 24
Chapter 4: Call to action .......................................................................................... 28
About the survey ..................................................................................................... 30
Contacts .................................................................................................................. 32
Acknowledgements ................................................................................................ 34
PwC and Mainnovation have joined forces in the field of maintenance and asset management. We are both convinced that maintenance can be elevated to new heights by combining the power of new digital technologies with a deep understanding of maintenance. Our collaboration in projects for several clients has further strengthened our belief that predictive maintenance with big data analytics can be a tremendous source of new value for asset owners and maintenance service providers.
We want to continue to deepen our understanding and sharpen our insights. We have thus jointly conducted a market survey on predictive maintenance for the second consecutive year. Besides surveying 268 companies from Belgium, Germany and the Netherlands about their current use of, and future plans for, predictive maintenance, this also involved conducting interviews with leading companies in the field.
This report presents the results of this research and our approach to successfully implementing predictive maintenance with big data. In order to present our findings in a coherent manner, we have reused certain sections from our 2017 report. We have added a section about results that companies have achieved by using predictive maintenance with big data analytics. We hope you’ll find this particular section as exciting as we do.
Our findings should be of interest to those responsible for maintenance and asset management of fleets, factories and infrastructure, who are looking for new ways to increase the reliability of their assets. We are proud to share these findings with you and look forward to continuing the fruitful discussions on this topic we have enjoyed with many of you.
Michel Mulders Mark HaarmanPartner, PwC The Netherlands Managing Partner, Mainnovation
2 | PdM 4.0: Beyond the hype 2018 PdM 4.0: Beyond the hype 2018 | 3
Summary
The use of big data analytics in predictive maintenance is one of the most talked-about topics in maintenance and asset management. We surveyed 268 companies in Belgium, Germany and the Netherlands to discover where companies currently stand regarding predictive maintenance, what has changed since our previous survey in 2017, and which plans companies have for the near future. It appears that predictive maintenance with big data analytics is not just a fancy topic in an early stage of the ‘hype cycle’. Instead, it is proving to be a very powerful new technology that is realising tremendous results and value for companies that have incorporated it into their maintenance operations.
Key findings from the surveyWe found that 11% of survey respondents are currently at maturity level 4, the same figure we found in our 2017 survey. This means companies’ plans and ambitions regarding PdM 4.0 have not yet resulted in a noticeable increase in its use among companies. However, we also found numerous signs that companies have become more ambitious about improving the maturity of their predictive maintenance. 60% of respondents have either concrete plans or intentions to use PdM 4.0 in the near future, which has increased from 49% in 2017. The main objective of these plans is to improve uptime. Most companies that have no plans to use PdM 4.0 mention the lack of budget as their main reason.
We also found that companies are doing much more to increase the maturity of their maintenance than just announce ambitions. Companies are actually laying the foundations for such maturity increases and have invested in the capabilities and resources needed for PdM 4.0. Compared to 2017, more companies are using external data, which is an essential componentof big data analytics. They are using more - and more advanced - data sources, particularly sensors, environmental data, production control systems and maintenance information systems. There has also been a marked increase in the use of more advanced data software, data platforms and connectivity solutions. Finally, we have witnessed a significant increase in the number of companies that employ data scientists, IT specialists and reliability engineers in their maintenance activities; functions typically associated with more mature levels of predictive maintenance. Once again, we can conclude that PdM 4.0 is widely recognized as a potential improvement to existing maintenance practices, but that the market is still in the early stages of adopting this technology.
This year’s survey was also aimed at discovering whether PdM 4.0 is really as good as advertised. So we asked companies that already use PdM 4.0 about the results it has helped them to achieve. An astonishing 95% of these survey respondents said PdM 4.0 is indeed responsible for improving one or, in most cases, several key maintenance value drivers. 60% of
respondents have seen an improvement in uptime due to PdM 4.0, with an average improvement of no less than 9%. A similar number of respondents reported that PdM 4.0 had helped to reduce costs, cut risks associated with health, safety, the environment and quality, and to extend the lifetime of their assets. These results strengthen our conviction that using big data analytics in maintenance truly represents a new level of maturity. Companies that succeed in reaching this level will unlock sources of tremendous value for their business. These results also provide reference data and inspiration to companies who find it difficult to make a solid business case for PdM 4.0 and to quantify the expected results.
Our approach to successful PdM 4.0 implementationsWe conclude this report by outlining our approach for implementing PdM 4.0. We have provided a framework for the step-by-step implementation of technical components in the PdM 4.0 model, in a manner that supports business strategy. We have used a special section to propose general IT architecture that supports PdM 4.0, and have briefly described the various components.
Our approach also covers several organisational aspects that are important if PdM 4.0 is to be successful: building skills and capabilities needed for PdM 4.0, and building a digital culture. In the interest of brevity, a full discussion about these aspects has not been included in this report, although we can refer to our 2017 report. This in no way implies that we think these aspects are of secondary importance.
It is worth reemphasizing that successful PdM 4.0 implementations can only take place and be sustained in organisations that are capable of realising change, fostering a digital culture and developing and attracting necessary capabilities. The right technologies are obviously important, but success or failure will not ultimately depend on specific sensors, algorithms or analytics programmes, but on a broader range of people-related factors. Getting such people-related factors right may be the most challenging part of a PdM 4.0 implementation.
To assess current practices, we have used a framework that identifies four levels of maturity in predictive maintenance. As companies move through these levels, there is an increase in how much data they use to predict failures. Visual inspections represent level 1 in this framework; instrument inspections and real-time condition monitoring are associated with levels 2 and 3, while big data analytics starts to drive decision-making in level 4. This is where the digital
revolution meets the world of maintenance. This level involves using the power of machine learning technology to identify meaningful patterns in vast amounts of data and to generate practical new insights for improving asset availability. We refer to this as Predictive Maintenance 4.0, or PdM 4.0. PdM 4.0 makes it possible for you to predict failures that had been unpredictable up to now.
4 | PdM 4.0: Beyond the hype 2018 PdM 4.0: Beyond the hype 2018 | 5
Summary Summary
Chapter 1 Introduction
Taking predictive maintenance to the next level
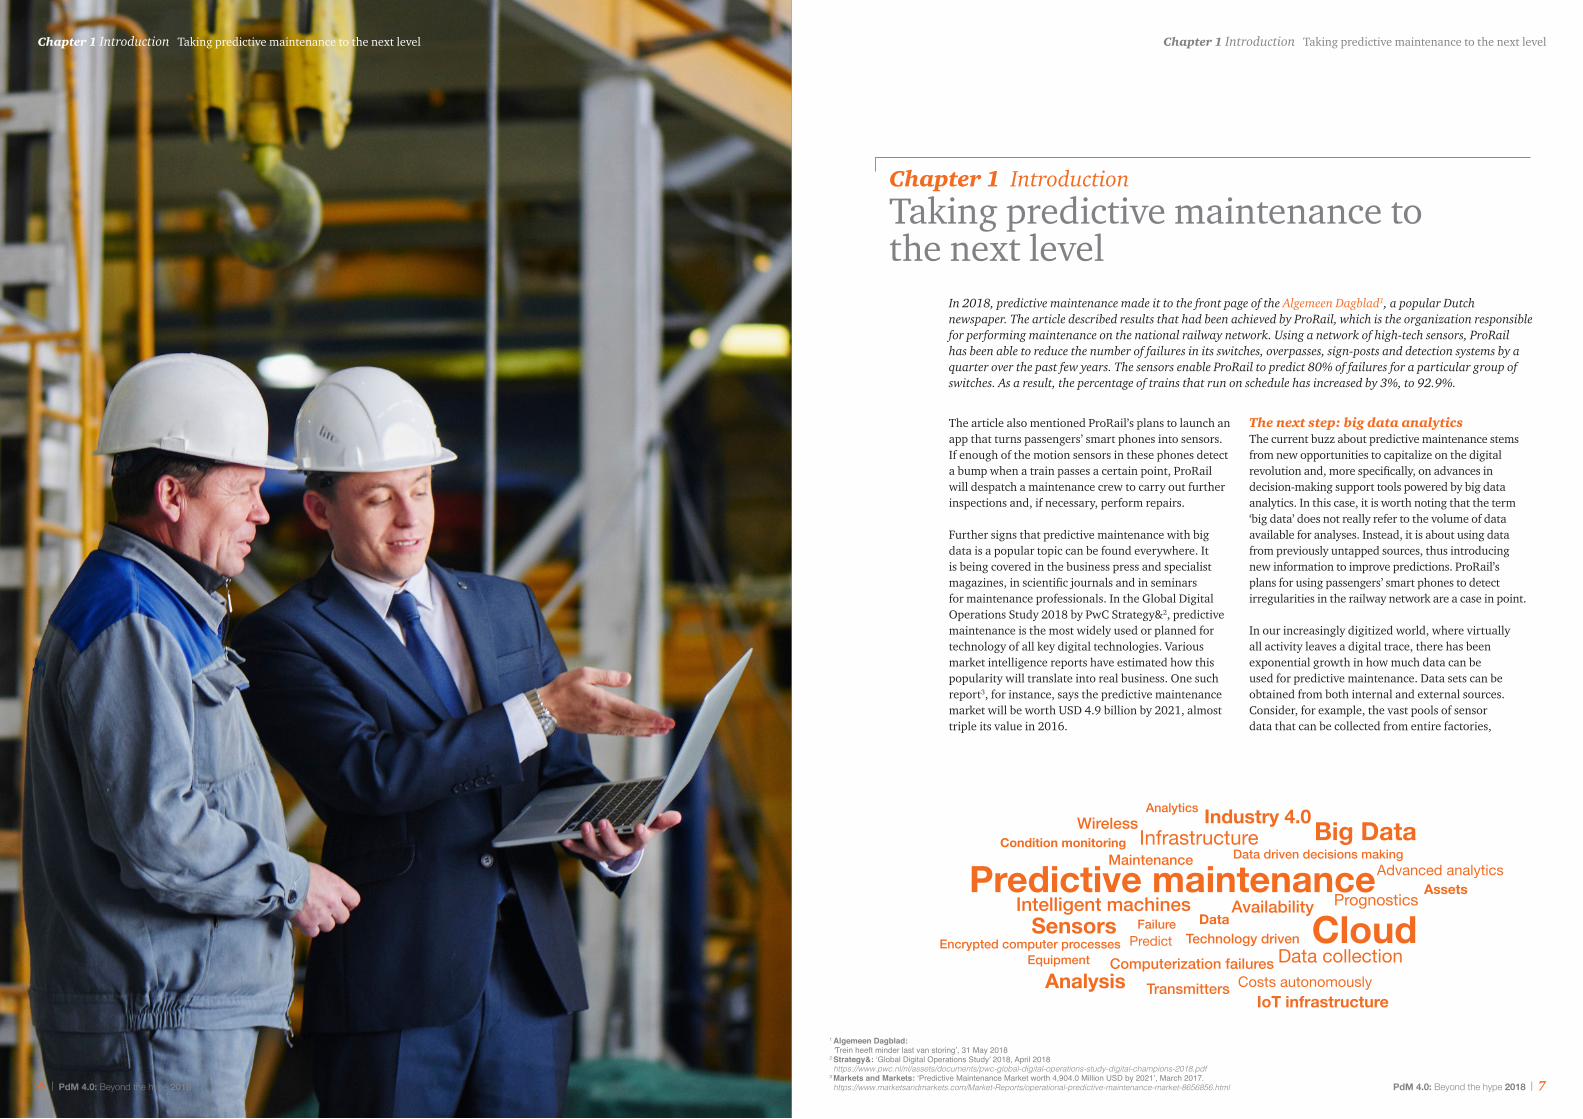
In 2018, predictive maintenance made it to the front page of the Algemeen Dagblad1, a popular Dutch newspaper. The article described results that had been achieved by ProRail, which is the organization responsible for performing maintenance on the national railway network. Using a network of high-tech sensors, ProRail has been able to reduce the number of failures in its switches, overpasses, sign-posts and detection systems by a quarter over the past few years. The sensors enable ProRail to predict 80% of failures for a particular group of switches. As a result, the percentage of trains that run on schedule has increased by 3%, to 92.9%.
The article also mentioned ProRail’s plans to launch an app that turns passengers’ smart phones into sensors. If enough of the motion sensors in these phones detect a bump when a train passes a certain point, ProRail will despatch a maintenance crew to carry out further inspections and, if necessary, perform repairs.
Further signs that predictive maintenance with big data is a popular topic can be found everywhere. It is being covered in the business press and specialist magazines, in scientific journals and in seminars for maintenance professionals. In the Global Digital Operations Study 2018 by PwC Strategy&2, predictive maintenance is the most widely used or planned for technology of all key digital technologies. Various market intelligence reports have estimated how this popularity will translate into real business. One such report3, for instance, says the predictive maintenance market will be worth USD 4.9 billion by 2021, almost triple its value in 2016.
The next step: big data analyticsThe current buzz about predictive maintenance stems from new opportunities to capitalize on the digital revolution and, more specifically, on advances in decision-making support tools powered by big data analytics. In this case, it is worth noting that the term ‘big data’ does not really refer to the volume of data available for analyses. Instead, it is about using data from previously untapped sources, thus introducing new information to improve predictions. ProRail’s plans for using passengers’ smart phones to detect irregularities in the railway network are a case in point.
In our increasingly digitized world, where virtually all activity leaves a digital trace, there has been exponential growth in how much data can be used for predictive maintenance. Data sets can be obtained from both internal and external sources. Consider, for example, the vast pools of sensor data that can be collected from entire factories,
TransmittersComputerization failures
Wireless
Data collection
DataIntelligent machines
Encrypted computer processesFailureSensors
Industry 4.0
Data driven decisions makingInfrastructureCondition monitoring
Predict
Big Data
Technology driven
Analysis
Advanced analyticsMaintenance
CloudPrognostics
Assets
Costs autonomously
Analytics
Availability
Equipment
Predictive maintenance
IoT infrastructure
1 Algemeen Dagblad: ‘Trein heeft minder last van storing’, 31 May 2018
2 Strategy&: ‘Global Digital Operations Study’ 2018, April 2018 https://www.pwc.nl/nl/assets/documents/pwc-global-digital-operations-study-digital-champions-2018.pdf
3 Markets and Markets: ‘Predictive Maintenance Market worth 4,904.0 Million USD by 2021’, March 2017. https://www.marketsandmarkets.com/Market-Reports/operational-predictive-maintenance-market-8656856.html6 | PdM 4.0: Beyond the hype 2018 PdM 4.0: Beyond the hype 2018 | 7
Chapter 1 Introduction Taking predictive maintenance to the next levelChapter 1 Introduction Taking predictive maintenance to the next level
transportation fleets or infrastructure networks, and then distributed via Internet of Things technology. External data can include environmental data about temperature, humidity and wind speeds, or operator profiles or specifications of materials being processed at the time of failure. Data sets used for predictive maintenance may be structured, like spreadsheets or relational databases, but can also be unstructured, like maintenance logs or thermal images, which can be ‘unlocked’ through text mining and pattern recognition software respectively.
One could easily drown in this sea of data. Fortunately, rapid advances in artificial intelligence techniques have enabled us to make sense of all this data. Machine learning algorithms are particularly crucial in this respect. These algorithms are not constructed as a predefined set of rules, as in traditional software programming. Instead, these algorithms are self-learning. They infer rules by performing a series of trials on a set of training data and thus construct their own model of the world. Every additional set of data can then be used to refine this model and improve its predictive powers.
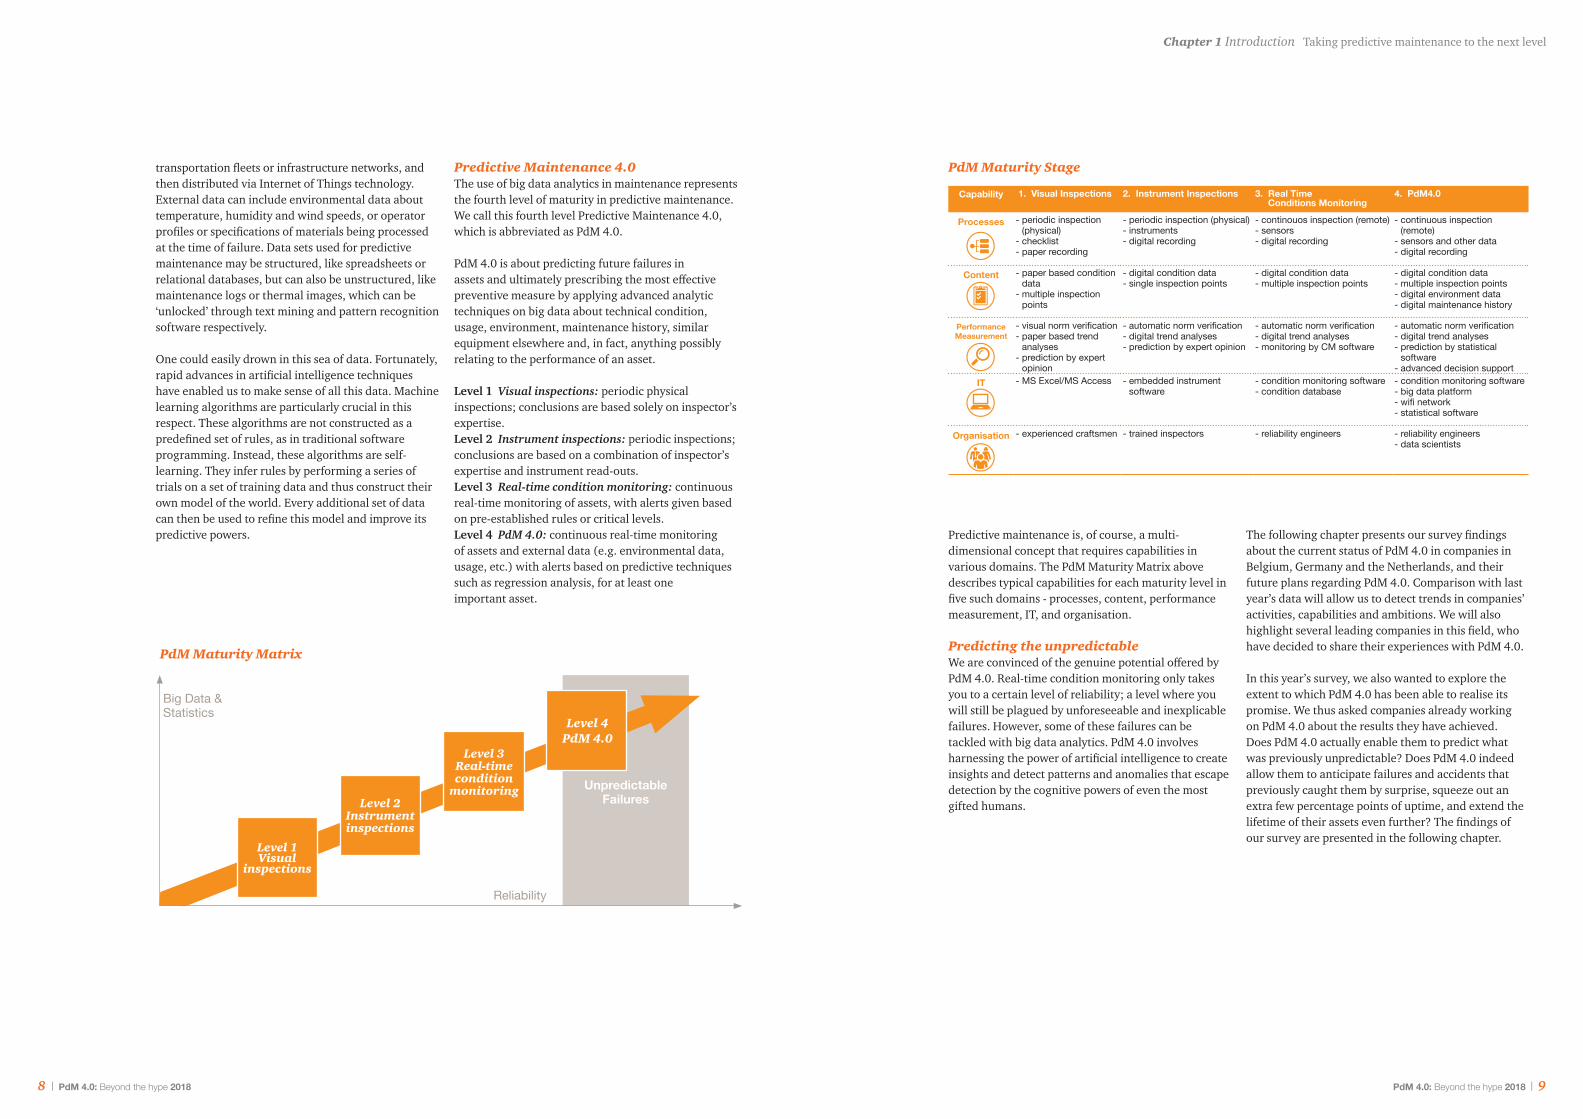
Predictive Maintenance 4.0The use of big data analytics in maintenance represents the fourth level of maturity in predictive maintenance. We call this fourth level Predictive Maintenance 4.0, which is abbreviated as PdM 4.0.
PdM 4.0 is about predicting future failures in assets and ultimately prescribing the most effective preventive measure by applying advanced analytic techniques on big data about technical condition, usage, environment, maintenance history, similar equipment elsewhere and, in fact, anything possibly relating to the performance of an asset.
Level 1 Visual inspections: periodic physical inspections; conclusions are based solely on inspector’s expertise.Level 2 Instrument inspections: periodic inspections; conclusions are based on a combination of inspector’s expertise and instrument read-outs.Level 3 Real-time condition monitoring: continuous real-time monitoring of assets, with alerts given based on pre-established rules or critical levels.Level 4 PdM 4.0: continuous real-time monitoring of assets and external data (e.g. environmental data, usage, etc.) with alerts based on predictive techniques such as regression analysis, for at least one important asset.
Unpredictable Failures
Reliability
Big Data &Statistics
Level 1Visual
inspections
Level 2Instrumentinspections
Level 3Real-time condition
monitoring
PdM Maturity Matrix
Predictive maintenance is, of course, a multi-dimensional concept that requires capabilities in various domains. The PdM Maturity Matrix above describes typical capabilities for each maturity level in five such domains - processes, content, performance measurement, IT, and organisation.
Predicting the unpredictableWe are convinced of the genuine potential offered by PdM 4.0. Real-time condition monitoring only takes you to a certain level of reliability; a level where you will still be plagued by unforeseeable and inexplicable failures. However, some of these failures can be tackled with big data analytics. PdM 4.0 involves harnessing the power of artificial intelligence to create insights and detect patterns and anomalies that escape detection by the cognitive powers of even the most gifted humans.
The following chapter presents our survey findings about the current status of PdM 4.0 in companies in Belgium, Germany and the Netherlands, and their future plans regarding PdM 4.0. Comparison with last year’s data will allow us to detect trends in companies’ activities, capabilities and ambitions. We will also highlight several leading companies in this field, who have decided to share their experiences with PdM 4.0.
In this year’s survey, we also wanted to explore the extent to which PdM 4.0 has been able to realise its promise. We thus asked companies already working on PdM 4.0 about the results they have achieved. Does PdM 4.0 actually enable them to predict what was previously unpredictable? Does PdM 4.0 indeed allow them to anticipate failures and accidents that previously caught them by surprise, squeeze out an extra few percentage points of uptime, and extend the lifetime of their assets even further? The findings of our survey are presented in the following chapter.
Capability 1. Visual Inspections 2. Instrument Inspections 3. Real Time Conditions Monitoring
4. PdM4.0
Processes - periodic inspection (physical)
- checklist- paper recording
- periodic inspection (physical)- instruments- digital recording
- continouos inspection (remote)- sensors- digital recording
- continuous inspection (remote)
- sensors and other data- digital recording
Content - paper based condition data
- multiple inspection points
- digital condition data- single inspection points
- digital condition data- multiple inspection points
- digital condition data- multiple inspection points- digital environment data- digital maintenance history
PerformanceMeasurement
- visual norm verification- paper based trend
analyses- prediction by expert
opinion
- automatic norm verification- digital trend analyses- prediction by expert opinion
- automatic norm verification- digital trend analyses- monitoring by CM software
- automatic norm verification- digital trend analyses- prediction by statistical
software- advanced decision support
IT - MS Excel/MS Access - embedded instrument software
- condition monitoring software- condition database
- condition monitoring software- big data platform- wifi network- statistical software
Organisation - experienced craftsmen - trained inspectors - reliability engineers - reliability engineers- data scientists
PdM Maturity Stage
Level 4PdM 4.0
8 | PdM 4.0: Beyond the hype 2018 PdM 4.0: Beyond the hype 2018 | 9
Chapter 1 Introduction The next level in predictive maintenance Chapter 1 Introduction Taking predictive maintenance to the next level
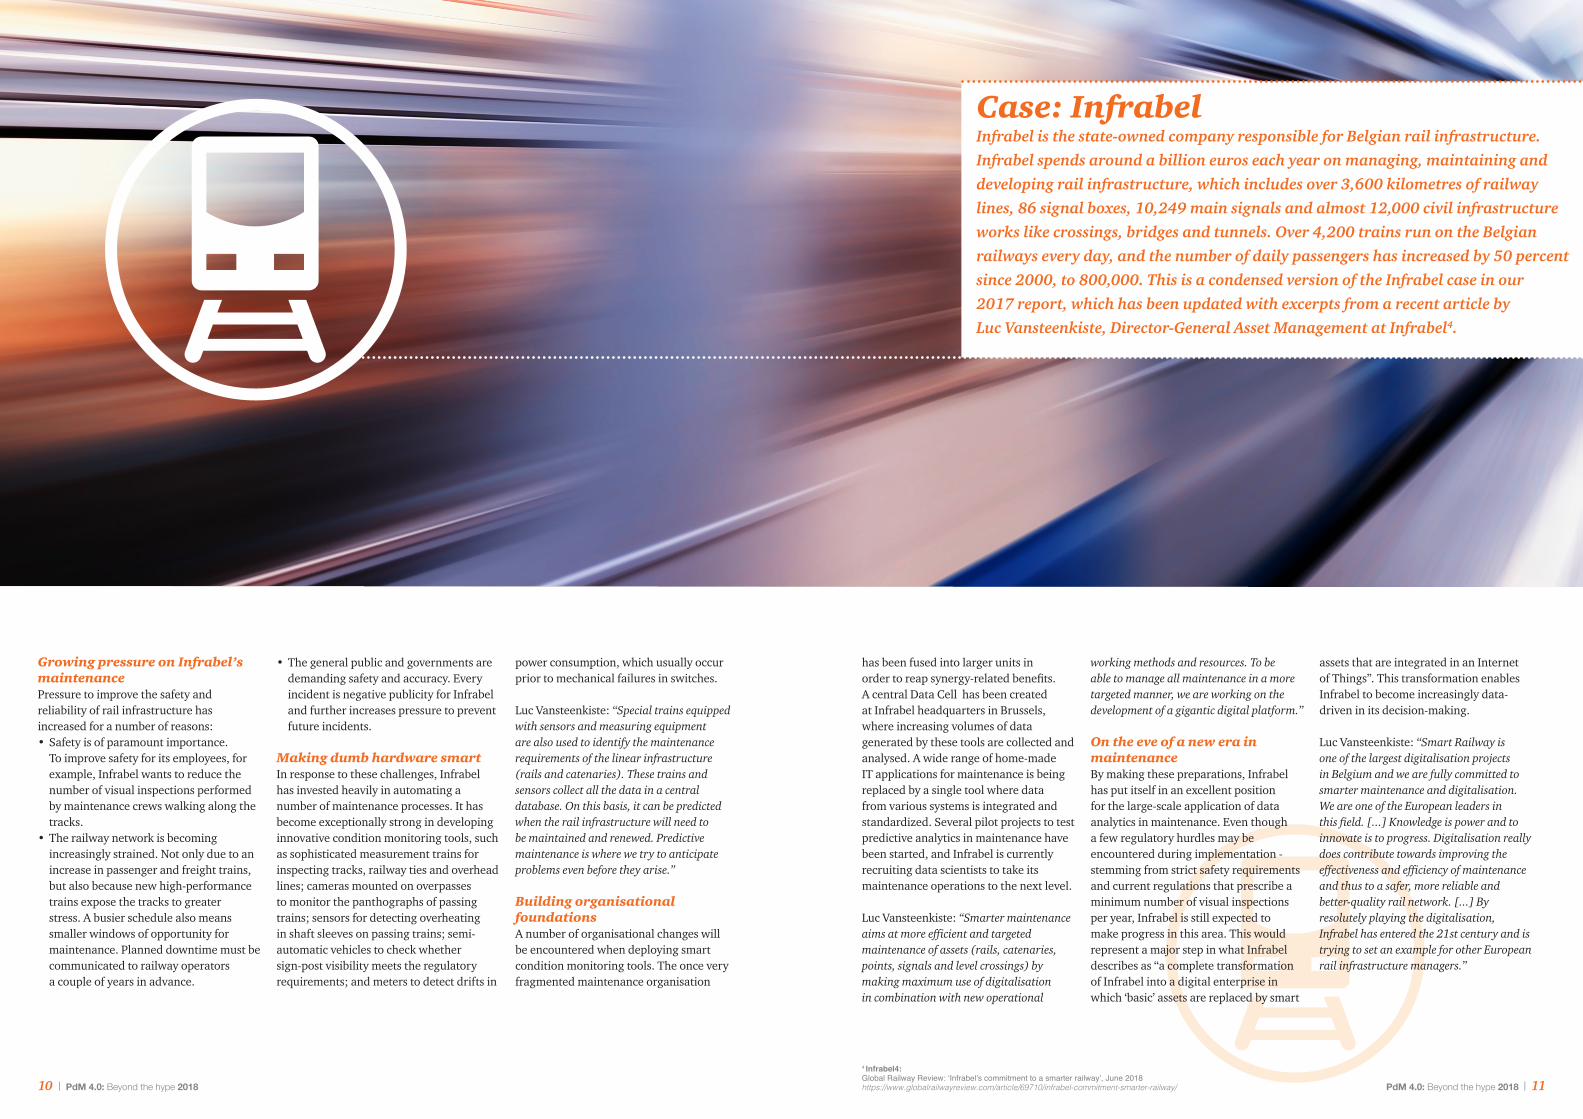
Growing pressure on Infrabel’s maintenancePressure to improve the safety and reliability of rail infrastructure has increased for a number of reasons: • Safety is of paramount importance.
To improve safety for its employees, for example, Infrabel wants to reduce the number of visual inspections performed by maintenance crews walking along the tracks.
• The railway network is becoming increasingly strained. Not only due to an increase in passenger and freight trains, but also because new high-performance trains expose the tracks to greater stress. A busier schedule also means smaller windows of opportunity for maintenance. Planned downtime must be communicated to railway operators a couple of years in advance.
• The general public and governments are demanding safety and accuracy. Every incident is negative publicity for Infrabel and further increases pressure to prevent future incidents.
Making dumb hardware smart In response to these challenges, Infrabel has invested heavily in automating a number of maintenance processes. It has become exceptionally strong in developing innovative condition monitoring tools, such as sophisticated measurement trains for inspecting tracks, railway ties and overhead lines; cameras mounted on overpasses to monitor the panthographs of passing trains; sensors for detecting overheating in shaft sleeves on passing trains; semi-automatic vehicles to check whether sign-post visibility meets the regulatory requirements; and meters to detect drifts in
power consumption, which usually occur prior to mechanical failures in switches.
Luc Vansteenkiste: “Special trains equipped with sensors and measuring equipment are also used to identify the maintenance requirements of the linear infrastructure (rails and catenaries). These trains and sensors collect all the data in a central database. On this basis, it can be predicted when the rail infrastructure will need to be maintained and renewed. Predictive maintenance is where we try to anticipate problems even before they arise.”
Building organisational foundationsA number of organisational changes will be encountered when deploying smart condition monitoring tools. The once very fragmented maintenance organisation
Case: InfrabelInfrabel is the state-owned company responsible for Belgian rail infrastructure. Infrabel spends around a billion euros each year on managing, maintaining and developing rail infrastructure, which includes over 3,600 kilometres of railway lines, 86 signal boxes, 10,249 main signals and almost 12,000 civil infrastructure works like crossings, bridges and tunnels. Over 4,200 trains run on the Belgian railways every day, and the number of daily passengers has increased by 50 percent since 2000, to 800,000. This is a condensed version of the Infrabel case in our 2017 report, which has been updated with excerpts from a recent article by Luc Vansteenkiste, Director-General Asset Management at Infrabel4.
has been fused into larger units in order to reap synergy-related benefits. A central Data Cell has been created at Infrabel headquarters in Brussels, where increasing volumes of data generated by these tools are collected and analysed. A wide range of home-made IT applications for maintenance is being replaced by a single tool where data from various systems is integrated and standardized. Several pilot projects to test predictive analytics in maintenance have been started, and Infrabel is currently recruiting data scientists to take its maintenance operations to the next level.
Luc Vansteenkiste: “Smarter maintenance aims at more efficient and targeted maintenance of assets (rails, catenaries, points, signals and level crossings) by making maximum use of digitalisation in combination with new operational
working methods and resources. To be able to manage all maintenance in a more targeted manner, we are working on the development of a gigantic digital platform.”
On the eve of a new era in maintenanceBy making these preparations, Infrabel has put itself in an excellent position for the large-scale application of data analytics in maintenance. Even though a few regulatory hurdles may be encountered during implementation - stemming from strict safety requirements and current regulations that prescribe a minimum number of visual inspections per year, Infrabel is still expected to make progress in this area. This would represent a major step in what Infrabel describes as “a complete transformation of Infrabel into a digital enterprise in which ‘basic’ assets are replaced by smart
assets that are integrated in an Internet of Things”. This transformation enables Infrabel to become increasingly data-driven in its decision-making.
Luc Vansteenkiste: “Smart Railway is one of the largest digitalisation projects in Belgium and we are fully committed to smarter maintenance and digitalisation. We are one of the European leaders in this field. [...] Knowledge is power and to innovate is to progress. Digitalisation really does contribute towards improving the effectiveness and efficiency of maintenance and thus to a safer, more reliable and better-quality rail network. [...] By resolutely playing the digitalisation, Infrabel has entered the 21st century and is trying to set an example for other European rail infrastructure managers.”
4 Infrabel4:Global Railway Review: ‘Infrabel’s commitment to a smarter railway’, June 2018 https://www.globalrailwayreview.com/article/69710/infrabel-commitment-smarter-railway/10 | PdM 4.0: Beyond the hype 2018 PdM 4.0: Beyond the hype 2018 | 11
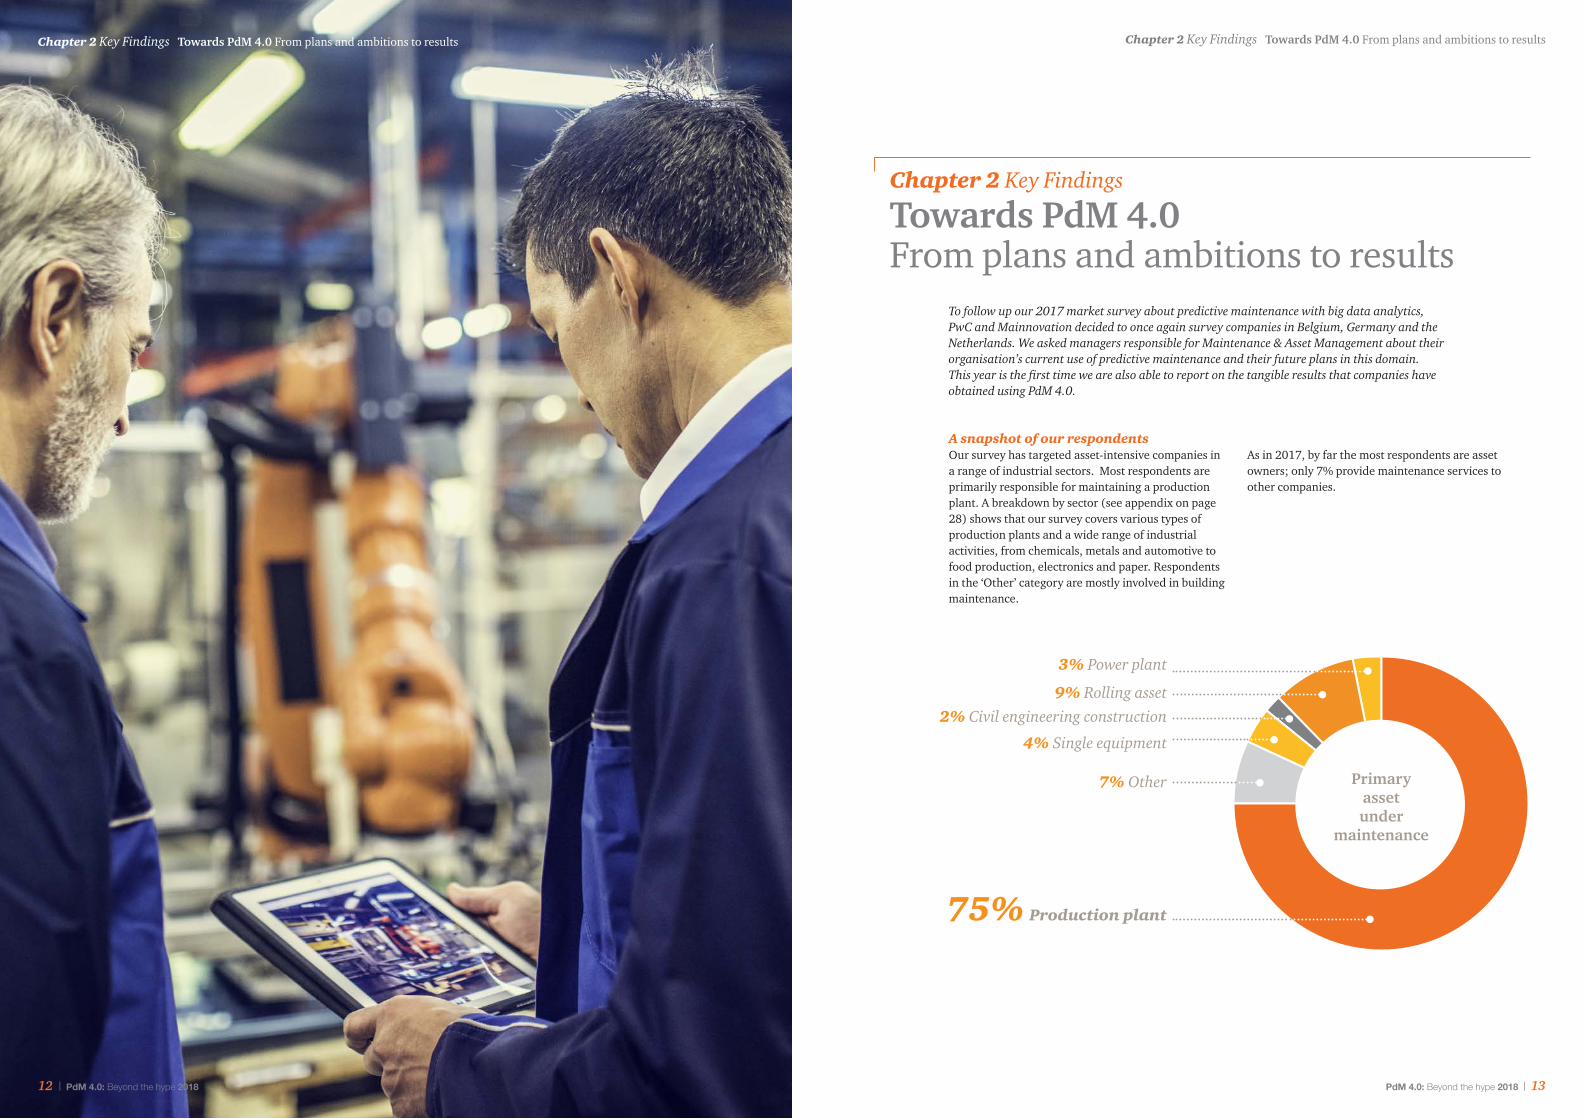
75% Production plant
4% Single equipment
2% Civil engineering construction9% Rolling asset
3% Power plant
7% Other
Chapter 2 Key Findings Towards PdM 4.0 From plans and ambitions to resultsChapter 2 Key Findings Towards PdM 4.0 From plans and ambitions to results
Chapter 2 Key Findings
Towards PdM 4.0 From plans and ambitions to results
To follow up our 2017 market survey about predictive maintenance with big data analytics, PwC and Mainnovation decided to once again survey companies in Belgium, Germany and the Netherlands. We asked managers responsible for Maintenance & Asset Management about their organisation’s current use of predictive maintenance and their future plans in this domain. This year is the first time we are also able to report on the tangible results that companies have obtained using PdM 4.0.
A snapshot of our respondentsOur survey has targeted asset-intensive companies in a range of industrial sectors. Most respondents are primarily responsible for maintaining a production plant. A breakdown by sector (see appendix on page 28) shows that our survey covers various types of production plants and a wide range of industrial activities, from chemicals, metals and automotive to food production, electronics and paper. Respondents in the ‘Other’ category are mostly involved in building maintenance.
As in 2017, by far the most respondents are asset owners; only 7% provide maintenance services to other companies.
Primaryassetunder
maintenance
12 | PdM 4.0: Beyond the hype 2018 PdM 4.0: Beyond the hype 2018 | 13
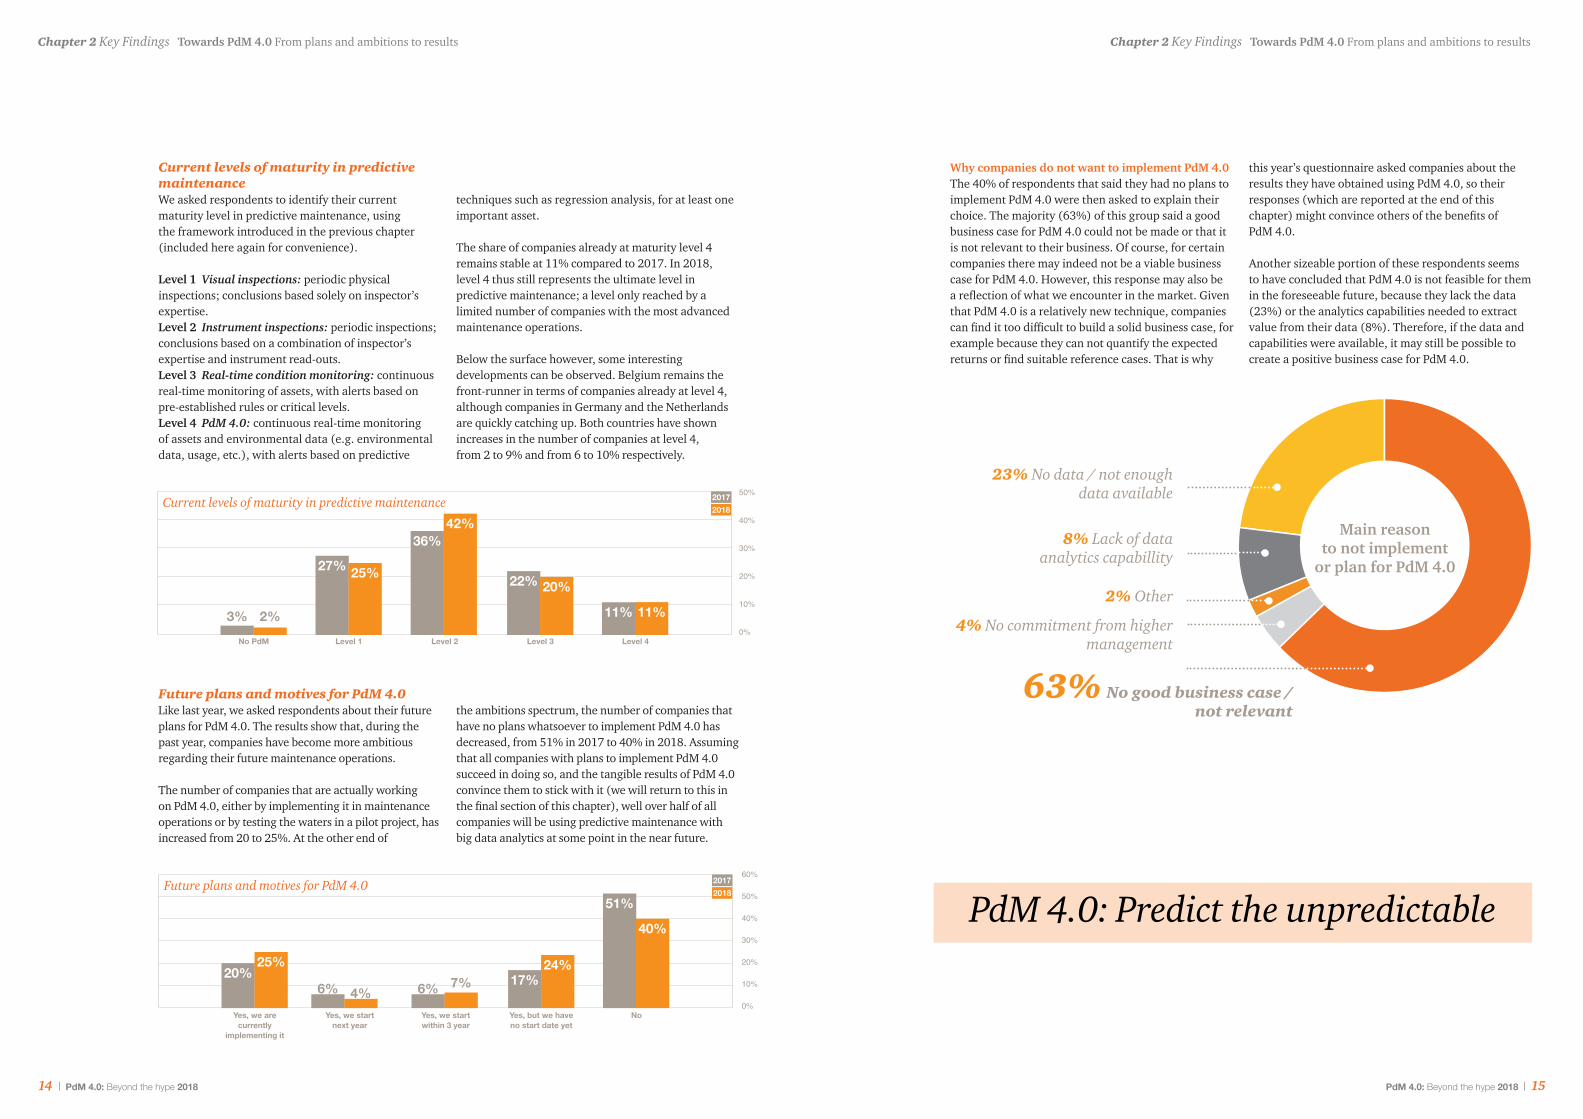
Why companies do not want to implement PdM 4.0The 40% of respondents that said they had no plans to implement PdM 4.0 were then asked to explain their choice. The majority (63%) of this group said a good business case for PdM 4.0 could not be made or that it is not relevant to their business. Of course, for certain companies there may indeed not be a viable business case for PdM 4.0. However, this response may also be a reflection of what we encounter in the market. Given that PdM 4.0 is a relatively new technique, companies can find it too difficult to build a solid business case, for example because they can not quantify the expected returns or find suitable reference cases. That is why
this year’s questionnaire asked companies about the results they have obtained using PdM 4.0, so their responses (which are reported at the end of this chapter) might convince others of the benefits of PdM 4.0.
Another sizeable portion of these respondents seems to have concluded that PdM 4.0 is not feasible for them in the foreseeable future, because they lack the data (23%) or the analytics capabilities needed to extract value from their data (8%). Therefore, if the data and capabilities were available, it may still be possible to create a positive business case for PdM 4.0.
50%
40%
30%
20%
10%
0%3% 2%
No PdM
27% 25%
Level 1
36%42%
Level 2
22% 20%
Level 3
11% 11%
Level 4
Current levels of maturity in predictive maintenance We asked respondents to identify their current maturity level in predictive maintenance, using the framework introduced in the previous chapter (included here again for convenience).
Level 1 Visual inspections: periodic physical inspections; conclusions based solely on inspector’s expertise.Level 2 Instrument inspections: periodic inspections; conclusions based on a combination of inspector’s expertise and instrument read-outs.Level 3 Real-time condition monitoring: continuous real-time monitoring of assets, with alerts based on pre-established rules or critical levels.Level 4 PdM 4.0: continuous real-time monitoring of assets and environmental data (e.g. environmental data, usage, etc.), with alerts based on predictive
techniques such as regression analysis, for at least one important asset.
The share of companies already at maturity level 4 remains stable at 11% compared to 2017. In 2018, level 4 thus still represents the ultimate level in predictive maintenance; a level only reached by a limited number of companies with the most advanced maintenance operations.
Below the surface however, some interesting developments can be observed. Belgium remains the front-runner in terms of companies already at level 4, although companies in Germany and the Netherlands are quickly catching up. Both countries have shown increases in the number of companies at level 4, from 2 to 9% and from 6 to 10% respectively.
60%
50%
40%
30%
20%
10%
0%
20%25%
Yes, we are currently
implementing it
6% 4%Yes, we start
next year
6% 7%
Yes, we start within 3 year
17%24%
Yes, but we have no start date yet
51%
40%
No
Future plans and motives for PdM 4.0Like last year, we asked respondents about their future plans for PdM 4.0. The results show that, during the past year, companies have become more ambitious regarding their future maintenance operations.
The number of companies that are actually working on PdM 4.0, either by implementing it in maintenance operations or by testing the waters in a pilot project, has increased from 20 to 25%. At the other end of
the ambitions spectrum, the number of companies that have no plans whatsoever to implement PdM 4.0 has decreased, from 51% in 2017 to 40% in 2018. Assuming that all companies with plans to implement PdM 4.0 succeed in doing so, and the tangible results of PdM 4.0 convince them to stick with it (we will return to this in the final section of this chapter), well over half of all companies will be using predictive maintenance with big data analytics at some point in the near future.
2% Other
8% Lack of data analytics capabillity
23% No data / not enough data available
4% No commitment from higher management
Main reason to not implement
or plan for PdM 4.0
63% No good business case / not relevant
20172018
20172018
PdM 4.0: Predict the unpredictable
14 | PdM 4.0: Beyond the hype 2018 PdM 4.0: Beyond the hype 2018 | 15
Chapter 2 Key Findings Towards PdM 4.0 From plans and ambitions to results Chapter 2 Key Findings Towards PdM 4.0 From plans and ambitions to results
Current levels of maturity in predictive maintenance
Future plans and motives for PdM 4.0
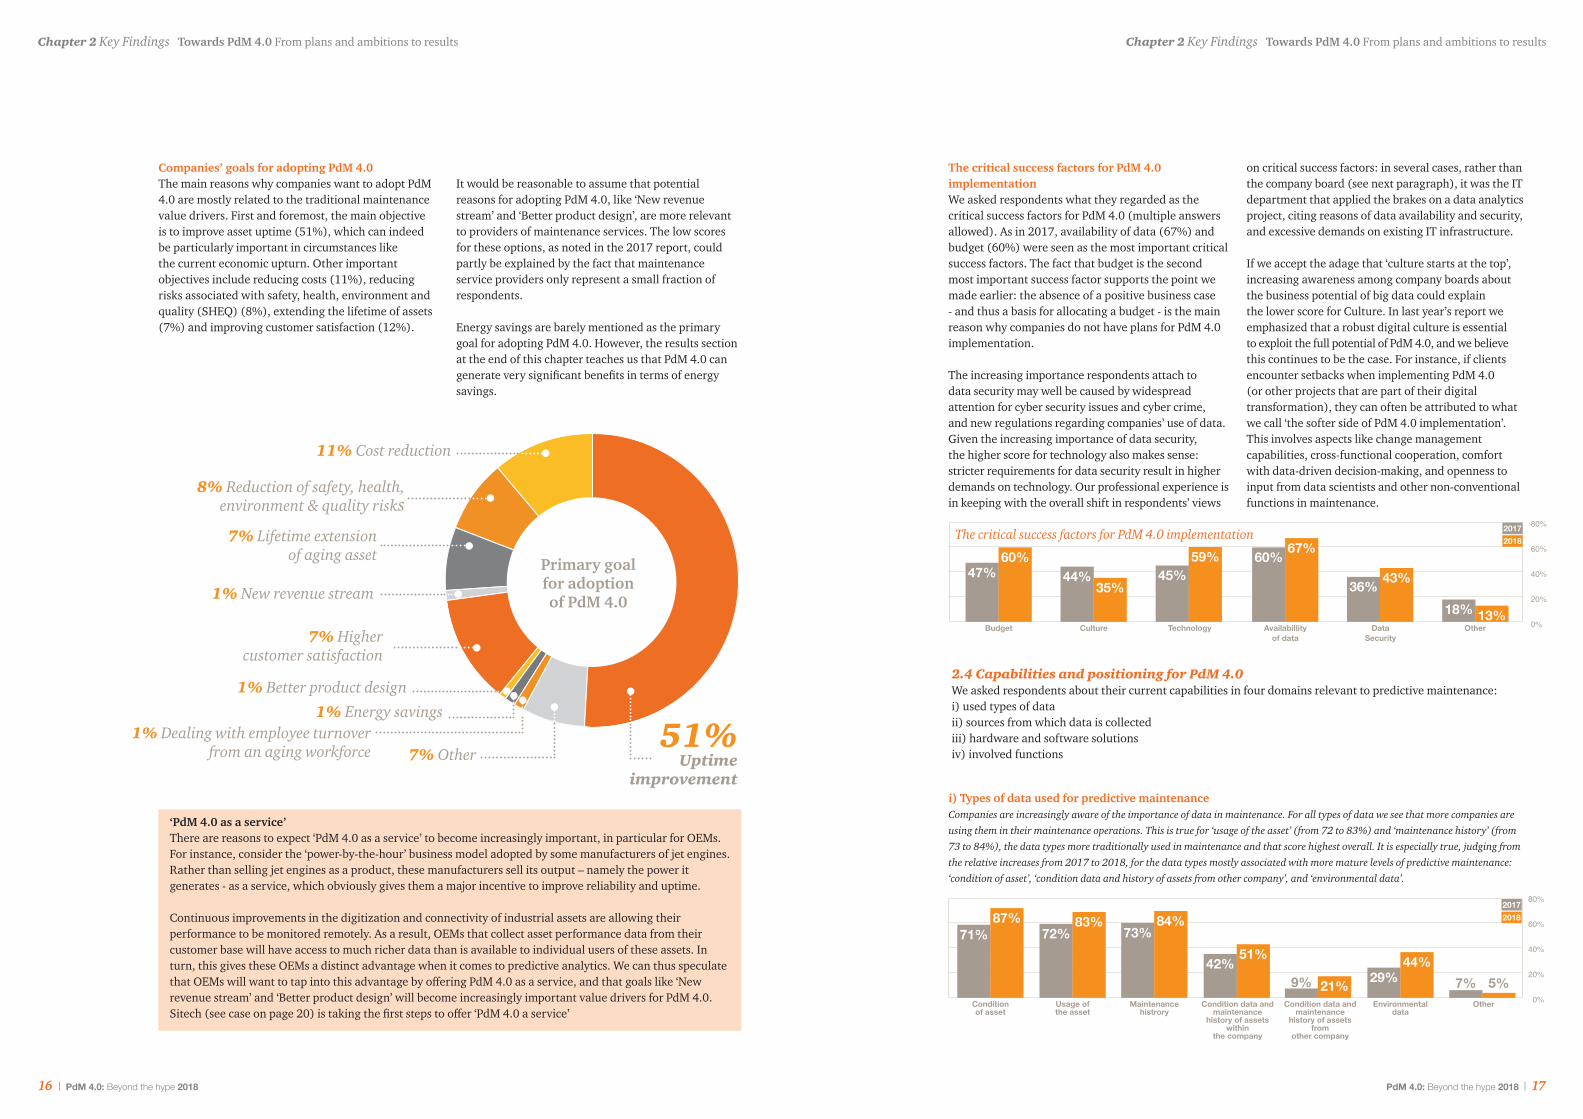
The critical success factors for PdM 4.0 implementation We asked respondents what they regarded as the critical success factors for PdM 4.0 (multiple answers allowed). As in 2017, availability of data (67%) and budget (60%) were seen as the most important critical success factors. The fact that budget is the second most important success factor supports the point we made earlier: the absence of a positive business case - and thus a basis for allocating a budget - is the main reason why companies do not have plans for PdM 4.0 implementation.
The increasing importance respondents attach to data security may well be caused by widespread attention for cyber security issues and cyber crime, and new regulations regarding companies’ use of data. Given the increasing importance of data security, the higher score for technology also makes sense: stricter requirements for data security result in higher demands on technology. Our professional experience is in keeping with the overall shift in respondents’ views
on critical success factors: in several cases, rather than the company board (see next paragraph), it was the IT department that applied the brakes on a data analytics project, citing reasons of data availability and security, and excessive demands on existing IT infrastructure.
If we accept the adage that ‘culture starts at the top’, increasing awareness among company boards about the business potential of big data could explain the lower score for Culture. In last year’s report we emphasized that a robust digital culture is essential to exploit the full potential of PdM 4.0, and we believe this continues to be the case. For instance, if clients encounter setbacks when implementing PdM 4.0 (or other projects that are part of their digital transformation), they can often be attributed to what we call ‘the softer side of PdM 4.0 implementation’. This involves aspects like change management capabilities, cross-functional cooperation, comfort with data-driven decision-making, and openness to input from data scientists and other non-conventional functions in maintenance.
Companies’ goals for adopting PdM 4.0The main reasons why companies want to adopt PdM 4.0 are mostly related to the traditional maintenance value drivers. First and foremost, the main objective is to improve asset uptime (51%), which can indeed be particularly important in circumstances like the current economic upturn. Other important objectives include reducing costs (11%), reducing risks associated with safety, health, environment and quality (SHEQ) (8%), extending the lifetime of assets (7%) and improving customer satisfaction (12%).
It would be reasonable to assume that potential reasons for adopting PdM 4.0, like ‘New revenue stream’ and ‘Better product design’, are more relevant to providers of maintenance services. The low scores for these options, as noted in the 2017 report, could partly be explained by the fact that maintenance service providers only represent a small fraction of respondents.
Energy savings are barely mentioned as the primary goal for adopting PdM 4.0. However, the results section at the end of this chapter teaches us that PdM 4.0 can generate very significant benefits in terms of energy savings.
7% Higher customer satisfaction
1% New revenue stream
8% Reduction of safety, health, environment & quality risks
7% Lifetime extensionof aging asset
11% Cost reduction
1% Better product design
7% Other1% Dealing with employee turnover
from an aging workforce
Primary goal for adoptionof PdM 4.0
51% Uptime
improvement
‘PdM 4.0 as a service’There are reasons to expect ‘PdM 4.0 as a service’ to become increasingly important, in particular for OEMs. For instance, consider the ‘power-by-the-hour’ business model adopted by some manufacturers of jet engines. Rather than selling jet engines as a product, these manufacturers sell its output – namely the power it generates - as a service, which obviously gives them a major incentive to improve reliability and uptime.
Continuous improvements in the digitization and connectivity of industrial assets are allowing their performance to be monitored remotely. As a result, OEMs that collect asset performance data from their customer base will have access to much richer data than is available to individual users of these assets. In turn, this gives these OEMs a distinct advantage when it comes to predictive analytics. We can thus speculate that OEMs will want to tap into this advantage by offering PdM 4.0 as a service, and that goals like ‘New revenue stream’ and ‘Better product design’ will become increasingly important value drivers for PdM 4.0. Sitech (see case on page 20) is taking the first steps to offer ‘PdM 4.0 a service’
Budget Culture Technology Availabillityof data
DataSecurity
Other
80%
60%
40%
20%
0%
47% 44% 45%60%
36%18%
60%
35%
59% 67%
43%
13%
20172018
2.4 Capabilities and positioning for PdM 4.0 We asked respondents about their current capabilities in four domains relevant to predictive maintenance:i) used types of dataii) sources from which data is collected iii) hardware and software solutionsiv) involved functions
80%
60%
40%
20%
0%
29%
71%87%
72%83%
73%84%
42%51%
9% 21%
44%
Conditionof asset
Usage ofthe asset
Maintenancehistrory
Condition data andmaintenance
history of assets within
the company
Condition data andmaintenance
history of assets from
other company
Environmental data
Other
7% 5%
20172018
i) Types of data used for predictive maintenanceCompanies are increasingly aware of the importance of data in maintenance. For all types of data we see that more companies are using them in their maintenance operations. This is true for ‘usage of the asset’ (from 72 to 83%) and ‘maintenance history’ (from 73 to 84%), the data types more traditionally used in maintenance and that score highest overall. It is especially true, judging from the relative increases from 2017 to 2018, for the data types mostly associated with more mature levels of predictive maintenance: ‘condition of asset’, ‘condition data and history of assets from other company’, and ‘environmental data’.
1% Energy savings
16 | PdM 4.0: Beyond the hype 2018 PdM 4.0: Beyond the hype 2018 | 17
Chapter 2 Key Findings Towards PdM 4.0 From plans and ambitions to resultsChapter 2 Key Findings Towards PdM 4.0 From plans and ambitions to results
The critical success factors for PdM 4.0 implementation
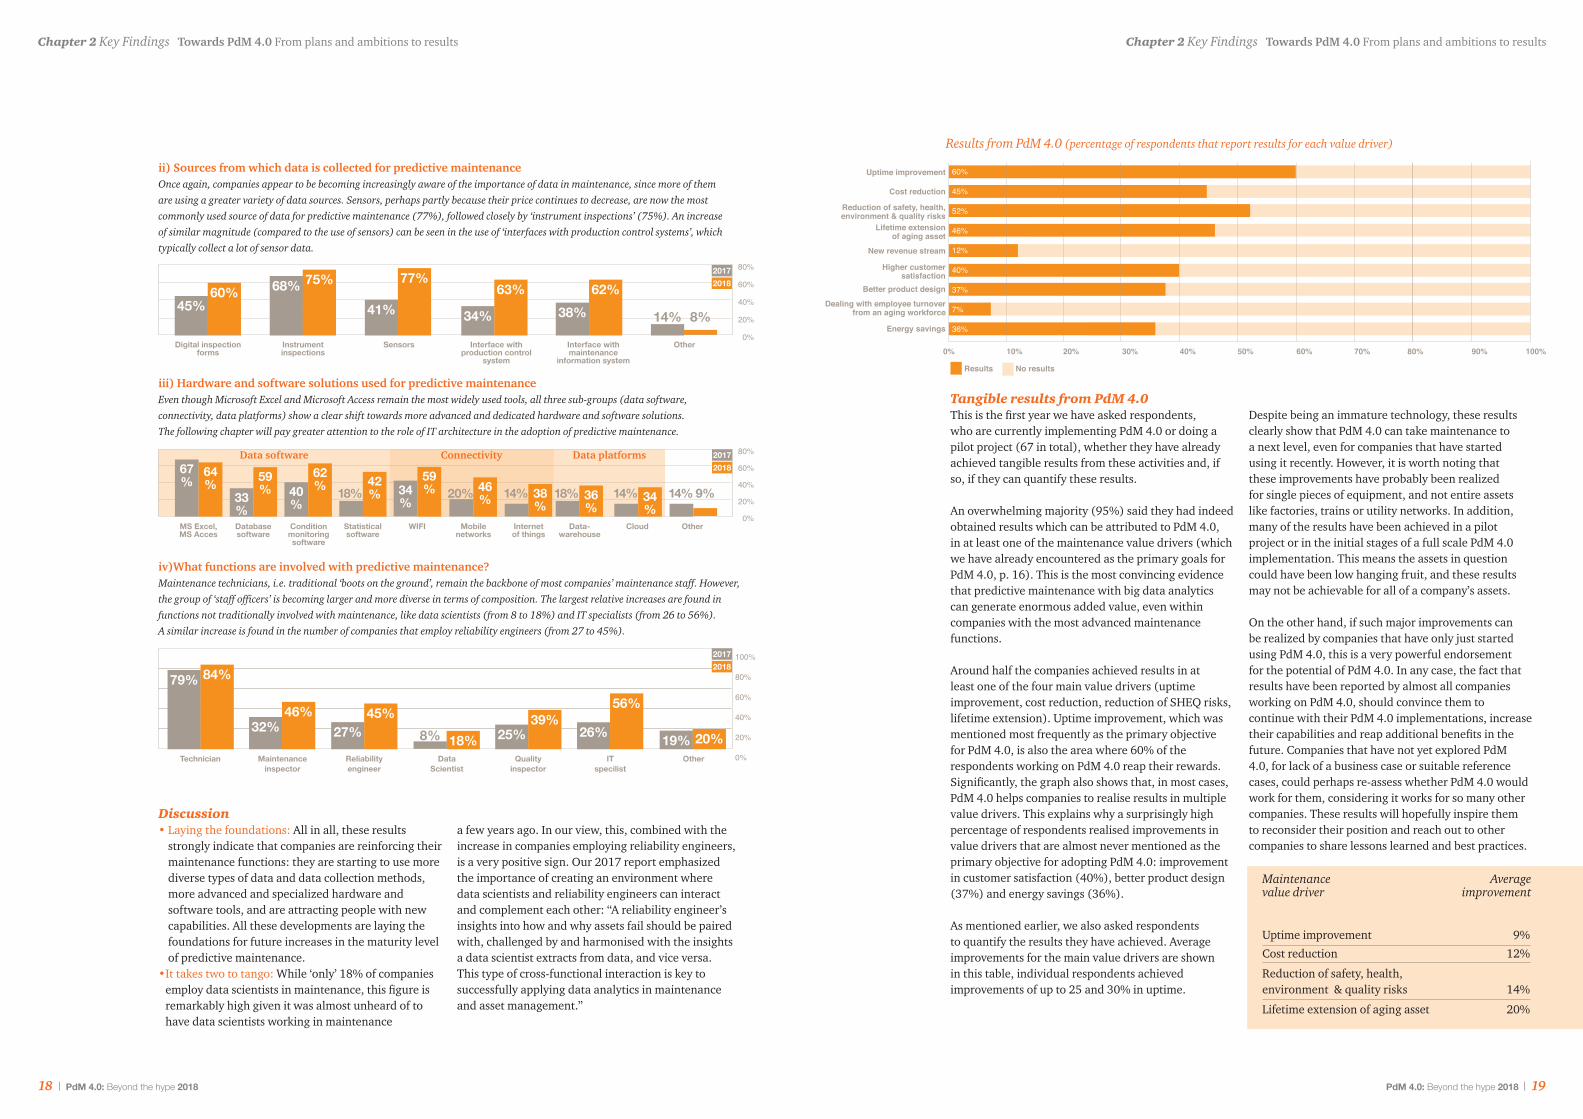
Tangible results from PdM 4.0This is the first year we have asked respondents, who are currently implementing PdM 4.0 or doing a pilot project (67 in total), whether they have already achieved tangible results from these activities and, if so, if they can quantify these results.
An overwhelming majority (95%) said they had indeed obtained results which can be attributed to PdM 4.0, in at least one of the maintenance value drivers (which we have already encountered as the primary goals for PdM 4.0, p. 16). This is the most convincing evidence that predictive maintenance with big data analytics can generate enormous added value, even within companies with the most advanced maintenance functions.
Around half the companies achieved results in at least one of the four main value drivers (uptime improvement, cost reduction, reduction of SHEQ risks, lifetime extension). Uptime improvement, which was mentioned most frequently as the primary objective for PdM 4.0, is also the area where 60% of the respondents working on PdM 4.0 reap their rewards. Significantly, the graph also shows that, in most cases, PdM 4.0 helps companies to realise results in multiple value drivers. This explains why a surprisingly high percentage of respondents realised improvements in value drivers that are almost never mentioned as the primary objective for adopting PdM 4.0: improvement in customer satisfaction (40%), better product design (37%) and energy savings (36%).
As mentioned earlier, we also asked respondents to quantify the results they have achieved. Average improvements for the main value drivers are shown in this table, individual respondents achievedimprovements of up to 25 and 30% in uptime.
Despite being an immature technology, these results clearly show that PdM 4.0 can take maintenance to a next level, even for companies that have started using it recently. However, it is worth noting that these improvements have probably been realized for single pieces of equipment, and not entire assets like factories, trains or utility networks. In addition, many of the results have been achieved in a pilot project or in the initial stages of a full scale PdM 4.0 implementation. This means the assets in question could have been low hanging fruit, and these results may not be achievable for all of a company’s assets.
On the other hand, if such major improvements can be realized by companies that have only just started using PdM 4.0, this is a very powerful endorsement for the potential of PdM 4.0. In any case, the fact that results have been reported by almost all companies working on PdM 4.0, should convince them to continue with their PdM 4.0 implementations, increase their capabilities and reap additional benefits in the future. Companies that have not yet explored PdM 4.0, for lack of a business case or suitable reference cases, could perhaps re-assess whether PdM 4.0 would work for them, considering it works for so many other companies. These results will hopefully inspire them to reconsider their position and reach out to other companies to share lessons learned and best practices.
60%
45%
52%
46%
12%
40%
37%
7%
36%
0% 10% 20% 30% 40% 50% 60% 70% 80% 90% 100%
Uptime improvement
Cost reduction
Reduction of safety, health, environment & quality risks
Lifetime extension of aging asset
New revenue stream
Higher customer satisfaction
Better product design
Dealing with employee turnoverfrom an aging workforce
Energy savings
ii) Sources from which data is collected for predictive maintenanceOnce again, companies appear to be becoming increasingly aware of the importance of data in maintenance, since more of them are using a greater variety of data sources. Sensors, perhaps partly because their price continues to decrease, are now the most commonly used source of data for predictive maintenance (77%), followed closely by ‘instrument inspections’ (75%). An increase of similar magnitude (compared to the use of sensors) can be seen in the use of ‘interfaces with production control systems’, which typically collect a lot of sensor data.
iii) Hardware and software solutions used for predictive maintenanceEven though Microsoft Excel and Microsoft Access remain the most widely used tools, all three sub-groups (data software, connectivity, data platforms) show a clear shift towards more advanced and dedicated hardware and software solutions. The following chapter will pay greater attention to the role of IT architecture in the adoption of predictive maintenance.
iv)What functions are involved with predictive maintenance?Maintenance technicians, i.e. traditional ‘boots on the ground’, remain the backbone of most companies’ maintenance staff. However, the group of ‘staff officers’ is becoming larger and more diverse in terms of composition. The largest relative increases are found in functions not traditionally involved with maintenance, like data scientists (from 8 to 18%) and IT specialists (from 26 to 56%). A similar increase is found in the number of companies that employ reliability engineers (from 27 to 45%).
38%45%14% 8%
80%
60%
40%
20%
0%Digital inspection
formsInstrumentinspections
Sensors Interface with production control
system
Interface withmaintenance
information system
Other
80%
60%
40%
20%
0%MS Excel,MS Acces
Databasesoftware
Conditionmonitoringsoftware
Statisticalsoftware
WIFI Internetof things
Mobilenetworks
Data-warehouse
Cloud Other
36%
18%46%
67%
64%
33%
59% 40
%
62% 14% 9%14% 34
%38%
14%59%34
%18%
42% 20%
20172018
20172018
100%
80%
60%
40%
20%
0%
32%46%
27%45%
25%39%
26%
56%
19% 20%
79% 84%
18%8%Technician Maintenance
inspectorReliabilityengineer
DataScientist
Qualityinspector
ITspecilist
Other
20172018
Discussion• Laying the foundations: All in all, these results
strongly indicate that companies are reinforcing their maintenance functions: they are starting to use more diverse types of data and data collection methods, more advanced and specialized hardware and software tools, and are attracting people with new capabilities. All these developments are laying the foundations for future increases in the maturity level of predictive maintenance.
• It takes two to tango: While ‘only’ 18% of companies employ data scientists in maintenance, this figure is remarkably high given it was almost unheard of to have data scientists working in maintenance
a few years ago. In our view, this, combined with the increase in companies employing reliability engineers, is a very positive sign. Our 2017 report emphasized the importance of creating an environment where data scientists and reliability engineers can interact and complement each other: “A reliability engineer’s insights into how and why assets fail should be paired with, challenged by and harmonised with the insights a data scientist extracts from data, and vice versa. This type of cross-functional interaction is key to successfully applying data analytics in maintenance and asset management.”
Maintenance Averagevalue driver improvement
Uptime improvement 9%
Cost reduction 12%
Reduction of safety, health, environment & quality risks 14%
Lifetime extension of aging asset 20%
Data software Connectivity Data platforms
60% 68%41%
75% 77%
34%
63% 62%
Results No results
18 | PdM 4.0: Beyond the hype 2018 PdM 4.0: Beyond the hype 2018 | 19
Chapter 2 Key Findings Towards PdM 4.0 From plans and ambitions to results Chapter 2 Key Findings Towards PdM 4.0 From plans and ambitions to results
Results from PdM 4.0 (percentage of respondents that report results for each value driver)
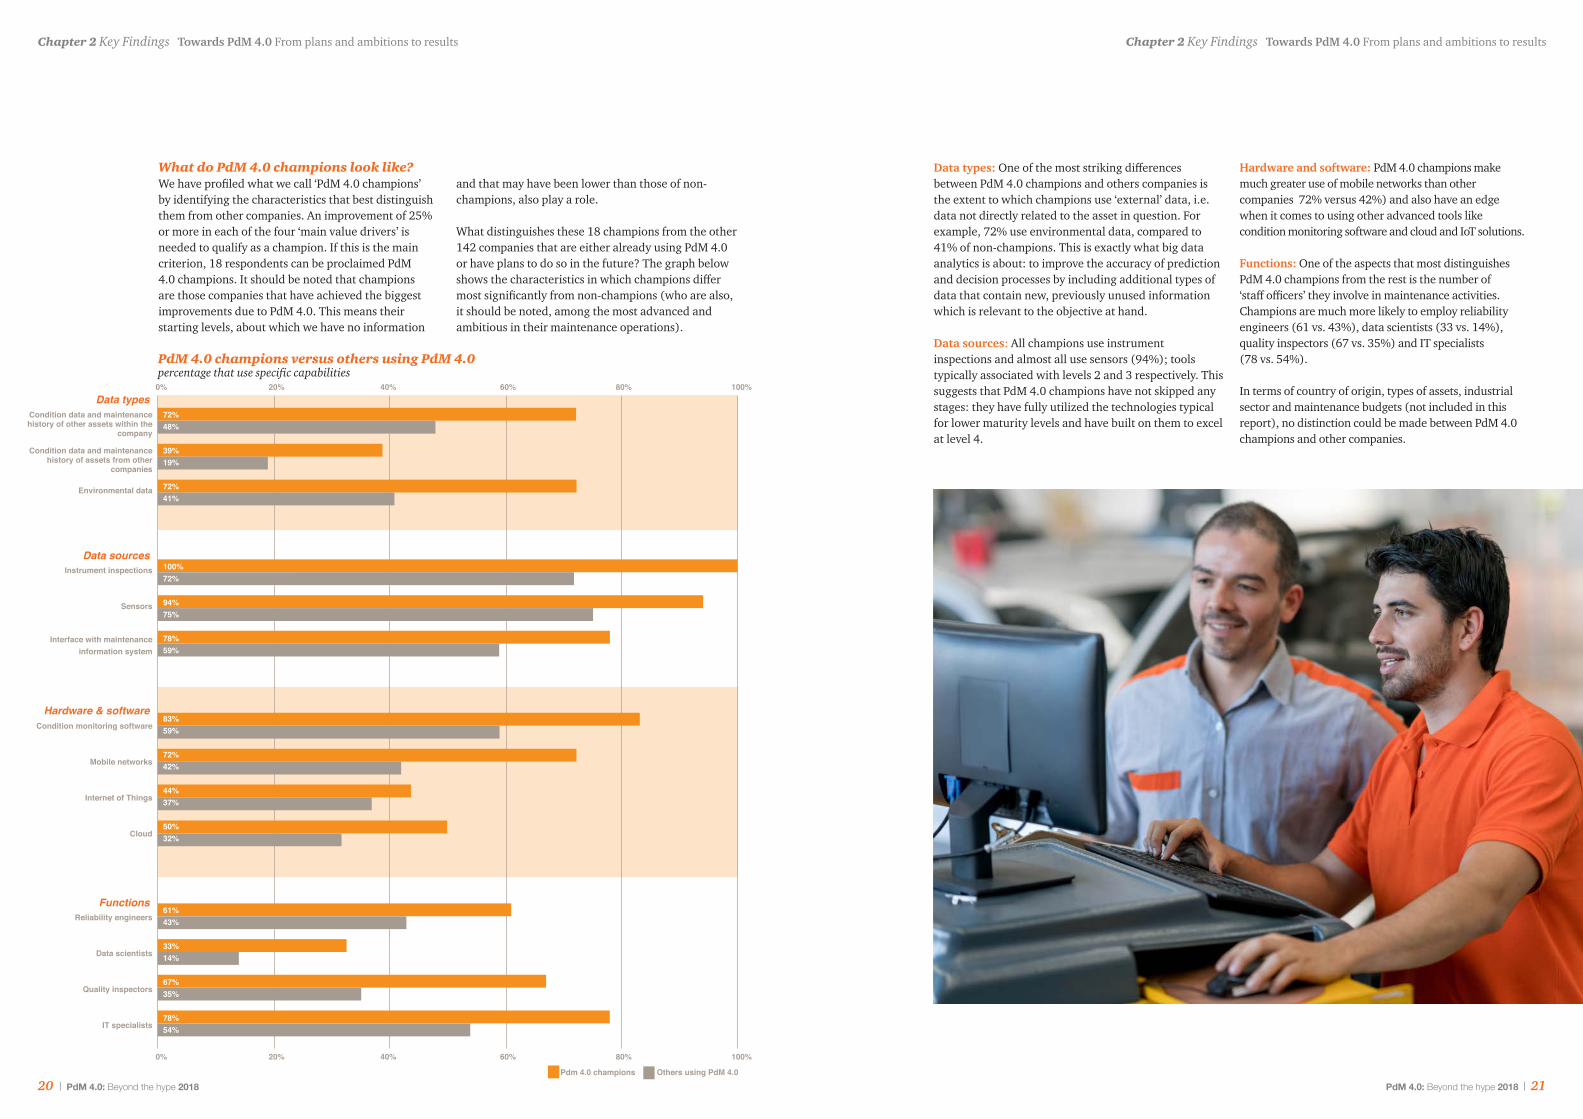
What do PdM 4.0 champions look like?We have profiled what we call ‘PdM 4.0 champions’ by identifying the characteristics that best distinguish them from other companies. An improvement of 25% or more in each of the four ‘main value drivers’ is needed to qualify as a champion. If this is the main criterion, 18 respondents can be proclaimed PdM 4.0 champions. It should be noted that champions are those companies that have achieved the biggest improvements due to PdM 4.0. This means their starting levels, about which we have no information
and that may have been lower than those of non-champions, also play a role.
What distinguishes these 18 champions from the other 142 companies that are either already using PdM 4.0 or have plans to do so in the future? The graph below shows the characteristics in which champions differ most significantly from non-champions (who are also, it should be noted, among the most advanced and ambitious in their maintenance operations).
Data types: One of the most striking differences between PdM 4.0 champions and others companies is the extent to which champions use ‘external’ data, i.e. data not directly related to the asset in question. For example, 72% use environmental data, compared to 41% of non-champions. This is exactly what big data analytics is about: to improve the accuracy of prediction and decision processes by including additional types of data that contain new, previously unused information which is relevant to the objective at hand.
Data sources: All champions use instrument inspections and almost all use sensors (94%); tools typically associated with levels 2 and 3 respectively. This suggests that PdM 4.0 champions have not skipped any stages: they have fully utilized the technologies typical for lower maturity levels and have built on them to excel at level 4.
Hardware and software: PdM 4.0 champions make much greater use of mobile networks than other companies 72% versus 42%) and also have an edge when it comes to using other advanced tools like condition monitoring software and cloud and IoT solutions.
Functions: One of the aspects that most distinguishes PdM 4.0 champions from the rest is the number of ‘staff officers’ they involve in maintenance activities. Champions are much more likely to employ reliability engineers (61 vs. 43%), data scientists (33 vs. 14%), quality inspectors (67 vs. 35%) and IT specialists (78 vs. 54%).
In terms of country of origin, types of assets, industrial sector and maintenance budgets (not included in this report), no distinction could be made between PdM 4.0 champions and other companies.
72%48%
39%19%
72%41%
Condition data and maintenance history of other assets within the
company
Condition data and maintenance history of assets from other
companies
Environmental data
Instrument inspections
Sensors
Interface with maintenance information system
Condition monitoring software
Mobile networks
Internet of Things
Cloud
Reliability engineers
Data scientists
Quality inspectors
IT specialists
100%72%
94%75%
78%59%
83%59%
72%42%
44%37%
50%32%
61%43%
33%14%
67%35%
78%54%
0% 20% 40% 60% 80% 100%
0% 20% 40% 60% 80% 100%Data types
Data sources
Hardware & software
Functions
PdM 4.0 champions versus others using PdM 4.0 percentage that use specific capabilities
Pdm 4.0 champions Others using PdM 4.0
20 | PdM 4.0: Beyond the hype 2018 PdM 4.0: Beyond the hype 2018 | 21
Chapter 2 Key Findings Towards PdM 4.0 From plans and ambitions to resultsChapter 2 Key Findings Towards PdM 4.0 From plans and ambitions to results
Developing the maintenance functionRichard Schouten: “As things stand, the main drivers for our success are factory uptime and safety. Downtime costs can amount to half a million euros per day in missed revenue, so we have reached a point where the benefits of reducing maintenance costs by a few percent are rather insignificant compared to those gained by improving uptime. Safety is our other main driver. We know we have aging assets and will gradually lose the knowledge needed to maintain them. We thus had to switch to predictive maintenance. This allows us to have fewer maintenance staff at the plants and provides much better insight into how factories operate. Predictive maintenance thus contributes to the safety of both people and processes.”
Sitech’s initial approach to predictive maintenanceRichard Schouten: “We started off simple. We assigned the task to Maurice, one of our reliability engineers at the time, and asked him to set up a pilot project. He identified a single,
but critical, pump as the piece of equipment for our pilot. This pilot turned out to be very successful because we can now predict when the pump will fail, include replacement activities in the regular maintenance schedule and thereby reduce downtime. We realise annual savings of around 60,000 euros for this pump alone, while the sensors and model development only cost a fraction of that.”
The business case for predictive maintenanceRichard Schouten: “We were able to finance our initial pilot projects because I strongly believed in the concept and was able to convince plant managers about our approach. We have implemented seven models in the past two years, which helped to put together a very convincing case to present to our customers. I estimate that we spent around 200,000 euros on our pilot projects, and that these delivered around half a million worth of uptime improvements and cost savings in return.”
Maurice Jilderda: “First and foremost, you have to believe in predictive maintenance as
a concept. Without this underlying belief, you can build any business case you want but will still have trouble convincing people. Secondly, downtime costs are huge in the chemical industry. This means costs for predictive maintenance pilots and implementations are often negligible compared to the benefits of improving safety, performance, reliability and energy consumption. If we need to quantify these benefits, we can do a quick scan of the assets in question and their performance and maintenance histories. We use both internal and external benchmark figures to estimate potential improvements.”
The roll-out of predictive maintenanceRichard Schouten: “We asked plant managers for funding to scale up and accelerate further implementation of predictive maintenance for all critical equipment. We originally planned to do this in five years, but were asked to do it in three. We are developing models and performing the roll-out for each type of equipment. For example, for all pumps of a certain type or for all heat exchangers at the
site. Even though rotary pumps, for example, may have different manufacturers and different specifications, they all operate on the same physical principles. We can thus employ similar sensors and models for all rotary pumps. We have now developed a predictive model for pumps and are currently rolling it out at the factories.”
Maurice Jilderda: “We have learned that in order to scale-up predictive maintenance and expand it to more assets and more sites, you have to keep it simple for asset owners. That is why we, together with an external partner, have developed a software solution that allows asset owners to connect their assets to our platform in a quick and automated manner. It’s a plug-and-play solution: for each asset, clients can search our library for a predictive model that fits their maintenance strategy, and quickly get started without major investments. This software has allowed us to make great strides in up-scaling predictive maintenance at the Chemelot site. But our vision goes beyond this. We want to work towards a complete Asset Performance Management solution that not
only includes maintenance and reliability, but also safety, process performance and energy consumption.”
The future Richard Schouten: “We want to apply predictive maintenance and data analytics to all critical and semi-critical equipment. The next step is to develop predictive models for processing units, which for example involve several pumps and filters working together with a heat exchanger. But we can only do this by making sure the models for each equipment type can communicate with each other. If, for example, a heat exchanger gets contaminated, the system must learn that it can be cleaned by pumping more volume through it and decide to do this by itself. We then want to apply the same concept to entire factories and eventually to the whole site. We want to move from an Asset Health Centre to a digital plant environment - that’s our ultimate dream.”
Maurice Jilderda: “Over the past year, we have been receiving requests to share our expertise in predictive maintenance from clients all over the
world. We have started the first pilot projects for clients outside Chemelot and, for one client, we have even established a direct data link that enables us to monitor their process in real time. This is really a big step. Everyone is always worried about confidentiality and security when it comes to sharing data, but together with our client we just did it and got started! We’re still in the pilot phase and a lot of obstacles still need to be overcome, but we’re confident of positive results if we can match the client’s data with our predictive models.”
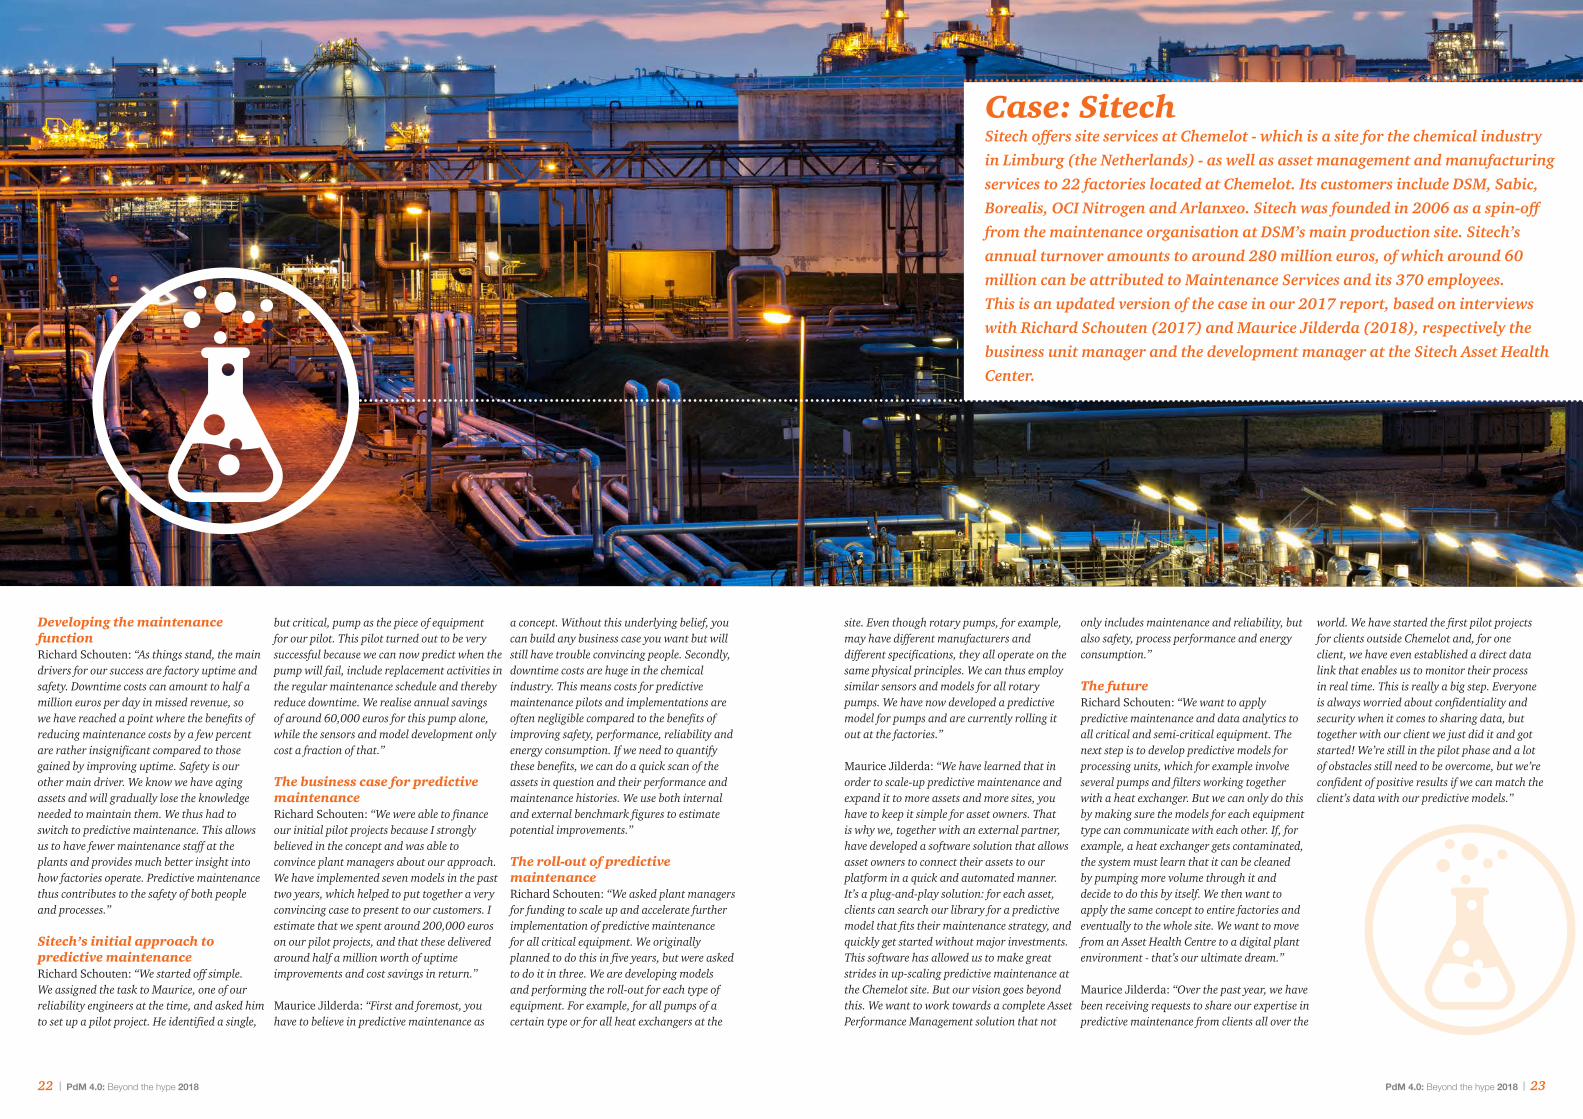
Case: SitechSitech offers site services at Chemelot - which is a site for the chemical industry in Limburg (the Netherlands) - as well as asset management and manufacturing services to 22 factories located at Chemelot. Its customers include DSM, Sabic, Borealis, OCI Nitrogen and Arlanxeo. Sitech was founded in 2006 as a spin-off from the maintenance organisation at DSM’s main production site. Sitech’s annual turnover amounts to around 280 million euros, of which around 60 million can be attributed to Maintenance Services and its 370 employees. This is an updated version of the case in our 2017 report, based on interviews with Richard Schouten (2017) and Maurice Jilderda (2018), respectively the business unit manager and the development manager at the Sitech Asset Health Center.
22 | PdM 4.0: Beyond the hype 2018 PdM 4.0: Beyond the hype 2018 | 23
Chapter 3 Recommendations
Getting the most out of PdM 4.0
The previous chapters show that many companies are ambitious when it comes to PdM 4.0. 60% of the companies we surveyed are either working on a PdM 4.0 implementation, have started a pilot project or have plans to get started in the foreseeable future. We have also seen that, despite considerable improvements in the past year, many companies’ current predictive maintenance capabilities are not yet at the level needed for PdM 4.0. Significant efforts and resources will thus be needed for companies to get the most out of PdM 4.0.
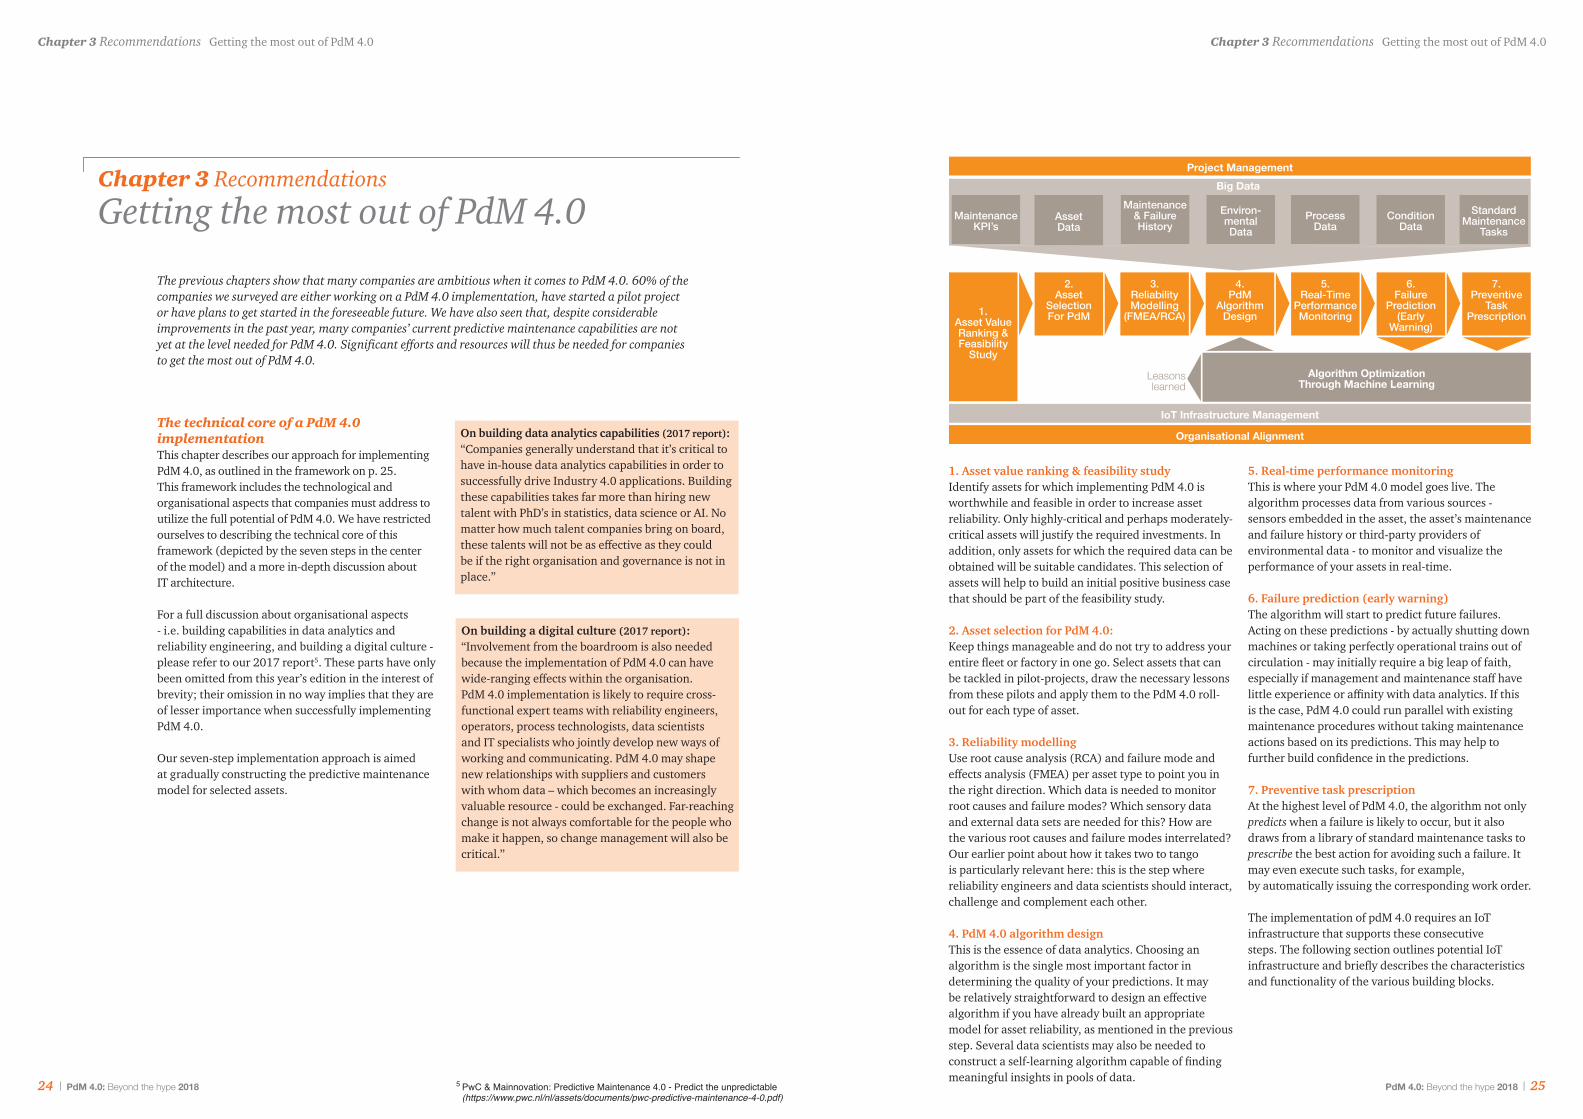
The technical core of a PdM 4.0 implementation This chapter describes our approach for implementing PdM 4.0, as outlined in the framework on p. 25. This framework includes the technological and organisational aspects that companies must address to utilize the full potential of PdM 4.0. We have restricted ourselves to describing the technical core of this framework (depicted by the seven steps in the center of the model) and a more in-depth discussion about IT architecture.
For a full discussion about organisational aspects - i.e. building capabilities in data analytics and reliability engineering, and building a digital culture - please refer to our 2017 report5. These parts have only been omitted from this year’s edition in the interest of brevity; their omission in no way implies that they are of lesser importance when successfully implementing PdM 4.0.
Our seven-step implementation approach is aimed at gradually constructing the predictive maintenance model for selected assets.
On building data analytics capabilities (2017 report):“Companies generally understand that it’s critical to have in-house data analytics capabilities in order to successfully drive Industry 4.0 applications. Building these capabilities takes far more than hiring new talent with PhD’s in statistics, data science or AI. No matter how much talent companies bring on board, these talents will not be as effective as they could be if the right organisation and governance is not in place.”
On building a digital culture (2017 report):“Involvement from the boardroom is also needed because the implementation of PdM 4.0 can have wide-ranging effects within the organisation. PdM 4.0 implementation is likely to require cross-functional expert teams with reliability engineers, operators, process technologists, data scientists and IT specialists who jointly develop new ways of working and communicating. PdM 4.0 may shape new relationships with suppliers and customers with whom data – which becomes an increasingly valuable resource - could be exchanged. Far-reaching change is not always comfortable for the people who make it happen, so change management will also be critical.”
Project ManagementBig Data
7.Preventive
Task Prescription
Organisational Alignment
IoT Infrastructure Management
Leasonslearned
Algorithm Optimization Through Machine Learning
6.Failure
Prediction(Early
Warning)
5.Real-Time
PerformanceMonitoring
4.PdM
AlgorithmDesign
2.Asset
Selection For PdM1.
Asset Value Ranking & Feasibility
Study
3.Reliability Modelling
(FMEA/RCA)
MaintenanceKPI’s
AssetData
Maintenance& FailureHistory
Environ-mentalData
ProcessData
ConditionData
StandardMaintenance
Tasks
1. Asset value ranking & feasibility study Identify assets for which implementing PdM 4.0 is worthwhile and feasible in order to increase asset reliability. Only highly-critical and perhaps moderately-critical assets will justify the required investments. In addition, only assets for which the required data can be obtained will be suitable candidates. This selection of assets will help to build an initial positive business case that should be part of the feasibility study.
2. Asset selection for PdM 4.0: Keep things manageable and do not try to address your entire fleet or factory in one go. Select assets that can be tackled in pilot-projects, draw the necessary lessons from these pilots and apply them to the PdM 4.0 roll-out for each type of asset.
3. Reliability modelling Use root cause analysis (RCA) and failure mode and effects analysis (FMEA) per asset type to point you in the right direction. Which data is needed to monitor root causes and failure modes? Which sensory data and external data sets are needed for this? How are the various root causes and failure modes interrelated? Our earlier point about how it takes two to tango is particularly relevant here: this is the step where reliability engineers and data scientists should interact, challenge and complement each other.
4. PdM 4.0 algorithm design This is the essence of data analytics. Choosing an algorithm is the single most important factor in determining the quality of your predictions. It may be relatively straightforward to design an effective algorithm if you have already built an appropriate model for asset reliability, as mentioned in the previous step. Several data scientists may also be needed to construct a self-learning algorithm capable of finding meaningful insights in pools of data.
5. Real-time performance monitoringThis is where your PdM 4.0 model goes live. The algorithm processes data from various sources - sensors embedded in the asset, the asset’s maintenance and failure history or third-party providers of environmental data - to monitor and visualize the performance of your assets in real-time.
6. Failure prediction (early warning) The algorithm will start to predict future failures. Acting on these predictions - by actually shutting down machines or taking perfectly operational trains out of circulation - may initially require a big leap of faith, especially if management and maintenance staff have little experience or affinity with data analytics. If this is the case, PdM 4.0 could run parallel with existing maintenance procedures without taking maintenance actions based on its predictions. This may help to further build confidence in the predictions.
7. Preventive task prescriptionAt the highest level of PdM 4.0, the algorithm not only predicts when a failure is likely to occur, but it also draws from a library of standard maintenance tasks to prescribe the best action for avoiding such a failure. It may even execute such tasks, for example, by automatically issuing the corresponding work order.
The implementation of pdM 4.0 requires an IoT infrastructure that supports these consecutive steps. The following section outlines potential IoT infrastructure and briefly describes the characteristics and functionality of the various building blocks.
5 PwC & Mainnovation: Predictive Maintenance 4.0 - Predict the unpredictable (https://www.pwc.nl/nl/assets/documents/pwc-predictive-maintenance-4-0.pdf)
24 | PdM 4.0: Beyond the hype 2018 PdM 4.0: Beyond the hype 2018 | 25
Chapter 3 Recommendations Getting the most out of PdM 4.0Chapter 3 Recommendations Getting the most out of PdM 4.0
• IT operation management involves implementing all functions needed to operate an IT function (it is very likely that such components are already present in the organization). Service activation (registering the user to an IT service), health monitoring, incident response and reporting are typical functions of this module.
• Analytics, Business Intelligence and reporting This is another key module in PdM 4.0 architecture. This calculation engine powers the solution and offers input for PdM 4.0 statistical models.
• Business Layer describes the core capabilities that the business needs to function. Having this as a separate layer allows a high degree of modularity and reuse to be realised in architecture and design. The results of PdM 4.0 are determined by the quality of data received from this business layer e.g. data from the plant maintenance module. Typical functions of this layer include: - Business facing/enabling components/services
i.e. specialized services that allow the various lines of business to perform their daily activities.
- General purpose shared/Enabling components/services: based on needs throughout the company, this layer identifies support services like workflow management, collaboration, scanning, printing etc.
- Internal components/services i.e. services that improve the performance of internal processes and internal users in the organization, e.g. Finance & Accounting, HR management etc.
• Presentation layer reformats user output to enable multi-channel capabilities.
• Access channels e.g. web, mobile, augmented reality visors, etc. are located and managed at this level.
• End to end security. This is another key component of the overall architecture. Although not actually a component per se, it is an aspect that must be taken in consideration. As already pointed stated, evolutions in IoT and Industry 4.0 have resulted in a level of data sharing and interconnectivity that has never been witnessed previously. The opportunities associated with this approach are also accompanied by challenges. For instance, when more devices are connected, a higher risk of hacking and breaches may also be encountered
Risks associated with adopting PdM 4.0 can be mitigated by adopting this proposed architecture, which has proved successful in the majority of cases. However, successful implementation of PdM 4.0 cannot be guaranteed by following this design alone. For instance, it must also be accompanied by strong IT governance (supported by the management) and an overall cultural shift. Cultural barriers are usually regarded as a potential risk factor in the digitalization journey. However, the first step towards tearing down such barriers could be taken by using an IT-based approach, implementing the proposed architecture and adopting an innovative mindset (e.g. ensuring agile software development).
The role of IoT infrastructure in PdM 4.0 implementationsIoT infrastructure plays a key role in the process for implementing PdM 4.0, and in operational excellence in general. It is clear that most of the underlying technologies that make PdM 4.0 possible have originated from the IT world, like big data, advanced analytics and cloud computing. On the other hand, unnecessary complications could be triggered by the proliferation of similar and competing solutions, the presence of existing legacy software and the need to connect with the inherently heterogeneous world of IT (various sensors, LoRa, Wifi, distributed control systems (DCS’s) and programmable logic controllers (PLC’s).
Other complications include data being in proprietary format and the use of different communication protocols. This can easily lead to cost overshoots and eventually to false starts and disappointments. It is necessary to adopt meaningful governance and design a proper IoT architecture if PdM 4.0 is to be successful. This will allow IT to become a powerful ally in this fascinating journey of connectivity.
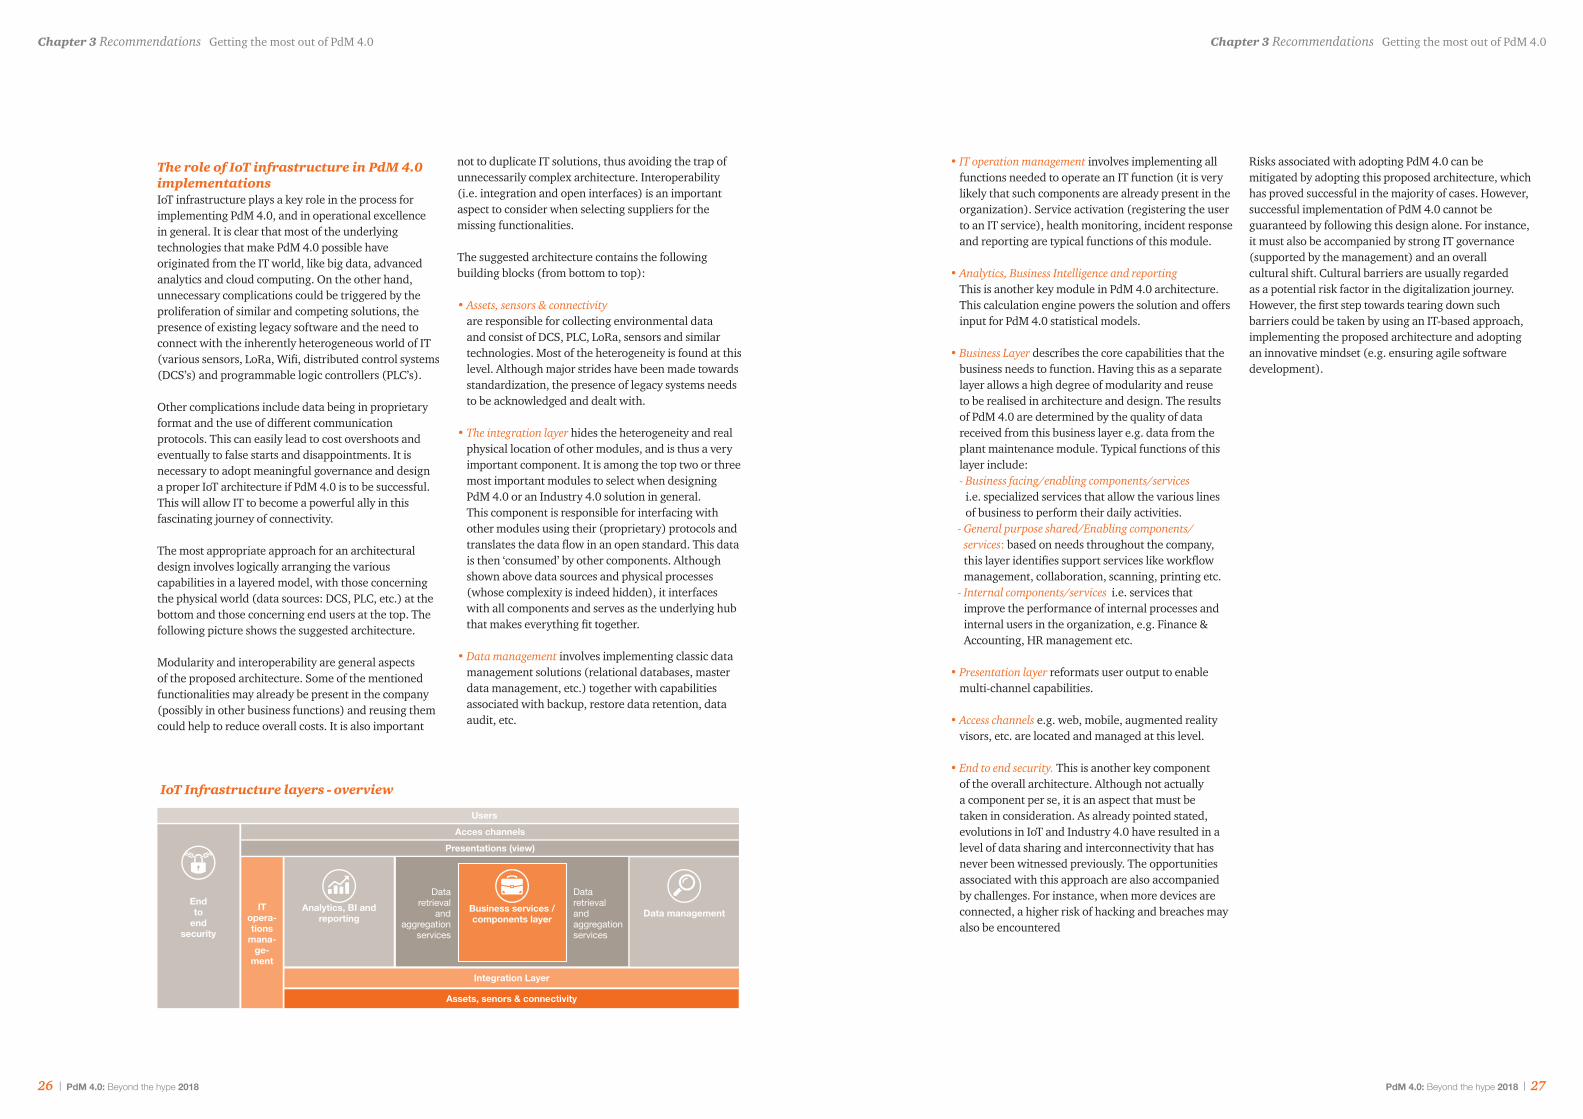
The most appropriate approach for an architectural design involves logically arranging the various capabilities in a layered model, with those concerning the physical world (data sources: DCS, PLC, etc.) at the bottom and those concerning end users at the top. The following picture shows the suggested architecture.
Modularity and interoperability are general aspects of the proposed architecture. Some of the mentioned functionalities may already be present in the company (possibly in other business functions) and reusing them could help to reduce overall costs. It is also important
not to duplicate IT solutions, thus avoiding the trap of unnecessarily complex architecture. Interoperability (i.e. integration and open interfaces) is an important aspect to consider when selecting suppliers for the missing functionalities.
The suggested architecture contains the following building blocks (from bottom to top):
• Assets, sensors & connectivity are responsible for collecting environmental data and consist of DCS, PLC, LoRa, sensors and similar technologies. Most of the heterogeneity is found at this level. Although major strides have been made towards standardization, the presence of legacy systems needs to be acknowledged and dealt with.
• The integration layer hides the heterogeneity and real physical location of other modules, and is thus a very important component. It is among the top two or three most important modules to select when designing PdM 4.0 or an Industry 4.0 solution in general. This component is responsible for interfacing with other modules using their (proprietary) protocols and translates the data flow in an open standard. This data is then ‘consumed’ by other components. Although shown above data sources and physical processes (whose complexity is indeed hidden), it interfaces with all components and serves as the underlying hub that makes everything fit together.
• Data management involves implementing classic data management solutions (relational databases, master data management, etc.) together with capabilities associated with backup, restore data retention, data audit, etc.
Assets, senors & connectivity
Acces channelsPresentations (view)
Users
Integration Layer
Endto
endsecurity
ITopera-tions
mana-ge-
ment
Analytics, BI and reporting Data managementBusiness services /
components layer
Data retrievalandaggregationservices
Data retrieval
andaggregation
services
IoT Infrastructure layers - overview
26 | PdM 4.0: Beyond the hype 2018 PdM 4.0: Beyond the hype 2018 | 27
Chapter 3 Recommendations Getting the most out of PdM 4.0Chapter 3 Recommendations Getting the most out of PdM 4.0

Chapter 4 Call to Action
Chapter 4 Call to action
1. Plot your PdM 4.0 strategyEvaluate your current PdM maturity level and set targets for the next five years that bring value to your business and that are consistent with your overall strategy. Make sure that company leadership is ready and willing to champion your approach.
2. Create inital pilot projectsSelect asset types suitable for a PdM 4.0 pilot and use them to establish proof of concept and to demonstrate business value. Create cross-functional teams and provide them with sufficient resources and the freedom to pioneer new ways of working. With evidence from early successes, you can gain buy-in from the organisation and secure funding for a larger rollout.
3. Define the capabilities you needUse the lessons learned from your pilot projects to map out in detail what capabilities you need to achieve your targets. Develop strategies for improving processes and for implementing new technologies. Your biggest constraint may well be your ability to recruit the people needed to put PdM 4.0 in place.
4. Become a virtuoso in data analyticsYour success with PdM 4.0 will depend on skills and knowledge. It is not enough to just recruit and develop talent; governance is also important. Create an environment where data scientists and reliability engineers can feed off each other’s expertise.
5. Transform into a digital maintenance organisationDeploy PdM 4.0 across your asset base and become truly data-driven in your decision-making. Continue to develop the support structure - master data management, data analytics platform, IoT infrastructure - in order to keep up with your progress in PdM 4.0.
6. Actively plan an ecosystem approachAs you become more mature in PdM 4.0, foster collaboration with suppliers, research centers and other external partners in order to keep up with the latest developments. Develop interfaces and benefit sharing models with partners in your ecosystem to generate even more value with PdM 4.0.
Plot yourPdM 4.0strategy
Create inital pilot projects
Define the capabilities you
need
Become a virtuoso in data
analytics
Transform into a digital maintenance organisation
Actively plan an ecosystem
approach
1 2 3 4 5 6
If the findings and ideas presented in this report have inspired you, follow the six steps in our blueprint for digital success and become a PdM 4.0 champion.
Blueprint for PdM 4.0 success
28 | PdM 4.0: Beyond the hype 2018 PdM 4.0: Beyond the hype 2018 | 29
Chapter 4 Call to action Chapter 4 Call to action
About the surveyAbout the survey
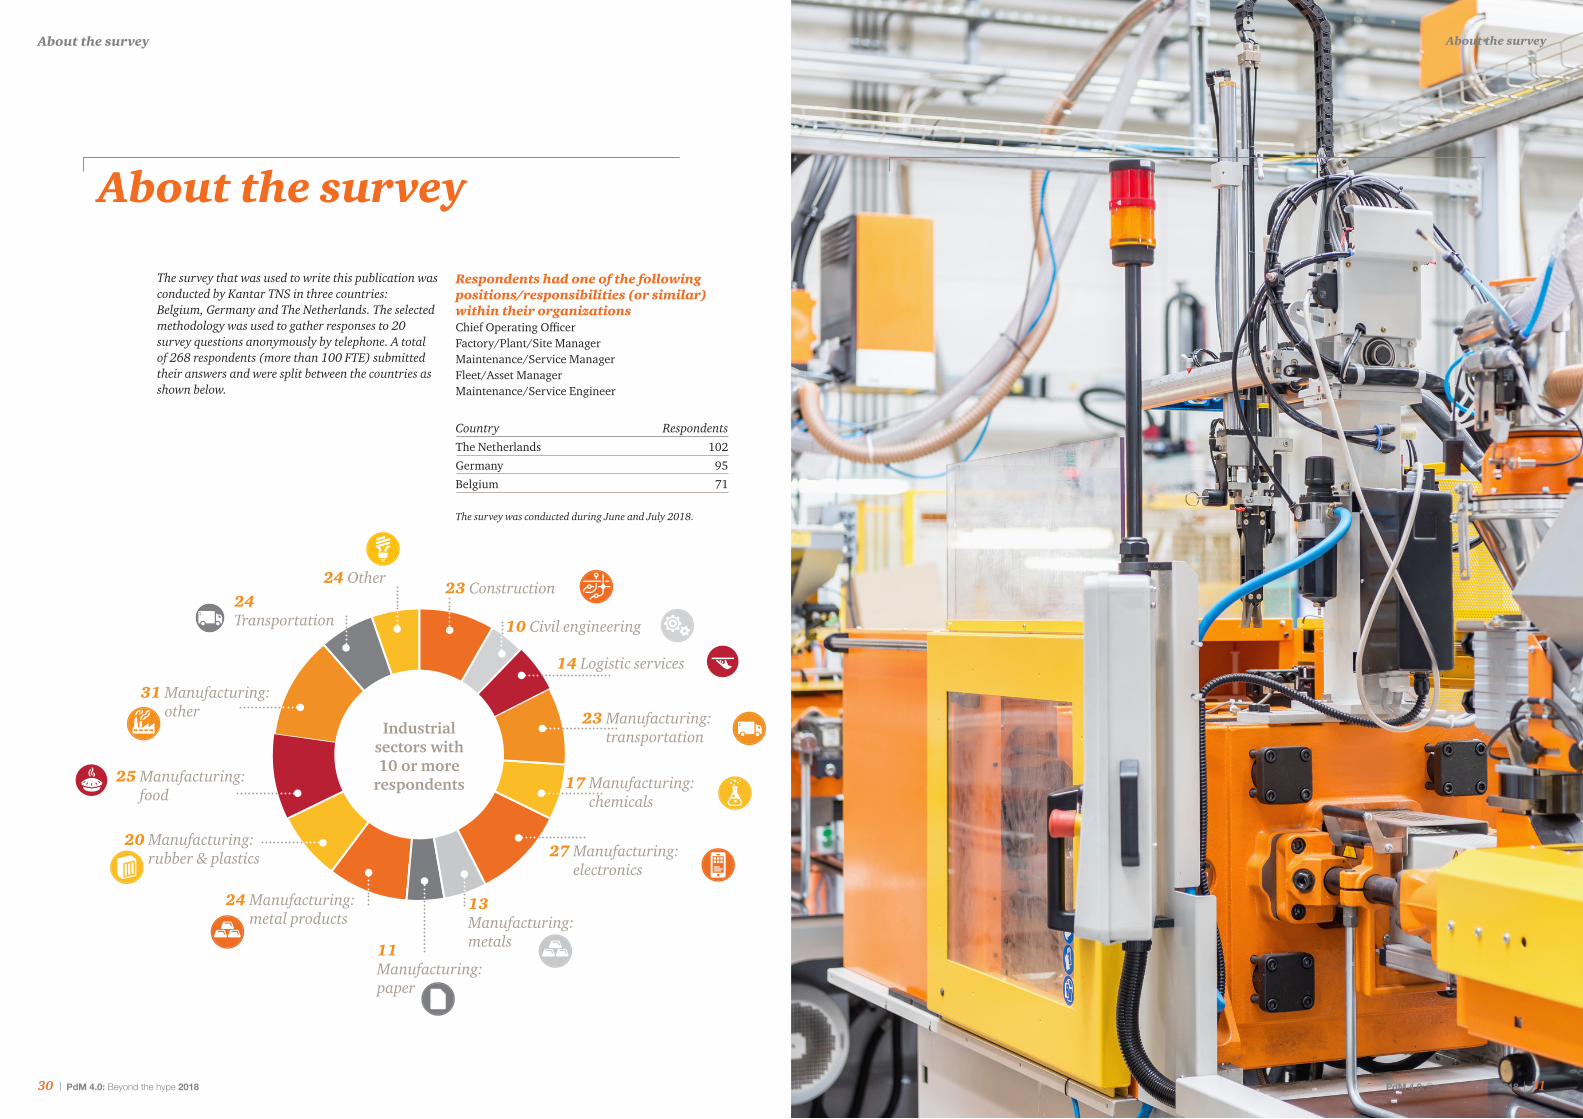
The survey that was used to write this publication was conducted by Kantar TNS in three countries:Belgium, Germany and The Netherlands. The selected methodology was used to gather responses to 20 survey questions anonymously by telephone. A total of 268 respondents (more than 100 FTE) submitted their answers and were split between the countries as shown below.
Respondents had one of the following positions/responsibilities (or similar) within their organizationsChief Operating OfficerFactory/Plant/Site ManagerMaintenance/Service ManagerFleet/Asset ManagerMaintenance/Service Engineer
Country RespondentsThe Netherlands 102
Germany 95
Belgium 71
The survey was conducted during June and July 2018.
About the survey
27 Manufacturing: electronics
17 Manufacturing: chemicals
23 Manufacturing: transportation
14 Logistic services
10 Civil engineering
23 Construction24 Other
24Transportation
31 Manufacturing: other
25 Manufacturing: food
20 Manufacturing: rubber & plastics
24 Manufacturing: metal products
11 Manufacturing: paper
13Manufacturing: metals
Industrial sectors with 10 or more
respondents
30 | PdM 4.0: Beyond the hype 2018 PdM 4.0: Beyond the hype 2018 | 31

Contacts
PdM 4.0 Contacts
MainnovationMark Haarmanmanaging partnerT: +31 (0)78 614 6724M: [email protected]
MainnovationPeter DecaignypartnerT: +32 (0)473 55 6614 M: [email protected]
PwC The NetherlandsMichel Mulderspartner & industry leader Industrial ManufacturingT: +31 (0)6 1263 1745M: [email protected]
PwC GermanyMichael BrunspartnerT: +49 (0)21 1981 4721M: [email protected]
MainnovationPieter de Klerkexecutive consultantT: +31 (0)6 21 55 33 14M: [email protected]
PwC BelgiumMatthias ReyntjenspartnerT: +32 (0)9 268 8066M: [email protected]
32 | PdM 4.0: Beyond the hype 2018 PdM 4.0: Beyond the hype 2018 | 33
Acknowledgements
Authors of the report
MainnovationMark Haarmanmanaging partnerT: +31 (0)78 614 6724M: [email protected]
MainnovationPieter de Klerkexecutive consultantT: +31 (0)6 21 55 33 14M: [email protected]
MainnovationPeter DecaignypartnerT: +32 (0)473 55 6614 M: [email protected]
PwCMichel Mulderspartner & industry leader Industrial ManufacturingT: +31 (0)88 792 3165M: [email protected]
PwCCostas Vassiliadis, PhDsenior manager Data Analytics and OperationsT: +31 (0)6 2009 5372M: [email protected]
PwCHedwich Sijtsema senior manager Data AnalyticsT: +31 (0)6 5151 2298M: [email protected]
PwC EuropeIvan Gallosenior manager Digital Operations Impact CenterT: +49 (0)170 81 58 275M: [email protected]
Editorial BoardHedwich Sijtsema
Data analysisMark HaarmanPieter de KlerkCostas VassiliadisHedwich SijtsemaCoen Hennipman
Text editorJeroen Kerkhof
Project managementAlette Marbus
Market researchKantar TNS
34 | PdM 4.0: Beyond the hype 2018 PdM 4.0: Beyond the hype 2018 | 35
Acknowledgements

© 2018 PricewaterhouseCoopers B.V. (KvK 34180289) and Mainnovation (KvK 14067715). All rights reserved. No part of this publication may be reproduced, stored in a retrieval system, or transmitted in any form or by any means, electronic, mechanical, photocopying, recording, or otherwise, without the prior written permission of the publisher. PwC refers to the PwC network and/or one or more of its member firms, each of which is a seprate legal entity. Please see www.pwc.com/structure for further details.