Predictive gravity models of livestock mobility in ...
21
RESEARCH ARTICLE Predictive gravity models of livestock mobility in Mauritania: The effects of supply, demand and cultural factors Gae ¨ lle Nicolas 1 *, Andrea Apolloni 2 , Caroline Coste 3 , G. R. William Wint 4 , Renaud Lancelot 2 , Marius Gilbert 1,3 1 Spatial Epidemiology Lab (SpELL), Universite ´ Libre de Bruxelles, Brussels, Belgium, 2 International Center for Agronomic Research and Development, CIRAD, Montpellier, France, 3 Fonds National de la Recherche Scientifique, Brussels, Belgium, 4 Environmental Research Group Oxford (ERGO)—Department of Zoology, University of Oxford, Oxford, United Kingdom * [email protected] Abstract Animal movements are typically driven by areas of supply and demand for animal products and by the seasonality of production and demand. As animals can potentially spread infec- tious diseases, disease prevention can benefit from a better understanding of the factors influencing movements patterns in space and time. In Mauritania, an important cultural event, called the Tabaski (Aïd el Kebir) strongly affects timing and structure of movements, and due to the arid and semi-arid climatic conditions, the season can also influence move- ment patterns. In order to better characterize the animal movements patterns, a survey was carried out in 2014, and those data were analysed here using social network analysis (SNA) metrics and used to train predictive gravity models. More specifically, we aimed to contrast the movements structure by ruminant species, season (Tabaski vs. Non-Tabaski) and mode of transport (truck vs. foot). The networks differed according to the species, and to the season, with a changed proportion of truck vs. foot movements. The gravity models were able to predict the probability of a movement link between two locations with moderate to good accuracy (AUC ranging from 0.76 to 0.97), according to species, seasons, and mode of transport, but we failed to predict the traded volume of those trade links. The significant predictor variables of a movement link were the human and sheep population at the source and origin, and the distance separating the locations. Though some improvements would be needed to predict traded volumes and better account for the barriers to mobility, the results provide useful predictions to inform epidemiological models in space and time, and, upon external validation, could be useful to predict movements at a larger regional scale. Introduction Many factors that may influence the dynamics and transmission of infectious diseases have been rapidly changing over the last decades. Alongside climate and land use changes, often considered in emerging infectious diseases literature as main drivers, other factors such as the PLOS ONE | https://doi.org/10.1371/journal.pone.0199547 July 18, 2018 1 / 21 a1111111111 a1111111111 a1111111111 a1111111111 a1111111111 OPEN ACCESS Citation: Nicolas G, Apolloni A, Coste C, Wint GRW, Lancelot R, Gilbert M (2018) Predictive gravity models of livestock mobility in Mauritania: The effects of supply, demand and cultural factors. PLoS ONE 13(7): e0199547. https://doi.org/ 10.1371/journal.pone.0199547 Editor: Rachata Muneepeerakul, University of Florida, UNITED STATES Received: December 20, 2017 Accepted: June 8, 2018 Published: July 18, 2018 Copyright: © 2018 Nicolas et al. This is an open access article distributed under the terms of the Creative Commons Attribution License, which permits unrestricted use, distribution, and reproduction in any medium, provided the original author and source are credited. Data Availability Statement: Data are part of a previously published study referred as Apolloni et al. (2018) and available on: https://doi.org/10. 5061/dryad.v4m56. The full citation of the previously published work is: Apolloni A, Nicolas G, Coste C, EL Mamy AB, Yahya B, EL Arbi AS, Baba Gueya M, Baba D, Gilbert M, Lancelot R (2018). Towards the description of livestock mobility in Sahelian Africa: Some results from a survey in Mauritania. PLOS ONE 13(1): e0191565.
Transcript of Predictive gravity models of livestock mobility in ...

RESEARCH ARTICLE
Predictive gravity models of livestock mobility
in Mauritania: The effects of supply, demand
and cultural factors
Gaelle Nicolas1*, Andrea Apolloni2, Caroline Coste3, G. R. William Wint4,
Renaud Lancelot2, Marius Gilbert1,3
1 Spatial Epidemiology Lab (SpELL), Universite Libre de Bruxelles, Brussels, Belgium, 2 International Center
for Agronomic Research and Development, CIRAD, Montpellier, France, 3 Fonds National de la Recherche
Scientifique, Brussels, Belgium, 4 Environmental Research Group Oxford (ERGO)—Department of Zoology,
University of Oxford, Oxford, United Kingdom
Abstract
Animal movements are typically driven by areas of supply and demand for animal products
and by the seasonality of production and demand. As animals can potentially spread infec-
tious diseases, disease prevention can benefit from a better understanding of the factors
influencing movements patterns in space and time. In Mauritania, an important cultural
event, called the Tabaski (Aïd el Kebir) strongly affects timing and structure of movements,
and due to the arid and semi-arid climatic conditions, the season can also influence move-
ment patterns. In order to better characterize the animal movements patterns, a survey was
carried out in 2014, and those data were analysed here using social network analysis (SNA)
metrics and used to train predictive gravity models. More specifically, we aimed to contrast
the movements structure by ruminant species, season (Tabaski vs. Non-Tabaski) and
mode of transport (truck vs. foot). The networks differed according to the species, and to the
season, with a changed proportion of truck vs. foot movements. The gravity models were
able to predict the probability of a movement link between two locations with moderate to
good accuracy (AUC ranging from 0.76 to 0.97), according to species, seasons, and mode
of transport, but we failed to predict the traded volume of those trade links. The significant
predictor variables of a movement link were the human and sheep population at the source
and origin, and the distance separating the locations. Though some improvements would be
needed to predict traded volumes and better account for the barriers to mobility, the results
provide useful predictions to inform epidemiological models in space and time, and, upon
external validation, could be useful to predict movements at a larger regional scale.
Introduction
Many factors that may influence the dynamics and transmission of infectious diseases have
been rapidly changing over the last decades. Alongside climate and land use changes, often
considered in emerging infectious diseases literature as main drivers, other factors such as the
PLOS ONE | https://doi.org/10.1371/journal.pone.0199547 July 18, 2018 1 / 21
a1111111111
a1111111111
a1111111111
a1111111111
a1111111111
OPENACCESS
Citation: Nicolas G, Apolloni A, Coste C, Wint
GRW, Lancelot R, Gilbert M (2018) Predictive
gravity models of livestock mobility in Mauritania:
The effects of supply, demand and cultural factors.
PLoS ONE 13(7): e0199547. https://doi.org/
10.1371/journal.pone.0199547
Editor: Rachata Muneepeerakul, University of
Florida, UNITED STATES
Received: December 20, 2017
Accepted: June 8, 2018
Published: July 18, 2018
Copyright: © 2018 Nicolas et al. This is an open
access article distributed under the terms of the
Creative Commons Attribution License, which
permits unrestricted use, distribution, and
reproduction in any medium, provided the original
author and source are credited.
Data Availability Statement: Data are part of a
previously published study referred as Apolloni
et al. (2018) and available on: https://doi.org/10.
5061/dryad.v4m56. The full citation of the
previously published work is: Apolloni A, Nicolas G,
Coste C, EL Mamy AB, Yahya B, EL Arbi AS, Baba
Gueya M, Baba D, Gilbert M, Lancelot R (2018).
Towards the description of livestock mobility in
Sahelian Africa: Some results from a survey in
Mauritania. PLOS ONE 13(1): e0191565.

distribution, growth and connectivity of human populations have also been changing rapidly
as result of demographic transitions, conflicts or migrations. Similarly, the distribution and
connectivity of traded animal populations are strongly influenced by agricultural intensifica-
tion and changes in trade patterns. The combined effect of these societal and environmental
changes taking place simultaneously is difficult to assess, but some, particularly mobility of
livestock and traditional trading practices, have been associated with the emergence and the
spread of infectious diseases [1–4], and can have strong socio-economic impacts [5,6]. In addi-
tion to these long-term trends, culture and tradition strongly shape societies at national,
regional and global scale. For example, human population movement during specific periods
such as Chinese Spring Festival [7], annual holidays [8], or religious feast around Christmas,
Ramadan, Thanksgiving or Hindu Holy feast are known to cause substantially affect global
mobility [9] with significant economic and epidemiological implications [10–12]. Large move-
ments of animal populations are also linked to changes in the spatial pattern of food demand,
which is anticipated by the market. In low-income countries, such as Sahelian African coun-
tries, rapid changes in demand for animal products linked to cultural and traditional events
therefore leads to a large number of animals–notably sheep, being slaughtered to meet the
seasonal food demand. As a consequence, in the months and weeks preceding such events,
trading of live animals is particularly intense. Due to the dry ecoclimate of the Sahelian area,
agriculture and breeding strongly depend on the amount of rainfall and the availability of
pasture. As a consequence, successive droughts also dramatically affect the Livestock flow.
Another example is Madagascar, where kapsile is a traditional practice consisting in an animal
barters linked to the labour need in a period when breeders are cash-poor and which strongly
affects the patterns of trade flows [3,13]. In West Africa, similar practices, called loans, have
been described as a large number of short term animal exchanges for reproduction, food sup-
ply through milk production, animal traction, etc [14]. In Mauritania, the Muslim feast of
Tabaski or Aïd el-Kebir, is a major cultural and traditional event that strongly influence trad-
ing patterns and could have major impact on the spread of diseases. On this occasion, young
rams are slaughtered in most families on the 10th day of the month "dhou al-hija", a religious
holiday during the last month of the Muslim (lunar) calendar. The date of this festival changes
each year according to the Gregorian (solar) calendar and strongly structures the volume of
traded sheep during the year. Annual and seasonal differences are thus observed in the sheep
trade flows. The country, and the whole Sahel, was hit by severe droughts in the 1960’s, 70’s
and 80’s, and more limited droughts later on till 2017 [15]. The drought of 1970 was the main
climatic event for the area. Since then, the area has been mostly in deficit of rainfall [16]. The
series of droughts had a profound impact on the livestock (affecting 2/3 of the production)
and human population. Cattle population dropped, whilst the population of small ruminants
increased, the latter being more robust than the former to harsh climatic conditions. Apolloni
et al. [17] described the livestock trading mobility for the year 2014 in Mauritania, highlighting
that the main trading peak related to the Tabaski took place between August and December.
During this period, the price of male lambs sharply increased, and the high demand strongly
affected the trading network structure.
In this paper, we aimed to understand how the Tabaski festivity changed the trade network
in Mauritania compared to the rest of the year. Apolloni et al. [17] provided a comprehensive
study of the Mauritania survey data, characterizing the seasonal trade network and ruminant
flows within Mauritania, and between Mauritania and the neighboring countries. Here, we
first provided a complementary description of inner flows using social network analysis indi-
cators, by contrasting the Tabaski and non-Tabaski periods, the different ruminant species
and modes of transport. Second, we developed predictive models to estimate the probability of
a trade connection between two spatial units (areas around markets and/or farms, etc.) based
Livestock mobility in Mauritania
PLOS ONE | https://doi.org/10.1371/journal.pone.0199547 July 18, 2018 2 / 21
Funding: This study was funded by EU grant FP7-
613996 VMERGE and is catalogued by the
VMERGE Steering Committee as VMERGE000
(http://www.vmerge.eu). The contents of this
publication are the sole responsibility of the
authors and don’t necessarily reflect the views of
the European Commission.
Competing interests: The authors have declared
that no competing interests exist.

on their potential production and demand characteristics and different measures of the cost
distance between them.
Material and methods
Study area
Mauritania is situated in the hyper-arid (Sahara) and arid (Sahel) ecozones [18], with low
annual rainfall (0–400 mm) concentrated in a short rainy season (June-September). In the
northern part of the country, the driest one, only short-cycle plants grow. Livestock, mainly
camels and small ruminants, are reared moving around available water points and grazing
areas. The southern area, more humid and greener is mostly exploited by transhumant herds.
Most of cattle population, being less mobile and demanding more water and nutrients, is con-
centrated in the southern area, mainly in the region around the river Senegal. Because of the
harsh conditions, mobility is a key aspect of animal rearing in Mauritania. Animals are moved
almost continuously among grazing areas to optimize the consumption of good quality nutri-
ents. In the absence of slaughterhouses, stocking facilities and road infrastructures, animals are
traded alive and butchered at consumption markets.
Past droughts indirectly contributed to the growth of cities, in particular Nouakchott, due
to the migration of previous farmers and herders from the countryside to urban areas in search
of jobs. Because of this, Nouakchott, the capital city has seen its population dramatically
exploding during and following the drought years. As of today, almost one quarter of the total
population lives in the capital city (National Bureau of statistics http://www.ons.mr/) Maurita-
nia is still recovering from the latest food crisis in 2011, affecting almost 1 million of its habi-
tants. In 2018, the drought indicators were at the same levels as those of 2012, indicating that
the food emergency is not completely over. The inadequate levels of rainfall and the continu-
ous threat of the droughts force herders to sell their livestock, in particular small ruminants,
due to shortages of suitable feeding areas.
Data collection
A survey among veterinary officers was conducted in June 2015 by the National Office for Live-
stock Research and Development (ONARDEL) to collect their knowledge of ruminant trade
flows as reported in Apolloni et al. [17]. The survey aimed to monitor the movement patterns
during the year 2014. Its results were recorded as a series of trade flow events, with the following
information: i) the origin, ii) the destination, iii) the type of trade movement (farm, transit, mar-
ket), iv) the frequency (annual, monthly, weekly), v) the species (cattle–Bos indicus, sheep, goat
or camel—Camelus dromedarius), vi) the number of heads, vii) the date of the starting of the
event, viii) the transportation mode (by truck or on foot) and ix) the latitude/longitude coordi-
nates of the origin and destination. Three types of movements were recorded: i) between pasto-
ral areas for grazing and/or reproduction, ii) from farm to market, iii) or from market to
market. Transhumance movements aiming to gradually move herds for suitable pasture areas
were not included. The database was cross-checked against sanitary certificates, the scientific
documents describing transhumance patterns, and the knowledge of veterinarian staff [17].
Both national and international trade-flows were recorded and the transboundary movements
were double-checked through surveys on transit sites between Senegal and Mauritania.
Additional data
In 2013, the Ministry for Rural Development and Environment reported a population of 16.8
million sheep and goats, 1.8 million cattle, and 1.4 million camels for Mauritania to FAOSTAT
Livestock mobility in Mauritania
PLOS ONE | https://doi.org/10.1371/journal.pone.0199547 July 18, 2018 3 / 21

[19]. Accordingly, and because no finer data was available at national level, we used the most
recent version of the Gridded Livestock of the World database (GLW), where the subnational
livestock statistics for Mauritania dates back to 2007, and were adjusted to match the FAO-
STAT 2010 national totals [20,21]. The WorldPop database was used for the human popula-
tion [22]. Both databases were aggregated at a spatial resolution of 0.083333 decimal degrees
(i.e. approximately 10 km at the equator) (Fig 1). To estimate the cost paths potentially affect-
ing mobility between different localities, we considered two main data sources: the friction
layer of Nelson accessibility map, which quantifies the time needed to travel through each
pixel [23], and the elevation from the GTOPO30 database (https://lta.cr.usgs.gov/GTOPO30).
Analysis
In this study, we only considered inner movements of cattle, camels, sheep and goats within
Mauritania.
Social network analysis (SNA) [24] have proved to be of significant interest in animals
movements analyses in the past decade [25–28]. Here, it was first used to describe the trade
networks according to the species, the transport modality (using truck vs. walking), and the
season (Tabaski vs. non-Tabaski). These mentioned periods were defined as strongly influenc-
ing the livestock flow within the country by Apolloni et al. [17] who investigated the dataset
regarding the occurrence of the Muslim festival for the year 2014. A set of network parameters
were estimated for the different networks using the simplified definition provided in Wasser-
man and Faust, (1994) [24]:
Fig 1. Population of human and ruminants in Mauritania. The size of the circle are proportional to the number of head located within the
Voronoï polygon related to the spatial location of the trading network.
https://doi.org/10.1371/journal.pone.0199547.g001
Livestock mobility in Mauritania
PLOS ONE | https://doi.org/10.1371/journal.pone.0199547 July 18, 2018 4 / 21

• Diameter: a network-level parameter representing the greatest number of links in the short-
est path between two nodes.
• Average path length: a network-level parameter measuring the average number of steps
along the shortest paths of all possible nodes pairs, i.e. the average number of nodes an actor
has to trade through to connect to any other node.
• The clustering coefficient: a node-level parameter of the density of local ties. It measures the
probability that neighboring nodes of a node are connected.
• The density: a network-level parameter measuring the proportion of observed links among
the possible links between nodes, and indicates how strongly a network is connected.
• Average degree: a network-level parameter quantifying the average number of links con-
nected with a node in a network. Besides these global measures, other centrality measures
highlighting the prominent role of nodes in the network were considered: node’s in- and
out-degree (the number of connection towards and from each node), node’s in and out-
weight (the volume of animal towards and from each node); node’s betweenness (the num-
ber of shortest path passing through the node) and node’s eigenvector centrality (scoring the
importance of nodes).
Network’s vulnerability to target removal of nodes based on centrality measures and esti-
mates of the size of the largest connected component were tested. The removal of specific
nodes, and their links, cause the network to fragment in a set of smaller subnetworks. The size
of the largest component can be thought as the maximum extent a disease can spread after the
implementation of the control measure (vaccination of animal in the areas surrounding the
nodes, market closure, etc.) [29]. Volkova et al. (2010) [30] introduced the notion of epidemic
threshold (q) in veterinarian epidemiology. This parameter estimates the (minimum) proba-
bility for a disease to be transmitted from one node to another to trigger an epidemic. The low-
est the epidemic threshold the higher is the risk of an epidemics. This quantity depends on the
heterogeneity of the network and the weight’s distribution. In the case of a weighted network
the epidemic threshold can be estimated as:
q ¼hwouti
hwin � wouti
Where h i indicates the average value and win, wout indicate node’s in- and out-weight,
respectively. Following the same procedure as in Lancelot et al. (2017) [31], the invasion
threshold for each month were estimated. Highlight on the role of occasional links were given
(connections appearing just once per year).
We plotted path intersections between different species, transports modalities and seasons,
to highlight possible common or specific links for different combinations. In addition, metrics
quantifying these intersections were estimated, such as the pairwise percentage of common
and specific paths between two networks, respectively.
Gravity models were used to estimate the probability of a link between two distinct nodes
according to their features. These models were developed in the field of socio-economics and
human migration studies [32,33]. They provide estimates for the flows of goods or people
between two nodes, as a function of node-level variables (e.g. population size, socio-economic
factors, etc.), and of the distance or movement cost between these nodes. Its most general for-
mulation (Eq 1) shows the analogy with Newton’s gravity law. MIGij is the flow between the
origin i and destination j, pi and pj are the population at the origin and destination, dij is the
distance between i and j, and α, β and γ are model parameters. The equation is linearized into
Livestock mobility in Mauritania
PLOS ONE | https://doi.org/10.1371/journal.pone.0199547 July 18, 2018 5 / 21

Eq (2) by a log-transformation, and its coefficients can be estimated with generalized linear
models. Eq (2) can be rewritten as a model (3) with an intercept (a flow that would still be pres-
ent when populations are equal to zero), and a set of predictor variables xk characterizing the
origin or destination, with their associated coefficients βk.
MIGij ¼pai p
bj
dgij
ð1Þ
logðMIGijÞ ¼ api þ bpj � gdij ð2Þ
logðMIGijÞ ¼ b0 þ b1pi þ b2pj þ b3dij þPK
k¼4bkxk ð3Þ
In this study, we first aimed to estimate the probability of a trade connection between two
nodes. Therefore, log(MIGij) was replaced with the logit of this probability and logistic regres-
sion was used to estimate the coefficients. As the response, all pairs of connected nodes were
coded with 1, and all other pairs of nodes were coded with 0. The analysis was split according
to the main structuring factors of the networks, i.e. species, transport modality and season. For
each sub-model, we tested seven combinations of predictors, considering them both at the ori-
gin and destination with inclusion of a distance estimator ((i) great-circle distance, (ii) cost-
path distance based on accessibility friction surface or (iii) cost-path distance based on eleva-
tion friction surface). The different combinations of predictors that were tested in the models
are shown in Table 1. The human and animal populations at the origin and destination were
extracted from the Worldpop and GLW raster layers within the Thiessens’ polygons around
each node (Fig 1). Thiessen’s polygons represent areas consisting of all points closer to the
node than to any other node. These were used because the nodes did not correspond to any
particular administrative division that could have been used (i.e. many nodes per admin unit).
Although Thiessen’s polygon can produce somewhat misleading long shapes in desertic areas,
this is not necessarily a problem as the livestock and human population demographics would
be low in these areas anyway. In each sub-model, we first included the extracted animal popu-
lation of each species at both the source and destination (cattle, sheep, goats, and camels). We
used stepwise regression based on Akaike information criterion (AIC) to select a more parsi-
monious model, with the lowest AIC.
In a second step, this analysis was repeated using the number of animals traded between
these two locations as the response variable. To better differentiate the factors influencing the
trade probability from those influencing its volume, the latter analysis was restricted to pairs of
Table 1. General equation of the tested models.
MODEL GENERAL EQUATION
E1 Hpi + Hpj + dijgE2 Lpi + Lpj + dijgE3 Hpi + Hpj + Lpi + Lpj + dijgE4 Hpi + Hpj + Lpi + Lpj + dijaE5 Hpi + Hpj + Lpi + Lpj + dijel
E6 Δ(Hpi, Hpj) + Δ(Lpi, Lpj) + dijgE7 E3 + mode + mode: pi + mode: pj + mode: dijg
pi: population at the origin (L: livestock, H: human); pj: population at destination (L: livestock, H: human); dij: distance
(g: great circle distance, a: costhpath distance based on accessibility friction surface, el: costhpath distance based on
elevation friction surface), mode: transport modality (by truck or on foot).
https://doi.org/10.1371/journal.pone.0199547.t001
Livestock mobility in Mauritania
PLOS ONE | https://doi.org/10.1371/journal.pone.0199547 July 18, 2018 6 / 21

locations with an existing trade link. All analyses were coded and carried out using R [34]. The
“sna” package was used to describe and analyse the trade network [35].
Results
The dataset consisted in 2,219 trade movements involving 7.1 million head. The subset of
national movements, the focus of this analysis, included 1,178 movement events involving 2.1
million head (Table 2). International movements involved around 5 million head, sold or
bought to or from Senegal, Mali, Ivory Coast, Guinea Bissau and Morocco. As the destination
of these international movements within these countries was unknown, they could not be
included in the network analysis or gravity models. Within Mauritania, the trading network
was composed of 65 nodes and 84 unique paths. Transport by foot was the most represented
mode, corresponding to 83% of the animal flow (Tables 2 and 3). The foot and truck transport
modalities presented contrasted patterns. The largest share of foot movements being short to
medium distance (0–200 km), whereas the opposite was observed for movements by truck,
where the largest share was represented by movements > 500 km (Fig 2). Similarly, those con-
trasting patterns somewhat matched the seasonal pattern. The Tabaski period represented 41%
of the inner animal movements, with 57% of them by truck. In contrast, only 25% of the head
were moved by truck outside the Tabaski period (Table 2).
The Mauritanian network was weakly connected. The density value indicated that 2% of
possible node pairs were actually connected, and the network level centrality parameters and
clustering coefficient were low (Table 3). However, each of the exchange networks (full net-
work, or species-specific sub-networks) contained a single component in which the average
length of the shortest path between node pairs was lower than 2 links, the maximum value
(diameter) being 5 links. The goat and camel trading networks were smaller with a diameter of
2 and 3 links. On average, in the full species network, a given node was directly connected with
approximately 2 other nodes on average (average degree). Both the in-degree and in-weight
distributions are right-skewed. Only 5 locations from the livestock trading network attracted
more than 50% of the connections, and are also the destination for more than 60% of the
Table 2. Number of national and international traded animals in Mauritania. Values represent the number of animals moved for each given period. Movements are
defined as national if both the origin and destination are located within the Mauritanian border. Small ruminants (SR) include sheep and goats. Some of the records did
not differentiate the species individually and are counted as “Cattle and SR” or “Mixed”.
Cattle Cattle and SR Camels SR Mixed Total
Truck 67 240 43 760 1 105 870 1 216 870
Aug-Dec 34 398 19 119 843 047 896 565
international 2 400 2 120 410 500 415 020
national 31 998 16 999 432 547 481 545
Jan-July 32 842 24 641 262 822 320 305
international 9 600 3 280 980 13 860
national 23 242 21 361 261 842 306 445
Foot 1 801 846 1 660 598 034 3 334 755 96 563 5 832 859
Aug-Dec 342 444 277 112 740 716 645 19 740 1 191 847
international 283 403 28 011 518 420 829 835
national 59 041 277 84 729 198 225 19 740 362 012
Jan-July 1 459 402 1 383 485 294 2 618 110 76 823 4 641 012
international 119 1123 271 755 2 286 295 3 749 172
national 268 279 1 383 213 539 331 815 76 823 891 839
Total 1 869 086 1 660 641 794 4 440 625 96 563 7 049 729
https://doi.org/10.1371/journal.pone.0199547.t002
Livestock mobility in Mauritania
PLOS ONE | https://doi.org/10.1371/journal.pone.0199547 July 18, 2018 7 / 21
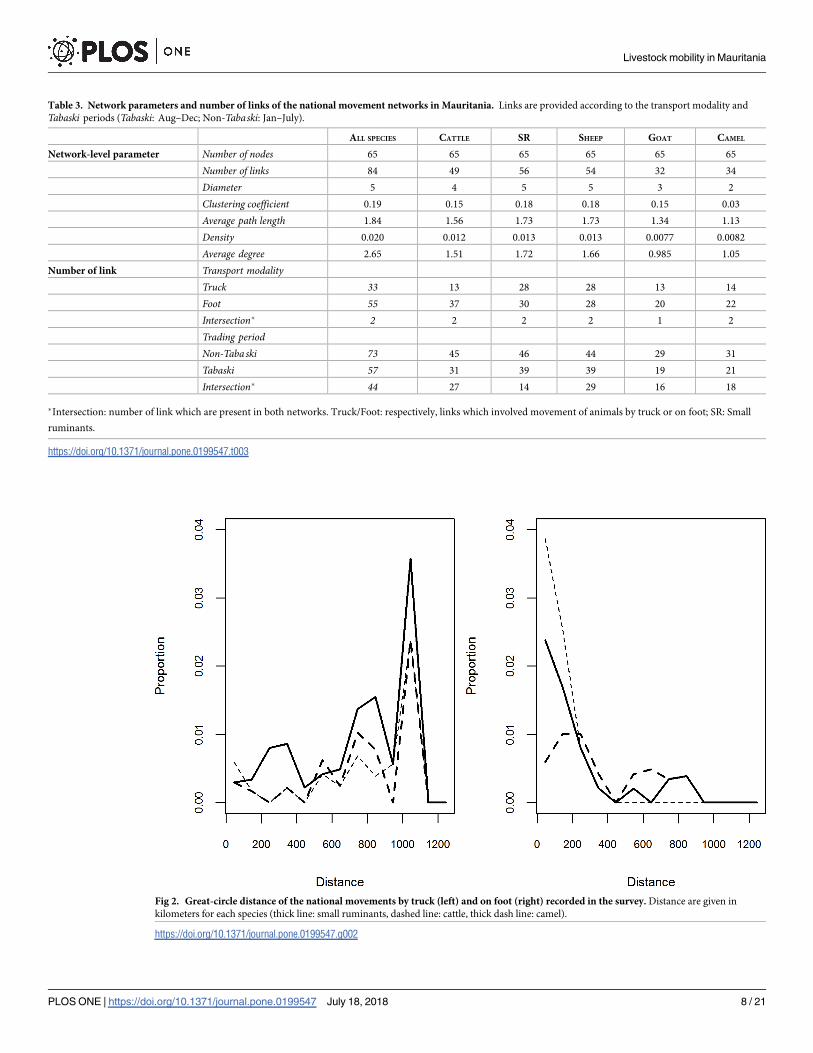
Fig 2. Great-circle distance of the national movements by truck (left) and on foot (right) recorded in the survey. Distance are given in
kilometers for each species (thick line: small ruminants, dashed line: cattle, thick dash line: camel).
https://doi.org/10.1371/journal.pone.0199547.g002
Table 3. Network parameters and number of links of the national movement networks in Mauritania. Links are provided according to the transport modality and
Tabaski periods (Tabaski: Aug–Dec; Non-Tabaski: Jan–July).
ALL SPECIES CATTLE SR SHEEP GOAT CAMEL
Network-level parameter Number of nodes 65 65 65 65 65 65
Number of links 84 49 56 54 32 34
Diameter 5 4 5 5 3 2
Clustering coefficient 0.19 0.15 0.18 0.18 0.15 0.03
Average path length 1.84 1.56 1.73 1.73 1.34 1.13
Density 0.020 0.012 0.013 0.013 0.0077 0.0082
Average degree 2.65 1.51 1.72 1.66 0.985 1.05
Number of link Transport modalityTruck 33 13 28 28 13 14
Foot 55 37 30 28 20 22
Intersection� 2 2 2 2 1 2
Trading periodNon-Tabaski 73 45 46 44 29 31
Tabaski 57 31 39 39 19 21
Intersection� 44 27 14 29 16 18
�Intersection: number of link which are present in both networks. Truck/Foot: respectively, links which involved movement of animals by truck or on foot; SR: Small
ruminants.
https://doi.org/10.1371/journal.pone.0199547.t003
Livestock mobility in Mauritania
PLOS ONE | https://doi.org/10.1371/journal.pone.0199547 July 18, 2018 8 / 21

traded volume. Nouakchott, the main urban consumption market of the country, acts as hub
for livestock mobility with 18 links which concentrate around 1/3 of the traded animals’ total
volume (Fig 3, Table 4). With the highest centrality score, the capital city is the most important
node of the network. Almost 2/3 of the nodes has at most one outgoing link, whilst Aleg and
Fig 3. Network’s centrality measures of the Mauritanian’s livestock trade. Node size show the importance of the measured centrality values. in and out-weight
measures were scaled on the total volume of traded livestock; eigenvector centrality (centrality measure) were scored from 0 to 1, betweenness was considered for the
fraction of paths passing through the node.
https://doi.org/10.1371/journal.pone.0199547.g003
Table 4. List of nodes with highest values for centrality measures. Each column corresponds to a specific network (all species or by single species) Each line relates to a
specific centrality measure. Only the name of the node corresponding with the largest value for each measure is reported. In the case of multiple nodes with same value of
the measure, all the names are reported.
ALL SPECIES CATTLE SR CAMEL
INDEGREE Nouakchott Nouakchott Nouakchott Nouakchott
INWEIGHT Nouakchott Selibabi Nouakchott ZouerateOUTDEGREE Aleg Aleg Kiffa Aleg Kiffa
Kiffa Mmat Laakarich II M. LahjarOUTWEIGHT Tintane Kaedi Tintane NbeikaBETWEENNESS Boutilimit Adel-Bagrou Boutilimit Boutilimit
Mbout Nbeika
EIGENVECTOR CENTRALITY Nouakchott Kaedi Nouakchott Nbeika
https://doi.org/10.1371/journal.pone.0199547.t004
Livestock mobility in Mauritania
PLOS ONE | https://doi.org/10.1371/journal.pone.0199547 July 18, 2018 9 / 21

Kiffa, in the southern region, are connected to other 7 localities, and Tintane has the largest
out-weight. Finally, the betweenness distribution is right-skewed and Boutilimit appears to be
the node with highest betweenness. Few of the centrality measures are significantly correlated
(p-value<0.05) and reported in Table 5.
Results of the percolation analysis on networks cohesion are shown in Fig 4. Nodes are
removed based on the centrality measures (indegree, outdegree, incoming and outgoing
Table 5. Correlation coefficients among centrality measures. Pearson correlations coefficients among centrality measure. Only significant (p-value<0.05) coefficients
are reported.
INDEGREE OUTDEGREE INWEIGHT OUTWEIGHT
INDEGREE 0.88
OUTDEGREE 0.63
INWEIGHT 0.88
OUTWEIGHT 0.63
https://doi.org/10.1371/journal.pone.0199547.t005
Fig 4. Effect of targeted removal on the connected component size. Values on the x axis indicate the percentage of
nodes removed (cumulative), together with their links. Values on y axis indicate the percentage of nodes in the largest
connected sub-network, after the removal. Color indicates the removal procedure based on centrality measure score
(starting from the highest score nodes) or randomly. Shaded areas correspond to 95% CI for the random procedure.
https://doi.org/10.1371/journal.pone.0199547.g004
Livestock mobility in Mauritania
PLOS ONE | https://doi.org/10.1371/journal.pone.0199547 July 18, 2018 10 / 21

volume, betweenness, eigenvector centrality) and, for comparison purposes, randomly.
Removing nodes in order of their incoming connections, incoming volume and centrality
result as the most effective strategies of fragmentation. In the first case, removing less than
20% of the nodes (13 nodes) results in decomposing network in a set of subnetworks whom
the largest one contains less than 10% of the nodes (7 nodes).
In total, 94% of the goats trading network paths were shared with the sheep (Fig 5, Table 6).
These two networks were merged into a single small ruminant trading network in the gravity
models. A high degree of overlap between pairs of species networks was highlighted (Table 6).
However, overlapping only involved 20% of the full set of trading links (Fig 5, Table 6).
Fig 5. Species-level movement networks. Each diagram represents the movement links that are specific to the species (red: by truck, dark
grey: by foot, both truck and foot: blue). The last plot shows the entire network of all species.
https://doi.org/10.1371/journal.pone.0199547.g005
Table 6. Comparison of the trading networks of the different species. The values correspond to the percentage (italic) and the number (bracket) of common links and
difference between the trading network of the pair of species.
network SPECIES 1 network SPECIES 2 INTERSECTION
% (n)
DIFFERENCE SP1/SP2
% (n)
DIFFERENCESP2/SP1
% (n)
CATTLE/SR 49 56 65 (32) 35 (17) 43 (24)
CAMEL/SR 34 56 65 (22) 35 (12) 61 (34)
CAMEL/CATTLE 34 49 47 (16) 53 (18) 67 (33)
GOAT/SHEEP 32 54 94 (30) 6 (2) 44 (24)
ALL SPECIES � 84 - 20 (17)
� All species: Association of small ruminants, Cattle and Camel trading networks.
https://doi.org/10.1371/journal.pone.0199547.t006
Livestock mobility in Mauritania
PLOS ONE | https://doi.org/10.1371/journal.pone.0199547 July 18, 2018 11 / 21

Among the remaining links, many were species-specific: 30% of the small ruminant (17/56),
33% of the cattle (16/49) and 32% of the camel (11/34) links were not included in any of the
other networks. Very few links were shared between the truck and foot networks and were
identical for all species (2/84, Table 6).
The role of nodes could change depending on the species considered. Previous results
about most central nodes hold when we consider the “small ruminants only” network. Whilst
Nouakchott remains always the most connected node, most of the volume of cattle and camels
are directed towards Selibabi and Zouerate, respectively. The markets of Kaedi, for cattle, and
Nbeika, for camels, become more central in the network (see S1 File and Table 4). In term of
cohesiveness, specie-specific network are more vulnerable to the target removal of nodes. As
in the all species case target removal based on indegree and inweight are the most efficient pro-
cedures. In fact, in both cases, removing a limited quantity of nodes, 8 for camel’s network 10
for cattle’s one and 12 for small ruminants one, results in decomposing the respective networks
in a set of subnetworks whom the largest one contains at most 8 nodes. This is particularly rel-
evant for small ruminants and the cattle networks, whose largest subnetworks consist of 7 and
10 nodes, respectively, after the removal of only 3 most connected nodes.
There was a high number of shared links between the Tabaski and non-Tabaski periods
(44/84, Table 6). Both Tabaski and non-Tabaski networks included truck and foot movements,
but their relative proportion was different. During the Tabaski period, there were fewer foot
movements and higher truck movements (Fig 6). Very few trade connections involved both
truck and foot movements in the two periods (Table 6, Figs 5 and 6).
Fig 6. Movement networks according to the species and seasons. Note that for each season the links present in both defined
transportation mode are not plotted and are the same for both defined season (red: by truck, dark grey: by foot, nf: number of movement
links by foot, Jan-July: Non-Tabaski period; Aug-Dec: Tabaski period). Fig 3 should be considered to see the redundancy between
transportation mode (blue edge).
https://doi.org/10.1371/journal.pone.0199547.g006
Livestock mobility in Mauritania
PLOS ONE | https://doi.org/10.1371/journal.pone.0199547 July 18, 2018 12 / 21

As the network changes along the year so its proneness to diffuse diseases. Fig 7, present the
variation of the epidemic threshold (denoted q), estimated every month, along the year in
comparison with the number of links active and the volume of livestock traded. Since the net-
work can change along the year, particularly new active links around Tabaski, we considered
the backbone network from Apolloni et al. [17] (containing links present more than 2 months)
and the total network containing all the link active that month to elicit the role that Tabaskiplays on the risk of transmission. The epidemic threshold is at the lowest values between the
March and June, when the volume and the number of exchanges (links) is at maximum, and
around Tabaski, when a second peak of movements (mainly small ruminants) whose volume
is almost equal to the first peak, is observed. Occasional links, appearing only for the Tabaskireason, decreases the invasion threshold and consequently the risk of disease spreading is
higher in this period.
Table 7 presents the different sets of gravity models that were applied to the full network
(binary outcome: 1 if two nodes were connected and 0 otherwise), and to the networks broken
down by species, period and transport modality.
The best results were obtained with models including human and animal populations at the
origin and destination, with a great-circle distance (model E3, Tables 1 and 7). Replacing this
distance with cost-distance functions of accessibility (E4) or elevation (E5) did not improve
the results. Similarly, although we noted some improvements for some combinations of species
and transport modalities, the use of the population difference between origin and destination
Fig 7. Variations of network quantities along the year. Bottom: monthly epidemic threshold variations along the
year; Centre Volume of animals traded during the month; Top number of links active. For each month, we have
considered 2 networks: all network including occasional links appearing on that month; backbone, excluding
occasional link. The different colors correspond to the quantity evaluated for the specific network.
https://doi.org/10.1371/journal.pone.0199547.g007
Livestock mobility in Mauritania
PLOS ONE | https://doi.org/10.1371/journal.pone.0199547 July 18, 2018 13 / 21

rather than their absolute values (E6) did not lead to improved models for the different break-
downs. In all models, and for all species networks, when the animal population was kept as a
predictor, the number of sheep was the most important predictor.
Table 8 presents the details of the final models broken down by species, season and trans-
port mode with the human and sheep population at the origin and destination and great-circle
distance as predictors. The predictive power of the models were moderate to very good,
according to the species, season and mode of transport, with AUC values ranging from 0.76 to
0.97. Considering all species, seasons and transport modes, positive associations were found
between the probability of a trade connection and: i) low human population at the origin, ii)
high human population at the destination, iii) high sheep population at the origin, iv) low
sheep population at the destination, and v) a low great-circle distance (Table 8). The results
were similar for the small ruminants’ network model, whereas for the cattle model, the human
population at the origin and the sheep population at the destination were not significant. For
the camel network, the human population at the origin and the great-circle distance were not
significant. The sign of the significant effects was coherent across the sub-models, i.e. a higher
probability of trade event was always associated with low human population at the origin, or
high human population at the destination, a high population of sheep at the origin, a low pop-
ulation of sheep at the destination and a low great-circle distance, or a combination of these
effects. In addition, meaningful differences were noticed in some sub-models. For example, in
small ruminant models split by transport mode, human population at the destination, and
sheep population at the origin were not significant in the foot-movement sub-model. In
Table 7. AIC values of the logistic regression models. The models are broken down by species (SR: small ruminants, CT: cattle, CM: camels), period (Tab: Tabaski,NTab: Non-Tabaski) and transport modality. E1-E6 correspond to different models described in Table 1.
AIC model n link n unique link E1 E2 E3 E4 E5 E6 E7
ALL SPECIES All 1178 140 1501.8 1604.1 1464.1 1488.9 1485.1 1461.9 1342.7
NTab 518 53 1339.8 1418.6 1303.3 1323.7 1323.6 1303.3
Tab 660 87 995.6 1133.7 979.8 983.1 982.9 976.1
Truck 735 121 427.2 601.1 405.0 408.9 407.3 416.9
Truck—NTab 443 91 315.7 470.7 302.4 309.1 305.4 307.8
Truck—Tab 257 40 175.2 280.5 172.0 174.9 172.2 175.2
Foot 129 21 899.3 885.9 877.5 951.1 934.7 885.6
Foot—NTab 478 81 843.8 832.2 821.8 886.8 874.0 832.1
Foot—Tab 182 41 460.4 454.7 455.2 498.3 484.9 455.7
SR All 620 58 589.5 639.7 572.0 578.9 576.7 570.3
NTab 374 46 482.7 530.3 470.1 474.1 476.5 470.7
Tab 246 40 412.9 473.1 404.0 404.2 403.7 403.7
Truck 324 31 210.3 290.5 204.5 205.7 205.7 205.9
Foot 296 27 315.3 308.2 304.7 331.3 327.0 307.9
CT All 341 47 494.1 526.9 480.6 474.9 487.2 489.4
NTab 214 43 465.0 492.4 451.3 444.5 455.8 459.3
Tab 127 31 342.3 384.2 329.3 322.5 328.0 340.2
Truck 109 13 107.2 146.7 105.6 105.9 106.0 106.0
Foot 232 34 305.7 295.8 296.0 304.1 307.9 307.7
CM All 217 35 411.5 425.1 399.2 397.4 399.5 395.8
NTab 147 32 390 393.9 377.0 375.9 377.6 373.4
Tab 70 20 241.7 265.8 236.1 235.7 236.1 233.4
Truck 113 13 116.6 156.3 109.9 110.8 108.9 112.3
Foot 104 22 266.6 258.7 261.3 264.9 265.9 258.6
https://doi.org/10.1371/journal.pone.0199547.t007
Livestock mobility in Mauritania
PLOS ONE | https://doi.org/10.1371/journal.pone.0199547 July 18, 2018 14 / 21

contrast, both predictors at the origin were not significant in the truck-movement sub-model.
Great-circle distance and both human and sheep population were not significant for the latter,
though. The observed and estimated trade links are illustrated in Fig 8 for these small rumi-
nant models for the Tabaski and non-Tabaski periods, and movements by trucks or on foot.
During the non-Tabaski period, the fitted values correctly captured the co-existence of short-
and long-distance movements, whereas long-distance movements were prominent during the
Tabaski period. Similarly, the prediction of the truck or foot movements corresponded to their
respective long or short distances. None of the models correctly fitted the south/north
movements.
None of the gravity models with the flow of animals as the response, and the same set
of predictors as in the presence/absence model detailed above, showed any significant
association.
Discussion
Though international movements were not addressed in this study, it is noteworthy that in
2014, the largest sheep exportation peak was observed during the “soudure”, i.e. the period sepa-
rating the end of familial cereal reserve saved after the previous harvest (millet, sorghum. . .)
from the next harvest. This was also the hot, dry season, when forage and surface water resources
were finished, and ruminant livestock starved. Therefore, the most obvious option for the Mau-
ritanian livestock farmers was to sell most of the offspring, only keeping the core of reproductive
Table 8. Multivariate linear model and significance of the parameters given for the selected model (E3).
Intercept Hpopi Hpopj Spopi Spopj Great-circle distance AUC
All mode All species -4.239 ��� -7.622 10−6 � 4.667 10−6 ��� 3.905 10−6 ��� -5.104 10−6 ��� -2.278 10−3 ��� 0.836
Small ruminants -3.895 ��� -1.0 10−5 4.92 10−6 ��� 2.45 10−6 ��� -4.00 10−6 �� -2.129 10−3 ��� 0.840
Cattle -4.619 ��� -8.928 10−6 5.596 10−6 ��� 2.118 10−5 ��� 7.090 10−6 -4.416 10−3 ��� 0.884
Camel -5.402 ��� -1.966 10−6 4.189 10−6 ��� 4.699 10−6 �� -6.374 10−6 � -5.632 10−4 0.790
All non-Tabaski All species -4.210 ��� -1.069 10−5 �� 4.555 10−6 ��� 4.196 10−6 ��� -5.356 10−3 ��� -2.415 10−3 ��� 0.840
Small ruminants -3.809 ��� -1.751 10−5 �� 5.08 10−6 ��� 2.634 10−6 �� -3.575 10−6 � -2.628 10−3 ��� 0.863
Cattle -4.599 ��� -1.239 10−5 � 5.417 10−6 ��� 2.244 10−5 ��� 4.982 10−6 -4.095 10−3 ��� 0.885
Camel -5.563 ��� -1.559 10−6 3.852 10−6 ��� 5.167 10−6 ��� -6.139 10−6 � -5.802 10−4 0.781
All Tabaski All species -5.355 ��� -3.679 10−6 5.424 10−6 ��� 3.563 10−6 ��� -4.107 10−6 �� -1.595 10−3 ��� 0.869
Small ruminants -4.680 ��� -5.409 10−6 5.408 10−6 ��� 1.985 10−6 � -4.637 10−6 � -1.378 10−3 � 0.863
Cattle -6.179 ��� -3.851 10−6 6.665 10−6 ��� 2.269 10−5 ��� 1.598 10−5 � -3.287 10−3 ��� 0.901
Camel -6.391 ��� -4.458 10−7 5.102 10−6 ��� 4.862 10−6 � -7.167 10−6 -2.454 10−4 0.837
Truck All period All species -5.841 ��� -7.730 10−8 6.876 10−6 ��� 3.242 10−6 � -2.072 10−5 ��� 1.126 10−3 � 0.934
Small ruminants -5.432 ��� -9.748 10−7 6.600 10−6 ��� 1.634 10−6 -8.942 10−6 � 8.968 10−4 0.91
Cattle -2.574 ��� -1.350 10−7 3.652 10−5 1.903 10−5 9.883 10−6 -1.049 10−2 ��� 0.945
Camel -6.015 ��� 8.635 10−7 7.230 10−6 ��� 4.261 10−6 -3.349 10−5 � 1.590 10−3 0.966
Foot All period All species -2.665 ��� -1.396 10−5 �� -1.435 10−6 4.702 10−6 ��� -3.418 10−6 �� -5.783 10−3 ��� 0.830
Small ruminants -2.225 ��� -1.963 10−5 � 3.289 10−6 3.289 10−6 -2.996 10−6 � -6.409 10−3 ��� 0.853
Cattle -6.470 ��� 9.398 10−7 6.589 10−6 ��� 1.636 10−5 -1.105 10−4 8.720 10−4 0.908
Camel -4.200 ��� -3.373 10−6 -4.043 10−6 -4.940 10−6 �� -4.366 10−6 -1.982 10−3 0.759
��� p<0.001
�� p<0.01
� p<0.05
NS: not significant
Hpop: Human population at the origin (i) and at destination (j); Spop: Sheep population at the origin (i) and at destination (j).
https://doi.org/10.1371/journal.pone.0199547.t008
Livestock mobility in Mauritania
PLOS ONE | https://doi.org/10.1371/journal.pone.0199547 July 18, 2018 15 / 21

ewes and she-goats. In addition, many of the latter spent this season in the closest areas with
more abundant pastoral resources, i.e. in Senegal and Mali. Short- and mid-distance move-
ments–most of them by foot, thus allowed pastoralists to exploit more suitable environmental
conditions and reduce the economic cost of feeding the animals. In future years, when the
Tabaski feast occurs during the soudure period, the relative importance of truck vs. foot
Fig 8. Observed and predicted movements links from the gravity model applied to the small ruminant networks.
Models were applied to movements occurring within the non-Tabaski period (A), the Tabaski period (B), without
distinction of period (C-D): movements by truck (C) and by foot (D).
https://doi.org/10.1371/journal.pone.0199547.g008
Livestock mobility in Mauritania
PLOS ONE | https://doi.org/10.1371/journal.pone.0199547 July 18, 2018 16 / 21

movements may change and add to each other. Moreover, as the Tabaski is a mobile festivity
which is celebrated annually among Muslims worldwide 70 days after Ramadan, a time slip of
10 days upstream occurs each year. An overlap with specific diseases vectors may thus occurs
depending on the occurrence of the feast (year-dependence of the epidemic risk). Around Sene-
gal river, Aedes mosquitoes show a peak in the periods of July-August and September during the
rainy season. Thanks to the happening of the Tabaski, held in the last years between September
and October, the risk of infection was elevated [36]. The risk remains high every year due to the
large volume of moved animals and the traders’ preference for truck transportation and its fast-
ness which allow viremic animal introduction on remote locations.
The low values for the national network diameter, the presence of hubs and the low values
of the epidemic threshold, indicate that the network could be prone to transmission of dis-
eases. This means that also a lowly transmitted disease, once introduced in the national net-
work, could reach all nodes (the network’s single component) in a short amount of time (small
diameter). On the other hand, independently of the species considered, the mobility network
is prone to fragmentation due to targeted intervention based on nodes activity (in-degree and
in-weight). After the intervention, the network is decomposed in a set of smaller subnetworks,
and virus can circulate only among nodes of the same sub-network. Vaccinating animals in
largest markets (nodes with largest number of incoming animals) or closing these markets,
could result in a very effective way of controlling the epidemic spread.
Regarding internal movements, the gravity models correctly predicted the probability of a
trade connection and their interpretation was straightforward. Locations with few sheep and
high human populations, i.e. urban consumption centers, acted as movement sinks. Con-
versely, areas with high sheep and low human populations, i.e. rural livestock farming areas,
acted as movement sources. For a similar level of production and demand, short distance
movements were more likely that long distance ones. In addition, Nouakchott, the capital city
located on the coast, strongly influenced the network structures. Almost a quarter of the total
population of Mauritania lives in Nouakchott (according to the National Statistical Office
http://www.ons.mr/) and because of this, it is the largest terminal market with an incoming
volume of almost 30% of the national one. In preparation for Tabaski, almost 50% of the total
traded small ruminants are sold in Nouakchott. The largest majority of livestock provisioning
Nouakchott markets comes from the South-Western area of Mauritania. A continuous flux of
animals is ensured by stockists who collect animals at collection market and transfer them by
truck to the capital city. Here, stockists buy imported goods, arrived at the international port,
to sell at collection markets.
It might look odd that the sheep population at the origin and destination of movements
was the best predictor for all species-level networks. A possible explanation might be that the
spatial distributions of all ruminant species were positively correlated, thus making the sheep
population a confounding factor for the other ruminant populations. This assumption was
corroborated by the dominance of small ruminant movements: 1.3 million vs. 0.39 million for
cattle and 0.37 million for camels. Therefore, the small ruminant network probably influenced
all other ruminant trade activities.
The seasonal models had good predictive power for the models of both truck or foot move-
ments. These models captured the dominance of long-distance movements (truck movement
network), of short-distance movements (foot movement network) and different combinations
of short and long-distance movements (Tabaski vs non-Tabaski periods). However, the models
did not capture some of the trade links. For example, they failed to predict the link to the
northern city of Zouerate, which was involved in the small ruminant and camel trading net-
works. Located in the desert and with a low accessibility, this city has a large iron mining
industry, and virtually no local production. The working population there may be much higher
Livestock mobility in Mauritania
PLOS ONE | https://doi.org/10.1371/journal.pone.0199547 July 18, 2018 17 / 21

than the population estimates in the Worldpop population database, which maps people
according to their residence, not their working place. Such high populations of workers may
generate high demand for small ruminant and camel meat, and camel milk. Armed conflicts
may also influence the pattern of demand with drivers not accounted for in the models. For
example, an important flow of human population was reported in south-eastern Mauritania
coming from Mali after the terrorist attack of January 2013. These refugees established camps
close to the border with Mali: their population may have influenced the pattern of demand
and production in a way that was not captured by the model.
The use of cost-distance instead of great-circle distance did not improve the models. The
cost-distance was estimated using the accessibility friction map which is based on the road net-
work and land-use data, two expected drivers of the livestock trade networks. However, the
friction layer might not be adapted to the specific constrains of animal movements in arid and
hyper-arid environments. For example, the presence of water points or stopover feeding sites
along the roads might be more relevant factors than those included in the global friction sur-
face. Therefore, further work is needed to build friction surfaces better suited to the specific
constrains of animal movement in this environment.
The movement survey database also included volumes of the livestock trade flows between
locations. However, these quantitative data were not correctly predicted by any of the models.
This failure might be related to two non-exclusive factors. First, when a link was established,
the volume of traded animals did not vary much, and not proportionally to the deficit in
demand or to the distance. Second, there might be noise in the data related to inaccurate
replies during the interviews with field veterinary officers. However, considering the outer
trade data (international movements), estimates from this survey closely matched importation
estimates from the Senegalese Veterinary Services for the Tabaski period. Because these data
were of crucial importance to stabilize sheep price (and thus prevent social troubles), all efforts
were made for an accurate monitoring of sheep importation. Therefore, this good match pro-
vided a partial validation for the quality of data produced by this survey, as well as the good
predictive power obtained with the presence/absence models.
An important question underlying these analyses is the role that animal mobility might
play in the spread of animal and zoonotic diseases in the region. For example, animal move-
ments may contribute to the spread of Rift Valley fever (RVF) in the Sahelian region of Mauri-
tania, and from Mauritania to Senegal [37,38]. The network structure predicted by this model
may provide input for an epidemiological model of RVF or other important diseases affecting
the region, such as Peste des petits ruminants (PPR) [6].
Gravity models are an important method in economic analyses, used mainly to predict
bilateral flow of population and goods between two distant locations [39]. They were recently
adapted to describe the spread of biological agents [33,40–42]. To our knowledge, this study is
a first attempt to predict livestock mobility patterns. Besides obvious applications in the field
of pastoral economics, it opens new perspectives for predicting the transmission of pathogens
such as PPR or RVF viruses in animal meta-populations, or extending existing models of post-
vaccination immunity persistence at the population level [43]. Also, similar models might be
used at the regional level–e.g, between Maghreb or Sahel countries, or between Sahel and
Maghreb regions, etc.–to validate and compliment (un)available information on transbound-
ary animal movements.
Supporting information
S1 File. Small ruminant, cattle and camel trading networks and related centrality measures
for Mauritania in 2014. Node size show the importance of the measured centrality values. in
Livestock mobility in Mauritania
PLOS ONE | https://doi.org/10.1371/journal.pone.0199547 July 18, 2018 18 / 21

and out-weight measures were scaled on the total volume of traded livestock; eigenvector cen-
trality (centrality measure) were scored from 0 to 1, betweenness was considered for the frac-
tion of paths passing through the node.
(DOCX)
Acknowledgments
This study was funded by EU grant FP7-613996 VMERGE and is catalogued by the VMERGE
Steering Committee as VMERGE000 (http://www.vmerge.eu). The contents of this publication
are the sole responsibility of the authors and don’t necessarily reflect the views of the European
Commission.
Author Contributions
Conceptualization: Gaelle Nicolas, Marius Gilbert.
Data curation: Gaelle Nicolas.
Formal analysis: Gaelle Nicolas.
Methodology: Gaelle Nicolas, Marius Gilbert.
Supervision: Marius Gilbert.
Validation: Gaelle Nicolas.
Visualization: Gaelle Nicolas.
Writing – original draft: Gaelle Nicolas.
Writing – review & editing: Gaelle Nicolas, Andrea Apolloni, Caroline Coste, G. R. William
Wint, Renaud Lancelot, Marius Gilbert.
References1. Jones KE, Patel NG, Levy MA, Storeygard A, Balk D, Gittleman JL, et al. Global trends in emerging
infectious diseases. Nature. 2008; 451: 990–993. https://doi.org/10.1038/nature06536 PMID:
18288193
2. Black P, Nunn M. Impact of climate change and environmental changes on emerging and reemerging
animal disease and animal production. Conf OIE. 2009; 15–25.
3. Nicolas G, Durand B, Duboz R, Rakotondravao R, Chevalier V. Description and analysis of the cattle
trade network in the Madagascar highlands: Potential role in the diffusion of Rift Valley fever virus. Acta
Trop. 2013; 126: 19–27. https://doi.org/10.1016/j.actatropica.2012.12.013 PMID: 23295911
4. Grace D, Mutua F, Ochungo P, Kruska R, Jones K, Brierley L, et al. Mapping of poverty and likely zoo-
noses hotspots. Zoonoses Project 4. Report to the UK Department for International Development. Nai-
robi, Kenya: ILRI [Internet]. ILRI; 2012 Jul. Available: https://cgspace.cgiar.org/handle/10568/21161
5. Fèvre EM, Bronsvoort BM de C, Hamilton KA, Cleaveland S. Animal movements and the spread of
infectious diseases. Trends Microbiol. 2006; 14: 125–131. https://doi.org/10.1016/j.tim.2006.01.004
PMID: 16460942
6. Jones BA, Rich KM, Mariner JC, Anderson J, Jeggo M, Thevasagayam S, et al. The Economic Impact
of Eradicating Peste des Petits Ruminants: A Benefit-Cost Analysis. PLOS ONE. 2016; 11: e0149982.
https://doi.org/10.1371/journal.pone.0149982 PMID: 26900944
7. Wang X, Liu C, Mao W, Hu Z, Gu L. Tracing The Largest Seasonal Migration on Earth. ResearchGate.
2014; Available: https://www.researchgate.net/publication/267811689_Tracing_The_Largest_
Seasonal_Migration_on_Earth
8. Deville P, Linard C, Martin S, Gilbert M, Stevens FR, Gaughan AE, et al. Dynamic population mapping
using mobile phone data. Proc Natl Acad Sci. 2014; 111: 15888–15893. https://doi.org/10.1073/pnas.
1408439111 PMID: 25349388
Livestock mobility in Mauritania
PLOS ONE | https://doi.org/10.1371/journal.pone.0199547 July 18, 2018 19 / 21

9. Chapman M, Prothero RM. Circulation in Population Movement (Routledge Revivals): Substance and
concepts from the Melanesian case. Reprint edition. London: Routledge; 2013.
10. Clarkson L, Crawford M. Feast and FamineFood and Nutrition in Ireland 1500–1920 [Internet]. 2001.
Available: http://www.oxfordscholarship.com/view/10.1093/acprof:oso/9780198227519.001.0001/
acprof-9780198227519
11. Colizza V, Barrat A, Barthelemy M, Vespignani A. The role of the airline transportation network in the
prediction and predictability of global epidemics. Proc Natl Acad Sci U S A. 2006; 103: 2015–2020.
https://doi.org/10.1073/pnas.0510525103 PMID: 16461461
12. Colizza V, Barthelemy M, Barrat A, Vespignani A. Epidemic modeling in complex realities. C R Biol.
2007; 330: 364–374. https://doi.org/10.1016/j.crvi.2007.02.014 PMID: 17502293
13. Nicolas G, Chevalier V, Tantely LM, Fontenille D, Durand B. A Spatially Explicit Metapopulation Model
and Cattle Trade Analysis Suggests Key Determinants for the Recurrent Circulation of Rift Valley Fever
Virus in a Pilot Area of Madagascar Highlands. PLoS Negl Trop Dis. 2014; 8: e3346. https://doi.org/10.
1371/journal.pntd.0003346 PMID: 25474116
14. Moritz M. Chapter 13—Networks and Hazard Adaptation Among West African Pastoralists. Social Net-
work Analysis of Disaster Response, Recovery, and Adaptation. Butterworth-Heinemann; 2017. pp.
193–207. Available: http://www.sciencedirect.com/science/article/pii/B9780128051962000133
15. Ibra T, Ickowicz A, Wane A, Garba I, Gerber P. Eds. Atlas of Trends in pastoral systems in the Sahel
1970–2012. SIPSA. FAO-CIRAD, 32 pages(http://umr-selmet.cirad.fr/publications-et-ressources/
documents-techniques). [Internet]. 2012. Available: https://www.researchgate.net/publication/
261842575_Atlas_of_Trends_in_pastoral_systems_in_the_Sahel_1970-2012_SIPSA_FAO-CIRAD_
32_pages_httpumr-selmetciradfrpublications-et-ressourcesdocuments-techniques
16. L’hote Y, Mahe G, Some B, Triboulet JP. Analysis of a Sahelian annual rainfall index from 1896 to 2000;
the drought continues. Hydrol Sci J. 2002; 47: 563–572. https://doi.org/10.1080/02626660209492960
17. Apolloni A, Nicolas G, Coste C, El Mamy ABO, Lancelot R, Gilbert M. Towards the description of live-
stock mobility in Sahelian Africa: some results from a survey in Mauritania. Transbound Emerg Dis.
2018; 13: e0191565. https://doi.org/10.1371/journal.pone.0191565 PMID: 29364989
18. Metzger MJ, Bunce RGH, Jongman RHG, Sayre R, Trabucco A, Zomer R. A high-resolution bioclimate
map of the world: a unifying framework for global biodiversity research and monitoring. Glob Ecol Bio-
geogr. 2013; 22: 630–638. https://doi.org/10.1111/geb.12022
19. FAOSTAT [Internet]. [cited 12 Feb 2018]. Available: http://www.fao.org/faostat/en/#data/QA
20. Nicolas G, Robinson TP, Wint GRW, Conchedda G, Cinardi G, Gilbert M. Using Random Forest to
Improve the Downscaling of Global Livestock Census Data. PLOS ONE. 2016; 11: e0150424. https://
doi.org/10.1371/journal.pone.0150424 PMID: 26977807
21. Robinson TP, Wint GRW, Conchedda G, Van Boeckel TP, Ercoli V, Palamara E, et al. Mapping the
Global Distribution of Livestock. PLoS ONE. 2014; 9: e96084. https://doi.org/10.1371/journal.pone.
0096084 PMID: 24875496
22. Stevens FR, Gaughan AE, Linard C, Tatem AJ. Disaggregating census data for population mapping
using random forests with remotely-sensed and ancillary data. PloS One. 2015; 10: e0107042. https://
doi.org/10.1371/journal.pone.0107042 PMID: 25689585
23. Nelson A. Travel time to major cities: A global map of Accessibility [Internet]. Ispra Italy: Global Envi-
ronment Monitoring Unit—Joint Research Centre of the European Commission; 2008. Available: Avail-
able at http://gem.jrc.ec.europa.eu/
24. Wasserman S, Faust K. Social Network Analysis: Methods and Applications. Cambridge University
Press; 1994.
25. Beaunee G, Vergu E, Ezanno P. Modelling of paratuberculosis spread between dairy cattle farms at a
regional scale. Vet Res. 2015; 46. https://doi.org/10.1186/s13567-015-0247-3 PMID: 26407894
26. Moslonka-Lefebvre M, Gilligan CA, Monod H, Belloc C, Ezanno P, Filipe JAN, et al. Market analyses of
livestock trade networks to inform the prevention of joint economic and epidemiological risks. J R Soc
Interface. 2016; 13. https://doi.org/10.1098/rsif.2015.1099 PMID: 26984191
27. Lichoti JK, Davies J, Kitala PM, Githigia SM, Okoth E, Maru Y, et al. Social network analysis provides
insights into African swine fever epidemiology. Prev Vet Med. 2016; 126: 1–10. https://doi.org/10.1016/
j.prevetmed.2016.01.019 PMID: 26848113
28. Relun A, Grosbois V, Alexandrov T, Sanchez-Vizcaıno JM, Waret-Szkuta A, Molia S, et al. Prediction of
Pig Trade Movements in Different European Production Systems Using Exponential Random Graph
Models. Front Vet Sci. 2017; 4. https://doi.org/10.3389/fvets.2017.00027 PMID: 28316972
29. Kiss IZ, Green DM, Kao RR. The network of sheep movements within Great Britain: network properties
and their implications for infectious disease spread. J R Soc Interface. 2006; 3: 669–677. https://doi.org/
10.1098/rsif.2006.0129 PMID: 16971335
Livestock mobility in Mauritania
PLOS ONE | https://doi.org/10.1371/journal.pone.0199547 July 18, 2018 20 / 21
http://www.oxfordscholarship.com/view/10.1093/acprof:oso/9780198227519.001.0001/acprof-9780198227519

30. Volkova VV, Howey R, Savill NJ, Woolhouse MEJ. Sheep Movement Networks and the Transmission
of Infectious Diseases. PLOS ONE. 2010; 5: e11185. https://doi.org/10.1371/journal.pone.0011185
PMID: 20567504
31. Lancelot R, Beral M, Rakotoharinome VM, Andriamandimby S-F, Heraud J-M, Coste C, et al. Drivers of
Rift Valley fever epidemics in Madagascar. Proc Natl Acad Sci U S A. 2017; 114: 938–943. https://doi.
org/10.1073/pnas.1607948114 PMID: 28096420
32. Simini F, Gonzalez MC, Maritan A, Barabasi A-L. A universal model for mobility and migration patterns.
Nature. 2012; 484: 96–100. https://doi.org/10.1038/nature10856 PMID: 22367540
33. Balcan D, Colizza V, Goncalves B, Hu H, Ramasco JJ, Vespignani A. Multiscale mobility networks and
the spatial spreading of infectious diseases. Proc Natl Acad Sci. 2009; 106: 21484–21489. https://doi.
org/10.1073/pnas.0906910106 PMID: 20018697
34. R Development Core Team. R: A language and Environment for Statistical Computing. Vienna Austria
R Found Stat Comput. 2015;
35. Butts CT. sna: Tools for Social Network Analysis [Internet]. 2016. Available: https://cran.r-project.org/
web/packages/sna/index.html
36. Biteye B, Fall AG, Ciss M, Seck MT, Apolloni A, Fall M, et al. Ecological distribution and population
dynamics of Rift Valley fever virus mosquito vectors (Diptera, Culicidae) in Senegal. Parasit Vectors.
2018; 11. https://doi.org/10.1186/s13071-017-2591-9 PMID: 29316967
37. El Mamy ABO, Baba MO, Barry Y, Isselmou K, Dia ML, Hampate B, et al. Unexpected Rift Valley Fever
Outbreak, Northern Mauritania. Emerg Infect Dis. 2011; 17: 1894–1896. https://doi.org/10.3201/
eid1710.110397 PMID: 22000364
38. El Mamy AB, Lo MM, Thiongane Y, Diop M, Isselmou K, Doumbia B, et al. Comprehensive Phyloge-
netic Reconstructions of Rift Valley Fever Virus: The 2010 Northern Mauritania Outbreak in the Came-
lus dromedarius Species. Vector Borne Zoonotic Dis. 2014; 14: 856–861. https://doi.org/10.1089/vbz.
2014.1605 PMID: 25514121
39. Truscott J, Ferguson NM. Evaluating the Adequacy of Gravity Models as a Description of Human Mobil-
ity for Epidemic Modelling. PLoS Comput Biol. 2012; 8. https://doi.org/10.1371/journal.pcbi.1002699
PMID: 23093917
40. Xia Y, Bjørnstad ON, Grenfell BT. Measles Metapopulation Dynamics: A Gravity Model for Epidemio-
logical Coupling and Dynamics. Am Nat. 2004; 164: 267–281. https://doi.org/10.1086/422341 PMID:
15278849
41. Barrios JM, Verstraeten WW, Maes P, Aerts J-M, Farifteh J, Coppin P. Using the Gravity Model to Esti-
mate the Spatial Spread of Vector-Borne Diseases. Int J Environ Res Public Health. 2012; 9: 4346–
4364. https://doi.org/10.3390/ijerph9124346 PMID: 23202882
42. Sarzynska M, Udiani O, Zhang N. A study of gravity-linked metapopulation models for the spatial spread
of dengue fever. ArXiv13084589 Q-Bio Stat. 2013; Available: http://arxiv.org/abs/1308.4589
43. Hammami P, Lancelot R, Lesnoff M. Modelling the Dynamics of Post-Vaccination Immunity Rate in a
Population of Sahelian Sheep after a Vaccination Campaign against Peste des Petits Ruminants Virus.
PloS One. 2016; 11: e0161769. https://doi.org/10.1371/journal.pone.0161769 PMID: 27603710
Livestock mobility in Mauritania
PLOS ONE | https://doi.org/10.1371/journal.pone.0199547 July 18, 2018 21 / 21