Predictive Factors of Radiation-Induced Changes Following ...
13
Journal of Clinical Medicine Article Predictive Factors of Radiation-Induced Changes Following Single-Session Gamma Knife Radiosurgery for Arteriovenous Malformations Myung Ji Kim 1 , Kyung Won Chang 2 , So Hee Park 2 , Won Seok Chang 2 , Jong Hee Chang 2 , Jin Woo Chang 2 and Hyun Ho Jung 2, * Citation: Kim, M.J.; Chang, K.W.; Park, S.H.; Chang, W.S.; Chang, J.H.; Chang, J.W.; Jung, H.H. Predictive Factors of Radiation-Induced Changes Following Single-Session Gamma Knife Radiosurgery for Arteriovenous Malformations. J. Clin. Med. 2021, 10, 2186. https:// doi.org/10.3390/jcm10102186 Academic Editor: Gordon H. Baltuch Received: 17 April 2021 Accepted: 17 May 2021 Published: 19 May 2021 Publisher’s Note: MDPI stays neutral with regard to jurisdictional claims in published maps and institutional affil- iations. Copyright: © 2021 by the authors. Licensee MDPI, Basel, Switzerland. This article is an open access article distributed under the terms and conditions of the Creative Commons Attribution (CC BY) license (https:// creativecommons.org/licenses/by/ 4.0/). 1 Department of Neurosurgery, Korea University Ansan Hospital, Korea University College of Medicine, 123 Jeokgeum-ro, Danwon-gu, Ansan, Gyeonggi-do 15355, Korea; [email protected] 2 Department of Neurosurgery, Brain Research Institute, Yonsei University College of Medicine, Yonsei-ro 50-1, Seodamungu, Seoul 03722, Korea; [email protected] (K.W.C.); [email protected] (S.H.P.); [email protected] (W.S.C.); [email protected] (J.H.C.); [email protected] (J.W.C.) * Correspondence: [email protected]; Tel.: +82-2-2228-2150; Fax: +82-2-393-9979 Abstract: We evaluated for possible predictors of radiation-induced changes (RICs) after gamma knife radiosurgery (GKRS) for arteriovenous malformations (AVMs). We identified the nidal component within AVMs to analyze the correlation between the volume of brain parenchyma within the 50% isodose line (IDL) and RICs. We retrospectively reviewed patients with AVMs who underwent a single-session of GKRS at our institution between 2007 and 2017 with at least a 2-year minimum follow-up. Follow-up magnetic resonance images were evaluated for newly developed T2 signal changes and the proportions of nidus and intervening parenchyma were quantified. A total of 180 AVM patients (98 males and 82 females) with a median age of 34 years were included in the present study. The overall obliteration rate was 67.8%. The median target volume was 3.65 cc. The median nidus and parenchyma volumes within the 50% IDL were 1.54 cc and 2.41 cc, respectively. RICs were identified in 79 of the 180 patients (43.9%). AVMs associated with previous hemorrhages showed a significant inverse correlation with RICs. In a multivariate analysis, RICs were associated with a higher proportion of brain parenchyma within the 50% IDL (hazard ratio (HR) 169.033; p < 0.001) and inversely correlated with the proportion of nidus volume within the 50% IDL (HR 0.006; p < 0.001). Our study identified that a greater proportion of brain tissue between the nidus within the 50% IDL was significantly correlated with RICs. Nidus angioarchitectural complexity and the absence of a prior hemorrhage were also associated with RICs. The identification of possible predictors of RICs could facilitate radiosurgical planning and treatment decisions as well as the planning of appropriate follow-up after GKRS; this could minimize the risk of RICs, which would be particularly beneficial for the treatment of incidentally found asymptomatic AVMs. Keywords: adverse radiation effect (ARE); arteriovenous malformation (AVM); cerebrovascular disease (CVD); gamma knife radiosurgery (GKRS); stereotactic radiosurgery (SRS); radiation-induced change (RIC) 1. Introduction Gamma knife radiosurgery (GKRS) is a treatment option for cerebral arteriovenous malformations (AVMs) and is especially effective for AVMs located in deep or eloquent areas of the brain [1,2]. However, there are several adverse effects associated with GKRS for AVMs, including brain edema, necrosis, delayed cyst formation, arterial stenosis, en- capsulated hematoma, and hemorrhage after obliteration [3–8]. Radiation-induced changes (RICs) are the most common complication after GKRS for AVMs; they appear as T2-weighted hyperintensities on magnetic resonance imaging (MRI) and occur in 30–40% of patients [9–15]. Although most RICs are asymptomatic [10,12], the incidence of symptomatic RICs has J. Clin. Med. 2021, 10, 2186. https://doi.org/10.3390/jcm10102186 https://www.mdpi.com/journal/jcm
Transcript of Predictive Factors of Radiation-Induced Changes Following ...
Journal of
Clinical Medicine
Article
Predictive Factors of Radiation-Induced Changes FollowingSingle-Session Gamma Knife Radiosurgery for ArteriovenousMalformations
Myung Ji Kim 1, Kyung Won Chang 2, So Hee Park 2, Won Seok Chang 2 , Jong Hee Chang 2, Jin Woo Chang 2
and Hyun Ho Jung 2,*
�����������������
Citation: Kim, M.J.; Chang, K.W.;
Park, S.H.; Chang, W.S.; Chang, J.H.;
Chang, J.W.; Jung, H.H. Predictive
Factors of Radiation-Induced
Changes Following Single-Session
Gamma Knife Radiosurgery for
Arteriovenous Malformations. J. Clin.
Med. 2021, 10, 2186. https://
doi.org/10.3390/jcm10102186
Academic Editor: Gordon H. Baltuch
Received: 17 April 2021
Accepted: 17 May 2021
Published: 19 May 2021
Publisher’s Note: MDPI stays neutral
with regard to jurisdictional claims in
published maps and institutional affil-
iations.
Copyright: © 2021 by the authors.
Licensee MDPI, Basel, Switzerland.
This article is an open access article
distributed under the terms and
conditions of the Creative Commons
Attribution (CC BY) license (https://
creativecommons.org/licenses/by/
4.0/).
1 Department of Neurosurgery, Korea University Ansan Hospital, Korea University College of Medicine,123 Jeokgeum-ro, Danwon-gu, Ansan, Gyeonggi-do 15355, Korea; [email protected]
2 Department of Neurosurgery, Brain Research Institute, Yonsei University College of Medicine, Yonsei-ro 50-1,Seodamungu, Seoul 03722, Korea; [email protected] (K.W.C.); [email protected] (S.H.P.);[email protected] (W.S.C.); [email protected] (J.H.C.); [email protected] (J.W.C.)
* Correspondence: [email protected]; Tel.: +82-2-2228-2150; Fax: +82-2-393-9979
Abstract: We evaluated for possible predictors of radiation-induced changes (RICs) after gamma kniferadiosurgery (GKRS) for arteriovenous malformations (AVMs). We identified the nidal componentwithin AVMs to analyze the correlation between the volume of brain parenchyma within the 50%isodose line (IDL) and RICs. We retrospectively reviewed patients with AVMs who underwent asingle-session of GKRS at our institution between 2007 and 2017 with at least a 2-year minimumfollow-up. Follow-up magnetic resonance images were evaluated for newly developed T2 signalchanges and the proportions of nidus and intervening parenchyma were quantified. A total of 180AVM patients (98 males and 82 females) with a median age of 34 years were included in the presentstudy. The overall obliteration rate was 67.8%. The median target volume was 3.65 cc. The mediannidus and parenchyma volumes within the 50% IDL were 1.54 cc and 2.41 cc, respectively. RICs wereidentified in 79 of the 180 patients (43.9%). AVMs associated with previous hemorrhages showeda significant inverse correlation with RICs. In a multivariate analysis, RICs were associated with ahigher proportion of brain parenchyma within the 50% IDL (hazard ratio (HR) 169.033; p < 0.001) andinversely correlated with the proportion of nidus volume within the 50% IDL (HR 0.006; p < 0.001).Our study identified that a greater proportion of brain tissue between the nidus within the 50% IDLwas significantly correlated with RICs. Nidus angioarchitectural complexity and the absence of aprior hemorrhage were also associated with RICs. The identification of possible predictors of RICscould facilitate radiosurgical planning and treatment decisions as well as the planning of appropriatefollow-up after GKRS; this could minimize the risk of RICs, which would be particularly beneficialfor the treatment of incidentally found asymptomatic AVMs.
Keywords: adverse radiation effect (ARE); arteriovenous malformation (AVM); cerebrovasculardisease (CVD); gamma knife radiosurgery (GKRS); stereotactic radiosurgery (SRS); radiation-inducedchange (RIC)
1. Introduction
Gamma knife radiosurgery (GKRS) is a treatment option for cerebral arteriovenousmalformations (AVMs) and is especially effective for AVMs located in deep or eloquentareas of the brain [1,2]. However, there are several adverse effects associated with GKRSfor AVMs, including brain edema, necrosis, delayed cyst formation, arterial stenosis, en-capsulated hematoma, and hemorrhage after obliteration [3–8]. Radiation-induced changes(RICs) are the most common complication after GKRS for AVMs; they appear as T2-weightedhyperintensities on magnetic resonance imaging (MRI) and occur in 30–40% of patients [9–15].Although most RICs are asymptomatic [10,12], the incidence of symptomatic RICs has
J. Clin. Med. 2021, 10, 2186. https://doi.org/10.3390/jcm10102186 https://www.mdpi.com/journal/jcm
J. Clin. Med. 2021, 10, 2186 2 of 13
been reported to be between 3.7% and 10.8% [12,16,17]. While most symptomatic RICs aretransient and can be medically manageable, a few patients (1–5.1%) develop a permanentneurologic deficit [12,14,16,17]. Previous studies have suggested that AVM location, nidusvolume, radiation dose, and the brain volume included in the 12 Gy dose are predictivefactors for RICs [11–14,18]. Importantly, AVMs contain no pathological tissue and thedelivered dose is concentrated on a confined target volume [19]; thus, it is not possibleto exclude brain parenchyma from radiation exposure, which can lead to radiation injuryto the intervening brain parenchyma within the isodose line (IDL) [20]. The underlyingmechanism of RICs remains to be elucidated. Although target volume has been suggestedas an important predictor of RICs [10,11,14,17,21,22], the incidence of RICs in large AVMsis not consistently higher than that of smaller AVMs. AVMs that are widespread andintermingled with brain parenchyma are more likely to receive a higher dose of radiationthan AVMs with compact vascular structures and little intervening brain tissue [20]. Wehypothesize that RICs might be associated with injuries to the brain parenchyma. In thepresent study, we evaluated possible predictive factors associated with the development ofRICs after GKRS for AVMs. We attempted to identify nidal components within AVMs toanalyze the correlation between the volume of brain parenchyma within the 50% IDL andRICs.
2. Materials and Methods2.1. Patient Characteristics
A database of 453 patients with AVMs, who underwent GKRS between January 2007and December 2017 in our center, was retrospectively reviewed. This study excludedpatients who had less than 2 years of follow-up or who had been previously treated byrepeat or volume-staged GKRS, resection or embolization in our center or at anotherinstitution; this was to allow us to evaluate the effect of a single-session of GKRS. Allpatients had at least 2 years of imaging follow-up that included thin-slice post-GKRSMRI sequences for volumetric analysis, and cerebral angiography follow-up studies at ourhospital available for analysis. Patient clinical data were reviewed, including demographics,imaging findings prior to GKRS, radiosurgical parameters, and follow-up images. AVMswere classified using the Spetzler–Martin (SM) grade, Virginia Radiosurgery AVM Scale(VRAS), and Pollock–Flickinger score [23]. This study obtained full ethical approval fromour Institutional Review Board (IRB).
2.2. Gamma Knife Radiosurgery
The procedure for GKRS has been described previously [23–25]. In brief, all patientsunderwent stereotactic frame placement and then neuroimaging including MRI and digitalsubtraction angiography (DSA) [23]. Radiosurgery was performed using the LeksellGamma Knife Unit Model C between 2007 and 2008, and the Perfexion Model (ElektaAB, Elekta Company, Stockholm, Sweden) between 2009 and 2017. Stereotactic MRI withT1-weighted contrast-enhanced and T2-weighted imaging sequences, as well as DSA usingLeksell GammaPlan (Elekta AB, Stockholm, Sweden), were used to delineate the AVMnidus. A neurosurgeon and a medical physicist prescribed the radiation dose based on thelocation of the AVM nidus and the calculated lesion volume [23].
2.3. Neuroimaging Follow-Up and Outcome Assessment
Following GKRS, all patients were evaluated clinically and MRI and MR angiography(MRA) with time-of-flight (TOF) studies were performed at 6-month intervals for the first 2years, then annually thereafter. It was suggested that a cerebral angiogram be performedonce the nidus was deemed obliterated on MRI/MRA [23]. RICs were identified as newlydeveloped perinidal hyperintensities on T2-weighted MRI and were classified accordingto the grading system proposed by Yen et al. [7]. Symptomatic RICs were defined asRICs associated with any newly developed headache, seizure, or neurologic deficit. Theabsence of nidus filling on the angiography was defined as total obliteration of the AVM.
J. Clin. Med. 2021, 10, 2186 3 of 13
If there was no flow void on MRI and vascular filling on MRA in case the patient did nothave an angiogram, the AVM was considered obliterated [23,24]. The incidence of latentperiod hemorrhage and delayed cyst formation were assessed using MRI throughout thefollow-up period.
2.4. Volumetric Analysis
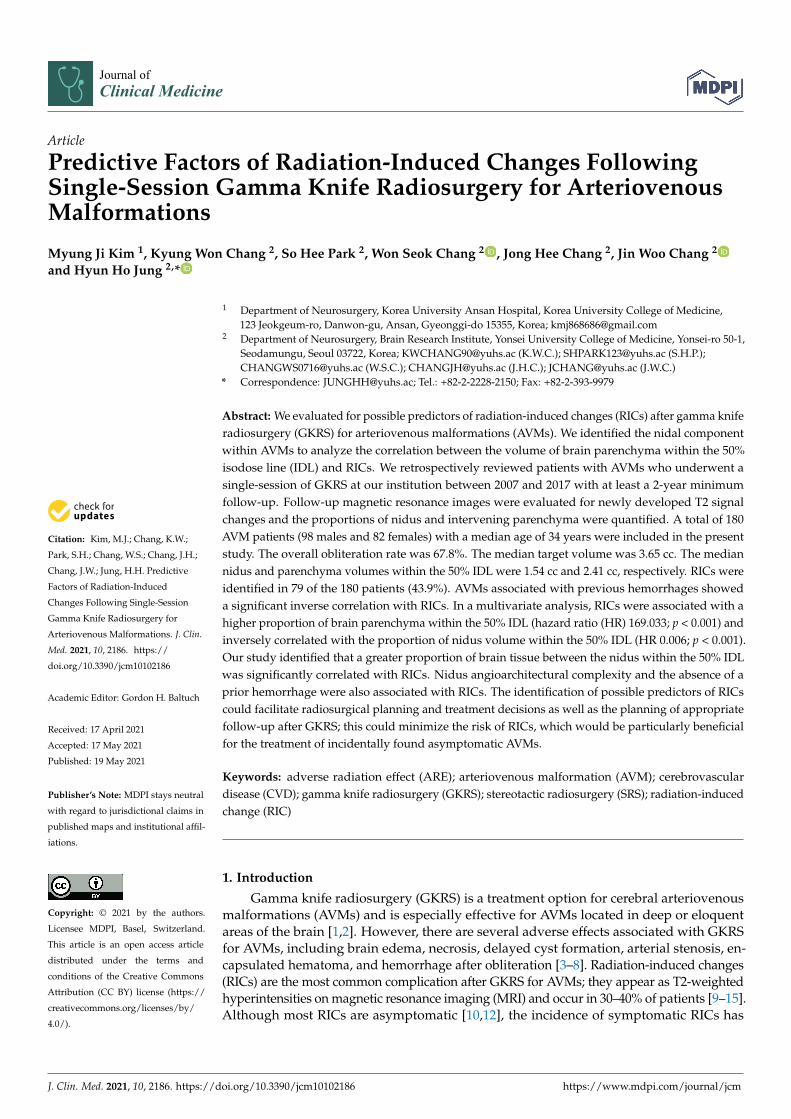
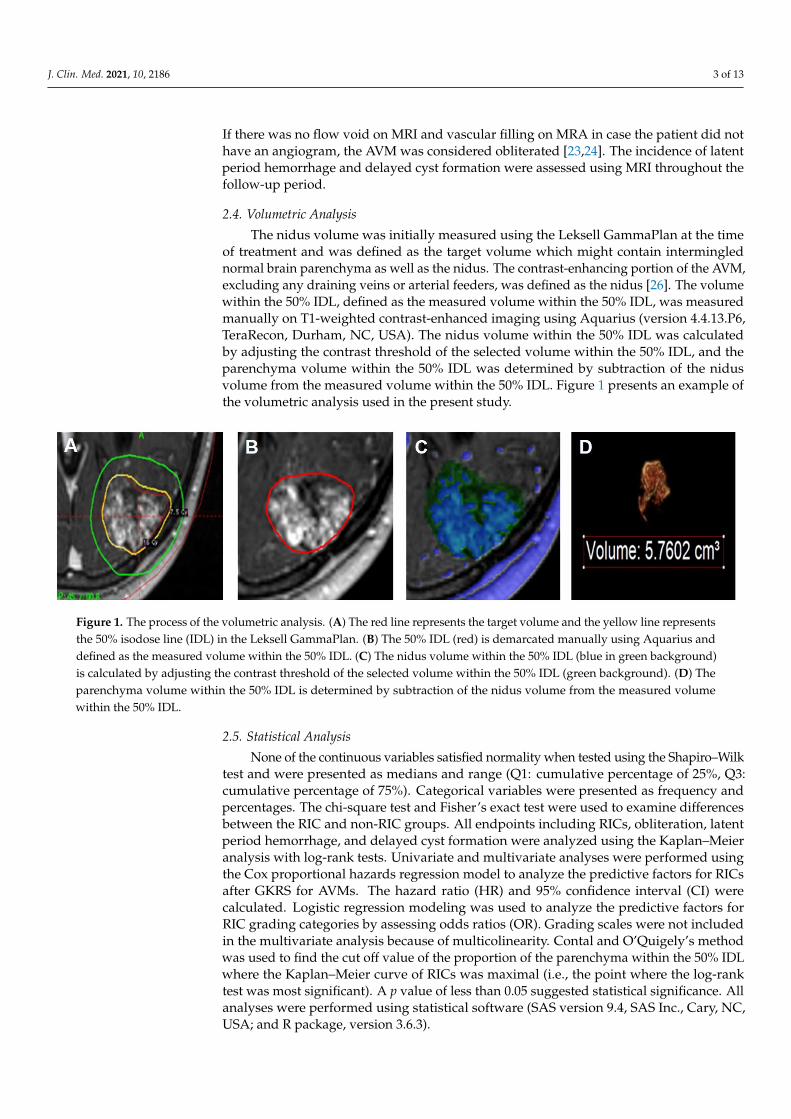
The nidus volume was initially measured using the Leksell GammaPlan at the timeof treatment and was defined as the target volume which might contain interminglednormal brain parenchyma as well as the nidus. The contrast-enhancing portion of the AVM,excluding any draining veins or arterial feeders, was defined as the nidus [26]. The volumewithin the 50% IDL, defined as the measured volume within the 50% IDL, was measuredmanually on T1-weighted contrast-enhanced imaging using Aquarius (version 4.4.13.P6,TeraRecon, Durham, NC, USA). The nidus volume within the 50% IDL was calculatedby adjusting the contrast threshold of the selected volume within the 50% IDL, and theparenchyma volume within the 50% IDL was determined by subtraction of the nidusvolume from the measured volume within the 50% IDL. Figure 1 presents an example ofthe volumetric analysis used in the present study.
J. Clin. Med. 2021, 10, x FOR PEER REVIEW 3 of 14
tified as newly developed perinidal hyperintensities on T2-weighted MRI and were clas-sified according to the grading system proposed by Yen et al. [7]. Symptomatic RICs were defined as RICs associated with any newly developed headache, seizure, or neurologic deficit. The absence of nidus filling on the angiography was defined as total obliteration of the AVM. If there was no flow void on MRI and vascular filling on MRA in case the patient did not have an angiogram, the AVM was considered obliterated [23,24]. The in-cidence of latent period hemorrhage and delayed cyst formation were assessed using MRI throughout the follow-up period.
2.4. Volumetric Analysis
Figure 1. The process of the volumetric analysis. (A) The red line represents the target volume and the yellow line repre-sents the 50% isodose line (IDL) in the Leksell GammaPlan. (B) The 50% IDL (red) is demarcated manually using Aquarius and defined as the measured volume within the 50% IDL. (C) The nidus volume within the 50% IDL (blue in green back-ground) is calculated by adjusting the contrast threshold of the selected volume within the 50% IDL (green background). (D) The parenchyma volume within the 50% IDL is determined by subtraction of the nidus volume from the measuredvolume within the 50% IDL.
2.5. Statistical Analysis None of the continuous variables satisfied normality when tested using the Shapiro–
Wilk test and were presented as medians and range (Q1: cumulative percentage of 25%, Q3: cumulative percentage of 75%). Categorical variables were presented as frequency and percentages. The chi-square test and Fisher’s exact test were used to examine differ-ences between the RIC and non-RIC groups. All endpoints including RICs, obliteration, latent period hemorrhage, and delayed cyst formation were analyzed using the Kaplan–Meier analysis with log-rank tests. Univariate and multivariate analyses were performed using the Cox proportional hazards regression model to analyze the predictive factors for RICs after GKRS for AVMs. The hazard ratio (HR) and 95% confidence interval (CI) were calculated. Logistic regression modeling was used to analyze the predictive factors for RIC grading categories by assessing odds ratios (OR). Grading scales were not included in the multivariate analysis because of multicolinearity. Contal and O’Quigely’s method was used to find the cut off value of the proportion of the parenchyma within the 50% IDL where the Kaplan–Meier curve of RICs was maximal (i.e., the point where the log-rank
Figure 1. The process of the volumetric analysis. (A) The red line represents the target volume and the yellow line representsthe 50% isodose line (IDL) in the Leksell GammaPlan. (B) The 50% IDL (red) is demarcated manually using Aquarius anddefined as the measured volume within the 50% IDL. (C) The nidus volume within the 50% IDL (blue in green background)is calculated by adjusting the contrast threshold of the selected volume within the 50% IDL (green background). (D) Theparenchyma volume within the 50% IDL is determined by subtraction of the nidus volume from the measured volumewithin the 50% IDL.
2.5. Statistical Analysis
None of the continuous variables satisfied normality when tested using the Shapiro–Wilktest and were presented as medians and range (Q1: cumulative percentage of 25%, Q3:cumulative percentage of 75%). Categorical variables were presented as frequency andpercentages. The chi-square test and Fisher’s exact test were used to examine differencesbetween the RIC and non-RIC groups. All endpoints including RICs, obliteration, latentperiod hemorrhage, and delayed cyst formation were analyzed using the Kaplan–Meieranalysis with log-rank tests. Univariate and multivariate analyses were performed usingthe Cox proportional hazards regression model to analyze the predictive factors for RICsafter GKRS for AVMs. The hazard ratio (HR) and 95% confidence interval (CI) werecalculated. Logistic regression modeling was used to analyze the predictive factors forRIC grading categories by assessing odds ratios (OR). Grading scales were not includedin the multivariate analysis because of multicolinearity. Contal and O’Quigely’s methodwas used to find the cut off value of the proportion of the parenchyma within the 50% IDLwhere the Kaplan–Meier curve of RICs was maximal (i.e., the point where the log-ranktest was most significant). A p value of less than 0.05 suggested statistical significance. Allanalyses were performed using statistical software (SAS version 9.4, SAS Inc., Cary, NC,USA; and R package, version 3.6.3).
J. Clin. Med. 2021, 10, 2186 4 of 13
3. Results3.1. Patient Demographics, AVM Characteristics, and Radiosurgical Parameters
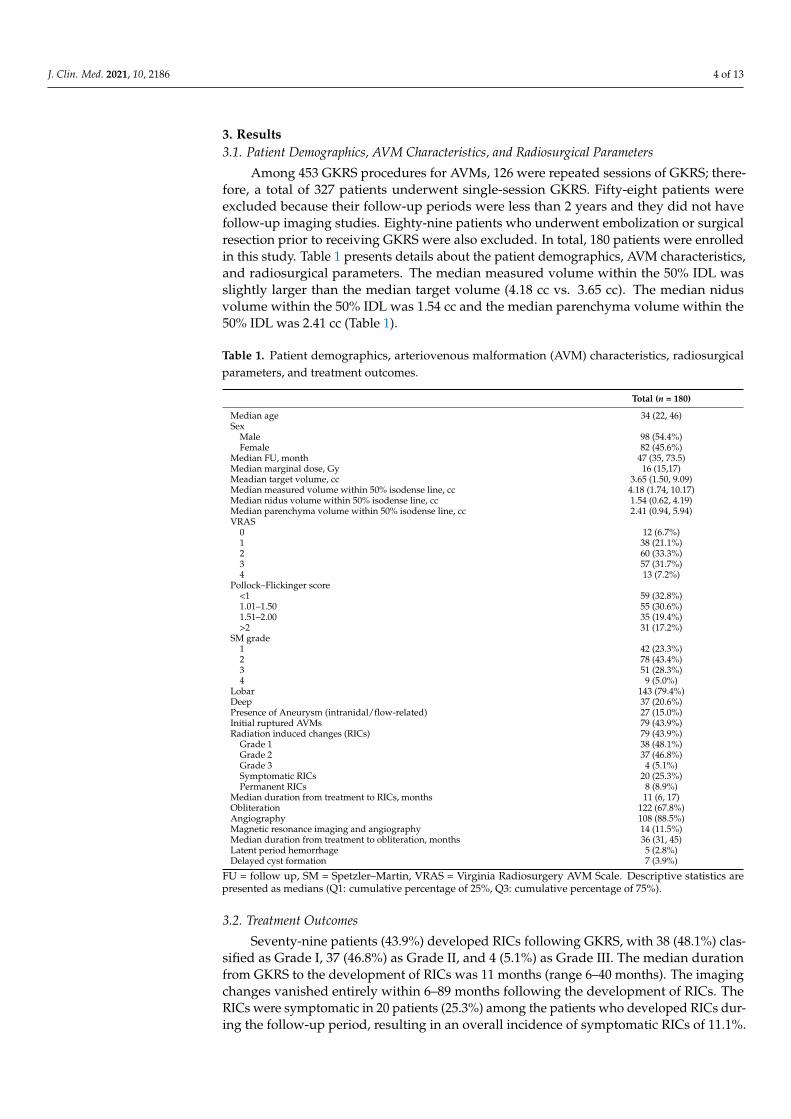
Among 453 GKRS procedures for AVMs, 126 were repeated sessions of GKRS; there-fore, a total of 327 patients underwent single-session GKRS. Fifty-eight patients wereexcluded because their follow-up periods were less than 2 years and they did not havefollow-up imaging studies. Eighty-nine patients who underwent embolization or surgicalresection prior to receiving GKRS were also excluded. In total, 180 patients were enrolledin this study. Table 1 presents details about the patient demographics, AVM characteristics,and radiosurgical parameters. The median measured volume within the 50% IDL wasslightly larger than the median target volume (4.18 cc vs. 3.65 cc). The median nidusvolume within the 50% IDL was 1.54 cc and the median parenchyma volume within the50% IDL was 2.41 cc (Table 1).
Table 1. Patient demographics, arteriovenous malformation (AVM) characteristics, radiosurgicalparameters, and treatment outcomes.
Total (n = 180)
Median age 34 (22, 46)Sex
Male 98 (54.4%)Female 82 (45.6%)
Median FU, month 47 (35, 73.5)Median marginal dose, Gy 16 (15,17)Meadian target volume, cc 3.65 (1.50, 9.09)Median measured volume within 50% isodense line, cc 4.18 (1.74, 10.17)Median nidus volume within 50% isodense line, cc 1.54 (0.62, 4.19)Median parenchyma volume within 50% isodense line, cc 2.41 (0.94, 5.94)VRAS
0 12 (6.7%)1 38 (21.1%)2 60 (33.3%)3 57 (31.7%)4 13 (7.2%)
Pollock–Flickinger score<1 59 (32.8%)1.01–1.50 55 (30.6%)1.51–2.00 35 (19.4%)>2 31 (17.2%)
SM grade1 42 (23.3%)2 78 (43.4%)3 51 (28.3%)4 9 (5.0%)
Lobar 143 (79.4%)Deep 37 (20.6%)Presence of Aneurysm (intranidal/flow-related) 27 (15.0%)Initial ruptured AVMs 79 (43.9%)Radiation induced changes (RICs) 79 (43.9%)
Grade 1 38 (48.1%)Grade 2 37 (46.8%)Grade 3 4 (5.1%)Symptomatic RICs 20 (25.3%)Permanent RICs 8 (8.9%)
Median duration from treatment to RICs, months 11 (6, 17)Obliteration 122 (67.8%)Angiography 108 (88.5%)Magnetic resonance imaging and angiography 14 (11.5%)Median duration from treatment to obliteration, months 36 (31, 45)Latent period hemorrhage 5 (2.8%)Delayed cyst formation 7 (3.9%)
FU = follow up, SM = Spetzler–Martin, VRAS = Virginia Radiosurgery AVM Scale. Descriptive statistics arepresented as medians (Q1: cumulative percentage of 25%, Q3: cumulative percentage of 75%).
3.2. Treatment Outcomes
Seventy-nine patients (43.9%) developed RICs following GKRS, with 38 (48.1%) clas-sified as Grade I, 37 (46.8%) as Grade II, and 4 (5.1%) as Grade III. The median durationfrom GKRS to the development of RICs was 11 months (range 6–40 months). The imagingchanges vanished entirely within 6–89 months following the development of RICs. TheRICs were symptomatic in 20 patients (25.3%) among the patients who developed RICs dur-ing the follow-up period, resulting in an overall incidence of symptomatic RICs of 11.1%.
J. Clin. Med. 2021, 10, 2186 5 of 13
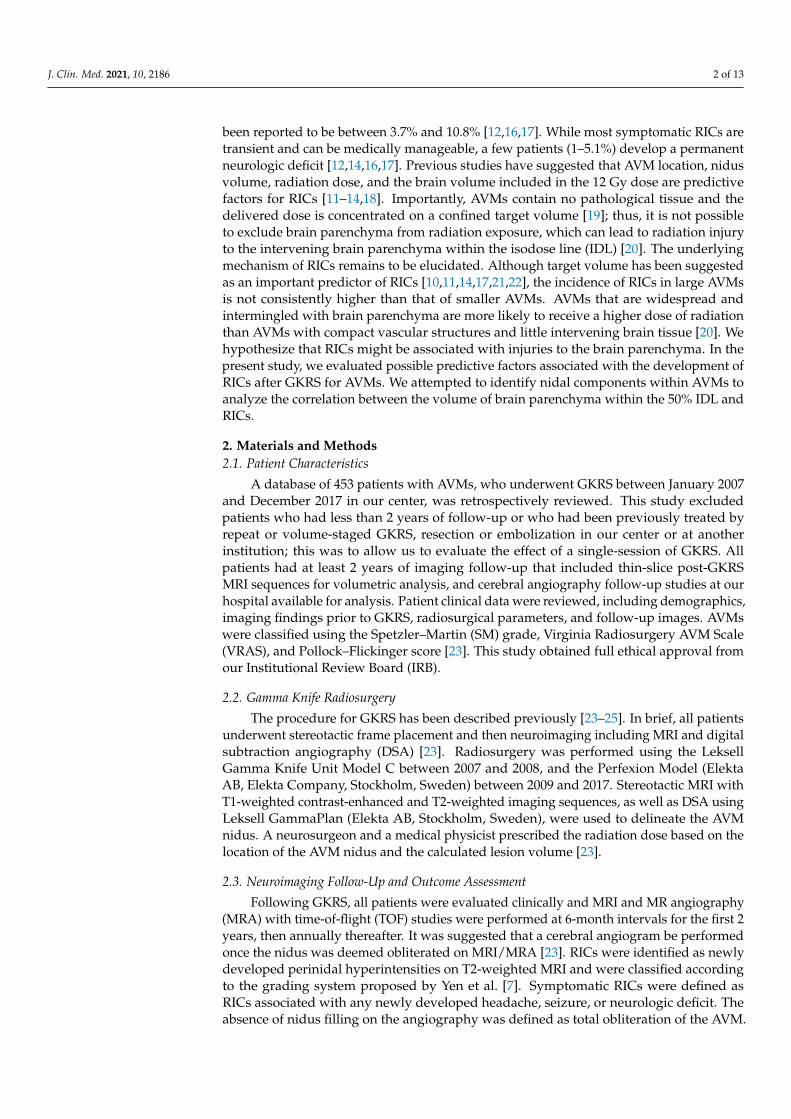
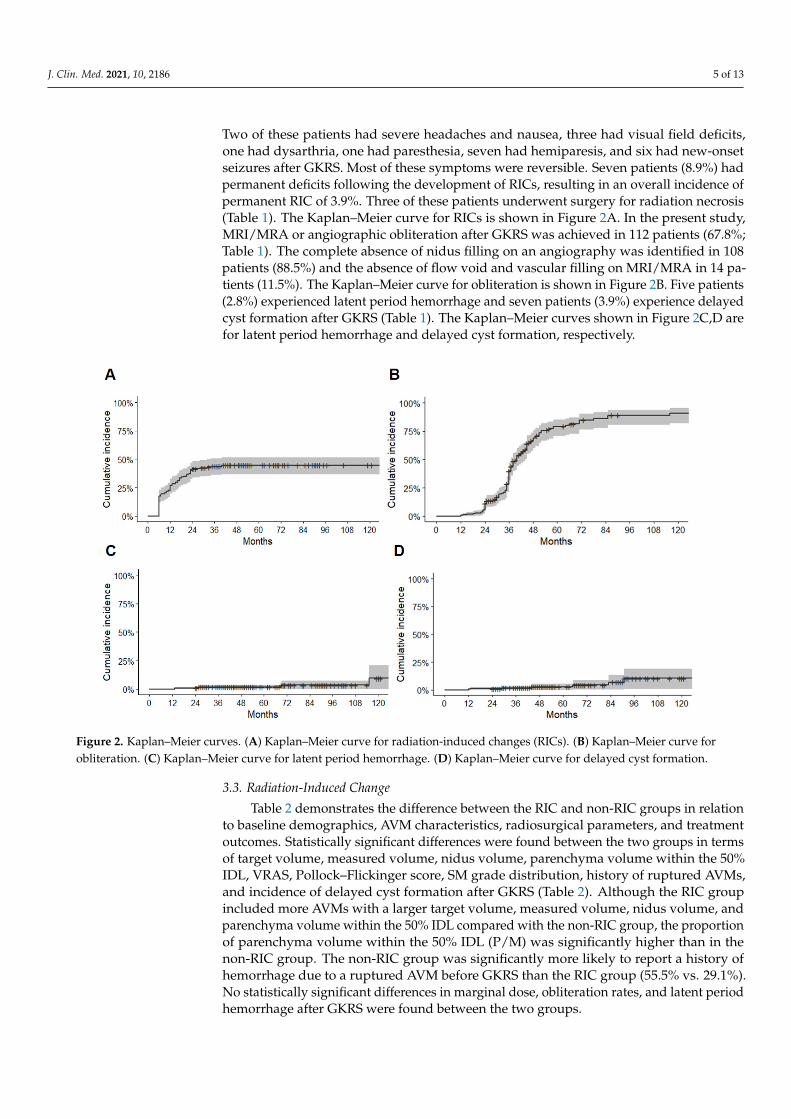
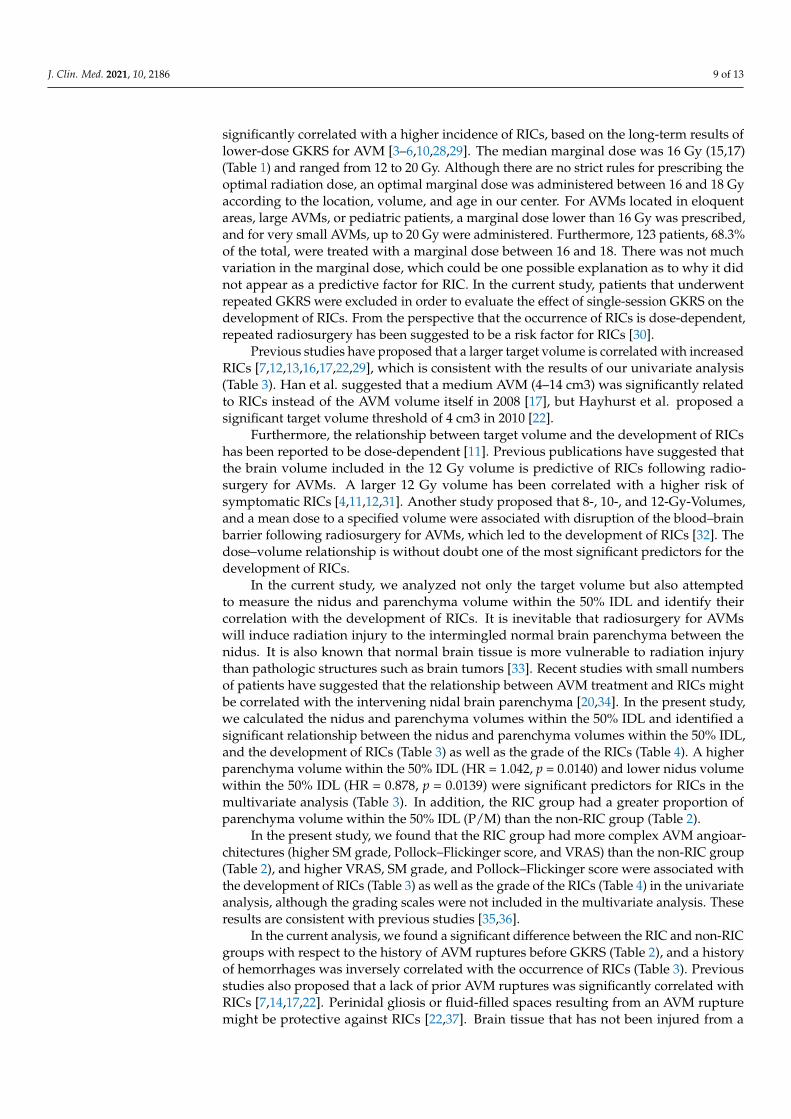
Two of these patients had severe headaches and nausea, three had visual field deficits,one had dysarthria, one had paresthesia, seven had hemiparesis, and six had new-onsetseizures after GKRS. Most of these symptoms were reversible. Seven patients (8.9%) hadpermanent deficits following the development of RICs, resulting in an overall incidence ofpermanent RIC of 3.9%. Three of these patients underwent surgery for radiation necrosis(Table 1). The Kaplan–Meier curve for RICs is shown in Figure 2A. In the present study,MRI/MRA or angiographic obliteration after GKRS was achieved in 112 patients (67.8%;Table 1). The complete absence of nidus filling on an angiography was identified in 108patients (88.5%) and the absence of flow void and vascular filling on MRI/MRA in 14 pa-tients (11.5%). The Kaplan–Meier curve for obliteration is shown in Figure 2B. Five patients(2.8%) experienced latent period hemorrhage and seven patients (3.9%) experience delayedcyst formation after GKRS (Table 1). The Kaplan–Meier curves shown in Figure 2C,D arefor latent period hemorrhage and delayed cyst formation, respectively.
J. Clin. Med. 2021, 10, x FOR PEER REVIEW 6 of 14
Figure 2. Kaplan–Meier curves. (A) Kaplan–Meier curve for radiation-induced changes (RICs). (B) Kaplan–Meier curve for obliteration. (C) Kaplan–Meier curve for latent period hemorrhage. (D) Kaplan–Meier curve for delayed cyst for-mation.
3.3. Radiation-Induced Change Table 2 demonstrates the difference between the RIC and non-RIC groups in relation
to baseline demographics, AVM characteristics, radiosurgical parameters, and treatment outcomes. Statistically significant differences were found between the two groups in terms of target volume, measured volume, nidus volume, parenchyma volume within the 50% IDL, VRAS, Pollock–Flickinger score, SM grade distribution, history of ruptured AVMs, and incidence of delayed cyst formation after GKRS (Table 2). Although the RIC group included more AVMs with a larger target volume, measured volume, nidus vol-ume, and parenchyma volume within the 50% IDL compared with the non-RIC group, the proportion of parenchyma volume within the 50% IDL (P/M) was significantly higher than in the non-RIC group. The non-RIC group was significantly more likely to report a history of hemorrhage due to a ruptured AVM before GKRS than the RIC group (55.5% vs. 29.1%). No statistically significant differences in marginal dose, obliteration rates, and latent period hemorrhage after GKRS were found between the two groups.
Table 2. Comparison of baseline demographic data, arteriovenous malformation (AVM) characteristics, radiosurgical pa-rameters, and treatment outcomes between the radiation-induced change (RIC) group and non-RIC group.
Non-RIC (n = 101)
RIC (n = 79) p-Value
Median age 32 (16,45) 37 (25,47) 0.0576 Sex 0.7604
Male 56 (55.5%) 42 (53.2%) Female 45 (44.5%) 37 (46.8%)
Median marginal dose, Gy 16 (15, 17) 16 (15, 17) 0.1079
Figure 2. Kaplan–Meier curves. (A) Kaplan–Meier curve for radiation-induced changes (RICs). (B) Kaplan–Meier curve forobliteration. (C) Kaplan–Meier curve for latent period hemorrhage. (D) Kaplan–Meier curve for delayed cyst formation.
3.3. Radiation-Induced Change
Table 2 demonstrates the difference between the RIC and non-RIC groups in relationto baseline demographics, AVM characteristics, radiosurgical parameters, and treatmentoutcomes. Statistically significant differences were found between the two groups in termsof target volume, measured volume, nidus volume, parenchyma volume within the 50%IDL, VRAS, Pollock–Flickinger score, SM grade distribution, history of ruptured AVMs,and incidence of delayed cyst formation after GKRS (Table 2). Although the RIC groupincluded more AVMs with a larger target volume, measured volume, nidus volume, andparenchyma volume within the 50% IDL compared with the non-RIC group, the proportionof parenchyma volume within the 50% IDL (P/M) was significantly higher than in thenon-RIC group. The non-RIC group was significantly more likely to report a history ofhemorrhage due to a ruptured AVM before GKRS than the RIC group (55.5% vs. 29.1%).No statistically significant differences in marginal dose, obliteration rates, and latent periodhemorrhage after GKRS were found between the two groups.
J. Clin. Med. 2021, 10, 2186 6 of 13
Table 2. Comparison of baseline demographic data, arteriovenous malformation (AVM) characteristics, radiosurgicalparameters, and treatment outcomes between the radiation-induced change (RIC) group and non-RIC group.
Non-RIC(n = 101)
RIC(n = 79) p-Value
Median age 32 (16,45) 37 (25,47) 0.0576Sex 0.7604
Male 56 (55.5%) 42 (53.2%)Female 45 (44.5%) 37 (46.8%)
Median marginal dose, Gy 16 (15, 17) 16 (15, 17) 0.1079Median target volume, cc 2.0 (0.9, 4.8) 6.5 (2.9, 13.5) <0.0001
Median measured volume within 50% isodense line, cc 2.3 (1.0, 5.6) 6.7 (3.6, 15.8) <0.0001Median nidus volume within 50% isodense line, cc 0.9 (0.5, 2.6) 2.6 (1.1, 5.9) <0.0001
Median parenchyma volume within 50% isodense line, cc 1.3 (0.6, 2.8) 4.7 (2.2, 9.8) <0.0001Median N/M
(nidus/measured volume within 50% isodense line) 0.5 (0.3, 0.6) 0.3 (0.3, 0.4) <0.0001
Median P/M(parenchyma/measured volume within 50% isodense line) 0.5 (0.4, 0.7) 0.7 (0.6, 0.8) <0.0001
VRAS 0.00750 11 (10.9%) 1 (1.3%)1 24 (23.8%) 14 (17.7%)2 37 (36.6%) 23 (29.1%)3 23 (22.8%) 34 (43.0%)4 6 (5.9%) 7 (8.9%)
Pollock–Flickinger score <0.0001< 1 48 (47.5%) 11 (13.9%)
1.01–1.50 29 (28.7%) 26 (32.9%)1.51–2.00 15 (14.9%) 20 (25.3%)
> 2 9 (8.9%) 22 (27.9%)SM grade 0.0005
1 32 (31.7%) 10 (12.7%)2 47 (46.5%) 31 (39.2%)3 20 (19.8%) 31 (39.2%)4 2 (2.0%) 7 (8.9%)
Location 0.1151Lobar 76 (75.3%) 67 (84.8%)Deep 25 (24.7%) 12 (15.2%)
Presence of Aneurysm (intranidal/flow-related)Initial ruptured AVMs 56 (55.5%) 23 (29.1%) 0.0004
Obliteration 74 (73.3%) 48 (60.8%)0.0748Angiography 65 (87.8%) 43 (89.6%)
Magnetic resonance imaging and angiography 9 (12.2%) 5 (10.4%)Latent period hemorrhage 2 (2.0%) 3 (3.8%) 0.6551
Delayed cyst formation 1 (1.0%) 6 (7.6%) 0.0446
SM = Spetzler–Martin, VRAS = Virginia Radiosurgery AVM Scale. Descriptive statistics are presented as medians (Q1: cumulativepercentage of 25%, Q3: cumulative percentage of 75%). Boldface type indicates statistical significance (p < 0.05).
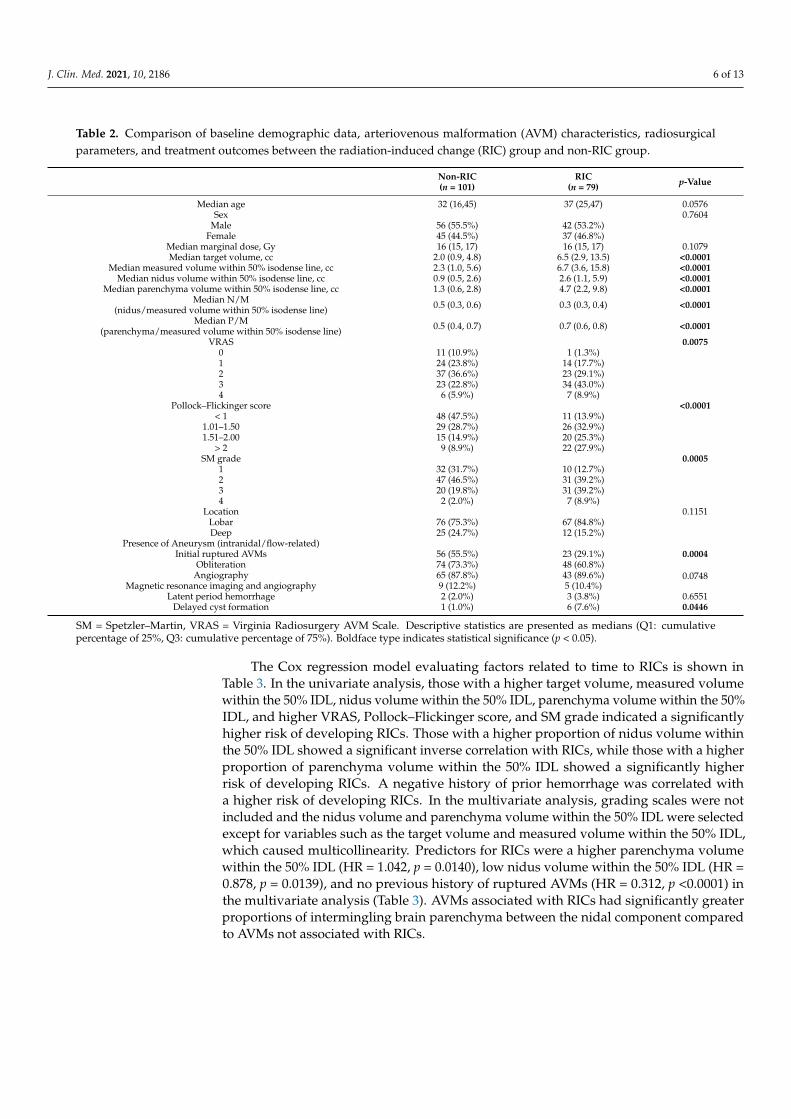
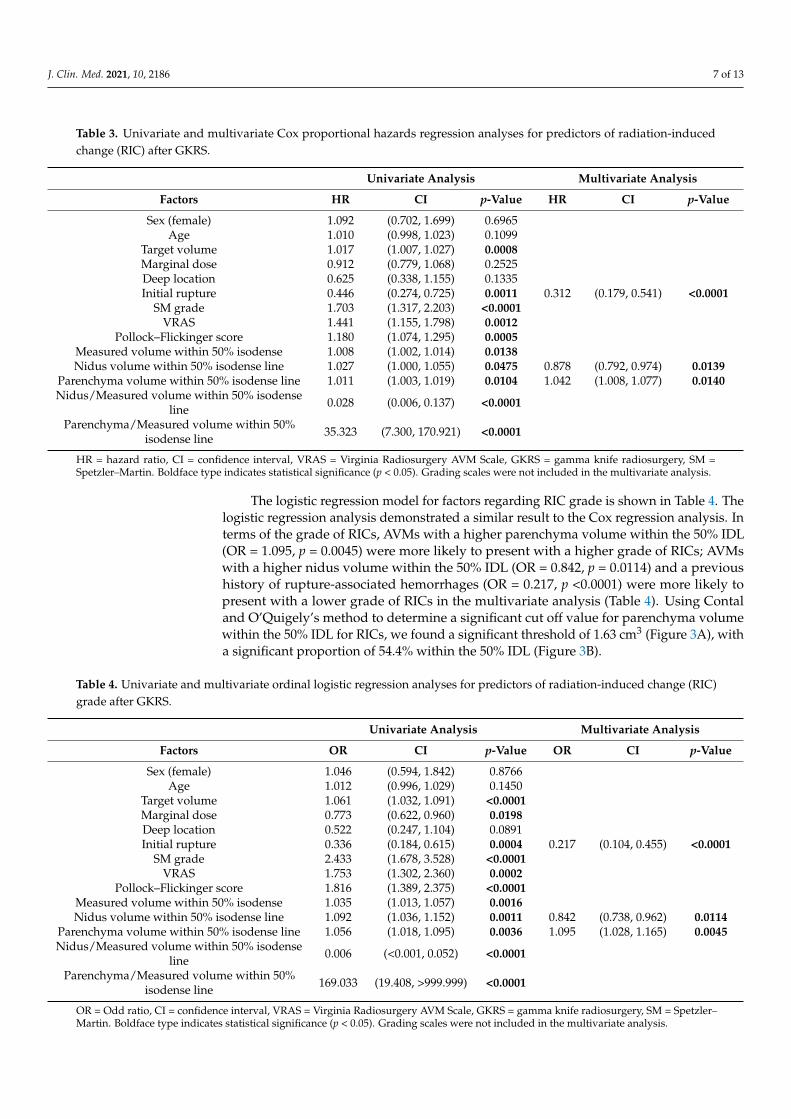
The Cox regression model evaluating factors related to time to RICs is shown inTable 3. In the univariate analysis, those with a higher target volume, measured volumewithin the 50% IDL, nidus volume within the 50% IDL, parenchyma volume within the 50%IDL, and higher VRAS, Pollock–Flickinger score, and SM grade indicated a significantlyhigher risk of developing RICs. Those with a higher proportion of nidus volume withinthe 50% IDL showed a significant inverse correlation with RICs, while those with a higherproportion of parenchyma volume within the 50% IDL showed a significantly higherrisk of developing RICs. A negative history of prior hemorrhage was correlated witha higher risk of developing RICs. In the multivariate analysis, grading scales were notincluded and the nidus volume and parenchyma volume within the 50% IDL were selectedexcept for variables such as the target volume and measured volume within the 50% IDL,which caused multicollinearity. Predictors for RICs were a higher parenchyma volumewithin the 50% IDL (HR = 1.042, p = 0.0140), low nidus volume within the 50% IDL (HR =0.878, p = 0.0139), and no previous history of ruptured AVMs (HR = 0.312, p <0.0001) inthe multivariate analysis (Table 3). AVMs associated with RICs had significantly greaterproportions of intermingling brain parenchyma between the nidal component comparedto AVMs not associated with RICs.
J. Clin. Med. 2021, 10, 2186 7 of 13
Table 3. Univariate and multivariate Cox proportional hazards regression analyses for predictors of radiation-inducedchange (RIC) after GKRS.
Univariate Analysis Multivariate Analysis
Factors HR CI p-Value HR CI p-Value
Sex (female) 1.092 (0.702, 1.699) 0.6965Age 1.010 (0.998, 1.023) 0.1099
Target volume 1.017 (1.007, 1.027) 0.0008Marginal dose 0.912 (0.779, 1.068) 0.2525Deep location 0.625 (0.338, 1.155) 0.1335Initial rupture 0.446 (0.274, 0.725) 0.0011 0.312 (0.179, 0.541) <0.0001
SM grade 1.703 (1.317, 2.203) <0.0001VRAS 1.441 (1.155, 1.798) 0.0012
Pollock–Flickinger score 1.180 (1.074, 1.295) 0.0005Measured volume within 50% isodense 1.008 (1.002, 1.014) 0.0138Nidus volume within 50% isodense line 1.027 (1.000, 1.055) 0.0475 0.878 (0.792, 0.974) 0.0139
Parenchyma volume within 50% isodense line 1.011 (1.003, 1.019) 0.0104 1.042 (1.008, 1.077) 0.0140Nidus/Measured volume within 50% isodense
line 0.028 (0.006, 0.137) <0.0001
Parenchyma/Measured volume within 50%isodense line 35.323 (7.300, 170.921) <0.0001
HR = hazard ratio, CI = confidence interval, VRAS = Virginia Radiosurgery AVM Scale, GKRS = gamma knife radiosurgery, SM =Spetzler–Martin. Boldface type indicates statistical significance (p < 0.05). Grading scales were not included in the multivariate analysis.
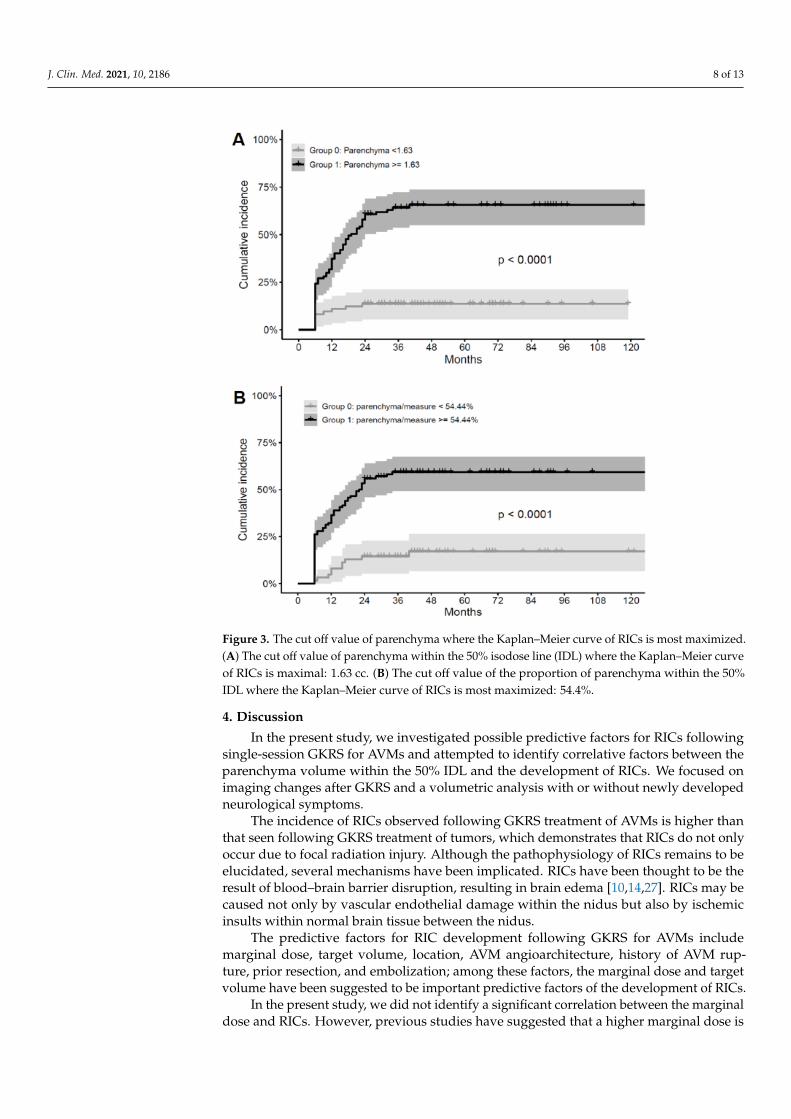
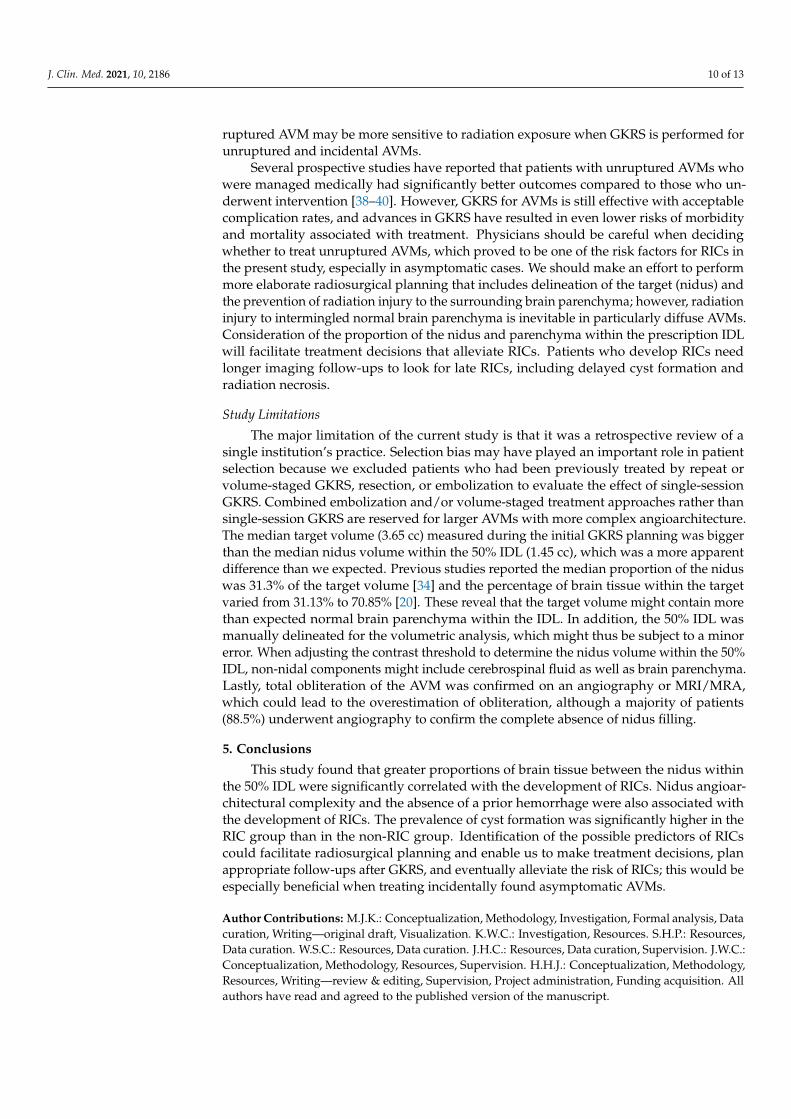
The logistic regression model for factors regarding RIC grade is shown in Table 4. Thelogistic regression analysis demonstrated a similar result to the Cox regression analysis. Interms of the grade of RICs, AVMs with a higher parenchyma volume within the 50% IDL(OR = 1.095, p = 0.0045) were more likely to present with a higher grade of RICs; AVMswith a higher nidus volume within the 50% IDL (OR = 0.842, p = 0.0114) and a previoushistory of rupture-associated hemorrhages (OR = 0.217, p <0.0001) were more likely topresent with a lower grade of RICs in the multivariate analysis (Table 4). Using Contaland O’Quigely’s method to determine a significant cut off value for parenchyma volumewithin the 50% IDL for RICs, we found a significant threshold of 1.63 cm3 (Figure 3A), witha significant proportion of 54.4% within the 50% IDL (Figure 3B).
Table 4. Univariate and multivariate ordinal logistic regression analyses for predictors of radiation-induced change (RIC)grade after GKRS.
Univariate Analysis Multivariate Analysis
Factors OR CI p-Value OR CI p-Value
Sex (female) 1.046 (0.594, 1.842) 0.8766Age 1.012 (0.996, 1.029) 0.1450
Target volume 1.061 (1.032, 1.091) <0.0001Marginal dose 0.773 (0.622, 0.960) 0.0198Deep location 0.522 (0.247, 1.104) 0.0891Initial rupture 0.336 (0.184, 0.615) 0.0004 0.217 (0.104, 0.455) <0.0001
SM grade 2.433 (1.678, 3.528) <0.0001VRAS 1.753 (1.302, 2.360) 0.0002
Pollock–Flickinger score 1.816 (1.389, 2.375) <0.0001Measured volume within 50% isodense 1.035 (1.013, 1.057) 0.0016Nidus volume within 50% isodense line 1.092 (1.036, 1.152) 0.0011 0.842 (0.738, 0.962) 0.0114
Parenchyma volume within 50% isodense line 1.056 (1.018, 1.095) 0.0036 1.095 (1.028, 1.165) 0.0045Nidus/Measured volume within 50% isodense
line 0.006 (<0.001, 0.052) <0.0001
Parenchyma/Measured volume within 50%isodense line 169.033 (19.408, >999.999) <0.0001
OR = Odd ratio, CI = confidence interval, VRAS = Virginia Radiosurgery AVM Scale, GKRS = gamma knife radiosurgery, SM = Spetzler–Martin. Boldface type indicates statistical significance (p < 0.05). Grading scales were not included in the multivariate analysis.
J. Clin. Med. 2021, 10, 2186 8 of 13
J. Clin. Med. 2021, 10, x FOR PEER REVIEW 9 of 14
Parenchyma volume within 50% isodense line 1.056 (1.018, 1.095) 0.0036 1.095 (1.028, 1.165) 0.0045 Nidus/Measured volume within 50% isodense line 0.006 (<0.001, 0.052) <0.0001
Parenchyma/Measured volume within 50% isodense line
169.033 (19.408, >999.999) <0.0001
OR = Odd ratio, , CI = confidence interval, VRAS = Virginia Radiosurgery AVM Scale, GKRS = gamma knife radiosurgery, SM = Spetzler–Martin. Boldface type indicates statistical significance (p < 0.05). Grading scales were not included in the multivariate analysis.
Figure 3. The cut off value of parenchyma where the Kaplan–Meier curve of RICs is most maxim-ized. (A) The cut off value of parenchyma within the 50% isodose line (IDL) where the Kaplan–Meier curve of RICs is maximal: 1.63 cc. (B) The cut off value of the proportion of parenchyma within the 50% IDL where the Kaplan–Meier curve of RICs is most maximized: 54.4%.
4. Discussion In the present study, we investigated possible predictive factors for RICs following
single-session GKRS for AVMs and attempted to identify correlative factors between the parenchyma volume within the 50% IDL and the development of RICs. We focused on imaging changes after GKRS and a volumetric analysis with or without newly developed neurological symptoms.
The incidence of RICs observed following GKRS treatment of AVMs is higher than that seen following GKRS treatment of tumors, which demonstrates that RICs do not only occur due to focal radiation injury. Although the pathophysiology of RICs remains to be elucidated, several mechanisms have been implicated. RICs have been thought to be the result of blood–brain barrier disruption, resulting in brain edema [10,14,27]. RICs may be
Figure 3. The cut off value of parenchyma where the Kaplan–Meier curve of RICs is most maximized.(A) The cut off value of parenchyma within the 50% isodose line (IDL) where the Kaplan–Meier curveof RICs is maximal: 1.63 cc. (B) The cut off value of the proportion of parenchyma within the 50%IDL where the Kaplan–Meier curve of RICs is most maximized: 54.4%.
4. Discussion
In the present study, we investigated possible predictive factors for RICs followingsingle-session GKRS for AVMs and attempted to identify correlative factors between theparenchyma volume within the 50% IDL and the development of RICs. We focused onimaging changes after GKRS and a volumetric analysis with or without newly developedneurological symptoms.
The incidence of RICs observed following GKRS treatment of AVMs is higher thanthat seen following GKRS treatment of tumors, which demonstrates that RICs do not onlyoccur due to focal radiation injury. Although the pathophysiology of RICs remains to beelucidated, several mechanisms have been implicated. RICs have been thought to be theresult of blood–brain barrier disruption, resulting in brain edema [10,14,27]. RICs may becaused not only by vascular endothelial damage within the nidus but also by ischemicinsults within normal brain tissue between the nidus.
The predictive factors for RIC development following GKRS for AVMs includemarginal dose, target volume, location, AVM angioarchitecture, history of AVM rup-ture, prior resection, and embolization; among these factors, the marginal dose and targetvolume have been suggested to be important predictive factors of the development of RICs.
In the present study, we did not identify a significant correlation between the marginaldose and RICs. However, previous studies have suggested that a higher marginal dose is
J. Clin. Med. 2021, 10, 2186 9 of 13
significantly correlated with a higher incidence of RICs, based on the long-term results oflower-dose GKRS for AVM [3–6,10,28,29]. The median marginal dose was 16 Gy (15,17)(Table 1) and ranged from 12 to 20 Gy. Although there are no strict rules for prescribing theoptimal radiation dose, an optimal marginal dose was administered between 16 and 18 Gyaccording to the location, volume, and age in our center. For AVMs located in eloquentareas, large AVMs, or pediatric patients, a marginal dose lower than 16 Gy was prescribed,and for very small AVMs, up to 20 Gy were administered. Furthermore, 123 patients, 68.3%of the total, were treated with a marginal dose between 16 and 18. There was not muchvariation in the marginal dose, which could be one possible explanation as to why it didnot appear as a predictive factor for RIC. In the current study, patients that underwentrepeated GKRS were excluded in order to evaluate the effect of single-session GKRS on thedevelopment of RICs. From the perspective that the occurrence of RICs is dose-dependent,repeated radiosurgery has been suggested to be a risk factor for RICs [30].
Previous studies have proposed that a larger target volume is correlated with increasedRICs [7,12,13,16,17,22,29], which is consistent with the results of our univariate analysis(Table 3). Han et al. suggested that a medium AVM (4–14 cm3) was significantly relatedto RICs instead of the AVM volume itself in 2008 [17], but Hayhurst et al. proposed asignificant target volume threshold of 4 cm3 in 2010 [22].
Furthermore, the relationship between target volume and the development of RICshas been reported to be dose-dependent [11]. Previous publications have suggested thatthe brain volume included in the 12 Gy volume is predictive of RICs following radio-surgery for AVMs. A larger 12 Gy volume has been correlated with a higher risk ofsymptomatic RICs [4,11,12,31]. Another study proposed that 8-, 10-, and 12-Gy-Volumes,and a mean dose to a specified volume were associated with disruption of the blood–brainbarrier following radiosurgery for AVMs, which led to the development of RICs [32]. Thedose–volume relationship is without doubt one of the most significant predictors for thedevelopment of RICs.
In the current study, we analyzed not only the target volume but also attemptedto measure the nidus and parenchyma volume within the 50% IDL and identify theircorrelation with the development of RICs. It is inevitable that radiosurgery for AVMswill induce radiation injury to the intermingled normal brain parenchyma between thenidus. It is also known that normal brain tissue is more vulnerable to radiation injurythan pathologic structures such as brain tumors [33]. Recent studies with small numbersof patients have suggested that the relationship between AVM treatment and RICs mightbe correlated with the intervening nidal brain parenchyma [20,34]. In the present study,we calculated the nidus and parenchyma volumes within the 50% IDL and identified asignificant relationship between the nidus and parenchyma volumes within the 50% IDL,and the development of RICs (Table 3) as well as the grade of the RICs (Table 4). A higherparenchyma volume within the 50% IDL (HR = 1.042, p = 0.0140) and lower nidus volumewithin the 50% IDL (HR = 0.878, p = 0.0139) were significant predictors for RICs in themultivariate analysis (Table 3). In addition, the RIC group had a greater proportion ofparenchyma volume within the 50% IDL (P/M) than the non-RIC group (Table 2).
In the present study, we found that the RIC group had more complex AVM angioar-chitectures (higher SM grade, Pollock–Flickinger score, and VRAS) than the non-RIC group(Table 2), and higher VRAS, SM grade, and Pollock–Flickinger score were associated withthe development of RICs (Table 3) as well as the grade of the RICs (Table 4) in the univariateanalysis, although the grading scales were not included in the multivariate analysis. Theseresults are consistent with previous studies [35,36].
In the current analysis, we found a significant difference between the RIC and non-RICgroups with respect to the history of AVM ruptures before GKRS (Table 2), and a historyof hemorrhages was inversely correlated with the occurrence of RICs (Table 3). Previousstudies also proposed that a lack of prior AVM ruptures was significantly correlated withRICs [7,14,17,22]. Perinidal gliosis or fluid-filled spaces resulting from an AVM rupturemight be protective against RICs [22,37]. Brain tissue that has not been injured from a
J. Clin. Med. 2021, 10, 2186 10 of 13
ruptured AVM may be more sensitive to radiation exposure when GKRS is performed forunruptured and incidental AVMs.
Several prospective studies have reported that patients with unruptured AVMs whowere managed medically had significantly better outcomes compared to those who un-derwent intervention [38–40]. However, GKRS for AVMs is still effective with acceptablecomplication rates, and advances in GKRS have resulted in even lower risks of morbidityand mortality associated with treatment. Physicians should be careful when decidingwhether to treat unruptured AVMs, which proved to be one of the risk factors for RICs inthe present study, especially in asymptomatic cases. We should make an effort to performmore elaborate radiosurgical planning that includes delineation of the target (nidus) andthe prevention of radiation injury to the surrounding brain parenchyma; however, radiationinjury to intermingled normal brain parenchyma is inevitable in particularly diffuse AVMs.Consideration of the proportion of the nidus and parenchyma within the prescription IDLwill facilitate treatment decisions that alleviate RICs. Patients who develop RICs needlonger imaging follow-ups to look for late RICs, including delayed cyst formation andradiation necrosis.
Study Limitations
The major limitation of the current study is that it was a retrospective review of asingle institution’s practice. Selection bias may have played an important role in patientselection because we excluded patients who had been previously treated by repeat orvolume-staged GKRS, resection, or embolization to evaluate the effect of single-sessionGKRS. Combined embolization and/or volume-staged treatment approaches rather thansingle-session GKRS are reserved for larger AVMs with more complex angioarchitecture.The median target volume (3.65 cc) measured during the initial GKRS planning was biggerthan the median nidus volume within the 50% IDL (1.45 cc), which was a more apparentdifference than we expected. Previous studies reported the median proportion of the niduswas 31.3% of the target volume [34] and the percentage of brain tissue within the targetvaried from 31.13% to 70.85% [20]. These reveal that the target volume might contain morethan expected normal brain parenchyma within the IDL. In addition, the 50% IDL wasmanually delineated for the volumetric analysis, which might thus be subject to a minorerror. When adjusting the contrast threshold to determine the nidus volume within the 50%IDL, non-nidal components might include cerebrospinal fluid as well as brain parenchyma.Lastly, total obliteration of the AVM was confirmed on an angiography or MRI/MRA,which could lead to the overestimation of obliteration, although a majority of patients(88.5%) underwent angiography to confirm the complete absence of nidus filling.
5. Conclusions
This study found that greater proportions of brain tissue between the nidus withinthe 50% IDL were significantly correlated with the development of RICs. Nidus angioar-chitectural complexity and the absence of a prior hemorrhage were also associated withthe development of RICs. The prevalence of cyst formation was significantly higher in theRIC group than in the non-RIC group. Identification of the possible predictors of RICscould facilitate radiosurgical planning and enable us to make treatment decisions, planappropriate follow-ups after GKRS, and eventually alleviate the risk of RICs; this would beespecially beneficial when treating incidentally found asymptomatic AVMs.
Author Contributions: M.J.K.: Conceptualization, Methodology, Investigation, Formal analysis, Datacuration, Writing—original draft, Visualization. K.W.C.: Investigation, Resources. S.H.P.: Resources,Data curation. W.S.C.: Resources, Data curation. J.H.C.: Resources, Data curation, Supervision. J.W.C.:Conceptualization, Methodology, Resources, Supervision. H.H.J.: Conceptualization, Methodology,Resources, Writing—review & editing, Supervision, Project administration, Funding acquisition. Allauthors have read and agreed to the published version of the manuscript.
J. Clin. Med. 2021, 10, 2186 11 of 13
Funding: This work was supported by grants from the Basic Science Research Program through theNational Research Foundation of Korea (NRF-2020R1F1A1074104) and by a Korea University AnsanHospital Grant (O2105791).
Institutional Review Board Statement: The study was conducted according to the guidelines ofthe Declaration of Helsinki, and approved by the Institutional Review Board of Yonsei UniversitySeverance Hospital Clinical Prial (4-2020-0869, 15 January 2020).
Informed Consent Statement: Patient consent was waived due to the retrospective nature of thepresent study.
Data Availability Statement: Data are available upon reasonable request.
Conflicts of Interest: The authors declare no conflict of interest.
References1. Lunsford, L.D.; Kondziolka, D.; Flickinger, J.C.; Bissonette, D.J.; Jungreis, C.A.; Maitz, A.H.; Horton, J.A.; Coffey, R.J. Stereotactic
radiosurgery for arteriovenous malformations of the brain. J. Neurosurg. 1991, 75, 512–524. [CrossRef] [PubMed]2. Pan, D.H.; Guo, W.Y.; Chung, W.Y.; Shiau, C.Y.; Chang, Y.C.; Wang, L.W. Gamma knife radiosurgery as a single treatment modality
for large cerebral arteriovenous malformations. J. Neurosurg. 2000, 93 (Suppl. 3), 113–119. [CrossRef]3. Inoue, H.K. Long-term results of Gamma Knife surgery for arteriovenous malformations: 10- to 15-year follow up in patients
treated with lower doses. J. Neurosurg. 2006, 105 (Suppl.), 64–68. [CrossRef]4. Flickinger, J.C.; Kondziolka, D.; Lunsford, L.D.; Pollock, B.E.; Yamamoto, M.; Gorman, D.A.; Schomberg, P.J.; Sneed, P.; Larson, D.;
Smith, V.; et al. A multi-institutional analysis of complication outcomes after arteriovenous malformation radiosurgery. Int. J.Radiat. Oncol. Biol. Phys. 1999, 44, 67–74. [CrossRef]
5. Izawa, M.; Hayashi, M.; Chernov, M.; Nakaya, K.; Ochiai, T.; Murata, N.; Takasu, Y.; Kubo, O.; Hori, T.; Takakura, K. Long-termcomplications after gamma knife surgery for arteriovenous malformations. J. Neurosurg. 2005, 102 (Suppl.), 34–37. [CrossRef]
6. Yamamoto, M.; Hara, M.; Ide, M.; Ono, Y.; Jimbo, M.; Saito, I. Radiation-related adverse effects observed on neuro-imagingseveral years after radiosurgery for cerebral arteriovenous malformations. Surg. Neurol. 1998, 49, 385–397; discussion 397–388.[CrossRef]
7. Yen, C.P.; Matsumoto, J.A.; Wintermark, M.; Schwyzer, L.; Evans, A.J.; Jensen, M.E.; Shaffrey, M.E.; Sheehan, J.P. Radiation-induced imaging changes following Gamma Knife surgery for cerebral arteriovenous malformations. J. Neurosurg. 2013, 118,63–73. [CrossRef]
8. Serrato-Avila, J.L.; da Costa, M.D.S.; Stávale, J.N.; Lima, J.V.F.; Carrasco-Hernandez, J.P.; Alejandro, S.A.; Chaddad-Neto, F.Microsurgical Resection of a Left Supramarginal Gyrus AVM Causing Radionecrosis. World Neurosurg. 2020, 138, 317. [CrossRef]
9. Ding, D.; Starke, R.M.; Sheehan, J.P. Radiosurgery for the management of cerebral arteriovenous malformations. Handb. Clin.Neurol. 2017, 143, 69–83. [CrossRef] [PubMed]
10. Kano, H.; Flickinger, J.C.; Tonetti, D.; Hsu, A.; Yang, H.C.; Flannery, T.J.; Niranjan, A.; Lunsford, L.D. Estimating the Risks ofAdverse Radiation Effects After Gamma Knife Radiosurgery for Arteriovenous Malformations. Stroke 2017, 48, 84–90. [CrossRef][PubMed]
11. Flickinger, J.C.; Kondziolka, D.; Lunsford, L.D.; Kassam, A.; Phuong, L.K.; Liscak, R.; Pollock, B. Development of a model topredict permanent symptomatic postradiosurgery injury for arteriovenous malformation patients. Arteriovenous MalformationRadiosurgery Study Group. Int. J. Radiat. Oncol. Biol. Phys. 2000, 46, 1143–1148. [CrossRef]
12. Flickinger, J.C.; Kondziolka, D.; Pollock, B.E.; Maitz, A.H.; Lunsford, L.D. Complications from arteriovenous malformationradiosurgery: Multivariate analysis and risk modeling. Int. J. Radiat. Oncol. Biol. Phys. 1997, 38, 485–490. [CrossRef]
13. Flickinger, J.C.; Lunsford, L.D.; Kondziolka, D.; Maitz, A.H.; Epstein, A.H.; Simons, S.R.; Wu, A. Radiosurgery and brain tolerance:An analysis of neurodiagnostic imaging changes after gamma knife radiosurgery for arteriovenous malformations. Int. J. Radiat.Oncol. Biol. Phys. 1992, 23, 19–26. [CrossRef]
14. Ilyas, A.; Chen, C.J.; Ding, D.; Buell, T.J.; Raper, D.M.S.; Lee, C.C.; Xu, Z.; Sheehan, J.P. Radiation-Induced Changes AfterStereotactic Radiosurgery for Brain Arteriovenous Malformations: A Systematic Review and Meta-Analysis. Neurosurgery 2018,83, 365–376. [CrossRef]
15. Chen, C.J.; Kearns, K.N.; Ding, D.; Kano, H.; Mathieu, D.; Kondziolka, D.; Feliciano, C.; Rodriguez-Mercado, R.; Grills, I.S.;Barnett, G.H.; et al. Stereotactic radiosurgery for arteriovenous malformations of the basal ganglia and thalamus: An internationalmulticenter study. J. Neurosurg. 2019, 132, 122–131. [CrossRef] [PubMed]
16. Ganz, J.C.; Reda, W.A.; Abdelkarim, K. Adverse radiation effects after Gamma Knife Surgery in relation to dose and volume. ActaNeurochir. (Wien.) 2009, 151, 9–19. [CrossRef]
J. Clin. Med. 2021, 10, 2186 12 of 13
17. Han, J.H.; Kim, D.G.; Chung, H.T.; Park, C.K.; Paek, S.H.; Kim, J.E.; Jung, H.W.; Han, D.H. Clinical and neuroimaging outcomeof cerebral arteriovenous malformations after Gamma Knife surgery: Analysis of the radiation injury rate depending on thearteriovenous malformation volume. J. Neurosurg. 2008, 109, 191–198. [CrossRef]
18. Liscak, R.; Vladyka, V.; Simonova, G.; Urgosik, D.; Novotny, J., Jr.; Janouskova, L.; Vymazal, J. Arteriovenous malformationsafter Leksell gamma knife radiosurgery: Rate of obliteration and complications. Neurosurgery 2007, 60, 1005–1014; discussion1015–1006. [CrossRef]
19. Tuleasca, C.; Peciu-Florianu, I.; Leroy, H.A.; Vermandel, M.; Faouzi, M.; Reyns, N. Biologically effective dose and predictionof obliteration of unruptured arteriovenous malformations treated by upfront Gamma Knife radiosurgery: A series of 149consecutive cases. J. Neurosurg. 2020, 1–11. [CrossRef]
20. Peng, S.J.; Lee, C.C.; Wu, H.M.; Lin, C.J.; Shiau, C.Y.; Guo, W.Y.; Pan, D.H.; Liu, K.D.; Chung, W.Y.; Yang, H.C. Fully automatedtissue segmentation of the prescription isodose region delineated through the Gamma knife plan for cerebral arteriovenousmalformation (AVM) using fuzzy C-means (FCM) clustering. Neuroimage Clin. 2019, 21, 101608. [CrossRef] [PubMed]
21. Ganz, J.C.; Reda, W.A.; Abdelkarim, K.; Hafez, A. A simple method for predicting imaging-based complications following gammaknife surgery for cerebral arteriovenous malformations. J. Neurosurg. 2005, 102 (Suppl.), 4–7. [CrossRef]
22. Hayhurst, C.; Monsalves, E.; van Prooijen, M.; Cusimano, M.; Tsao, M.; Menard, C.; Kulkarni, A.V.; Schwartz, M.; Zadeh, G.Pretreatment predictors of adverse radiation effects after radiosurgery for arteriovenous malformation. Int. J. Radiat. Oncol. Biol.Phys. 2012, 82, 803–808. [CrossRef]
23. Kim, M.J.; Park, S.H.; Park, K.Y.; Jung, H.H.; Chang, J.H.; Chang, J.W.; Lee, J.W.; Chang, W.S. Gamma Knife RadiosurgeryFollowed by Flow-Reductive Embolization for Ruptured Arteriovenous Malformation. J. Clin. Med. 2020, 9, 1318. [CrossRef][PubMed]
24. Lee, C.C.; Chen, C.J.; Ball, B.; Schlesinger, D.; Xu, Z.; Yen, C.P.; Sheehan, J. Stereotactic radiosurgery for arteriovenous malforma-tions after Onyx embolization: A case-control study. J. Neurosurg. 2015, 123, 126–135. [CrossRef] [PubMed]
25. Hung, Y.C.; Mohammed, N.; Eluvathingal Muttikkal, T.J.; Kearns, K.N.; Li, C.E.; Narayan, A.; Schlesinger, D.; Xu, Z.; Sheehan, J.P.The impact of preradiosurgery embolization on intracranial arteriovenous malformations: A matched cohort analysis based onde novo lesion volume. J. Neurosurg. 2019, 1–12. [CrossRef] [PubMed]
26. Todnem, N.; Ward, A.; Nahhas, M.; Vender, J.R.; Alleyne, C.H.; Rahimi, S.Y. A Retrospective Cohort Analysis of HemorrhagicArteriovenous Malformations Treated with Combined Endovascular Embolization and Gamma Knife Stereotactic Radiosurgery.World Neurosurg. 2019, 122, e713–e722. [CrossRef]
27. Blamek, S.; Tarnawski, R.; Miszczyk, L. Linac-based stereotactic radiosurgery for brain arteriovenous malformations. Clin. Oncol.(R. Coll. Radiol.) 2011, 23, 525–531. [CrossRef]
28. Inoue, H.K.; Kohga, H.; Hirato, M.; Nakamura, M.; Ohye, C. Neurobiologic effects of radiosurgery: Histologic, immunohisto-chemical and electron-microscopic studies of a rat model. Stereotact. Funct. Neurosurg. 1994, 63, 280–285. [CrossRef]
29. Cohen-Inbar, O.; Lee, C.C.; Xu, Z.; Schlesinger, D.; Sheehan, J.P. A quantitative analysis of adverse radiation effects followingGamma Knife radiosurgery for arteriovenous malformations. J. Neurosurg. 2015, 123, 945–953. [CrossRef] [PubMed]
30. Flickinger, J.C.; Kondziolka, D.; Maitz, A.H.; Lunsford, L.D. An analysis of the dose-response for arteriovenous malformationradiosurgery and other factors affecting obliteration. Radiother Oncol. 2002, 63, 347–354. [CrossRef]
31. Flickinger, J.C.; Kondziolka, D.; Maitz, A.H.; Lunsford, L.D. Analysis of neurological sequelae from radiosurgery of arteriovenousmalformations: How location affects outcome. Int. J. Radiat. Oncol. Biol. Phys. 1998, 40, 273–278. [CrossRef]
32. Levegrün, S.; Hof, H.; Essig, M.; Schlegel, W.; Debus, J. Radiation-induced changes of brain tissue after radiosurgery in patientswith arteriovenous malformations: Correlation with dose distribution parameters. Int. J. Radiat. Oncol. Biol. Phys. 2004, 59,796–808. [CrossRef] [PubMed]
33. Ganz, J.C.; Reda, W.A. Radionecrosis following Gamma Knife treatment for mesial temporal lobe epilepsy. Br. J. Neurosurg. 2011,25, 649–651. [CrossRef] [PubMed]
34. Lee, C.C.; Yang, H.C.; Lin, C.J.; Chen, C.J.; Wu, H.M.; Shiau, C.Y.; Guo, W.Y.; Hung-Chi Pan, D.; Liu, K.D.; Chung, W.Y.; et al.Intervening Nidal Brain Parenchyma and Risk of Radiation-Induced Changes After Radiosurgery for Brain ArteriovenousMalformation: A Study Using an Unsupervised Machine Learning Algorithm. World Neurosurg. 2019, 125, e132–e138. [CrossRef][PubMed]
35. Ding, D.; Yen, C.P.; Xu, Z.; Starke, R.M.; Sheehan, J.P. Radiosurgery for low-grade intracranial arteriovenous malformations. J.Neurosurg. 2014, 121, 457–467. [CrossRef]
36. Quigg, M.; Yen, C.P.; Chatman, M.; Quigg, A.H.; McNeill, I.T.; Przybylowski, C.J.; Yan, G.; Sheehan, J.P. Risks of history ofdiabetes mellitus, hypertension, and other factors related to radiation-induced changes following Gamma Knife surgery forcerebral arteriovenous malformations. J. Neurosurg. 2012, 117 (Suppl.), 144–149. [CrossRef]
37. Ding, D.; Yen, C.P.; Starke, R.M.; Xu, Z.; Sheehan, J.P. Effect of prior hemorrhage on intracranial arteriovenous malformationradiosurgery outcomes. Cereb. Dis. 2015, 39, 53–62. [CrossRef]
38. Mohr, J.P.; Parides, M.K.; Stapf, C.; Moquete, E.; Moy, C.S.; Overbey, J.R.; Al-Shahi Salman, R.; Vicaut, E.; Young, W.L.; Houdart, E.;et al. Medical management with or without interventional therapy for unruptured brain arteriovenous malformations (ARUBA):A multicentre, non-blinded, randomised trial. Lancet 2014, 383, 614–621. [CrossRef]

J. Clin. Med. 2021, 10, 2186 13 of 13
39. Wedderburn, C.J.; van Beijnum, J.; Bhattacharya, J.J.; Counsell, C.E.; Papanastassiou, V.; Ritchie, V.; Roberts, R.C.; Sellar, R.J.;Warlow, C.P.; Al-Shahi Salman, R. Outcome after interventional or conservative management of unruptured brain arteriovenousmalformations: A prospective, population-based cohort study. Lancet Neurol. 2008, 7, 223–230. [CrossRef]
40. Al-Shahi Salman, R.; White, P.M.; Counsell, C.E.; du Plessis, J.; van Beijnum, J.; Josephson, C.B.; Wilkinson, T.; Wedderburn, C.J.;Chandy, Z.; St George, E.J.; et al. Outcome after conservative management or intervention for unruptured brain arteriovenousmalformations. Jama 2014, 311, 1661–1669. [CrossRef]