Predictive Bias and Sensitivity in NRC Fuel Performance Codes
194
NUREG/CR-7001 PNNL-17644 Predictive Bias and Sensitivity in NRC Fuel Performance Codes Office of Nuclear Regulatory Research
Transcript of Predictive Bias and Sensitivity in NRC Fuel Performance Codes

NUREG/CR-7001 PNNL-17644
Predictive Bias and Sensitivity in NRC Fuel Performance Codes
Office of Nuclear Regulatory Research

DISCLAIMER: This report was prepared as an account of work sponsored by an agency of the U.S. Government. Neither the U.S. Government nor any agency thereof, nor any employee, makes any warranty, expressed orimplied, or assumes any legal liability or responsibility for any third party’s use, or the results of such use, of anyinformation, apparatus, product, or process disclosed in this publication, or represents that its use by such thirdparty would not infringe privately owned rights.
AVAILABILITY OF REFERENCE MATERIALSIN NRC PUBLICATIONS
NRC Reference Material
As of November 1999, you may electronically accessNUREG-series publications and other NRC records atNRC’s Public Electronic Reading Room at http://www.nrc.gov/reading-rm.html. Publicly releasedrecords include, to name a few, NUREG-seriespublications; Federal Register notices; applicant,licensee, and vendor documents and correspondence;NRC correspondence and internal memoranda;bulletins and information notices; inspection andinvestigative reports; licensee event reports; andCommission papers and their attachments.
NRC publications in the NUREG series, NRCregulations, and Title 10, Energy, in the Code ofFederal Regulations may also be purchased from oneof these two sources.1. The Superintendent of Documents U.S. Government Printing Office Mail Stop SSOP Washington, DC 20402–0001 Internet: bookstore.gpo.gov Telephone: 202-512-1800 Fax: 202-512-22502. The National Technical Information Service Springfield, VA 22161–0002 www.ntis.gov 1–800–553–6847 or, locally, 703–605–6000
A single copy of each NRC draft report for comment isavailable free, to the extent of supply, upon writtenrequest as follows:Address: U.S. Nuclear Regulatory Commission Office of Administration Mail, Distribution and Messenger Team Washington, DC 20555-0001E-mail: [email protected] Facsimile: 301–415–2289
Some publications in the NUREG series that are posted at NRC’s Web site addresshttp://www.nrc.gov/reading-rm/doc-collections/nuregs are updated periodically and may differ from the lastprinted version. Although references to material foundon a Web site bear the date the material was accessed,the material available on the date cited maysubsequently be removed from the site.
Non-NRC Reference Material
Documents available from public and special technicallibraries include all open literature items, such asbooks, journal articles, and transactions, FederalRegister notices, Federal and State legislation, andcongressional reports. Such documents as theses,dissertations, foreign reports and translations, andnon-NRC conference proceedings may be purchasedfrom their sponsoring organization.
Copies of industry codes and standards used in asubstantive manner in the NRC regulatory process aremaintained at—
The NRC Technical Library Two White Flint North11545 Rockville PikeRockville, MD 20852–2738
These standards are available in the library for reference use by the public. Codes and standards areusually copyrighted and may be purchased from theoriginating organization or, if they are AmericanNational Standards, from—
American National Standards Institute11 West 42nd StreetNew York, NY 10036–8002www.ansi.org 212–642–4900
Legally binding regulatory requirements are statedonly in laws; NRC regulations; licenses, includingtechnical specifications; or orders, not in NUREG-series publications. The views expressedin contractor-prepared publications in this series arenot necessarily those of the NRC.
The NUREG series comprises (1) technical andadministrative reports and books prepared by thestaff (NUREG–XXXX) or agency contractors(NUREG/CR–XXXX), (2) proceedings ofconferences (NUREG/CP–XXXX), (3) reportsresulting from international agreements(NUREG/IA–XXXX), (4) brochures(NUREG/BR–XXXX), and (5) compilations of legaldecisions and orders of the Commission and Atomicand Safety Licensing Boards and of Directors’decisions under Section 2.206 of NRC’s regulations(NUREG–0750).
NUREG/CR-7001 PNNL-17644
Predictive Bias and Sensitivity in NRC Fuel Performance Codes Manuscript Completed: April 2009 Date Published: October 2009 Prepared by K.J. Geelhood, W.G. Luscher, C.E. Beyer, D.J. Senor, and M.E. Cunningham, D.D. Lanning, H.E. Adkins Pacific Northwest National Laboratory P.O. Box 999 Richland, WA 99352 NRC Job Code N6326 Office of Nuclear Regulatory Research


iii
ABSTRACT The latest versions of the fuel performance codes, FRAPCON-3 and FRAPTRAN were examined to ensure best estimate behavior of the codes and to ensure (to the extent possible that unintentional bias has been eliminated. Each individual model and type of code prediction was examined and compared to the data that was used to develop the model. In addition, a brief literature search was performed to determine if more recent data have become available since the original model development for model comparison. If new data were discovered, these data were compared to the models and code predictions in FRAPCON-3.3 and FRAPTRAN-1.3 in order to determine if the model is biased. Models or integral effect prediction found to be biased relative to the data were updated and corrected in the upcoming versions of the codes, FRAPCON-3.4 and FRAPTRAN 1.4. Areas where modeling may be lacking were noted for further model development. The details of the updated models are provided in this report. Subsequently, a sensitivity study was performed on the steady-state code, FRAPCON-3.3 to determine the effects of uncertainty in model predictions, manufacturing parameters and power history on the code outputs of regulatory interest.


v
FOREWORD The purpose of this study was to re-examine the NRC fuel performance codes to ensure best estimate behavior of the codes and to ensure (to the extent possible) that unintentional bias has been eliminated. The tendency of these analytical tools to be (or to become) intrinsically conservative is understandable as the regulatory requirements themselves use conservatism to bound uncertainties. As an example of this regulatory approach, the required and acceptable features of evaluation models used in the calculation of stored energy of the fuel include:
The steady-state temperature distribution and stored energy in the fuel before the hypothetical accident shall be calculated for the burn-up that yields the highest calculation cladding temperature (or, optionally, the highest calculated stored energy.)
10 CFR 50, Appendix K, Part (I)(A)(1) Thus, there is a motive for analytical tools used in the regulatory audit vendor safety analyses to incorporate conservatisms in an intrinsic or automated fashion. However, this may not be consistent with the need to compare code predictions with experimentally-derived information, such as fuel centerline thermocouple data. This current study seeks to identify and remove such conservatisms from the code (as opposed to removing them from the regulation). Further, in recognition of recent vendor efforts to combine uncertainties in fuel code input parameters, a sensitivity study was performed on the steady-state code, FRAPCON-3.3 to determine the effects of uncertainty in model predictions, manufacturing parameters, and power history on the code outputs of regulatory interest. This effort makes direct use of the first part of this study – the comparison of individual model or type of code prediction with the data that was used to develop that model. The results of these two complementary efforts both seek to improve the tools used by NRC in regulatory analysis.


vii
CONTENTS ABSTRACT ......................................................................................................................... iii FOREWORD..........................................................................................................................v CONTENTS ........................................................................................................................ vii LIST OF FIGURES................................................................................................................x LIST OF TABLES ..............................................................................................................xvi EXECUTIVE SUMMARY............................................................................................... xvii ABBREVIATIONS.............................................................................................................xix 1.0 INTRODUCTION ...........................................................................................1.1 2.0 BIAS ASSESSMENT......................................................................................2.1
2.1 Thermal Modeling and Assessment.................................................................2.1 2.1.1 Code Solution Method, Fuel Rod Heat Transfer Solution Methods and
Pellet Heat Generation Radial Profile..............................................................2.1 2.1.2 Fuel Thermal Conductivity ..............................................................................2.5
2.1.2.1 UO2 .......................................................................................................2.5 2.1.2.2 MOX .....................................................................................................2.6 2.1.2.3 UO2-Gd2O3............................................................................................2.7
2.1.3 Gap Conductance.............................................................................................2.9 2.1.3.1 Conductance through the Gas ...............................................................2.9 2.1.3.2 Conductance through points of cladding-pellet contact......................2.10 2.1.3.3 Radiation heat transfer ........................................................................2.10
2.1.4 Fuel Thermal Expansion................................................................................2.10 2.1.5 Fuel Relocation ..............................................................................................2.11 2.1.6 Other Models and Properties .........................................................................2.13
2.1.6.1 Cladding-Coolant Heat Transfer .........................................................2.14 2.1.6.2 Oxide Thermal Conductivity ..............................................................2.14 2.1.6.3 CRUD Thermal Conductivity .............................................................2.16 2.1.6.4 Cladding Thermal Conductivity..........................................................2.17 2.1.6.5 Gas Thermal Conductivity ..................................................................2.18 2.1.6.6 Cladding Thermal Expansion..............................................................2.24
2.1.7 Integral Assessment .......................................................................................2.26 2.1.7.1 UO2 Temperature Comparisons ..........................................................2.26 2.1.7.2 UO2-Gd2O3 Temperature Comparisons ..............................................2.33 2.1.7.3 MOX Temperature Comparisons........................................................2.38
2.2 Fission Gas Release Model and Assessment .................................................2.43 2.2.1 Modeling........................................................................................................2.44 2.2.2 Assessment.....................................................................................................2.45
2.3 Cladding Corrosion and Hydriding Models...................................................2.49 2.3.1 Cladding Corrosion........................................................................................2.49 2.3.2 Hydrogen Pickup ...........................................................................................2.54
2.4 Fuel Densification and Swelling....................................................................2.57 2.4.1 Fuel Swelling .................................................................................................2.58 2.4.2 Fuel Densification..........................................................................................2.59
2.5 Assessment of Mechanical Modeling and Properties ....................................2.60 2.5.1 Modeling........................................................................................................2.60 2.5.2 Mechanical Properties....................................................................................2.61
2.5.2.1 Irradiation Creep .................................................................................2.61 2.5.2.2 Yield Strength .....................................................................................2.63 2.5.2.3 Young’s Modulus................................................................................2.65
viii
2.5.3 Assessment of Power Ramped Rods..............................................................2.65 2.6 Void Volume Model and Assessment............................................................2.67
2.6.1 Rod Growth....................................................................................................2.67 2.6.2 Plenum Gas Temperature...............................................................................2.69
2.7 Time Dependent Models................................................................................2.70 2.7.1 Properties and Models without time dependence ..........................................2.71 2.7.2 Properties and models with time dependence that can change over short
time intervals (e.g. < 10 minutes) and should be modeled in FRAPTRAN...................................................................................................2.72
2.7.3 Properties and models with time dependence much greater than the time period modeled in FRAPTRAN.....................................................................2.74
2.7.4 Summary........................................................................................................2.75 2.8 Conclusions....................................................................................................2.76
3.0 UPDATES TO MODELS................................................................................3.1 3.1 Corrosion and Hydrogen Pickup in Cladding Alloys ......................................3.1
3.1.1 Hydrogen pickup in Zircaloy-2........................................................................3.1 3.1.2 Corrosion in ZIRLO™.....................................................................................3.2 3.1.3 Corrosion and Hydrogen Pickup in M5™ .......................................................3.5
3.2 Radial Power Profile in HWR..........................................................................3.8 3.3 Radial Power Profile in UO2-Gd2O3 ..............................................................3.10 3.4 Fuel Thermal Expansion at High Temperature..............................................3.15 3.5 Gas Thermal Conductivity at High Temperature...........................................3.16 3.6 Steam Conductivity........................................................................................3.20 3.7 Cladding Irradiation Creep ............................................................................3.22
4.0 Sensitivity Analysis .........................................................................................4.1 4.1 Outputs of Interest ...........................................................................................4.2
4.1.1 Rod Internal Gas Pressure................................................................................4.2 4.1.2 Peak Fuel Centerline Temperature...................................................................4.2 4.1.3 Cladding Permanent Hoop Strain ....................................................................4.2 4.1.4 Other Outputs of Interest .................................................................................4.3
4.2 Selection of Base Cases ...................................................................................4.3 4.3 Effects of Manufacturing Uncertainties...........................................................4.5
4.3.1 Cladding Inner Diameter................................................................................4.10 4.3.2 Cladding Thickness........................................................................................4.10 4.3.3 Cladding Roughness ......................................................................................4.11 4.3.4 Pellet Outer Diameter ....................................................................................4.11 4.3.5 Theoretical Pellet Density..............................................................................4.12 4.3.6 Pellet Re-Sinter Density.................................................................................4.13 4.3.7 Pellet Roughness............................................................................................4.13 4.3.8 Pellet Dish Diameter and Depth ....................................................................4.14 4.3.9 Rod Fill Pressure............................................................................................4.14 4.3.10 Rod Plenum Length .......................................................................................4.15
4.4 Effects of Model Uncertainties ......................................................................4.15 4.4.1 Fuel Thermal Conductivity ............................................................................4.23 4.4.2 Fuel Thermal Expansion................................................................................4.24 4.4.3 Cladding Oxide Conductivity ........................................................................4.25 4.4.4 Cladding Conductivity ...................................................................................4.27 4.4.5 Gas Conductance ...........................................................................................4.28 4.4.6 Fission Gas Release .......................................................................................4.29 4.4.7 Cladding Corrosion........................................................................................4.31 4.4.8 Fuel Swelling .................................................................................................4.33

ix
4.4.9 Creep of Irradiated Cladding .........................................................................4.35 4.4.10 Cladding Yield Strength ................................................................................4.36 4.4.11 Young’s Modulus of Cladding.......................................................................4.38 4.4.12 Cladding Axial Growth..................................................................................4.39 4.4.13 Cladding Thermal Expansion ........................................................................4.41
4.5 Effects of Power Uncertainties ......................................................................4.42 4.5.1 Steady State....................................................................................................4.45 4.5.2 Height of AOO Pulse .....................................................................................4.45 4.5.3 Duration of AOO Pulse..................................................................................4.46
4.6 Conclusions....................................................................................................4.46 4.6.1 Rod Internal Pressure.....................................................................................4.47 4.6.2 Peak Fuel Centerline Temperature.................................................................4.47 4.6.3 Cladding Permanent Hoop Strain ..................................................................4.47
5.0 CONCLUSIONS .............................................................................................5.1 6.0 REFERENCES ................................................................................................6.1

x
LIST OF FIGURES Figure 2.1 Radial burnup profile for BWR rod A3/6-4 at 55 GWd/MTU ......................... 2.2 Figure 2.2 Radial burnup profile for BWR rod H8/36-4 at 55 GWd/MTU ....................... 2.3 Figure 2.3 Radial burnup profile for PWR rod BK365 at 83 GWd/MTU ......................... 2.3 Figure 2.4 Radial burnup profile for PWR rod D200 at 25 GWd/MTU............................ 2.4 Figure 2.5 Radial burnup profile for PWR rod D226 at 45 GWd/MTU............................ 2.4 Figure 2.6 Predicted vs. measured thermal conductivity for unirradiated UO2. ................ 2.5 Figure 2.7 Predicted vs. measured thermal conductivity for irradiated UO2. .................... 2.6 Figure 2.8 Predicted vs. measured thermal conductivity for MOX fuel ............................ 2.7 Figure 2.9 Predicted vs. measured thermal conductivity for unirradiated UO2
Gd2O3. ..... 2.8 Figure 2.10 Predicted vs. measured thermal conductivity for irradiated UO2
Gd2O3. ..... 2.8 Figure 2.11 Thermal expansion data and model predictions for UO2 ........................... 2.11 Figure 2.12 Predicted and measured fuel centerline temperatures with argon and
helium fill gases for a IFA-633 UO2 rod (as-fabricated radial gap is 105μm)........ 2.13 Figure 2.13 Comparison of MATPRO ZrO2 model to data used to develop the model
and newer data......................................................................................................... 2.16 Figure 2.14 MATPRO model (CTHCON), the data on which it is based, newer data,
and the Fink Model.................................................................................................. 2.18 Figure 2.15 Thermal conductivity data and model predictions for He .......................... 2.20 Figure 2.16 Thermal conductivity data and model predictions for Ar........................... 2.20 Figure 2.17 Thermal conductivity data and model predictions for Kr........................... 2.21 Figure 2.18 Thermal conductivity data and model predictions for Xe .......................... 2.21 Figure 2.19 Thermal conductivity data and model predictions for H2........................... 2.22 Figure 2.20 Thermal conductivity data and model predictions for N2........................... 2.22 Figure 2.21 Thermal conductivity data and model predictions for steam at 100 MPa .. 2.23 Figure 2.22 Predicted vs. measured thermal conductivity for various gas mixtures. .... 2.24 Figure 2.23 Axial thermal expansion model from FRAPCON-3.3 and FRAPTRAN
1.3 compared to data ............................................................................................... 2.25 Figure 2.24 Circumferential thermal expansion model from FRAPCON-3.3 and
FRAPTRAN 1.3 compared to data.......................................................................... 2.25 Figure 2.25 Predicted and measured temperature for BOL ramp to power. .................. 2.27 Figure 2.26 Measured and predicted centerline temperature for IFA-432r1 lower
thermocouple (Burnup=45 GWd/MTU, as-fabricated radial gap=114μm)............. 2.28 Figure 2.27 Measured and predicted centerline temperature for IFA-432r3 lower
thermocouple (Burnup=45 GWd/MTU, as-fabricated radial gap=38μm)............... 2.29 Figure 2.28 Measured and predicted centerline temperature for IFA-513r1 upper
thermocouple (a) and lower thermocouple (b) (Burnup=10 GWd/MTU, as-fabricated radial gap=108μm) ................................................................................. 2.30
Figure 2.29 Measured and predicted centerline temperature for IFA-513r6 upper thermocouple (a) and lower thermocouple (b) (Burnup=10 GWd/MTU, as-fabricated radial gap=108μm) ................................................................................. 2.31
Figure 2.30 Measured and predicted rod-average centerline temperature for IFA-562r18 (Burnup=76 GWd/MTU, as-fabricated radial gap=50μm) ......................... 2.32
Figure 2.31 Measured and predicted centerline temperature for IFA-597r8 (starting burnup=68 GWd/MTU, ending burnup=71 GWd/MTU, as-fabricated radial gap=105μm). ........................................................................................................... 2.33
Figure 2.32 Measured and predicted centerline temperature for IFA-515.10 rod A1 (UO2) (a), and for IFA-515.10 rod A2 (UO2-8%Gd2O3) (b) (Burnup=80 GWd/MTU, as-fabricated radial gap=25μm).......................................................... 2.34

xi
Figure 2.33 Measured and predicted centerline temperature for IFA-515.10 rod B1 (UO2) (a), and for IFA-515.10 rod B2 (UO2-8%Gd2O3) (b) (Burnup=80 GWd/MTU, as-fabricated radial gap=25μm).......................................................... 2.35
Figure 2.34 Measured and predicted centerline temperature for IFA-636r2 (UO2-8%Gd2O3) (Burnup=25 GWd/MTU, as-fabricated radial gap=77μm) ................... 2.36
Figure 2.35 Measured and predicted centerline temperature for IFA-636r4 (UO2-8%Gd2O3) (Burnup=25 GWd/MTU, as-fabricated radial gap=77μm) ................... 2.36
Figure 2.36 Measured and predicted centerline temperature for IFA-681r1 (UO2) (Burnup=12 GWd/MTU, as-fabricated radial gap=85μm) ..................................... 2.37
Figure 2.37 Measured and predicted centerline temperature for IFA-681r2 (UO2 2%Gd2O3) (Burnup=10 GWd/MTU, as-fabricated radial gap=85μm) ................... 2.37
Figure 2.38 Measured and predicted centerline temperature for IFA-681r3 (UO2 8%Gd2O3) (Burnup=4 GWd/MTU, as-fabricated radial gap=85μm) ..................... 2.38
Figure 2.39 Predicted vs. measured centerline temperature for Halden MOX rods. ..... 2.39 Figure 2.40 Measured and predicted centerline temperature for IFA-629-1 rod 1
(starting burnup=27 GWd/MTU, ending burnup=33 GWd/MTU, as-fabricated radial gap=84μm) .................................................................................................... 2.39
Figure 2.41 Measured and predicted centerline temperature for IFA-629-1 rod 2 (starting burnup=29 GWd/MTU, ending burnup=40 GWd/MTU, as-fabricated radial gap=84μm) .................................................................................................... 2.40
Figure 2.42 Measured and predicted centerline temperature for IFA-610.2 (starting burnup=55 GWd/MTU, ending burnup=56 GWd/MTU, as-fabricated radial gap=84μm) .............................................................................................................. 2.40
Figure 2.43 Measured and predicted centerline temperature for IFA-610.4 (starting burnup=56, ending burnup=57 GWd/MTU, as-fabricated radial gap=84μm) ........ 2.41
Figure 2.44 Measured and predicted centerline temperature for IFA-648.1 rod 1 (starting burnup=55 GWd/MTU, ending burnup=62 GWd/MTU, as-fabricated radial gap=84μm) .................................................................................................... 2.41
Figure 2.45 Measured and predicted centerline temperature for IFA-648.1 rod 2 (starting burnup=55 GWd/MTU, ending burnup=62 GWd/MTU, as-fabricated radial gap=84μm) .................................................................................................... 2.42
Figure 2.46 Measured and predicted centerline temperature for IFA-629.3 rod 5 (starting burnup=62 GWd/MTU, ending burnup=72 GWd/MTU, as-fabricated radial gap=84μm) .................................................................................................... 2.42
Figure 2.47 Measured and predicted centerline temperature for IFA-629.3 rod 6 (starting burnup=62 GWd/MTU, ending burnup=68 GWd/MTU, as-fabricated radial gap=84μm) .................................................................................................... 2.43
Figure 2.48 Measured and predicted centerline temperature for IFA-606 Phase 2 (starting burnup=50 GWd/MTU, as-fabricated radial gap=94μm) ......................... 2.43
Figure 2.49 Measured vs. predicted FGR for steady-state UO2 rods............................. 2.45 Figure 2.50 Measured vs. predicted FGR for power ramped UO2 rods......................... 2.46 Figure 2.51 Predicted minus measured FGR as a function of burnup for steady-state
UO2 rods .................................................................................................................. 2.46 Figure 2.52 Predicted minus measured FGR as a function of burnup for power
ramped UO2 rods (Rods with hold time less than 4 hours marked) ........................ 2.47 Figure 2.53 Measured vs. predicted FGR for steady-state and power ramped MOX
rods .................................................................................................................... 2.48 Figure 2.54 Predicted minus measured FGR as a function of burnup for steady-state
and power ramped MOX rods ................................................................................. 2.48
xii
Figure 2.55 PWR Zircaloy-4 corrosion data and FRAPCON-3.3 PWR corrosion model (Smith et al., 1994, Pyecha, 1985, Newman, 1986, Balfour, 1982b, Dideon, 1983, Garde, 1986).................................................................................................. 2.50
Figure 2.56 BWR Zircaloy-2 corrosion data and FRAPCON-3.3 BWR corrosion model (West et al., 1983, Barner et al., 1990)......................................................... 2.50
Figure 2.57 Zircaloy-2 BWR Corrosion Data for the Newer Cladding Types with Controlled SPP’s and composition (Yasuyuki et al., 2007, Sell et al., 2006, Hirano et al., 2005, Mutyala, 2004)......................................................................... 2.51
Figure 2.58 ZIRLO™ data and FRAPCON-3.3 predictions as a function of fuel duty index (FDI) (Knott et al., 2003) .............................................................................. 2.52
Figure 2.59 M5™ data and FRAPCON-3.3 predictions as a function of burnup (Mardon and Waeckel, 2003) .................................................................................. 2.52
Figure 2.60 End of life oxide thickness and FRAPCON-3 predictions for Vandellos II rod A06, clad in ZIRLO™ and irradiated to 68 GWd/MTU (CSN, ENUSA, 2002). .................................................................................................................... 2.53
Figure 2.61 End of life oxide thickness and FRAPCON-3 predictions for Vandellos II rod A12, clad in ZIRLO™ and irradiated to 68 GWd/MTU(CSN, ENUSA, 2002). .................................................................................................................... 2.53
Figure 2.62 End of life oxide thickness and FRAPCON-3 predictions for Gravelines 5 rod N05, clad in M5™ and irradiated to 70 GWd/MTU (Segura et al., 2002). ... 2.54
Figure 2.63 Measured and predicted hydrogen pickup for PWR rods with Zircaloy-4 cladding (Smith et al., 1994, Pyecha, 1985, Newman, 1986, Balfour, 1982b, Dideon, 1983, Garde, 1986) .................................................................................... 2.55
Figure 2.64 Measured and predicted hydrogen pickup for BWR rods with Zircaloy-2 cladding (Itagaki, 2003.) ......................................................................................... 2.56
Figure 2.65 Measured and predicted hydrogen pickup from recent literature search for BWR rods with Zircaloy-2 cladding (Hayashi et al., 2003, Sell et al., 2006, Hirano et al., 2005, Ledberger et al., 2005)............................................................. 2.56
Figure 2.66 Measured and predicted hydrogen pickup for PWR rods with ZIRLO™ (Tsukuda et al., 2003, Kitaguawa et al., 2005)........................................................ 2.57
Figure 2.67 Measured and predicted hydrogen pickup for PWR rods with M5™ (Mardon and Waeckel, 2003) .................................................................................. 2.57
Figure 2.68 FRAPCON-3.3 swelling model prediction and data as a function of burnup .................................................................................................................... 2.58
Figure 2.69 FRAPCON-3.3 swelling rate and observed swelling rates from Halden instrumented fuel assemblies (EOL burnups shown for each point)....................... 2.59
Figure 2.70 Comparison of FUDENS fuel densification predictions to the experimental data from which the fit coefficients were determined and to more recent published data. .............................................................................................. 2.60
Figure 2.71 Predicted and measured cladding creepdown from the 2nd and 3rd cycle rods in the ANO-2 PWR assembly, TSQ002. ......................................................... 2.62
Figure 2.72 Predicted and measured cladding creepdown from the 3rd, 4th, and 5th cycle rods in the Oconee PWR assembly, 15309. ................................................... 2.62
Figure 2.73 Predicted vs. measured yield stress from irradiated and unirradiated Zircaloy-2 and Zircaloy-4 ....................................................................................... 2.64
Figure 2.74 Measured and predicted yield stress for high burnup cladding from the PROMETRA database. ........................................................................................... 2.64
Figure 2.75 Measured vs. predicted Young’s modulus for model development data and recent data......................................................................................................... 2.65
Figure 2.76 Predicted and measured permanent hoop strain from Cabri and NSRR RIA tests. ................................................................................................................. 2.66

xiii
Figure 2.77 Predicted and measured permanent axial strain from Cabri and NSRR RIA tests. ................................................................................................................. 2.67
Figure 2.78 FRAPCON-3.3 model for axial growth in PWR cladding compared to data used for model development and recent data................................................... 2.68
Figure 2.79 FRAPCON-3.3 model for axial growth in BWR cladding compared to data used for model development and recent data................................................... 2.69
Figure 3.1 Comparison of recent Zircaloy-2 hydrogen pickup data to new correlations for old and new Zircaloy-2 cladding ......................................................................... 3.2
Figure 3.2 ZIRLO™ data vs. burnup and (a) FRAPCON-3.3 and (b) FRAPCON-3.4 model predictions for several sample PWR rods ...................................................... 3.3
Figure 3.3. Old and New ZIRLO™ model predictions for end of life oxide thickness for rod A06 ................................................................................................................ 3.4
Figure 3.4 Old and New ZIRLO™ model predictions for end of life oxide thickness for rod A12 ................................................................................................................ 3.5
Figure 3.5 M5™ data vs. burnup and (a) FRAPCON-3.3 and (b) FRAPCON-3.4 model predictions for several sample PWR rods ...................................................... 3.6
Figure 3.6 Old and New M5™ model predictions for end of life oxide thickness for rod N05...................................................................................................................... 3.7
Figure 3.7 Hydrogen concentration data for M5™ and FRAPCON-3.4 predictions of hydrogen for typical PWR cases ............................................................................... 3.8
Figure 3.8 Burnup distribution in rod section F9-3-44 with U-235 enrichment of 5%, irradiated to 39 GWd/MTU in the Halden reactor .................................................... 3.9
Figure 3.9 Burnup distribution in rod section AF21-2-8 with U-235 enrichment of 1.5%, irradiated to 72.2 GWd/MTU in the DR3 reactor ........................................... 3.9
Figure 3.10 Radial power profile in IFA-558 as predicted by FTEMP and TUBRNP with U-235 enrichment of 7%, irradiated in the Halden reactor ............................. 3.10
Figure 3.11 Centerline temperature measurements and predictions for IFA-636 Rod 2 with hollow pellets and 8 wt% Gd2O3. The FRAPCON-3.3 prediction uses the Halden table of radial power profiles. The FRAPCON-3.4 prediction uses the new table of radial power profiles ........................................................................... 3.12
Figure 3.12 Centerline temperature measurements and predictions for IFA-636 Rod 4 with solid pellets and 8 wt% Gd2O3 (Solid pellet temperatures are estimated from measurements made on hollow pellets in IFA-636 Rod 2.) The FRAPCON-3.3 prediction uses the Halden table of radial power profiles. The FRAPCON-3.4 prediction uses the new table of radial power profiles ............................................ 3.12
Figure 3.13 Centerline temperature measurements and predictions for IFA-681 Rod 2 with solid pellets and 2 wt% Gd2O3. The FRAPCON-3.3 prediction uses the Halden table of radial power profiles. The FRAPCON-3.4 prediction uses the new table of radial power profiles ........................................................................... 3.13
Figure 3.14 Centerline temperature measurements and predictions for IFA-681 Rod 3 with solid pellets and 8 wt% Gd2O3. The FRAPCON-3.3 prediction uses the Halden table of radial power profiles. The FRAPCON-3.4 prediction uses the new table of radial power profiles ........................................................................... 3.13
Figure 3.15 Centerline temperature measurements and predictions for IFA-681 Rod 4 with hollow pellets and 2 wt% Gd2O3. The FRAPCON-3.3 prediction uses the Halden table of radial power profiles. The FRAPCON-3.4 prediction uses the new table of radial power profiles ........................................................................... 3.14
Figure 3.16 Centerline temperature measurements and predictions for IFA-681 Rod 6 with hollow pellets and 8 wt% Gd2O3. The FRAPCON-3.3 prediction uses the Halden table of radial power profiles. The FRAPCON-3.4 prediction uses the new table of radial power profiles ........................................................................... 3.14

xiv
Figure 3.17 Original and modified UO2 thermal expansion model with available data as a function of temperature. ................................................................................... 3.16
Figure 3.18 Original and modified model for He thermal conductivity (σ=0.00899)... 3.17 Figure 3.19 Original and modified model for Ar thermal conductivity (σ=0.000966) . 3.18 Figure 3.20 Original and modified model for Kr thermal conductivity (σ=0.000886) . 3.18 Figure 3.21 Original and modified model for Xe thermal conductivity (σ=0.000534). 3.19 Figure 3.22 Original and modified model for H2 thermal conductivity (σ=0.0167) ..... 3.19 Figure 3.23 Original and modified model for N2 thermal conductivity (σ=0.000197) . 3.20 Figure 3.24 Comparison of low temperature steam conductivity models from
MATPRO, FRAPTRAN-1.3, and FRAPCON-3.3 with adopted values of experimental data from ASME................................................................................ 3.21
Figure 3.25 Predicted and measured cladding creepdown using the original and new creep models from the 2nd and 3rd cycle rods in the AN0-2 PWR assembly, TSQ002 ................................................................................................................... 3.24
Figure 3.26 Predicted and measured cladding creepdown using the original and new creep models from the 3rd, 4th, and 5th cycle rods in the Oconee PWR assembly, 15309 .................................................................................................................... 3.25
Figure 3.27 Predicted vs. measured cladding creepdown using the new creep model from creepdown data from irradiated SRA tubes.................................................... 3.26
Figure 3.28 Predicted vs. measured cladding creepdown using the new creep model from creepdown data from irradiated RXA tubes ................................................... 3.26
Figure 4.1 Power histories for PWR and BWR base cases without AOO ......................... 4.4 Figure 4.2 Predicted and measured thermal conductivity data with ±0.5 W/m-K as
upper and lower bounds .......................................................................................... 4.23 Figure 4.3 UO2 thermal conductivity model and available data with ±15% as upper and
lower bounds ........................................................................................................... 4.24 Figure 4.4 ZrO2 thermal conductivity model and available data with ±0.5 W/m-K as
upper and lower bounds .......................................................................................... 4.26 Figure 4.5 Zircaloy thermal conductivity model and available data with +5/-3 W/m-K
as upper and lower bounds ...................................................................................... 4.27 Figure 4.6 Helium thermal conductivity model and available data with ±5% as upper
and lower bounds..................................................................................................... 4.28 Figure 4.7 Nominal predicted vs. measured fission gas release....................................... 4.29 Figure 4.8 Predicted vs. measured fission gas release for upper bound model
with D*2.................................................................................................................. 4.30 Figure 4.9 Predicted vs. measured fission gas release for lower bound model
with D/2................................................................................................................... 4.30 Figure 4.10 Nominal predicted vs. measured oxide thickness....................................... 4.31 Figure 4.11 Predicted vs. measured oxide thickness for upper bound model with
+40% .................................................................................................................... 4.32 Figure 4.12 Predicted vs. measured oxide thickness for lower bound model with
-40% .................................................................................................................... 4.32 Figure 4.13 Fuel swelling model and available data with ±0.3% ΔV/V per 10
GWd/MTU as upper and lower bounds on the swelling rate .................................. 4.34 Figure 4.14 Cladding creep model and available data with +10%/-40% upper and
lower bound on creep rate. ...................................................................................... 4.35 Figure 4.15 Nominal predicted vs. measured yield stress ............................................. 4.36 Figure 4.16 Predicted vs. measured yield stress for upper bound model with K*1.3.... 4.37 Figure 4.17 Predicted vs. measured yield stress for lower bound model with K/1.3 .... 4.37
xv
Figure 4.18 Predicted and measured cladding Young’s Modulus data with +5/-10 GPa as upper and lower bounds .............................................................................. 4.38
Figure 4.19 Cladding axial growth model for PWR cladding with ±50% as upper and lower bounds ........................................................................................................... 4.39
Figure 4.20 Cladding axial growth model for BWR cladding with ±50% as upper and lower bounds ........................................................................................................... 4.40
Figure 4.21 Cladding diametral thermal expansion model with ±30% as upper and lower bounds ........................................................................................................... 4.41
Figure 4.22 Cladding axial thermal expansion model with +30%/-10% as upper and lower bounds ........................................................................................................... 4.41
xvi
LIST OF TABLES Table 2.1 Properties and models without time dependence...................................................2.70 Table 2.2 Properties and models with time dependence that can change over short time
intervals (e.g. < 10 minutes) and should be modeled in FRAPTRAN ................2.70 Table 2.3 Properties and models with time dependence much greater than the time
period modeled in FRAPTRAN ...........................................................................2.71 Table 3.1 Original A and B coefficients used in FRAPCON-3.3 and FRAPTRAN 1.3 .......3.16 Table 3.2 Modified A and B coefficients ..............................................................................3.17 Table 3.3 Parameters for FRAPCON-3.4 creep equation for SRA and RXA cladding.........3.23 Table 4.1 Typical fuel design parameters used for base case code input (NUREG-1754)......4.3 Table 4.2 Axial power profile used for PWR and BWR base case input ................................4.5 Table 4.3 Comparison between unbiased output and output biased by manufacturing
uncertainty for a 17x17 PWR .................................................................................4.6 Table 4.4 Comparison between unbiased output and output biased by manufacturing
uncertainty for a 10x10 BWR·················································································4.8 Table 4.5 Comparison between unbiased output and output biased by model
uncertainties for a 17x17 PWR·············································································4.17 Table 4.6 Comparison between unbiased output and output biased by model
uncertainties for a 10x10 BWR ············································································4.20 Table 4.7 Comparison between unbiased output and output biased by power
uncertainties for a 17x17 PWR·············································································4.43 Table 4.8 Comparison between unbiased output and output biased by power
uncertainties for a 10x10 BWR ············································································4.44

xvii
EXECUTIVE SUMMARY FRAPCON-3 (Lanning et al., 1997a, Lanning et al, 1997b, Berna et al., 1997, Lanning et al., 2005a) is the steady state fuel performance code maintained by Pacific Northwest National Laboratory (PNNL) for the United States Nuclear Regulatory Commission (USNRC). FRAPCON-3 predicts fuel rod performance in pressurized water reactors (PWRs) and boiling water reactors (BWRs) by modeling the material responses of both the fuel and the cladding under normal operating conditions and anticipated operational occurrences (AOOs) with a duration of several minutes or greater. FRAPTRAN (Cunningham et al., 2001a, Cunningham et al., 2001b) is the corresponding transient fuel performance code maintained by PNNL for the USNRC. FRAPTRAN predicts fuel rod performance in PWRs and BWRs by modeling the material responses of both the fuel and the cladding under fast transient and accident conditions. Material properties modeled by FRAPCON-3 and FRAPTRAN include fuel thermal conductivity, fuel thermal expansion, cladding oxide thermal conductivity, cladding thermal conductivity, gas conductance, fission gas release, cladding corrosion, fuel swelling, creep of irradiated cladding, cladding yield strength, Young’s modulus of cladding, cladding axial irradiation growth, and cladding thermal expansion. By modeling material properties, important fuel rod performance parameters, such as rod internal gas pressure, peak fuel centerline temperature, and cladding permanent (i.e. plastic) hoop strain, can be predicted up to high burnup levels (65 GWd/MTU). It has been noted that the original fuel performance codes used by the USNRC, the predecessors of FRAPCON-3 and FRAPTRAN were intrinsically conservative. In fact, the current version of FRAPCON-3 continues to provide conservative options (although these options are no longer used or recommended by PNNL). Despite efforts to update the codes and the models over the past 15 years, the codes are still considered by some to be not just optionally but intrinsically conservative. In order to quantitatively determine if these codes are biased, the latest versions of FRAPCON-3 and FRAPTRAN were examined to determine if the individual material property models or code outputs are biased relative to the available data. Each material property model was examined and compared to the data that was used to develop the model. In addition, a brief literature search was performed to determine if more recent data has become available, since the original model development, to further validate each model. If new data were discovered, these data were compared to the models in FRAPCON-3.3 and FRAPTRAN 1.3 in order to determine if the model is biased relative to the data. In addition to examining each model individually, code predictions that are a combination of multiple model predictions such as fuel centerline temperature, and fission gas release were compared to data from rods where these parameters were measured to determine if these integral effect predictions are biased. Although several individual models were found to be biased, the overall integral predictions of FRAPCON-3.3 and FRAPTRAN 1.3 compare well with integral effects data. For models or integral effect predictions that was found to be biased relative to the data, a new correlation was developed that provides a best-estimate fit to the available data. New correlations have been developed for cladding corrosion and hydrogen pickup, radial power profile for heavy water reactor conditions, radial power profile for UO2-Gd2O3 fuel, fuel thermal expansion at high temperature, gas thermal conductivity at high temperature, and

xviii
cladding creep. These new correlations are discussed in this report and will be included in the upcoming versions of the codes, FRAPCON-3.4 and FRAPTRAN 1.4. Areas where modeling may be lacking were noted for further model development. Fuel performance codes similar to FRAPCON-3 and FRAPTRAN are developed by the fuel vendors and are used to demonstrate safe performance of the fuel rods for each core reload analysis. The fuel vendors must demonstrate that uncertainty in model predictions, fabrication parameters and power history are accounted for in this analysis. In order to do this, fuel vendors have used methodologies where the uncertainty in key critical parameters are included and others that have little effect on the outputs of regulatory interest are not included. In order to determine the effect of each key parameter on the outputs of regulatory interest, a sensitivity study was performed using FRAPCON-3 where each fabrication parameter, model, and power history parameter was individually biased to a high and low value to determine the sensitivity of the uncertainty in these parameters to the outputs of regulatory interest. The results of this study are summarized in this document. This report shows the sensitivity of selected model uncertainties, manufacturing uncertainties, and power uncertainties on the code prediction of rod internal gas pressure, fuel centerline temperature, and cladding strain for sample BWR and PWR cases. It should be noted that the sensitivity to these parameters could change based on differences in power history or fuel rod design. The results from this study can be used to select parameters to vary in an analysis to determine upper bound output values from a statistical combination of uncertainties.

xix
ABBREVIATIONS ASME American Society of Mechanical Engineers AOO Anticipated Operational Occurrence BOL Beginning of Life BWR Boiling Water Reactor CE Combustion Engineering CHF Critical Heat Flux CRUD Chalk River Unknown Deposit (generic term for various residues
deposited on fuel rod surfaces, originally coined by Atomic Energy of Canada, Ltd. (AECL) to describe deposits observed on fuel from the test reactor at Chalk River.)
DNB Departure from Nucleate Boiling EBWR Experimental Boiling Water Reactor EPMA Electron Probe Micro-Analysis FDI Fuel Duty Index FGR Fission Gas Release HTC Heat Transfer Correlation HWR Heavy Water Reactor ID Inner Diameter INEL Idaho National Engineering Laboratory LGHR Linear Heat Generation Rate LOCA Loss of Coolant Accident MOX Mixed Oxide NSRR Nuclear Safety Research Reactor OECD Organization for Economic Co-operation and Development OD Outer Diameter PBF Power Burst Facility PCMI Pellet/Cladding Mechanical Interaction PIE Post Irradiation Examination PNNL Pacific Northwest National Laboratory PWR Pressurized Water Reactor RIA Reactivity Initiated Accident RXA Recrystallized Annealed SNF Spent Nuclear Fuel SPP Second Phase Precipitates SRA Stress Relief Annealed TD Theoretical Density USNRC United States Nuclear Regulatory Commission W Westinghouse


1.1
1.0 INTRODUCTION FRAPCON-3 (Lanning et al., 1997a, Lanning et al, 1997b, Berna et al., 1997, Lanning et al., 2005a) is the steady state fuel performance code maintained by Pacific Northwest National Laboratory (PNNL) for the United States Nuclear Regulatory Commission (USNRC). FRAPCON-3 predicts fuel rod performance in pressurized water reactors (PWRs) and boiling water reactors (BWRs) by modeling the material responses of both the fuel and the cladding under normal operating conditions and anticipated operational occurrences (AOOs) with a duration of several minutes or greater. FRAPTRAN (Cunningham et al., 2001a, Cunningham et al., 2001b) is the corresponding transient fuel performance code maintained by PNNL for the USNRC. FRAPTRAN predicts fuel rod performance in PWRs and BWRs by modeling the material responses of both the fuel and the cladding under fast transient and accident conditions. Material properties modeled by FRAPCON-3 and FRAPTRAN include fuel thermal conductivity, fuel thermal expansion, cladding oxide thermal conductivity, cladding thermal conductivity, gas conductance, fission gas release, cladding corrosion, fuel swelling, creep of irradiated cladding, cladding yield strength, Young’s modulus of cladding, cladding axial irradiation growth, and cladding thermal expansion. By modeling material properties, important fuel rod performance parameters, such as rod internal gas pressure, peak fuel centerline temperature, and cladding permanent (i.e. plastic) hoop strain, can be predicted up to high burnup levels (65 GWd/MTU). It has been noted that the original fuel performance codes used by the USNRC, the predecessors of FRAPCON-3 and FRAPTRAN were intrinsically conservative. In fact, the current version of FRAPCON-3 continues to provide conservative options (although these options are no longer used or recommended by PNNL). Despite efforts to update the codes and the models over the past 15 years, the codes are still considered by some to be not just optionally but intrinsically conservative. In order to quantitatively determine if these codes are biased, the latest versions of FRAPCON-3 and FRAPTRAN were examined to determine if the individual material property models or code outputs are biased relative to the available data. This document describes the work that was done to evaluate the USNRC fuel performance codes FRAPCON-3.3 (Lanning et al., 1997a, Lanning et al, 1997b, Berna et al., 1997, Lanning et al., 2005a) and FRAPTRAN 1.3 (Cunningham et al., 2001a, Cunningham et al., 2001b) for any predictive bias and to determine the sensitivity of model, manufacturing, and power history uncertainties on predictions of fuel centerline temperature, cladding strain, and rod internal pressure. The intent of this report is not to ensure the conservatism in predicted fuel behavior. The intent is to ensure best-estimate behavior of the codes and to ensure (to the extent possible) that unintentional bias has been eliminated. Section 2.0 provides the results of the bias study. In this section, each individual material property model is compared to the data that was used to develop the model as well as new data that has become available since the original model development. In addition, code predictions that rely on the integral effects of multiple material property models, such as fission gas release and fuel centerline temperature, are compared to data that have been taken from fuel rods where these properties were measured. For individual material properties or code predictions that were found to be biased or otherwise in error, a new correlation was developed to provide a best estimate fit to the data that had been used in the original model development and the new data that was available. Section 3.0 describes the

1.2
new models that have been developed as a result of this study. For each new model, a detailed description is provided as well as a plot showing its comparison to data. Each of these models will be included in the upcoming versions of the codes, FRAPCON-3.4 and FRAPTRAN 1.4. Areas where modeling may be lacking were noted for further model development. Section 4.0 provides the result of the sensitivity study that was performed using FRAPCON-3.3. This study documents the effect of uncertainty in various models, manufacturing parameters, and power histories on the code predictions of rod internal pressure, centerline temperature, and cladding hoop strain. Overall conclusions from these studies are given in Section 5.0. References are given in Section 6.0.

2.1
2.0 BIAS ASSESSMENT The latest code versions, FRAPCON-3.3 and FRAPTRAN 1.3, were examined to determine if the codes are intrinsically conservative. Each model was examined and compared to the data that were used to develop the model. In addition, a brief literature search was performed to determine if more recent data has become available, after release of the three code versions, to compare to each model. If new data were discovered, these data were compared to the models in FRAPCON-3.3 and FRAPTRAN-1.3 in order to determine if the model is biased relative to the data. This section will not validate the current models, as this work has already been performed (Lanning et al, 1997a, Lanning et al, 1997b, Lanning et al, 2005a, Cunningham et al, 2001b). Rather this section will just examine the models and integral effect predictions to determine if they are biased relative to the data. Most of the material properties used in these come from the library of nuclear material properties found in MATPRO (Hagrman et al., 1981). Some of these properties have been updated in FRAPCON-3.3 and FRATPRAN 1.3 as a result of new data at higher burnup becoming available. The result of this study is a list given in section 2.8 of models in FRAPCON-3.3 and FRAPTRAN 1.3 that are considered to be best-estimate relative to the most up-to-date data and a list of models that are biased relative to the data. In addition, the integral effects calculations such as temperature and cladding strain are compared to data to determine if these predictions are biased. Models or integral effect predictions found to be biased relative to the data will be updated and corrected in the upcoming versions of the codes, FRAPCON-3.4 and FRAPTRAN 1.4. Areas where modeling may be lacking were noted for further model development.
2.1 Thermal Modeling and Assessment This section describes the thermal modeling in FRAPCON-3.3 and FRAPTRAN-1.3. Section 2.1.1 describes the code solution method. Sections 2.1.2-2.1.6 describe the property models that are used in determining the temperature distribution radially from the cladding outer surface to the fuel center. Section 2.1.7 describes the assessment of the code predictions to measured temperature data from instrumented fuel rods.
2.1.1 Code Solution Method, Fuel Rod Heat Transfer Solution Methods and Pellet Heat Generation Radial Profile
The FRAPCON-3.3 and FRAPTRAN-1.3 codes iteratively calculate the interrelated effects of fuel and cladding temperature, rod internal gas pressure, fuel and cladding deformation, release of fission product gases, fuel swelling and densification, cladding thermal expansion and the irradiation-induced growth, cladding corrosion, and CRUD (Chalk River Unknown Deposit) deposition as functions of time and fuel rod specific power. The solution methods are described in detail in Berna et al. (1997) and Cunningham et al. (2001a). For both codes, the models assume a cylindrical fuel pellet located symmetrically within a cylindrical fuel rod cladding surrounded by coolant. The local linear heat generation rate is used to calculate the coolant bulk temperature. Using this temperature as a boundary condition, FRAPCON-3.3 uses a one-dimensional (1-D) steady-state solution method to determine the temperature distribution in the cladding, gap, and fuel from the outside in, while FRAPTRAN-1.3 uses a 1-D transient solution method to determine the temperature distribution in the cladding, gap, and fuel from the outside in.
2.2
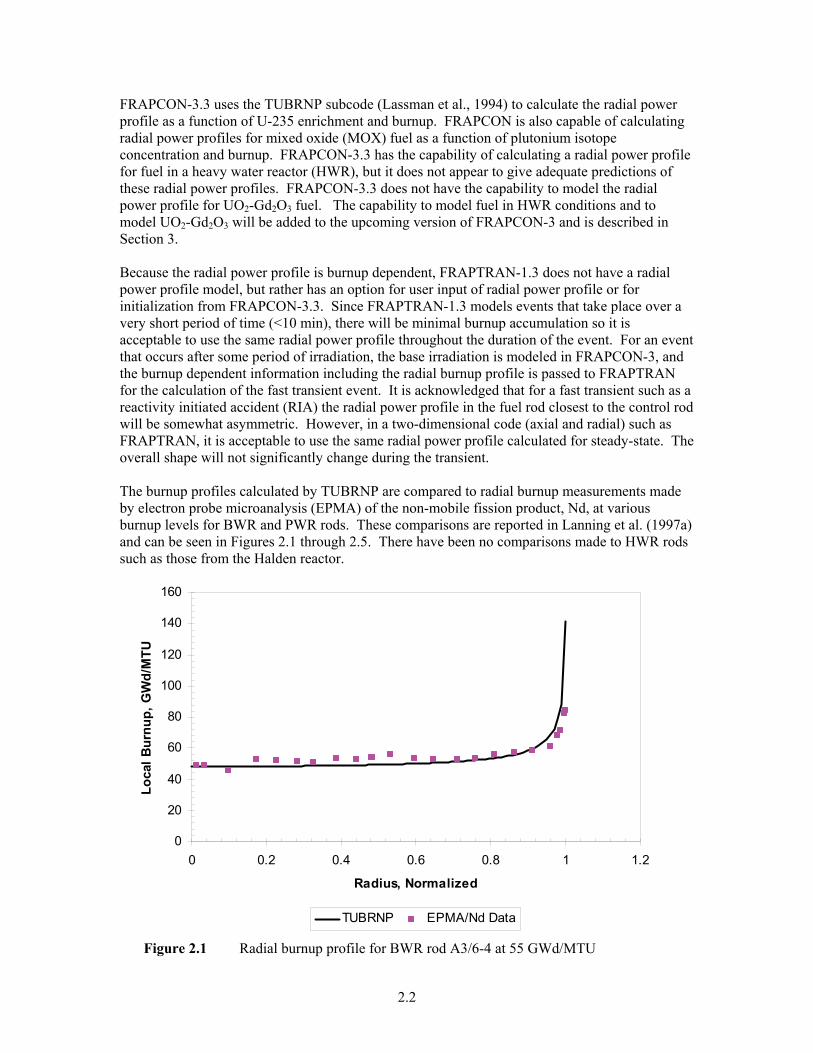
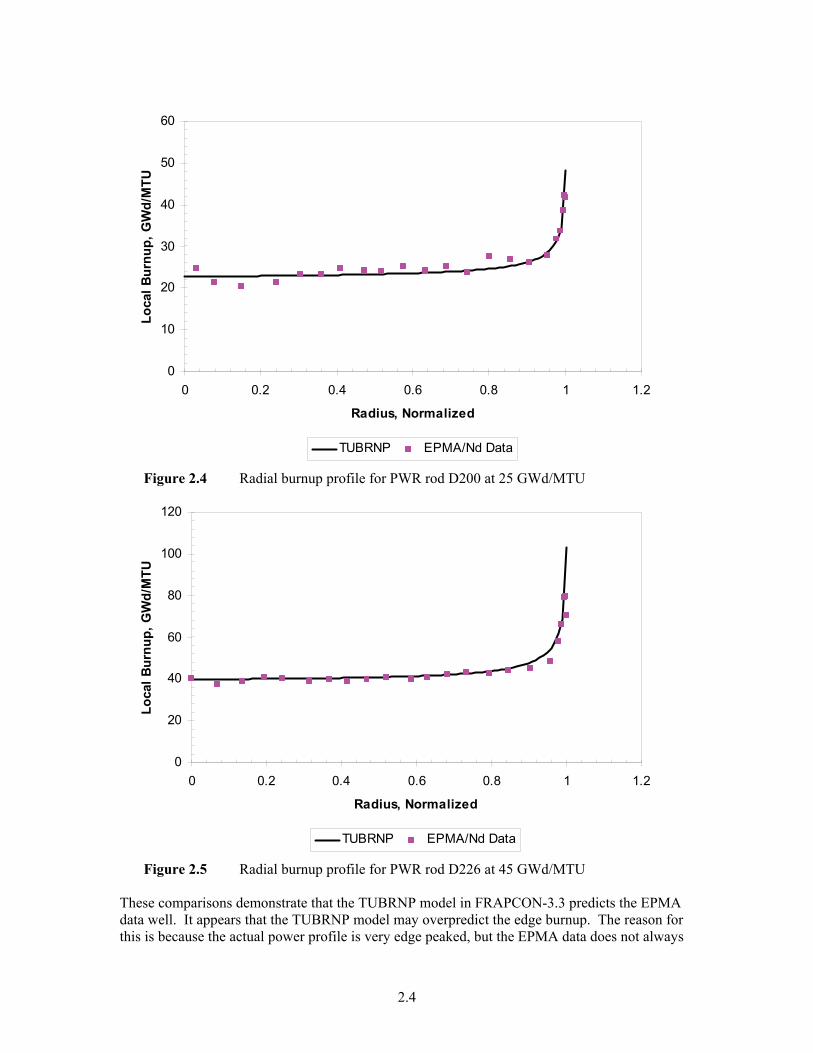
FRAPCON-3.3 uses the TUBRNP subcode (Lassman et al., 1994) to calculate the radial power profile as a function of U-235 enrichment and burnup. FRAPCON is also capable of calculating radial power profiles for mixed oxide (MOX) fuel as a function of plutonium isotope concentration and burnup. FRAPCON-3.3 has the capability of calculating a radial power profile for fuel in a heavy water reactor (HWR), but it does not appear to give adequate predictions of these radial power profiles. FRAPCON-3.3 does not have the capability to model the radial power profile for UO2-Gd2O3 fuel. The capability to model fuel in HWR conditions and to model UO2-Gd2O3 will be added to the upcoming version of FRAPCON-3 and is described in Section 3. Because the radial power profile is burnup dependent, FRAPTRAN-1.3 does not have a radial power profile model, but rather has an option for user input of radial power profile or for initialization from FRAPCON-3.3. Since FRAPTRAN-1.3 models events that take place over a very short period of time (<10 min), there will be minimal burnup accumulation so it is acceptable to use the same radial power profile throughout the duration of the event. For an event that occurs after some period of irradiation, the base irradiation is modeled in FRAPCON-3, and the burnup dependent information including the radial burnup profile is passed to FRAPTRAN for the calculation of the fast transient event. It is acknowledged that for a fast transient such as a reactivity initiated accident (RIA) the radial power profile in the fuel rod closest to the control rod will be somewhat asymmetric. However, in a two-dimensional code (axial and radial) such as FRAPTRAN, it is acceptable to use the same radial power profile calculated for steady-state. The overall shape will not significantly change during the transient. The burnup profiles calculated by TUBRNP are compared to radial burnup measurements made by electron probe microanalysis (EPMA) of the non-mobile fission product, Nd, at various burnup levels for BWR and PWR rods. These comparisons are reported in Lanning et al. (1997a) and can be seen in Figures 2.1 through 2.5. There have been no comparisons made to HWR rods such as those from the Halden reactor.
0
20
40
60
80
100
120
140
160
0 0.2 0.4 0.6 0.8 1 1.2
Radius, Normalized
Loca
l Bur
nup,
GW
d/M
TU
TUBRNP EPMA/Nd Data
Figure 2.1 Radial burnup profile for BWR rod A3/6-4 at 55 GWd/MTU

2.3
0
20
40
60
80
100
120
140
0 0.2 0.4 0.6 0.8 1 1.2
Radius, Normalized
Loca
l Bur
nup,
GW
d/M
TU
TUBRNP EPMA/Nd Data
Figure 2.2 Radial burnup profile for BWR rod H8/36-4 at 55 GWd/MTU
0
20
40
60
80
100
120
140
160
180
0 0.2 0.4 0.6 0.8 1 1.2
Radius, Normalized
Loca
l Bur
nup,
GW
d/M
TU
TUBRNP EPMA/Nd Data
Figure 2.3 Radial burnup profile for PWR rod BK365 at 83 GWd/MTU
2.4
0
10
20
30
40
50
60
0 0.2 0.4 0.6 0.8 1 1.2
Radius, Normalized
Loca
l Bur
nup,
GW
d/M
TU
TUBRNP EPMA/Nd Data
Figure 2.4 Radial burnup profile for PWR rod D200 at 25 GWd/MTU
0
20
40
60
80
100
120
0 0.2 0.4 0.6 0.8 1 1.2
Radius, Normalized
Loca
l Bur
nup,
GW
d/M
TU
TUBRNP EPMA/Nd Data
Figure 2.5 Radial burnup profile for PWR rod D226 at 45 GWd/MTU These comparisons demonstrate that the TUBRNP model in FRAPCON-3.3 predicts the EPMA data well. It appears that the TUBRNP model may overpredict the edge burnup. The reason for this is because the actual power profile is very edge peaked, but the EPMA data does not always

2.5
capture this on the very edge of the pellet. This is demonstrated by examining the data in Figures 2.1 and 2.2 where for BWR rods with the same burnup, significantly different edge peaking can be seen. It can be concluded that the radial power profile model predicts radial power and burnup well within the accuracy of the data.
2.1.2 Fuel Thermal Conductivity The FRAPCON-3.3 and FRAPTRAN-1.3 codes have two fuel thermal conductivity models. One model is for urania (UO2) and the other model is for mixed-oxide fuel (MOX). In addition, each model has the same correction for gadolinia (Gd2O3) additions. Section 2.1.2.1 describes the assessment of the UO2 model. Section 2.1.2.2 describes the assessment of the MOX model. Section 2.1.2.3 describes the assessment of the correction for Gd2O3 additions.
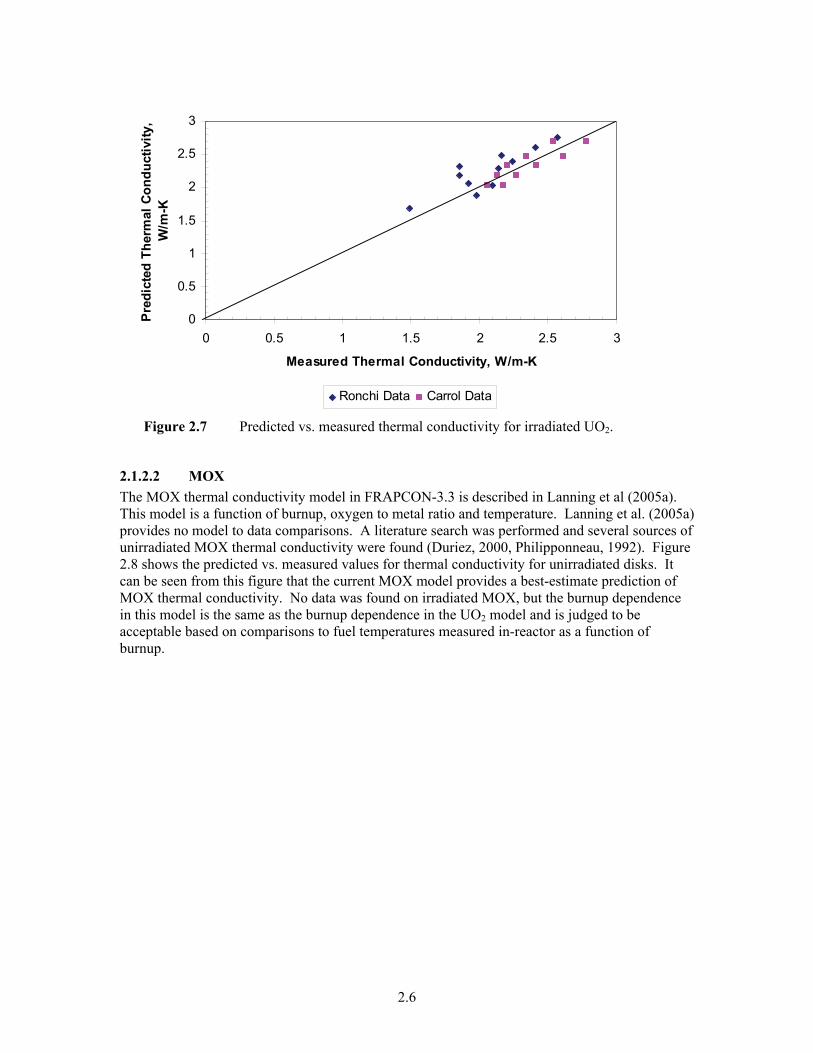
2.1.2.1 UO2 The UO2 thermal conductivity model is the same in both FRAPCON-3.3 and FRAPTRAN-1.3. This model is described in Lanning et al. (2005a). This model is a function of burnup and temperature. Unirradiated (Ronchi, 1999, Lucuta, 1996, Christensen et al., 1964, Godfrey et al., 1094, Bates, 1970, Gibby, 1971, Weilbacker, 1972, Goldsmith and Douglas, 1973, and Hobson et al., 1974) and irradiated (Carrol, 1994, Ronchi, 2004) data was collected to compare to model predictions. Figures 2.6 and 2.7 show the predicted minus measured values for thermal conductivity for unirradiated and irradiated disks, respectively. It can be seen from these figures that the model provides a best-estimate calculation of UO2 thermal conductivity. There is a slight code underprediction for thermal conductivity values greater than 5 W/m-K. These values are measured at and around room temperature and will not impact fuel temperature calculations at normal reactor conditions. The UO2 model is acceptable based on good comparison to thermal conductivity data and measured centerline temperatures.
0123456789
0 3 6 9
Measured Thermal Conductivity, W/m-K
Pred
icte
d Th
erm
al
Con
duct
ivity
, W/m
-K
Ronchi Lucuta Christensen Godfrey BatesGibby Weilbacker Goldsmith Hobson
Figure 2.6 Predicted vs. measured thermal conductivity for unirradiated UO2.
2.6
0
0.5
1
1.5
2
2.5
3
0 0.5 1 1.5 2 2.5 3
Measured Thermal Conductivity, W/m-K
Pred
icte
d Th
erm
al C
ondu
ctiv
ity,
W/m
-K
Ronchi Data Carrol Data
Figure 2.7 Predicted vs. measured thermal conductivity for irradiated UO2.
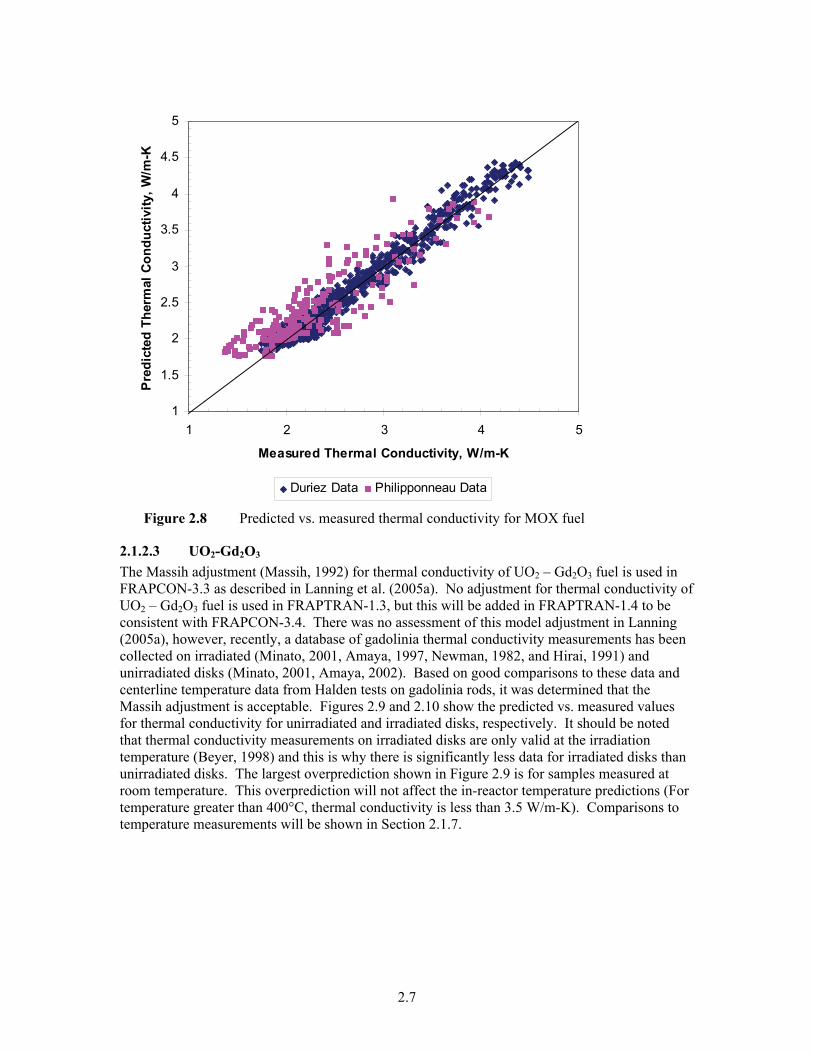
2.1.2.2 MOX The MOX thermal conductivity model in FRAPCON-3.3 is described in Lanning et al (2005a). This model is a function of burnup, oxygen to metal ratio and temperature. Lanning et al. (2005a) provides no model to data comparisons. A literature search was performed and several sources of unirradiated MOX thermal conductivity were found (Duriez, 2000, Philipponneau, 1992). Figure 2.8 shows the predicted vs. measured values for thermal conductivity for unirradiated disks. It can be seen from this figure that the current MOX model provides a best-estimate prediction of MOX thermal conductivity. No data was found on irradiated MOX, but the burnup dependence in this model is the same as the burnup dependence in the UO2 model and is judged to be acceptable based on comparisons to fuel temperatures measured in-reactor as a function of burnup.
2.7
1
1.5
2
2.5
3
3.5
4
4.5
5
1 2 3 4 5
Measured Thermal Conductivity, W/m-K
Pre
dict
ed T
herm
al C
ondu
ctiv
ity, W
/m-K
Duriez Data Philipponneau Data
Figure 2.8 Predicted vs. measured thermal conductivity for MOX fuel
2.1.2.3 UO2-Gd2O3 The Massih adjustment (Massih, 1992) for thermal conductivity of UO2 – Gd2O3 fuel is used in FRAPCON-3.3 as described in Lanning et al. (2005a). No adjustment for thermal conductivity of UO2 – Gd2O3 fuel is used in FRAPTRAN-1.3, but this will be added in FRAPTRAN-1.4 to be consistent with FRAPCON-3.4. There was no assessment of this model adjustment in Lanning (2005a), however, recently, a database of gadolinia thermal conductivity measurements has been collected on irradiated (Minato, 2001, Amaya, 1997, Newman, 1982, and Hirai, 1991) and unirradiated disks (Minato, 2001, Amaya, 2002). Based on good comparisons to these data and centerline temperature data from Halden tests on gadolinia rods, it was determined that the Massih adjustment is acceptable. Figures 2.9 and 2.10 show the predicted vs. measured values for thermal conductivity for unirradiated and irradiated disks, respectively. It should be noted that thermal conductivity measurements on irradiated disks are only valid at the irradiation temperature (Beyer, 1998) and this is why there is significantly less data for irradiated disks than unirradiated disks. The largest overprediction shown in Figure 2.9 is for samples measured at room temperature. This overprediction will not affect the in-reactor temperature predictions (For temperature greater than 400°C, thermal conductivity is less than 3.5 W/m-K). Comparisons to temperature measurements will be shown in Section 2.1.7.

2.8
0
1
2
3
4
5
6
7
0 1 2 3 4 5 6 7
Measured Thermal Conductivity, W/m-K
Pre
dict
ed T
herm
al C
ondu
ctiv
ity, W
/m-K
Data
Figure 2.9 Predicted vs. measured thermal conductivity for unirradiated UO2 Gd2O3.
0
0.5
1
1.5
2
2.5
3
0 0.5 1 1.5 2 2.5 3
Measured Thermal Conductivity (W/m-K)
Pre
dict
ed T
herm
al C
ondu
ctiv
ity (W
/m-K
)
Data
Figure 2.10 Predicted vs. measured thermal conductivity for irradiated UO2 Gd2O3.

2.9
2.1.3 Gap Conductance The gap conductance model in FRAPCON-3.3 and FRAPTRAN-1.3 is based upon the assumption of a symmetric radial gap between the fuel pellet and the cladding, which has finite size even when strong pellet-cladding mechanical interaction (“hard contact”) occurs due to surface roughness effects. Effects of pellet eccentricity upon effective gap conductance are deemed to be overshadowed by the effects of pellet cracking and fragment outward relocation, which for any normal irradiation will occur upon the first rise to full power (see Section 2.1.5). Hence, three parallel paths of heat conduction are envisioned across the pellet-cladding gap:
a. Conduction (bulk diffusion) through the gas (modified by thermal accommodation at the bounding surfaces, in the Knudsen regime).
b. Conduction through points of contact (when pellet-cladding contact has occurred). c. Radiation heat transfer (for pellet outer surface temperatures during normal operation,
this is a minor contribution). These three paths will be discussed in the sections below.
2.1.3.1 Conductance through the Gas The conductivity of the pure gases and gas mixtures encountered in fuel rods is described in Section 2.1.6.5. This includes the mixing rules for calculating mixed-gas conductivity and conductivity of fill gas (normally helium) that has become significantly diluted by released fission gases. The conductance contribution from this pathway is described by Berna et al. (1997). The physical gap separation is calculated from the as-fabricated input gap size, modified by fuel and cladding displacements due to thermal expansion, fuel relocation, fuel densification and swelling, and cladding creep. Fuel creep in the FRAPCON-3.3 and FRAPTRAN-1.3 codes is not calculated, as it is not a large source of pellet outer surface displacement during normal operation. This assumption of a “rigid pellet” is discussed in greater detail in Section 2.5. The “temperature jump distance” is an increment added to the physical gap separation to account for imperfect thermal accommodation (i.e., energy transfer) of the gas molecules impinging on the bounding surfaces of the gap. That is, the gas molecule kinetic energy is incompletely transferred to thermal energy in the cladding, and the thermal energy of the atoms on the fuel pellet surface is incompletely transferred to the gas molecules in the gap. Both of these incomplete energy transfers result in higher fuel temperatures, and they are represented by “accommodation coefficients” (with values of <1.0) for both surfaces. The relationship between temperature jump distance and accommodation coefficient is described by Berna et al. (1997). The development of this model, and its selection from among other possibilities, is explained in (Lanning, 1975). Both ex-reactor gap conductance experiments at PNNL (Garnier and Begej, 1979a, Garnier and Begej, 1979b) and in-reactor experiments at Halden Reactor Project in Norway (Miller, 1980) have confirmed the magnitude of the jump distance that is calculated by FRAPCON-3.3. It should be noted that, for modern PWR and even BWR fuel rods, the pressurization of the helium fill gas leads to in-reactor rod internal pressures that make absolute values of temperature jump distance very insignificant relative to the total gap size. This is even true when the gap has

2.10
closed because the temperature jump distances are still small relative to the combined fuel pellet and cladding surface roughnesses. It should further be noted that, when pellet-cladding contact first occurs, the gap size reduces to the sum of the roughness values. However, as hard contact occurs, this gap size is further reduced slightly as a function of the interface pressure. This is explained in (Lanning et al., 1997a).
2.1.3.2 Conductance through points of cladding-pellet contact When the net fuel pellet and cladding deformations result in pellet-cladding contact and mechanical interaction, direct solid-to-solid heat transfer will occur across the roughness asperity points where, on a microscopic level, contact is actually occurring. Initially, the contact pressure is very small, because the cracked and relocated pellet fragments will be partially pushed back into place by the ongoing differential displacements of fuel and cladding (so-called “soft contact”). In FRAPCON-3.3, this period of soft contact is assigned zero interfacial pressure, and hence no credit is taken for solid-solid contact conductance. When 50% of the fuel pellet outward relocation is consumed by differential deformations, the mechanical model is permitted to calculate interfacial pressure from the increasing differential displacements, and the solid-solid contact conductance is calculated as a function of interface pressure and cladding and fuel conditions. This model is described by Berna et al. (1997). In FRAPTRAN-1.3 as opposed to FRAPCON-3.3, the relocation is not allowed to recover due to the rapid nature of transients and the pellet-cladding contact conduction described above is used immediately upon gap closure.
2.1.3.3 Radiation heat transfer Due to the high axial aspect ratio for the fuel-to-cladding gap, the radiation heat transfer from the fuel pellet surface to the cladding is calculated assuming the fuel and cladding are infinite concentric cylinders, gray body derived by Kreith (1964). This model is described by Berna et al. (1997). This model appears to provide an adequate approximation of the radiation heat transfer between the two bodies. Typically, this pathway constitutes a very small fraction of the total conductance.
2.1.4 Fuel Thermal Expansion The fuel thermal expansion model in both FRAPCON-3.3 and FRAPTRAN-1.3 is the FTHEXP model documented in MATPRO 11, Rev. 2 (Hagrman et al. 1981). The actual coding in terms of comments and formatting varies somewhat, however the effective coding is the same. The model is based on both measurements of the lattice constant by x-ray diffraction, which were applied for model development at temperatures below 800K only, and data from bulk thermal expansion measurements. The same model form is used for both UO2 and PuO2 fuels, with the constants changed depending on the fuel type. Fuel thermal expansion for mixed oxide is determined based on weight fraction. The model in FRAPCON-3.3 and FRAPTRAN-1.3 was compared to data provided in the original MATPRO reference (Grønvold, 1955, Baldock et al., 1966, Christensen, 1963, Kempter and Elliott, 1959, Burdick and Parker, 1956, and Tokar and Nutt, 1972). In, addition, a literature search was performed to find any further thermal expansion data since the publication of the MATPRO model. This search yielded a review of thermal expansion data by Martin (1988) and

2.11
Momin et al (1991) and a model that fits the data well. In addition, two other sources (Fink, 2000b and Carbajo, 2001) recommend the Martin model. The data used in the development of the MATPRO model and the Martin model are shown in Figure 2.11. It can be seen from this figure that the MATPRO model and the Martin model are highly similar up to 2200K. Beyond this, the MATRPO model provides lower thermal expansion than the Martin model. Based on the latest thermal expansion data, the thermal expansion model in FRAPCON-3.3 and FRAPTRAN-1.3 may underpredict fuel thermal expansion above 2200K. The magnitude of under prediction could be as high as 10% by 3000K.
00.005
0.010.0150.02
0.025
0.030.0350.04
0.0450.05
0 500 1000 1500 2000 2500 3000
Temperature, K
Ther
mal
Exp
ansi
on,
ΔL/
L
MATPRO Gronvold BaldockBurdick Other MATPRO References Martin ReferencesMartin Equation
Figure 2.11 Thermal expansion data and model predictions for UO2
The impact of underpredicting the fuel thermal expansion for temperatures greater than 2200K is as follows. • less radial/axial thermal expansion for temperatures greater than 2200K • less gap closure at higher temperature • less cladding strain at higher temperature • less increase in gas pressure at higher temperature Based on these data comparisons it is concluded that the fuel thermal expansion model in FRAPCON-3.3 and FRAPTRAN-1.3 provides a best estimate prediction for fuel thermal expansion up to 2200K. Beyond this temperature, the model may underpredict fuel thermal expansion. This model will be updated in both FRAPCON-3.4 and FRAPTRAN 1.4 as described in Section 3.4.
2.1.5 Fuel Relocation When fresh fuel rods first rise to operating power level, the pellets begin to crack radially, due to the thermal hoop stresses generated by the temperature gradient from center to surface and the

2.12
differential thermal expansion of central region material compared to peripheral region material. A full diametral crack has been observed to develop at linear heat generation rates (LHGRs) as low as 3 kW/ft (Lanning and Cunningham, 1981). Higher LHGR levels typically experienced at beginning of cycle result in multiple radial cracks. The resulting roughly pie-shaped pellet fragments quickly relocate outwards toward the cladding, due to thermal ratcheting (increasing and decreasing temperature rearranging pellet fragments). This results in significant gap closure and reduction in the effective thermal gap, and hence increase in the gap conductance. A best-estimate pellet relocation model was developed for GAPCON-THERMAL-2 Rev. 2 (GT2R2) (Beyer and Cunningham, 1984) and was recommended for use in FRAPCON-3 in conjunction with the FRACAS-1 mechanical model. This GT2R2 model is a function of LHGR and burnup. The gap closure due to relocation as a fraction of the as-fabricated pellet-cladding gap is given for FRAPCON-3.3 by Lanning et al. (1997a). This relocation model is not applied in FRAPTRAN-1.3 because relocation has a small burnup dependence and there is no significant burnup accumulation over the time periods of the events that are modeled in FRAPTRAN-1.3. However, FRAPTRAN-1.3 does assume some initial relocation prior to the start of a transient based on the FRAPCON-3.3 model (Cunningham et al., 2001a). For fresh fuel, the relocation is assumed to be 30% of the gap size. For irradiated fuel, the relocation is assumed to be 45% of the gap size. If FRAPCON-3.3 is used to initialize a FRAPTRAN-1.3 evaluation, then the relocation calculated by FRAPCON-3.3 is used. The assumption is made in FRAPCON-3.3 that 50% of the relocation displacement must be consumed by differential pellet-cladding displacements, before “hard” contact (pellet-cladding mechanical interaction) occurs. This is derived from beginning-of-life (BOL) measurements of the onset of cladding axial elongation, and from Halden squeeze tests that show approximately half the assigned relocation must be taken up before fuel pellet compliance changes back towards that of a solid pellet. In FRAPTRAN-1.3, no recovery of the relocation is allowed due to the rapid nature of transients and “hard” contact is assumed to occur as soon as the fuel and cladding come into contact. Fuel pellet center temperatures measured at BOL in instrumented test rods have repeatedly been found to be lower than values predicted assuming that the as-fabricated fuel-cladding gap size is reduced solely by differential fuel and cladding thermal expansion (Lanning, 1981; Kjaerheim and Rolstad, 1967). It has long been concluded, on the basis of microscopic examination of fuel cross sections (Galbraith, 1973, and Dutt, et al., 1974), that fuel pellet cracking promotes an outward relocation of the pellet fragments that causes additional gap closure, and hence increases the gap conductance and lowers the fuel temperatures. This process begins at beginning-of-life (BOL) and quickly reaches equilibrium. Oguma (1983) characterized this approach to equilibrium based on his analysis of BOL test fuel rod elongation data from Halden instrumented test assemblies. In a series of tests in the PBF reactor at Idaho National Engineering Laboratory (INEL) (Garner, 1978), titled the Gap Conductance (GC) series, GC-1,2, and 3, test rods of varying gap size and fill gas compositions were instrumented with both centerline thermocouples and multiple coplanar off-center thermocouples, in an attempt to quantify this transfer of thermal resistance from gap to fuel. The results indicated a major effect; according to INEL's analysis, the BOL gap size is reduced to much less than 50% of its unrelocated value on average. However, this does not agree with the extensive Halden data at BOL that suggests that the relocated gap size is approximately 50% of the un-relocated value.

2.13
“Soft" pellet cladding mechanical interaction (PCMI) occurs when the cracked (and highly deformable) pellet interacts mechanically with the cladding, producing fuel-cladding contact and limited enhanced axial rod elongation, but not the steep elongation vs. LHGR and bamboo ridging associated with "hard" PCMI. A rod displaying soft PCMI in operation also displays pellet deformability in rod radial compression tests. The occurrence of "soft" PCMI is consistent with the results of several experiments in the Halden Reactor, including NRC-sponsored tests, in which fuel temperature and rod elongation were simultaneously measured as a function of burnup and LHGR (Williford, 1980). Verification of the resulting gap closure functions have been done primarily with instrumented fuel tests in which fill gasses have been alternated at constant LHGR between helium and argon, and the change in pellet center temperature noted. These are indirect verifications of gap size, but they do have the advantage of yielding an “effective thermal gap” under varying conditions of LHGR level and burnup, which is the essential parameter that a fuel performance code needs to perform fuel temperature calculations. Figure 2.12 shows the temperature changes that occurred in a UO2 rod from IFA-633 near BOL when the helium fill gas was exchanged for argon fill gas at LHGRs steps up to 17 kW/m (Wright, 2004). The close agreement between predicted temperature change by FRAPCON-3.3 and that measured is qualitative verification that, for this open-gap situation, the thermal gap is closely predicted by the current relocation model.
200
400
600
800
1000
1200
1400
1600
0 5 10 15 20 25
LHGR, kW/m
Cen
terli
ne T
empe
ratu
re, °
C
Helium Prediction Helium Top TC Helium Bottom TCArgon Prediction Argon Top TC Argon Bottom TC
Figure 2.12 Predicted and measured fuel centerline temperatures with argon and helium
fill gases for a IFA-633 UO2 rod (as-fabricated radial gap is 105μm)
2.1.6 Other Models and Properties This section will describe the following models and properties and provide data comparisons for each one. • Clad-coolant heat transfer

2.14
• Oxide thermal conductivity • CRUD thermal conductivity • Cladding thermal conductivity • Gas conductance • Cladding thermal expansion The following subsections provide an assessment of each of these models
2.1.6.1 Cladding-Coolant Heat Transfer The coolant bulk temperature in FRAPCON-3.3 is calculated for each axial node assuming a single, closed coolant channel as described in Berna (1997). The calculation of the fuel rod surface temperature is performed assuming forced convection and/or nucleate boiling depending on the conditions. The model selection and a description of each model are described in Berna (1997). In FRAPTRAN-1.3 there are several ways for the user to specify the coolant conditions. The first is for the user to specify the coolant temperature, pressure, and surface heat transfer coefficient. In this case, the code uses these values to calculate the cladding surface temperature using the coolant temperature. The second is for the user to specify the coolant as water and specify the enthalpy, pressure, mass flux, and select a heat transfer correlation (HTC) and critical heat flux (CHF) correlation. The HTC and CHF correlations have been updated in FRAPTRAN 1.4. User guidelines will be provided for selecting the appropriate correlations. Work has been performed to assess the correlations and demonstrate that these correlations provide best-estimate predictions of cladding surface temperature over a wide range of coolant conditions (Cuta, 2007). It is concluded that the clad-coolant heat transfer models in FRAPCON-3.3 are acceptable and provide best-estimate values of cladding surface temperature based on good comparisons to fuel centerline temperature and general acceptance of the correlations used. The correlations used in FRAPTRAN-1.3 were satisfactory 25 years ago, but based on new data and information, they needed to be updated. The new correlations have been added to FRAPTRAN-1.4 and provide a best-estimate prediction of cladding surface temperature over a wide range of coolant conditions but are not documented in this report.
2.1.6.2 Oxide Thermal Conductivity The zirconium oxide (ZrO2) thermal conductivity model used in both FRAPCON-3.3 (Lanning et al., 2005a) and FRAPTRAN-1.3 (Cunningham et al., 2001a) is the ZOTCON model documented in MATPRO 11, Rev. 2 (Hagrman et al. 1981). The model is based on the data of Kingery et al. (1954). Data from Maki (1973) and Lapshov and Bashkatov (1973) were reviewed during the development of the ZOTCON model, but not used in the model because it was concluded that those data were not applicable. The model is stated to be applicable for the temperature range 100-1400˚C. The MATPRO description provides data source references and a plot of the Kingery et al. data compared to the ZOTCON model. This data-model comparison is provided in Figure 2.13. The Kingery et al. reference used two sample types for data generation: a bulk ZrO2 that was 100% dense and used for the model, and a sample that had approximately 13% porosity, but was not used for model development.

2.15
A search was performed for ZrO2 thermal conductivity data published since the development of the ZOTCON model. The only openly-published source of oxide thermal conductivity versus temperature data that was found was Gilchrist (1979). Gilchrist measured the thermal conductivity of oxide grown on Zry-2 tubes rather than bulk ZrO2. The oxides were generated under different oxidation conditions and to different thicknesses. Two room-temperature values of ZrO2 thermal conductivity were found. Accuractus.com (Accuractus, 2007) listed the thermal conductivity as 2 W/m-K for bulk Y2O3 stabilized ZrO2. Matweb.com (Matweb, 2007) listed the thermal conductivity as 1.675 W/m-K for material that was 100% dense. A comparison of the MATPRO ZrO2 thermal conductivity model to the Kingery et al. (1954) data is presented in Figure 2.13. There is an excellent model-data comparison for the 100% dense material. However, the model is approximately 20% high compared to the data from the porous ZrO2. This is important because the porous material, with the lower thermal conductivity is believed to be more representative of the actual oxide on cladding. The ZrO2 data by Gilchrist (1979) are also shown in Figure 2.13. The Gilchrist samples are oxide actually grown on Zry-2 tubes and are, therefore, more representative of the oxide observed in-reactor. These data are considerably lower than the MATPRO model and the Kingery et al. porous data. This figure demonstrates that the model in FRAPCON and FRAPTRAN predicts 100% dense oxide well, but overpredicts less dense oxide that is seen in-reactor by approximately 100%. The two room-temperature data points are also included in Figure 2.13 (“bulk data” points). These two data points are in general agreement with the MATPRO model and the data presented by Kingery et al. As with the Kingery et al. data, the oxide source is apparently high-density bulk oxide rather than porous oxide. High-density bulk oxide apparently has a higher thermal conductivity than porous oxide and does not appear to be an appropriate material for generating thermal conductivity data for the purpose of modeling fuel rod thermal performance. The impact of overpredicting oxide thermal conductivity (i.e., overpredicting heat flow through the oxide) would be:
• underprediction of the temperature at the oxide-metal interface; • underprediction of oxide growth because of underpredicting the oxide-metal interface
temperature; and • underprediction of the bulk cladding temperature, gap gas temperature, and fuel
temperature. It is recommended that the MATPRO ZrO2 thermal conductivity model be further evaluated with an expectation of reducing the predicted thermal conductivity. An Organization for Economic Cooperation and Development (OECD) document (OECD 1995) from 1995 also concluded that “thermal conductivity of oxide needs further clarification.” Based on the Gilchrist data, a simple “fix” might be to reduce the predicted oxide thermal conductivity by 50%. Debate on this issue is ongoing. The difference in centerline temperature that the cladding thermal conductivity model being biased high would have is only about 10°C.

2.16
0
0.5
1
1.5
2
2.5
3
0 500 1000 1500 2000
Temperature (K)
Ther
mal
Con
duct
ivity
(W/m
-K)
MATPRO Model Kingery w/porosity Kingery 100% denseGilchrist #1 Gilchrist #3 Gilchrist #4Gilchrist #5 Gilchrist #6 Gilchrist #7bulk data
Figure 2.13 Comparison of MATPRO ZrO2 model to data used to develop the model and newer data
2.1.6.3 CRUD Thermal Conductivity CRUD is commonly defined as the deposition of oxidation products, formed in the primary coolant circuit, on the surface of the fuel rods. There are two types of CRUD that accumulate, a light fluffy CRUD and a more tenacious CRUD. The light fluffy CRUD is mainly an iron oxide (hematite) and is usually not a significant barrier to heat flow. The tenacious CRUD can differ depending on if it is in a BWR or a PWR with the former being a zinc-iron oxide with nickel and the later consisting of a nickel ferrite oxide, but can also consist of other oxides or compounds. The tenacious CRUD deposition is important in fuel rod modeling from the standpoint of affecting the zirconium oxide/metal interface temperature, and thus the rate of formation of additional zirconium oxide (Cheng et al., 2000). The CRUD thermal conductivity model used in FRAPCON-3.3 (Lanning et al., 2005a) is a constant value of 0.87 W/m-K (0.5 BTU/hr-ft-F). The FRAPCON-3.3 documentation does not state where the CRUD thermal conductivity value originates. There is no CRUD thermal conductivity model used in FRAPTRAN-1.3 (Cunningham et al., 2001a) nor is there a CRUD thermal conductivity model defined in MATPRO 11, Rev. 2 (Hagrman et al. 1981). A search was performed for published CRUD thermal conductivity data. There was very little information found. Leyse (2003) stated a value of 0.8 W/m-K for hydrated alumina in the Experimental Boiling Water Reactor (EBWR). This is close to the value used in FRAPCON-3.3.
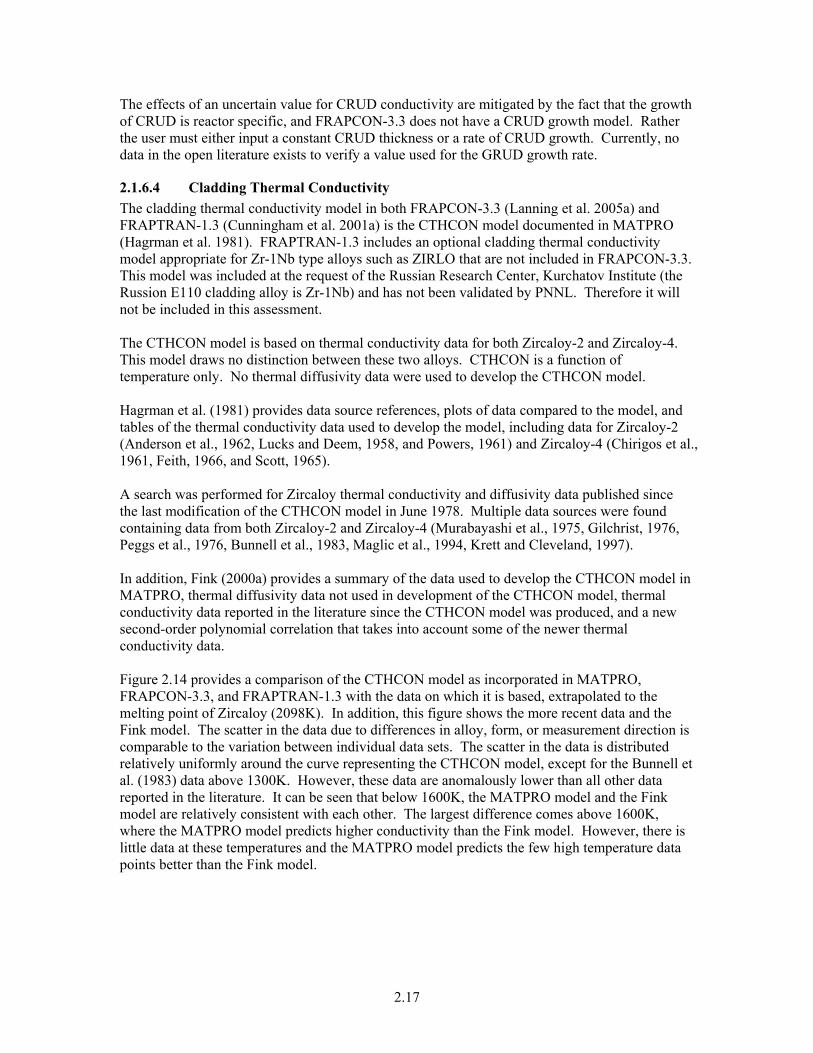
2.17
The effects of an uncertain value for CRUD conductivity are mitigated by the fact that the growth of CRUD is reactor specific, and FRAPCON-3.3 does not have a CRUD growth model. Rather the user must either input a constant CRUD thickness or a rate of CRUD growth. Currently, no data in the open literature exists to verify a value used for the GRUD growth rate.
2.1.6.4 Cladding Thermal Conductivity The cladding thermal conductivity model in both FRAPCON-3.3 (Lanning et al. 2005a) and FRAPTRAN-1.3 (Cunningham et al. 2001a) is the CTHCON model documented in MATPRO (Hagrman et al. 1981). FRAPTRAN-1.3 includes an optional cladding thermal conductivity model appropriate for Zr-1Nb type alloys such as ZIRLO that are not included in FRAPCON-3.3. This model was included at the request of the Russian Research Center, Kurchatov Institute (the Russion E110 cladding alloy is Zr-1Nb) and has not been validated by PNNL. Therefore it will not be included in this assessment. The CTHCON model is based on thermal conductivity data for both Zircaloy-2 and Zircaloy-4. This model draws no distinction between these two alloys. CTHCON is a function of temperature only. No thermal diffusivity data were used to develop the CTHCON model. Hagrman et al. (1981) provides data source references, plots of data compared to the model, and tables of the thermal conductivity data used to develop the model, including data for Zircaloy-2 (Anderson et al., 1962, Lucks and Deem, 1958, and Powers, 1961) and Zircaloy-4 (Chirigos et al., 1961, Feith, 1966, and Scott, 1965). A search was performed for Zircaloy thermal conductivity and diffusivity data published since the last modification of the CTHCON model in June 1978. Multiple data sources were found containing data from both Zircaloy-2 and Zircaloy-4 (Murabayashi et al., 1975, Gilchrist, 1976, Peggs et al., 1976, Bunnell et al., 1983, Maglic et al., 1994, Krett and Cleveland, 1997). In addition, Fink (2000a) provides a summary of the data used to develop the CTHCON model in MATPRO, thermal diffusivity data not used in development of the CTHCON model, thermal conductivity data reported in the literature since the CTHCON model was produced, and a new second-order polynomial correlation that takes into account some of the newer thermal conductivity data. Figure 2.14 provides a comparison of the CTHCON model as incorporated in MATPRO, FRAPCON-3.3, and FRAPTRAN-1.3 with the data on which it is based, extrapolated to the melting point of Zircaloy (2098K). In addition, this figure shows the more recent data and the Fink model. The scatter in the data due to differences in alloy, form, or measurement direction is comparable to the variation between individual data sets. The scatter in the data is distributed relatively uniformly around the curve representing the CTHCON model, except for the Bunnell et al. (1983) data above 1300K. However, these data are anomalously lower than all other data reported in the literature. It can be seen that below 1600K, the MATPRO model and the Fink model are relatively consistent with each other. The largest difference comes above 1600K, where the MATPRO model predicts higher conductivity than the Fink model. However, there is little data at these temperatures and the MATPRO model predicts the few high temperature data points better than the Fink model.

2.18
0
10
20
30
40
50
60
70
0 500 1000 1500 2000
Temperature, K
Ther
mal
Con
duct
ivity
, W/m
-K
MATPRO Data used by MATPRO Recent DataRecent Data (Bunnell) Fink Model
Figure 2.14 MATPRO model (CTHCON), the data on which it is based, newer data, and
the Fink Model. Based on this comparison, it can be concluded that the model used in FRAPCON-3.3 and FRAPTRAN-1.3 for cladding thermal conductivity provides a best-estimate prediction for Zircaloy-2 and Zircaloy-4.
2.1.6.5 Gas Thermal Conductivity The gas thermal conductivity models included in the GTHCON subroutines and those for FRAPCON-3.3 (Lanning et al. 2005a) and FRAPTRAN-1.3 (Cunningham et al. 2001a) exhibit some differences. The thermal conductivity models for the gases helium (He), argon (Ar), krypton (Kr), xenon (Xe), hydrogen (H2), and nitrogen (N2) are the same in both codes (with the exception of one difference in the fourth significant digit of the “bb” parameter for Xe). The individual gas thermal conductivity models and fit coefficients in both codes agree with those listed in MATPRO (Hagrman et al. 1981). The methodology for calculating the thermal conductivity of gas mixtures is identical in both codes (with the exception of one difference in the fourth and fifth significant digits of the “a” parameter for steam (H2O)) and agrees with that described in Hagrman et al. The gas thermal conductivity model for steam is different in FRAPCON-3.3 and FRAPTRAN-1.3, and neither code agrees with the steam conductivity model in Hagrman et al. This discrepancy, and what will be done regarding this will be discussed below. The mixing model included in FRAPCON-3.3 is identical to that employeed in FRAPTRAN-1.3. This mixing model is identical to the mixing model described by Hagrman et al. (1981). The data source references for the gas thermal conductivity models are provided by Hagrman et al. (1981) as follows. The He model is based on data from Johnston and Grilly (1946), Kannuluik and Carman (1952), von Ubisch (1959), Zaitseva (1959), Cheung et al. (1962), Timrot and Totskii (1965), Timrot and Umanskii (1965), Gambhir et al. (1967), and Saxena and Saxena (1968a). The Ar model is based on data from Kannuluik and Carman (1952), von Ubisch (1959),
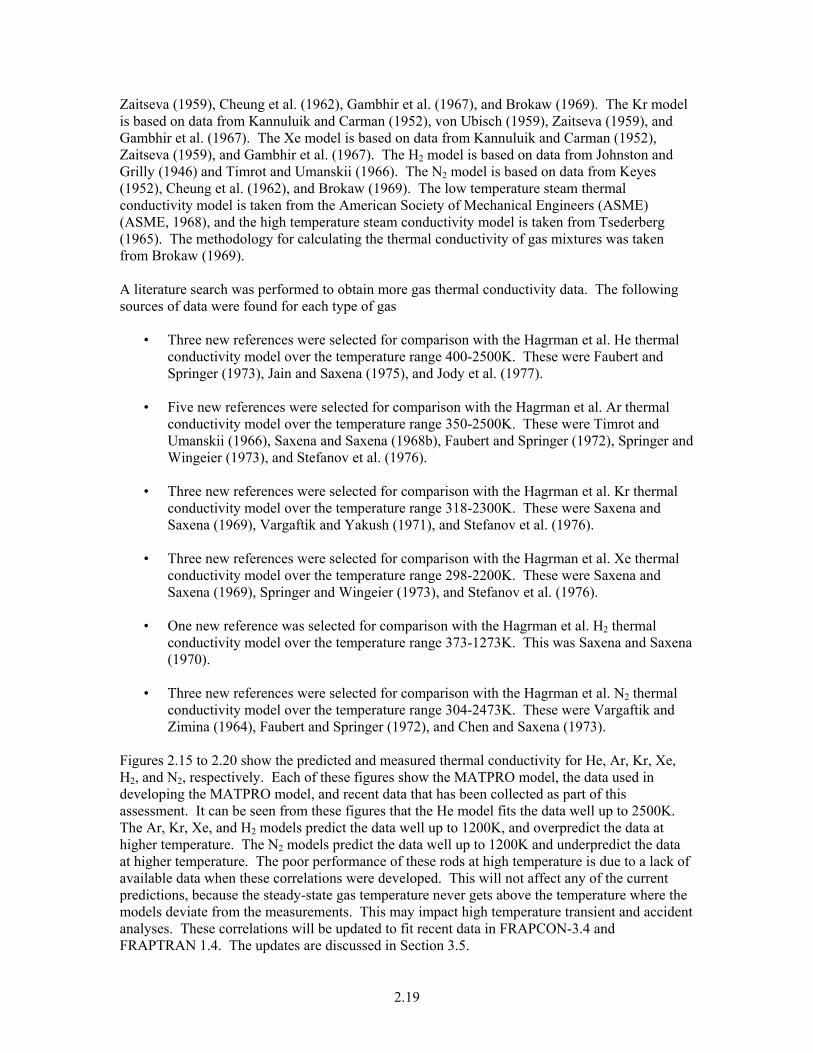
2.19
Zaitseva (1959), Cheung et al. (1962), Gambhir et al. (1967), and Brokaw (1969). The Kr model is based on data from Kannuluik and Carman (1952), von Ubisch (1959), Zaitseva (1959), and Gambhir et al. (1967). The Xe model is based on data from Kannuluik and Carman (1952), Zaitseva (1959), and Gambhir et al. (1967). The H2 model is based on data from Johnston and Grilly (1946) and Timrot and Umanskii (1966). The N2 model is based on data from Keyes (1952), Cheung et al. (1962), and Brokaw (1969). The low temperature steam thermal conductivity model is taken from the American Society of Mechanical Engineers (ASME) (ASME, 1968), and the high temperature steam conductivity model is taken from Tsederberg (1965). The methodology for calculating the thermal conductivity of gas mixtures was taken from Brokaw (1969). A literature search was performed to obtain more gas thermal conductivity data. The following sources of data were found for each type of gas
• Three new references were selected for comparison with the Hagrman et al. He thermal conductivity model over the temperature range 400-2500K. These were Faubert and Springer (1973), Jain and Saxena (1975), and Jody et al. (1977).
• Five new references were selected for comparison with the Hagrman et al. Ar thermal
conductivity model over the temperature range 350-2500K. These were Timrot and Umanskii (1966), Saxena and Saxena (1968b), Faubert and Springer (1972), Springer and Wingeier (1973), and Stefanov et al. (1976).
• Three new references were selected for comparison with the Hagrman et al. Kr thermal
conductivity model over the temperature range 318-2300K. These were Saxena and Saxena (1969), Vargaftik and Yakush (1971), and Stefanov et al. (1976).
• Three new references were selected for comparison with the Hagrman et al. Xe thermal
conductivity model over the temperature range 298-2200K. These were Saxena and Saxena (1969), Springer and Wingeier (1973), and Stefanov et al. (1976).
• One new reference was selected for comparison with the Hagrman et al. H2 thermal
conductivity model over the temperature range 373-1273K. This was Saxena and Saxena (1970).
• Three new references were selected for comparison with the Hagrman et al. N2 thermal
conductivity model over the temperature range 304-2473K. These were Vargaftik and Zimina (1964), Faubert and Springer (1972), and Chen and Saxena (1973).
Figures 2.15 to 2.20 show the predicted and measured thermal conductivity for He, Ar, Kr, Xe, H2, and N2, respectively. Each of these figures show the MATPRO model, the data used in developing the MATPRO model, and recent data that has been collected as part of this assessment. It can be seen from these figures that the He model fits the data well up to 2500K. The Ar, Kr, Xe, and H2 models predict the data well up to 1200K, and overpredict the data at higher temperature. The N2 models predict the data well up to 1200K and underpredict the data at higher temperature. The poor performance of these rods at high temperature is due to a lack of available data when these correlations were developed. This will not affect any of the current predictions, because the steady-state gas temperature never gets above the temperature where the models deviate from the measurements. This may impact high temperature transient and accident analyses. These correlations will be updated to fit recent data in FRAPCON-3.4 and FRAPTRAN 1.4. The updates are discussed in Section 3.5.

2.20
0.00
0.10
0.20
0.30
0.40
0.50
0.60
0.70
0.80
0 500 1000 1500 2000 2500 3000
Temperature, K
Ther
mal
Con
duct
ivity
, W/m
-K
MATPRO Data used by MATPRO Recent Data
Figure 2.15 Thermal conductivity data and model predictions for He
0.00
0.01
0.02
0.03
0.04
0.05
0.06
0.07
0.08
0.09
0.10
0 500 1000 1500 2000 2500 3000
Temperature, K
Ther
mal
Con
duct
ivity
, W/m
-K
MATPRO Data used by MATPRO Recent Data
Figure 2.16 Thermal conductivity data and model predictions for Ar
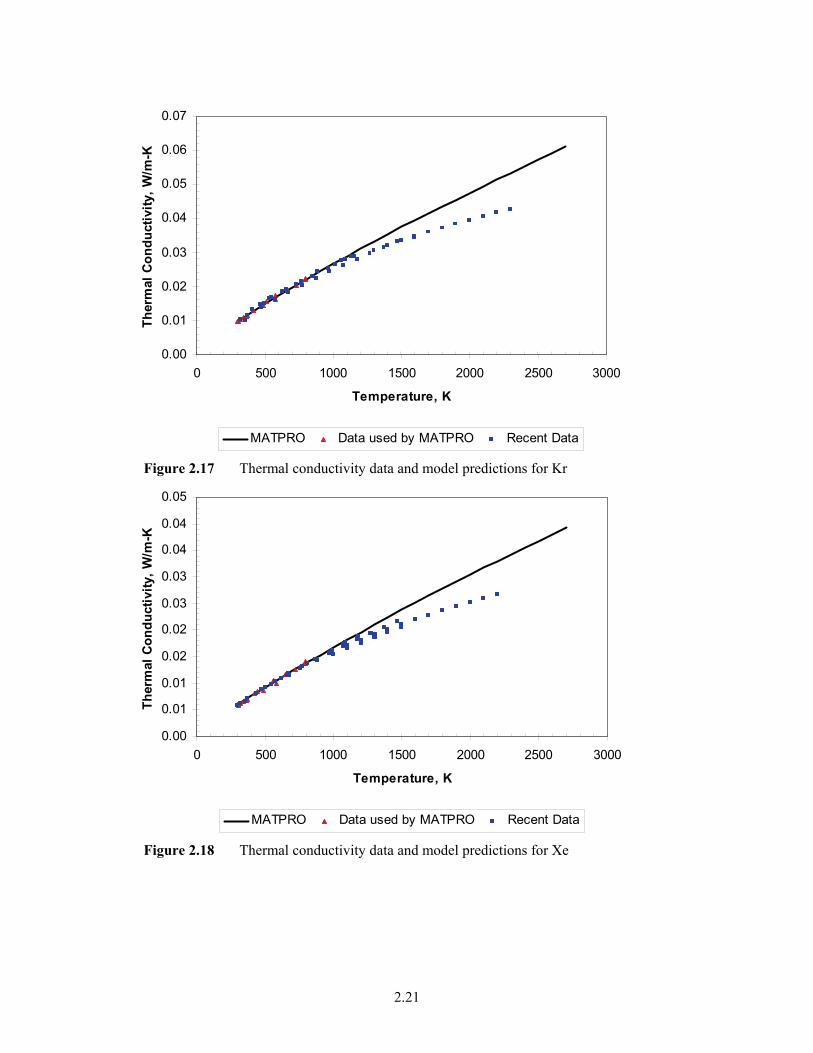
2.21
0.00
0.01
0.02
0.03
0.04
0.05
0.06
0.07
0 500 1000 1500 2000 2500 3000
Temperature, K
Ther
mal
Con
duct
ivity
, W/m
-K
MATPRO Data used by MATPRO Recent Data
Figure 2.17 Thermal conductivity data and model predictions for Kr
0.00
0.01
0.01
0.02
0.02
0.03
0.03
0.04
0.04
0.05
0 500 1000 1500 2000 2500 3000
Temperature, K
Ther
mal
Con
duct
ivity
, W/m
-K
MATPRO Data used by MATPRO Recent Data
Figure 2.18 Thermal conductivity data and model predictions for Xe

2.22
0.00
0.20
0.40
0.60
0.80
1.00
1.20
0 500 1000 1500 2000 2500 3000
Temperature, K
Ther
mal
Con
duct
ivity
, W/m
-K
MATPRO Data used by MATPRO Recent Data
Figure 2.19 Thermal conductivity data and model predictions for H2
0.00
0.02
0.04
0.06
0.08
0.10
0.12
0.14
0 500 1000 1500 2000 2500 3000
Temperature, K
Ther
mal
Con
duct
ivity
, W/m
-K
MATPRO Data used by MATPRO Recent Data
Figure 2.20 Thermal conductivity data and model predictions for N2 As discussed earlier, there is a difference in the models for steam conductivity between what is in MATPRO, FRAPCON-3.3, and FRAPTRAN-1.3. These three models are plotted in Figure 2.21 for a pressure of 100 MPa. Also shown in this figure is the ASME model that is essentially the same as the MATPRO model, and some data.

2.23
It can be seen from this figure that the MATPRO and ASME models predict the data well. The FRAPCON-3.3 model underpredicts the data by 10-30%, because it is only valid up to 0.1 MPa. The FRAPTRAN-1.3 model predicts negative values for the thermal conductivity which indicates a coding error in this model. The ASME model will be included in both FRAPCON-3.4 and FRAPTRAN-1.4 since it predicts the data best and is valid over the largest pressure range. This discrepancy has not affected any of the assessment cases to date since none of them used steam as a fill gas. In FRAPTRAN 1.3, the code uses steam in the fuel/cladding gap after the rods bursts, but at this point, temperature predictions are not of great concern.
-0.15
-0.1
-0.05
0
0.05
0.1
0.15
600 650 700 750 800 850 900 950 1000Temperature, K
Ther
mal
Con
duct
ivity
, W/m
-K
Data ASME (1968) MATPRO FRAPTRAN-1.3 FRAPCON-3.3
Figure 2.21 Thermal conductivity data and model predictions for steam at 100 MPa The mixing model in FRAPCON-3.3 and FRAPTRAN-1.3 was used to compare against thermal conductivity data taken on various gas mixtures (Ibbs and Hirst, 1929, Mason and von Ubisch, 1960, and Gray and Wright, 1961). It can be seen from Figure 2.22 that the gas mixing model in FRAPCON-3.3 and FRAPTRAN-1.3 predicts these data well. Some biases in the predictions at higher temperatures may be due to over- or under-prediction in the individual conductivities of the gases at high temperature.
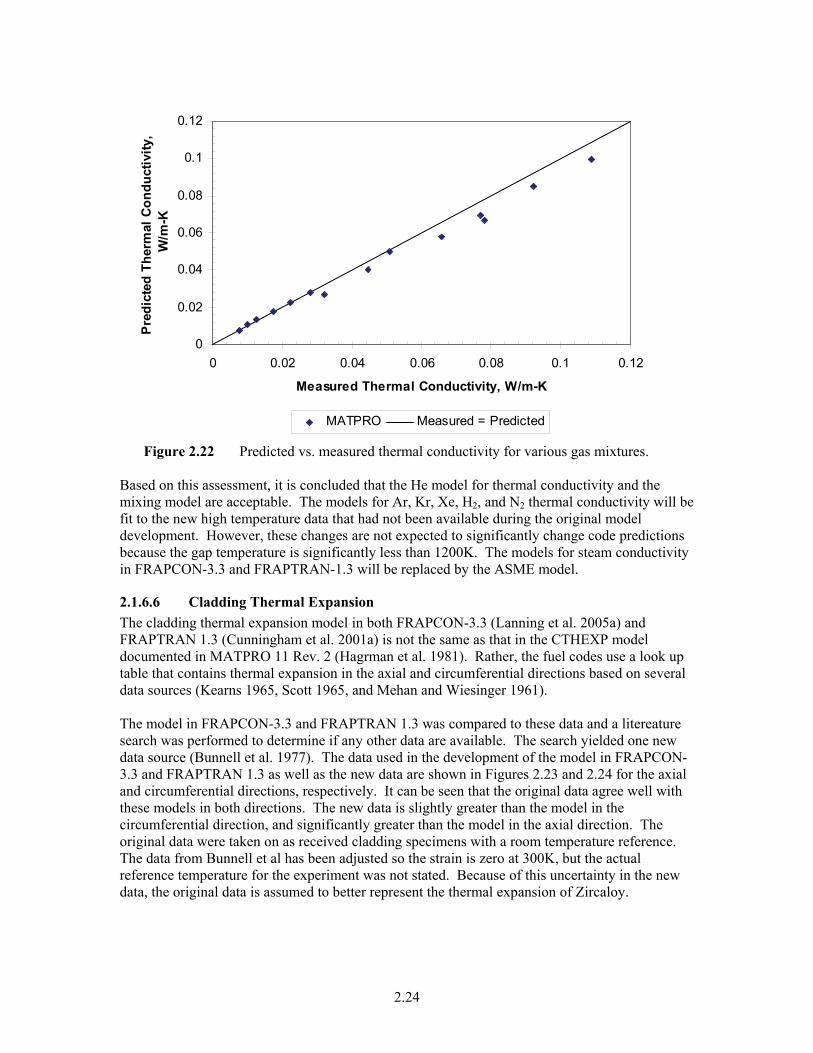
2.24
0
0.02
0.04
0.06
0.08
0.1
0.12
0 0.02 0.04 0.06 0.08 0.1 0.12
Measured Thermal Conductivity, W/m-K
Pred
icte
d Th
erm
al C
ondu
ctiv
ity,
W/m
-K
MATPRO Measured = Predicted
Figure 2.22 Predicted vs. measured thermal conductivity for various gas mixtures. Based on this assessment, it is concluded that the He model for thermal conductivity and the mixing model are acceptable. The models for Ar, Kr, Xe, H2, and N2 thermal conductivity will be fit to the new high temperature data that had not been available during the original model development. However, these changes are not expected to significantly change code predictions because the gap temperature is significantly less than 1200K. The models for steam conductivity in FRAPCON-3.3 and FRAPTRAN-1.3 will be replaced by the ASME model.
2.1.6.6 Cladding Thermal Expansion The cladding thermal expansion model in both FRAPCON-3.3 (Lanning et al. 2005a) and FRAPTRAN 1.3 (Cunningham et al. 2001a) is not the same as that in the CTHEXP model documented in MATPRO 11 Rev. 2 (Hagrman et al. 1981). Rather, the fuel codes use a look up table that contains thermal expansion in the axial and circumferential directions based on several data sources (Kearns 1965, Scott 1965, and Mehan and Wiesinger 1961). The model in FRAPCON-3.3 and FRAPTRAN 1.3 was compared to these data and a litereature search was performed to determine if any other data are available. The search yielded one new data source (Bunnell et al. 1977). The data used in the development of the model in FRAPCON-3.3 and FRAPTRAN 1.3 as well as the new data are shown in Figures 2.23 and 2.24 for the axial and circumferential directions, respectively. It can be seen that the original data agree well with these models in both directions. The new data is slightly greater than the model in the circumferential direction, and significantly greater than the model in the axial direction. The original data were taken on as received cladding specimens with a room temperature reference. The data from Bunnell et al has been adjusted so the strain is zero at 300K, but the actual reference temperature for the experiment was not stated. Because of this uncertainty in the new data, the original data is assumed to better represent the thermal expansion of Zircaloy.

2.25
Based on the original thermal expansion data, the cladding thermal expansion model in FRAPCON-3.3 and FRAPTRAN 1.3 provides a best-estimate fit to data up to 1100K. Very little data exists above this temperature such that the model cannot be validated above 1100K.
0
0.0005
0.001
0.0015
0.002
0.0025
0.003
0.0035
0.004
0.0045
0.005
0 200 400 600 800 1000 1200 1400
Temperature, K
Axi
al T
herm
al E
xpan
sion
, in/
in
FRAPCON-3 Data used by FRAPCON-3 Bunnell Data
Figure 2.23 Axial thermal expansion model from FRAPCON-3.3 and FRAPTRAN 1.3 compared to data
0
0.001
0.002
0.003
0.004
0.005
0.006
0 200 400 600 800 1000 1200 1400
Temperature, K
Circ
umfe
rent
ial T
herm
al E
xpan
sion
, in
/in
FRAPCON-3 Data used by FRAPCON-3 Bunnell Data
Figure 2.24 Circumferential thermal expansion model from FRAPCON-3.3 and FRAPTRAN 1.3 compared to data
2.26
2.1.7 Integral Assessment Instrument fuel rods irradiated in Halden have been used to assess the predicted temperatures from FRAPCON-3.3, by comparing the predictions to measurements taken in-reactor using centerline thermocouples, and expansion thermometers. The following sections show the results of temperature comparisons for UO2 rods, UO2-Gd2O3 rods and MOX rods. In a search of the literature, PNNL has been unable to find any reported tests that have collected centerline temperature during fast transients. Therefore, FRAPTRAN-1.3 was not assessed relative to its prediction of centerline temperature. However, since it uses the same models as FRAPCON-3.3, it is expected to provide centerline temperature predictions that are as accurate as those of FRAPCON-3.3.
2.1.7.1 UO2 Temperature Comparisons FRAPCON-3 was initially assessed against BOL temperature measurements taken during the first ramp to power and against temperature measurements made throughout the life of the rod. Five rods are used to assess the performance of FRAPCON-3 at beginning of life. These rods are IFA-432 rod 1, IFA-432 rod 2, IFA-432 rod 3, IFA-513 rod 1, and IFA-513 rod 6. Four additional rods, IFA-681r1, IFA-633r1, IFA-633r3, and IFA-633r5 were recently added to the beginning of life temperature assessment. The rods, IFA-432 rod 1, IFA-432 rod 2, IFA-432 rod 3, IFA-513 rod 1, IFA-513 rod 6, and IFA-562 rod 18 were also initially used to assess the performance of FRAPCON-3 as a function of burnup with a seventh rod being recently added. The seventh rod is IFA-597 rod 8. IFA-432 rod 2 has been removed as an assessment of FRAPCON-3 as a function of burnup, as the test is not prototypic of current fuel designs due to its large gap, and a small overprediction in fission gas release can result in a large temperature overprediction. Figure 2.25 shows the predicted vs. measured temperature for the BOL ramp up to power for the five assessment cases. It can be seen from this figure that FRAPCON-3.3 predicts these temperatures within ±50K for all these rods except IFA-513r6. This rod is slightly underpredicted at high temperatures. However, this prediction is still within the uncertainty of the data. A ±50K uncertainty on temperature predictions is reasonable given the uncertainty in the thermocouple data and the calculated rod power.

2.27
0
500
1000
1500
2000
2500
0 500 1000 1500 2000 2500
Measured Temperature, K
Pred
icte
d Te
mpe
ratu
re, K
IFA-432r1 IFA-432r2 IFA-432r3 IFA-513r1 IFA513r6IFA-681r1 IFA-633r1 IFA-633r3 IFA-633r5
Figure 2.25 Predicted and measured temperature for BOL ramp to power.
The following figures show measured and predicted fuel centerline temperatures from rods with centerline temperature measurements. Individual rod predictions may demonstrate a systematic error (bias) that may be due to thermocouple decalibration or a systematic error in the power history provided due to decalibration in the neutron detectors. However, when all the comparisons are examined, it is found that there is no overall systematic error (bias) in the prediction of UO2 fuel temperature throughout life similar to what was seen in Figure 2.25 for UO2 at BOL. Figure 2.26 shows the measured and predicted centerline temperature for IFA-432r1. This figure contains data from the lower thermocouple. This rod also contained an upper thermocouple, but it failed after 150 days. The comparisons to the upper thermocouple data are similar to the lower thermocouple. This figure shows excellent agreement between the FRAPCON-3.3 predictions and the data.

2.28
1000
1100
1200
1300
1400
1500
1600
1700
1800
0 100 200 300 400 500 600 700 800
Time, Days
Cen
terl
ine
Tem
pera
ture
, K
Lower TC Data FRAPCON-3.3
Figure 2.26 Measured and predicted centerline temperature for IFA-432r1 lower thermocouple (Burnup=45 GWd/MTU, as-fabricated radial gap=114μm)
Figure 2.27 shows the measured and predicted centerline temperature for IFA-432r3. This figure contains data from the lower thermocouple. This rod also contained an upper thermocouple, but it failed after 550 days. The comparisons to the upper thermocouple data are similar to the lower thermocouple. This figure shows excellent agreement between the FRAPCON-3.3 predictions and the data at beginning of life, and overprediction of about 100K at end of life. This overprediction may be due to FRAPCON-3.3 overpredicting the gas release, leading to higher predicted temperatures. As noted earlier, overprediction of gas release leads to lower gap conductivity and results in higher fuel temperature predictions.

2.29
800
900
1000
1100
1200
1300
1400
1500
0 200 400 600 800 1000 1200
Time, Days
Cen
terl
ine
Tem
pera
ture
, K
Lower TC Data FRAPCON-3.3
Figure 2.27 Measured and predicted centerline temperature for IFA-432r3 lower thermocouple (Burnup=45 GWd/MTU, as-fabricated radial gap=38μm)
Figure 2.28 shows the measured and predicted centerline temperature for IFA-513r1. This figure contains data from the upper and lower thermocouples. This figure shows reasonable agreement between the FRAPCON-3.3 predictions and the data.

2.30
500
700
900
1100
1300
1500
1700
1900
2100
0 50 100 150 200
Time, days
Tem
pera
ture
, K
Upper TC Data FRAPCON-3.3 (Upper TC) (a)
500
700
900
1100
1300
1500
1700
0 50 100 150 200
Time, days
Tem
pera
ture
, K
Lower TC Data FRAPCON-3.3 (Lower TC)(b)
Figure 2.28 Measured and predicted centerline temperature for IFA-513r1 upper thermocouple (a) and lower thermocouple (b) (Burnup=10 GWd/MTU, as-fabricated radial gap=108μm)
Figure 2.29 shows the measured and predicted centerline temperature for IFA-513r6. This figure contains data from the upper and lower thermocouples. This figure shows reasonable agreement between the FRAPCON-3.3 predictions and the data.

2.31
500
700
900
1100
1300
1500
1700
1900
2100
2300
0 50 100 150 200
Time, days
Tem
pera
ture
, K
Upper TC Data FRAPCON-3.3 (Upper TC) (a)
500
700
900
1100
1300
1500
1700
1900
0 50 100 150 200
Time, days
Tem
pera
ture
, K
Lower TC Data FRAPCON-3.3 (Lower TC) (b)
Figure 2.29 Measured and predicted centerline temperature for IFA-513r6 upper thermocouple (a) and lower thermocouple (b) (Burnup=10 GWd/MTU, as-fabricated radial gap=108μm)
Figure 2.30 shows the measured and predicted centerline temperature for IFA-562r18. This figure contains rod-average data from the expansion thermometer. This figure shows excellent agreement between the FRAPCON-3.3 predictions and the data.

2.32
700
800
900
1000
1100
1200
1300
1400
0 200 400 600 800 1000
Time, days
Cent
erlin
e Te
mpe
ratu
re, K
Rod-Average Data FRAPCON-3.3
Figure 2.30 Measured and predicted rod-average centerline temperature for IFA-562r18 (Burnup=76 GWd/MTU, as-fabricated radial gap=50μm)
Figure 2.31 shows the measured and predicted centerline temperature for IFA-597r8. This rod was refabricated from a commercial rod that was irradiated to 68 GWd/MTU. This figure contains upper thermocouple data. This figure shows reasonable agreement between the FRAPCON-3.3 predictions and the data (±75K).

2.33
800
900
1000
1100
1200
1300
1400
0 20 40 60 80 100
Time, days
Cent
erlin
e Te
mpe
ratu
re, K
Upper TC Data FRAPCON-3.3
Figure 2.31 Measured and predicted centerline temperature for IFA-597r8 (starting burnup=68 GWd/MTU, ending burnup=71 GWd/MTU, as-fabricated radial gap=105μm).
This section demonstrates that FRAPCON-3.3 continues to provide a best-estimate prediction of centerline temperature for UO2 rods to within ±70K for recent experimental data.
2.1.7.2 UO2-Gd2O3 Temperature Comparisons The adjustment for gadolinia in the thermal conductivity model has recently been assessed against centerline temperature predictions from three instrumented fuel assemblies irradiated at the Halden Reactor. The results of these comparisons are provided in this section. Figures 2.32 and 2.33 show the measured and predicted centerline temperature for IFA-515.10. Rods A1 and B1 are UO2 rods and rods A2 and B2 are UO2-Gd2O3 rods with depleted Gd. These rods were meant to show the difference only due to the thermal conductivity degradation from Gd2O3, not due to the difference in radial power profile. It can be seen from these figures that FRAPCON-3.3 predicts the centerline temperatures for UO2-Gd2O3 rods as well as for UO2 rods. In these figures the vertical line denotes where the thermocouple failed. Although data was reported after this point, it is not valid.

2.34
300
400
500
600
700
800
900
1000
0 20 40 60 80 100
Burnup, GWd/MTU
Tem
pera
ture
, °C
A1 Data FRAPCON-3.3 TC failed(a)
300
400
500
600
700
800
900
1000
0 20 40 60 80 100
Burnup, GWd/MTU
Tem
pera
ture
, °C
A2 Data FRAPCON-3.3 TC Failed(b)
Figure 2.32 Measured and predicted centerline temperature for IFA-515.10 rod A1 (UO2) (a), and for IFA-515.10 rod A2 (UO2-8%Gd2O3) (b) (Burnup=80 GWd/MTU, as-fabricated radial gap=25μm)

2.35
300
400
500
600
700
800
900
1000
0 20 40 60 80 100
Burnup, GWd/MTU
Tem
pera
ture
, °C
B1 Data FRAPCON-3.3(a)
300
400
500
600
700
800
900
1000
0 20 40 60 80 100
Burnup, GWd/MTU
Tem
pera
ture
, °C
B2 Data FRAPCON-3.3 TC Failed(b)
Figure 2.33 Measured and predicted centerline temperature for IFA-515.10 rod B1 (UO2) (a), and for IFA-515.10 rod B2 (UO2-8%Gd2O3) (b) (Burnup=80 GWd/MTU, as-fabricated radial gap=25μm)
Figures 2.34 and 2.35 show the measured and predicted centerline temperature for IFA-636 rod 2 and rod 4. These rods contain standard Gd. Because of this, it was necessary to modify FRAPCON-3 to use the radial power profiles provided by Halden for these rods. Rod 2 was equipped with a centerline thermocouple and the data from this thermocouple is shown in Figure 2.32. Rod 4 contains solid pellets, and the data shown in Figure 2.34 is estimated from Rod 2. Because of this, there is more uncertainty in the data from rod 4. In addition, during the first rise to power, as the Gd is burning out, there is a high level of uncertainty on the rod power. Because of this, FRAPCON-3.3 may not predict the centerline temperature well during this period. These

2.36
figures show excellent agreement between the FRAPCON-3.3 predictions and the data for rod 2 and reasonable agreement for rod 4 that has greater uncertainty.
0
200
400
600
800
1000
1200
0 200 400 600 800
Time, Days
Tem
pera
ture
, °C
636 Rod 2 Data FRAPCON-3.3
Figure 2.34 Measured and predicted centerline temperature for IFA-636r2 (UO2-8%Gd2O3) (Burnup=25 GWd/MTU, as-fabricated radial gap=77μm)
0
200
400
600
800
1000
1200
1400
0 5 10 15 20 25
Rod Average Burnup, GWd/MTU
Tem
pera
ture
, °C
636 Rod 4 Data FRAPCON-3.3
Figure 2.35 Measured and predicted centerline temperature for IFA-636r4 (UO2-8%Gd2O3) (Burnup=25 GWd/MTU, as-fabricated radial gap=77μm)
Figures 2.36 through 2.38 show the measured and predicted centerline temperature for IFA-681 rod 1, rod 2 and rod 3. Rods 4-6 are not shown here, because there are still some issues in regards to calibrating the data from these rods. Rod 1 is a UO2 rod. Rods 2 and 3 contain standard Gd with 2 wt% and 8 wt% Gd2O3. Because of this, it was necessary to use the modified FRAPCON-3 discussed above to use the radial power profiles provided by Halden for these rods. During the

2.37
first rise to power, as the Gd is burning out, there is a high level of uncertainty on the rod power. Because of this, FRAPCON-3.3 may not predict the centerline temperature well during this period. These figures show excellent agreement between the FRAPCON-3.3 predictions and the data for all three rods, particularly after the Gd has burned out (~100 days for Figure 2.37, >175 days for Figure 2.38) and there is less uncertainty in the rod power.
0
200
400
600
800
1000
1200
1400
0 50 100 150
Time Days
Tem
pera
ture
, °C
Rod 1 Data FRAPCON-3.3
Figure 2.36 Measured and predicted centerline temperature for IFA-681r1 (UO2) (Burnup=12 GWd/MTU, as-fabricated radial gap=85μm)
0
200
400
600
800
1000
1200
1400
0 50 100 150
Time Days
Tem
pera
ture
, °C
Rod 2 Data FRAPCON-3.3
Figure 2.37 Measured and predicted centerline temperature for IFA-681r2 (UO2 2%Gd2O3) (Burnup=10 GWd/MTU, as-fabricated radial gap=85μm)

2.38
0
200
400
600
800
1000
1200
0 50 100 150
Time Days
Tem
pera
ture
, °C
Rod 3 Data FRAPCON-3.3
Figure 2.38 Measured and predicted centerline temperature for IFA-681r3 (UO2 8%Gd2O3) (Burnup=4 GWd/MTU, as-fabricated radial gap=85μm)
2.1.7.3 MOX Temperature Comparisons FRAPCON-3.3 predictions have been benchmarked against centerline temperatures taken from five Halden tests with instrumented fuel assemblies containing 9 rods. The results of these comparisons are provided in this section. Figure 2.39 shows the results of all nine rods as predicted centerline temperature vs. measured centerline temperature. It can be seen from this figure that although predictions of individual rods may be biased high or low, the overall predictions are in excellent agreement with the measurements (±10%).

2.39
0
200
400
600
800
1000
1200
1400
0 200 400 600 800 1000 1200 1400
Measured Centerline Temperature, °C
Pre
dict
ed C
ente
rline
Te
mpe
ratu
re, °
C
629-1r1 629-1r2 610.2
610.4 648.1r1 648r2
IFA-629.3r5 IFA-629.3r6 IFA-606
Predicted = Measured Pred.=Meas.*1.1 Pred.=Meas.*0.9
Figure 2.39 Predicted vs. measured centerline temperature for Halden MOX rods. Figures 2.40 and 2.41 show the measured and predicted centerline temperatures for IFA-629-1 rods 1 and 2. These figures show good agreement between the FRAPCON-3.3 predictions and the data. The slight offset during parts of the irradiation could be due to power or thermocouple calibration changes at the end of each cycle.
0
200
400
600
800
1000
1200
1400
1600
0 20 40 60 80 100 120
Time, days
Cen
terli
ne T
empe
ratu
re, °
C
Data FRAPCON-3.3
Figure 2.40 Measured and predicted centerline temperature for IFA-629-1 rod 1 (starting burnup=27 GWd/MTU, ending burnup=33 GWd/MTU, as-fabricated radial gap=84μm)
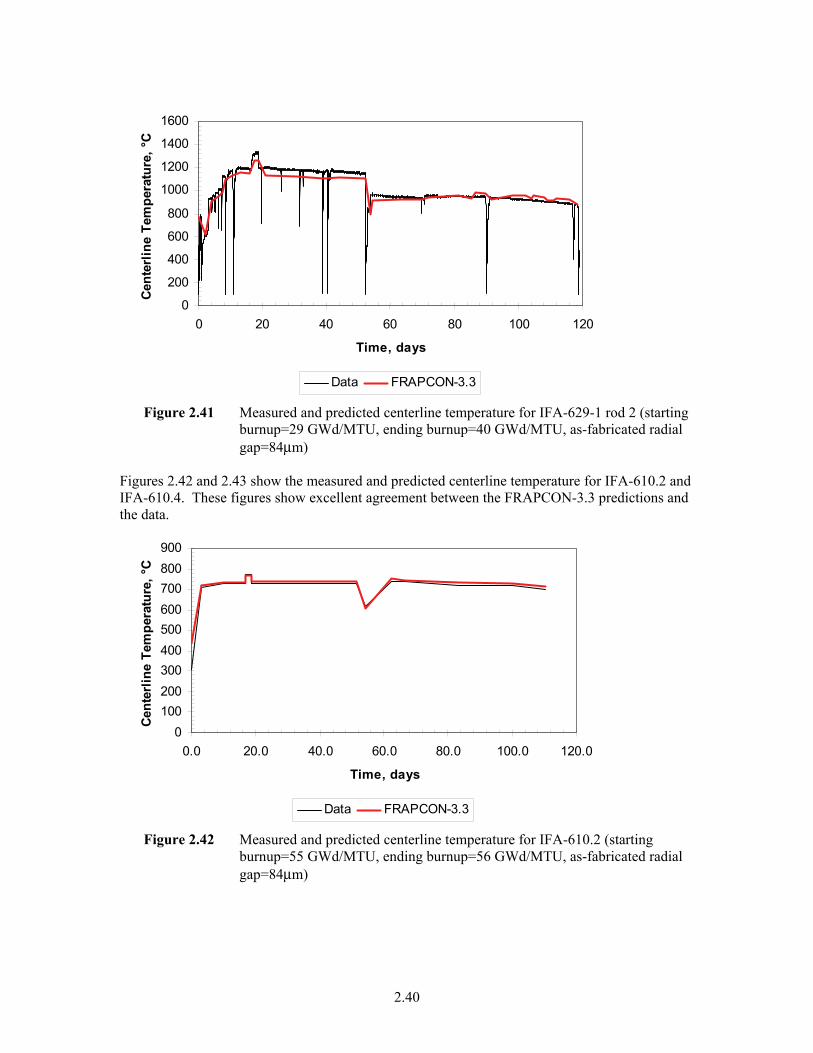
2.40
0
200
400
600
800
1000
1200
1400
1600
0 20 40 60 80 100 120
Time, days
Cent
erlin
e Te
mpe
ratu
re, °
C
Data FRAPCON-3.3
Figure 2.41 Measured and predicted centerline temperature for IFA-629-1 rod 2 (starting burnup=29 GWd/MTU, ending burnup=40 GWd/MTU, as-fabricated radial gap=84μm)
Figures 2.42 and 2.43 show the measured and predicted centerline temperature for IFA-610.2 and IFA-610.4. These figures show excellent agreement between the FRAPCON-3.3 predictions and the data.
0100200300400500600700800900
0.0 20.0 40.0 60.0 80.0 100.0 120.0
Time, days
Cent
erlin
e Te
mpe
ratu
re, °
C
Data FRAPCON-3.3
Figure 2.42 Measured and predicted centerline temperature for IFA-610.2 (starting burnup=55 GWd/MTU, ending burnup=56 GWd/MTU, as-fabricated radial gap=84μm)

2.41
0100200300400500600700800900
0 10 20 30 40 50 60
Time, days
Cent
erlin
e Te
mpe
ratu
re, °
C
Data FRAPCON-3.3
Figure 2.43 Measured and predicted centerline temperature for IFA-610.4 (starting burnup=56, ending burnup=57 GWd/MTU, as-fabricated radial gap=84μm)
Figures 2.44 and 2.45 show the measured and predicted centerline temperature for IFA-648.1 rods 1 and 2. These figures show excellent agreement between the FRAPCON-3.3 predictions and the data.
0
100
200
300
400
500
600
700
0 50 100 150 200 250 300 350
Time, days
Cent
erlin
e Te
mpe
ratu
re, °
C
Data FRAPCON-3.3
Figure 2.44 Measured and predicted centerline temperature for IFA-648.1 rod 1 (starting burnup=55 GWd/MTU, ending burnup=62 GWd/MTU, as-fabricated radial gap=84μm)

2.42
0
100
200
300
400
500
600
700
0 50 100 150 200 250 300 350
Time, days
Cent
erlin
e Te
mpe
ratu
re, °
C
Data FRAPCON-3.3
Figure 2.45 Measured and predicted centerline temperature for IFA-648.1 rod 2 (starting burnup=55 GWd/MTU, ending burnup=62 GWd/MTU, as-fabricated radial gap=84μm)
Figures 2.46 and 2.47 show the measured and predicted centerline temperature for IFA-629.3 rods 5 and 6. These figures show excellent agreement between the FRAPCON-3.3 predictions and the data.
0100200300400500600700800900
1000
0 20 40 60 80 100 120
Time, days
Cent
erlin
e Te
mpe
ratu
re, °
C
Data FRAPCON-3.3
Figure 2.46 Measured and predicted centerline temperature for IFA-629.3 rod 5 (starting burnup=62 GWd/MTU, ending burnup=72 GWd/MTU, as-fabricated radial gap=84μm)

2.43
0100200300400500600700800900
1000
0 20 40 60 80 100 120
Time, days
Cent
erlin
e Te
mpe
ratu
re, °
C
Data FRAPCON-3.3
Figure 2.47 Measured and predicted centerline temperature for IFA-629.3 rod 6 (starting burnup=62 GWd/MTU, ending burnup=68 GWd/MTU, as-fabricated radial gap=84μm)
Figure 2.48 shows the measured and predicted centerline temperature for IFA-606 Phase 2. This figure shows reasonable agreement between the FRAPCON-3.3 predictions and the data (within ±75K).
0
200
400
600
800
1000
1200
1400
49.5 49.7 49.9 50.1 50.3 50.5
Time, days
Cent
erlin
e Te
mpe
ratu
re, °
C
Data FRAPCON-3.3
Figure 2.48 Measured and predicted centerline temperature for IFA-606 Phase 2 (starting burnup=50 GWd/MTU, as-fabricated radial gap=94μm)
2.2 Fission Gas Release Model and Assessment The following section describes the fission gas release model in FRAPCON-3.3 and provides an assessment of the prediction. It is important to be able to predict fission gas release; especially at

2.44
high release levels as fission gas increases the rod internal pressure and degrades the gap thermal conductivity, increasing the fuel temperature.
2.2.1 Modeling The fission gas release (FGR) model in FRAPCON-3.3 is a two-stage diffusion model. Gas is produced inside spherical grains at a rate proportional to power generation. Gas is allowed to diffuse from these grains to the grain boundaries that are considered to be an infinite sink for gas atoms. The diffusion of gas from the grains is controlled by a diffusion coefficient that is a function of temperature and burnup. When the gas atoms arrive at the grain boundaries a fraction of these atoms are considered to be re-solved back into the grain. However, since the resolution depth is very small, these atoms are not added back into the atoms still in the grain, but are stored separately as resolved gas. The remaining gas accumulates on the grain boundary until the grain boundary saturation is exceeded. This saturation value is a function of temperature, external pressure, and grain size. When the saturation value is exceeded, both the gas on the grain boundary and the resolved gas are released to the rod void volume. The concentration of gas on the grain boundaries must then exceed the saturation value for further release to occur. In addition to this thermally driven gas release, an athermal contribution is also determined that models the release of an additional 1% gas for every 10 GWd/MTU of rod average burnup above 40 GWd/MTU. In order to accurately model MOX fuel, the diffusion coefficient is increased by an empirical constant factor to account for the observation of greater gas release from MOX than UO2. Many of the parameters in this model are difficult to measure in-reactor. In order to develop this model, values are selected such that the model gives a best-estimate prediction of gas release for a wide variety of rod types and conditions. In this model, the following parameters were selected to best predict measured FGR data from rods in the assessment database. • Pre-exponential diffusion coefficient • Activation energy for diffusion coefficient • Burnup dependence of the diffusion coefficient • Coefficient that defined the fraction of gas arriving on the grain boundaries that is
resolved There is no FGR model in FRAPTRAN-1.3 because it was thought that the time periods over which events are modeled in FRAPTRAN are too short for gas to diffuse and release to occur. However, in experimental programs performed in the Cabri reactor (Papin et al., 2003) large amounts of fission gas have been released during RIA events (5-33%). This is believed to be due to grain boundary cracking and separation during the fast transient. Because of this, it is important that a transient FGR model be developed for FRAPTRAN-1.3 and that the steady-state FGR in FRAPCON-3.3 be assessed and modified if necessary to initialize FRAPTRAN. The following section will show the fit of the FGR model in FRAPCON-3.3 to the data from rods in the assessment database.

2.45
2.2.2 Assessment The assessment of the UO2 model for fission gas release is documented in Lanning et al. (2005a). Figures 2.49 and 2.50 show the predicted fission gas release as a function of measured fission gas release for the steady-state rods and power ramped rods, respectively. Figures 2.51 and 2.52 show the predicted minus measured fission gas release as a function of burnup for the steady-state rods and power ramped rods, respectively. The standard deviation for the steady state predictions is 2.8 % FGR. The standard deviation for the power ramped cases is 5.3% FGR. These figures demonstrate that FRAPCON-3.3 provides a best-estimate calculation of fission gas over a wide range of burnup and gas release levels. It has been observed that FRAPCON-3.3 seems to slightly underpredict power ramped rods with short hold times (<4 hours). In Figure 2.52 the rods with short hold times are noted. Although two of these rods are within the standard error of the predictions, the fact that all three rods with short hold time are underpredicted, leads to the conclusion that FRAPCON-3.3 may underpredict power ramped rods with short (<4 hours) hold times. In future versions of FRAPCON-3, this underprediction will be addressed. Until this time, PNNL has recommended that the hold time for power ramps less than 4 hours be increased by a factor of 3 to conservatively bound the expected fission gas release (Beyer, 2007).
0
10
20
30
40
50
60
0 10 20 30 40 50 60
Measured FGR, %
Pred
icte
d FG
R, %
FRAPCON-3.3 Predicted = Measured
Figure 2.49 Measured vs. predicted FGR for steady-state UO2 rods

2.46
0
5
10
15
20
25
30
35
40
45
50
0 10 20 30 40 50
Measured FGR, %
Pred
icte
d FG
R, %
FRAPCON-3.3 Predicted = Measured
Figure 2.50 Measured vs. predicted FGR for power ramped UO2 rods
-6
-4
-2
0
2
4
6
8
0 10 20 30 40 50 60 70 80 90 100
Burnup, GWd/MTU
Pred
icte
d-M
easu
red
FGR
, %
Figure 2.51 Predicted minus measured FGR as a function of burnup for steady-state UO2
rods

2.47
-10
-5
0
5
10
0 20 40 60 80
Burnup, GWd/MTU
Pred
icte
d-M
easu
red
FGR
, %
4hr hold
1.5hr hold
Figure 2.52 Predicted minus measured FGR as a function of burnup for power ramped
UO2 rods (Rods with hold time less than 4 hours marked) A limited assessment of the MOX fission gas release model was performed by Lanning et al. (2005a). Since then, more MOX rods were added to the database and a more comprehensive assessment was performed and is documented in Lanning et al. (2005b) and Geelhood and Beyer (2008). Figure 2.53 shows the predicted fission gas release as a function of measured fission gas release for the steady-state and power ramped rods. Figure 2.54 shows the predicted minus measured fission gas release as a function of burnup. It can be seen that there is a large degree of scatter in the predictions. However, for the rods with the large overprediction, (ATR phase I and II and M504) there are no measured temperatures available to verify that this overprediction is due solely to a deviation in the FGR model. In addition, these rods were irradiated in test reactors with small cores and consequently there could be considerable uncertainty in the reported power levels. However, for the cases with measured temperature below 62 GWd/MTU (IFA-651.1, IFA-629.1, IFA-606 phase 2, IFA-597.4,.5,.6,.7 and IFA-633.1 Rod 6) FRAPCON-3.3 provides a much better prediction of fission gas over a wide range of gas release levels up to a burnup of 58 GWd/MTU with a standard error of 4.2% FGR. For example, those rods that demonstrated a small underpredicition in fuel temperature also resulted in a small underprediction in FGR and for those rods with a small overprediction in FGR were similarly overpredicted. Figure 2.54 indicates that the model may underpredict FGR from MOX at high burnups (>60 GWd/MTU) based on the two rods from IFA-629.3 where fuel temperatures were predicted well (Rod 5 in Figure 2.46) or overpredicted (Rod 6 in Figure 2.47) and FGR was underpredicted. It is recommended that more high burnup FGR data be obtained as it becomes available and attempt to verify or refute behavior with MOX.

2.48
0
5
10
15
20
25
30
35
40
0 5 10 15 20 25 30 35 40
Measured FGR, %
Pre
dict
ed F
GR,
%
Gravelines MOX IFA 629.1 IFA 606 phase 2 IFA 633.1 rod 6IFA-651.1 M504 Rods M501 Rods M308 RodIFA-629.3 IFA-597.4,5,6,7 E09 Rods ATR Phase IIATR Phase III ATR Phase IV
Figure 2.53 Measured vs. predicted FGR for steady-state and power ramped MOX rods
-20
-15
-10
-5
0
5
10
15
20
25
0 10 20 30 40 50 60 70 80
Burnup, GWd/MTM
Pre
dict
ed m
inus
Mea
sure
d FG
R,
%
Gravelines MOX IFA 629.1 IFA 606 phase 2 IFA 633.1 rod 6IFA-651.1 M504 Rods M501 Rods M308 RodIFA-629.3 IFA-597.4,5,6,7 E09 Rods ATR Phase IIATR Phase III ATR Phase IV
Figure 2.54 Predicted minus measured FGR as a function of burnup for steady-state and
power ramped MOX rods
Rods with possible power uncertainty
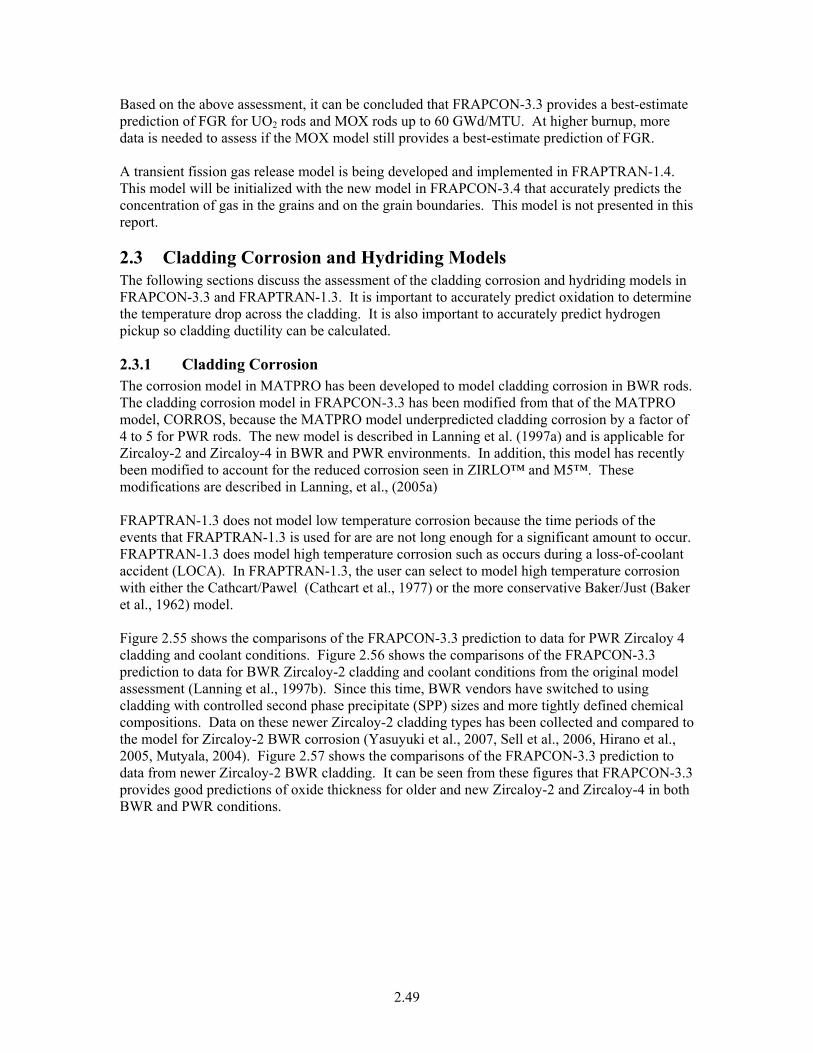
2.49
Based on the above assessment, it can be concluded that FRAPCON-3.3 provides a best-estimate prediction of FGR for UO2 rods and MOX rods up to 60 GWd/MTU. At higher burnup, more data is needed to assess if the MOX model still provides a best-estimate prediction of FGR. A transient fission gas release model is being developed and implemented in FRAPTRAN-1.4. This model will be initialized with the new model in FRAPCON-3.4 that accurately predicts the concentration of gas in the grains and on the grain boundaries. This model is not presented in this report.
2.3 Cladding Corrosion and Hydriding Models The following sections discuss the assessment of the cladding corrosion and hydriding models in FRAPCON-3.3 and FRAPTRAN-1.3. It is important to accurately predict oxidation to determine the temperature drop across the cladding. It is also important to accurately predict hydrogen pickup so cladding ductility can be calculated.
2.3.1 Cladding Corrosion The corrosion model in MATPRO has been developed to model cladding corrosion in BWR rods. The cladding corrosion model in FRAPCON-3.3 has been modified from that of the MATPRO model, CORROS, because the MATPRO model underpredicted cladding corrosion by a factor of 4 to 5 for PWR rods. The new model is described in Lanning et al. (1997a) and is applicable for Zircaloy-2 and Zircaloy-4 in BWR and PWR environments. In addition, this model has recently been modified to account for the reduced corrosion seen in ZIRLO™ and M5™. These modifications are described in Lanning, et al., (2005a) FRAPTRAN-1.3 does not model low temperature corrosion because the time periods of the events that FRAPTRAN-1.3 is used for are are not long enough for a significant amount to occur. FRAPTRAN-1.3 does model high temperature corrosion such as occurs during a loss-of-coolant accident (LOCA). In FRAPTRAN-1.3, the user can select to model high temperature corrosion with either the Cathcart/Pawel (Cathcart et al., 1977) or the more conservative Baker/Just (Baker et al., 1962) model. Figure 2.55 shows the comparisons of the FRAPCON-3.3 prediction to data for PWR Zircaloy 4 cladding and coolant conditions. Figure 2.56 shows the comparisons of the FRAPCON-3.3 prediction to data for BWR Zircaloy-2 cladding and coolant conditions from the original model assessment (Lanning et al., 1997b). Since this time, BWR vendors have switched to using cladding with controlled second phase precipitate (SPP) sizes and more tightly defined chemical compositions. Data on these newer Zircaloy-2 cladding types has been collected and compared to the model for Zircaloy-2 BWR corrosion (Yasuyuki et al., 2007, Sell et al., 2006, Hirano et al., 2005, Mutyala, 2004). Figure 2.57 shows the comparisons of the FRAPCON-3.3 prediction to data from newer Zircaloy-2 BWR cladding. It can be seen from these figures that FRAPCON-3.3 provides good predictions of oxide thickness for older and new Zircaloy-2 and Zircaloy-4 in both BWR and PWR conditions.

2.50
0
20
40
60
80
100
120
0 20 40 60 80 100 120
Measured Oxide Thickness, microns
Pred
icte
d O
xide
Thi
ckne
ss
PWR Data Measured=Predicted
Figure 2.55 PWR Zircaloy-4 corrosion data and FRAPCON-3.3 PWR corrosion model (Smith et al., 1994, Pyecha, 1985, Newman, 1986, Balfour, 1982b, Dideon, 1983, Garde, 1986).
0
5
10
15
20
25
30
35
40
0 10 20 30 40 50 60 70
Rod Average Burnup, GWd/MTU
Oxi
de T
hick
ness
, mic
rons
BWR Data FRAPCON-3.3
Figure 2.56 BWR Zircaloy-2 corrosion data and FRAPCON-3.3 BWR corrosion model (West et al., 1983, Barner et al., 1990)
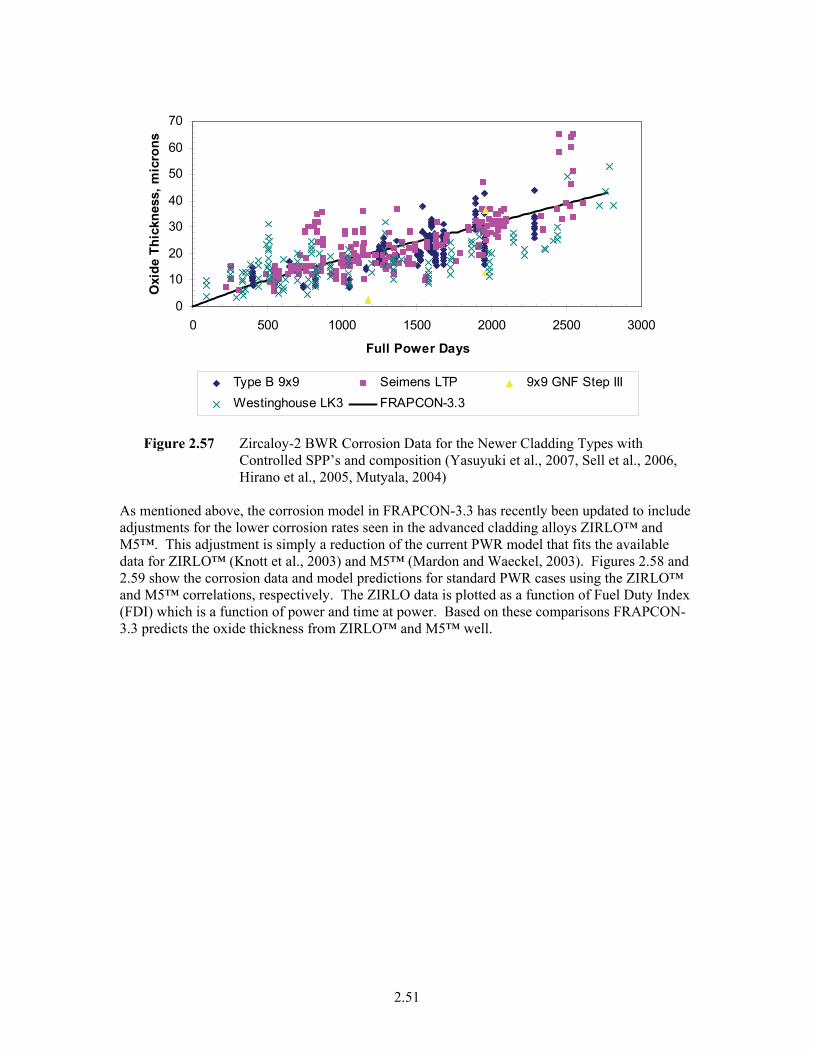
2.51
0
10
20
30
40
50
60
70
0 500 1000 1500 2000 2500 3000
Full Power Days
Oxi
de T
hick
ness
, mic
rons
Type B 9x9 Seimens LTP 9x9 GNF Step IIIWestinghouse LK3 FRAPCON-3.3
Figure 2.57 Zircaloy-2 BWR Corrosion Data for the Newer Cladding Types with
Controlled SPP’s and composition (Yasuyuki et al., 2007, Sell et al., 2006, Hirano et al., 2005, Mutyala, 2004)
As mentioned above, the corrosion model in FRAPCON-3.3 has recently been updated to include adjustments for the lower corrosion rates seen in the advanced cladding alloys ZIRLO™ and M5™. This adjustment is simply a reduction of the current PWR model that fits the available data for ZIRLO™ (Knott et al., 2003) and M5™ (Mardon and Waeckel, 2003). Figures 2.58 and 2.59 show the corrosion data and model predictions for standard PWR cases using the ZIRLO™ and M5™ correlations, respectively. The ZIRLO data is plotted as a function of Fuel Duty Index (FDI) which is a function of power and time at power. Based on these comparisons FRAPCON-3.3 predicts the oxide thickness from ZIRLO™ and M5™ well.

2.52
0
20
40
60
80
100
120
0 200 400 600 800 1000
FDI
Oxi
de T
hick
ness
, mic
rons
ZIRLO Data FRAPCON-3.3
Figure 2.58 ZIRLO™ data and FRAPCON-3.3 predictions as a function of fuel duty index (FDI) (Knott et al., 2003)
0
5
10
15
20
25
30
35
40
0 20 40 60 80
Burnup, GWd/tU
Oxi
de T
hick
ness
, mic
rons
FRAPCON-3.3 M5 Data
Figure 2.59 M5™ data and FRAPCON-3.3 predictions as a function of burnup (Mardon and Waeckel, 2003)
However, recent data from high burnup Spanish and French rods clad in ZIRLO™ (CSN, ENUSA, 2002) and M5™ (Segura et al., 2002) indicate that the corrosion adjustments that have been recently made for these alloys underpredict the oxide thickness for ZIRLO™ at high burnup and overpredict the oxide thickness for M5™. Figures 2.60 and 2.61 show the end of life oxide profile for two Spanish rods clad in ZIRLO™ irradiated to a rod average burnup of 68 GWd/MTU. Figure 2.62 shows the end of life oxide profile for a French rod clad in M5™ irradiated to 70 GWd/MTU. Also shown on these figures for reference is the FRAPCON-3.3 correlation for Zircaloy-4. These figures support the conclusions given above and emphasize the need to develop new correlations specifically for ZIRLO™ and M5™, rather than just adding a multiplicative factor to the current correlation for Zircaloy. A new correlation will be developed

2.53
for M5™ and ZIRLO™ in FRAPCON-3.4 that will provide better predictions of the high burnup corrosion data. These new correlations are discussed in Section 3.1.
0
20
40
60
80
100
120
140
160
0 500 1000 1500 2000 2500 3000 3500 4000
Axial Elevation, mm
Oxi
de T
hick
ness
, mic
rons
Data Lower Bound Data Median Data Upper BoundZIRLO Correlation Zircaloy-4 Correlation
Figure 2.60 End of life oxide thickness and FRAPCON-3 predictions for Vandellos II rod
A06, clad in ZIRLO™ and irradiated to 68 GWd/MTU (CSN, ENUSA, 2002).
0
20
40
60
80
100
120
140
160
0 500 1000 1500 2000 2500 3000 3500 4000
Axial Elevation, mm
Oxi
de T
hick
ness
, mic
rons
Data Lower Bound Data Median Data Upper BoundZIRLO Correlation Zircaloy-4 Correlation
Figure 2.61 End of life oxide thickness and FRAPCON-3 predictions for Vandellos II rod
A12, clad in ZIRLO™ and irradiated to 68 GWd/MTU(CSN, ENUSA, 2002).

2.54
0
20
40
60
80
100
120
140
160
0 500 1000 1500 2000 2500 3000 3500 4000
Axial Elevation, mm
Oxi
de T
hick
ness
, mic
rons
Data Lower Bound Data Median Data Upper BoundM5 Correlation Zircaloy-4 Correlation
Figure 2.62 End of life oxide thickness and FRAPCON-3 predictions for Gravelines 5
rod N05, clad in M5™ and irradiated to 70 GWd/MTU (Segura et al., 2002). Cunningham et al, (2001b) has assessed the Cathcart-Pawel and Baker-Just models in FRAPTRAN-1.3. The conclusion of this assessment is that the Cathcart-Pawel model is more accurate below 1800K, and the Baker-Just model is more accurate above 1800K. Experimental work is currently ongoing to determine the high temperature oxidation behavior for zirconium alloys as a function of burnup. It has been determined that fabrication and heat treatment as well as level of hydrides can drastically affect the high temperature oxidation performance. For example, it has been determined that M5 shows good oxidation performance, while E-110, which is nominally the same composition, shows very poor oxidation performance at high temperature in steam. As more data become available, the high temperature oxidation models in FRAPTRAN-1.3 can be re-evaluated to determine if they provide a best-estimate calculation for high temperature corrosion. However, using the models currently in FRAPTRAN-1.3 with the above recommendations should provide close to a best-estimate prediction of high temperature oxidation behavior.
2.3.2 Hydrogen Pickup FRAPCON-3.3 uses a hydrogen pickup fraction of 29% for BWR corrosion and 15% for PWR corrosion. These pickup fractions are valid for Zircaloy-2 and Zircaloy-4. The code has recently been changed to model the improved hydrogen pickup performance of ZIRLO™ and M5™. The hydrogen pickup fraction for ZIRLO™ in a PWR is 12.5% while the hydrogen pickup fraction for M5™ in a PWR is 7.5%. No correlations for ZIRLO™ or M5™ in a BWR were developed since all the vendors currently use Zircaloy-2 cladding in BWRs. FRAPTRAN does not model hydrogen pickup from low temperature corrosion, since it does not model low temperature corrosion. There has not been any data that indicated what the hydrogen

2.55
pickup would be during high temperature oxidation. Because of this, there is no hydrogen pickup model in FRAPTRAN. Figure 2.63 shows the measured and predicted hydrogen data for PWR Zircaloy-4 rods. It can be seen from this figure that the model predicts the data well. Figure 2.64 shows the measured and predicted hydrogen pickup fraction for BWR Zircaloy-2 rods. Because there was such a limited number of BWR hydrogen pickup data, a literature search was performed to find more hydrogen pickup data for Zircaloy-2 in BWR conditions. A more recent data comparison of older Zircaloy-2 without controlled SPP sizes and controlled compositions (Hayashi et al., 2003) and of newer Zircaloy-2 with controlled SPP sizes and compositions (Hayashi et al., 2003, Sell et al., 2006, Hirano et al., 2005, Ledberger et al., 2005) found that a constant hydrogen pickup fraction is not appropriate for hydrogen pickup in Zircaloy-2. Figure 2.65 shows the new data plotted as a function of local axial burnup along with the 29% hydrogen pickup fraction used in FRAPCON-3.3. In addition, it was found that the hydrogen pickup in new Zircaloy-2 where the vendors have better control over the alloy composition and second-phase precipitate (SPP) size is different from older Zircaloy. New correlations have been developed and will be included in FRAPCON-3.4 that provide a better prediction of the hydrogen pickup in older and new Zircaloy-2 as a function of burnup. These correlations are described in Section 3.1. Figure 2.66 shows the measured and predicted hydrogen data for PWR ZIRLO™ rods (Tsukuda et al., 2003, Kitaguawa et al., 2005). It can be seen from this figure that the model predicts the data well. Figure 2.67 shows the measured and predicted hydrogen pickup fraction for PWR M5™. Also shown on this figure are hydrogen concentration values predicted by FRAPCON-3.3 for standard PWR rods. It can be seen from this figure that although there is significant scatter in the hydrogen content when plotted as a function of burnup, the model predicts the data well. This scatter is due to overprediction of oxide thickness and will be less for the new model described in Section 3.1
0100200300400500600700800
0 100 200 300 400 500 600 700 800
Measured Hydrogen, ppm
Pred
icte
d H
ydro
gen,
ppm
Figure 2.63 Measured and predicted hydrogen pickup for PWR rods with Zircaloy-4
cladding (Smith et al., 1994, Pyecha, 1985, Newman, 1986, Balfour, 1982b, Dideon, 1983, Garde, 1986)

2.56
05
101520253035
0 10 20 30 40 50
Rod-Average Burnup, GWd/MTU
Hyd
roge
n P
icku
p Fr
actio
n, %
Data FRAPCON-3.3
Figure 2.64 Measured and predicted hydrogen pickup for BWR rods with Zircaloy-2 cladding (Itagaki, 2003.)
0
50
100
150
200
250
300
350
400
450
500
0 10 20 30 40 50 60 70 80
Local Axial Burnup [MWd/kgU]
Hydr
ogen
Con
tent
[ppm
]
Old Zircaloy-2 New Zircaloy-2 FRAPCON-3.3
Figure 2.65 Measured and predicted hydrogen pickup from recent literature search for
BWR rods with Zircaloy-2 cladding (Hayashi et al., 2003, Sell et al., 2006, Hirano et al., 2005, Ledberger et al., 2005)

2.57
0
100
200
300
400
500
0 10 20 30 40 50 60 70
Oxide Thickness, microns
Hyd
roge
n P
icku
p, p
pm.
Tsukuda ZIRLO Data Kitaguawa ZIRLO Data 12.5% Pickup
Figure 2.66 Measured and predicted hydrogen pickup for PWR rods with ZIRLO™ (Tsukuda et al., 2003, Kitaguawa et al., 2005)
0
20
40
60
80
100
120
140
160
0 10 20 30 40 50 60 70 80
Burnup, GWd/MTU
Hyd
roge
n, p
pm
FRAPCON-3.3 M5 Data
Figure 2.67 Measured and predicted hydrogen pickup for PWR rods with M5™ (Mardon and Waeckel, 2003)
2.4 Fuel Densification and Swelling The following sections describe the fuel swelling and densification models in FRAPCON-3.3 and provides data comparisons for these models.

2.58
FRAPTRAN-1.3 does not contain a fuel densification or swelling model. This is acceptable because fuel densification and swelling are burnup-related phenomena and no significant burnup accumulates over the time periods of the events that are modeled in FRAPTRAN-1.3.
2.4.1 Fuel Swelling The fuel swelling model in FRAPCON-3.3 has been modified from the model documented in MATPRO (Hagrman et al. 1981). This model is accurately described in Lanning et al (1997a). The swelling model in FRAPCON-3.3 is a function of pellet-average burnup only. The swelling model is based on dimensional data obtained on UO2 pellets and pellet stacks irradiated within cladding (i.e., constrained) in PWRs. Data obtained from ex-reactor, thermally-heated, unconstrained pellet swelling experiments were not included. Lanning et al. (1997a) provided data source references and plots of data compared to the modified FSWELL model. The PWR data of Dideon and Bain (1983), Garde (1986), Newman (1986), and Smith et al. (1994) were used to develop the swelling model in FRAPCON-3.3. A search was performed for recent fuel swelling data. Two references were found that included data for constrained UO2 pellets irradiated in light water reactors (Zacharie et al., 1998, Lafchiev and Tverberg, 2005). Figure 2.68 provides a comparison of the swelling model in FRAPCON-3.3, compared to the data on which it is based, up to the 70 GWd/MTU burnup limit specified by Lanning et al. (1997a). It can be seen from this figure that while there is considerable scatter in the swelling data, the FRAPCON-3.3 model seems to provide a best-estimate prediction of fuel swelling. A fuel swelling rate has been deduced from a number of Halden fuel assemblies (Lafchiev and Tverberg, 2005). These rates are shown in Figure 2.69 along with the FRAPCON-3.3 swelling rate of 0.77% ΔV/V per 10 GWd/MTU. This figure shows that the swelling rate used on FRAPCON-3.3 is within the scatter of the swelling rates that have been observed at Halden, but slightly higher than the average rate from these data.
0
1
2
3
4
5
6
7
8
9
0 20 40 60 80 100 120
Pellet Average Burnup, GWd/MTU
ΔV/
V, %
FRAPCON-3.3 Model Data for Model Development Recent Data
Figure 2.68 FRAPCON-3.3 swelling model prediction and data as a function of burnup

2.59
0
0.2
0.4
0.6
0.8
1
1.2
1.4
IFA-655Rods 1
&3
IFA-655Rods 2
&4
IFA-633 IFA-610 IFA-629.3
IFA-629.4
IFA-534.14
IFA-597.3
Swel
ling
Rate
, %Δ
V/V
per
10
GW
d/M
TMFRAPCON-3.3 Swelling Rate, 0.77% ΔV/V per 10 GWd/MTU
99 G
Wd/
MTU
99 G
Wd/
MTU
17 G
Wd/
MTU
62 G
Wd/
MTU
68 G
Wd/
MTU
65 G
Wd/
MTU
62 G
Wd/
MTU
70 G
Wd/
MTU
Figure 2.69 FRAPCON-3.3 swelling rate and observed swelling rates from Halden
instrumented fuel assemblies (EOL burnups shown for each point)
2.4.2 Fuel Densification FRAPCON-3.3 uses the MATPRO model, FUDENS, to calculate fuel densification as a function of burnup and maximum densification. The code contains several methods for calculating maximum densification. The first and most commonly used method is to use the user-input value for maximum densification and simply convert this to a linear strain. The maximum densification can be estimated using a standard densification test (1700°C for 24 hours). This is the method recommended in US NRC Regulatory Guide 1.126 (1978) and has been shown to correlate well with observed maximum in-reactor densification. If the maximum densification is not input, FRAPCON-3.3 uses the equations given in the MATPRO subroutine FUDENS that are a function of fuel temperature, fuel density, and fuel sintering temperature. The FUDENS model in FRAPCON-3.3 has been fit to provide the best fit to the data of Freshley et al. (1976). A search was performed for recent fuel densification data. Three new sources of data (Banks, 1974, Freshley et al., 1978, and Small, 1987) were obtained. Figure 2.70 compares the predicted densification values to the experimental values from the data used to tune the model and from more recent data. In general, the model predicts the correct densification trends. However, there is a considerable amount of scatter in the densification data. In addition, FRAPCON-3.3 is not typically used to calculate the densification, but rather the maximum densification is often provided as an input variable to the code.

2.60
-1.00
0.00
1.00
2.00
3.00
4.00
5.00
6.00
7.00
8.00
-1.00 0.00 1.00 2.00 3.00 4.00 5.00 6.00 7.00 8.00
Measured Densification (% TD)
Pred
icte
d D
ensi
ficat
ion
(% T
D)
Data used to tune model Recent Data
Figure 2.70 Comparison of FUDENS fuel densification predictions to the experimental data from which the fit coefficients were determined and to more recent published data.
Based on this comparison and the fact that maximum densification is typically provided as a code input as recommended by NRC (US NRC Regulatory Guide 1.126, 1978), it can be concluded that FRAPCON-3.3 provides a reasonable estimate of fuel densification.
2.5 Assessment of Mechanical Modeling and Properties This section will discuss the modeling approach that is used in FRAPCON-3.3 and FRAPTRAN 1.3 to model the mechanical responses of the fuel and the cladding. In addition, each model for the mechanical properties of the fuel and cladding will be described and compared to applicable data.
2.5.1 Modeling Both FRAPCON-3.3 and FRAPTRAN-1.3 use the FRACAS-I finite difference model to calculate the stress and strain in the cladding due to fill gas pressure and pellet-cladding mechanical interaction. In this model, the stress induced deformation in the fuel is neglected and a rigid pellet assumption is used. The code must account for two different loading conditions. The first occurs when the pellet-cladding gap is open. During this time, the rod internal gas pressure and coolant pressure exert forces on the cladding causing a stress in the cladding. The resultant strain in the cladding due to this stress is calculated by the FRACAS-I model. The second loading condition occurs after the pellet cladding gap is closed due to a combination of fuel swelling, thermal expansion, and cladding creepdown. During this time, the rigid pellet strains the cladding, and the resultant stress in the cladding is calculated by the FRACAS-I model. The FRACAS-I model in

2.61
FRAPCON-3.3 and FRAPTRAN-1.3 are described in greater detail by Berna et al. (1997) and by Cunningham et al (2001a).
2.5.2 Mechanical Properties The mechanical properties of primary concern for modeling the stress and strain response of the cladding are irradiation creep, yield stress, and Young’s modulus. These properties are discussed in detail and compared to data in the following section.
2.5.2.1 Irradiation Creep The irradiation creep model in FRAPCON-3.3 is the same model that was in FRAPCON-2. This model is not discussed in the documentation for FRAPCON-3. The model has, however, been documented for FRAPCON-2. This model is summarized below.
( ) 1547.136003*2*12 2
⋅⋅=ε
ε AAA&
Where ε& = creep strain rate, in/in/hr
φ2910129.51 −×=A φ = fast neutron flux, n/m²/s
⎟⎠⎞
⎜⎝⎛
⋅−=
TA
987.110000exp2
T = temperature, K )10967.4exp(2.7253 8 σσ ⋅×+= −A
σ = hoop stress, Pa ε = creep strain from previous time step, in/in (if ε <0.0001, use ε =0.0001) This model is a function of time, stress, fast neutron flux, and temperature. The time and stress dependence is based on Ibrahin (1973). The flux dependence is based on Ross-Ross and Hunt (1968). The temperature dependence is based on a value of q = 10000 cal/mole near 573K from Fidleris (1974). Lanning et al. (1997b) compared the creep model to measurements from two PWR rod sets (Smith et al., 1994 and Newman, 1986). The results of these comparisons have changed due to the discovery of an error in the code with the calculation of fast neutron fluence. The results of these comparisons for end-of-life creepdown with FRAPCON-3.3 can be seen in Figures 2.71 and 2.72.

2.62
-1.2
-1
-0.8
-0.6
-0.4
-0.2
0
0 2E+25 4E+25 6E+25 8E+25 1E+26 1.2E+26
Rod Average Fluence, n/m²
Ave
rage
Hoo
p S
train
, %
FRAPCON-3.3 Data
Figure 2.71 Predicted and measured cladding creepdown from the 2nd and 3rd cycle rods in the ANO-2 PWR assembly, TSQ002.
-1.2
-1
-0.8
-0.6
-0.4
-0.2
0
0 2E+25 4E+25 6E+25 8E+25 1E+26
Rod Average Fluence, n/m²
Ave
rage
Hoo
p St
rain
, %
FRAPCON-3.3 Data
Figure 2.72 Predicted and measured cladding creepdown from the 3rd, 4th, and 5th cycle rods in the Oconee PWR assembly, 15309.
It can be seen from these comparisons that the current creep model may predict too high of a creep rate. Several organizations have stated that they believe the cladding creep model in FRAPCON-3.3 predicts creep to occur more rapidly than that normally exhibited. This causes FRAPCON-3.3 to predict gap closure before it might actually occur. A new cladding creep model has been developed to provide a best estimate model for cladding creepdown in FRAPCON-3.4. This model is described in Section 3.7.

2.63
There currently is no thermal creep model in FRAPCON-3.3 or FRAPTRAN 1.3. The impact of this lack of thermal creep is that stress relaxation due to thermal creep strain is not calculated. The new model described in Section 3.7 contains a thermal term. The impact of this inclusion will be discussed more in Section 3.7. It should be acknowledged that many fabrication parameters can affect the irradiation creep in Zircaloy cladding. Because of this, different cladding vendors should have an irradiation creep model that accurately predicts cladding irradiation creep in cladding manufactured by their supplier. FRAPTRAN-1.3 does not contain an irradiation creep model. This is acceptable because irradiation creep is a fast neutron fluence-related phenomena and no significant fluence accumulates over the time periods of the events that are modeled in FRAPTRAN-1.3.
2.5.2.2 Yield Strength The plastic stress/strain relationship in FRAPTRAN and FRAPCON-3 is given by a power law relationship. The yield stress is the point where the plastic curve, represented by a power law relationship, intersects with the elastic curve, represented by a linear relationship. The coefficients used in the power law are a function of temperature, fast neutron fluence, cladding cold work, strain rate, and cladding type. These coefficients have been modified from those provided in MATPRO to provide a best-estimate prediction of yield stress and ultimate tensile strength from axial tube tensile tests and burst tests taken on irradiated cladding. The model used in FRAPCON-3.3 and FRAPTRAN-1.3 assumes the cladding behaves isotropically and is described in the release document for FRAPTRAN-1.3 (Geelhood, 2005a). PNNL has compiled a large database of mechanical properties for irradiated and unirradiated Zircaloy-2 and Zircaloy-4 with fast neutron fluence levels up to 12x1025 n/m2. Figure 2.73 shows the predicted yield stress as a function of the measured yield stress for these data. It can be seen from this figure that the model provides a best-estimate prediction of the cladding yield stress for Zircaloy-2 and Zircaloy-4.

2.64
0
200
400
600
800
1000
1200
0 200 400 600 800 1000 1200
Measured Yield Stress, MPa
Pred
icte
d Y
ield
Str
ess,
MPa
Axial Tests Burst Tests Ring Tests
Figure 2.73 Predicted vs. measured yield stress from irradiated and unirradiated Zircaloy-2 and Zircaloy-4
In addition to these data, there has been data from the PROMETRA program that has been irradiated up to about 8x1025 n/m². These data, and the model predictions for three different strain rates are shown in Figure 2.74. It can be seen from this figure that the model accurately predicts the strain rate dependence as well as the yield stress at very high temperature.
0
200
400
600
800
1000
1200
200 500 800 1100 1400
Temperature, K
Yiel
d St
ress
, MPa
0.01 /s Hoop
0.01 /s Axial
0.01 /s Ax_Joule
0.2 /s Hoop
0.2 /s Axial
0.2 /s Ax_Joule
5 /s Hoop
5 /s Axial
5 /s Ax_Joule
FRAPTRAN 0.001 /s
FRAPTRAN 1 /s
FRAPTRAN 10 /s
Figure 2.74 Measured and predicted yield stress for high burnup cladding from the
PROMETRA database. Based on these comparisons, it can be seen that the cladding yield stress model in FRAPCON and FRAPTRAN provides a best-estimate prediction of yield stress over a wide range of temperature, fluence, cold work, and strain rate.
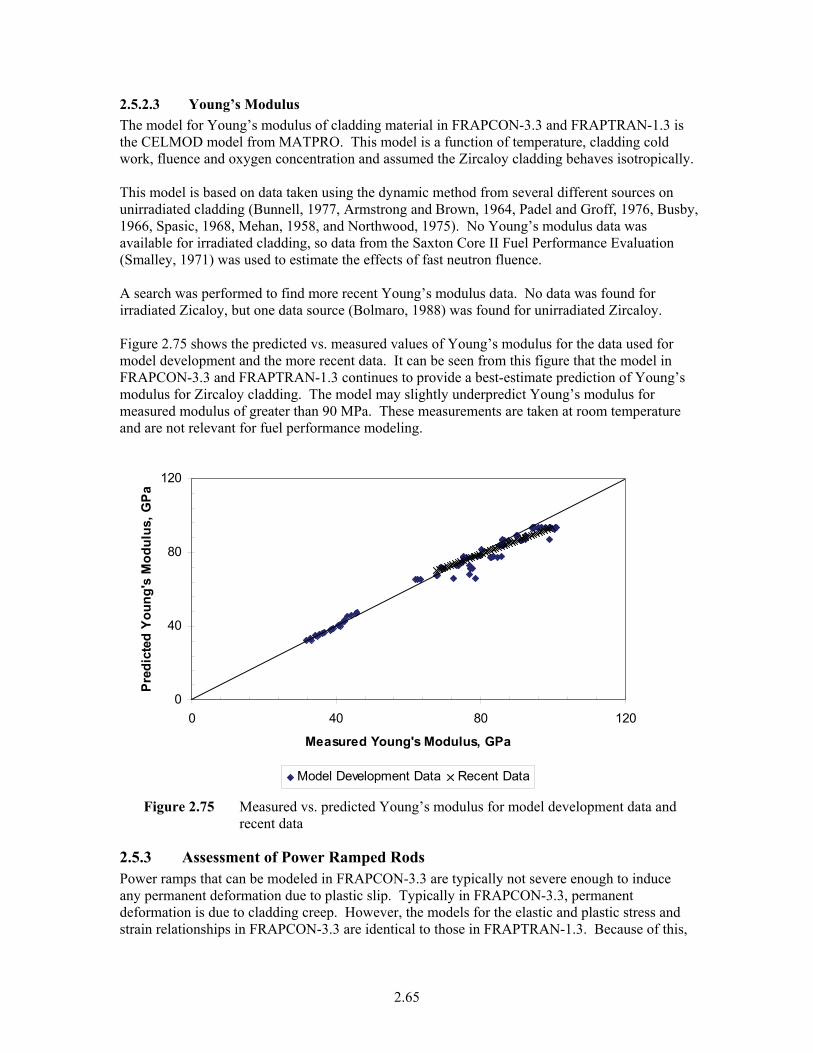
2.65
2.5.2.3 Young’s Modulus The model for Young’s modulus of cladding material in FRAPCON-3.3 and FRAPTRAN-1.3 is the CELMOD model from MATPRO. This model is a function of temperature, cladding cold work, fluence and oxygen concentration and assumed the Zircaloy cladding behaves isotropically. This model is based on data taken using the dynamic method from several different sources on unirradiated cladding (Bunnell, 1977, Armstrong and Brown, 1964, Padel and Groff, 1976, Busby, 1966, Spasic, 1968, Mehan, 1958, and Northwood, 1975). No Young’s modulus data was available for irradiated cladding, so data from the Saxton Core II Fuel Performance Evaluation (Smalley, 1971) was used to estimate the effects of fast neutron fluence. A search was performed to find more recent Young’s modulus data. No data was found for irradiated Zicaloy, but one data source (Bolmaro, 1988) was found for unirradiated Zircaloy. Figure 2.75 shows the predicted vs. measured values of Young’s modulus for the data used for model development and the more recent data. It can be seen from this figure that the model in FRAPCON-3.3 and FRAPTRAN-1.3 continues to provide a best-estimate prediction of Young’s modulus for Zircaloy cladding. The model may slightly underpredict Young’s modulus for measured modulus of greater than 90 MPa. These measurements are taken at room temperature and are not relevant for fuel performance modeling.
0
40
80
120
0 40 80 120
Measured Young's Modulus, GPa
Pred
icte
d Y
oung
's M
odul
us, G
Pa
Model Development Data Recent Data
Figure 2.75 Measured vs. predicted Young’s modulus for model development data and recent data
2.5.3 Assessment of Power Ramped Rods Power ramps that can be modeled in FRAPCON-3.3 are typically not severe enough to induce any permanent deformation due to plastic slip. Typically in FRAPCON-3.3, permanent deformation is due to cladding creep. However, the models for the elastic and plastic stress and strain relationships in FRAPCON-3.3 are identical to those in FRAPTRAN-1.3. Because of this,
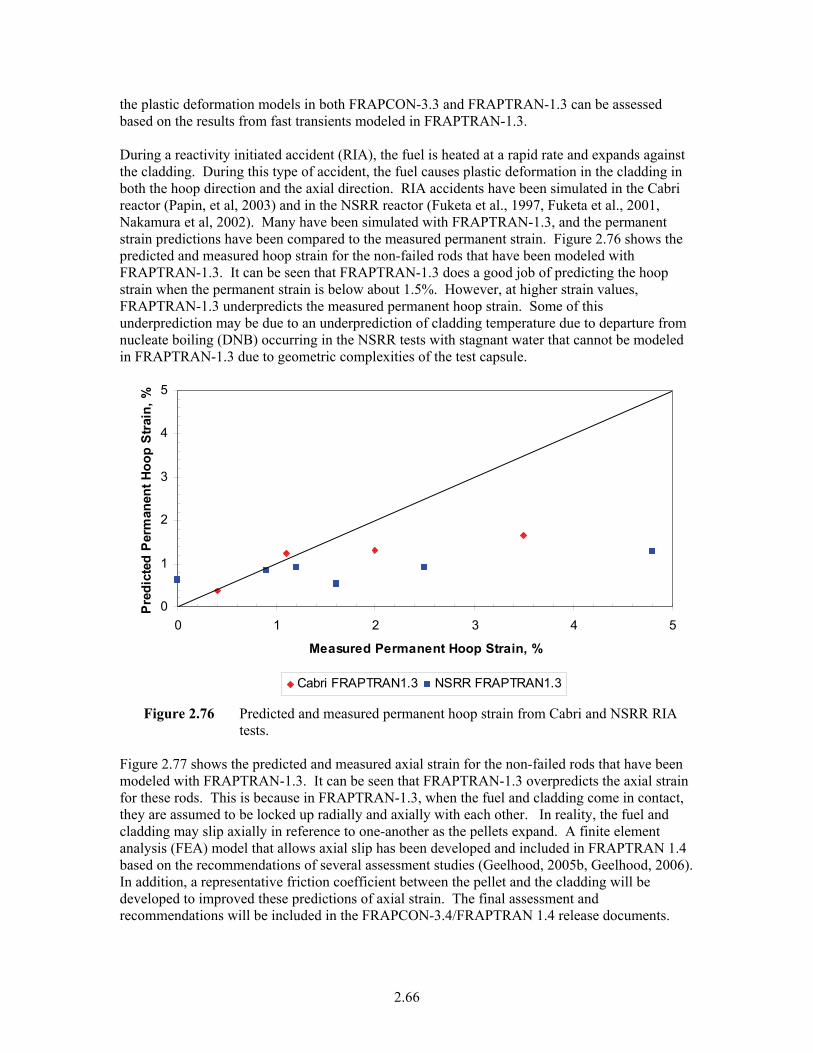
2.66
the plastic deformation models in both FRAPCON-3.3 and FRAPTRAN-1.3 can be assessed based on the results from fast transients modeled in FRAPTRAN-1.3. During a reactivity initiated accident (RIA), the fuel is heated at a rapid rate and expands against the cladding. During this type of accident, the fuel causes plastic deformation in the cladding in both the hoop direction and the axial direction. RIA accidents have been simulated in the Cabri reactor (Papin, et al, 2003) and in the NSRR reactor (Fuketa et al., 1997, Fuketa et al., 2001, Nakamura et al, 2002). Many have been simulated with FRAPTRAN-1.3, and the permanent strain predictions have been compared to the measured permanent strain. Figure 2.76 shows the predicted and measured hoop strain for the non-failed rods that have been modeled with FRAPTRAN-1.3. It can be seen that FRAPTRAN-1.3 does a good job of predicting the hoop strain when the permanent strain is below about 1.5%. However, at higher strain values, FRAPTRAN-1.3 underpredicts the measured permanent hoop strain. Some of this underprediction may be due to an underprediction of cladding temperature due to departure from nucleate boiling (DNB) occurring in the NSRR tests with stagnant water that cannot be modeled in FRAPTRAN-1.3 due to geometric complexities of the test capsule.
0
1
2
3
4
5
0 1 2 3 4 5
Measured Permanent Hoop Strain, %
Pred
icte
d P
erm
anen
t Hoo
p St
rain
, %
Cabri FRAPTRAN1.3 NSRR FRAPTRAN1.3
Figure 2.76 Predicted and measured permanent hoop strain from Cabri and NSRR RIA tests.
Figure 2.77 shows the predicted and measured axial strain for the non-failed rods that have been modeled with FRAPTRAN-1.3. It can be seen that FRAPTRAN-1.3 overpredicts the axial strain for these rods. This is because in FRAPTRAN-1.3, when the fuel and cladding come in contact, they are assumed to be locked up radially and axially with each other. In reality, the fuel and cladding may slip axially in reference to one-another as the pellets expand. A finite element analysis (FEA) model that allows axial slip has been developed and included in FRAPTRAN 1.4 based on the recommendations of several assessment studies (Geelhood, 2005b, Geelhood, 2006). In addition, a representative friction coefficient between the pellet and the cladding will be developed to improved these predictions of axial strain. The final assessment and recommendations will be included in the FRAPCON-3.4/FRAPTRAN 1.4 release documents.

2.67
0
1
2
3
4
0 1 2 3 4
Measured Permanent Axial Strain, %
Pred
icte
d P
erm
anen
t Axi
al S
trai
n,
%
Cabri FRAPTRAN1.3 NSRR FRAPTRAN1.3
Figure 2.77 Predicted and measured permanent axial strain from Cabri and NSRR RIA tests.
2.6 Void Volume Model and Assessment The rod void volume is primarily affected by the rod growth model and the fuel swelling model. This model and the plenum gas temperature model affect the gas pressure calculation. The rod growth model and plenum gas temperature models will be discussed in the sections below and compared to applicable data.
2.6.1 Rod Growth The cladding axial growth model in FRAPCON-3.3 has been updated from the CAGROW model documented in MATPRO. The updated model is documented in Lanning et al. (1997a). This model is a modified version of a model developed by Franklin (Franklin 1982). There is no axial growth model in FRAPTRAN-1.3 because cladding axial growth is a fluence (burnup) dependant phenomenon and there is no significant fluence accumulation over the time periods of the events that are modeled in FRAPTRAN-1.3. The model is reduced by a factor of 2 (half its size) for modeling BWR cladding, as the data shows a reduction of growth in BWR cladding. This is most likely due to the fact that most BWR cladding is recrystallized Zircaloy-2, while most PWR cladding is stress relieved Zircaloy-4. This model is valid for these two alloys. No comparison has been made for ZIRLO™ and M5™. To model these two newer alloys, PNNL recommends using the PWR model for ZIRLO™ (stress-relief annealed) and the BWR model for M5™ (recrystallized). The axial growth model in FRAPCON-3.3 is based on data obtained from post-irradiation examination (PIE) data resulting from experiments conducted by Combustion Engineering (CE) and Westinghouse (W) in five different PWRs (Franklin, 1982). The cladding material was cold-worked stress relieved Zircaloy-4. Lanning et al. (1997a) compared the FRAPCON-3.3 model to PWR cladding growth data from six different irradiation experiments (Newman, 1986, Balfour, 1982a, Dideon, 1983, Smith, 1986, Smally, 1974, and Smith, 1983) and BWR cladding growth data (West et al., 1983 and Barner, 1990) from two irradiation experiments.

2.68
A search was performed for cladding axial growth data published recently. One data source was found (Gilbon, 2000), and more data was found in a Franklin paper (Franklin, 1982). Figure 2.78 provides a comparison of the FRAPCON-3.3 model for PWR cladding to the data on which it is based and to the more recent PWR data. Figure 2.79 provides a comparison of the FRAPCON-3.3 model for BWR cladding to the data on which it is based and to the more recent BWR data.
0
0.2
0.4
0.6
0.8
1
1.2
0 2E+21 4E+21 6E+21 8E+21 1E+22 1.2E+22 1.4E+22
Fast Fluence (n/cm2, E > 1 MeV)
∆L/L
o (%
)
FRAPCON-3.3 Data for FRAPCON Assessment Recent Data
Figure 2.78 FRAPCON-3.3 model for axial growth in PWR cladding compared to data used for model development and recent data
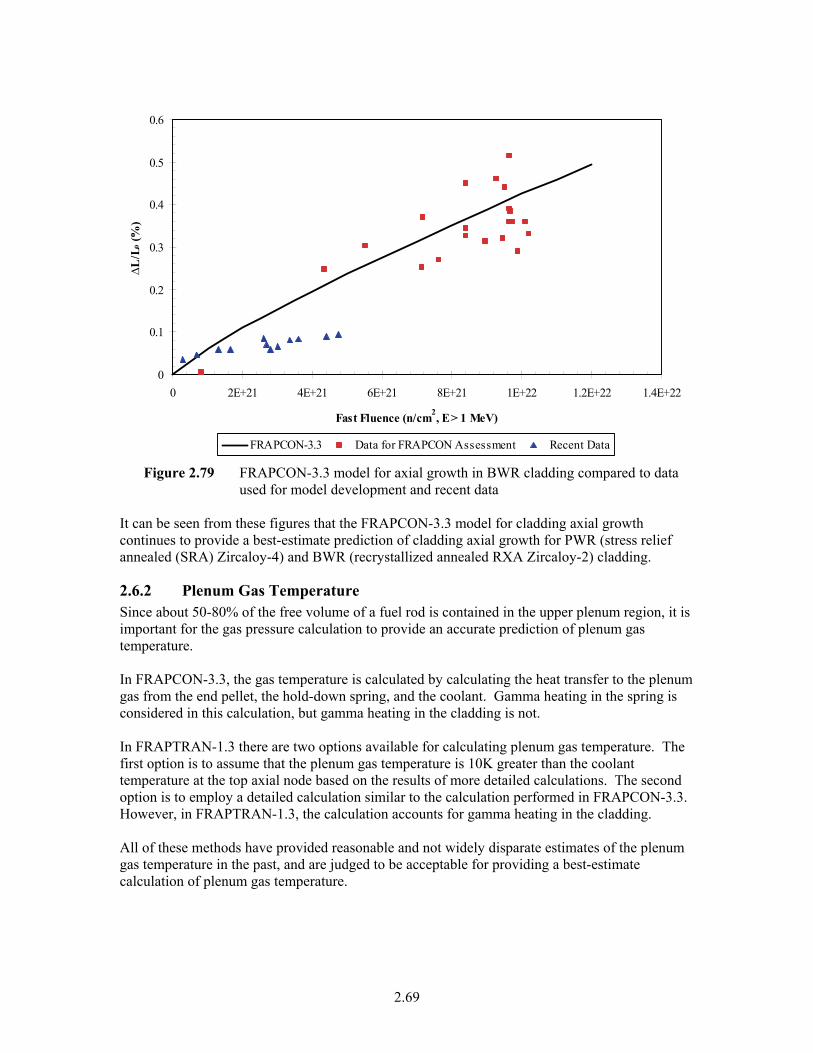
2.69
0
0.1
0.2
0.3
0.4
0.5
0.6
0 2E+21 4E+21 6E+21 8E+21 1E+22 1.2E+22 1.4E+22
Fast Fluence (n/cm2, E > 1 MeV)
∆L/L
o (%
)
FRAPCON-3.3 Data for FRAPCON Assessment Recent Data
Figure 2.79 FRAPCON-3.3 model for axial growth in BWR cladding compared to data used for model development and recent data
It can be seen from these figures that the FRAPCON-3.3 model for cladding axial growth continues to provide a best-estimate prediction of cladding axial growth for PWR (stress relief annealed (SRA) Zircaloy-4) and BWR (recrystallized annealed RXA Zircaloy-2) cladding.
2.6.2 Plenum Gas Temperature Since about 50-80% of the free volume of a fuel rod is contained in the upper plenum region, it is important for the gas pressure calculation to provide an accurate prediction of plenum gas temperature. In FRAPCON-3.3, the gas temperature is calculated by calculating the heat transfer to the plenum gas from the end pellet, the hold-down spring, and the coolant. Gamma heating in the spring is considered in this calculation, but gamma heating in the cladding is not. In FRAPTRAN-1.3 there are two options available for calculating plenum gas temperature. The first option is to assume that the plenum gas temperature is 10K greater than the coolant temperature at the top axial node based on the results of more detailed calculations. The second option is to employ a detailed calculation similar to the calculation performed in FRAPCON-3.3. However, in FRAPTRAN-1.3, the calculation accounts for gamma heating in the cladding. All of these methods have provided reasonable and not widely disparate estimates of the plenum gas temperature in the past, and are judged to be acceptable for providing a best-estimate calculation of plenum gas temperature.

2.70
2.7 Time Dependent Models In order to be consistent with each other, the two fuel performance codes, FRAPCON-3.3 and FRAPTRAN 1.3 use the same set of material properties and models when appropriate. Since FRAPCON-3 is a steady state code, changes that occur over the time period of milliseconds to minutes are not considered. However, FRAPTRAN is specifically designed to calculate changes in temperature and other parameters over such short intervals of time. Because of this, there is some concern that the material properties or other models used to calculate the behavior of the fuel and cladding may not change instantly when the temperature of the material changes. An example of this would be a material property that requires some atom diffusion to occur when the temperature changes such as the cladding annealing or hydrogen solubility models. The material properties of the fuel and cladding can be divided into 3 categories. (1) Those without time dependence that can be included in FRAPTRAN as given, (2) those with time dependence that can change over short time intervals (e.g. < 10 minutes) and should include a time dependence term in FRAPTRAN, and (3) those with a time dependence much greater than the time interval that is typically modeled in FRAPTRAN and can be ignored completely in FRAPTRAN. Tables 2.1-2.3 list the properties of fuel and cladding in their appropriate categories.
Table 2.1 Properties and models without time dependence Property Use Young’s modulus Calculate stress/strain behavior Thermal conductivity Calculate flow of heat through fuel, gas,
cladding and oxide Thermal expansion Calculate size of fuel and cladding at various
temperature k, m, and n Coefficients used to calculate plastic
stress/strain behavior
Table 2.2 Properties and models with time dependence that can change over short time intervals (e.g. < 10 minutes) and should be modeled in FRAPTRAN
Property Use Zircaloy annealing Calculate effective fluence and cold work as a
function of time and temperature for mechanical properties, E, k, m, and n.
Power law for plastic stress/strain behavior and thermal creep
Calculates yield stress and plastic stress/strain behavior as a function of E, k, m, n, and strain rate. Thermal creep not currently modeled in FRAPCON-3.3
Release of fission gas from grain boundary due to cracking
Calculate amount of fission gas residing on the grain boundary to be released to the rod void volume
Hydrogen dissolution and precipitation Used to calculate the excess hydrogen content that is used to calculate failure strain
Fuel melting Calculates volume change due to melting

2.71
Table 2.3 Properties and models with time dependence much greater than the time period modeled in FRAPTRAN
Property Use Fuel Relocation Calculates size of irradiated pellet due to
relocation Recovery of fuel relocation Percentage of fuel relocation to be recovered
upon gap closure Release of fission gas from grains to grain boundaries
Calculates amount of fission gas inside the grains that is released to the grain boundaries
Fuel swelling and densification Calculates size of fuel pellet as a function of burnup
Cladding irradiation creep Calculates creep induced in the cladding due to irradiation and external stress
Cladding irradiation growth Calculates axial growth induced by irradiation in the cladding
The following section will examine each of these three types of properties and explain why each property is in this category and how the property is treated or should be treated in FRAPTRAN.
2.7.1 Properties and Models without time dependence Young’s Modulus The Young’s modulus is governed by the strength of inter-atomic forces. These forces are a function of the lattice temperature and are not expected to have any time dependence. Of course, during a transient, the local temperature will not immediately reach the steady-state temperature, but FRAPTRAN divides the fuel and the cladding into many radial nodes, and uses a transient temperature calculator to calculate the local temperature at each radial node. Given the local temperature as calculated by FRAPTRAN, it is not expected that the Young’s modulus will have any time dependence. There is the possibility of annealing changing the crystal structure by removing the effect of cold work and irradiation defects. The model for Young’s modulus in FRAPTRAN is a function of cold work and fast neutron fluence. A separate annealing model calculates effective values of cold work and fast neutron fluence that are used as input to this model. Thermal Conductivity The fuel thermal conductivity of the fuel in FRAPTRAN is composed of two terms. The first is a phonon term that describes the heat transfer in the solid by lattice vibration. The ability of a lattice to transfer heat is not a function of time at temperature unless a phase change is expected. The extent of irradiation damage is a function of fluence and temperature, and impacts phonon heat transfer. FRAPCON-3.3 and FRAPTRAN 1.3 assume instantaneous change in the irradiation damage when the temperature changes such as a temperature transient but this is most likely not correct because the higher temperature will anneal the damage. In reality, the annealing of damage is most likely time dependent. There are some thermal diffusivity data that are measured above the irradiation temperature that may provide some information on how to model this damage as a function of time. The second term is an electronic term that describes

2.72
heat transfer by electrons. This term is not expected to have any time dependence of a rapid change with temperature. Thermal Expansion Thermal expansion in both the fuel and the cladding is a function of the crystal lattice constant increasing due to increased temperature changing the inter-atomic bond energies. This change in lattice constant manifests itself as a macroscopic swelling of the material. There is no delay between the increase in temperature and the macroscopic swelling in the fuel or the cladding. k, m, and n The strength coefficient, k, strain rate exponent, m, and strain hardening exponent, n are used to determine the stress, strain behavior of the cladding. These coefficients are a function of temperature, cold work, fast neutron fluence, and alloy type. Although the effective cold work and fluence effects (due to irradiation damage) can change, this is modeled in the annealing model, and the stress strain correlation has strain rate dependence in it, the equations for k, m, and n should not change with time for a given set of temperature, cold work and fast neutron fluence.
2.7.2 Properties and models with time dependence that can change over short time intervals (e.g. < 10 minutes) and should be modeled in FRAPTRAN
Zircaloy annealing The current versions of both FRAPCON-3 and FRAPTRAN contain a Zircaloy annealing model. The mechanical properties in FRAPCON-3 and FRAPTRAN are a function of both cold work and fast neutron fluence. The effects that these parameters have on the mechanical properties of Zircaloy are reduced when the cladding temperature increases during a transient. In addition, the time at temperature affects the degree to which these effects are reduced. The annealing model in FRAPCON-3 and FRAPTRAN is the ‘CANEAL’ model from MATPRO-11. This model calculates effective values for the cladding cold work and fast neutron fluence based on the temperature history that the cladding has seen. In this way, the time dependence of temperature on cladding mechanical properties is accounted for. The current annealing model is based on limited data. However, there is not currently significantly more data on cladding annealing. If more data become available, this model will be re-examined. Power law for plastic stress/strain behavior The stress strain behavior of zirconium alloy cladding is affected by the strain rate as well as the cold work and neutron fluence. For example, it has been observed that the yield stress and ultimate tensile strength of irradiated Zircaloy is about 15% greater during tests at high strain rates such as 1-10 in/in/s than during tests at lows strain rates such as 10-5 in/in/s. FRAPTRAN calculates the strain rate in the cladding based on the strain rate from the previous time step. The power law that relates plastic stress and strain is a function of strain rate. In this way, the strain rate is accounted for in the cladding stress/strain behavior.
2.73
Release of fission gas from grain boundary Fission gas that is accumulated on the grain boundary can be released to the rod void volume if the fuel temperature were to increase rapidly. This is of particular concern for RIA accidents, where it has been observed that fission gas release on the order of 5-20% is observed over a time period of less than 1 second. Currently, FRAPTRAN 1.3 has no transient fission gas release model. However, a new model has been developed for FRAPCON-3 that can be used to predict how much gas is on the grain boundaries, in addition to how much gas has been released during normal operation. A transient gas release model is under development that can use the gas on the grain boundary to predict how much gas will be released during a power transient. The release of grain boundary gas is expected to be nearly instantaneous with the temperature increase due to cracking and/or grain boundary separation. Additional diffusion of gas to the grain boundary is not expected over the time periods (< 10 minutes) modeled in FRAPTRAN. Hydrogen dissolution and precipitation FRAPTRAN-1.3 contains a strain based failure model that is used for cladding failure due to PMCI at temperatures below 700K. This model is used to predict failure during RIA-type accidents. This model is a function of temperature and excess hydrogen in the cladding. During a RIA, the cladding temperature is rapidly heated up within less than a second. The rate of change in excess hydrogen is such that the level of hydrogen in the cladding does not change appreciably over such a short time period. Because of this the steady state (equilibrium) value of hydrogen solubility that increases as the cladding temperature increases should not be used to predict the excess hydrogen in the cladding for this transient. A rate dependent dissolution (Kearns 1968) and precipitation (Une et al. 2003) model of hydrogen in Zircaloy is included in FRAPTRAN-1.3, so that the excess hydrogen content can be determined as a function of time and temperature during heat-up of the cladding on the order of several seconds or minutes. Fuel melting As energy increases in the fuel and the temperature reaches the fuel melting point, the heat of fusion must be absorbed by the fuel before the fuel temperature will continue to increase. This will cause a delay in the fuel temperature as a function of energy deposited that must be modeled in FRAPTRAN. In FRAPTRAN-1.3, when the fuel reaches the fuel melting temperature, the fuel temperature is held at the melting temperature until the fuel absorbs the heat of fusion. During the period of time that the fuel is absorbing the heat of fusion, the code calculates the volume fraction of fuel that is molten and the volume fraction that is solid. This volume fraction is used to determine the fuel thermal expansion of the pellet given the two phase composition and the volume change associated with fuel melting.

2.74
2.7.3 Properties and models with time dependence much greater than the time period modeled in FRAPTRAN
Fuel Relocation Fuel relocation is the term used to describe the cracking that occurs in a pellet as it expands and cracks and becomes larger than the solid pellet had been. This process is modeled in FRAPCON-3 as a power and burnup dependent phenomenon for the first 5 GWd/MTU of operation and remains constant for higher burnup. This model is based on beginning of life fuel temperature measurements taken in the Halden reactor. Because burnup accumulation is not modeled in FRAPTRAN the evolution of relocation is not modeled in FRAPTRAN. FRAPTRAN uses a simplification of the FRAPCON-3 model. For unirradiated fuel, the relocation is assumed to be 30% of the gap size. For irradiated fuel, the relocation is assumed to be 45% of the gap size. If FRAPCON-3 is used to initialize FRAPTRAN, the relocation calculated in FRAPCON-3 for a burnup dependent case is passed to FRAPTRAN as a pellet strain and the simplified model discussed above is ignored. Recovery of fuel relocation In FRAPCON-3 when the pellet and cladding come in contact, 50% of the calculated relocation is accommodated back into the pellet, to account for the repacking of some of the fuel fragments. This assumption is based on beginning of life measurements of the onset of cladding axial elongation and Halden squeeze tests on fuel pellets. This accommodation process occurs over some length of time that is assumed to be greater than the time modeled in FRAPTRAN. In FRAPTRAN, hard contact is assumed to occur when the pellet and cladding first come into contact. This assumption was made so that the predicted hoop strains in FRAPTRAN compare well with measured hoop strains from RIA tests. Release of fission gas from grains to grain boundaries Fission gas is produced within the fuel grains and diffuses out of the grains to the grain boundaries. Once these grain boundaries are saturated, the gas on the grain boundaries is released to the rod void. The rate of diffusion of Xe and Kr in UO2 is such that over the period of < 10 minutes significant diffusion will not occur. Because of this, the transient fission gas release model that will be developed for FRAPTRAN will not consider gas diffusion from the grains. The only source of fission gas for this transient model will be gas that has previously accumulated on the grain boundaries. Fuel swelling and densification Solid fission product swelling and fuel densification happen over a long period of time. These changes are typically on the order of ± 1 % ΔV/V per 10 GWd/MTU (>100 days). Since the period of time that is typically modeled in FRAPTRAN (< 10 minutes) is significantly shorter than this period of time, no fuel swelling or densification is modeled in FRAPTRAN. For a case with burnup dependent properties from FRAPCON-3, the deformed pellet radius from the final time step that includes changes due to densification and solid swelling is input to FRAPTRAN. No further swelling or densification is calculated in FRATPRAN for this case.
2.75
Gaseous swelling is not modeled in FRAPCON-3.3 or FRAPTRAN 1.3. Gaseous swelling may be important at high burnups (> 40 GWd/MTU) for high power increases on the order of several minutes at power. Gaseous swelling is diffusion dependent. Cladding irradiation and thermal creep Irradiation creep in the cladding is a process that causes strain in the cladding as a function of fast neutron flux, time, and temperature. The period of time that is typically modeling in FRAPTRAN (< 10 minutes) is significantly shorter than the time required to get significant irradiation creep. As with the swelling and densification, FRAPTRAN assumes that no irradiation creep occurs. For a case with burnup dependent properties from FRAPCON-3, the deformed cladding radius from the final time step is input to FRAPTRAN. No further cladding creep is calculated in FRAPTRAN for this case. Thermal creep is not modeled in either FRAPCON-3.3 or FRAPTRAN 1.3 with the exception of cladding ballooning at very high temperature (>750°C) that is modeled in FRAPTRAN 1.3. Cladding ballooning can occur during a LOCA event. Thermal creep is diffusion dependent such that it takes several seconds to hours depending on cladding temperature to be significant. The new creep model that has been developed and implemented in FRAPCON-3.4 contains a thermal creep term. This model is described in Section 3.7. Cladding irradiation growth Irradiation growth in the cladding is a process that causes axial strain in the cladding as a function of fast neutron fluence. The period of time that is typically modeled in FRAPTRAN (< 10 minutes) is significantly shorter than the time required to get significant growth. As with the cladding creep, FRAPTRAN assumes that no irradiation growth occurs. For a case with burnup dependent properties from FRAPCON-3, the cladding elongation from the final time step is input to FRAPTRAN. No further cladding growth is calculated in FRAPTRAN for this case.
2.7.4 Summary The material properties and models for the fuel and cladding can be divided into three categories. These categories are; those with out time dependence, those with time dependence that can change over short time intervals (e.g. < 10 minutes) and should include a time dependence term in FRAPTRAN, and those with a time dependence much greater than the time interval that is typically modeled in FRAPTRAN that can be ignored completely in FRAPTRAN. The material properties and models of the fuel and cladding are divided up into each of these categories, and those in the second category have been examined to ensure that they are adequately modeled in FRAPTRAN. For those material properties and models with time dependence that can change over short time intervals (e.g. < 10 minutes), all are assumed to be correctly modeled in FRAPTRAN, except for grain boundary release of fission gas. A model is currently under development to simulate this behavior. In addition, there are not much data to support the cladding annealing model, but no more is currently available. As more data become available, this model will be re-examined. No gaseous swelling model or thermal creep model exists in FRAPTRAN-1.3 or FRAPCON-3.3. A gaseous swelling model is currently under development. A thermal term has been included in the new creep model described in Section 3.7.

2.76
2.8 Conclusions The conclusion of this assessment is that both FRAPCON-3.3 and FRAPTRAN 1.3 provide best-estimate predictions of fuel temperature (see Section 2.1.7), fission gas release (see Section 2.2.2) and cladding stress and strain (see Section 2.5.3). Several individual models have been identified as being biased over certain ranges, but the integral predictions of fuel and cladding temperature and cladding stress and strain in FRAPCON-3.3 and FRAPTRAN 1.3 are best-estimate. The following list includes individual models that have been re-examined, to improve the model’s predictive capability in FRAPCON-3.4 and FRAPTRAN 1.4. These model improvements are discussed in Section 3. • Cladding corrosion: Recent adjustments have been made to simulate corrosion on ZIRLO™
and M5™. Some comparisons have shown that this adjustment may not be valid at high burnup for ZIRLO™. This model has been reassessed and made to provide a better fit to ZIRLO™ corrosion data.
• BWR cladding hydrogen content: New data show the need for a new model for predicting BWR cladding hydrogen content. A model has been developed to calculate this.
• Radial power profile: The radial power profile should be assessed relative to the expected radial power profile in a HWR and a radial power model has been developed for UO2-Gd2O3 fuel.
• Fuel thermal expansion at high temperature: A new model has been developed to better fit the data at high temperature.
• Gas thermal conductivity: The gas conductivity models are not valid for most gasses beyond 1100K and new data are available for new model development. This will not affect most of the temperature predictions since the gas does not typically exceed 1000K. New models have been developed that better predict these data.
• Steam thermal conductivity: The models in both codes have been changed to match the ASME model. This is most important in FRAPTRAN 1.3 where the gap may be filled with steam after cladding rupture.
• Cladding irradiation creepdown: Some evidence indicates that the cladding irradiation creepdown model in FRAPCON-3.3 may predict creepdown to occur too rapidly. This has been assessed and a new irradiation creepdown model has been developed.
• Thermal creep impacts calculation of permanent strains below the yield stress for transients on the order of several minutes to hours. The new creep model contains a thermal creep term.
• Clad-coolant heat transfer models – The models for clad-coolant heat transfer in FRAPTRAN were updated. These models are discussed elsewhere (Cuta, 2007).
The following list contains areas where modeling has not been done, but where new modeling capabilities could be added and possibly improve the codes’ predictive capabilities. • Fission gas release: There is no fission gas release model in FRAPTRAN 1.3. Significant
gas release has been observed during RIAs. A model should be developed to simulate this release in FRAPTRAN 1.3, and if necessary, the model in FRAPCON-3.3 should be modified to provide initial conditions to this new model.
• Fission gas release: The fission gas release model in FRAPCON-3.3 underpredicts FGR for power ramped rods with hold times less than 4 hours. The model should be modified to account for this. Until this time, PNNL recommends that the hold time be increased by a factor of 3 for power ramp hold times less than 4 hours to conservatively bound the expected fission gas release behavior.

2.77
• Gaseous swelling is not modeled and may be important for transient in high burnup fuel lasting several minutes to hours.
• Time dependent change in thermal conductivity due to thermal annealing of irradiation defects during a slow temperature transient.
• Hydrogen pickup from high temperature oxidation not modeled in FRAPTRAN 1.3 • Axial and radial strain predictions in FRAPTRAN 1.3

3.1
3.0 UPDATES TO MODELS This section discusses the models that have been found to be biased in Section 2.0 and have been updated to provide a best-estimate fit to the available data. Since these models are new, they will be validated relative to the available data and standard deviation will be calculated relative to the available data. All of these models will be included in the new code versions, FRAPCON-3.4 and FRATPRAN 1.4, when they are released. The release of FRAPCON-3.4 and FRAPTRAN 1.4 will each be accompanied by a document that describes the changes that have been made since the previous version as well as providing the results of the integral assessment comparisons for integral effects such as centerline temperature and rod internal pressure. The integral effects may be impacted by the changes made to models described in this section as well as other changes made since the previous code release. The overall code validation will be performed in the documents accompanying the release of each code.
3.1 Corrosion and Hydrogen Pickup in Cladding Alloys Section 2.3 identified that the corrosion and hydrogen pickup models in FRAPCON-3.3 are deficient in the areas of hydrogen pickup in Zircaloy-2 in BWR conditions, corrosion of ZIRLO™ at high burnup, and corrosion of M5™ at high burnup. This section will discuss how these models have been changed to provide a best-estimate prediction for these alloys.
3.1.1 Hydrogen pickup in Zircaloy-2 The recent data comparison shown in Section 2.3.2 found that a constant hydrogen pickup fraction is not appropriate for hydrogen pickup in Zircaloy-2. In addition, it was found that the hydrogen pickup in new Zircaloy-2 where the vendors have better control over the alloy composition and second-phase precipitate (SPP) size is different from older Zircaloy. Correlations were developed for the hydrogen pickup in older and new Zircaloy-2 as a function of burnup. These correlations are given below. For older Zircaloy-2:
BUBu
HTot ⋅+⎟⎠⎞
⎜⎝⎛
+− 316.0
13.1exp8.47
Where: HTot = total hydrogen, ppm (wt) BU = local axial burnup, MWd/kgU (only valid to 50 MWd/kgU) For new Zircaloy-2:
( ))20(117.0exp8.22 −+= BUH Tot Where: HTot = total hydrogen, ppm (wt) BU = local axial burnup, MWd/kgU (valid up to 70 MWd/kgU) It is noted that the correlation for older Zircaloy-2 is only valid to 50 MWd/kgU. This is because there is no data available above 50 MWd/kgU. For older Zircaloy, when the burnup exceeds 50 MWd/kgU, it is recommended that the correlation for newer Zircaloy plus 6.1 (the difference between these correlations at 50 MWd/kgU) be used. FRAPCON-3.4 will be modified to include these equations for hydrogen pickup in Zircaloy-2 cladding under BWR conditions. In addition, a new variable will be added to select between new Zircaloy-2 and older Zircaloy-2.

3.2
Figure 3.1 shows the data and the correlations that have been developed for hydrogen pickup in old and new Zircaloy-2 as well as the previous model used in FRAPCON-3.3. The data for the older fuel types is primarily from Japanese reactors. The standard deviation, σ, of this correlation is 9.69 ppm that appears to remain relatively constant up to 45 MWd/kgU. The standard deviation for the correlation for newer Zircaloy-2 can be seen to be burnup dependent with the scatter in the data significantly increasing above a local burnup of 49 MWd/kgU. Therefore, the calculation of standard deviation has been broken into two separate burnup ranges of 0 to 49 MWd/kgU where σ = 10.76 ppm and for burnups between 49 to 65 MWd/kgU where σ = 60.62 ppm. The distribution of the predicted-minus-measured is close to a normal distribution within a given burnup range such that use of normal statistics is assumed to be valid.
0
50
100
150
200
250300
350
400
450
500
0 10 20 30 40 50 60 70 80
Local Axial Burnup [MWd/kgU]
Hyd
roge
n C
onte
nt [p
pm]
Old Zircaloy-2 New Zircaloy-2FRAPCON-3.3 FRAPCON-3.4 Old Zircaloy-2FRAPCON-3.4 New Zircaloy
Figure 3.1 Comparison of recent Zircaloy-2 hydrogen pickup data to new correlations
for old and new Zircaloy-2 cladding
3.1.2 Corrosion in ZIRLO™ The data comparison in Section 2.3.1 where the ZIRLO™ model in FRAPCON-3.3 was compared to two high exposure rods (A06 & A12) (CSN, ENUSA, 2002) found that the model underpredicts oxide thickness at high burnup (>70 GWd/MTU). The model in FRAPCON-3.3 for ZIRLO™ had been the same as the model for Zircaloy-4, but the final oxide thickness was reduced by a factor of 2.0 (Lanning et al, 2005a). In order to provide a better fit to the data, the following changes were made to the Zircaloy-4 model for the modeling of ZIRLO™.
• The value used for weight gain from the previous time step was increased by a factor of 2.0.
• The calculated thickness for the current time step was decreased by a factor of 2.0. • The activation energy for post transition oxidation, Q2, was decreased by a factor of 0.99.

3.3
Figure 3.2 shows the FRAPCON predictions of oxide thickness as a function of fuel duty index (FDI) using the old model (FRAPCON-3.3) and the new model (FRAPCON-3.4). The FRAPCON-3 predictions are performed for one of the high exposure rods, A06, and for several other typical PWR rods where power history and design information is known that allowed cladding temperatures and fuel duty index (FDI) to be calculated for a given PWR design assuming ZIRLO™ cladding. Also shown in this figure is a large quantity of ZIRLO™ oxide thickness data (Knott et al., 2003).
0
20
40
60
80
100
120
0 200 400 600 800 1000
Fuel Duty Index
Oxi
de T
hick
ness
, μm
ZIRLO Data A06 REP Na 8 Base TSQ002 BFM034 (a)
0
20
40
60
80
100
120
0 200 400 600 800 1000
Fuel Duty Index
Oxi
de T
hick
ness
, μm
ZIRLO Data A06 Rep Na8 Base TSQ002 BFM034 (b)
Figure 3.2 ZIRLO™ data vs. burnup and (a) FRAPCON-3.3 and (b) FRAPCON-3.4 model predictions for several sample PWR rods
It can be seen from this figure that the model in FRAPCON-3.3 begins to underpredict the oxide thickness by a FDI of 700. However, the new model shows good predictions out to a FDI of 900. It is difficult to calculate the uncertainty of this model as the actual temperature and time for each
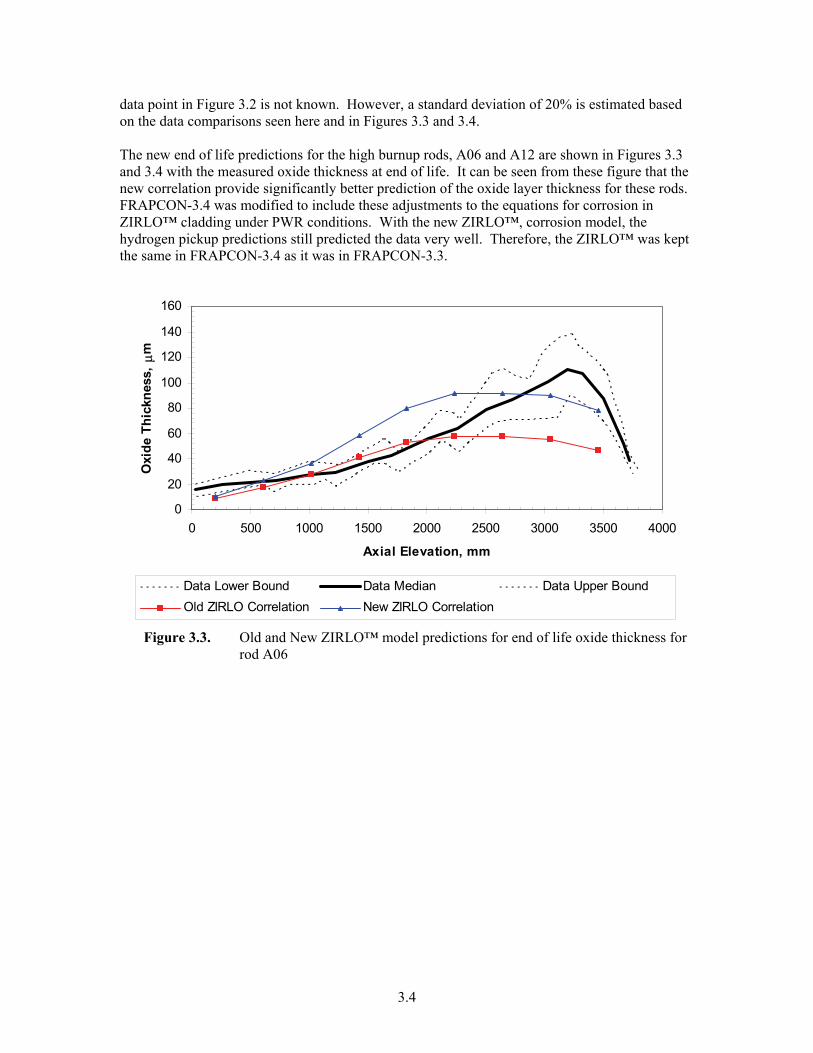
3.4
data point in Figure 3.2 is not known. However, a standard deviation of 20% is estimated based on the data comparisons seen here and in Figures 3.3 and 3.4. The new end of life predictions for the high burnup rods, A06 and A12 are shown in Figures 3.3 and 3.4 with the measured oxide thickness at end of life. It can be seen from these figure that the new correlation provide significantly better prediction of the oxide layer thickness for these rods. FRAPCON-3.4 was modified to include these adjustments to the equations for corrosion in ZIRLO™ cladding under PWR conditions. With the new ZIRLO™, corrosion model, the hydrogen pickup predictions still predicted the data very well. Therefore, the ZIRLO™ was kept the same in FRAPCON-3.4 as it was in FRAPCON-3.3.
0
20
40
60
80
100
120
140
160
0 500 1000 1500 2000 2500 3000 3500 4000
Axial Elevation, mm
Oxi
de T
hick
ness
, μm
Data Lower Bound Data Median Data Upper BoundOld ZIRLO Correlation New ZIRLO Correlation
Figure 3.3. Old and New ZIRLO™ model predictions for end of life oxide thickness for
rod A06
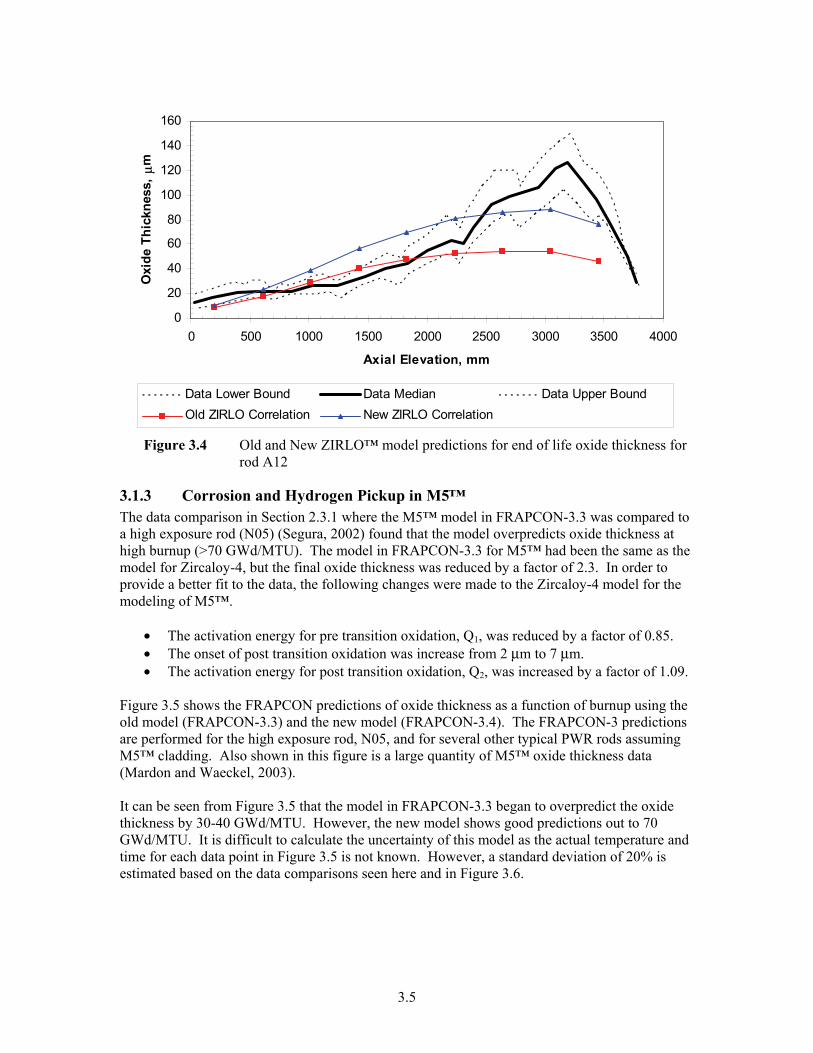
3.5
0
20
40
60
80
100
120
140
160
0 500 1000 1500 2000 2500 3000 3500 4000
Axial Elevation, mm
Oxi
de T
hick
ness
, μm
Data Lower Bound Data Median Data Upper BoundOld ZIRLO Correlation New ZIRLO Correlation
Figure 3.4 Old and New ZIRLO™ model predictions for end of life oxide thickness for
rod A12
3.1.3 Corrosion and Hydrogen Pickup in M5™ The data comparison in Section 2.3.1 where the M5™ model in FRAPCON-3.3 was compared to a high exposure rod (N05) (Segura, 2002) found that the model overpredicts oxide thickness at high burnup (>70 GWd/MTU). The model in FRAPCON-3.3 for M5™ had been the same as the model for Zircaloy-4, but the final oxide thickness was reduced by a factor of 2.3. In order to provide a better fit to the data, the following changes were made to the Zircaloy-4 model for the modeling of M5™.
• The activation energy for pre transition oxidation, Q1, was reduced by a factor of 0.85. • The onset of post transition oxidation was increase from 2 μm to 7 μm. • The activation energy for post transition oxidation, Q2, was increased by a factor of 1.09.
Figure 3.5 shows the FRAPCON predictions of oxide thickness as a function of burnup using the old model (FRAPCON-3.3) and the new model (FRAPCON-3.4). The FRAPCON-3 predictions are performed for the high exposure rod, N05, and for several other typical PWR rods assuming M5™ cladding. Also shown in this figure is a large quantity of M5™ oxide thickness data (Mardon and Waeckel, 2003). It can be seen from Figure 3.5 that the model in FRAPCON-3.3 began to overpredict the oxide thickness by 30-40 GWd/MTU. However, the new model shows good predictions out to 70 GWd/MTU. It is difficult to calculate the uncertainty of this model as the actual temperature and time for each data point in Figure 3.5 is not known. However, a standard deviation of 20% is estimated based on the data comparisons seen here and in Figure 3.6.

3.6
0
10
20
30
40
50
60
0 20 40 60 80
Burnup, GWd/MTU
Oxi
de T
hick
ness
, μm
N05 M5 Data REP Na 8 Base TSQ002 BFM034 (a)
0
10
20
30
40
50
60
0 20 40 60 80
Burnup, GWd/MTU
Oxi
de T
hick
ness
, μm
N05 M5 Data Rep Na8 Base TSQ002 BFM034 (b)
Figure 3.5 M5™ data vs. burnup and (a) FRAPCON-3.3 and (b) FRAPCON-3.4 model predictions for several sample PWR rods
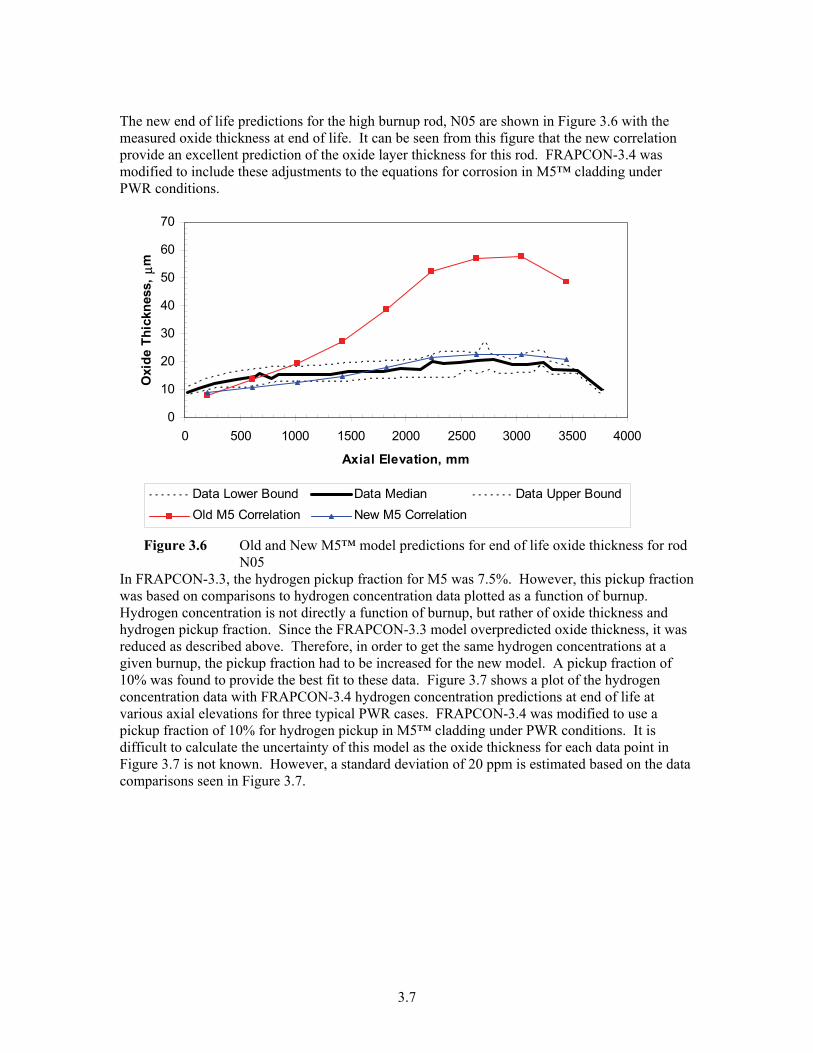
3.7
The new end of life predictions for the high burnup rod, N05 are shown in Figure 3.6 with the measured oxide thickness at end of life. It can be seen from this figure that the new correlation provide an excellent prediction of the oxide layer thickness for this rod. FRAPCON-3.4 was modified to include these adjustments to the equations for corrosion in M5™ cladding under PWR conditions.
0
10
20
30
40
50
60
70
0 500 1000 1500 2000 2500 3000 3500 4000
Axial Elevation, mm
Oxi
de T
hick
ness
, μm
Data Lower Bound Data Median Data Upper BoundOld M5 Correlation New M5 Correlation
Figure 3.6 Old and New M5™ model predictions for end of life oxide thickness for rod
N05 In FRAPCON-3.3, the hydrogen pickup fraction for M5 was 7.5%. However, this pickup fraction was based on comparisons to hydrogen concentration data plotted as a function of burnup. Hydrogen concentration is not directly a function of burnup, but rather of oxide thickness and hydrogen pickup fraction. Since the FRAPCON-3.3 model overpredicted oxide thickness, it was reduced as described above. Therefore, in order to get the same hydrogen concentrations at a given burnup, the pickup fraction had to be increased for the new model. A pickup fraction of 10% was found to provide the best fit to these data. Figure 3.7 shows a plot of the hydrogen concentration data with FRAPCON-3.4 hydrogen concentration predictions at end of life at various axial elevations for three typical PWR cases. FRAPCON-3.4 was modified to use a pickup fraction of 10% for hydrogen pickup in M5™ cladding under PWR conditions. It is difficult to calculate the uncertainty of this model as the oxide thickness for each data point in Figure 3.7 is not known. However, a standard deviation of 20 ppm is estimated based on the data comparisons seen in Figure 3.7.

3.8
020406080
100120140160
0 20 40 60 80
Local Burnup, GWd/MTU
Hyd
roge
n C
once
ntra
tion,
pp
m
M5 Data REP Na8 Base TSQ002 BFM034
Figure 3.7 Hydrogen concentration data for M5™ and FRAPCON-3.4 predictions of hydrogen for typical PWR cases
3.2 Radial Power Profile in HWR The TUBRNP (Lassman et al. 1994) model in FRAPCON-3.3 predicts the radial power profiles within the fuel pellet as a function of uranium and plutonium isotopic concentration and burnup. The version of this subroutine contains one parameter that is modified to account for HWR conditions. The constant p1 is changed from 3.45 to 2.45 for HWR conditions. Comparison to data and other neutronic code predictions have demonstrated that this adjustment does not correctly account for the differences in heavy water and light water reactor conditions. Since the original release of FRAPCON-3, a second paper has been published on the modifications to TUBRNP to correctly model HWR conditions (Lassman et al. 1998). This paper stated that the original TUBRNP model could be modified to be applicable to HWR conditions if the fission and capture cross sections for each uranium and plutonium isotopes were updated based on a HWR neutron spectrum and if the constant p1 was changed from 3.45 to 2.21. The neutron spectrum in a HWR has relatively more neutrons in the thermal region and relatively fewer neutrons in the fast region. Therefore the spectrum-averaged fission and capture cross sections will be different for LWR and HWR conditions. Lassman et al. (1998) did not provide the spectrum-averaged cross sections that they used to update this model. The current TRANSURANUS code developers were contacted and the cross section values that are used in TUBRNP for HWR conditions were provided. The internal version of FRAPCON-3.4 was modified to use the recommended value of p1 and fission and capture cross sections for HWR conditions. The predictions of this modified version of FRAPCON-3.4 were compared to rods that had electron probe microanalysis (EPMA) data of the fission product, Nd (Lassmann et al., 1998). This fission product is immobile in UO2 and the concentration of Nd is related to the fission density and thus can be converted to burnup. Figures 3.8 and 3.9 show the original TUBRNP and the modified TUBRNP predictions of radial burnup distribution for two different rod sections irradiated at Halden and DR3.
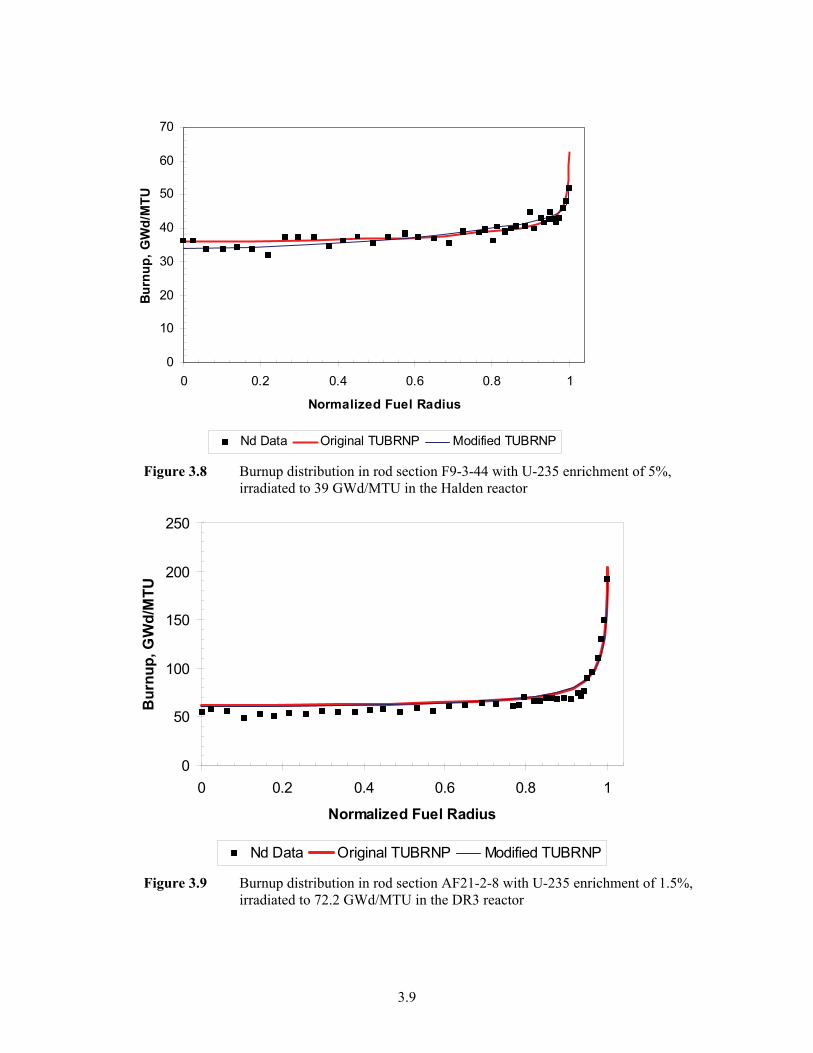
3.9
0
10
20
30
40
50
60
70
0 0.2 0.4 0.6 0.8 1
Normalized Fuel Radius
Bur
nup,
GW
d/M
TU
Nd Data Original TUBRNP Modified TUBRNP
Figure 3.8 Burnup distribution in rod section F9-3-44 with U-235 enrichment of 5%, irradiated to 39 GWd/MTU in the Halden reactor
0
50
100
150
200
250
0 0.2 0.4 0.6 0.8 1
Normalized Fuel Radius
Bur
nup,
GW
d/M
TU
Nd Data Original TUBRNP Modified TUBRNP
Figure 3.9 Burnup distribution in rod section AF21-2-8 with U-235 enrichment of 1.5%, irradiated to 72.2 GWd/MTU in the DR3 reactor

3.10
Figure 3.10 shows a comparison of the predictions of the TUBRNP model for a rod with 7% U-235 irradiated in the Halden reactor compared to the Halden predictions made using FTEMP.
0.8
0.9
1
1.1
1.2
1.3
0 0.1 0.2 0.3 0.4 0.5 0.6
Radius, cm
Rel
ativ
e Po
wer
FTEMP-0 GWd/MTU TUBRNP-0 GWd/MTUFTEMP-20 GWd/MTU TUBRNP-20 GWd/MTU
Figure 3.10 Radial power profile in IFA-558 as predicted by FTEMP and TUBRNP with
U-235 enrichment of 7%, irradiated in the Halden reactor It can be seen from these figures that the modified version of TUBRNP provides slightly better predictions of the edge peaking, particularly for the lower burnup section seen in Figure 3.8. For the comparison in Figure 3.9, the modified version of TUBRNP only provides slightly less edge peaking. It can also be seen that the TUBRNP predictions are almost identical to the FTEMP predictions at beginning of life and similar thereafter. The modified version of TUBRNP was added to FRAPCON-3.4. Based on data comparisons and comparisons to other codes, it can be estimated that the radial power profile model in FRAPCON-3.4 has a standard deviation of about 2.5%. The modified version of TUBRNP will be compared to a more detailed neutronics code (such as WIMS) calculation of radial power in HWR prior to the release of FRAPCON-3.4.
3.3 Radial Power Profile in UO2-Gd2O3 Based on the success of using TUBRNP to model the radial power profile for UO2 and MOX under LWR and HWR conditions, it was thought that if the model was modified to track the neutron absorption and quantity of the neutron absorbing isotopes of gadolinium, Gd-155 and Gd-157 then this model could be used to predict the radial power profile of UO2-Gd2O3 fuel. This approach was attempted, but the results predicted by TUBRNP were not reasonable in that they did not match neutronic code predictions done at Halden ( Klecha 2005, Volkov et al. 2002) and the centerline temperature predictions in FRAPCON-3 did not match centerline temperature measurements from Halden test rods with centerline thermocouples. The centerline temperature comparisons for Halden UO2-Gd2O3 rods shown in Section 2.1.7.2 were performed using the radial power profiles provided by Halden for various burnups and radial positions. A lookup and interpolation routine was used to calculate the radial power for each time step and location in FRAPCON-3. This approach provided good predictions of

3.11
centerline temperature for these rods, however, the radial power profiles used here were specific for these rods and the Halden reactor and could not be independently verified. In order to model the radial power profile for UO2-Gd2O3, a typical rod was modeled in WIMS for 0, 2, 4, 6, 8, and 10 wt% Gd2O3 at various burnup levels for LWR and HWR conditions. The results of these calculations were put into FRAPCON-3.4 as a data table and a lookup and interpolation routine was used to calculate the radial power profile. This lookup table is used for burnup values less than 7 GWd/MTU in FRAPCON-3.4. The WIMS calculations for the case with 10 wt% Gd2O3 showed that all the Gd-155 was gone (<0.1%) by about 7 GWd/MTU and all the Gd-157 was gone by about 5 GWd/MTU. Beyond this burnup level, the neutron absorbing isotopes, Gd-155 and Gd-157, have converted to non-neutron absorbing isotopes and the radial power profile is very similar to the radial power profile for UO2. For burnup levels greater than 7 GWd/MTU, the TUBRNP model is used to calculate the radial power profile for UO2-Gd2O3. The burnup values output by WIMS do not directly correspond with those in FRAPCON-3. In WIMS, a constant power of 40 MW/MTU (5.73 kW/ft) was used for these calculations. However, in reality, while the gadolinium is burning out in a fuel rod, the power level is much less than this due to neutron absorption by gadolinium. The power level and burnup in WIMS best corresponds to the power level and burnup in the neighboring UO2 fuel rods. The power profiles provided by WIMS are best described as a function of time. In order to account for this, an effective burnup is calculated in FRAPCON-3.4 to use in the interpolation routine where the burnup increment for each time step is the burnup calculated by FRAPCON-3 times the ratio of 5.73 kW/ft to the actual fuel rod power. The FRAPCON-3.4 predictions were compared to those made using the radial power profiles calculated by Halden and to the measured temperature data from IFA-636 (Tverberg et al 2005, Volkov et al 2002, Tolonen & Tverberg, 2005) and from IFA-681 (Tolonen & Tverberg, 2005, Tolonen & Andres 2005, Klecha 2005). Plots of these comparisons are shown in Figures 3.11-3.16. It is noted that the measured temperature for IFA-636 Rod 4 (solid pellets) was estimated by Halden from IFA-636 Rod 2 thermocouple measurements. It can be seen from these figures that using the new data table to calculate radial power profile, FRAPCON-3.4 predicts centerline temperature values as well as those using the Halden data tables. It is concluded that the new data table is well within the accuracy of measured rod power and temperatures.
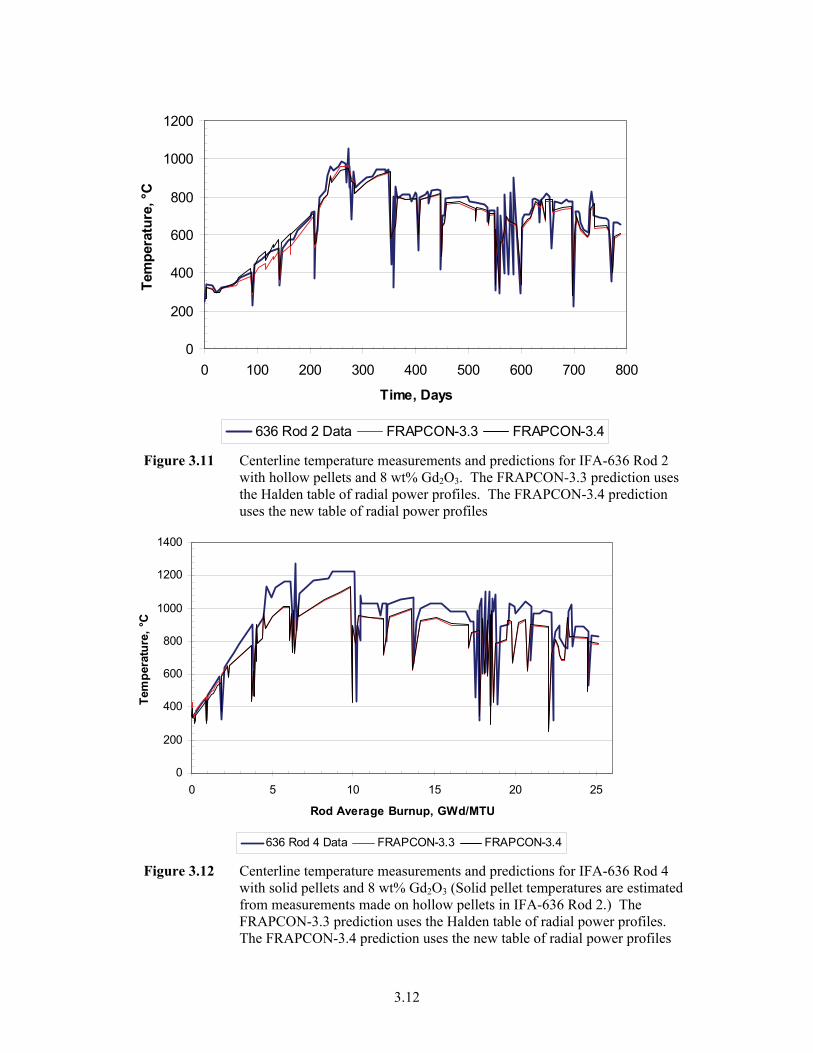
3.12
0
200
400
600
800
1000
1200
0 100 200 300 400 500 600 700 800
Time, Days
Tem
pera
ture
, °C
636 Rod 2 Data FRAPCON-3.3 FRAPCON-3.4
Figure 3.11 Centerline temperature measurements and predictions for IFA-636 Rod 2 with hollow pellets and 8 wt% Gd2O3. The FRAPCON-3.3 prediction uses the Halden table of radial power profiles. The FRAPCON-3.4 prediction uses the new table of radial power profiles
0
200
400
600
800
1000
1200
1400
0 5 10 15 20 25
Rod Average Burnup, GWd/MTU
Tem
pera
ture
, °C
636 Rod 4 Data FRAPCON-3.3 FRAPCON-3.4
Figure 3.12 Centerline temperature measurements and predictions for IFA-636 Rod 4 with solid pellets and 8 wt% Gd2O3 (Solid pellet temperatures are estimated from measurements made on hollow pellets in IFA-636 Rod 2.) The FRAPCON-3.3 prediction uses the Halden table of radial power profiles. The FRAPCON-3.4 prediction uses the new table of radial power profiles

3.13
0
200
400
600
800
1000
1200
1400
0 50 100 150
Time Days
Tem
pera
ture
, °C
Rod 2 Data FRAPCON-3.3 FRAPCON-3.4
Figure 3.13 Centerline temperature measurements and predictions for IFA-681 Rod 2 with solid pellets and 2 wt% Gd2O3. The FRAPCON-3.3 prediction uses the Halden table of radial power profiles. The FRAPCON-3.4 prediction uses the new table of radial power profiles
0
200
400
600
800
1000
1200
0 50 100 150
Time Days
Tem
pera
ture
, °C
Rod 3 Data FRAPCON-3.3 FRAPCON-3.4
Figure 3.14 Centerline temperature measurements and predictions for IFA-681 Rod 3 with solid pellets and 8 wt% Gd2O3. The FRAPCON-3.3 prediction uses the Halden table of radial power profiles. The FRAPCON-3.4 prediction uses the new table of radial power profiles

3.14
0
200
400
600
800
1000
1200
1400
0 50 100 150
Time Days
Tem
pera
ture
, °C
Rod 4 Data FRAPCON-3.3 FRAPCON-3.4
Figure 3.15 Centerline temperature measurements and predictions for IFA-681 Rod 4 with hollow pellets and 2 wt% Gd2O3. The FRAPCON-3.3 prediction uses the Halden table of radial power profiles. The FRAPCON-3.4 prediction uses the new table of radial power profiles
0
200
400
600
800
1000
1200
1400
0 50 100 150
Time Days
Tem
pera
ture
, °C
Rod 6 Data FRAPCON-3.3 FRAPCON-3.4
Figure 3.16 Centerline temperature measurements and predictions for IFA-681 Rod 6 with hollow pellets and 8 wt% Gd2O3. The FRAPCON-3.3 prediction uses the Halden table of radial power profiles. The FRAPCON-3.4 prediction uses the new table of radial power profiles

3.15
3.4 Fuel Thermal Expansion at High Temperature The original model in FRAPCON-3.3 and FRAPTRAN 1.3 for UO2 thermal expansion is given below.
⎟⎠⎞
⎜⎝⎛ −
+−=ΔkTEKKTK
LL Dexp3210
Where:
0LLΔ
=linear strain caused by thermal expansion with a reference of 300K
K1=1.0x10⁻⁵
K2=3.0x10⁻³ K3=4.0x10⁻² ED=6.9x10⁻²⁰ k = 1.38x10⁻²³ This model was found to underpredict data above 2200K in Section 2.1.4. The coefficients in this model were updated to provide a better fit of all the data. The updated coefficients are given below. K1=9.80x10⁻⁶
K2=2.61x10⁻³ K3=3.16x10⁻¹ ED=1.32x10⁻¹⁹ Figure 3.17 shows a plot of the original and the new model with all the available data as a function of temperature. It can be seen that the modified model provides a better fit to the data above 2300K. This new models has been added to FRAPCON-3.4 and FRAPTRAN 1.4. The standard deviation of this model relative to the data in Figure 3.16 is 0.0015 ΔL/L.

3.16
00.005
0.010.015
0.020.0250.03
0.0350.04
0.0450.05
0 500 1000 1500 2000 2500 3000
Temperature, K
Ther
mal
Exp
ansi
on,
ΔL/
L
FRAPCON-3.3 GronvoldBaldock BurdickOther MATPRO References Martin ReferencesUpdated Model
Figure 3.17 Original and modified UO2 thermal expansion model with available data as a
function of temperature.
3.5 Gas Thermal Conductivity at High Temperature The original model for gas thermal conductivity used in FRAPCON-3.3 and FRAPTRAN 1.3 is given below.
BATk = Where: k = thermal conductivity, W/m-K T = temperature, K The coefficients A and B that are used for each gas species is given in Table 3.1.
Table 3.1 Original A and B coefficients used in FRAPCON-3.3 and FRAPTRAN 1.3 Gas A B He 2.639x10⁻³ 0.7085 Ar 2.986x10⁻⁴ 0.7224 Kr 8.247x10⁻⁵ 0.8363 Xe 4.351x10⁻⁵ 0.8616 H2 1.097x10⁻³ 0.8785 N2 5.314x10⁻⁴ 0.6898

3.17
This model was found to underpredict gas conductivity at high temperature. Because of this the model parameters, A and B were updated to provide a better fit to the data. The updated coefficients for each gas are shown in Table 3.2.
Table 3.2 Modified A and B coefficients Gas A B He 2.531x10⁻³ 0.7146 Ar 4.090x10⁻⁴ 0.6748 Kr 1.966x10⁻⁴ 0.7006 Xe 9.825x10⁻⁵ 0.7334 H2 1.349x10⁻³ 0.8408 N2 2.984x10⁻⁴ 0.7799
Figures 3.18-3.23 show plots of the original and the new models with all the available data as a function of temperature. It can be seen that the modified models provides a better fit to the high temperature Ar, Kr, Xe, H2 and N2 data. These updated models have been added to FRAPCON-3.4 and FRAPTRAN 1.4. The standard deviation for each of these models relative to the data is stated in the caption for each figure.
0.00
0.10
0.20
0.30
0.40
0.50
0.60
0.70
0.80
0 500 1000 1500 2000 2500 3000
Temperature, K
Ther
mal
Con
duct
ivity
, W/m
-K
MATPRO Data used by MATPRORecent Data Updated Model
Figure 3.18 Original and modified model for He thermal conductivity (σ=0.00899)

3.18
0.00
0.01
0.02
0.03
0.04
0.05
0.06
0.07
0.08
0.09
0.10
0 500 1000 1500 2000 2500 3000
Temperature, K
Ther
mal
Con
duct
ivity
, W/m
-K
MATPRO Data used by MATPRORecent Data Updated Model
Figure 3.19 Original and modified model for Ar thermal conductivity (σ=0.000966)
0.00
0.01
0.02
0.03
0.04
0.05
0.06
0.07
0 500 1000 1500 2000 2500 3000
Temperature, K
Ther
mal
Con
duct
ivity
, W/m
-K
MATPRO Data used by MATPRORecent Data Updated Model
Figure 3.20 Original and modified model for Kr thermal conductivity (σ=0.000886)

3.19
0.00
0.01
0.01
0.02
0.02
0.03
0.03
0.04
0.04
0.05
0 500 1000 1500 2000 2500 3000
Temperature, K
Ther
mal
Con
duct
ivity
, W/m
-K
MATPRO Data used by MATPRORecent Data Updated Model
Figure 3.21 Original and modified model for Xe thermal conductivity (σ=0.000534)
0.00
0.20
0.40
0.60
0.80
1.00
1.20
0 500 1000 1500 2000 2500 3000
Temperature, K
Ther
mal
Con
duct
ivity
, W/m
-K
MATPRO Data used by MATPRORecent Data Updated Model
Figure 3.22 Original and modified model for H2 thermal conductivity (σ=0.0167)

3.20
0.00
0.02
0.04
0.06
0.08
0.10
0.12
0.14
0.16
0 500 1000 1500 2000 2500 3000
Temperature, K
Ther
mal
Con
duct
ivity
, W/m
-K
MATPRO Data used by MATPRORecent Data Updated Model
Figure 3.23 Original and modified model for N2 thermal conductivity (σ=0.000197)
3.6 Steam Conductivity The steam conductivity model in FRAPCON-3.3 is ksteam =1.76x10⁻⁴ + 5.87x10⁻⁵ T − 273.15( )+1.04x10⁻⁷ T − 273.15( )2 − 4.51x10⁻¹¹ T − 273.15( )3
Where: ksteam = the steam conductivity, W/m-K T = the gas temperature, K. The steam conductivity model employed in FRAPTRAN-1.3 for temperatures less than or equal to 973.15K is
ksteam = −2.8516x10⁻⁸ + 9.424x10⁻¹⁰T − 6.005x10⁻¹⁴ T 2( )pT
+ 1.009p2
T 2 T − 273.15( )4.2
− 8.4083x10⁻³ −1.19998x10⁻⁵T − 6.706x10⁻⁸T 2 − 4.51x10⁻¹¹T 3
Where: p = gas pressure, Pa. For temperatures above 973.15K, the model employed in FRAPTRAN-1.3 is

3.21
ksteam = 4.44x10⁻⁶T1.45 + 9.45x10⁻⁵ 2.1668x10⁻⁹ pT
⎛
⎝ ⎜
⎞
⎠ ⎟
1.3
The steam conductivity model in MATPRO is
( )( )
( ) ( ) ( )3112754
2.42
2214108
27310x51.427310x08.127310x87.5106.17
273009.110x005.610x424.910x8516.2
−−−+−+×+
−+−+−=
−−−−
−−−
TTT
TTp
TpTTksteam
for temperatures less than or equal to 973.15K, and
ksteam = 4.44x10⁻⁶T1.45 + 9.5x10⁻⁵ 2.1668x10⁻⁹ pT
⎛
⎝ ⎜
⎞
⎠ ⎟
1.3
for temperatures above 973.15 The models in FRAPCON-3.3, FRAPTRAN-1.3 and MATPRO were compared to the ASME adopted value of steam conductivity at 107 Pa. These comparisons are shown in Figure 3.24. It can be seen from this figure that the MATPRO model predicts the conductivity well, while the models in FRAPCON-3.3 and FRAPTRAN 1.3 do not. Because of this, the model described above was used for steam conductivity in both FRAPCON and FRAPTRAN.
-0.1200
-0.1000
-0.0800
-0.0600
-0.0400
-0.0200
0.0000
0.0200
0.0400
0.0600
0.0800
0.1000
0.1200
0.06 0.07 0.08 0.09 0.1 0.11 0.12Experimental Values (W/m-K)
ASME (1968)Hagrman et al. (1993)FRAPTRAN-1.3FRAPCON-3.3
Figure 3.24 Comparison of low temperature steam conductivity models from MATPRO,
FRAPTRAN-1.3, and FRAPCON-3.3 with adopted values of experimental data from ASME.

3.22
This updated model has been added to FRAPCON-3.4 and FRAPTRAN 1.4.
3.7 Cladding Irradiation Creep The data comparisons in Section 2.5.2.1 identified that the cladding creep model in FRAPCON-3.3 over-predicts the irradiation creep rate in PWR SRA cladding. In addition, this model is used for both SRA and RXA cladding, despite the observations of different creep behavior between the two types of cladding. A literature search was performed to select a model that provides a best-estimate prediction of cladding irradiation creep for both SRA and RXA cladding tubes. The model given by Limback and Andersson (Limback et al., 1996) was selected for cladding irradiation creep in FRAPCON-3.4. This model uses a thermal creep model described by Matsuo (1987) and an empirical irradiation creep rate with tuned model parameters that were fit to data set by Franklin et al.(1983). This model was modified by PNNL to use effective stress rather than hoop stress as an input so that the difference in creep behavior during tensile and compressive creep would be modeled correctly. Several of the fitting coefficients were consequently changed to accommodate this modification. In addition, a temperature dependent term was added to the formula for irradiation creep strain rate. This model has different parameters for SRA and RXA cladding types, and provides much more reasonable creep strains in the LWR range of temperature and cladding hoop stresses than the current model in FRAPCON-3.3. This model is described below. The steady state thermal and irradiation creep rates are given by:
⎟⎠⎞
⎜⎝⎛ −
⎟⎟⎠
⎞⎜⎜⎝
⎛=
RTQ
Ea
TEA
neffi
th expsinhσ
ε&
)(210 TfC C
effC
irr ⋅⋅⋅= σφε& Where
irrth εε && , - thermal and irradiation strain rate, respectively (in/in/hr) These rates are added together so:
irrthirrth εεε &&& +=+ The saturated primary hoop strain is given by:
( ) 05.2109.0 )35500tanh(20216.0 −++ ⋅−⋅= irrthirrth
sp εεε &&
The total thermal strain is given by: ( )( ) tt irrthirrth
spH ⋅+⋅⋅−−= ++ εεεε &&52exp1
In FRAPCON-3.4, strain rate is used. Taking the derivative with respect to time of the expression above gives:
( ) irrthirrthirrth
sp
H tt
+++ +⋅⋅−
⋅
⋅⋅= εε
εεε &&
&& 52exp
2
5221
21
Where: T – temperature (K) t – time (hours) σeff – effective stress, MPa φ – fast neutron flux, n/m²-s

3.23
Table 3.3 lists the parameters used in these equations for SRA and RXA cladding types
Table 3.3 Parameters for FRAPCON-3.4 creep equation for SRA and RXA cladding Parameter Units Values for SRA Cladding Values for RXA
Cladding A* K/MPa/hr 1.08E9* 5.47E8* E MPA 1.149E5-59.9*T ai MPa-1 650{1-0.56[1-exp(-1.4E-27*Φ1.3)]}
Φ = fast neutron fluence (n/cm²) n unitless 2.0 3.5 Q kJ/mole 201 R kJ/mol-K 0.008314 C0 (n/m²-s)-C1
MPa-C2 4.0985E-24 1.87473E-24
C1 unitless 0.85 C2 unitless 1.0 f(T)* unitless T<570K 0.7283
570<T<625K -7.0237+0.0136T T>625K 1.4763
0.7994 -3.18562+0.00699132T 1.1840
*Parameters changed from original Limback equation The effective stress in the cladding is found using the principal stresses at the midwall radius using the thick wall formula as follows:
( )
220
2
2222
i
iooiooii
r rrr
PPrrrPrP
−
−+−
=σ
( )
220
2
2222
i
iooiooii
t rrr
PPrrrPrP
−
−−−
=σ
220
22
i
ooiil rr
rPrP−−=σ
Where: Pi – inner pressure Po – outer pressure ri – inner radius ro – outer radius r – radius within tube σr – radial stress σt – tangential stress σl – longitudinal stress The effective stress, σeff, is then given by:
( ) ( ) ( )( )2225.0 lrrttleff σσσσσσσ −+−+−=

3.24
This equation has been added to FRAPCON-3.4 for the calculation of creep strain rate. The model predictions were compared to creep data from two PWR rods that were used in the original FRAPCON-3 model assessment (Lanning et al., 1997). The creep predictions using the original creep model in FRAPCON-3.3 and using the modified Limback creep model in FRAPCON-3.4 are shown in Figures 3.25 and 3.26. These data are taken from actual fuel rods at the end of each cycle. However, for these rods, no data was taken at the end of the first cycle. The linear decrease in hoop strain ends when the fuel and cladding come in contact and no further creepdown is possible. It can be seen from these figures that the new cladding creep model provides better prediction of creep than the original creep model in FRAPCON-3.3. Over the range of fluences in which data are available, the new model appears to predict these data well.
-1.2
-1
-0.8
-0.6
-0.4
-0.2
0
0 2E+25 4E+25 6E+25 8E+25 1E+26 1.2E+26
Rod Average Fluence, n/m²
Ave
rage
Hoo
p S
trai
n, %
FRAPCON-3.3 Data Updated Creep Model
Figure 3.25 Predicted and measured cladding creepdown using the original and new creep models from the 2nd and 3rd cycle rods in the AN0-2 PWR assembly, TSQ002

3.25
-1.2
-1
-0.8
-0.6
-0.4
-0.2
0
0 2E+25 4E+25 6E+25 8E+25 1E+26
Rod Average Fluence, n/m²
Aver
age
Hoop
Str
ain,
%
FRAPCON-3.3 Data Updated Creep Model
Figure 3.26 Predicted and measured cladding creepdown using the original and new creep models from the 3rd, 4th, and 5th cycle rods in the Oconee PWR assembly, 15309
Creep data was obtained from irradiated tubes in order to further validate the selected creep model. Data was found on irradiated SRA cladding tubes (Franklin, 1983, Soniak et al., 2002 and Gilbon et al., 2000) and on irradiated RXA cladding tubes (Franklin, 1983, Soniak et al., 2002, Gilbon et al., 2000, and Sontheimer et al., 1994). These data span a temperature range of 570K to 625K, an effective stress range of 40-130 MPa, and a fast neutron flux range of 1x10¹⁷ – 2x10¹⁸ n/m²-s that comes the range of LWR fuel rod operation. Figures 3.27 and 3.28 show the results of these predictions. It appears that the uncertainty in Figure 3.28 is increasing with increasing strain. It should be noted however, that the strain values in Figure 3.28 are significantly less than those in Figure 3.27. A relative standard error for the predictions is 14.5% for SRA cladding and 21.6% for RXA cladding. FRAPCON-3.4 will be modified to use the creep model described in this section.

3.26
0
0.005
0.01
0.015
0.02
0.025
0 0.005 0.01 0.015 0.02 0.025
Measured hoop strain, in/in
Pred
icte
d ho
op s
trai
n, in
/in
Franklin Soniak 350°C Soniak 320°C Gilbon Predicted=Measured
Figure 3.27 Predicted vs. measured cladding creepdown using the new creep model from creepdown data from irradiated SRA tubes
-0.002
0
0.002
0.004
0.006
0.008
-0.002 0 0.002 0.004 0.006 0.008
Measured hoop strain, in/in
Pred
icte
d ho
op s
train
, in/
in
Franklin Soniak 350°C Soniak 320°CGilbon BWR ROPE-1 IFA 585 BWRPredicted=Measured
Figure 3.28 Predicted vs. measured cladding creepdown using the new creep model from
creepdown data from irradiated RXA tubes

4.1
4.0 Sensitivity Analysis Material properties modeled in FRAPCON-3.3 include fuel thermal conductivity, fuel thermal expansion, cladding oxide thermal conductivity, cladding thermal conductivity, gas thermal conductivity, fission gas release, cladding corrosion, fuel swelling, thermal and irradiation creep of irradiated cladding, cladding yield strength, Young’s modulus of cladding, cladding axial growth, and cladding thermal expansion. By modeling material properties, important fuel rod performance parameters, such as rod internal gas pressure, peak fuel centerline temperature, and cladding permanent (i.e. plastic) hoop strain, can be predicted up to high burnup levels (65 GWd/MTU). These parameters are used for licensing analyses. Models incorporated in FRAPCON-3.3 are based on both physical and empirical relationships that are continuously compared and adapted to experimental data as it becomes available. Experimental data can exhibit scatter and may be scarce under certain conditions like high burnup or high temperature. Consequently, there is uncertainty in the derived models. In addition to model uncertainty, manufacturing and power history parameters are also sources for uncertainty that may influence the code output. Since fuel performance predictions generated by FRAPCON-3.3 are based on interdependent material response models, manufacturer metrics, and power histories, uncertainty does not propagate linearly to the code output. Nevertheless, the influence of each type of uncertainty can be evaluated by iteratively biasing individual parameters both positively and negatively and comparing the subsequent output with a baseline case. This has been the approach taken by fuel vendors in their fuel performance methodologies that have been approved by NRC. Individual parameters are readily categorized by the three types of uncertainty considered here. Another approach of sampling multiple uncertainties in a Monte Carlo approach could also be used and has been proposed by one fuel vendor (Arimescu, 2008). Prior to applying an approach such as this, it is necessary to know what uncertainties will have an impact on the outputs of interest so those uncertainties can be included in the sampling. In order to determine this a study similar to the study performed below would have to first be performed. Other researchers have done work to examine the sensitivity of various models and predictions in FRAPCON-3 and FRAPTRAN (Vallejo et al. 2004, del Barrio et al. 2006, del Barrio et al. 2007). These studies provided valuable insight into the sensitivity of these codes to changes in various parameters. This report will show the sensitivity of selected model uncertainties, manufacturing uncertainties, and power uncertainties on the code prediction of rod internal gas pressure, fuel centerline temperature, and cladding strain for sample BWR and PWR cases. It should be noted that the sensitivity to these parameters could change based on differences in power history or fuel rod design. The manufacturing uncertainties used in this report represent an average value of the tolerances given by fuel rod fabricators. Individual parameters influenced by manufacturing uncertainty include cladding inner diameter, cladding thickness, cladding roughness, pellet outer diameter, theoretical pellet density, pellet re-sinter density, pellet roughness, pellet dish diameter and depth, rod fill gas pressure, and rod plenum length. The model uncertainties used in this report are based on uncertainty in parameters used to fit the aforementioned material property models to experimental data as demonstrated in Section 2.0, which may significantly influence output values generated by FRAPCON-3.3. Finally, power uncertainty includes uncertainties associated with the measurement of steady state power and anticipated operational occurrences (AOOs), which typically result in brief power pulses above the steady state power output that last for varying lengths of time. Although these power transients are anticipated, the uncertainty

4.2
associated with their intensity and duration may influence the fuel performance predicted by FRAPCON-3.3 The purpose of this study is to evaluate the influence of manufacturing, model, and power uncertainties on fuel performance parameter outputs of interest generated by FRAPCON-3. Establishing the effects of these sources of uncertainty will facilitate more accurate comparisons between modeled and experimentally observed fuel performance. In addition, they will establish which uncertainties are important for inclusion in licensing analyses. This study was performed using the released version of FRAPCON-3.3 as discussed in Section 2.
4.1 Outputs of Interest Material response models incorporated in FRAPCON-3 enable three important fuel rod performance parameters of regulatory interest to be predicted. These output parameters include the rod internal gas pressure, peak fuel centerline temperature, and cladding permanent hoop strain. Each parameter is significant as the predicted value may indicate whether or not the fuel rod will exceed the specific acceptable fuel design limits under designated conditions for licensing analyses. The significance of each parameter is discussed in the following subsections.
4.1.1 Rod Internal Gas Pressure Rod internal gas pressure is predicted by FRAPCON-3 through models that account for the thermal expansion of the cladding and the fuel. Fission gas release from the fuel pellets is also considered in the rod internal pressure calculation. Rod internal pressure is a critical parameter in fuel rod performance because it contributes to the development of hoop strains endured by the cladding, which may lead to excessive pressure in the rod that could cause cladding lift off (pellet/cladding gap re-opening at high burnup), hydride reorientation (circumferential hydrides reorienting to radial hydrides that embrittle the cladding), and/or cladding failure.
4.1.2 Peak Fuel Centerline Temperature Peak fuel centerline temperature is a critical parameter predicted by FRAPCON-3. By modeling the conductivity of the fuel, gap, cladding, and corrosion layer, the fuel centerline temperature can be predicted. Low gap conductivity resulting from cladding lift off or excessive fission gas release results in significant increase in fuel centerline temperature. When the peak fuel centerline temperature predicted by FRAPCON-3 exceeds the melting temperature of the fuel, FRAPCON-3 will indicate that fuel failure has occurred based on NRC design criteria.
4.1.3 Cladding Permanent Hoop Strain Fuel rod cladding, which is typically composed of a zirconium-based alloy, surrounds the fuel and prevents fuel from entering the reactor coolant system. Should the cladding fail, fuel may be transported from the fuel rod to the reactor vessel contaminating the entire primary coolant loop with fissile material. Fuel rod cladding typically fails by cracking due to pellet-clad mechanical loads, or bursting due to gas pressure (preceded by ballooning) during a power transient or LOCA, respectively. In order for a cladding to balloon and eventually burst, a significant amount of plastic circumferential, or hoop, strain (i.e., εhoop) must manifest within the cladding. By predicting the hoop strain in the cladding, FRAPCON-3 can identify conditions that would be conducive for cladding failure. The standard review plan (Standard Review Plan Section 4.2,

4.3
2007) states that transient induced uniform deformation (elastic + plastic) should not exceed 1% strain.
4.1.4 Other Outputs of Interest Although the outputs listed above are significant fuel rod performance parameters, there are several other outputs of regulatory interest. Among these are the volume-average fuel temperature (i.e. stored energy), gap conductance, and the cladding hydrogen concentration. Hydrogen concentration is important for determining the cladding strain capability and propensity for failure. The significance of choosing rod internal pressure, peak fuel centerline temperature, and cladding permanent hoop strain as outputs of interest is that these are directly measured and generally representative of fuel rod performance.
4.2 Selection of Base Cases In order to evaluate the influence of the different types of uncertainty on the output of FRAPCON-3, a base case must be established for both PWR and BWR fuel performance calculations. The purpose of this section is to describe the fuel design parameters, power histories, and axial power profiles that are used as code input to define these base cases. The base cases employed in this study utilized a 17x17 PWR and a 10x10 BWR with typical design parameters required for FRAPCON-3 code input published in NUREG-1754 (O’Donnell et al, 2001) and are presented in Table 4.1.
Table 4.1 Typical fuel design parameters used for base case code input (NUREG-1754)
PWR BWRDescription of Design Parameter 17x17 10x10
Pitch (mm, in ) 12.6, 0.498 13.0, 0.510Cladding OD (mm, in ) 9.4, 0.370 10.0, 0.395
Cladding Thickness (mm, in) 0.610, 0.024 0.660, 0.026Cladding ID (mm, in ) 8.18, 0.322 8.68, 0.343
Gap Thickness (mm, in ) 0.084, 0.0033 0.089, 0.0035Fuel Pellet Diameter (mm, in ) 8.0, 0.315 8.5, 0.336
Plenum Spring Diameter (mm, in ) 8.0, 0.315 8.5, 0.336Pellet Length (mm, in ) 11.4, 0.45 11.4, 0.45
Dish Diameter (mm, in ) 4.01, 0.158 0, 0Dish Depth (mm, in ) 0.287, 0.0113 0, 0
Plenum Length (mm, in ) 254, 10 254, 10Turns in Plenum Spring 28 31
Plenum Spring Wire Diameter (mm, in ) 1.27, 0.05 1.27, 0.05Helium Fill Gas Pressure (MPa, psi ) 2.41, 350 0.69, 100
Active Fuel Length (m, in ) 3.66, 144 3.66, 144System Coolant Pressure (MPa, psi ) 15.5, 2250 7.14, 1035
Coolant Inlet Temperature (°C, °F ) 288, 550 277, 530Coolant Flow Rate (x106 kg/m2, x106 lb/ft2) 12.47, 2.55 5.13, 1.05
Enrichment (atom %) 4.5 4Pellet Density (% TD) 95 95
Limit on Pellet Density Increase (% TD) 0.9 0.9Fuel Surface Roughness (μm, in ) 2.0, 3x10⁻⁵ 2.0, 3x10⁻⁵
Cladding Surface Roughness (μm, in ) 0.5, 2x10⁻⁵ 0.5, 2x10⁻⁵
Cladding Material Zircaloy-4 Zircaloy-2Cold Work (%) 50 0

4.4
It is acknowledged that the fill gas pressure of 350 psi that was used for the PWR case is higher than the fill gas pressure for many modern rods (175 psi). A brief study was performed to confirm that relative differences caused by biasing other parameters were the same for both initial fill gas pressures. In addition to selecting prototypical fuel design parameters for the desired base cases, the power histories and axial power profiles were also designated specific input values. Both the PWR and BWR cases were evaluated up to a rod average burnup of 65 GWd/MTU. Although different factors, such as core management, may introduce uncertainty, the power histories and axial power profiles presented here are assumed to be representative and employed for comparison. In order to evaluate the influence of power uncertainties at various levels of burnup, individual conditions were examined in which AOOs were implemented at 30, 40, and 50 GWd/MTU. At the time of the AOO, the output power was increased 50% for a period of 4hrs. This AOO was selected as the more limiting AOO for temperature, pressure and strain than an overpower of 25% that is held for 12 hrs. Power histories for the PWR and BWR base cases are presented in Figure 4.1 without an AOO. A symmetrical power profile was selected for both the PWR and BWR base cases and is presented in Table 4.2. A modern BWR power profile is more peaked than this profile, but a brief study confirmed that the relative effects of the uncertainties would be the same by running several of the cases discussed in the following section using a more peaked axial power profile.
0
2
4
6
8
10
12
0 10 20 30 40 50 60 70Rod Average Burnup (GWd/MTU)
Rod
Ave
rage
Pow
er (k
W/ft
) PWRBWR
Figure 4.1 Power histories for PWR and BWR base cases without AOO

4.5
Table 4.2 Axial power profile used for PWR and BWR base case input
4.3 Effects of Manufacturing Uncertainties Manufacturing uncertainties stem from the range of tolerances used in fuel rod fabrication. Variation in cladding and pellet metrics, such as cladding thickness and pellet diameter, can influence geometric relationships between the cladding and the fuel like the pellet-cladding gap. Consequently, the end of life rod internal pressure, peak fuel centerline temperature, and cladding permanent hoop strain (εhoop) predictions generated by FRAPCON-3 may be influenced by manufacturing uncertainties. The purpose of this section is to present and discuss comparisons between base cases and cases biased by manufacturing uncertainty. Tolerances presented in this section were not chosen arbitrarily, and are considered typical of industry. Comparisons for PWR and BWR cases are presented in Tables 4.3 and 4.4, respectively, and discussed in the following subsections. If tolerances are greater than those assumed in these tables, this may change the conclusions from this sample calculation on sensitivity. Also, this sample calculation only examined individual changes in manufacturing tolerances rather than the combined effects from all sources. Combined effects of manufacturing uncertainties will have a more significant impact on fuel performance.
Axial AxialElevation Power
(mm) Profile0 0.63
305 0.83610 1.03914 1.081219 1.082438 1.082743 1.083048 1.033353 0.833660 0.63

4.6
Tab
le 4
.3
Com
paris
on b
etw
een
unbi
ased
out
put a
nd o
utpu
t bia
sed
by m
anuf
actu
ring
unce
rtain
ty fo
r a 1
7x17
PW
R
Cla
ddin
g In
ner D
iam
eter
C
ladd
ing
Thic
knes
s
Cla
ddin
g R
ough
ness
Con
ditio
nR
espo
nses
Unb
iase
d+
0.04
mm
- 0.0
4 m
m+
0.04
mm
- 0.0
4 m
m+
0.3
mm
- 0.3
mm
No
AOO
Rod
Inte
rnal
Pre
ssur
e (M
Pa)
12.1
612
.81
11.5
712
.17
12.0
712
.24
12.0
2Pe
ak F
uel C
ente
rline
T (°
C)
1590
1586
1594
1591
1588
1594
1586
30R
od In
tern
al P
ress
ure
(MPa
)13
.25
13.8
312
.69
13.3
413
.24
13.2
913
.16
GW
d/M
TUPe
ak F
uel C
ente
rline
T (°
C)
2319
2314
2325
2321
2317
2325
2314
Cla
ddin
g Pe
rman
ent ε
hoop
(%)
0.43
540.
4343
0.43
650.
4323
0.43
840.
4378
0.43
25
40R
od In
tern
al P
ress
ure
(MPa
)14
.13
14.7
513
.44
14.1
514
.13
14.1
914
.00
GW
d/M
TUPe
ak F
uel C
ente
rline
T (°
C)
2079
2074
2084
2080
2077
2085
2073
Cla
ddin
g Pe
rman
ent ε
hoop
(%)
0.35
750.
3570
0.35
790.
3550
0.36
040.
3598
0.35
52
50R
od In
tern
al P
ress
ure
(MPa
)14
.20
14.7
113
.61
14.3
214
.17
14.3
314
.19
GW
d/M
TUPe
ak F
uel C
ente
rline
T (°
C)
1788
1783
1793
1789
1787
1793
1782
Cla
ddin
g Pe
rman
ent ε
hoop
(%)
0.26
720.
2661
0.26
800.
2656
0.26
920.
2693
0.26
55
P
elle
t Out
er D
iam
eter
P
elle
t Den
sity
Pel
let R
e-Si
nter
Den
sity
Con
ditio
nR
espo
nses
Unb
iase
d+
0.01
3 m
m- 0
.013
mm
+ 0.
91%
TD
- 0.9
1% T
D+
0.4%
TD
- 0.4
% T
DN
o AO
OR
od In
tern
al P
ress
ure
(MPa
)12
.16
12.0
212
.35
11.9
312
.28
11.8
212
.42
Peak
Fue
l Cen
terli
ne T
(°C
)15
9015
9015
8915
7116
0915
8115
99
30R
od In
tern
al P
ress
ure
(MPa
)13
.25
13.0
313
.48
13.0
213
.48
12.9
813
.49
GW
d/M
TUPe
ak F
uel C
ente
rline
T (°
C)
2319
2320
2318
2295
2344
2308
2331
Cla
ddin
g Pe
rman
ent ε
hoop
(%)
0.43
540.
4365
0.43
360.
4285
0.44
250.
4318
0.43
84
40R
od In
tern
al P
ress
ure
(MPa
)14
.13
13.9
214
.29
13.9
314
.14
13.7
914
.36
GW
d/M
TUPe
ak F
uel C
ente
rline
T (°
C)
2079
2080
2077
2056
2101
2068
2090
Cla
ddin
g Pe
rman
ent ε
hoop
(%)
0.35
750.
3587
0.35
620.
3517
0.36
340.
3546
0.36
05
50R
od In
tern
al P
ress
ure
(MPa
)14
.20
14.0
114
.45
14.0
514
.25
13.9
614
.52
GW
d/M
TUPe
ak F
uel C
ente
rline
T (°
C)
1788
1789
1787
1768
1807
1778
1798
Cla
ddin
g Pe
rman
ent ε
hoop
(%)
0.26
720.
2682
0.26
580.
2617
0.27
260.
2646
0.27
00

4.7
Tab
le 4
.3 (c
ontin
ued)
. Com
paris
on b
etw
een
unbi
ased
out
put a
nd o
utpu
t bia
sed
by m
anuf
actu
ring
unce
rtain
ty fo
r a 1
7x17
PW
R
Pelle
t Rou
ghne
ss P
elle
t Dis
h D
iam
eter
& D
epth
Rod
Fill
Pre
ssur
eC
ondi
tion
Res
pons
esU
nbia
sed
+ 0.
5 m
m- 0
.5 m
m+
0.5
&0.
05 m
m- 0
.5 &
0.05
mm
+ 69
kP
a- 6
9 kP
aN
o A
OO
Rod
Inte
rnal
Pre
ssur
e (M
Pa)
12.1
612
.26
12.0
312
.00
12.3
512
.30
12.0
3P
eak
Fuel
Cen
terli
ne T
(°C
)15
9015
9715
8315
8915
9015
8915
90
30R
od In
tern
al P
ress
ure
(MP
a)13
.25
13.3
213
.08
13.3
113
.47
13.4
413
.06
GW
d/M
TUP
eak
Fuel
Cen
terli
ne T
(°C
)23
1923
2923
0923
1823
2023
1823
20C
ladd
ing
Per
man
ent ε
hoop
(%)
0.43
540.
4397
0.43
020.
4322
0.43
560.
4345
0.43
56
40R
od In
tern
al P
ress
ure
(MP
a)14
.13
14.2
013
.90
14.0
714
.36
14.3
113
.95
GW
d/M
TUP
eak
Fuel
Cen
terli
ne T
(°C
)20
7920
8920
6820
7820
7920
7820
80C
ladd
ing
Per
man
ent ε
hoop
(%)
0.35
750.
3613
0.35
350.
3512
0.35
780.
3573
0.35
79
50R
od In
tern
al P
ress
ure
(MP
a)14
.20
14.3
314
.03
14.0
814
.39
14.3
914
.04
GW
d/M
TUP
eak
Fuel
Cen
terli
ne T
(°C
)17
8817
9717
7817
8717
8817
8717
89C
ladd
ing
Per
man
ent ε
hoop
(%)
0.26
720.
2711
0.26
340.
2589
0.26
730.
2669
0.26
76
R
od P
lenu
m L
engt
hC
ondi
tion
Res
pons
esU
nbia
sed
+1 P
elle
t Len
gth
-1 P
elle
t Len
gth
No
AO
OR
od In
tern
al P
ress
ure
(MP
a)12
.16
11.9
612
.38
Pea
k Fu
el C
ente
rline
T (°
C)
1590
1589
1590
30R
od In
tern
al P
ress
ure
(MP
a)13
.25
12.9
213
.59
GW
d/M
TUP
eak
Fuel
Cen
terli
ne T
(°C
)23
1923
1923
20C
ladd
ing
Per
man
ent ε
hoop
(%)
0.43
540.
4349
0.43
53
40R
od In
tern
al P
ress
ure
(MP
a)14
.13
13.7
914
.41
GW
d/M
TUP
eak
Fuel
Cen
terli
ne T
(°C
)20
7920
7820
79C
ladd
ing
Per
man
ent ε
hoop
(%)
0.35
750.
3573
0.35
77
50R
od In
tern
al P
ress
ure
(MP
a)14
.20
13.9
614
.58
GW
d/M
TUP
eak
Fuel
Cen
terli
ne T
(°C
)17
8817
8817
88C
ladd
ing
Per
man
ent ε
hoop
(%)
0.26
720.
2671
0.26
76

4.8
Tab
le 4
.4
Com
paris
on b
etw
een
unbi
ased
out
put a
nd o
utpu
t bia
sed
by m
anuf
actu
ring
unce
rtain
ty fo
r a 1
0x10
BW
R
Cla
ddin
g In
ner D
iam
eter
Cla
ddin
g Th
ickn
ess
C
ladd
ing
Rou
ghne
ssC
ondi
tion
Res
pons
esU
nbia
sed
+ 0.
04 m
m- 0
.04
mm
+ 0.
04 m
m- 0
.04
mm
+ 0.
3 m
m- 0
.3 m
mN
o AO
OR
od In
tern
al P
ress
ure
(MP
a)5.
375.
564.
995.
375.
375.
365.
41Pe
ak F
uel C
ente
rline
T (°
C)
1234
1266
1237
1235
1232
1237
1230
30R
od In
tern
al P
ress
ure
(MP
a)5.
305.
634.
945.
315.
295.
305.
13G
Wd/
MTU
Peak
Fue
l Cen
terli
ne T
(°C
)18
6818
6418
7418
7018
6618
7618
60C
ladd
ing
Perm
anen
t εho
op (%
)0.
3180
0.19
020.
3253
0.31
580.
3202
0.32
310.
3134
40R
od In
tern
al P
ress
ure
(MP
a)6.
566.
846.
286.
576.
566.
696.
56G
Wd/
MTU
Peak
Fue
l Cen
terli
ne T
(°C
)17
2917
2317
3517
3017
2717
3817
21C
ladd
ing
Perm
anen
t εho
op (%
)0.
2683
0.25
990.
2733
0.26
600.
2714
0.27
360.
2643
50R
od In
tern
al P
ress
ure
(MP
a)6.
737.
006.
466.
746.
736.
896.
66G
Wd/
MTU
Peak
Fue
l Cen
terli
ne T
(°C
)15
3015
2515
3515
3215
2815
3815
22C
ladd
ing
Perm
anen
t εho
op (%
)0.
2067
0.19
970.
2121
0.20
510.
2083
0.21
090.
2020
P
elle
t Out
er D
iam
eter
P
elle
t Den
sity
Pel
let R
e-Si
nter
Den
sity
Con
ditio
nR
espo
nses
Unb
iase
d+
0.01
3 m
m- 0
.013
mm
+ 0.
91%
TD
- 0.9
1% T
D+
0.4%
TD
- 0.4
% T
DN
o AO
OR
od In
tern
al P
ress
ure
(MP
a)5.
375.
245.
465.
184.
835.
285.
40Pe
ak F
uel C
ente
rline
T (°
C)
1234
1234
1233
1218
1248
1231
1240
30R
od In
tern
al P
ress
ure
(MP
a)5.
305.
185.
415.
135.
455.
235.
35G
Wd/
MTU
Peak
Fue
l Cen
terli
ne T
(°C
)18
6818
6918
6718
4318
9318
5718
79C
ladd
ing
Perm
anen
t εho
op (%
)0.
3180
0.32
130.
3102
0.30
970.
3263
0.30
680.
3234
40R
od In
tern
al P
ress
ure
(MP
a)6.
566.
436.
676.
596.
636.
476.
62G
Wd/
MTU
Peak
Fue
l Cen
terli
ne T
(°C
)17
2917
3017
2817
0517
5017
1917
38C
ladd
ing
Perm
anen
t εho
op (%
)0.
2683
0.27
080.
2653
0.26
140.
2743
0.26
340.
2726
50R
od In
tern
al P
ress
ure
(MP
a)6.
736.
596.
846.
596.
786.
646.
94G
Wd/
MTU
Peak
Fue
l Cen
terli
ne T
(°C
)15
3015
3215
2815
1115
4815
2115
39C
ladd
ing
Perm
anen
t εho
op (%
)0.
2067
0.20
940.
2031
0.20
090.
2113
0.20
160.
2113

4.9
Tab
le 4
.4 (c
ontin
ued)
. Com
paris
on b
etw
een
unbi
ased
out
put a
nd o
utpu
t bia
sed
by m
anuf
actu
ring
unce
rtain
ty fo
r a 1
0x10
BW
R
Pel
let R
ough
ness
Pel
let D
ish
Dia
met
er &
Dep
th
R
od F
ill P
ress
ure
Con
ditio
nR
espo
nses
Unb
iase
d+
0.5
mm
- 0.5
mm
+ 0.
5 &
0.0
5 m
m- 0
.5 &
0.0
5 m
m+
69 k
Pa
- 69
kPa
No
AOO
Rod
Inte
rnal
Pre
ssur
e (M
Pa)
5.37
5.11
5.45
NA
NA
5.67
5.25
Pea
k Fu
el C
ente
rline
T (°
C)
1234
1240
1227
NA
NA
1230
1235
30R
od In
tern
al P
ress
ure
(MPa
)5.
305.
305.
12N
AN
A5.
365.
08G
Wd/
MTU
Pea
k Fu
el C
ente
rline
T (°
C)
1868
1884
1852
NA
NA
1862
1872
Cla
ddin
g P
erm
anen
t εho
op (%
)0.
3180
0.32
700.
3077
NA
NA
0.31
340.
3197
40R
od In
tern
al P
ress
ure
(MPa
)6.
566.
696.
56N
AN
A6.
806.
46G
Wd/
MTU
Pea
k Fu
el C
ente
rline
T (°
C)
1729
1744
1711
NA
NA
1725
1734
Cla
ddin
g P
erm
anen
t εho
op (%
)0.
2683
0.27
590.
2585
NA
NA
0.26
640.
2704
50R
od In
tern
al P
ress
ure
(MPa
)6.
736.
866.
51N
AN
A6.
826.
63G
Wd/
MTU
Pea
k Fu
el C
ente
rline
T (°
C)
1530
1543
1515
NA
NA
1525
1534
Cla
ddin
g P
erm
anen
t εho
op (%
)0.
2067
0.21
360.
1979
NA
NA
0.20
240.
2089
R
od P
lenu
m L
engt
hC
ondi
tion
Res
pons
esU
nbia
sed
+1 P
elle
t Len
gth
-1 P
elle
t Len
gth
No
AO
OR
od In
tern
al P
ress
ure
(MP
a)5.
375.
185.
62P
eak
Fuel
Cen
terli
ne T
(°C
)12
3412
3312
34
30R
od In
tern
al P
ress
ure
(MP
a)5.
305.
115.
51G
Wd/
MTU
Pea
k Fu
el C
ente
rline
T (°
C)
1868
1867
1869
Cla
ddin
g P
erm
anen
t εho
op (%
)0.
3180
0.31
740.
3194
40R
od In
tern
al P
ress
ure
(MP
a)6.
566.
316.
84G
Wd/
MTU
Pea
k Fu
el C
ente
rline
T (°
C)
1729
1728
1730
Cla
ddin
g P
erm
anen
t εho
op (%
)0.
2683
0.26
760.
2693
50R
od In
tern
al P
ress
ure
(MP
a)6.
736.
626.
95G
Wd/
MTU
Pea
k Fu
el C
ente
rline
T (°
C)
1530
1530
1530
Cla
ddin
g P
erm
anen
t εho
op (%
)0.
2067
0.20
690.
2059

4.10
4.3.1 Cladding Inner Diameter PWR Rod internal pressure, peak fuel centerline temperature, and cladding permanent hoop strain values for an unbiased 17X17 PWR base case and cases biased by adjusting cladding inner diameter by the manufacturing tolerance of ±0.04mm are presented in Table 4.3 for comparison. The average variance in rod internal pressure is 4.5% and ranges from 3.60% at the positively biased 50 GWd/MTU condition to 5.40% at the positively biased no AOO condition. Peak fuel centerline temperature and cladding permanent hoop strain values varied from the base case by less than 0.3% and 0.4%, respectively. Based on these observations, it appears that manufacturing uncertainty in cladding inner diameter has the potential to influence the rod internal pressure generated by FRAPCON-3. A tendency for rod internal pressure to increase and decrease with cladding inner diameter was observed. However, peak fuel centerline temperatures and cladding permanent hoop strains varied inversely with cladding inner diameter. BWR Outputs of interest for the unbiased 10X10 BWR base case and cases biased by adjusting cladding inner diameter by the manufacturing tolerance of ±0.04mm are presented in Table 4.4 for comparison. The average variance in rod internal pressure is 5.0% and ranges from 3.64% to 7.00% under the positively and negatively biased no AOO conditions, respectively. Although the other peak fuel centerline temperatures varied by less than 0.4%, the positively biased peak fuel centerline temperature with no AOO exceeded the base case by 2.6%. In addition, an outlying variation in cladding permanent hoop strain of 40.2% was observed at the positively biased 30 GWd/MTU condition. This is likely due to the gap not being closed in this case at the time of the AOO. With exception of this case, the average variance of the permanent cladding hoop strain is 2.7% and ranges from 1.86% under the negatively biased 40 GWd/MTU condition to 3.39% under the positively biased 50 GWd/MTU condition. It appears that manufacturing uncertainty in cladding inner diameter has no significant influence on rod internal pressure and no effect on peak fuel centerline temperature or an increase in cladding permanent hoop strain predictions. A tendency for rod internal pressure to increase and decrease with cladding inner diameter was observed. However, peak fuel centerline temperatures and cladding permanent hoop strains typically varied inversely with cladding inner diameter.
4.3.2 Cladding Thickness PWR Rod internal pressure, peak fuel centerline temperature, and cladding permanent hoop strain values for an unbiased 17X17 PWR base case and cases biased by adjusting cladding thickness by the manufacturing tolerance of ±0.04mm are presented in Table 4.3 for comparison. The maximum variance for each of the three outputs of interest is less than 1.0% from the base case, which indicates that manufacturing uncertainty in cladding thickness does not significantly affect outputs of interest generated FRAPCON-3. Although the variance is negligible, a tendency for rod internal pressure and peak fuel centerline temperature to increase and decrease with cladding thickness was observed. However, cladding permanent hoop strain values tended to vary inversely with cladding thickness.

4.11
BWR Outputs of interest for the unbiased 10X10 BWR base case and cases biased by adjusting cladding thickness by the manufacturing tolerance of ±0.04mm are presented in Table 4.4 for comparison. The average variance each of these outputs of interest is less than 1% from the base BWR case. It appears that manufacturing uncertainty in cladding thickness has no influence on outputs of interest from FRAPCON-3. Although the differences were negligible, a tendency for rod internal pressure and peak fuel centerline temperature to increase and decrease with cladding thickness was observed. However, cladding permanent hoop strain values tended to vary inversely with cladding thickness.
4.3.3 Cladding Roughness PWR Rod internal pressure, peak fuel centerline temperature, and cladding permanent hoop strain values for an unbiased 17X17 PWR base case and cases biased by adjusting cladding roughness by the manufacturing tolerance of ±0.3μm are presented in Table 4.3 for comparison. The maximum variance for each of the three outputs of interest is less than 1.2% from the base PWR case, which indicates that manufacturing uncertainty in cladding roughness does not have an effect on outputs of interest from FRAPCON-3. Although the variance was negligible, a tendency for rod internal pressure, peak fuel centerline temperature, and cladding permanent hoop strain to increase and decrease with cladding roughness was observed. BWR Outputs of interest for the unbiased 10X10 BWR base case and cases biased by adjusting cladding roughness by the manufacturing tolerance of ±0.3μm are presented in Table 4.4 for comparison. Rod internal pressure values vary from the base case by 1.2% on average and range from 0.02% to 3.24% at the positively and negatively biased 30 GWd/MTU conditions, respectively. Peak fuel centerline temperatures vary from the base case by less than 1%. Cladding permanent hoop strain exhibits an average variance of 1.8%, ranging from 1.45% at the negatively biased 30 GWd/MTU condition to 2.27% at the negatively biased 50 GWd/MTU conditions. Based on these observations, it appears that manufacturing uncertainty in cladding roughness has no influence on the outputs of interest generated by FRAPCON-3. Although the variance was negligible, a tendency for rod internal pressure, peak fuel centerline temperature, and cladding permanent hoop strain to increase and decrease with cladding roughness was observed.
4.3.4 Pellet Outer Diameter PWR Rod internal pressure, peak fuel centerline temperature, and cladding permanent hoop strain values for an unbiased 17X17 PWR base case and cases biased by adjusting pellet outer diameter by the manufacturing tolerance of ±0.013mm are presented in Table 4.3 for comparison. The average variance for rod internal pressure is 1.5% and ranges from 1.11% at the negatively biased 40 GWd/MTU condition to 1.80% at the negatively biased 50 GWd/MTU condition. Peak fuel centerline temperature and permanent cladding hoop strain values typically differ from the base case by less than 0.5%. Based on these observations, it appears that manufacturing uncertainty in pellet outer diameter has no effect on the outputs of interest from FRAPCON-3. Although the variance was small, a tendency for rod internal pressure to vary inversely with pellet outer

4.12
diameter was observed. However, a tendency for peak fuel centerline temperature and cladding permanent hoop strain to increase and decrease with pellet outer diameter was also observed. BWR Outputs of interest for the unbiased 10X10 BWR base case and cases biased by adjusting pellet outer diameter by the manufacturing tolerance of ±0.013mm are presented in Table 4.4 for comparison. Rod internal pressure values vary from the base case by 2.0% on average. This variance ranges from 1.66% at the negatively biased 50 GWd/MTU condition to 2.29% at the positively biased no AOO and 30 GWd/MTU conditions. Fuel centerline temperatures differ from the base case by less than 0.1% on average. The average variance between cladding permanent hoop strains predicted from the base case and cases biased by uncertainty in pellet outer diameter is 1.4%. This variance ranges from 0.93% under the positively biased 40 GWd/MTU conditions to 2.45% under the negatively influenced 30 GWd/MTU condition. Based on these observations, it appears that manufacturing uncertainty in the pellet outer diameter has no effect on the outputs of interest generated by FRAPCON-3. Although the variance was small, a tendency for rod internal pressures to vary inversely with increasing and decreasing pellet outer diameter was observed. However, a tendency for peak fuel centerline temperature and cladding permanent hoop strain to increase and decrease with pellet outer diameter was also observed.
4.3.5 Theoretical Pellet Density PWR Rod internal pressure, peak fuel centerline temperature, and cladding permanent hoop strain values for an unbiased 17X17 PWR base case and cases biased by adjusting theoretical pellet density (TD) by the manufacturing tolerance of ±0.91%TD are presented in Table 4.3 for comparison. The average variance for rod internal pressure is 1.2% and ranges from 0.05% at the negatively biased 40 GWd/MTU condition to 1.91% at the positively biased no AOO condition. Peak fuel centerline temperature varies from the base case by 1.1% on average and ranges from 1.04% at the positively biased 30 GWd/MTU condition to 1.23% at the negatively biased no AOO condition. Cladding permanent hoop strain values vary by 1.8% on average and ranges from 1.58% at the positively biased 30 GWd/MTU condition to 2.06% at the positively biased 50 GWd/MTU condition. Based on these observations, it appears that manufacturing uncertainty in theoretical pellet density has no influence on the outputs of interest generated by FRAPCON-3. Although the variation was insignificant, a tendency for rod internal pressure, peak fuel centerline temperature, and cladding permanent hoop strain to vary inversely with pellet theoretical density was observed. BWR Outputs of interest for the unbiased 10X10 BWR base case and cases biased by adjusting theoretical pellet density (TD) by the manufacturing tolerance of ±0.91% are presented in Table 4.4 for comparison. Rod internal pressure values vary from the base case by 2.0% on average excluding an outlier at the negatively biased no AOO condition, which varied by 10%. This variance is most likely due to less gas release in this case, which resulted in less pressure. Variance in rod internal pressure ranged from 0.47% in the positively biased 40 GWd/MTU condition to 3.43% in the positively biased no AOO condition. Peak fuel centerline temperature varied by 1.3% on average and ranged from 1.17% at the negatively biased no AOO condition to 1.39% at the positively biased 40 GWd/MTU condition. Cladding permanent hoop strain varied by 2.5% on average and ranged from 2.23% to 2.81% at the negatively and positively biased 50

4.13
GWd/MTU conditions, respectively. Overall, it appears that manufacturing uncertainty in theoretical pellet density has low to moderate influence on outputs of interest generated by FRAPCON-3. A tendency for rod internal pressure, peak fuel centerline temperature, and cladding permanent hoop strain to vary inversely with pellet theoretical density was observed.
4.3.6 Pellet Re-Sinter Density PWR Rod internal pressure, peak fuel centerline temperature, and cladding permanent hoop strain values for an unbiased 17X17 PWR base case and cases biased by adjusting pellet re-sinter density by the manufacturing tolerance of ±0.4% TD are presented in Table 4.3 for comparison. In-reactor densification can have significant consequences for fuel performance and is described in greater detail in U.S. NRC Regulatory Guide 1.126 (U.S. NRC, 1978). The average variance for rod internal pressure is 2.1% and ranges from 1.62% at the negatively biased 40 GWd/MTU condition to 2.78% at the positively biased no AOO condition. Peak fuel centerline temperature and cladding hoop strain values differ from the base case by less than 1%. Based on this, it appears that manufacturing uncertainty in pellet re-sinter density has a small influence on outputs of interest generated by FRAPCON-3. Although the variation was small, a tendency for rod internal pressure, peak fuel centerline temperature, and cladding permanent hoop strain to vary inversely with pellet re-sinter density was observed. BWR Outputs of interest for the unbiased 10X10 BWR base case and cases biased by adjusting pellet re-sinter density by the manufacturing tolerance of ±0.4% TD are presented in Table 4.4 for comparison. In-reactor densification can have significant consequences for fuel performance and is described in greater detail in U.S. NRC Regulatory Guide 1.126. Rod internal pressure values vary from the base case by 1.4% on average and range from 0.68% in the negatively biased no AOO condition to 3.23% in the negatively biased 50 GWd/MTU condition. Peak fuel centerline temperatures differ from the base case by 0.6% or less. Cladding permanent hoop strain exhibited an average variance of 2.2% ranging from 1.60% in the negatively biased 40 GWd/MTU condition to 3.52% in the positively biased 30 GWd/MTU condition. Based on this, it appears that manufacturing uncertainty in pellet re-sinter density has a small influence on outputs of interest generated by FRAPON-3. Although the variation was small, a tendency for rod internal pressure, peak fuel centerline temperature, and cladding permanent hoop strain to vary inversely with pellet re-sinter density was observed.
4.3.7 Pellet Roughness PWR Rod internal pressure, peak fuel centerline temperature, and cladding permanent hoop strain values for an unbiased 17X17 PWR base case and cases biased by adjusting pellet roughness by the manufacturing tolerance of ±0.5μm are presented in Table 4.3 for comparison. The average variances in rod internal pressure, peak fuel centerline temperature, and permanent cladding values are 1.0, 0.47, and 1.2%, respectively. The maximum variance detected for any value was 1.69% for rod internal pressure at the negatively biased 40 GWd/MTU condition. Based on this, it appears that manufacturing uncertainty in pellet roughness has no influence on FRAPCON-3 output. Although the variation was insignificant, a tendency for rod internal pressure, peak fuel centerline temperature, and cladding permanent hoop strain to increase and decrease with pellet roughness was observed.

4.14
BWR Outputs of interest for the unbiased 10X10 BWR base case and cases biased by adjusting pellet roughness by the manufacturing tolerance of ±0.5μm are presented in Table 4.4 for comparison. Rod internal pressure values vary from the base case by 2.1% on average and range from 0.08% at the negatively biased 40 GWd/MTU conditions to 4.78% at the positively biased no AOO condition. Peak fuel centerline temperatures differ by less than 1.00% from the base. Cladding permanent hoop strain exhibited an average variance of 3.4% ranging from 2.83% at the positively biased 30 GWd/MTU and 40 GWd/MTU conditions to 4.26% at the negatively biased 50 GWd/MTU condition. Based on this, it appears that manufacturing uncertainty in pellet roughness has a low to moderated influence on FRAPCON-3 output. A tendency for rod internal pressure, peak fuel centerline temperature, and cladding permanent hoop strain to increase and decrease with pellet roughness was observed.
4.3.8 Pellet Dish Diameter and Depth PWR Rod internal pressure, peak fuel centerline temperature, and cladding permanent hoop strain values for an unbiased 17X17 PWR base case and cases biased by adjusting pellet dish diameter and depth by the manufacturing tolerances of ±0.5 and 0.05mm, respectively, are presented in Table 4.3 for comparison. Rod internal pressure varied by 1.2% on average and ranged from 0.41% at the positively biased 30 GWd/MTU condition to 1.62% at the negatively biased no AOO condition. Peak fuel centerline temperature values vary at most by 0.05% at the positively biased 50 GWd/MTU condition. Cladding permanent hoop strain values vary, on average, by 1.0% and range from 0.04% to 3.11% at the negative and positive 50 GWd/MTU conditions, respectively. These results indicate that manufacturing uncertainty in pellet dish diameter and depth has no influence on the outputs of interested generated by FRAPCON-3. Although the variation was insignificant, a tendency for rod internal pressure, peak fuel centerline temperature, and cladding permanent hoop strain to vary inversely with pellet dish diameter and depth was observed. BWR The fuel design used in this study were not dished on-end. Therefore, the influence of manufacturing uncertainty in pellet dish diameter and depth were not evaluated for the BWR base case. For dished BWR pellets, the effect of variation in the dish dimnsions are expected to be similar to the PWR case.
4.3.9 Rod Fill Pressure PWR Rod internal pressure, peak fuel centerline temperature, and cladding permanent hoop strain values for an unbiased 17X17 PWR base case and cases biased by adjusting rod fill pressure by the manufacturing tolerances of ± 10psi (≈ 0.07MPa) are presented in Table 4.3 for comparison. Rod internal pressure varies by 1.3% on average and ranges from 1.06% in the negatively biased no AAO condition to 1.44% in the negatively biased 30 GWd/MTU condition. Peak fuel centerline temperatures and cladding hoop strain values vary by less than 0.5%. Overall, it appears that manufacturing uncertainty in rod fill pressure has no influence on rod the outputs of interest generated by FRAPCON-3. Although the variation was insignificant, a tendency for rod

4.15
internal pressure to increase and decrease with rod fill pressure was observed. However a tendency for peak fuel centerline temperatures and cladding permanent hoop strains to vary inversely with rod fill pressure was also observed. BWR Outputs of interest for the unbiased 10X10 BWR base case and cases biased by adjusting rod fill pressure by the manufacturing tolerance of ± 10psi (≈ 0.07MPa) are presented in Table 4.4 for comparison. Rod internal pressure values vary from the base case by 2.7% on average and range from 1.13% at the positively biased 30 GWd/MTU condition to 5.71% in the positively biased no AOO condition. Fuel centerline temperatures, on the other hand, varied by 0.33% or less. Cladding permanent strain variances averaged 1.1% and range from 0.53% at the negatively biased 30 GWd/MTU condition to 2.08% at the positively biased 50 GWd/MTU condition. Based on these observations, it appears that manufacturing uncertainty in rod fill pressure has low to moderate influence on the outputs of interest generated by FRAPCON-3. A tendency for rod internal pressure to increase and decrease with rod fill pressure was observed. However a tendency for peak fuel centerline temperatures and cladding permanent hoop strains to vary inversely with rod fill pressure was also observed.
4.3.10 Rod Plenum Length PWR Rod internal pressure, peak fuel centerline temperature, and cladding permanent hoop strain values for an unbiased 17X17 PWR base case and cases biased by adjusting rod plenum length by the manufacturing tolerances of ± 1 pellet length are presented in Table 4.3 for comparison. Rod internal pressure varies by 2.2% on average and ranges from 1.59% in the positively biased no AOO condition to 2.69% in the negatively biased 50 GWd/MTU condition. Peak fuel centerline temperatures and cladding hoop strain values vary by less than 0.5%. Overall, it appears that manufacturing uncertainty in rod plenum length has no influence on outputs of interest generated by FRAPCON-3. Although variances were insignificant, a tendency for rod internal pressure, peak fuel centerline temperature, and cladding permanent hoop strain to vary inversely with rod plenum length was observed. BWR Outputs of interest for the unbiased 10X10 BWR base case and cases biased by adjusting rod plenum length by the manufacturing tolerance of ± 1 pellet length are presented in Table 4.4 for comparison. Rod internal pressure values vary from the base case by 3.6% on average and range from 1.55% in the positively biased 50GWd/MTU condition to 4.64% in the negatively biased no AOO condition. Peak fuel centerline temperatures and cladding permanent hoop strains, on the other hand, varied by 0.44% or less. Based on these observations, it appears that uncertainty in rod plenum length has low to moderate influence on the outputs of interest generated by FRAPCON-3. A tendency for rod internal pressure, peak fuel centerline temperature, and cladding permanent hoop strain to vary inversely with rod plenum length was observed.
4.4 Effects of Model Uncertainties Model uncertainties stem from uncertainties in the models used to simulate the material response of the fuel rod in service. Uncertainty in model fitting parameters resulting from scatter in experimental data may significantly influence fuel rod performance predictions generated by FRAPCON-3. The purpose of this section is to present and discuss comparisons between base

4.16
cases and cases biased by model uncertainty. Comparisons for PWR and BWR cases are presented in Tables 4.5 and 4.6, respectively, and discussed in the following subsections.

4.17
Tab
le 4
.5
Com
paris
on b
etw
een
unbi
ased
out
put a
nd o
utpu
t bia
sed
by m
odel
unc
erta
intie
s for
a 1
7x17
PW
R
Fue
l The
rmal
Con
duct
ivity
Fue
l The
rmal
Exp
ansi
on
Oxi
de C
ondu
ctiv
ityC
ondi
tion
Res
pons
esU
nbia
sed
+ 0.
5 W
/m-K
- 0.5
W/m
-K* 1
.15
/ 1.1
5+
0.5
W/m
-K- 0
.5 W
/m-K
No
AOO
Rod
Inte
rnal
Pre
ssur
e (M
Pa)
12.1
69.
7718
.46
12.1
912
.09
12.0
312
.76
Peak
Fue
l Cen
terli
ne T
(°C
)15
9013
4520
1215
9015
9015
8416
01
30R
od In
tern
al P
ress
ure
(MPa
)13
.25
9.77
18.3
413
.26
13.2
113
.14
13.6
5G
Wd/
MTU
Peak
Fue
l Cen
terli
ne T
(°C
)23
1919
5227
7223
1823
2023
1323
33C
ladd
ing
Per
man
ent ε
hoop
(%)
0.43
540.
3169
0.55
310.
5163
0.36
450.
4343
0.43
81
40R
od In
tern
al P
ress
ure
(MPa
)14
.13
10.5
618
.66
14.0
114
.05
13.9
614
.65
GW
d/M
TUPe
ak F
uel C
ente
rline
T (°
C)
2079
1731
2549
2078
2079
2068
2106
Cla
ddin
g P
erm
anen
t εho
op (%
)0.
3575
0.24
630.
4938
0.42
770.
2966
0.35
510.
3633
50R
od In
tern
al P
ress
ure
(MPa
)14
.20
10.4
018
.96
14.0
814
.21
14.0
614
.80
GW
d/M
TUPe
ak F
uel C
ente
rline
T (°
C)
1788
1484
2260
1787
1788
1771
1852
Cla
ddin
g P
erm
anen
t εho
op (%
)0.
2672
0.16
930.
4145
0.32
390.
2165
0.26
430.
2885
C
ladd
ing
Con
duct
ivity
Gas
Con
duct
ance
Fis
sion
Gas
Rel
ease
Con
ditio
nR
espo
nses
Unb
iase
d+
5 W
/m-K
- 3 W
/m-K
+ 0.
02 W
/m-K
- 0.0
2 W
/m-K
* 2/ 2
No
AOO
Rod
Inte
rnal
Pre
ssur
e (M
Pa)
12.1
611
.81
12.1
912
.02
12.2
614
.17
10.6
0Pe
ak F
uel C
ente
rline
T (°
C)
1590
1573
1604
1588
1591
1599
1583
30R
od In
tern
al P
ress
ure
(MPa
)13
.25
12.9
613
.56
13.2
413
.29
14.9
311
.86
GW
d/M
TUPe
ak F
uel C
ente
rline
T (°
C)
2319
2301
2336
2317
2321
2324
2315
Cla
ddin
g P
erm
anen
t εho
op (%
)0.
4354
0.42
830.
4400
0.43
450.
4362
0.43
210.
4366
40R
od In
tern
al P
ress
ure
(MPa
)14
.13
13.8
414
.28
14.1
114
.13
15.8
312
.76
GW
d/M
TUPe
ak F
uel C
ente
rline
T (°
C)
2079
2063
2093
2077
2081
2085
2073
Cla
ddin
g P
erm
anen
t εho
op (%
)0.
3575
0.35
040.
3606
0.35
710.
3582
0.35
560.
3583
50R
od In
tern
al P
ress
ure
(MPa
)14
.20
13.8
214
.38
14.2
214
.28
16.1
412
.72
GW
d/M
TUPe
ak F
uel C
ente
rline
T (°
C)
1788
1774
1800
1786
1790
1795
1781
Cla
ddin
g P
erm
anen
t εho
op (%
)0.
2672
0.26
050.
2702
0.26
680.
2678
0.26
710.
2659

4.18
Tab
le 4
.5 (c
ontin
ued)
Com
paris
on b
etw
een
unbi
ased
out
put a
nd o
utpu
t bia
sed
by m
odel
unc
erta
intie
s for
a 1
7x17
PW
R
Cla
ddin
g C
orro
sion
F
uel S
wel
ling
Irra
diat
ion
Cre
epC
ondi
tion
Res
pons
esU
nbia
sed
* 1.
4/ 1
.4+
0.3
- 0.3
* 1.
1/ 1
.4N
o AO
OR
od In
tern
al P
ress
ure
(MPa
)12
.16
12.7
312
.03
12.1
912
.16
12.1
612
.31
Peak
Fue
l Cen
terli
ne T
(°C
)15
9016
0115
8315
8915
9015
9015
90
30R
od In
tern
al P
ress
ure
(MPa
)13
.25
13.3
613
.11
13.3
512
.89
13.2
213
.39
GW
d/M
TUPe
ak F
uel C
ente
rline
T (°
C)
2319
2333
2312
2319
2319
2319
2319
Cla
ddin
g Pe
rman
ent ε
hoop
(%)
0.43
540.
4390
0.43
360.
4379
0.43
310.
4355
0.43
52
40R
od In
tern
al P
ress
ure
(MPa
)14
.13
14.6
413
.92
14.1
613
.46
14.0
714
.27
GW
d/M
TUPe
ak F
uel C
ente
rline
T (°
C)
2079
2108
2066
2079
2079
2079
2079
Cla
ddin
g Pe
rman
ent ε
hoop
(%)
0.35
750.
3651
0.35
420.
3626
0.35
060.
3575
0.35
75
50R
od In
tern
al P
ress
ure
(MPa
)14
.20
14.8
013
.76
14.2
713
.73
14.1
914
.30
GW
d/M
TUPe
ak F
uel C
ente
rline
T (°
C)
1788
1848
1768
1787
1788
1788
1788
Cla
ddin
g Pe
rman
ent ε
hoop
(%)
0.26
720.
2920
0.26
290.
2760
0.25
410.
2672
0.26
68
Yi
eld
Stre
ngth
You
ng's
Mod
ulus
A
xial
Gro
wth
Con
ditio
nR
espo
nses
Unb
iase
d*
1.3
/ 1.1
+ 5
MP
a- 1
0 M
Pa
* 1.
5/ 1
.5N
o AO
OR
od In
tern
al P
ress
ure
(MPa
)12
.16
12.1
612
.16
12.1
612
.16
11.5
312
.61
Peak
Fue
l Cen
terli
ne T
(°C
)15
9015
9015
9015
9015
9015
9015
90
30R
od In
tern
al P
ress
ure
(MPa
)13
.25
13.2
113
.25
13.2
513
.25
12.4
313
.75
GW
d/M
TUPe
ak F
uel C
ente
rline
T (°
C)
2319
2317
2320
2319
2319
2319
2319
Cla
ddin
g Pe
rman
ent ε
hoop
(%)
0.43
540.
4322
0.43
640.
4354
0.43
540.
4352
0.43
50
40R
od In
tern
al P
ress
ure
(MPa
)14
.13
14.1
414
.13
14.1
314
.13
13.3
214
.58
GW
d/M
TUPe
ak F
uel C
ente
rline
T (°
C)
2079
2077
2079
2079
2079
2079
2078
Cla
ddin
g Pe
rman
ent ε
hoop
(%)
0.35
750.
3542
0.35
870.
3575
0.35
750.
3574
0.35
74
50R
od In
tern
al P
ress
ure
(MPa
)14
.20
14.2
014
.20
14.2
014
.20
13.5
414
.76
GW
d/M
TUPe
ak F
uel C
ente
rline
T (°
C)
1788
1786
1788
1788
1788
1788
1787
Cla
ddin
g Pe
rman
ent ε
hoop
(%)
0.26
720.
2642
0.26
830.
2672
0.26
720.
2676
0.26
69

4.19
Tab
le 4
.5 (c
ontin
ued)
Com
paris
on b
etw
een
unbi
ased
out
put a
nd o
utpu
t bia
sed
by m
odel
unc
erta
intie
s for
a 1
7x17
PW
R
Cla
ddin
g Th
erm
al E
xpan
sion
Con
ditio
nR
espo
nses
Unb
iase
d*
1.3
/ 1.
3N
o A
OO
Rod
Inte
rnal
Pre
ssur
e (M
Pa)
12.1
612
.11
12.1
8Pe
ak F
uel C
ente
rline
T (°
C)
1590
1590
1590
30R
od In
tern
al P
ress
ure
(MPa
)13
.25
13.2
113
.27
GW
d/M
TUPe
ak F
uel C
ente
rline
T (°
C)
2319
2319
2319
Cla
ddin
g Pe
rman
ent ε
hoop
(%)
0.43
540.
4315
0.43
83
40R
od In
tern
al P
ress
ure
(MPa
)14
.13
14.0
614
.15
GW
d/M
TUPe
ak F
uel C
ente
rline
T (°
C)
2079
2079
2079
Cla
ddin
g Pe
rman
ent ε
hoop
(%)
0.35
750.
3532
0.36
07
50R
od In
tern
al P
ress
ure
(MPa
)14
.20
14.1
314
.22
GW
d/M
TUPe
ak F
uel C
ente
rline
T (°
C)
1788
1788
1788
Cla
ddin
g Pe
rman
ent ε
hoop
(%)
0.26
720.
2620
0.27
11
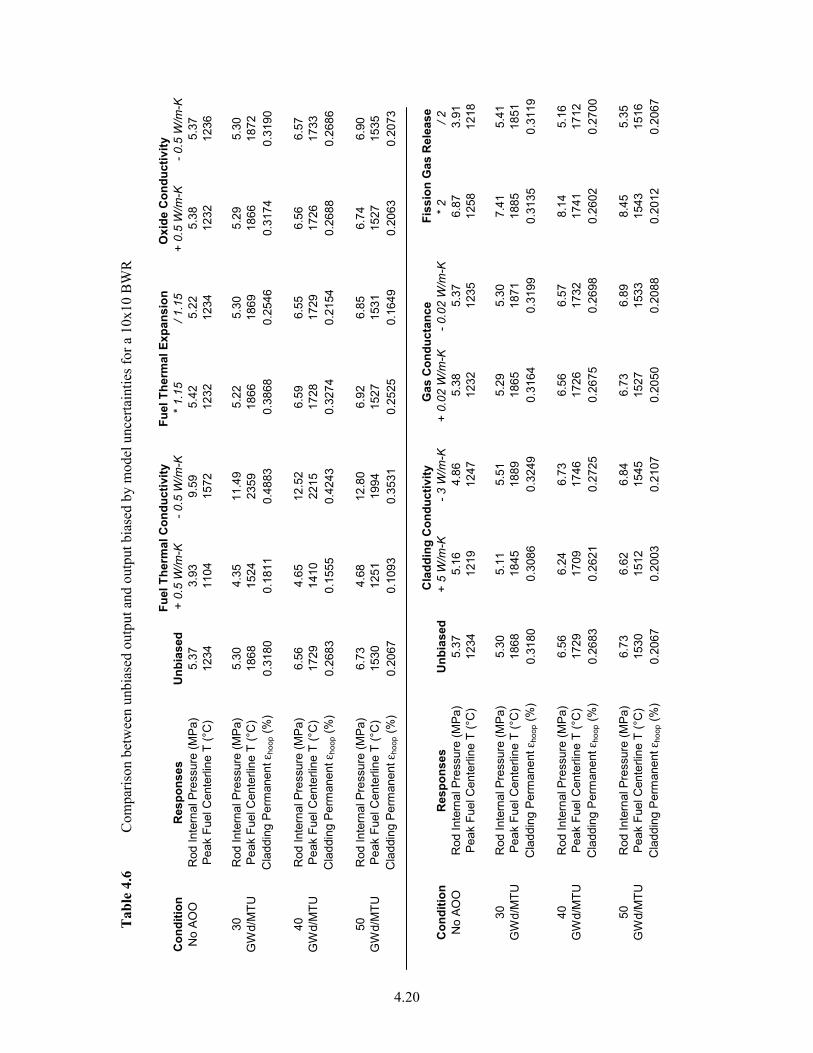
4.20
Tab
le 4
.6
Com
paris
on b
etw
een
unbi
ased
out
put a
nd o
utpu
t bia
sed
by m
odel
unc
erta
intie
s for
a 1
0x10
BW
R
Fue
l The
rmal
Con
duct
ivity
F
uel T
herm
al E
xpan
sion
O
xide
Con
duct
ivity
Con
ditio
nR
espo
nses
Unb
iase
d+
0.5
W/m
-K- 0
.5 W
/m-K
* 1.1
5/ 1
.15
+ 0.
5 W
/m-K
- 0.5
W/m
-KN
o AO
OR
od In
tern
al P
ress
ure
(MPa
)5.
373.
939.
595.
425.
225.
385.
37Pe
ak F
uel C
ente
rline
T (°
C)
1234
1104
1572
1232
1234
1232
1236
30R
od In
tern
al P
ress
ure
(MPa
)5.
304.
3511
.49
5.22
5.30
5.29
5.30
GW
d/M
TUPe
ak F
uel C
ente
rline
T (°
C)
1868
1524
2359
1866
1869
1866
1872
Cla
ddin
g P
erm
anen
t εho
op (%
)0.
3180
0.18
110.
4883
0.38
680.
2546
0.31
740.
3190
40R
od In
tern
al P
ress
ure
(MPa
)6.
564.
6512
.52
6.59
6.55
6.56
6.57
GW
d/M
TUPe
ak F
uel C
ente
rline
T (°
C)
1729
1410
2215
1728
1729
1726
1733
Cla
ddin
g P
erm
anen
t εho
op (%
)0.
2683
0.15
550.
4243
0.32
740.
2154
0.26
880.
2686
50R
od In
tern
al P
ress
ure
(MPa
)6.
734.
6812
.80
6.92
6.85
6.74
6.90
GW
d/M
TUPe
ak F
uel C
ente
rline
T (°
C)
1530
1251
1994
1527
1531
1527
1535
Cla
ddin
g P
erm
anen
t εho
op (%
)0.
2067
0.10
930.
3531
0.25
250.
1649
0.20
630.
2073
C
ladd
ing
Con
duct
ivity
Gas
Con
duct
ance
Fis
sion
Gas
Rel
ease
Con
ditio
nR
espo
nses
Unb
iase
d+
5 W
/m-K
- 3 W
/m-K
+ 0.
02 W
/m-K
- 0.0
2 W
/m-K
* 2/ 2
No
AOO
Rod
Inte
rnal
Pre
ssur
e (M
Pa)
5.37
5.16
4.86
5.38
5.37
6.87
3.91
Peak
Fue
l Cen
terli
ne T
(°C
)12
3412
1912
4712
3212
3512
5812
18
30R
od In
tern
al P
ress
ure
(MPa
)5.
305.
115.
515.
295.
307.
415.
41G
Wd/
MTU
Peak
Fue
l Cen
terli
ne T
(°C
)18
6818
4518
8918
6518
7118
8518
51C
ladd
ing
Per
man
ent ε
hoop
(%)
0.31
800.
3086
0.32
490.
3164
0.31
990.
3135
0.31
19
40R
od In
tern
al P
ress
ure
(MPa
)6.
566.
246.
736.
566.
578.
145.
16G
Wd/
MTU
Peak
Fue
l Cen
terli
ne T
(°C
)17
2917
0917
4617
2617
3217
4117
12C
ladd
ing
Per
man
ent ε
hoop
(%)
0.26
830.
2621
0.27
250.
2675
0.26
980.
2602
0.27
00
50R
od In
tern
al P
ress
ure
(MPa
)6.
736.
626.
846.
736.
898.
455.
35G
Wd/
MTU
Peak
Fue
l Cen
terli
ne T
(°C
)15
3015
1215
4515
2715
3315
4315
16C
ladd
ing
Per
man
ent ε
hoop
(%)
0.20
670.
2003
0.21
070.
2050
0.20
880.
2012
0.20
67

4.21
Tab
le 4
.6 (c
ontin
ued)
Com
paris
on b
etw
een
unbi
ased
out
put a
nd o
utpu
t bia
sed
by m
odel
unc
erta
intie
s for
a 1
0x10
BW
R
Cla
ddin
g C
orro
sion
Fuel
Sw
ellin
g
Ir
radi
atio
n C
reep
Con
ditio
nR
espo
nses
Unb
iase
d*1
.4/1
.4+
0.3
- 0.3
* 1.
1/ 1
.4N
o AO
OR
od In
tern
al P
ress
ure
(MP
a)5.
375.
375.
385.
454.
915.
355.
40Pe
ak F
uel C
ente
rline
T (°
C)
1234
1237
1231
1233
1235
1234
1234
30R
od In
tern
al P
ress
ure
(MP
a)5.
305.
305.
295.
285.
125.
295.
35G
Wd/
MTU
Peak
Fue
l Cen
terli
ne T
(°C
)18
6818
7318
6518
6718
6918
6818
68C
ladd
ing
Perm
anen
t εho
op (%
)0.
3180
0.31
930.
3172
0.32
640.
2643
0.31
870.
3124
40R
od In
tern
al P
ress
ure
(MP
a)6.
566.
576.
566.
606.
326.
546.
62G
Wd/
MTU
Peak
Fue
l Cen
terli
ne T
(°C
)17
2917
3417
2517
2817
2917
2917
29C
ladd
ing
Perm
anen
t εho
op (%
)0.
2683
0.26
900.
2685
0.28
190.
2545
0.26
880.
2658
50R
od In
tern
al P
ress
ure
(MP
a)6.
736.
906.
736.
936.
606.
716.
78G
Wd/
MTU
Peak
Fue
l Cen
terli
ne T
(°C
)15
3015
3615
2615
2715
3115
3015
31C
ladd
ing
Perm
anen
t εho
op (%
)0.
2067
0.20
760.
2061
0.22
380.
1880
0.20
720.
2042
Yi
eld
Stre
ngth
You
ng's
Mod
ulus
A
xial
Gro
wth
Con
ditio
nR
espo
nses
Unb
iase
d*
1.3
/ 1.1
+ 5
MP
a- 1
0 M
Pa
* 1.
5/ 1
.5N
o AO
OR
od In
tern
al P
ress
ure
(MP
a)5.
375.
375.
375.
375.
375.
175.
52Pe
ak F
uel C
ente
rline
T (°
C)
1234
1234
1234
1234
1234
1234
1234
30R
od In
tern
al P
ress
ure
(MP
a)5.
305.
215.
305.
305.
305.
115.
43G
Wd/
MTU
Peak
Fue
l Cen
terli
ne T
(°C
)18
6818
6518
6918
6818
6818
6818
68C
ladd
ing
Perm
anen
t εho
op (%
)0.
3180
0.31
260.
3199
0.31
800.
3180
0.31
810.
3181
40R
od In
tern
al P
ress
ure
(MP
a)6.
566.
566.
566.
566.
566.
326.
73G
Wd/
MTU
Peak
Fue
l Cen
terli
ne T
(°C
)17
2917
2517
3017
2917
2917
2917
29C
ladd
ing
Perm
anen
t εho
op (%
)0.
2683
0.26
790.
2703
0.26
830.
2683
0.26
820.
2691
50R
od In
tern
al P
ress
ure
(MP
a)6.
736.
656.
736.
736.
736.
646.
91G
Wd/
MTU
Peak
Fue
l Cen
terli
ne T
(°C
)15
3015
2015
3215
3015
3015
3115
29C
ladd
ing
Perm
anen
t εho
op (%
)0.
2067
0.19
420.
2091
0.20
670.
2067
0.20
730.
2063

4.22
Tab
le 4
.6 (c
ontin
ued)
Com
paris
on b
etw
een
unbi
ased
out
put a
nd o
utpu
t bia
sed
by m
odel
unc
erta
intie
s for
a 1
0x10
BW
R
Cla
ddin
g Th
erm
al E
xpan
sion
Con
ditio
nR
espo
nses
Unb
iase
d*1
.3 /1
.3N
o A
OO
Rod
Inte
rnal
Pre
ssur
e (M
Pa)
5.37
5.34
5.39
Peak
Fue
l Cen
terli
ne T
(°C
)12
3412
3412
34
30R
od In
tern
al P
ress
ure
(MP
a)5.
305.
305.
29G
Wd/
MTU
Peak
Fue
l Cen
terli
ne T
(°C
)18
6818
6818
68C
ladd
ing
Perm
anen
t εho
op (%
)0.
3180
0.31
230.
3212
40R
od In
tern
al P
ress
ure
(MP
a)6.
566.
566.
55G
Wd/
MTU
Peak
Fue
l Cen
terli
ne T
(°C
)17
2917
2917
29C
ladd
ing
Perm
anen
t εho
op (%
)0.
2683
0.26
530.
2706
50R
od In
tern
al P
ress
ure
(MP
a)6.
736.
716.
65G
Wd/
MTU
Peak
Fue
l Cen
terli
ne T
(°C
)15
3015
3115
30C
ladd
ing
Perm
anen
t εho
op (%
)0.
2067
0.20
390.
2079

4.23
4.4.1 Fuel Thermal Conductivity The fuel thermal conductivity model was biased by ±0.5 W/m-K, which bounds most of the experimental data below 4.7 W/m-K that is in the temperature range if interest (T>400°C) presented in Figure 4.2.
0
1
2
3
4
5
6
7
8
9
0 3 6 9
Measured Thermal Conductivity, W/m-K
Pred
icte
d Th
erm
al C
ondu
ctiv
ity,
W/m
-K
Unirradiated Data Irradiated Data Lower Bound Upper Bound
Figure 4.2 Predicted and measured thermal conductivity data with ±0.5 W/m-K as upper and lower bounds
PWR Rod internal pressure, peak fuel centerline temperature, and cladding permanent hoop strain values for an unbiased 17X17 PWR base case and cases biased by adjusting the fuel thermal conductivity model by ± 0.5 W/m-K are presented in Table 4.5 for comparison. Rod internal pressure varies by 31.7% on average and ranges from 19.66% to 51.83% at the positively and negatively biased no AOO conditions, respectively. Peak fuel centerline temperatures vary by 20.0% on average and range from 15.37% at the positively biased no AOO condition to 26.59% at the negatively biased no AOO condition. Cladding permanent hoop strain values averaged 35.9% and ranged from 27.03% at the negatively biased 30 GWd/MTU condition to 55.13% at the negatively biased 50 GWd/MTU condition. Based on these observations, it is clear that model uncertainty in the fuel thermal conductivity model significantly influences the outputs of interest generated by FRAPCON-3. A trend for rod internal pressure, peak fuel centerline temperature, and cladding permanent hoop strain values to vary inversely with thermal conductivity was observed. BWR Outputs of interest for the unbiased 10X10 BWR base case and cases biased by adjusting fuel thermal conductivity model by ± 0.5 W/m-K are presented in Table 4.6 for comparison. Rod internal pressure values vary from the base case by 60.1% on average and range from 17.91% to
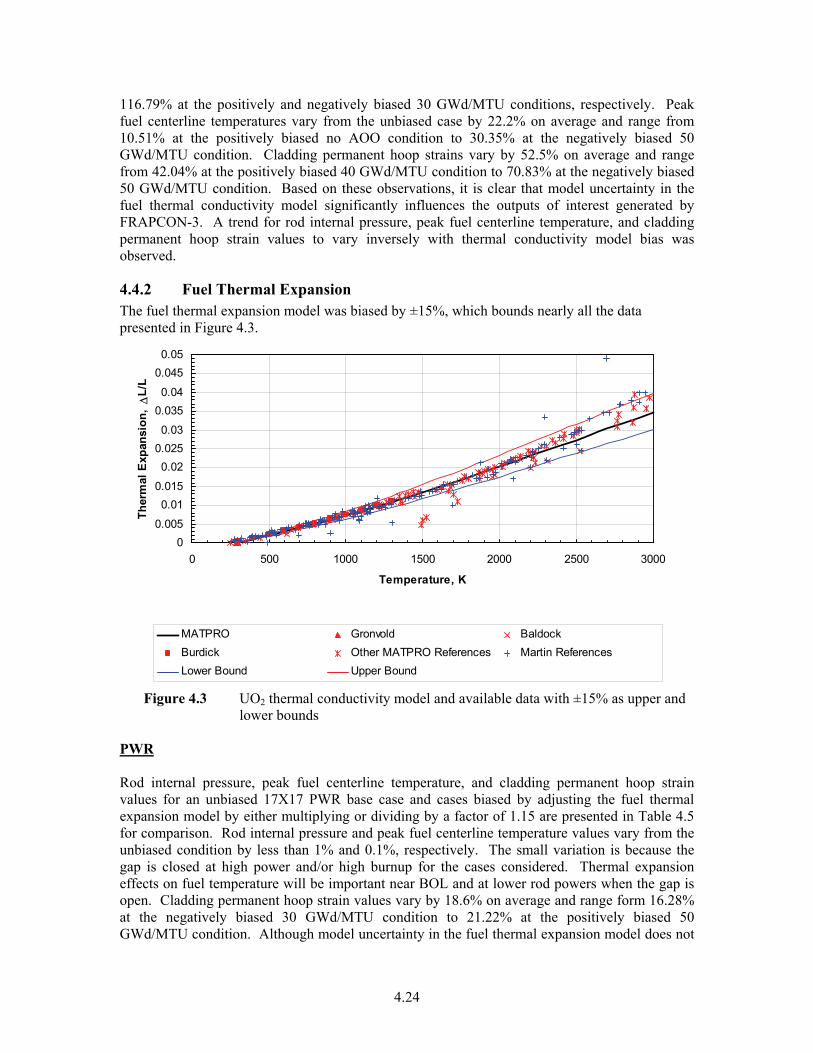
4.24
116.79% at the positively and negatively biased 30 GWd/MTU conditions, respectively. Peak fuel centerline temperatures vary from the unbiased case by 22.2% on average and range from 10.51% at the positively biased no AOO condition to 30.35% at the negatively biased 50 GWd/MTU condition. Cladding permanent hoop strains vary by 52.5% on average and range from 42.04% at the positively biased 40 GWd/MTU condition to 70.83% at the negatively biased 50 GWd/MTU condition. Based on these observations, it is clear that model uncertainty in the fuel thermal conductivity model significantly influences the outputs of interest generated by FRAPCON-3. A trend for rod internal pressure, peak fuel centerline temperature, and cladding permanent hoop strain values to vary inversely with thermal conductivity model bias was observed.
4.4.2 Fuel Thermal Expansion The fuel thermal expansion model was biased by ±15%, which bounds nearly all the data presented in Figure 4.3.
00.005
0.010.015
0.020.0250.03
0.0350.04
0.0450.05
0 500 1000 1500 2000 2500 3000
Temperature, K
Ther
mal
Exp
ansi
on,
ΔL/
L
MATPRO Gronvold BaldockBurdick Other MATPRO References Martin ReferencesLower Bound Upper Bound
Figure 4.3 UO2 thermal conductivity model and available data with ±15% as upper and
lower bounds PWR Rod internal pressure, peak fuel centerline temperature, and cladding permanent hoop strain values for an unbiased 17X17 PWR base case and cases biased by adjusting the fuel thermal expansion model by either multiplying or dividing by a factor of 1.15 are presented in Table 4.5 for comparison. Rod internal pressure and peak fuel centerline temperature values vary from the unbiased condition by less than 1% and 0.1%, respectively. The small variation is because the gap is closed at high power and/or high burnup for the cases considered. Thermal expansion effects on fuel temperature will be important near BOL and at lower rod powers when the gap is open. Cladding permanent hoop strain values vary by 18.6% on average and range form 16.28% at the negatively biased 30 GWd/MTU condition to 21.22% at the positively biased 50 GWd/MTU condition. Although model uncertainty in the fuel thermal expansion model does not

4.25
appear to influence rod internal pressure or peak fuel centerline temperature at the burnups and rod powers considered, it does appear to affect the cladding permanent hoop stress values predicted by FRAPCON-3. Since the gap was closed, it is difficult to determine the quantitative influence of fuel thermal expansion model uncertainty on rod internal pressure and peak fuel centerline temperature when the gap is open near BOL. However, a trend for cladding permanent hoop strain to increase and decrease with the fuel thermal expansion model was observed. BWR Outputs of interest for the unbiased 10X10 BWR base case and cases biased by adjusting fuel thermal expansion model by either multiplying or dividing by a factor of 1.15 are presented in Table 4.6 for comparison. Rod internal pressure and peak fuel centerline temperature values vary by less than 2.81 and 0.2% from the base case, respectively. The small variation is because the gap is closed at high power and/or high burnup for the cases considered. Cladding permanent hoop strain values vary from the base case by 21.0% on average and range from 19.72% at the negatively biased 40 GWd/MTU case to 22.16% at the positively biased 50 GWd/MTU condition. Although uncertainty in fuel thermal expansion model does not appear to influence rod internal pressure or peak fuel centerline temperature, it does appear to significantly influence the cladding permanent hoop stress values predicted by FRAPCON-3. Since the gap was closed, it is difficult to determine the quantitative influence of fuel thermal expansion model uncertainty on rod internal pressure and peak fuel centerline temperature when the gap is open near BOL. However, a trend for cladding permanent hoop strain to increase and decrease with the fuel thermal expansion model was observed.
4.4.3 Cladding Oxide Conductivity The cladding oxide conductivity model was biased by ±0.5 W/m-K, which bound the experimental data presented in Figure 4.4.
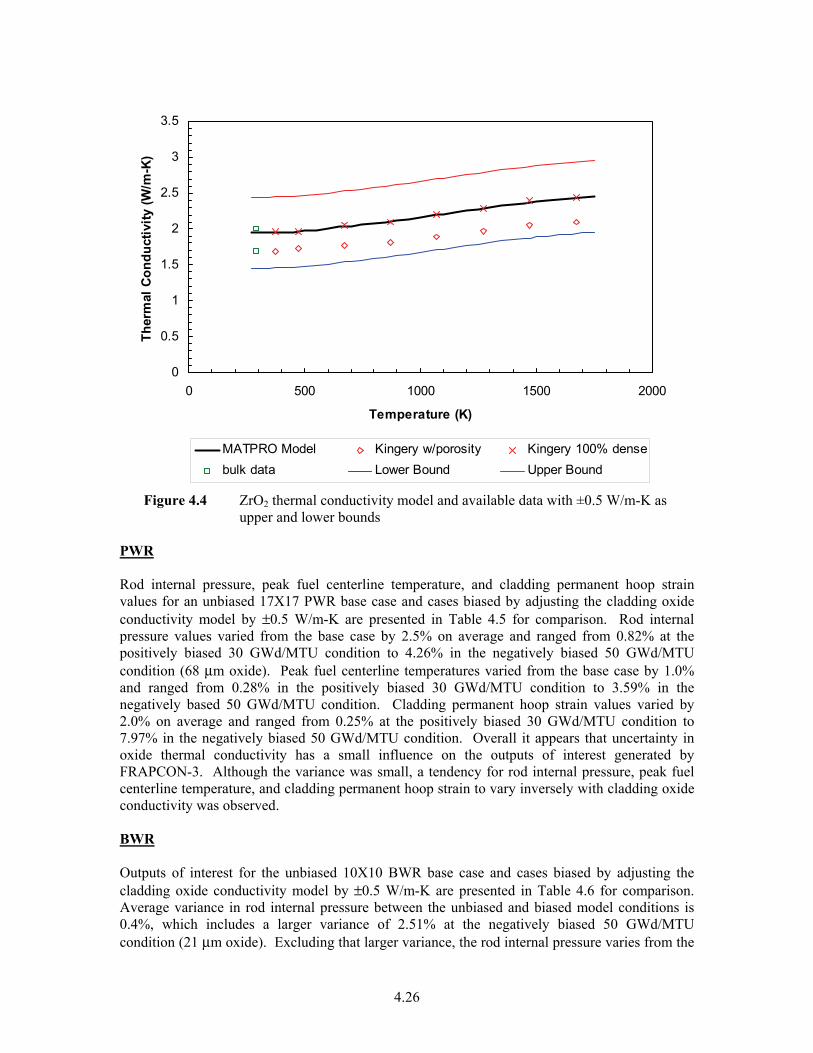
4.26
0
0.5
1
1.5
2
2.5
3
3.5
0 500 1000 1500 2000
Temperature (K)
Ther
mal
Con
duct
ivity
(W/m
-K)
MATPRO Model Kingery w/porosity Kingery 100% densebulk data Lower Bound Upper Bound
Figure 4.4 ZrO2 thermal conductivity model and available data with ±0.5 W/m-K as
upper and lower bounds PWR Rod internal pressure, peak fuel centerline temperature, and cladding permanent hoop strain values for an unbiased 17X17 PWR base case and cases biased by adjusting the cladding oxide conductivity model by ±0.5 W/m-K are presented in Table 4.5 for comparison. Rod internal pressure values varied from the base case by 2.5% on average and ranged from 0.82% at the positively biased 30 GWd/MTU condition to 4.26% in the negatively biased 50 GWd/MTU condition (68 μm oxide). Peak fuel centerline temperatures varied from the base case by 1.0% and ranged from 0.28% in the positively biased 30 GWd/MTU condition to 3.59% in the negatively based 50 GWd/MTU condition. Cladding permanent hoop strain values varied by 2.0% on average and ranged from 0.25% at the positively biased 30 GWd/MTU condition to 7.97% in the negatively biased 50 GWd/MTU condition. Overall it appears that uncertainty in oxide thermal conductivity has a small influence on the outputs of interest generated by FRAPCON-3. Although the variance was small, a tendency for rod internal pressure, peak fuel centerline temperature, and cladding permanent hoop strain to vary inversely with cladding oxide conductivity was observed. BWR Outputs of interest for the unbiased 10X10 BWR base case and cases biased by adjusting the cladding oxide conductivity model by ±0.5 W/m-K are presented in Table 4.6 for comparison. Average variance in rod internal pressure between the unbiased and biased model conditions is 0.4%, which includes a larger variance of 2.51% at the negatively biased 50 GWd/MTU condition (21 μm oxide). Excluding that larger variance, the rod internal pressure varies from the

4.27
unbiased base case by 0.01% at the positively biased 40 GWd/MTU condition to 0.24% at the positively biased no AOO condition. Peak fuel centerline temperature and cladding permanent hoop strain values vary from the base case by less than 0.5%. Overall, it appears that uncertainty in the oxide conductivity does not influence the rod internal pressure, fuel centerline temperature, or cladding permanent hoop strain values predicted by FRAPCON-3. Since the variance is very small, it is difficult to discern trends between rod internal pressure, peak fuel centerline temperature, and cladding permanent hoop strain with cladding oxide conductivity. However, a tendency for rod internal pressure, peak fuel centerline temperature, and cladding permanent hoop strain to vary inversely with cladding oxide conductivity was observed.
4.4.4 Cladding Conductivity The cladding conductivity model was biased by +5/-3 W/m-K, which bounds nearly all the experimental data presented in Figure 4.5.
0
10
20
30
40
50
60
70
0 500 1000 1500 2000
Temperature, K
Ther
mal
Con
duct
ivity
, W/m
-K
MATPRO Data used by MATPRO Recent DataRecent Data (Bunnell) Lower Bound Upper Bound
Figure 4.5 Zircaloy thermal conductivity model and available data with +5/-3 W/m-K as
upper and lower bounds PWR Rod internal pressure, peak fuel centerline temperature, and cladding permanent hoop strain values for an unbiased 17X17 PWR base case and cases biased by adjusting the cladding conductivity model by +5 W/m-K and -3 W/m-K are presented in Table 4.5 for comparison. Rod internal pressure values varied from the base case by 1.8% on average and range from 0.28% to 2.84% at the negatively and positively biased no AOO conditions, respectively. Peak fuel centerline temperatures varied from the base case by less than 1%. Cladding permanent hoop strain values varied by 1.5% on average and range from 0.87% at the negatively biased 40 GWd/MTU case to 2.51% at the positively biased 50GWd/MTU case. Overall, it appears that model uncertainty in the cladding conductivity model has no significant influence on the outputs of interest generated by FRAPCON-3. Despite the lack of a significant influence, a tendency for

4.28
rod internal pressure, peak fuel centerline temperature, and cladding permanent hoop strain to vary inversely with cladding conductivity was observed. BWR Outputs of interest for the unbiased 10X10 BWR base case and cases biased by adjusting the cladding conductivity model by +5 W/m-K and -3W/m-K are presented in Table 4.6 for comparison. Rod internal pressure values vary from the unbiased case by 4.0% on average and range from 1.57% in the positively biased 50 GWd/MTU condition to 9.51% in the negatively biased no AOO condition. Peak fuel centerline temperatures vary from the based case by 1.1% on average and range form 1.00% in the negatively biased 50 GWd/MTU condition to 1.22% in the positively biased 30 GWd/MTU condition. The cladding permanent hoop strain values varied from the base case by 2.4% on average and ranged from 1.57% at the negatively biased 40 GWd/MTUcondition to 3.10% at the positively biased 50 GWd/MTU condition. Based on this, it appears that model uncertainty in the cladding conductivity model has no significant influence on the outputs of interest generated by FRAPCON-3. Although the variance was small, a tendency for rod internal pressure, peak fuel centerline temperature, and cladding permanent hoop strain values to vary inversely with cladding conductivity was observed.
4.4.5 Gas Conductance The gas conductance model was biased by ±5%, which bounds nearly all the experimental data presented in Figure 4.6.
0.00
0.10
0.20
0.30
0.40
0.50
0.60
0.70
0.80
0 500 1000 1500 2000 2500 3000
Temperature, K
Ther
mal
Con
duct
ivity
, W/m
-K
MATPRO Data used by MATPRORecent Data Lower BoundUpper Bound
Figure 4.6 Helium thermal conductivity model and available data with ±5% as upper
and lower bounds PWR Rod internal pressure, peak fuel centerline temperature, and cladding permanent hoop strain values for an unbiased 17X17 PWR base case and cases biased by adjusting the gas conductance model by ±5% are presented in Table 4.5 for comparison. Rod internal pressure, peak fuel

4.29
centerline temperature, and cladding permanent hoop strain values varied by less than 1.15%. Based on this, it appears that model uncertainty in the gas conductance model has no significant influence over the outputs of interest generated by FRAPCON-3. Despite the lack of a significant effect, a tendency for rod internal pressure, peak fuel centerline temperature, and cladding permanent hoop strain to decrease with enhanced gas conductivity was observed. BWR Outputs of interest for the unbiased 10X10 BWR base case and cases biased by adjusting the gas conductance model by ±5% are presented in Table 4.6 for comparison. Rod internal pressure, peak fuel centerline temperature, and cladding permanent hoop strain values varied from the base case by less than 1%. Based on this, it appears that model uncertainty in the gas conductance model has no significant influence over the outputs of interest generated by FRAPCON-3. Despite the lack of a significant effect, a tendency for rod internal pressure, peak fuel centerline temperature, and cladding permanent hoop strain to decrease with enhanced gas conductivity was observed.
4.4.6 Fission Gas Release The fission gas release model was biased by multiplying or dividing gas diffusivity, D, by 2. The nominal model is shown in Figure 4.7. The biased models shown in Figures 4.8 and 4.9 bound most of the experimental data.
0
10
20
30
40
50
60
70
0 10 20 30 40 50 60 70
Measured FGR
Pred
icte
d FG
R
Steady State Power Ramped
Figure 4.7 Nominal predicted vs. measured fission gas release
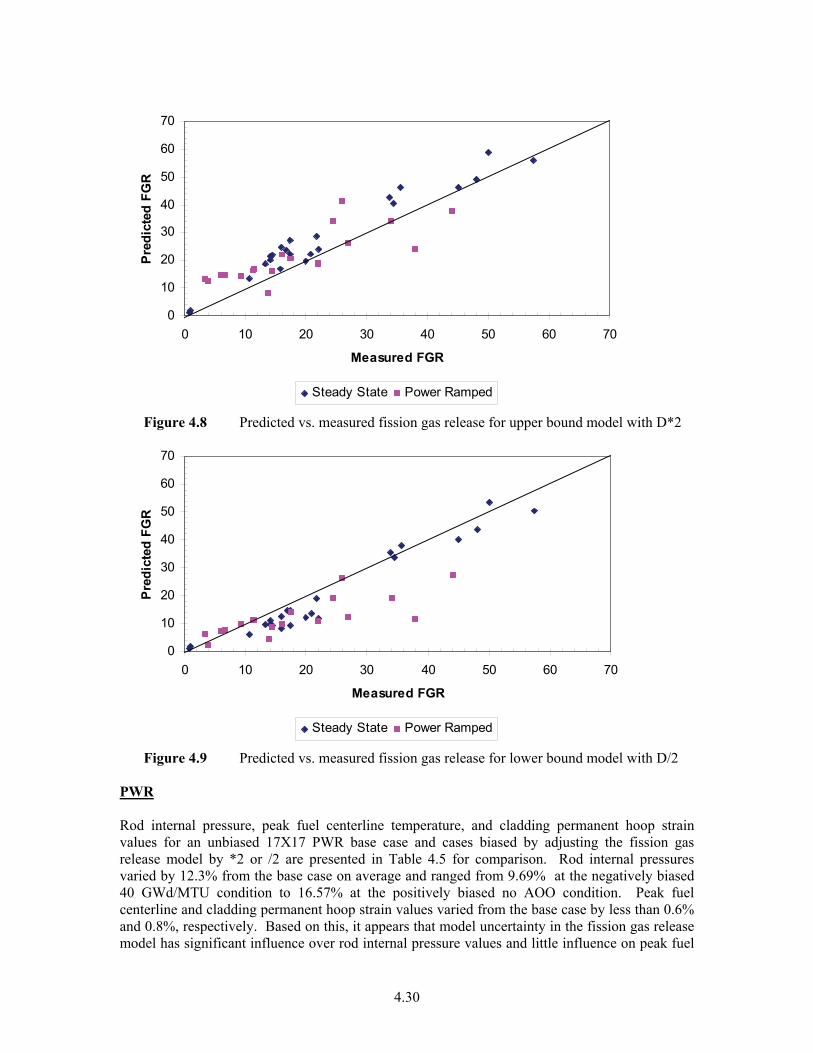
4.30
0
10
20
30
40
50
60
70
0 10 20 30 40 50 60 70
Measured FGR
Pred
icte
d FG
R
Steady State Power Ramped
Figure 4.8 Predicted vs. measured fission gas release for upper bound model with D*2
0
10
20
30
40
50
60
70
0 10 20 30 40 50 60 70
Measured FGR
Pre
dict
ed F
GR
Steady State Power Ramped
Figure 4.9 Predicted vs. measured fission gas release for lower bound model with D/2 PWR Rod internal pressure, peak fuel centerline temperature, and cladding permanent hoop strain values for an unbiased 17X17 PWR base case and cases biased by adjusting the fission gas release model by *2 or /2 are presented in Table 4.5 for comparison. Rod internal pressures varied by 12.3% from the base case on average and ranged from 9.69% at the negatively biased 40 GWd/MTU condition to 16.57% at the positively biased no AOO condition. Peak fuel centerline and cladding permanent hoop strain values varied from the base case by less than 0.6% and 0.8%, respectively. Based on this, it appears that model uncertainty in the fission gas release model has significant influence over rod internal pressure values and little influence on peak fuel

4.31
centerline temperature or cladding permanent hoop strain values generated by FRAPCON-3. The impact on fuel temperature would be more significant if the gap were open, e.g., at lower burnup. As expected, rod internal pressure significantly increased with increased fission gas release. BWR Outputs of interest for the unbiased 10X10 BWR base case and cases biased by adjusting the fission gas model by *2 or /2 are presented in Table 4.6 for comparison. Rod internal pressures varied by 23.6% from the base case on average and ranged from 2.04% to 39.93% between the negatively and positively biased 30 GWd/MTU conditions, respectively. Peak fuel centerline and cladding permanent hoop strain values varied from the base case by less than 2.0% and 3.0%, respectively. Based on this, it appears that model uncertainty in the fission gas release model has significant influence over rod internal pressure values and little influence on peak fuel centerline temperature or cladding permanent hoop strain values generated by FRAPCON-3. The impact on fuel temperature would be more significant if the gap were open, e.g., at lower burnup. As expected, rod internal pressure significantly increased with increased fission gas release.
4.4.7 Cladding Corrosion The cladding corrosion model was biased by ±40%. The nominal model is shown in Figure 4.10. The models biased to bound nearly all experimental data are shown in Figures 4.11 and 4.12.
0
20
40
60
80
100
120
0 20 40 60 80 100 120
Measured Oxide Thickness, microns
Pred
icte
d O
xide
Thi
ckne
ss
PWR Data Measured=Predicted
Figure 4.10 Nominal predicted vs. measured oxide thickness

4.32
0
20
40
60
80
100
120
140
0 20 40 60 80 100 120
Measured Oxide Thickness, microns
Pred
icte
d O
xide
Thi
ckne
ss
PWR Data Measured=Predicted
Figure 4.11 Predicted vs. measured oxide thickness for upper bound model with +40%
0
20
40
60
80
100
120
0 20 40 60 80 100 120
Measured Oxide Thickness, microns
Pre
dict
ed O
xide
Thi
ckne
ss
PWR Data Measured=Predicted
Figure 4.12 Predicted vs. measured oxide thickness for lower bound model with -40% PWR Rod internal pressure, peak fuel centerline temperature, and cladding permanent hoop strain values for an unbiased 17X17 PWR base case and cases biased by adjusting the cladding corrosion model by ±40% are presented in Table 4.5 for comparison. Rod internal pressures

4.33
varied by 2.5% from the base case on average and ranged from 0.83% at the positively biased 30 GWd/MTU condition to 4.67% at the positively biased no AOO condition. Peak fuel centerline temperatures varied from the base case by 1.0% on average and ranged from 0.33% at the negatively biased 30 GWd/MTU condition to 3.36% at the positively biased 50 GWd/MTU condition. Cladding permanent hoop strain values varied from the base case by 2.5% on average and ranged from 0.41% in the negatively biased 30 GWd/MTU condition to 9.28% in the positively biased 50 GWd/MTU condition. Based on this, it appears that model uncertainty in the cladding corrosion model has low to moderate influence on the outputs of interest generated by FRAPCON-3. It should be noted that cladding corrosion and hydriding can have a significant impact on cladding ductility. A tendency for rod internal pressure, peak fuel centerline temperature, and cladding permanent hoop strain to increase and decrease with cladding corrosion was observed. BWR Outputs of interest for the unbiased 10X10 BWR base case and cases biased by adjusting the cladding corrosion model by ±40% are presented in Table 4.6 for comparison. Rod internal pressures varied by 0.4% from the base case on average and ranged from 0.00% at the negatively biased 40 GWd/MTU condition to 2.51% at the positively biased 50 GWd/MTU condition. Peak fuel centerline temperatures varied from the base case by 0.3% on average and ranged from 0.17% at the negatively biased 30 GWd/MTU condition to 0.39% at the positively biased 50 GWd/MTU condition. Cladding permanent hoop strain values varied from the base case by 0.3% on average and ranged from 0.07% in the negatively biased 40 GWd/MTU condition to 0.44% in the positively biased 50 GWd/MTU condition. Based on this, it appears that model uncertainty in the cladding corrosion model has no significant influence on the outputs of interest generated by FRAPCON-3. It should be noted that cladding corrosion and hydriding can have a significant impact on cladding ductility. Despite the lack of a significant effect, a tendency for rod internal pressure, peak fuel centerline temperature, and cladding permanent hoop strain to increase with positively biased cladding corrosion was observed.
4.4.8 Fuel Swelling The fuel swelling model was biased by ±0.3% ΔV/V per 10 GWd/MTU, which bounds nearly all the data presented in Figure 4.13 as well as the Halden swelling data shown in Figure 2.69.
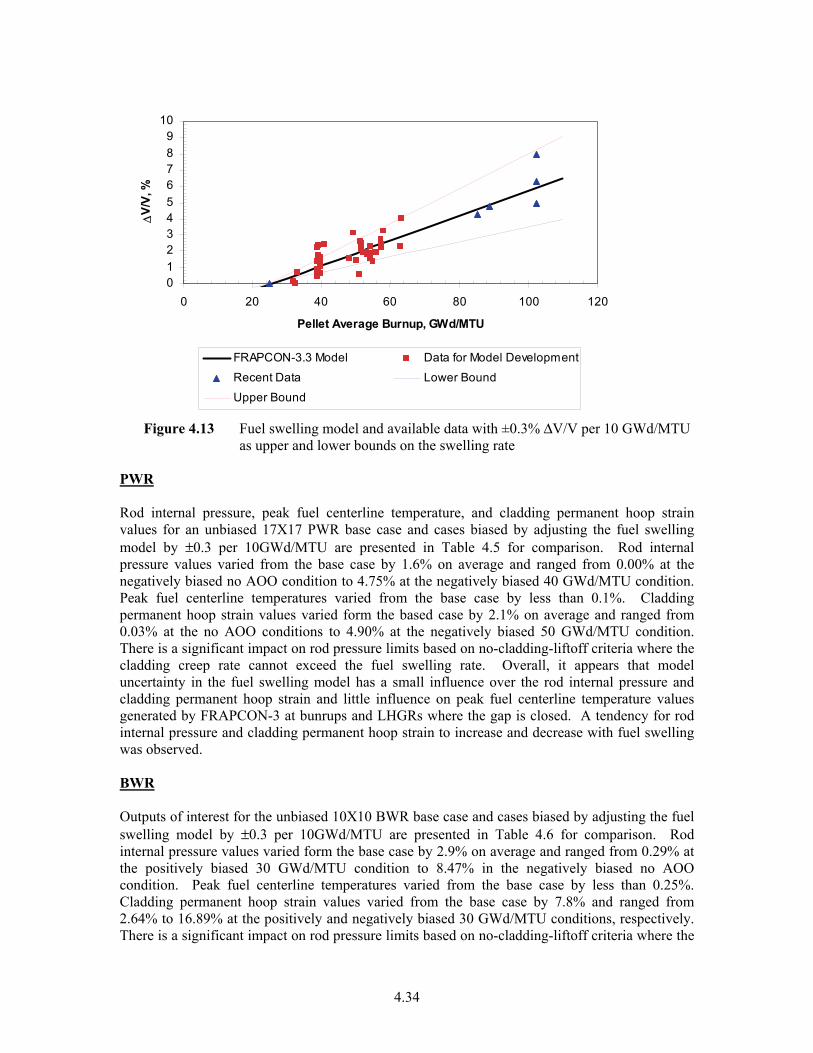
4.34
0123456789
10
0 20 40 60 80 100 120
Pellet Average Burnup, GWd/MTU
ΔV/
V, %
FRAPCON-3.3 Model Data for Model Development
Recent Data Lower Bound
Upper Bound
Figure 4.13 Fuel swelling model and available data with ±0.3% ΔV/V per 10 GWd/MTU as upper and lower bounds on the swelling rate
PWR Rod internal pressure, peak fuel centerline temperature, and cladding permanent hoop strain values for an unbiased 17X17 PWR base case and cases biased by adjusting the fuel swelling model by ±0.3 per 10GWd/MTU are presented in Table 4.5 for comparison. Rod internal pressure values varied from the base case by 1.6% on average and ranged from 0.00% at the negatively biased no AOO condition to 4.75% at the negatively biased 40 GWd/MTU condition. Peak fuel centerline temperatures varied from the base case by less than 0.1%. Cladding permanent hoop strain values varied form the based case by 2.1% on average and ranged from 0.03% at the no AOO conditions to 4.90% at the negatively biased 50 GWd/MTU condition. There is a significant impact on rod pressure limits based on no-cladding-liftoff criteria where the cladding creep rate cannot exceed the fuel swelling rate. Overall, it appears that model uncertainty in the fuel swelling model has a small influence over the rod internal pressure and cladding permanent hoop strain and little influence on peak fuel centerline temperature values generated by FRAPCON-3 at bunrups and LHGRs where the gap is closed. A tendency for rod internal pressure and cladding permanent hoop strain to increase and decrease with fuel swelling was observed. BWR Outputs of interest for the unbiased 10X10 BWR base case and cases biased by adjusting the fuel swelling model by ±0.3 per 10GWd/MTU are presented in Table 4.6 for comparison. Rod internal pressure values varied form the base case by 2.9% on average and ranged from 0.29% at the positively biased 30 GWd/MTU condition to 8.47% in the negatively biased no AOO condition. Peak fuel centerline temperatures varied from the base case by less than 0.25%. Cladding permanent hoop strain values varied from the base case by 7.8% and ranged from 2.64% to 16.89% at the positively and negatively biased 30 GWd/MTU conditions, respectively. There is a significant impact on rod pressure limits based on no-cladding-liftoff criteria where the

4.35
cladding creep rate cannot exceed the fuel swelling rate. Overall, it appears that model uncertainty in the fuel swelling model has a small to moderate influence on rod internal pressure and cladding permanent hoop strain values generated by FRAPCON-3 and little influence on peak fuel centerline temperature. Despite the lack of a significant effect, a tendency for rod internal pressure and cladding permanent hoop strain to increase and decrease with fuel swelling was observed.
4.4.9 Creep of Irradiated Cladding The irradiated cladding creep model was biased by +10%/-40%, which bounds nearly all the data presented in Figure 4.14.
-1.2
-1
-0.8
-0.6
-0.4
-0.2
0
0 2E+25 4E+25 6E+25 8E+25 1E+26
Rod Average Fluence, n/m²
Ave
rage
Hoo
p S
train
, %
FRAPCON-3.3 Data Lower Bound Upper Bound
Figure 4.14 Cladding creep model and available data with +10%/-40% upper and lower bound on creep rate.
PWR Rod internal pressure, peak fuel centerline temperature, and cladding permanent hoop strain values for an unbiased 17X17 PWR base case and cases biased by adjusting the irradiated cladding creep model by +10%/-40% are presented in Table 4.5 for comparison. Rod internal pressure values varied from the base case by 0.6% on average and ranged from 0.05% to 1.21% at the positively and negatively biased no AOO conditions, respectively. Peak fuel centerline temperatures and cladding permanent hoop strain values varied form the base case by less that 0.2%. The impact of cladding creep on fuel temperature will be significant at lower burnups when the gap is open. Also, there is a significant impact on rod pressure limits based on no-cladding-liftoff criteria where the cladding creep rate cannot exceed the fuel swelling rate. Overall, it appears that model uncertainty in the irradiated cladding creep model has no influence over the rod internal pressure, peak fuel centerline temperature and cladding permanent hoop strain values generated by FRAPCON-3.

4.36
BWR Outputs of interest for the unbiased 10X10 BWR base case and cases biased by adjusting the irradiated cladding creep model by +10%/-40% are presented in Table 4.6 for comparison. Rod internal pressure and cladding permanent hoop strain values vary form the base case by less than 1.0 and 1.8%, respectively. Peak fuel centerline temperatures varied form the base case by less than 0.1%. The impact of cladding creep on fuel temperature will be significant at lower burnups when the gap is open. Also, there is a significant impact on rod pressure limits based on no-cladding-liftoff criteria where the cladding creep rate cannot exceed the fuel swelling rate. Overall, it appears that model uncertainty in the irradiated cladding creep model has no significant influence on rod internal pressure, peak fuel centerline temperature, and cladding permanent hoop strain values generated by FRAPCON-3.
4.4.10 Cladding Yield Strength The cladding yield model was biased by adjusting the strength coefficient, K, by ± 30%. The nominal model is shown in Figure 4.15. The biased models bound nearly all experimental data as shown in Figures 4.16 and 4.17.
0
200
400
600
800
1000
1200
0 200 400 600 800 1000 1200
Measured Yield Stress, MPa
Pred
icte
d Yi
eld
Stre
ss, M
Pa
Axial Tests Burst Tests Ring Tests
Figure 4.15 Nominal predicted vs. measured yield stress

4.37
0
200
400
600
800
1000
1200
0 200 400 600 800 1000 1200
Measured Yield Stress, MPa
Pred
icte
d Yi
eld
Stre
ss, M
Pa
Axial Tests Burst Tests Ring Tests
Figure 4.16 Predicted vs. measured yield stress for upper bound model with K*1.3
0
200
400
600
800
1000
1200
0 200 400 600 800 1000 1200
Measured Yield Stress, MPa
Pre
dict
ed Y
ield
Str
ess,
MP
a
Axial Tests Burst Tests Ring Tests
Figure 4.17 Predicted vs. measured yield stress for lower bound model with K/1.3 PWR Rod internal pressure, peak fuel centerline temperature, and cladding permanent hoop strain values for an unbiased 17X17 PWR base case and cases biased by adjusting the strength coefficient, K, of the cladding yield strength model by ± 30% are presented in Table 4.5 for comparison. Rod internal pressure, peak fuel centerline, and cladding permanent hoop strain values varied form the base case by less than 1.1%. Based on this, it appears that model

4.38
uncertainty in the cladding yield strength model has little influence over the outputs of interest generated by FRAPCON-3. BWR Outputs of interest for the unbiased 10X10 BWR base case and cases biased by adjusting the strength coefficient, K, of the cladding yield strength model by ± 30% are presented in Table 4.6 for comparison. Rod internal pressure and peak fuel centerline temperatures varied from the base case by less than 1.6% and 0.6% respectively. Cladding permanent hoop strain values varied from the base case by 1.7% on average and ranged from 0.15% at the positively biased 40 GWd/MTU condition to 6.05% at the positively biased 50 GWd/MTU condition. Based on this, it appears that model uncertainty in the cladding yield strength model has little influence on rod internal pressure, peak fuel centerline temperature, and cladding permanent hoop strain values generated by FRAPCON-3.
4.4.11 Young’s Modulus of Cladding The cladding Young’s modulus model was biased by +5/-10GPa, which bounds nearly all the data presented in Figure 4.18.
0
40
80
120
0 40 80 120
Measured Young's Modulus, GPa
Pre
dict
ed Y
oung
's M
odul
us, G
Pa
Model Development Data Recent Data Lower Bound Upper Bound
Figure 4.18 Predicted and measured cladding Young’s Modulus data with +5/-10 GPa as upper and lower bounds
PWR Rod internal pressure, peak fuel centerline temperature, and cladding permanent hoop strain values for an unbiased 17X17 PWR base case and cases biased by adjusting the Young’s modulus of cladding model by + 5MPa and -10MPa are presented in Table 4.5 for comparison. Based on these results, it appears that model uncertainty in the Young’s modulus of cladding model has no influence on rod internal pressure, fuel centerline temperature, or cladding permanent hoop strain values predicted by FRAPCON-3.

4.39
BWR Outputs of interest for the unbiased 10X10 BWR base case and cases biased by adjusting the Young’s modulus of cladding model by +5 MPa and -10MPa are presented in Table 4.6 for comparison. Based on these results, it appears that uncertainty in the Young’s modulus model has no effect on rod internal pressure, fuel centerline temperature, or cladding permanent hoop strain values predicted by FRAPCON-3.
4.4.12 Cladding Axial Growth The cladding axial growth models for PWR and BWR reactors were biased by ± 50%, which bounds most of the data presented in Figures 4.19 and 4.20, respectively.
0
0.2
0.4
0.6
0.8
1
1.2
1.4
1.6
0 2E+21 4E+21 6E+21 8E+21 1E+22 1.2E+22 1.4E+22
Fast Fluence (n/cm2, E > 1 MeV)
∆L/L
o (%
)
FRAPCON-3.3 Data for FRAPCON AssessmentRecent Data Lower BoundUpper Bound
Figure 4.19 Cladding axial growth model for PWR cladding with ±50% as upper and
lower bounds
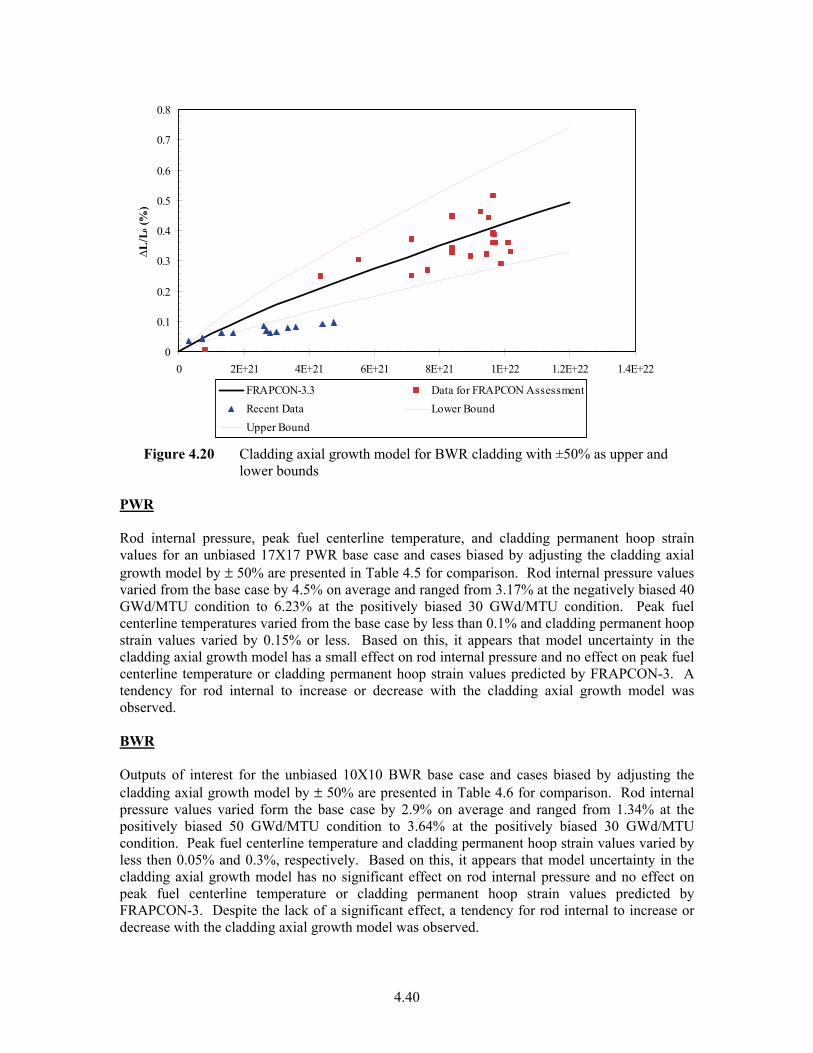
4.40
0
0.1
0.2
0.3
0.4
0.5
0.6
0.7
0.8
0 2E+21 4E+21 6E+21 8E+21 1E+22 1.2E+22 1.4E+22
Fast Fluence (n/cm2, E > 1 MeV)
∆L/L
o (%
)
FRAPCON-3.3 Data for FRAPCON AssessmentRecent Data Lower BoundUpper Bound
Figure 4.20 Cladding axial growth model for BWR cladding with ±50% as upper and
lower bounds PWR Rod internal pressure, peak fuel centerline temperature, and cladding permanent hoop strain values for an unbiased 17X17 PWR base case and cases biased by adjusting the cladding axial growth model by ± 50% are presented in Table 4.5 for comparison. Rod internal pressure values varied from the base case by 4.5% on average and ranged from 3.17% at the negatively biased 40 GWd/MTU condition to 6.23% at the positively biased 30 GWd/MTU condition. Peak fuel centerline temperatures varied from the base case by less than 0.1% and cladding permanent hoop strain values varied by 0.15% or less. Based on this, it appears that model uncertainty in the cladding axial growth model has a small effect on rod internal pressure and no effect on peak fuel centerline temperature or cladding permanent hoop strain values predicted by FRAPCON-3. A tendency for rod internal to increase or decrease with the cladding axial growth model was observed. BWR Outputs of interest for the unbiased 10X10 BWR base case and cases biased by adjusting the cladding axial growth model by ± 50% are presented in Table 4.6 for comparison. Rod internal pressure values varied form the base case by 2.9% on average and ranged from 1.34% at the positively biased 50 GWd/MTU condition to 3.64% at the positively biased 30 GWd/MTU condition. Peak fuel centerline temperature and cladding permanent hoop strain values varied by less then 0.05% and 0.3%, respectively. Based on this, it appears that model uncertainty in the cladding axial growth model has no significant effect on rod internal pressure and no effect on peak fuel centerline temperature or cladding permanent hoop strain values predicted by FRAPCON-3. Despite the lack of a significant effect, a tendency for rod internal to increase or decrease with the cladding axial growth model was observed.

4.41
4.4.13 Cladding Thermal Expansion The cladding thermal expansion model was biased by ± 30%. Figures 4.21 and 4.22 present diametral and axial thermal expansion data, respectively, with most of the experimental bounded by the bias.
0
0.001
0.002
0.003
0.004
0.005
0.006
0 200 400 600 800 1000 1200 1400
Temperature, K
Dia
met
ral T
herm
al E
xpan
sion
, in
/in
FRAPCON-3 Data used by MATPRO Recent DataLower Bound Upper Bound
Figure 4.21 Cladding diametral thermal expansion model with ±30% as upper and lower
bounds
00.00050.001
0.00150.002
0.00250.003
0.00350.004
0.00450.005
0 200 400 600 800 1000 1200 1400
Temperature, K
Axi
al T
herm
al E
xpan
sion
, in/
in
FRAPCON-3 Data used by MATPRO Recent DataLower Bound Upper Bound
Figure 4.22 Cladding axial thermal expansion model with +30%/-10% as upper and
lower bounds

4.42
PWR Rod internal pressure, peak fuel centerline temperature, and cladding permanent hoop strain values for an unbiased 17X17 PWR base case and cases biased by adjusting the cladding thermal expansion model by ± 30% are presented in Table 4.5 for comparison. Rod internal pressure and peak fuel centerline temperature values varied from the base case by less than 0.5%. Cladding permanent hoop strain values varied from the base case by 1.2% on average and ranged from 0.67% at the negatively biased 30 GWd/MTU condition to 1.95% at the positively biased 50 GWd/MTU condition. Based on this, it appears that model uncertainty in the cladding thermal expansion model has no significant effect on outputs of interest generated by FRAPCON-3. Despite the lack of a significant effect, a tendency for cladding permanent hoop strain to vary inversely with cladding thermal expansion was observed. BWR Outputs of interest for the unbiased 10X10 BWR base case and cases biased by adjusting the cladding thermal expansion model by ± 30% are presented in Table 4.6 for comparison. Rod internal pressure values varied form the base case by 0.3% on average and ranged from 0.01% at the positively biased 30 GWd/MTU condition to 1.10% at the negatively biased 50 GWd/MTU condition. Peak fuel centerline temperatures varied from the base case by less than 0.05%. Cladding permanent hoop strain values varied from the based case by 1.1% and ranged from 0.58% at the negatively biased 50 GWd/MTU condition to 1.79% at the positively biased 30 GWd/MTU condition. Based on this, it appears that model uncertainty in the cladding thermal expansion model has no significant effect on the outputs of interest generated by FRAPCON-3. Despite the lack of a significant effect, a tendency for cladding permanent hoop strain to increase with decreased cladding thermal expansion was observed.
4.5 Effects of Power Uncertainties Power uncertainties include fluctuations in the steady state power as well as the range of times and power levels that may be experienced during an AOO. In this study, the steady state power was varied by 10% over the entire power history to account for uncertainties in the calculation of steady state power. In addition, an AOO resulting in a 50% increase in power output for a period of 4 hrs was also considered. To study the influence of uncertainty in this AOO, two separate instances were analyzed. In the first case, the power increase was varied from 40% to 60%. The second case consisted of decreasing and increasing the duration of the transient by 1 hour. Results of the power uncertainty study are presented in Tables 4.7 and 4.8 and discussed in the following subsections.
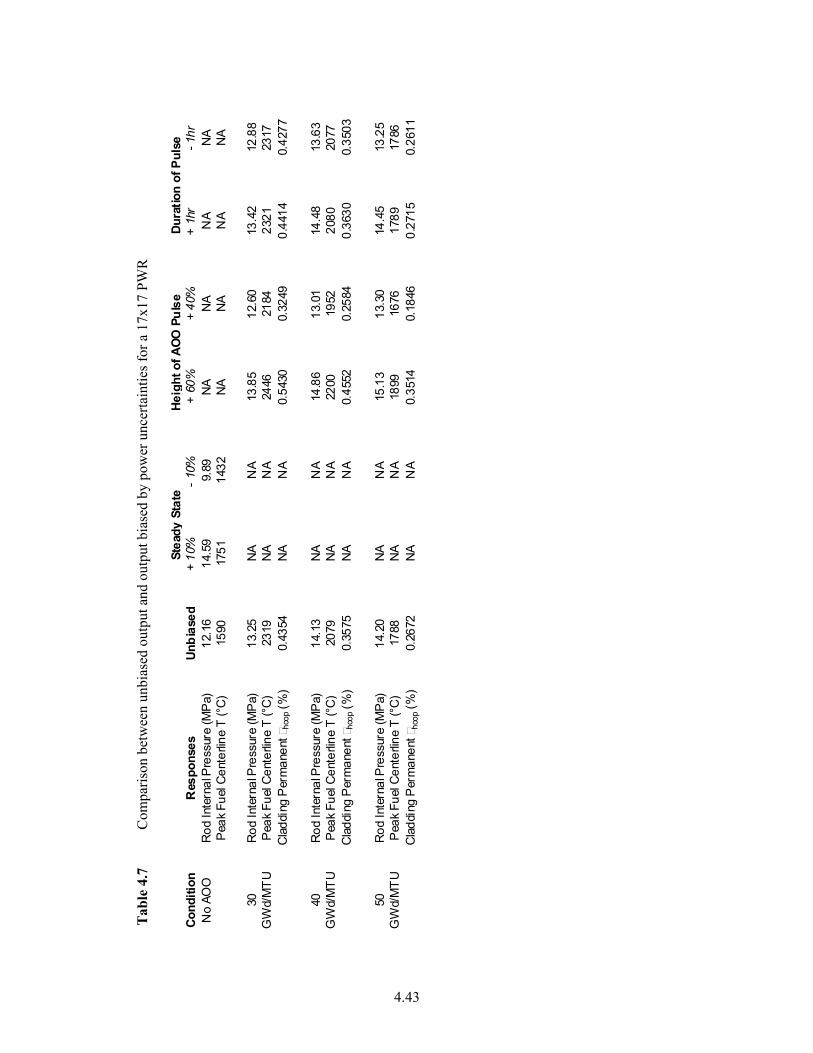
4.43
Tab
le 4
.7
Com
paris
on b
etw
een
unbi
ased
out
put a
nd o
utpu
t bia
sed
by p
ower
unc
erta
intie
s for
a 1
7x17
PW
R
S
tead
y St
ate
H
eigh
t of A
OO P
ulse
Dur
atio
n of
Pul
seCo
nditi
onR
espo
nses
Unbi
ased
+ 10
%-
10%
+ 6
0% +
40%
+ 1h
r- 1
hrN
o AO
OR
od In
tern
al P
ress
ure
(MP
a)12
.16
14.5
99.
89N
AN
AN
AN
AP
eak
Fuel
Cen
terli
ne T
(°C
)15
9017
5114
32N
AN
AN
AN
A
30R
od In
tern
al P
ress
ure
(MP
a)13
.25
NA
NA
13.8
512
.60
13.4
212
.88
GW
d/M
TU
Pea
k Fu
el C
ente
rline
T (°
C)
2319
NA
NA
2446
2184
2321
2317
Cla
ddin
g P
erm
anen
t ho
op (%
)0.
4354
NA
NA
0.54
300.
3249
0.44
140.
4277
40R
od In
tern
al P
ress
ure
(MP
a)14
.13
NA
NA
14.8
613
.01
14.4
813
.63
GW
d/M
TU
Pea
k Fu
el C
ente
rline
T (°
C)
2079
NA
NA
2200
1952
2080
2077
Cla
ddin
g P
erm
anen
t ho
op (%
)0.
3575
NA
NA
0.45
520.
2584
0.36
300.
3503
50R
od In
tern
al P
ress
ure
(MP
a)14
.20
NA
NA
15.1
313
.30
14.4
513
.25
GW
d/M
TU
Pea
k Fu
el C
ente
rline
T (°
C)
1788
NA
NA
1899
1676
1789
1786
Cla
ddin
g P
erm
anen
t ho
op (%
)0.
2672
NA
NA
0.35
140.
1846
0.27
150.
2611

4.44
Tab
le 4
.8
Com
paris
on b
etw
een
unbi
ased
out
put a
nd o
utpu
t bia
sed
by p
ower
unc
erta
intie
s for
a 1
0x10
BW
R
St
eady
Sta
te
Hei
ght o
f AO
O P
ulse
Dur
atio
n of
Pul
seC
ondi
tion
Res
pons
esU
nbia
sed
+ 10
%- 1
0% +
60%
+ 4
0%+1
hr-1
hrN
o AO
OR
od In
tern
al P
ress
ure
(MP
a)5.
375.
974.
21N
AN
AN
AN
APe
ak F
uel C
ente
rline
T (°
C)
1234
1364
1110
NA
NA
NA
NA
30R
od In
tern
al P
ress
ure
(MP
a)5.
30N
AN
A6.
224.
665.
495.
04G
Wd/
MTU
Peak
Fue
l Cen
terli
ne T
(°C
)18
68N
AN
A20
0017
3318
7118
62C
ladd
ing
Perm
anen
t εho
op (%
)0.
3180
NA
NA
0.42
100.
2163
0.32
440.
3081
40R
od In
tern
al P
ress
ure
(MP
a)6.
56N
AN
A7.
765.
476.
726.
13G
Wd/
MTU
Peak
Fue
l Cen
terli
ne T
(°C
)17
29N
AN
A18
4916
0617
3217
25C
ladd
ing
Perm
anen
t εho
op (%
)0.
2683
NA
NA
0.35
990.
1775
0.27
420.
2608
50R
od In
tern
al P
ress
ure
(MP
a)6.
73N
AN
A8.
185.
727.
266.
60G
Wd/
MTU
Peak
Fue
l Cen
terli
ne T
(°C
)15
30N
AN
A16
3614
2615
3115
24C
ladd
ing
Perm
anen
t εho
op (%
)0.
2067
NA
NA
0.28
440.
1326
0.21
110.
1994
4.45
4.5.1 Steady State PWR Rod internal pressure and peak fuel centerline temperature values for an unbiased 17X17 PWR base case and cases biased by adjusting the steady state power by ±10% are presented in Table 4.7 for comparison. The average variance in rod internal pressure and peak fuel centerline temperature is 20% and 10%, respectively. Based on these results, it is appears that power uncertainty in steady state power has a major effect on rod internal pressure and peak fuel centerline temperature. BWR Outputs of interest for the unbiased 10X10 BWR base case and cases biased by adjusting steady state power by ±10% are presented in Table 4.8 for comparison. The average variance in rod internal pressure and peak fuel centerline temperature is 15% and 10%, respectively. Based on these results it appears that power uncertainty in steady state power has a major effect on rod internal pressure and peak fuel centerline temperature.
4.5.2 Height of AOO Pulse PWR Rod internal pressure, peak fuel centerline temperature, and cladding permanent hoop strain values for an unbiased 17X17 PWR base case and cases biased by adjusting the height of AOO pulse by ±10% are presented in Table 4.7 for comparison. The average variance in rod internal pressure is 5.9% and varies from 4.53% at the positively biased 30 GWd/MTU condition to 7.98% at the negatively biased 40 GWd/MTU condition. Peak fuel centerline temperatures varied from the unbiased case by an average of 6.0% and ranged from 5.47% at the positively biased 30 GWd/MTU condition to 6.25% at the positively biased 50 GWd/MTU condition. Cladding permanent hoop strain values varied, on average, by 28.0% from the unbiased case. Cladding variance ranged from 24.71% at the positively biased 30 GWd/MTU condition to 31.51% at the positively biased 50 GWd/MTU condition. Based on these results, it appears that power uncertainty in AOO pulse height has a moderate effect on rod internal pressure and peak fuel centerline temperature, and a major effect on cladding permanent hoop strain values generated by FRAPCON-3. A trend for rod internal pressure, peak fuel centerline temperature, and cladding permanent hoop strain to increase and decrease with AOO pulse height was observed. BWR Outputs of interest for the unbiased 10X10 BWR base case and cases biased by adjusting the height of AOO pulse by ±10% are presented in Table 4.8 for comparison. The average variance in rod internal pressure is 16.8% and varies from 12.05% at the negatively biased 30 GWd/MTU condition to 21.61% at the positively biased 50 GWd/MTU condition. Peak fuel centerline temperatures varied, on average, by 7.0% and ranged from 6.80% at the negatively biased 50 GWd/MTU condition to 7.25% at the negatively biased 30 GWd/MTU condition. Cladding permanent hoop strain values varied from the base case by 34.3%, on average and ranged from 31.98% at the negatively biased 30 GWd/MTU condition to 37.59% at the positively biased 50GWd/MTU condition. Based on these results it appears that power uncertainty in the AOO

4.46
pulse height has a moderate effect on peak fuel centerline temperature, and a major effect on rod internal pressure and cladding permanent hoop strain values predicted by FRAPCON-3. A trend for rod internal pressure, peak fuel centerline temperature, and cladding permanent hoop strain to increase and decrease with AOO pulse height was observed.
4.5.3 Duration of AOO Pulse PWR Rod internal pressure, peak fuel centerline temperature, and cladding permanent hoop strain values for an unbiased 17X17 PWR base case and cases biased by adjusting the duration of AOO pulse by ±1hr are presented in Table 4.7 for comparison. The average variance in rod internal pressure is 3.1% and varies from 1.24% at the positively biased 30 GWd/MTU condition to 6.67% at the negatively biased 50 GWd/MTU condition. Peak fuel centerline temperatures, on the other hand, varied by 0.1% or less. Cladding permanent hoop strain values varied by 1.8% on average and ranged from 1.38% at the positively biased 30 GWd/MTU condition to 2.28% at the negatively biased 50 GWd/MTU condition. Based on this, it appears that power uncertainty in the AOO pulse duration has a moderate effect on the outputs of interest generated by FRAPCON-3. A trend for rod internal pressure, fuel centerline temperature, and cladding permanent hoop strain to increase and decrease with the duration of AOO pulse was observed. BWR Outputs of interest for the unbiased 10X10 BWR base case and cases biased by adjusting the duration of AOO pulse by ±1hr are presented in Table 4.8 for comparison. The average variance in rod internal pressure is 4.5% and varies from 1.90% at the negatively biased 50 GWd/MTU condition to 7.89% at the positively biased 50 GWd/MTU condition. Peak fuel centerline temperatures varied by less than 0.5%. Cladding permanent hoop strain values varied from the base case by 2.6% on average and ranged from 2.01% at the positively biased 30 GWd/MTU condition to 3.53% at the negatively biased 50 GWd/MTU condition. Based on this, it appears that power uncertainty in the AOO pulse duration has a moderate effect on the outputs of interest generated by FRAPCON-3. A trend for rod internal pressure, fuel centerline temperature, and cladding permanent hoop strain to increase and decrease with the duration of AOO pulse was observed.
4.6 Conclusions The influence of manufacturing, model, and power uncertainties on outputs of interest generated by FRAPCON-3 has been evaluated. Overall, it appears that manufacturing uncertainties have a small influence over the outputs of interest. The average variation between unbiased PWR and BWR base cases and cases biased by manufacturing uncertainties is typically less than 7%. Model uncertainties, on the other hand, significantly influence outputs of interest generated by FRAPCON-3 and may result in values that differ from the base cases by as much as 60%. This underscores the importance of exercising care in the selection and derivation of models and fitting parameters. Finally, evaluation of power uncertainties has revealed variation in steady state power has a major impact on centerline temperature and rod internal pressure and that the AOO pulse height has a more significant influence than the pulse duration on FRAPCON-3 outputs. In particular, cladding permanent hoop strain values can vary from the base case by as much as 34% when the AOO pulse height is varied from the base case by ±10%. The following subsections summarize the individual sources of uncertainty that have a significant impact on outputs of interest generated by FRAPCON-3.
4.47
The conclusions of this example sensitivity study could change depending on power histories. For example, if the peak power started higher than assumed here and dropped off at lower burnup, the gap would be open at lower burnup. This could make cladding creep, fuel swelling and fission gas release more important to the peak fuel centerline temperature predictions.
4.6.1 Rod Internal Pressure Individual manufacturing uncertainties only influenced rod internal pressure values by 5% or less, however, examination of model uncertainties revealed that rod internal pressure values can be significantly influenced by uncertainty in the fuel thermal conductivity and fission gas release models. Rod internal pressure values varied, on average, from the PWR and BWR base cases by approximately 32% and 60%, respectively, when the fuel thermal conductivity model is biased by ±0.5W/m-K. Biasing the diffusivity of the fission gas release model by ±2 resulted variations from the base case by 12% and 24% for PWR and BWR cases, respectively. Power uncertainty also had a significant influence on rod internal pressure. The uncertainty in steady state power has a major impact on the prediction of rod internal pressure. In addition, variation in AOO pulse height results rod internal pressures varying by 17% from the BWR base case. However, this effect was not as significant for the PWR, as the biased AOO pulse height only varied from the base case by 6%.
4.6.2 Peak Fuel Centerline Temperature Peak fuel centerline temperature values were insensitive to individual manufacturing uncertainties. However, biasing the fuel thermal conductivity model by ±0.5W/m-K resulted in variation from the PWR and BWR base cases by 20 and 22%, respectively. Power uncertainties have a major impact on peak fuel centerline temperature.
4.6.3 Cladding Permanent Hoop Strain Cladding permanent hoop strain values were insensitive to individual manufacturing uncertainties. However, model uncertainty in the fuel thermal conductivity and fuel thermal expansion models resulted in significant variation from the PWR and BWR base cases. Biasing the fuel thermal conductivity model by ±0.5W/m-K resulted in variations of 36 and 52% from the PWR and BWR base cases, respectively. Biasing the fuel thermal expansion model by ±15% resulted in variations of 19 and 21% from the PWR and BWR base cases, respectively. Power uncertainties also influence cladding permanent hoop strains. In particular, biasing the AOO pulse height by ±10% resulted in values that varied by 28 and 34% from the PWR and BWR base cases, respectively.


5.1
5.0 CONCLUSIONS The conclusion of this assessment is that both FRAPCON-3.3 and FRAPTRAN-1.3 provide best-estimate predictions of fuel and cladding temperatures and cladding stress and strain. The assessments of each model and the assessments of the combined model predictions are shown in Section 2. Several areas have been identified as areas that should be re-examined and new models developed to improve the model’s predictive capability. These areas are outlined below. • Cladding corrosion: The model for hydrogen pickup in Zircaloy-2 under BWR conditions
was found to over-predict hydrogen data. A new model was developed and is described in Section 3.1.1. The model for corrosion of ZIRLO™ was found to under-predict cladding corrosion at high burnup (>60 GWd/MTU). New model parameters were developed and are described in Section 3.1.2. The model for corrosion of M5™ was found to over-predict cladding corrosion at high burnup (>60 GWd/MTU). New model parameters were developed and are described in Section 3.1.3. After making this adjustment, it was also necessary to change the hydrogen pickup for M5™ as described in Section 3.1.3.
• Radial power profile: The TUBRNP subroutine that calculates radial power profile was updated as recommended by the authors of the subroutine to model the radial power profile in the HWR neutron spectrum as well as a LWR neutron spectrum. The details of this update are described in Section 3.2. A lookup and interpolation routine was developed and implemented in FRAPCON-3.4 to model the radial power profile for UO2-Gd2O3 fuel in both HWR and LWR neutron spectrums. The details of this update are described in Section 3.3
• UO2 thermal expansion: The model for UO2 fuel thermal expansion was found to slightly under-predict expansion strain at high temperature between 2500K and 3000K. Although this under prediction was within the scatter of the data, new model parameters were developed to predict the mean of the expansion strain data at high temperature and are described in Section 3.4.
• Gas conductivity: The gas conductivity models do not model the conductivity well for most gasses beyond 1100K. This will not affect most of the temperature predictions since the gas does not typically exceed 1000K. New data model parameters were developed to better predict gas conductivity at high temperature and are described in Section 3.5.
• Steam conductivity: The steam conductivity models in FRAPCON-3.3 and FRAPTRAN 1.3 were not the same. In addition, neither model predicted the data well. The models in both codes were changed to match the ASME model as described in Section 3.6. This is most important in FRAPTRAN-1.3 where the gap may be filled with steam after cladding rupture.
• Cladding irradiation creep: That the cladding irradiation creep model in FRAPCON-3.3 predicts creepdown to occur too rapidly. A new model has been selected and compared to creepdown data from fuel rods and from in-reactor pressurized cladding tube creep tests. This model is described in Section 3.7.
The influence of manufacturing, model, and power uncertainties on outputs of interest generated by FRAPCON-3.3 has been evaluated. Overall, it appears that manufacturing uncertainties on an individual basis have a small to moderate or little influence over the outputs of interest. The average variation between unbiased PWR and BWR base cases and cases biased by individual manufacturing uncertainties is typically less than 5%. Individual model uncertainties, on the other hand, significantly influence outputs of interest generated by FRAPCON-3.3 and may result in values that differ from the base cases by as much as 60%. This underscores the importance of exercising care in the selection and derivation of models and fitting parameters. Finally, evaluation of power uncertainties has revealed that the uncertainty on steady state power has a

5.2
major impact on the prediction of fuel centerline temperature and rod internal gas pressure. In addition, for a 50% overpower even with a 4 hour hold time, the pulse height has a more significant influence than the pulse duration on FRAPCON-3.3 outputs. In particular, cladding permanent hoop strain values can vary from the base case by as much as 34% when the AOO pulse height is varied from the base case by ±10%. The individual sources of uncertainty that have a significant impact on outputs of interest generated by FRAPCON-3.3 are summarized below. • Rod Internal Pressure: Although manufacturing uncertainty only influenced rod internal
pressure values by 5% or less, examination of model uncertainties revealed that rod internal pressure values can be significantly influenced by uncertainty in the fuel thermal conductivity and fission gas release models. Rod internal pressure values varied, on average, from the PWR and BWR base cases by approximately 32% and 60%, respectively, when the fuel thermal conductivity model is biased by ±0.5W/m-K. Biasing the diffusivity of the fission gas release model by ±2 resulted variations from the base case by 12% and 24% for PWR and BWR cases, respectively. Power uncertainty also had a significant influence on rod internal pressure. The uncertainty in steady state power has a major impact on the prediction of rod internal pressure. In addition, variation in AOO pulse height results rod internal pressures varying by 17% from the BWR base case. However, this effect was not as significant for the PWR, as the biased AOO pulse height only varied from the base case by 6%.
• Peak Fuel Centerline Temperature: Peak fuel centerline temperature values were insensitive to manufacturing uncertainty. However, biasing the fuel thermal conductivity model by ±0.5W/m-K resulted in variation from the PWR and BWR base cases by 20 and 22%, respectively. Power uncertainties have a major impact on peak fuel centerline temperature.
• Cladding Permanent Hoop Strain: Cladding permanent hoop strain values were insensitive to manufacturing uncertainty. However, model uncertainty in the fuel thermal conductivity and fuel thermal expansion models resulted in significant variation from the PWR and BWR base cases. Biasing the fuel thermal conductivity model by ±0.5W/m-K resulted in variations of 36 and 52% from the PWR and BWR base cases, respectively. Biasing the fuel thermal expansion model by ±15% resulted in variations of 19 and 21% from the PWR and BWR base cases, respectively. Power uncertainties also influence cladding permanent hoop strains. In particular, biasing the AOO pulse height by ±10% resulted in values that varied by 28 and 34% from the PWR and BWR base cases, respectively.
6.1
6.0 REFERENCES
1. Accuractus Fine Technical Ceramics and Glasses. Retrieved December 13, 2007, from http://www.accuratus.com/.
2. Amaya, M. and M. Hirai. 1997. “The effects of oxidation on the thermal conductivity of (U, M)O2 pellets (M=Gd and/or simulated soluble FPs)”, Journal of Nuclear Materials, 246:158-164.
3. Amaya, M., M. Hirai, H. Sakurai, K. Ito, M. Sasaki, T. Nomata. 2002. “Thermal conductivities of irradiated UO2 and (U, Gd)O2 pellets”, Journal of Nuclear Materials, 300:57-64.
4. Anderson, WK, CJ Beck, AR Kephart, and JS Theilacker. 1962. “Zirconium Alloys,” in Reactor Structural Materials: Engineering Properties as Affected by Nuclear Reactor Service, ASTM-STP-314, pp. 62-93. West Conshohocken, PA: American Society for Testing and Materials.
5. Arimescu, I. 2008. “Best-Estimate BWR Fuel Thermal Mechanical Analysis Based on Non-Parametric Order Statistics,” Proceeding of the 2008 Water Reactor Fuel Performance Meeting, Seoul, Korea, October, 2008.
6. Armstrong, P.E. and H.L. Brown. 1964. “Dynamic Young’s Modulus Measurements above 1000°C on Some Pure Polycrystalline Metals and Commercial Graphites”, Transactions of the Metallurgical Society of AIME 230, pp. 962-966.
7. ASME. 1968. 1967 ASME Steam Tables: Thermodynamic and Transport Properties of Steam Comprising Tables and Charts for Steam and Water. New York: American Society of Mechanical Engineers, pp. 76-78.
8. Baker, L. and L.C. Just, 1962. “Studies of Metal-Water Reactions at High Temperatures III. Experimental and Theoretical Studies of the Zirconium-Water Reaction”, ANL-6548, Argonne National Laboratory, Argonne, IL.
9. Baldock, P.J., W.E. Spindler and T.W. Bakeret. 1966. “The X-Ray Thermal Expansion of Near-Stoichiometric UO2,” Journal of Nuclear Materials, 18:305-313.
10. Balfour, M. G. 1982a. BR-3 High Burnup Fuel Rod Hot Cell Program, Final Report, Vol. 1. D0E/ET/34073-1, Westinghouse Electric Corporation, Pittsburgh, Pennsylvania.
11. Balfour, M.G. 1982b. Zorita Research and Development Program Vol. 1. Final Report. WCAP-10180, Westinghouse Electric Corporation, Pittsburg, PA.
12. Banks, DA. 1974. “Some Observations of Density and Porosity Changes in UO2 Fuel Irradiated in Water-Cooled Reactors,” Journal of Nuclear Materials, 54:97-107.
13. Barner, J. O., M. E. Cunningham, M. D. Freshley, and D. D. Lanning. 1990. High Burn up Effects Program Summary Report, DOE/NE/3406-1, Battelle, Pacific Northwest Laboratories, Richland, Washington.
14. Bates, J.L. 1970. High Temperature Thermal Conductivity of “Round Robin” Uranium Dioxide, BNWL-1431.
15. Berna, G.A., C.E. Beyer, K.L. Davis, and D.D. Lanning. 1997. FRAPCON-3: A Computer Code for the Calculation of Steady-State, Thermal-Mechanical Behavior of Oxide Fuel Rods for High Burnup, Pacific Northwest National Laboratory, NUREG/CR-6534 Vol. 2.
16. Beyer, C.E., 2007. Evaluation of Transient Gas Release for Radiological Source Terms, Letter report from K.J. Geelhood to J.C. Voglewede dated September 28, 2007.
17. Beyer, C.E. and D.D. Lanning, 1998. Review of Fuel Thermal Conductivity Data and Models, Proceedings from the Meeting on Thermal Performance of High Burn-Up LWR Fuel,Cadarache, France, March 3-6, 1998, pp. 57-70.

6.2
18. Beyer, C.E. and M.E. Cunningham. 1984. GT2R2: An Updated Version of GAPCON-THERMAL-2, NUREG/CR-3907, PNL-5178, Pacific Northwest National Laboratory, Richland, WA.
19. Bolmaro, RE and F. Povolo. 1988. “Anelastic behaviour of Materials under Multiaxial Strains: Part 2 Poisson’s ratio, Coupling of Strains and Anelastic Relaxation in Zircaloy-4,” Journal of Materials Science, 23:371.
20. Brokaw, RS. 1969. “Predicting Transport Properties of Dilute Gases,” I&EC Process Design and Development, 8(2):240-253.
21. Bunnell, LR, JL Bates, and GB Mellinger. 1983. “Some High-Temperature Properties of Zircaloy-Oxygen Alloys,” Journal of Nuclear Materials, 116(2-3):219-232.
22. Bunnell, L.R., G. B. Mellinger, J. L. Bates, and C. R. Hann. 1977. High Temperature Properties of Zircaloy-Oxygen Alloys, EPRI NP-524, Electric Power Research Institute, Palo Alto, CA.
23. Burdick, M.D., and H.S. Parker. 1956. “Effect of Particle Size on Bulk Density and Strength Properties of Uranium Dioxide Specimens,” Journal of the American Ceramic Society, 39: 181-187.
24. Busby, C.C. 1966. Properties of Zircaloy-4 Tubing, WAPD-TM-585, Bettis Atomic Power Laboratory, Pittsburg, PA.
25. Cathcart, J. V., Pawel, R. E., McKee, R. A. 1977. “Zirconium metal-water oxidation kinetics: IV. Reaction rate studies,” Technical report ORNL/NUREG-17, Oak Ridge National Laboratory, TN, USA.
26. Carbajo, J.J., G.L. Yoder, S.G. Popov and V. K. Ivanov. 2001. “A Review of the Thermophysical Properties of MOX and UO2 Fuels,” Journal of Nuclear Materials, 299:181-198.
27. Carrol, J.C., R.A. Gomme, and N.A. Leech. 1994. “Thermal Diffusivity Measurements on Unirradiated Archive Fuel, and Fuel Irradiated in the Halden IFA-558 Experiment,” Proceedings of the Enlarged HPG Meeting on High Burnup Fuel Performance, Safety and Reliability and Degradation of In-Core Materials and Water Chemistry Effects and Man-Machine Systems Research, 1994, HWR-345 paper 13. Bolkesjo, Norway Limited Distribution.
28. Chen, SHP and SC Saxena. 1973. “Experimental Determination of Thermal Conductivity of Nitrogen in the Temperature Range 100-2200°C,” High Temperature Science, 5(3):206-233.
29. Cheng, B., D. Smith, E. Armstrong, K. Turnage, and G. Bond. 2000. “Water Chemistry and Fuel Performance in LWRs,” Proceedings of the 2000 LWR Fuel Performance meeting, Park City, UT, April 10-13, 2000.
30. Cheung, H, LA Bromley, and CR Wilke. 1962. “Thermal Conductivity of Gas Mixtures,” American Institute of Chemical Eengineering Journal, 8(2):221-228.
31. Chirigos, JN, S Kass, WW Kirk, and GJ Salvaggio. 1961. “Development of Zircaloy-4,” Fuel Element Fabrication with Special Emphasis on Cladding Materials, London: Academic Press, pp. 19-56.
32. Christensen, J.A. 1963. “Thermal Expansion and Change in Volume of Uranium Dioxide on Melting,” Journal of the American Ceramic Society, 46:607-608.
33. Christensen, J.A. et al., 1964. “Uranium Dioxide Thermal Conductivity, “Transactions of the American Nuclear Society, 7, pp. 48-49.
34. CSN, ENUSA, 2002. “Characteristics of the ENUSA Rods Irradiated in the Vandellos II Reactor up to 68 GWd/t and Planned to be Used in the Cabri International Programme”, Note Cabri Water Loop, 2002/34.
35. Cunningham, M.E., C.E. Beyer, P.G. Medvedev, and G.A. Berna. 2001a. Fraptran: A Computer Code for the Transient Analysis of Oxide Fuel Rods, NUREG/CR-6739 Vol. 1, Pacific Northwest National Laboratory, Richland, WA.
6.3
36. Cunningham, M.E., C.E. Beyer, F.E. Panisko, P.G. Medvedev, G.A. Berna, H.H. Scott. 2001b. FRAPTRAN: Integral Assessment, NUREG/CR-6739 Vol. 2, Pacific Northwest National Laboratory, Richland, WA.
37. Cuta, J.M. 2007. FRAPTRAN Coolant Solution Option with New Heat Transfer Package Applied to LOCA and RIA Test Cases, PNNL report Transmitted via letter report from K.J. Geelhood to J.C. Voglewede June 14, 2007.
38. del Barrio, M.T., I. Vallejo, L.E. Herranz, 2006. “Analysis of FRAPCON-3 Models Related to High Burnup Fuel”, Proceeding of TopFuel 2006 Fuel Performance Meeting, Salamanca, Spain, October, 2006.
39. del Barrio, M.T. and L.E. Herranz, 2007. “FRAPTRAN Predictability of High Burnup Advanced Fuel Performance: Analysis of the CABRI CIPO-1 and CIPO-2 Experiments”, Proceedings of the 2007 LWR Fuel Performance/Top Fuel Meeting, San Francisco, CA, September 30 - October 3, 2007, paper 1046.
40. Dideon, CG and GM Bain. 1983. Fuel Performance under Extended Burnup for the B&W 15x15 Design, DOE/ET-34212-38. Babcock and Wilcox, Lynchburg, VA.
41. Duriez, C., J.-P. Allesandri, T. Gervais, and Y. Philipponneau. 2000. “Thermal Conductivity of Hypostoichiometric Low Pu Content (U,Pu)O2-x Mixed Oxide,” Journal of Nuclear Materials, 277:143-158.
42. Dutt, D.S., R.B. Baker and S.A. Chastain. 1974. Modeling of the Post-irradiation Fuel-Cladding Gap in Mixed-Oxide Fuels, HEDL-TME 74-19, Westinghouse Hanford Company, Richland, WA
43. Faubert, FM and GS Springer. 1972. “Measurement of the Thermal Conductivity of Argon, Krypton, and Nitrogen in the Range 800-2000°K,” Journal of Chemical Physics, 57(6):2333-2340.
44. Faubert, FM and GS Springer. 1973. “Measurement of the Thermal Conductivity of Helium up to 2100°K by the Column Method,” Journal of Chemical Physics, 58(10):4080-4083.
45. Feith, AD. 1966. Thermal Conductivity and Electrical Resistivity of Zircaloy-4, GEMP-669, General Electric Flight Propulsion Laboratory, Cincinnati, OH.
46. Fidleris. 1974 “Summary of Experimental Results on In-Reactor Creep and Irradiation Growth of Zirconium Alloys”, AECL-4766, Atomic Energy of Canada Ltd., Chalk River, ON.
47. Fink, JK. 2000a. “Zircaloy Thermal Conductivity,” International Nuclear Safety Center Material Properties Database, http://www.insc.anl.gov/matprop/zircaloy/index.php. Argonne National Laboratory, Argonne, IL.
48. Fink, J.K. 2000a. “Thermophysical Properties of Uranium Dioxide,” Journal of Nuclear Materials, 279:1-18.
49. Franklin, D.G. 1982. “Zircaloy-4 Cladding Deformation During Power Reactor Irradiation,” Zirconium in the Nuclear Industry: Fifth Conference, ASTM-STP-754, Ed. DG Franklin, American Society for Testing and Materials, West Conshohocken, PA, pp. 235-267.
50. Franklin, D.G. , G.E. Lucas, A.L. Bement. 1983. “Creep of Zirconium Alloys in Nuclear Reactors”, ASTM STP 815, American Society for Testing and Materials, West Conshohocken, PA.
51. Freshley, M.D., D.W. Brite, J.L. Daniel, and P.E. Hart. 1976. “Irradiation-Induced Densification of UO2 Pellet Fuel,” Journal of Nuclear Materials, 62:138-166.
52. Freshley, M.D., D.W. Brite, J.L. Daniel, and P.E. Hart. 1978. “Irradiation-Induced Densification and PuO2 Particle Behavior in Mixed-Oxide Pellet Fuel,” Journal of Nuclear Materials, 81:63-92.

6.4
53. Fuketa, T., H. Sasajima, Y. Mori, and K. Ishijima. 1997. “Fuel Failure and Fission Gas Release in High Burnup PWR Fuels under RIA Conditions,” Journal of Nuclear Materials, 248:249.
54. Fuketa, T., H. Sasajima, and T. Sugiyama. 2001. “Behavior of High-Burnup PWR Fuels with Low-Tin Zircaloy-4 Cladding under Reactivity-Initiated-Accident Conditions,” Nuclear Technology, 133:50.
55. Galbraith, K.P., 1973. Pellet-Cladding Gap Closure from Pellet Cracking Data and Analysis, XN-73-17, Exxon Nuclear Corporation, Richland, WA
56. Gambhir, R.S., J.M. Gandhi, and S.C. Saxena. 1967. “Thermal Conductivity of Rare Gases, Deuterium and Air,” Indian Journal of Pure and Applied Physics, 5:457-463.
57. Garde, A.M. 1986. Hot Cell Examination of Extended Burnup Fuel from Fort Calhoun, DOE/ET-34030-11 (CEND-427), Combustion Engineering, Windsor, CT.
58. Garner, R.W., D.T. Sparks, R.H. Smith, P.H. Klink, D.H. Schwieder, and P.E. MacDonald. 1978. Gap Conductance Test Series 2, Test Results Report for Tests GC2-1,2-2 and 2-3, NUREG/CR-0300, TREE-1268, EG&G Idaho, Inc., Idaho Falls, ID.
59. Garnier, S.E., and S. Begej. 1979a. Ex-Reactor Determination of Thermal Gap and Contact Conductance between Uranium Dioxide:Zircaloy-4 Interfaces Stage 1: Low Gas Pressure, NUREG/CR-0030 vol.1, PNL-2696, Pacific Northwest National Laboratory, Richland, WA.
60. Garnier, S.E., and S. Begej, 1979b. Ex-Reactor Determination of Thermal Gap and Contact Conductance between Uranium Dioxide:Zircaloy-4 Interfaces Stage 2: High Gas Pressure, NUREG/CR-0030 vol.2, PNL-2696, Pacific Northwest National Laboratory, Richland, WA.
61. Geelhood, K.J. 2005a. “FRAPTRAN 1.3,” Published to FRAPCON/FRAPTRAN code users group, from http://www.pnl.gov/frapcon3/.
62. Geelhood, K.J. 2005b. Letter report from Ken Geelhood to John Voglewede dated November 21, 2005, Evaluation of FEA versions of FRAPCON and FRAPTRAN.
63. Geelhood, K.J. 2006. Letter report from Ken Geelhood to John Voglewede dated April 5, 2006, Evaluation of FEA versions of FRAPCON and FRAPTRAN.
64. Geelhood, K.J. and C.E. Beyer. 2008. “Temperature and Fission Gas Release Predictions from UO2 and MOX Fuel using FRAPCON-3,” Proceedings of the Enlarged Halden Programme Group Meeting, May, 2008, Loen, Norway.
65. Gibby, R.L. 1971. “The Effect of Plutonium Content on the Thermal Conductivity of (U, Pu)O2 Solid Solutions,” Journal of Nuclear Materials, 38:163-177.
66. Gilbon, D., A. Soniak, S. Doriot, and J.P. Mardon. 2000. “Irradiation Creep and Growth Behavior, and Microstructural Evolution of Advanced Zr-Base Alloys,” Zirconium in the Nuclear Industry: Twelfth International Symposium, ASTM-STP-1354, Ed. GP Sabol and GD Moan, American Society of Testing and Materials, West Conshohocken, PA, pp. 51-73.
67. Gilchrist, K.E. 1976. “Thermal Property Measurements on Zircaloy-2 and Associated Oxide Layers up to 1200°C,” Journal of Nuclear Materials, 62:257-264.
68. Gilchrist, K.E. 1979. “Thermal Conductivity of Oxide Deposited on Zircaloy Fuel Tube Material: A Continuation of Previous Work,” Journal of Nuclear Materials, 82:193-194.
69. Godfrey T.G., et al. 1964. Thermal Conductivity of Uranium Dioxide and Armco Iron by an Improved Radial Heat Flow Technique, ORNL-3556, Oak Ridge National Laboratory, Oak Ridge, TN.
70. Goldsmith, L.A. and J.A.M. Douglas. 1973. “Measurements of the Thermal Conductivity of Uranium Dioxide at 670-1270K,” Journal of Nuclear Materials, 47:31-42.

6.5
71. Gray, P. and P.G. Wright. 1961. “Thermal Conductivity of Mixtures of Nitrogen, Ammonia and Hydrogen,” Proceedings of the Royal Society of London, A263(1313):161-168.
72. Grønvold, F. 1955. “High-Temperature X-Ray Study of Uranium Oxides in the UO2-U3O8 Region,” Journal of Inorganic and Nuclear Chemistry, 1:357-370.
73. Hagrman, D.L., G.A. Reymann, and R.E. Mason. 1981. MATPRO-Version 11 (Revision 2). A Handbook of Materials Properties for Use in the Analysis of Light Water Reactor Fuel Rod Behavior, NUREG/CR-0479 (TREE-1280, Rev. 2), EG&G Idaho, Inc., Idaho Falls, ID.
74. Hayashi, H. et al. 2003. “Outside-in Failure of High Burnup BWR Segmented Rods Caused by Power Ramp Tests,” Proceedings of the 2003 TopFuel Conference, March 16-16, 2003 Wurzburg, Germany
75. Hirai, M. and S. Ishimoto. 1991. “Thermal Diffusivities and Thermal Conductivities of UO2-Gd2O3”, Journal of Nuclear Science and Technology, pp. 995-1000. Hirano, Y., Y. Muzumi, K. Kamimura, and Y. Tsukuda. 2005. Irradiation Characteristics of BWR High Burnup 9x9 Lead Use Assemblies, Proceedings of the 2005 Water Reactor Fuel Performance Meeting, October 2-6, 2005 Kyoto, Japan.
76. Hirano, Y., Y. Muzumi, K. Kamimura, and Y. Tsukuda. 2005. “Irradiation Characteristics of BWR High Burnup 9x9 Lead Use Assemblies”, Proceedings of the 2005 Water Reactor Fuel Performance Meeting, October 2-6, 2005 Kyoto, Japan.
77. Hobson, I.C., R. Taylor, and J.B. Ainscough. 1974. “Effect of Porosity and Stoichiometry on the Thermal Conductivity of Uranium Dioxide,” Journal of Physics Section D: Applied Physics, 7:1003-1015.
78. Ibbs, T.L. and A.A. Hirst. 1929. “Thermal Conductivity of Gas Mixtures,” Proceedings of the Royal Society of London, A123(791):134-142.
79. Ibrahim, E.F. 1973. “In-reactor tubular creep of Zircaloy-2 at 260 to 300 °C”, Journal of Nuclear Materials, 46:169-182.
80. Itagaki, N., K. Kakuichi, F. Yasuhiro, T. Furuya, and O. Kubota. 2003. “Development of New High Corrosion Resistance Zr Alloy ‘HIFI’,” Proceedings of the 2003 TopFuel Conference, March 16-16, 2003 Wurzburg, Germany.
81. Jain, P.C. and S.C. Saxena. 1975. “Transport Properties of Helium in the Temperature Range 400-2300K,” Chemical Physics Letters, 36(4):489-491.
82. Jody, B.J., S.C. Saxena, V.P.S. Nain, and R.A. Aziz. 1977. “Thermal Conductivity of Helium: A Proble for the Repulsive Wall of the Interatomic Potential,” Chemical Physics, 22:53-58.
83. Johnston, H.L. and E.R. Grilly. 1946. “The Thermal Conductivities of Eight Common Gases Between 80° and 380°K,” Journal of Chemical Physics, 14(4):233-238.
84. Kannuluik, W.G. and E.H. Carman. 1952. “The Thermal Conductivity of Rare Gases,” Proceedings of the Physical Society, 65:701-709.
85. Kearns, J.J. 1965. Thermal Expansion and Preferred Orientation in Zircaloy, WAPD-TM-472 Westinghouse Electric Corporation, Bettis Plant, Pittsburg, PA.
86. Kearns, J.J. 1968. “Dissolution Kinetics of Hydride Platelets in Zircaloy-4”, Journal of Nuclear Materials, 27:64.
87. Kempter, C.P., and R.O. Elliott. 1959. “Thermal Expansion of UN, UO2, UO2-ThO2, and ThO2,” The Journal of Chemical Physics, 30:1524-1526.
88. Keyes, F.G. 1952. The Heat Conductivity, Viscosity, Specific Heat and Prandtl Numbers for Thirteen Gases, Project Squid Technical Report No. 37, Massachusetts Institute of Technology, Cambridge, MA.
89. Kingery, W.D., et al. 1954. “Thermal Conductivity: X, Data for Several Pure Oxide Materials Corrected to Zero Porosity,” Journal of the American Ceramic Society, 37:107-110.
6.6
90. Kitaguawa, K. T. Takahashi, Y. Shinohara, M. Sugano, Y. Kosaka, and T. Sendo. 2005. “Post Irradiation Examination of fuel rods in 55GWd/t Lead Use Assembly,” Proceedings of 2005 Water Reactor Fuel Performance Meeting, October 2-6, 2005, Koyoto, Japan.
91. Kjaerheim, G. and E. Rolstad. 1967. In-Pile Determination of UO2 Thermal Conductivity, Density Effects and Gap Conductance, HPR-80, Halden Reactor Project, Halden, Norway.
92. Klecha, L. 2005. Comparative Integral Irradiation Test on Gadolinium Fuel (IFA-681), HWR-815, Halden Reactor Project, Halden, Norway.
93. Knott, R.P., R.L. Kesterson, L.G. Hallstadius, and M.Y. Young. 2003. “Advanced PWR Fuel Designs for High Duty Operation,” Proceedings from the ENS TopFuel 2003 Meeting, March 16-19, 2003, Wurzburg, Germany.
94. Kreith, F. 1964. Principles of Heat Transfer, 8th Edition, Scranton: International Book Company.
95. Krett, V. and J. Cleveland. 1997. “Thermophysical Properties of Materials for Water Cooled Reactors,” IAEA-TECDOC-949, International Atomic Energy Agency, Vienna, Austria, pp. 67-84.
96. Lafchiev, K., and T. Tverberg. 2005. “Review of the HBWR Data Base on Fuel Swelling Behaviour”, HWR-822, OECD Halden Reactor Project.
97. Lanning, D.D., and C.R. Hann, 1975. Review of Methods Applicable to the Calculation of Gap Conductance, BNWL-1894, Battelle Northwest Laboratories, Richland, WA.
98. Lanning, D.D. and M.E. Cunningham. 1981. “Trends in Thermal Calculations for Light Water Reactor Fuel (1971-1981),” Proceedings of the Ninth Water Reactor Safety Research Information Meeting, Gaithersburg, Maryland, Oct. 26-30,1981.
99. Lanning, D. D. 1981. "The Possible Impact of Fuel Pellet Cracking on Inferred Gap Conductance and Stored Energy", Nuclear Technology, 56:565-574.
100. Lanning, D.D., C.E. Beyer, and C.L. Painter. 1997a. FRAPCON-3: Modifications to Fuel Rod Material Properties and Performance Models for High-Burnup Application, NUREG/CR-6534 Vol. 1, Pacific Northwest National Laboratory, Richland, WA.
101. Lanning, D.D., C.E. Beyer, and G.A. Berna. 1997b. FRAPCON-3: Integral Assessment, NUREG/CR-6534 Vol. 3, Pacific Northwest National Laboratory, Richland, WA.
102. Lanning, D.D., C.E. Beyer, and K.J. Geelhood. 2005a. FRAPCON-3 Updates, Including Mixed-Oxide Fuel Properties, NUREG/CR-6534, Vol. 4, Pacific Northwest National Laboratory, Richland, WA.
103. Lanning, D.D., K.J. Geelhood, L.J. Ott, and C.E. Beyer. 2005b. “Comparison of FRAPCON-3.3 to Mixed Oxide Fission Gas Release Data”, Proceedings of the Enlarged Halden Programme Group Meeting, October, 2005, Lillehammer, Norway, F4(5).
104. Lapshov, V.N., and A.V. Bashkatov. 1973. “Thermal Conductivity of Coatings of Zirconium Dioxide Applied by the Plasma Sputtering Method,” Heat Transfer, Soviet Research, 5:19-22.
105. Lassman, K., C. O’Carrol, J. VanderLarr, and C.T. Walker. 1994. “The Radial Distribution of Plutonium in High Burnup UO2 Fuels,” Journal of Nuclear Materials, 208:223-231.
106. Lassman, K., C.T. Walker, J. van de Laar. 1998. “Extension of the TRANSURANUS Burnup Model to Heavy Water Reactor Conditions,” Journal of Nuclear Materials, 255:222-233.
107. Ledberger, G., M. Limback, and S. Abolhassani. 2005. Characterisation of High Burn-up Fuel Irradiated in KKL, Proceedings of the 2005 Water Reactor Fuel Performance Meeting, October 2-6, 2005 Kyoto, Japan.

6.7
108. Leyse, R.H. 2003. “Unmet Challenges for SCDAP/RELAP5-3D. Analysis of Severe Accidents for Light Water Nuclear Reactors with Heavily Fouled Cores,” 2003 RELAP5 International Users Seminar, West Yellowstone, Montana, 27-29 August 2003.
109. Limbäck, M. and T. Andersson. 1996. “A Model for Analysis of the Effect of Final Annealing on the In- and Out-of-Reactor Creep Behavior of Zircaloy Cladding, “Zirconium in the Nuclear Industry: Eleventh International Symposium, ASTM STP 1295, E.R. Bradley and G.P. Sabol, Eds., American Society for Testing and Materials, pp. 448-468.
110. Lucks, C.F. and H.W. Deem. 1958. Progress Relating to Civilian Applications During June, 1958: Thermal Conductivity of Uranium and UO2, BMI-1273, Battelle Memorial Institute, Columbus, OH, pp. 7-9.
111. Lucuta, P.G., H.S. Matzke, and I.J. Hastings. 1996. “A Pragmatic Approach to Modeling Thermal Conductivity of Irradiated UO2 Fuel: Review and Recommendations,” Journal of Nuclear Materials, 232:166-180.
112. Maglic, K.D., N.Lj. Perovic, and A.M. Stanimirovic. 1994. “Calorimetric and Transport Properties of Zircaloy 2, Zircaloy 4, and Inconel 625,” International Journal of Thermophysics, 15(4):741-755.
113. Maki, H. 1973. “Heat Transfer Characteristics of Zircaloy-2 Oxide Film,” Journal of Nuclear Science and Technology, 10:107-175.
114. Mardon, J.P. and N. Waeckel. 2003. “Behavior of M5™ Alloy under LOCA Conditions,” Proceedings from ENS TopFuel 2003 Meeting, March 16-19, 2003, Wurzburg, Germany.
115. Martin, D.G. 1988. “The Thermal Expansion of Solid UO2 and (U, Pu) Mixed Oxides – A Review and Recommendations,” Journal of Nuclear Materials, 152:94-101.
116. Massih, A.R., S. Persson, and Z. Weiss. 1992. “Modeling of (U,Gd)O2 Fuel Behavior in Boiling Water Reactors”, Proceeding of Symposium E on Nuclear Materials for Fission Reactors of the 1991 E-MRS Fall Conference, Journal of Nuclear Materials, 188:323-330.
117. Mason, E.A. and H. von Ubisch. 1960. “Thermal Conductivities of Rare Gas Mixtures,” Physics of Fluids, 3(3):355-361.
118. Matsuo, Y. 1987. “Thermal Creep of Zircaloy-4 Cladding under Internal Pressure,” Journal of Nuclear Science and Technology, Vol. 24, No. 2, pp. 111-119.
119. MatWeb – Online Material Information Resource. Retrieved December 13, 2007, from http://www.matweb.com/
120. Mehan, R.L. 1958. Modulus of Elasticity of Zircaloy-2 Between Room Temperature and 1000°F, KAPL-M-RLM-16, Knolls Atomic Power Laboratory, Schenectady, NY.
121. Mehan, R.L. and F.W. Wiesinger. 1961. Mechanical Properties of Zircaloy-2, KAPL-2110, Knolls Atomic Power Laboratory, Schenectady, NY.
122. Miller, R.W. 1980. “On-Line Measurement of Gap Properties by Gas Exchange and Pressurization Results of Experiments with NRC/EG&G Rig, IFA-430,” HPR-0243, Halden Reactor Project, Halden, Norway.
123. Minato, K., T. Shiratori, H. Serizawa, K. Hayashi, K. Une. 2001. “Thermal conductivities of irradiated UO2 and (U, Gd)O2”, Journal of Nuclear Materials, 288:57-65.
124. Momin, A.C., E.B. Mirza, and M.D. Mathews. 1991. “High Temperature X-Ray Diffractometric Studies on the Lattice Thermal Expansion Behavior of UO2, ThO2, and (U0.2Th0.8)O2 Doped with Fission Products,” Journal of Nuclear Materials, 185:308-310.

6.8
125. Murabayashi, M., S. Tanaka, and Y. Takahashi. 1975. “Thermal Conductivity and Heat Capacity of Zircaloy-2, -4 and Unalloyed Zirconium,” Journal of Nuclear Science and Technology, 12(10):661-662.
126. Mutyala, M. 2004. “Westinghouse Fuel Direction,” Proceedings of the 2004 International LWR Fuel Performance Meeting, September 19- 22, 2004, Orlando, Florida.
127. Nakamura, T., K. Kusagaya, T. Fuketa, and H. Uetsuka. 2002. “High-Burnup Fuel Behavior under Simulated Reactivity-Initiated Accident Conditions,” Nuclear Technology, 138:46.
128. Newman, L.W. 1986. The Hot Cell Examination of Oconee 1 Fuel Rods after Five Cycles of Irradiation, DOE/ET-34212-50, Babcock and Wilcox, Lynchburg, VA.
129. Newman, L.W. 1982. Development and Demonstration of an Advanced Extended-Burnup Fuel Assembly Design Incorporating Urania-Gadolinia, DOE/ET/34212-36, Babcock and Wilcox, Lynchburg, VA.
130. Northwood, D.O., I.M. London, L.E. Bähen. 1975. “Elastic Constant of Zirconium Alloys”, Journal of Nuclear Materials, 55:299-310.
131. O’Donnell, G.M., H.H. Scott, and R.O. Meyer. 2001. “Comparative Analysis of Fuel Designs,” NUREG-1754, United States Nuclear Regulatory Commission, Washington D.C.
132. OECD. 1995. Scientific Issues in Fuel Behavior; a report by an NEA Nuclear Science Committee Task Force. Nuclear Energy Agency, Organization for Economic Cooperation and Development. January 1995.
133. Oguma, M. 1983. "Cracking and Relocation Behavior of Nuclear Fuel Pellets During Rise to Power" Nuclear Engineering and Design, 76:35-45.
134. Padel, A. and A. Groff. 1976. “Variation du Module de Young du Zirconium β en Fonction de la Temperature”, Journal of Nuclear Materials, 59:325-326.
135. Papin, J., B. Cazalis, J.M Frizonnet, E. Federici, F. Lemoine. 2003. “Synthesis of Cabri-RIA Tests Interpretation”, Transactions of The EuroSafe Forum 2003, Paris, France.
136. Peggs, I.D., A.M. Stadnyk, and D.P. Godin. 1976. “Thermophysical Properties of Zirconium-Alloy Fuel-Channel Components,” High Temperature – High Pressures 8:441-450.
137. Philipponneau, Y. 1992. “Thermal conductivity of (U, Pu)O2−x mixed oxide fuel”, Journal of Nuclear Materials, 188:194-197.
138. Powers, A.E. 1961. Application of the Ewing Equation for Calculating Thermal Conductivity from Electrical Conductivity, KAPL-2146. Knolls Atomic Power Laboratory, Schenectady, NY.
139. Pyecha, T.D. 1985. “Waterside Corrosion of PWR Fuel Rods Through Burnups of 50,000 MWd/MTU,” Proceedings of ANS/ENS International Topical Meeting on Light Water Reactor Fuel Performance, April, 1985, Orlando, FL.
140. Ronchi, C.M. Sheindlin, M. Musella, and G.L. Hyland. 1999. “Thermal Conductivity of Uranium Dioxide Up to 2900K from Simultaneous Measurement of the Heat Capacity and Thermal Diffusivity,” Journal of Applied Physics 85(2):776-789.
141. Ronchi, C., M. Sheindlin, D. Staicu, and M. Kinoshita. 2004. “Effect of Burnup on the Thermal Conductivity of Uranium Dioxide up to 100,000 MWd/t,” Journal of Nuclear Materials, 327:58-76.
142. Ross-Ross, P.A. and C.E.L. Hunt. 1968. “The in-reactor creep of cold-worked Zircaloy-2 and Zirconium-2.5 wt % niobium pressure tubes”, Journal of Nuclear Materials, 26:2-17.
143. Saxena, S.C. and V.K. Saxena. 1970. “Thermal Conductivity Data for Hydrogen and Deuterium in the Range 100-1100°C,” Journal of Physics A, 3(3):309-320.

6.9
144. Saxena, V.K. and S.C. Saxena. 1968a. “Measurement of the Thermal Conductivity of Helium Using a Hot-Wire Type of Thermal Diffusion Column,” Journal of Physics D: Applied Physics, 1(2):1341-1351.
145. Saxena, V.K. and S.C. Saxena. 1968b. “Measurement of the Thermal Conductivity of Argon Using Hot-Wire Type Thermal Diffusion Columns,” Chemical Physics Letters, 2(1):44-46.
146. Saxena, V.K. and S.C. Saxena. 1969. “Thermal Conductivity of Krypton and Xenon in the Temperature Range 350-1500K,” Journal of Chemical Physics, 51(8):3361-3368.
147. Scott, D.B. 1965. Physical and Mechanical Properties of Zircaloy-2 and -4, WCAP-3269-41, Westinghouse Atomic Power Division, Pittsburgh, PA, pp. 5 - 9.
148. Segura J.C., and C. Bernaudat, 2002. Fuel Characterization Data and Power History of the Rod which is to be tested in the CARI-WL CIPO-2 Test. Note CABRI Water Loop 2002/27.
149. Sell, H. -J., S. Trapp-Pirtsching, and F. Garzarolli. 2006. “Effect of Alloying Elements and Impurities on in-BWR Corrosion of Zirconium Alloys”, Journal of ASTM International, January 2006, 3(1).
150. Small, GJ. 1987. “Densification of Uranium Dioxide at Low Burn-Up,” Journal of Nuclear Materials, 148:302-315.
151. Smalley, W. R. 1971. Saxton Core II Fuel Performance Evaluation. WCAP-3385-56, Westinghouse Electric Corporation, Pittsburgh, Pennsylvania.
152. Smith, G.P. 1983. The Evaluation and Demonstration of Methods for Improved Fuel Utilization. DOE/ET/34010-10, Combustion Engineering, Windsor, Connecticut.
153. Smith, G.P. 1986. The Nondestructive Examination of Fuel Assemblies with Standard and Advanced Design after Three Cycles of Irradiation. DOE/ET/34013-12, Combustion Engineering, Windsor, Connecticut.
154. Smith, G.P., R.C. Pirek, H.R. Freeburn, and D. Schrire. 1994. The Evaluation and Demonstration of Methods for Improved Nuclear Fuel Utilization, DOE/ET-34013-15, Combustion Engineering, Windsor, CT.
155. Soniak, A., N. L’Hullier, J-P. Mardon, V. Rebeyrolle, P. Boffioux, C. Bernaudat. 2002. “Irradiation Creep Behavior of Zr-Base Alloys,” Zirconium in the Nuclear Industry: Thirteenth International Symposium, ASTM STP 1423, G.D. Moan and P. Rudling, Eds. ASTM International, West Conshahocken, PA, pp.837-862.
156. Sontheimer, F. and K.L. Nissen, 1994. “Evaluation of the Stress Reversal Creep Experiment IFA-585 in the HBWR and the Lift-Off Experiment ROPE-1 in the R2 Studsvik using the Siemens/KWU Clad Creep Model,” Enlarged HPG Meeting on High Burn-up Fuel Performance, Safety and Reliability and Degradation of In-Core Materials and Water Chemistry Effect and Man-Machine Systems Research, HPR-345/28.
157. Spasic, E. et al. 1968. Conference on the Use of Zirconium Alloys in Nuclear Reactors, Marlanske Lanze, Czechoslovakia, USAEC CONF-681086, pp 277-284.
158. Springer, G.S. and E.W. Wingeier. 1973. “Thermal Conductivity of Neon, Argon, and Xenon at High Temperatures,” Journal of Chemical Physics, 59(5):2747-2750.
159. Standard Review Plan for the Review of Safety Analysis Reports for Nuclear Power Plants (NUREG-0800), Section 4.2, “Fuel System Design,” Rev. 3 (March 2007) U.S. Nuclear Regulatory Commission, Washington D.C.
160. Stefanov, B., L. Zarkova, and D. Oliver. 1976. “Measurement of the Thermal-Conductivity Coefficient of Gases and Vapors up to 2500°K,” High Temperature, 14(1):48-57.
161. Timrot, D.L. and E.E. Totskii. 1965. “Dilatometric Method for the Experimental Determination of the Thermal Conductivity of Corrosive Gases and Vapors at High Temperatures,” High Temperature, 3:685-690.

6.10
162. Timrot, D.L. and A.S. Umanskii. 1965. “Investigation of the Thermal Conductivity of Helium in the Temperature Range 400-2400°K,” High Temperature, 3:345-351.
163. Timrot, D.L. and A.S. Umanskii. 1966. “Thermal Conductivity of Hydrogen and Argon,” High Temperature, 3:285-287.
164. Tokar, M., and A.W. Nutt. 1972. “Thermal Expansion of PuO2 from 25 to 1420˚C,” Transactions of the American Nuclear Society, 15:21-211.
165. Tolonen, P. and T. Tverberg. 2005. Halden Gd. Fuel Experiments IFA-515, IFA-636, and IFA-681, Proceedings from the Enlarged Halden Programme Group Meeting, Lillehammer, Norway, October 16-21, 2005, Session F5, Paper 3.
166. Tolonen, P., and J.R. Andres. 2005. Observations on Thermal-Mechanical Performance on the First Cycle of Irradiation in IFA-681.1, Proceedings from the Enlarged Halden Programme Group Meeting, Lillehammer, Norway, October 16-21, 2005, Session F5, Paper 8.
167. Tsederberg, N.V. 1965. Thermal Conductivity of Gases and Liquids. The MIT Press, Cambridge, MA , pp. 110-115.
168. Tsukuda, Y., Y. Kosaka, S.Doi, T. Sendo, P. Gonzales, and J.M Alonso. 2003. “Performance of Advanced Fuel Materials for High Burnup,” Proceedings of ENS TopFuel 2003 Meeting, March 16-16, 2003, Wurzburg, Germany.
169. Tverberg, T., B. Volkov, and J.C. Kim. 2005. Final Report on the UO2-Gd2O3 fuel performance test in IFA-636, HWR-817, Halden Reactor Project, Halden, Norway.
170. Une, K. and S. Ishimoto. 2003. “Dissolution and Precipitation Behavior of Hydrides in Zircaloy-2 and Fe Zircaloy”, Journal of Nuclear Materials, 322:66.
171. U.S. NRC “An Acceptable Model and Related Statistical Methods for the Analysis of Fuel Densification” Regulatory Guide 1.126 Rev. 1 March (1978)
172. Vallejo, I., M.T. del Barrio, L.E. Herranz, 2004. “Major Sensitivities of Fission Gas Release Modeling within the FRAPCON-3 Code”, Proceedings of the 2004 International Meeting on LWR Fuel Performance, Orlando, FL, September 19-22, 2004, paper 1071.
173. Vargaftik, N.B. and L.V. Yakush. 1971. “Measurement of the Thermal Conductivities of Neon, Krypton, and Xenon over a Wide Range of Temperatures,” Journal of Engineering Physics, 21(3):1156-1161.
174. Vargaftik, N.B. and N.Kh. Zimina. 1964. “Thermal Conductivity of Nitrogen at High Temperatures,” High Temperature, 2(6):782-790.
175. Volkov, B. and T. Tverberg. 2002. Irradiation Performance of Commercial UO2 and UO2-Gd2O3 Fuel (IFA-636); Data Qualification and Power Recalibration, HWR-723, Halden Reactor Project, Halden, Norway.
176. von Ubisch, H. 1959. “The Thermal Conductivities of Mixtures of Rare Gases at 29°C and at 520°C,” Arkiv für Fysik, 16(7):93-100.
177. Weilbacker, J.C. 1972. “Diffusivite Thermique de l’Oxyde d’Uranium et de l’Oxyde de Thorium a Haute Temperature,” High Temperature – High Pressure, 4:431-438.
178. West, J. S., S. E. Kasib, and S. Y. Ogawa. 1983. EOC9-Final Fuel Bundle Examination at Monticello Nuclear Generating Station. DOE/ET/34031-16, General Electric Company, San Jose, California.
179. Williford R.E., C.L. Mohr, D.D. Lanning, M.E. Cunningham, W.N. Rausch, and E.R. Bradley, 1980. Interim Report: The Analysis of Fuel Relocation for the NRC/PNL Halden Assemblies IFA-431,IFA-432, and IFA-513, NUREG/CR-0588, PNL-2709, Pacific Northwest Laboratory, Richland, Washington.
180. Wright, J. 2004. The SBR MOX and UO2 Comparison Test in Gas Flow Rig IFA-633: Results after Seven Cycles of Irradiation, HWR-764 Halden Reactor Project, Halden, Norway.

6.11
181. Yasuyuki, O., A. Moriyasu, K. Kazuo, F. Takuji, O. Koichi, and I. Noburu. 2007. “The Effects of Cladding Chemical Composition on Corrosion Behavior of High Burnup BWR Fuel (Corrosion Properties of Low Iron and Low Silicon Content Cladding)”, Proceedings of the 2007 International LWR Fuel Performance Meeting, September 30- October 3, 2007, San Francisco, California.
182. Zacharie, I., S. Lansiart, P. Combette, M. Trotabas, M. Coster, and M. Groos. 1998. “Thermal Treatment of Uranium Oxide Irradiated in Pressurized Water Reactor: Swelling and Release of Fission Gases,” Journal of Nuclear Materials, 255(2-3):85-91.
183. Zaitseva, L.S. 1959. “An Experimental Investigation of the Heat Conductivity of Monatomic Gases over Wide Temperature Intervals,” Soviet Physics Technical Physics, 4:444-450.

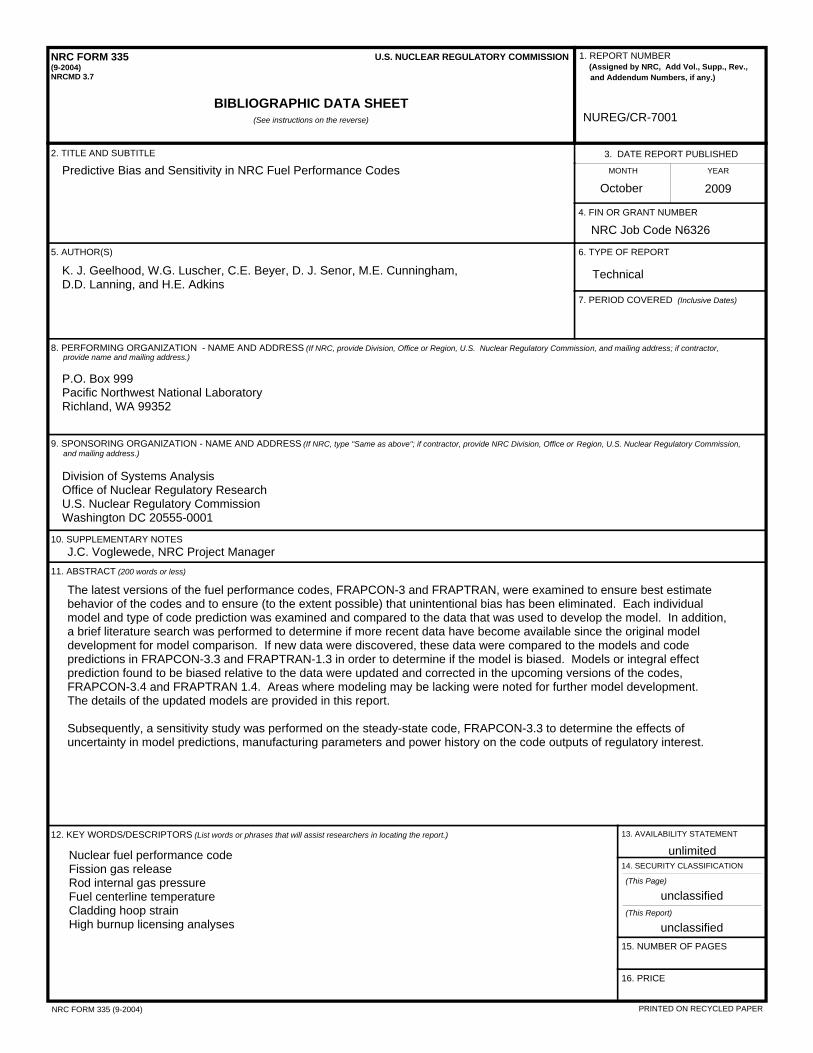
BIBLIOGRAPHIC DATA SHEET(See instructions on the reverse)
NRC FORM 335(9-2004)NRCMD 3.7
U.S. NUCLEAR REGULATORY COMMISSION 1. REPORT NUMBER(Assigned by NRC, Add Vol., Supp., Rev.,
and Addendum Numbers, if any.)
3. DATE REPORT PUBLISHED
MONTH YEAR
4. FIN OR GRANT NUMBER
2. TITLE AND SUBTITLE
5. AUTHOR(S) 6. TYPE OF REPORT
7. PERIOD COVERED (Inclusive Dates)
8. PERFORMING ORGANIZATION - NAME AND ADDRESS (If NRC, provide Division, Office or Region, U.S. Nuclear Regulatory Commission, and mailing address; if contractor,
9. SPONSORING ORGANIZATION - NAME AND ADDRESS (If NRC, type "Same as above"; if contractor, provide NRC Division, Office or Region, U.S. Nuclear Regulatory Commission,
provide name and mailing address.)
and mailing address.)
10. SUPPLEMENTARY NOTES
11. ABSTRACT (200 words or less)
12. KEY WORDS/DESCRIPTORS (List words or phrases that will assist researchers in locating the report.)
14. SECURITY CLASSIFICATION
13. AVAILABILITY STATEMENT
unlimited
(This Page)
unclassified(This Report)
unclassified15. NUMBER OF PAGES
16. PRICE
NRC FORM 335 (9-2004) PRINTED ON RECYCLED PAPER
NUREG/CR-7001
Predictive Bias and Sensitivity in NRC Fuel Performance CodesOctober 2009
NRC Job Code N6326
K. J. Geelhood, W.G. Luscher, C.E. Beyer, D. J. Senor, M.E. Cunningham,D.D. Lanning, and H.E. Adkins
Technical
P.O. Box 999Pacific Northwest National LaboratoryRichland, WA 99352
Division of Systems AnalysisOffice of Nuclear Regulatory ResearchU.S. Nuclear Regulatory CommissionWashington DC 20555-0001
J.C. Voglewede, NRC Project Manager
The latest versions of the fuel performance codes, FRAPCON-3 and FRAPTRAN, were examined to ensure best estimatebehavior of the codes and to ensure (to the extent possible) that unintentional bias has been eliminated. Each individualmodel and type of code prediction was examined and compared to the data that was used to develop the model. In addition,a brief literature search was performed to determine if more recent data have become available since the original modeldevelopment for model comparison. If new data were discovered, these data were compared to the models and codepredictions in FRAPCON-3.3 and FRAPTRAN-1.3 in order to determine if the model is biased. Models or integral effectprediction found to be biased relative to the data were updated and corrected in the upcoming versions of the codes,FRAPCON-3.4 and FRAPTRAN 1.4. Areas where modeling may be lacking were noted for further model development.The details of the updated models are provided in this report.
Subsequently, a sensitivity study was performed on the steady-state code, FRAPCON-3.3 to determine the effects ofuncertainty in model predictions, manufacturing parameters and power history on the code outputs of regulatory interest.
Nuclear fuel performance codeFission gas releaseRod internal gas pressureFuel centerline temperatureCladding hoop strainHigh burnup licensing analyses


UN
ITED STATES
NU
CLEA
R R
EGU
LATORY C
OM
MISSIO
NW
AS
HIN
GTO
N, D
C 20555-0001
--------------------O
FFICIA
L BU
SIN
ES
S