
Predictive Analytics in Malaysian Dengue Data from 2010...
13
Int. J. Advance Soft Compu. Appl, Vol. 8, No. 3, December 2016 ISSN 2074-8523 Predictive Analytics in Malaysian Dengue Data from 2010 until 2015 using BigML Zanariah Zainudin 1 , and Siti Mariyam Shamsuddin 1 1 UTM Big Data Centre, Universiti Teknologi Malaysia, 81310 Skudai, Johor e-mail: [email protected], [email protected] Abstract When era big data has reached to Malaysia, our government realized that all data are streaming all over the Internet from various data sources like sensors, social media data, excel spreadsheets, reviews, customer data, and etc. There are a lot data from our government need to be analysis which is can help decision making in the future. This Malaysia Open data can be analysis to help the government to predict what the next planning to do. In this paper, we use the Malaysia Open Data Government Portal about Malaysian Dengue Hotspot from 2010 until 2015. In the days, machine learning algorithms and technologies were mostly used by scientists, tech geeks or domain experts. However, several organizations are now using machine learning online and offline tool to make these technologies available to the masses to people outside. Online and offline tool make it easy for developers to apply machine learning to a dataset so as to add predictive features to their applications. In this paper, we used BigML which it provide online platform to integrate machine learning in real world applications and to predict the most popular place for Dengue to get an early warning and awareness to the people. BigML use the decision tree algorithms to do data analytics and prediction the popular place. In this case, we are using BigML to predict the place which always dengue occur in Malaysia which is also called as hotspot. Keywords: Malaysian Dengue Hotspot, Predictive Analytics, BigML.
Transcript of Predictive Analytics in Malaysian Dengue Data from 2010...

Int. J. Advance Soft Compu. Appl, Vol. 8, No. 3, December 2016 ISSN 2074-8523
Predictive Analytics in Malaysian Dengue Data from 2010 until 2015 using BigML
Zanariah Zainudin1, and Siti Mariyam Shamsuddin1
1UTM Big Data Centre,
Universiti Teknologi Malaysia, 81310 Skudai, Johor e-mail: [email protected],
Abstract When era big data has reached to Malaysia, our government
realized that all data are streaming all over the Internet from various data sources like sensors, social media data, excel spreadsheets, reviews, customer data, and etc. There are a lot data from our government need to be analysis which is can help decision making in the future. This Malaysia Open data can be analysis to help the government to predict what the next planning to do. In this paper, we use the Malaysia Open Data Government Portal about Malaysian Dengue Hotspot from 2010 until 2015. In the days, machine learning algorithms and technologies were mostly used by scientists, tech geeks or domain experts. However, several organizations are now using machine learning online and offline tool to make these technologies available to the masses to people outside. Online and offline tool make it easy for developers to apply machine learning to a dataset so as to add predictive features to their applications. In this paper, we used BigML which it provide online platform to integrate machine learning in real world applications and to predict the most popular place for Dengue to get an early warning and awareness to the people. BigML use the decision tree algorithms to do data analytics and prediction the popular place. In this case, we are using BigML to predict the place which always dengue occur in Malaysia which is also called as hotspot.
Keywords: Malaysian Dengue Hotspot, Predictive Analytics, BigML.

19 Predictive Analytics in Malaysian Dengue Data
1 Introduction to Dengue Fever Dengue fever is a disease carried where it transported through mosquitoes to human and has five type Aedes mosquito which called as DEN-1, DEN-2, DEN-3, DEN-4 and DEN-5. In Malaysia, there are only two type of Aedes mosquito which called as aedes aegypti and aedes albopictus as illustrated in figure 1 below [1].
Fig. 1: Aedes Mosquito (Wikipedia)
This disease used to be called “break-bone fever” because it sometimes causes severe joint and muscle pain that feels like bones are breaking. The symptom of dengue fever is the patient will getting rash, fever and muscle and joint pain as illustrated below in Figure 2.
Figure 2: Symptoms of Dengue Fever (Wikipedia)
Dengue disease is a tropical and subtropical mosquito-borne viral illness, and is a major health concern in Malaysia. The war against dengue fever the most important vector borne disease in Malaysia, has yet to be won[2], [3]. Throughout

Zainudin. Z and Shamsuddin S.M 20
the years, Selangor has been the champion, bearing about half of the total number of dengue fever cases in Malaysia which shown in Figure 3 below.
Fig.3: Hotspot for Dengue in Selangor based on Website IDengue for community (Government Portal, 2016)
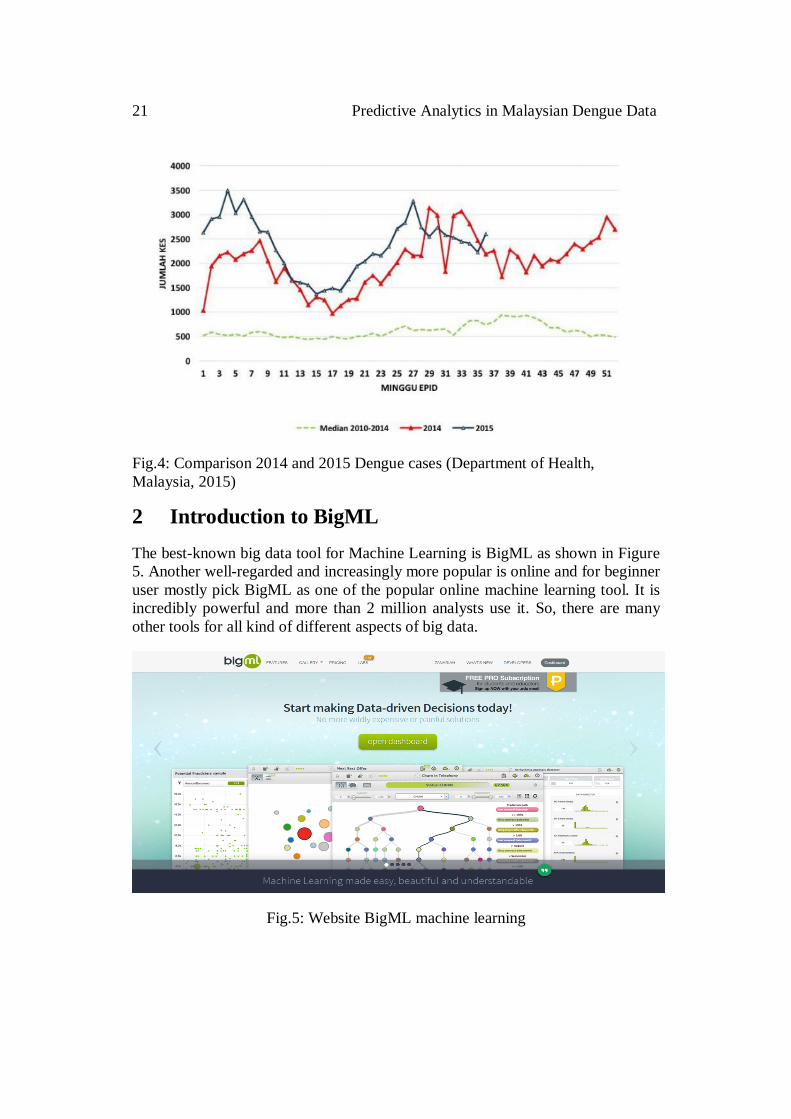
Based on statistics on Department of Health on September 2015in Figure 4, there were 85,488 cases of dengue with 234 deaths reported in Malaysia for 2015. This is 21.5% higher compared with the same reporting period of 2014 (n=70,337) (Figure 2). From 6 to 12 September 2015, there were 2,604 cases of dengue reported, 17% higher than the number of cases reported in the previous week (n=2,230)[4]. Weekly dengue cases has been decreasing for the eight consecutive week. In August 2015, DEN-1 has been the dominant serotype (60%).
21 Predictive Analytics in Malaysian Dengue Data
Fig.4: Comparison 2014 and 2015 Dengue cases (Department of Health, Malaysia, 2015)
2 Introduction to BigML The best-known big data tool for Machine Learning is BigML as shown in Figure 5. Another well-regarded and increasingly more popular is online and for beginner user mostly pick BigML as one of the popular online machine learning tool. It is incredibly powerful and more than 2 million analysts use it. So, there are many other tools for all kind of different aspects of big data.
Fig.5: Website BigML machine learning

Zainudin. Z and Shamsuddin S.M 22
BigML's goal is to create a machine learning service extremely easy to use and seamless to integrate. In BigML’s, it has use the decision tree as one of machine learning tool to analyse the dataset. It is because the decision tree is a decision support tool is can be seen as a tree-like graph of decisions in the outcomes. This algorithm is usually used in operations research specifically in decision analysis to help a best solution to achieve goal.
3 Introduction to Open Data Portal Government As we can see in Figure 6, open data website has been launch by YAB Dato' Seri Mohd Najib bin Tun Abdul Razak in 25th MSC Malaysia Implementation Council Meeting on 14 November 2013. In this meeting, it also have decided that:
All agencies in government must collaborate with MAMPU dan MDeC to develop a structured framework national Big Data. All government agencies must give appropriate data to be analysis in term of bid data analytics. As we can see in Figure 3, there are iniciative from government to publish data in every sector in Ministry to get analytics from the data itself.
MAMPU and MDeC will collaborate with four (4) apprentice project Big Data Analytics (BDA). BDA is used for improve the quality of government decision based on fact and data.
Fig.6: Website Malaysian Open Data Government Portal (2016)
4 Research Methodologies In order to classify and develop the prediction model, the flow chart of the research methodologies as depicted in Figure 7 below is applied.

23 Predictive Analytics in Malaysian Dengue Data
Fig.7: Flow chart of research methodologies process
4.1 Data Collection
The data used in this paper was taken from the official Malaysia Open Data Government Portal. The data is provided by the Ministry of Health Malaysia, starting from the week beginning February 22, 2010 up to the week beginning Jun 26, 2015 [5], [6]. The data collected represents the accumulated number of dengue cases reported in Malaysia. The data used in our work was collected for a longer period of time (over 5 years) where are briefly explained in Table 1 below:
Table 1: Information on dataset Malaysian Dengue Cases 2010-2015 Topic : Total cases in dengue spread in all state in Malaysia
from 2010 until 2015
Description : These dataset show the cases in dengue in every week in all state from year 2010 until 2015.
Ministry : Ministry of Health
Instances: 11430
Attribute: 94
Distribution dataset: Imbalance dataset because we can see there are more data on the left side
Data Collection
Data Pre-processing
Load Data
Result Analysis
Classifier and Prediction Modelling

Zainudin. Z and Shamsuddin S.M 24
4.2 Data Pre-processing
We need to undergo the pre-processing part, before doing the data analysis due to many reason such as[7]:
Lacking of the attribute values where contain only a few data
Noisy where contain many errors and outlier values
Inconsistent where contain different name for the same attribute/value This problem happen in real time databases and data warehouse. It affect the quality of the dataset. For this case, the Malaysia Dengue dataset have error on name of district, the format of the data itself and need to be transform into specific format. Based on the raw dataset we get from the Open Data Portal Government, the dataset are not ready yet to be put inside BigML tool. Using excel and other tool for the data cleaning, the Malaysian dengue dataset are ready to be analysis using the BigML tool as show in Figure 8 below.
Fig.8: Illustration on Data Cleaning process [8]
As we can see in Table 2, the raw dataset from Malaysian dengue has been pre-processing and the location for hot spot for Dengue is in Petaling Jaya where this location have 4827 cases from 2010 until 2015 followed by Hulu Langat, 1898 cases and third place for hot spot Dengue cases is in Kota Bharu where have 1124 cases.
Table 2: Location for Hotspot Dengue Fever Cases Location No. Dengue Cases Petaling 4827 Hulu Langat 1898 Kota Bharu 1124 Gombak 860 Kinta 637 Seremban 192

25 Predictive Analytics in Malaysian Dengue Data
Hulu Selangor 136 Sepang 119 MBJB 105 MPAJ 98 Cheras 88
For better visualisation, the pie chart in Figure 9 show more briefly on the hotspot location for Dengue cases. Mostly the hotspot location is in Selangor, where the first hotspot location is Petaling, and second location is Hulu Langat. After than Gombak, Hulu Selangor, Sepang, Setapak, Cheras, Klang and Klang Lama. In conclusion the Selangor is the state that have many dengue fever cases.
Fig.9: Pre-processing data from dataset Malaysian Dengue Cases 2010-2015
We can see from the Figure 10 illustrated in this paper that some place in Selangor are very popular with dengue spread. This study aims to develop forecasting hotspot models based on the number of dengue fever occurrence in areas in Selangor, namely Petaling and Hulu Langat.

Zainudin. Z and Shamsuddin S.M 26
Fig.10: Analysis by BigML Website for Hotspot in Malaysian Dengue Cases 2010-2015
Fig.11:Data distribution on Malaysian Dengue Cases 2010-2015 (Training Dataset) In this study, we found that there was a regular hotspot pattern for our input data. Therefore one prediction model turned out to be a good choice for our prediction hotspot for Malaysian Dengue cases as it can deal with irregular observable variables and produces model with low variances. We started with a simple model with only the previous hot spot number of dengue cases as input, and then gradually incorporated other data factors (i.e. dengue spreading day, total of

27 Predictive Analytics in Malaysian Dengue Data
dengue cases ) to improve the performance of our model which been illustrated in Figure 11[3], [6], [9].
4.3 Classification using Decision Tree classifier
Classification is the process mapping the data set into similar categories or classes. Using the dataset, a model of experiments is been performed. The data has been categorized to two category as stated below:
Training-70% ( data for training)
Testing-30% ( data for testing) For example in this dataset, the decision tree will have the root and internal nodes contain attribute to divide the data into different characteristics. All the terminal node are assigned to the hotspot location for Dengue in Malaysia. It will used to trace the path in the decision tree to predict the class label of the Malaysian Dengue Dataset, and the path terminates at a leaf node labeled the Hotspot location[6], [9], [10],[11], [12].
5 Prediction on Malaysian hotspot dengue cases The accuracy of the model is summarized in terms of classification accuracy, precision, recall, F-score and phi score. We can see the accuracy is 76.27%. As we can see that, we get the accuracy 76.27 % because of the distribution dataset are more to the left. It cause an imbalance dataset we get from the Malaysia Open Data Government Portal.
Table 3: Performance Analysis on Dataset Malaysian Dengue Cases 2010-2015 Accuracy: 76.27%.
Average Precision : 34.08%
Average Recall : 37.13%
Average F Measure : 0.34
Average Phi: 0.34
The accuracy of the model is summarized in terms of classification accuracy, precision, recall, F-score and phi score. As we can see that, we get the accuracy 76.27 % and very low of precision and recall result this is because of the distribution of the dataset are more to the left. It cause an imbalance dataset we get from the Malaysia Open Data Government Portal.
Zainudin. Z and Shamsuddin S.M 28
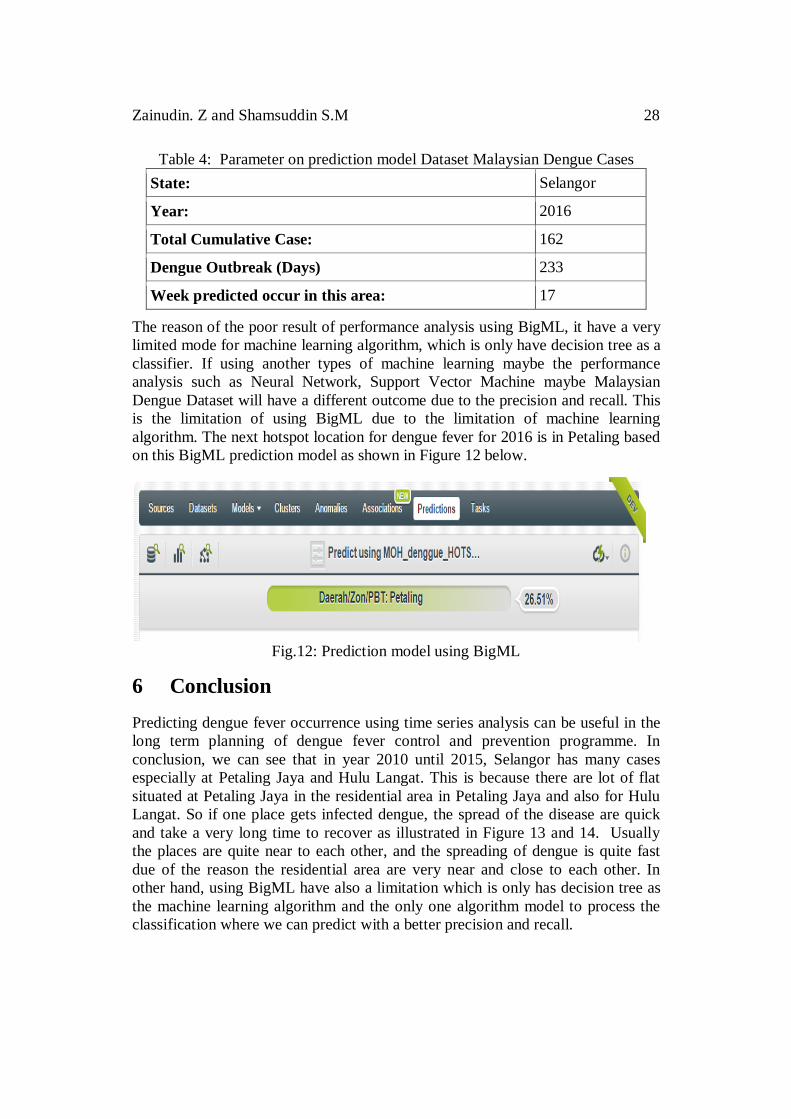
Table 4: Parameter on prediction model Dataset Malaysian Dengue Cases State: Selangor
Year: 2016
Total Cumulative Case: 162
Dengue Outbreak (Days) 233
Week predicted occur in this area: 17
The reason of the poor result of performance analysis using BigML, it have a very limited mode for machine learning algorithm, which is only have decision tree as a classifier. If using another types of machine learning maybe the performance analysis such as Neural Network, Support Vector Machine maybe Malaysian Dengue Dataset will have a different outcome due to the precision and recall. This is the limitation of using BigML due to the limitation of machine learning algorithm. The next hotspot location for dengue fever for 2016 is in Petaling based on this BigML prediction model as shown in Figure 12 below.
Fig.12: Prediction model using BigML
6 Conclusion Predicting dengue fever occurrence using time series analysis can be useful in the long term planning of dengue fever control and prevention programme. In conclusion, we can see that in year 2010 until 2015, Selangor has many cases especially at Petaling Jaya and Hulu Langat. This is because there are lot of flat situated at Petaling Jaya in the residential area in Petaling Jaya and also for Hulu Langat. So if one place gets infected dengue, the spread of the disease are quick and take a very long time to recover as illustrated in Figure 13 and 14. Usually the places are quite near to each other, and the spreading of dengue is quite fast due of the reason the residential area are very near and close to each other. In other hand, using BigML have also a limitation which is only has decision tree as the machine learning algorithm and the only one algorithm model to process the classification where we can predict with a better precision and recall.

29 Predictive Analytics in Malaysian Dengue Data
Fig.13: Residential Area in Petaling Jaya.
Fig.14: Residential Area in Hulu Langat.
ACKNOWLEDGEMENTS The authors would like to express their greatest appreciation to the Malaysian Open Data Government Portal and Ministry of Health, Malaysia for their kind approval and support towards the completion of this study. Awards of UTM Flagship Grant 13H82 is greatly appreciated. The authors also wish to thank UTM Big Data Centre for supporting this research.
References [1] T. William and J. Menon, “A review of malaria research in Malaysia,” Med. J.
Malaysia, vol. 69, no. August, pp. 82–87, 2014.
[2] D. N. Pham, T. Aziz, A. Kohan, S. Nellis, J. binti A. Jamil, J. J. Khoo, D. Lukose, A. Bakar, and A. Sattar, “an Efficient Method To Predict Dengue Outbreaks in Kuala Lumpur,” Proceeding 3rd Int. Conf. Artif. Intell. Comput. Sci., no. October, pp. 169–178, 2015.
[3] N. N. A. Husin, N. Salim, and A. R. A. Ahmad, “Simulation of Dengue Outbreak Prediction,” Proc. Postgrad. Annu. Res. Semin., pp. 374–379, 2006.
[4] Y. L. Hii, R. A. Zaki, N. Aghamohammadi, and J. Rocklöv, “Research on Climate and Dengue in Malaysia: A Systematic Review,” Curr. Environ. Heal. Reports, vol. 3, pp. 81–90, 2016.

Zainudin. Z and Shamsuddin S.M 30
[5] A. H. Mohd-Zaki, J. Brett, E. Ismail, and M. L’Azou, “Epidemiology of Dengue Disease in Malaysia (2000–2012): A Systematic Literature Review,” PLoS Negl. Trop. Dis., vol. 8, no. 11, p. e3159, 2014.
[6] C. C. Ho and C. Ting, “Time Series Analysis and Forecasting of Dengue Using Open Data,” no. May 2015.
[7] B. Gallagher and T. Eliassi-Rad, “An examination of experimental methodology for classifiers of relational data,” Proc. - IEEE Int. Conf. Data Mining, ICDM, pp. 411–416, 2007.
[8] J. Han, M. Kamber, and J. Pei, Data Mining. 2012.
[9] A. Ibrahim, N. Azan, M. Zin, and N. S. Ashaari, “Simulation Model for Predicting Dengue Fever Outbreak,” World Acad. Sci. Eng. Technol., vol. 59, pp. 67–69, 2011.
[10]Y. Yusof and Z. Mustaffa, “Dengue Outbreak Prediction : A Least Squares Support Vector Machines Approach,” Int. J. Comput. Theory Eng., vol. 3, no. 4, pp. 489–493, 2011.
[11]D. THITIPRAYOONWONGSE, “Data mining of dengue infection using decision tree,” Entropy, pp. 154–159, 2012.
[12]S. R. Safavian and D. Landgrebe, “A Survey of Decision Tree Classifier Methodology,” IEEE Trans. Syst. Man Cybern., vol. 21, no. 3, pp. 660–674, 1991.


![Dengue Fever/Severe Dengue Fever/Chikungunya Fever · Dengue fever and severe dengue (dengue hemorrhagic fever [DHF] and dengue shock syndrome [DSS]) are caused by any of four closely](https://static.fdocuments.net/doc/165x107/5e87bf3e7a86e85d3b149cd7/dengue-feversevere-dengue-feverchikungunya-dengue-fever-and-severe-dengue-dengue.jpg)
