Prediction of the gas liquid volumetric mass transfer...
23
Prediction of the gas /liquid volumetric mass transfer coefficients in surface-aeration and gas-inducing reactors using neural networks R. Lemoine a , B. Fillion a , A. Behkish a , A.E. Smith b , B.I. Morsi a, * a Chemical and Petroleum Engineering Department, University of Pittsburgh, 1249 Benedum Hall, Pittsburgh, PA 15261, USA b Industrial and Systems Engineering Department, Auburn University, Auburn, AL, USA Received 6 May 2002; received in revised form 30 October 2002; accepted 30 October 2002 Abstract Almost all available literature correlations to predict the volumetric gas /liquid mass transfer coefficient, k L a in agitated reactors are systems- or operating conditions-dependent. In this study, two back-propagation neural networks (BPNNs), one dimensional and one dimensionless were developed to correlate k L a for numerous gas /liquid systems in both surface-aeration reactors (SAR) and gas-inducing reactors (GIR) operating under wide ranges of industrial conditions. A total of 4435 experimental data points obtained from more than 10 publications for 50 gas /liquid systems were used to train, validate the dimensional and dimensionless BPNNs, which were able to correlate all k L a values with R 2 of 90.5 and 88.6%, respectively. The dimensional BPNN was used to predict the effect of various operating parameters on k L a in a number of important industrial processes. The predictions showed that increasing liquid viscosity decreased k L a values in the SAR, while k L a values in the GIR increased and then decreased with increasing liquid viscosity, following the gas holdup behavior. Increasing liquid density decreased k L a in both reactor types. Increasing liquid surface tension increased k L a values in the SAR, whereas in the GIR, k L a decreased due to the increase of bubble size. Increasing gas diffusivity or gas partial pressure or mixing speed, increased k L a in both reactor types. k L a values in the GIR were always higher than those in the SAR and increasing D Imp. /D T and H F /H L increased k L a in both reactor types. # 2003 Elsevier Science B.V. All rights reserved. Keywords: Back-propagation neural network; Gas /liquid systems; Gas-inducing reactors; Surface-aeration reactors; Volumetric gas-liquid mass transfer coefficient 1. Introduction The design, scale-up and optimization of industrial processes conducted in multiphase agitated reactors require, among others, precise knowledge of the hydro- dynamics, mass and heat transfer parameters and reaction kinetics. Literature data available indicate that the gas /liquid mass transfer is generally the rate- limiting step in many industrial processes [1] and hence the focus of this paper is on the assessment of the volumetric gas /liquid mass transfer coefficient, k L a , in agitated reactors. Tables 1 and 2 present available literature correlations for k L a in surface-aeration reac- tors (SAR) and gas-inducing reactors (GIR), respec- tively. From these tables it appears that these correlations were proposed to predict k L a values for a specific gas / liquid system under ambient conditions or high pressures and temperatures as a function of dimensionless numbers [3 /6,8,15 /23], specific power input [2,3,7,11 /13,24] or non-linear statistical correlations [9,10]. Although sup- posedly independent of the gas /liquid system, k L a values predicted using the dimensionless correlations often provide large deviations when compared with experi- mental data [25 /27]. Similarly, k L a predicted using the specific power input correlations frequently deviates from the actual experimental values obtained under typical industrial conditions, since these correlations do not directly account for the effects of pressure and/or temperature on k L a . The statistical correlations, on the other hand, are claimed to predict k L a with confidence levels greater than 97.5% [9,10,28,29], but they are specific to the gas /liquid system and reactor employed. Thus, there is a great need for developing k L a correla- * Corresponding author. Fax: /1-412-624-9639. E-mail address: [email protected] (B.I. Morsi). Chemical Engineering and Processing 42 (2003) 621 /643 www.elsevier.com/locate/cep 0255-2701/03/$ - see front matter # 2003 Elsevier Science B.V. All rights reserved. doi:10.1016/S0255-2701(02)00211-8
Transcript of Prediction of the gas liquid volumetric mass transfer...

Prediction of the gas�/liquid volumetric mass transfer coefficients insurface-aeration and gas-inducing reactors using neural networks
R. Lemoine a, B. Fillion a, A. Behkish a, A.E. Smith b, B.I. Morsi a,*a Chemical and Petroleum Engineering Department, University of Pittsburgh, 1249 Benedum Hall, Pittsburgh, PA 15261, USA
b Industrial and Systems Engineering Department, Auburn University, Auburn, AL, USA
Received 6 May 2002; received in revised form 30 October 2002; accepted 30 October 2002
Abstract
Almost all available literature correlations to predict the volumetric gas�/liquid mass transfer coefficient, kLa in agitated reactors
are systems- or operating conditions-dependent. In this study, two back-propagation neural networks (BPNNs), one dimensional
and one dimensionless were developed to correlate kLa for numerous gas�/liquid systems in both surface-aeration reactors (SAR)
and gas-inducing reactors (GIR) operating under wide ranges of industrial conditions. A total of 4435 experimental data points
obtained from more than 10 publications for 50 gas�/liquid systems were used to train, validate the dimensional and dimensionless
BPNNs, which were able to correlate all kLa values with R2 of 90.5 and 88.6%, respectively. The dimensional BPNN was used to
predict the effect of various operating parameters on kLa in a number of important industrial processes. The predictions showed
that increasing liquid viscosity decreased kLa values in the SAR, while kLa values in the GIR increased and then decreased with
increasing liquid viscosity, following the gas holdup behavior. Increasing liquid density decreased kLa in both reactor types.
Increasing liquid surface tension increased kLa values in the SAR, whereas in the GIR, kLa decreased due to the increase of bubble
size. Increasing gas diffusivity or gas partial pressure or mixing speed, increased kLa in both reactor types. kLa values in the GIR
were always higher than those in the SAR and increasing DImp./DT and HF/HL increased kLa in both reactor types.
# 2003 Elsevier Science B.V. All rights reserved.
Keywords: Back-propagation neural network; Gas�/liquid systems; Gas-inducing reactors; Surface-aeration reactors; Volumetric gas-liquid mass
transfer coefficient
1. Introduction
The design, scale-up and optimization of industrial
processes conducted in multiphase agitated reactors
require, among others, precise knowledge of the hydro-
dynamics, mass and heat transfer parameters and
reaction kinetics. Literature data available indicate
that the gas�/liquid mass transfer is generally the rate-
limiting step in many industrial processes [1] and hence
the focus of this paper is on the assessment of the
volumetric gas�/liquid mass transfer coefficient, kLa , in
agitated reactors. Tables 1 and 2 present available
literature correlations for kLa in surface-aeration reac-
tors (SAR) and gas-inducing reactors (GIR), respec-
tively. From these tables it appears that these correlations
were proposed to predict kLa values for a specific gas�/
liquid system under ambient conditions or high pressures
and temperatures as a function of dimensionless numbers
[3�/6,8,15�/23], specific power input [2,3,7,11�/13,24] or
non-linear statistical correlations [9,10]. Although sup-
posedly independent of the gas�/liquid system, kLa values
predicted using the dimensionless correlations often
provide large deviations when compared with experi-
mental data [25�/27]. Similarly, kLa predicted using the
specific power input correlations frequently deviates
from the actual experimental values obtained under
typical industrial conditions, since these correlations do
not directly account for the effects of pressure and/or
temperature on kLa . The statistical correlations, on the
other hand, are claimed to predict kLa with confidence
levels greater than 97.5% [9,10,28,29], but they are
specific to the gas�/liquid system and reactor employed.
Thus, there is a great need for developing kLa correla-* Corresponding author. Fax: �/1-412-624-9639.
E-mail address: [email protected] (B.I. Morsi).
Chemical Engineering and Processing 42 (2003) 621�/643
www.elsevier.com/locate/cep
0255-2701/03/$ - see front matter # 2003 Elsevier Science B.V. All rights reserved.
doi:10.1016/S0255-2701(02)00211-8
tions in agitated reactors, which would be system-
independent and could be used for proper design and
scale-up of industrial processes.Recently, artificial neural networks (ANNs) have
been employed in different industrial applications in
order to describe, control or model complex chemical
processes, as shown in Tables 3 and 4. Iliuta et al. [35]
used neural networks to correlate a and kLa in trickle-
bed reactors over wide ranges of industrial operating
conditions. Yang et al. [25] developed a neural network
to correlate kLa in gas sparging reactors (GSR),
operating under atmospheric conditions, however, their
study was limited to oxygen transfer into a Newtonian
coalescing liquid.The purpose of this study is to develop a more general
and system-independent correlation based on back-
propagation neural networks (BPNN), which accounts
for the various observed trends of kLa in the literature
for SAR and GIR. The methodology used to develop
and validate the neural networks was described and one
dimensionless and another dimensional ANN correla-
tions were developed. The dimensional neural network
Table 1
Literature survey on kLa in SAR
Author Gas Liquid Operating conditions Correlations
Matsumura et al. [2] �/ Water, alcohols �/ kLa /�DO�/309(P*/VL)0.6oG0.6
Albal et al. [3] O2 Water 13.8�/96.5 bar kLa�/2.579�/10�2DA0.5(P*/VL)0.6oG
0.6
298 K
13.3�/20 Hz
Albal et al. [3] O2 Water, glycerin, CMC, triton
CF-32
6�/97 bar
295�/573 K
Sh�/1.41�/10�2Sc0.5Re0.67We1.29
Versteeg et al. [4] CO2 Water, alkanol�/amine aqueous 1.3�/10.1 bar Sh�/0.064Sc0.5Re0.72
N2O 291�/356 K
179B/Re B/12471
117B/Sc B/13 487
Mizan [5] H2 C3H6 n -hexane 0.922B/Fr B/2.073 Sh�/51.7�/109Fr2.20Re�1.12(1�/W s)4.31
C2H4 67 100B/Re B/1643 000
C3H6 0B/Ws B/30
Mizan et al. [6] H2 C3H6 0.922B/Fr B/2.073 Sh�/55.2Fr2.07Re1.20We�1.34
C2H4 198 000B/Re B/445 100
741B/We B/31 060
Wu [7] Air Water�/Na2SO3�/CoSO4 1.2B/P*/VLB/8.5 kW/m3 kLa�/6.34�/10�2(P*/VL)0.65
Tekie et al. [8] N2 Cyclohexane 2100B/We B/13 300 Sh�/4.51�/103We�0.21Fr0.92
O2 1B/Fr B/3
Tekie et al. [9] N2
O2
Cyclohexane x1: 6.67B/N B/20.00 Hz
x2: 7B/P B/35 bar
x3: 330B/T B/430 K
x4: 0.171B/H B/0.268 m
N2 : ln(kLa )�/�/2.90�/0.358x1�/0.071x2�/
0.285x3�/0.184x4�/0.393x12�/0.059x2
2�/
0.044x32�/0.063x4
2�/2.902 exp(�/0.2(x1�/
0.204)2)�/0.044 exp(0.1(x1�/3)(4�/x4))
O2 : ln(kLa )�/�/2.933�/0.106x1�/0.096x2�/
0.231x3�/0.122x4�/0.382x12�/0.05x2
2�/
0.031x32�/0.07x4
2�/2.902 exp (�/
0.173(x1)2)�/0.114 exp(0.1(x1�/3)(4�/x4))
Fillion and Morsi [10] N2
H2
Soybean oil x1: 373B/T B/473 K
x2: 10B/N B/23.3 Hz
x3: 0.171B/H B/0.268 m
x4: 1B/P B/5 bar
N2 : ln(kLa )�/�/6.50�/0.177x1�/0.474x2�/
0.407x3�/0.053x32�/0.0798x2x3
H2 : ln(kLa )�/�/5.99�/0.229x1�/0.471x2�/
0.473x3�/0.0445x12�/0.0524x3
2�/0.126x2x3
R. Lemoine et al. / Chemical Engineering and Processing 42 (2003) 621�/643622

Table 2
Literature survey on kLa in GIR
Authors Induction type Gas Liquid Operating conditions Correlations
Joshi and Sharma [11] Hollow shaft�/Hollow impeller CO2 Na2CO3�/NaHCO3 0.41B/DTB/1.00.35B/DImp./DTB/0.75
UG B/0.005:kLa�/6.8�/10�3(P*/VL)0.55UG
0.5
HB/DTB/0.5DImp./10B/HImp.B/DImp./3
UG �/0.005:kLa�/3.26�/10�3(P*/VL)0.55UG
0.25
3B/N B/11.7 Hz0.0003B/UGB/0.032 m �/s�1
1B/P*/VLB/15 kW/m3
0.04B/kLa B/0.3 s�1
Kara [12] Hollow shaft�/Rushton turbine H2 Tetraline SRCII 70�/135 bar606�/684 K
kLa�/(3.439/1.13)�/10�4(P*/VL)0.8090.09(HL/DT)�1.990.66
50�/400 rpmP*/VLB/119 W/m3
Sawant et al. [13] Denver type impeller Air Water�/sodium sulfate 5B/N B/36 rev/s kLa�/0.0195�/(P*/VL)0.5
0.5B/H ?/DImp.B/1.5
Karandikar et al. [14] Hollow shaft�/Rushton turbine COH2
F-T waxF-T wax�/water
7�/45 bar423�/498 K
CO and H2 : kLa�/0.1607(N /1000)3.42
exp(0.108�/P )�/0.046CO2
CH4
700�/1000 rpm CO2 and CH4 : kLa�/0.0171(N /1000)6.05 exp(0.38�/P )�/0.00525
Chang et al. [15] Hollow shaft�/Rushton turbine N2
H2
n -hexane 177B/Eu B/22321913B/We B/7239
Sh�/6.67�/1026Re�2.6
Sc0.1Eu�1.0We4.2
CH4 8.6B/Sc B/28.5146 000B/Re B/290 000
Chang and Morsi [16] Hollow shaft�/Rushton turbine N2
CH4
Water, n -hexane 560B/Eu B/10 960760B/We B/7410
Sh�/2.39�/10�28Re4.86
Sc2.55Eu0.350We0.34
14B/Sc B/128102 400B/Re B/282 600
Chang and Morsi [17] Hollow shaft�/Rushton turbine N2 n -decane 1582B/We B/6528 Sh�/2.95�/1014Re�1.41Fr4.74We�1.32
H2 63 433B/Re B/216 626CH4 1.15B/Fr B/2.59
Dietrich et al. [18] Hollow shaft�/Rushton turbine H2 Water, ethanol, hydrogenation mixt. ofadiponitril
VR�/500 ml0.25B/VLB/0.38 dm3
H/DT �/1: Sh�/3�/10�4Re1.45
Sc0.5We0.5
H/DT �/1.4 : Sh�/1.5�/10�4Re1.45
Sc0.5We0.5
Hichri et al. [19] Hollow shaft�/Turbine H2 2-propanol 104B/Sh B/5�/105 Sh�/0.123Re0.44Sc0.5We1.27(VG/VL)1.1
o -cresol 7�/103B/Re B/13�/104
500B/Sc B/900180B/We B/5501.2B/VG /VLB/1.7
Chang and Morsi [20] Hollow shaft�/Rushton turbine CO n -hexanen -decane
730B/Eu B/10 7378B/Sc B/487
Sh�/3.41�/10�20Re3.06
Sc2.43Eu0.16We0.93
n -tetradecane 1688B/We B/11 33239 506B/Re B/333 924
R.
Lem
oin
eet
al.
/C
hem
ical
En
gin
eering
an
dP
rocessin
g4
2(
20
03
)6
21�
/64
36
23

Table 2 (Continued )
Authors Induction type Gas Liquid Operating conditions Correlations
Chang [21] Hollow shaft�/Rushton turbine COCO2
n -C6n -C10
546B/Eu B/11 3208B/Sc B/491
Sh�/5.114�/10�12Re2.18
Sc1.63Eu0.28Fr1.73
CH4 n -C14 31 101B/Re B/338 4091.2B/Fr B/2.6
Chang [21] Hollow shaft�/Rushton turbine H2 n -C6n -C10n -C14
569B/Eu B/10 4681676B/We B/772110B/Sc B/151
Sh�/2.74�/10�18Re3.00
Sc2.21Eu�0.42We1.29
68 926B/Re B/264 882
Koneripalli et al. [22] Hollow shaft�/Rushton turbine N2
COMethanol, ethanol 288B/Eu B/9640
7B/Sc B/220Sh�/4.88�/106Re�3.81
Sc0.23We4.48Eu0.09
H2 63 000B/Re B/385 000CO2 2000B/We B/14 700CH4
Heim et al. [23] Hollow shaft Air Water, fermentation mixtures 0.28B/Fr *B/1.4933 000B/Re B/260 000
4-pipe impeller: Sh*/9.5�/10�5�/1�/
exp(�/19.64Re�0.216Fr *1.336)6-pipe impeller: Sh*/1.06�/10�4�/1�/
exp(�/21.63Re�0.234Fr *1.207)Disk impeller: Sh*/1.04�/10�4�/1�/
exp(�/1331.20Re�0.557Fr *2.498)
Tekie et al. [8] Hollow shaft�/Rushton turbine N2
O2
Cyclohexane 2100B/We B/13 3001B/Fr B/3
Sh�/4.51�/103We�0.21Fr0.92(1�/
1.867�/103oG)
Tekie et al. [9] Hollow shaft�/Rushton turbine N2
O2
Cyclohexane x1: 6.67B/N B/20.0 Hzx2: 7B/P B/35 barx3: 330B/T B/430 Kx4: 0.171B/H B/0.268 m
N2 : ln(kLa )�/0.009�/1.922x1�/
0.102x2�/0.269x3�/0.050x4�/0.723x12�/
0.098x22�/0.018x3
2�/0.014x42�/3.395
exp(0.035(x1�/4.248)2)�/0.265exp(0.1(x1�/3)(4�/x4))O2 : ln(kLa )�/�/3.707�/1.235x1�/
0.105x2�/0.216x3�/0.087x4�/0.092x12�/
0.044x22�/0.005x3
2�/0.056x42�/3.753
exp(�/0.170(x1�/1.604)2)�/0.209exp(0.1(x1�/3)(4�/x4))
Forrester et al. [24] Hollow shaft�/6 concave blades Air Water 250B/P*/VLB/2250 w/m3 kLa�/(769/21)�/106(P*/VL)0.8090.06
0.01B/kLa B/0.035 s�1
Fillion and Morsi [10] Hollow shaft�/Rushton turbine N2
H2
Soybean oil x1: 373B/T B/473 Kx2: 10B/N B/23.3 Hzx3: 0.171B/HB/0.268 mx4: 1B/P B/5 bar
N2 : ln(kLa )�/�/4.86�/0.179x1�/
0.708x2�/0.596x3�/0.0759x12�/0.116x2
2�/
0.228x1x2�/0.0763x2x3�/0.0754x13�/
0.00269(x2�/2.5)e2x3�/1.28tanh(0.3x2(5.5�/x3
2)�/0.1(2�/4x3))�/
0.339x1x2x3
H2 : ln(kLa )�/�/3.868�/0.516x2�/
0.790x3�/0.223x12�/0.352ex1�/0.326ex3�/
0.00378(x2�/3)e2.5x3�/2.099tanh(0.3x2(8�/x3
2)�/0.1(2�/6x3))�/
0.927x1e�½x2½
R.
Lem
oin
eet
al.
/C
hem
ical
En
gin
eering
an
dP
rocessin
g4
2(
20
03
)6
21�
/64
36
24

correlation was employed to predict kLa behavior in
different important industrial processes.
2. Neural networks
Traditionally, ANNs have been used to model com-
plex non-linear systems [25,31,32,35,38,40,49] and ap-
peared to be a good alternative to traditional empirical,
phenomenological or statistical correlations [25,26,
35,38]. The ANNs are more powerful and can manip-
ulate non-linear input�/output relationships more suc-cessfully than available literature conventional
correlations [52].
2.1. Systems studied
A significant number of experimental data (4435
points) were used to develop kLa neural network
correlations. These data were obtained for different
gas�/liquid systems and cover wide ranges of operating
conditions, reactor types (SAR and GIR) and geome-tries as well as liquid and gas natures, as can be seen in
Table 5. The operating conditions used were similar to
those employed in industrial processes including, cyclo-
hexane oxidation [8,55], soybean oil hydrogenation
[10,57], propylene polymerization [28,54] and Fischer�/
Tropsch synthesis [14,58]. These data indicate that kLa
values are affected by several variables, which are
grouped as follows [59]:
�/ Geometrical variables: reactor diameter (DT), impel-ler diameter (DImp.), and impeller height from the
bottom of the reactor (HF).
�/ Operating variables: reactor mode (SAR, GIR),
mixing speed (N ), liquid height (HL), liquid height
above the impeller (H), temperature (T ), and gas
partial pressure (P1).
�/ Physicochemical variables: liquid viscosity (mL), li-
quid and gas densities (rL and rG), liquid surfacetension (sL) and the gas diffusivity in the liquid (DL).
A dimensional analysis [60] was performed using these
variables and 9 dimensionless groups were obtained: Re ,
Fr , Sc , We , Eu , rG/rL, DImp./DT, DImp./HF and DImp./
HL.
2.2. BPNNs
Two BPNNs, one dimensional and one dimensionless,
each with its own input were constructed. The inputs tothe dimensional BPNN were the geometrical, operating
and physicochemical variables as shown in Table 6a,
whereas the inputs to the dimensionless BPNN were the
dimensionless groups as presented in Table 6b. An
additional input, the ‘reactor operating mode’, was
added in both BPNNs as shown in these tables.
2.2.1. Model and architecture
The critical step in building a robust ANN is to create
an architecture, which should be as simple as possibleand has a fast capacity for learning the data set. The
robustness of the ANN will be the result of the complex
interactions between its topology and the learning
Table 3
Selected literature survey on ANN in the chemical industry
Authors Systems used Model
Alvarez et al. [30] Newtonian and non-
Newtonian fluid in
bubble columns
Prediction of kLa
Azlan Hussain [31] Review Simulation and online
implementation
Fullana et al. [32] Supercritical fluid
extractors
Kinetic modeling
Garcıa-Ochoa and
Gomez Castro [27]
O2/H2O xanthan
gum solution in STR
Prediction of kLa
Henrique et al. [33] pH neutralization
process
Model prediction and
simulation
I et al. [34] Sugar, cell mass, L-
lysine
Modeling
Iliuta et al. [35] Several system in
trickle bed reactors
Prediction of mass
transfer coefficient
Jambunathan et al.
[36]
Liquid crystal ther-
mography
Evaluation of heat
transfer coefficient
Krothapally and
Palanki [37]
Batch process Process optimization
Larachi et al. [38] 3-phase fluidized bed
reactor
Prediction of ULmf
Leib et al. [39] Fluidized bed Simulation of propylene
oxidation
Leib et al. [40] 3-phase bubble col-
umn
Simulation of Fischer-
Tropsch process
Mills et al. [41] Conical tank, indus-
trial evaporator
Control
Nascimento and
Giudici [42]
Nylon-6,6 polymeri-
zation
Process optimization
Nascimento et al.
[43]
Chemical process Optimization
Nikravesh et al. [44] CSTR Control of h and E0
Qi et al. [45] Fixed-bed reactor Prediction of overall
heat transfer coefficient
Reisener et al. [26] Electrolyte solutions
gas sparged reactors
Prediction of k
Sharma et al. [46] H2/CO�/SiO2�/Al2O3
fixed bed reactor
Modeling of Fischer-
Tropsch process
Shaw et al. [47] �/ Nonlinear process mod-
eling
Tendulkar et al. [48] Fixed-bed reactor Predictive control of
flow rate and tempera-
ture
Thibault and
Grandjean [49]
�/ Prediction of Nu num-
ber
Wilson and Zorzet-
to [50]
Hybrid process Control
Yang et al. [25] Various system in
STR
Prediction of kLa
Zhou et al. [51] Fixed bed reactor Modeling
R. Lemoine et al. / Chemical Engineering and Processing 42 (2003) 621�/643 625

scheme. The choice of the input variables is the key to
insure complete description of the systems, whereas the
quality as well as the number of the training observa-
tions (experimental data) have a tremendous impact on
both the reliability and performance of the ANN. The
two BPNNs used were constructed as follows:
(1) One input layer; one output node; two hidden
layers; all neurons were interconnected and all connec-
tions were weighted.
(2) Each neuron possessed a bias.
(3) The transfer function was a sigmoid of the form:
F (x)�1
1 � exp(�x)(1)
The basic architecture of the BPNNs is given in Fig. 1.
The number of neurons, (n) and (m ) in the first and
second hidden layers were determined based on the
analysis of errors during the training step of the
networks. The PITTNET software developed at the
University of Pittsburgh was used to build and validate
the two created BPNNs. The matrix formulation for the
calculation methodology is briefly described in the
Appendix B.
2.2.2. Training or learning phase: back-propagation
algorithm
The learning algorithm for the back-propagation,
which is commonly accepted [61�/63], was used for the
development of the ANNs. In this algorithm, the
training was supervised by means of a known output
data set and the connection weights were adjusted
according to the gradient descent method, as the mean
squared error (MSE) was minimized towards the
smallest error possible [61�/63]. More precisely, the
training data were fed forward leading to the calculation
of the output and associated errors. Then, the associated
errors were back-propagated and the adjustment of the
weights was completed accordingly [52,61�/63]. This
process was repeated until the MSE between the
experimental and calculated (kLa) values was less than
the chosen tolerance (10�7). The mean absolute errors
(MAE), the root mean squared errors (RMSE) and the
R2 values were also calculated and used in the validation
and construction procedures. Additional details of the
back-propagation algorithm are given in Fig. 2. It
should be noted that two phenomena were taken into
consideration during the construction and validation of
the BPNNs. The first phenomenon is over-training,
mainly attributed to a large number of iterations, which
generally leads to an excellent prediction of the training
data set, while predicting poorly the untrained values.
Table 4
Application of ANNs in multi-phase reactors
Authors System studied IU Reactor type Output parameters ANN type and topology
Alvarez et al. [30] CO2/Sucrose and CMC Bubble column kLa BPN-FF
Garcıa-Ochoa and
Gomez Castro [27]
O2/H2O xanthan gum sol. Baffled stirred
tank
kLa FF-ML 13-4-1
Iliuta et al. [35] 8050/rL0/1450 Trickle beds ShG, Sh and a .dV/(1�/o ) FF-ML 7-13-1, 7-8-1, 8-11-1
6.32�/10�40/mL0/4.72�/10�2
1.06�/10�20/sL0/7.77�/10�2
0.9370/rG0/57.46
5.4�/10�40/dP0/2.64�/10�2
Larachi et al. [38] 7800/rL0/1623
8.9�/10�40/mL0/0.0719
3-Phase flui-
dized beds
ULmf, ReL FF-ML 8-6-1, 5-9-1
0.0250/sL0/0.073
1.1450/rG0/1.159
12900/rS0/7510
Leib et al. [39] Propylene oxidation process Fluidized bed usb, yi, y4 � 6, wi, w4 � 6 FF-ML 11-8-9
Leib et al. [40] Liquid-phase Fischer-Tropsch
system
Slurry bubble
column
CG, CL, UG FF-ML 6-5-3
Nikravesh et al. [44] Non-isothermal system CSTR h and E0 DNNC-FF
Qi et al. [45] O2/Benzene/V2O5 Fixed-bed Heat transfer coefficient FF-ML, 3 ILN and 1 OLN
Reisener et al. [26] Electrolyte solution Gas sparged k FF-ML 3-4-1, 3-10-1
Sharma et al. [46] H2/CO/SiO2�/Al2O3 Fixed bed % conv., liq. conc., CH4 SS
conc., SS conc. oxygenates, SS
conc. hydrocarbons
ML, 3 ILN and 1 OLN
Tendulkar, et al. [48] H2O2/phenol/Ti-based zeolite cat. Fixed bed Phenol flow rate and T FF-ML, 4-5-2
Yang et al. [25] 00/Pg/VL0/55 000 Stirred tank kLa FF-ML, 6-11-1
0.80/mL0/70.2
R. Lemoine et al. / Chemical Engineering and Processing 42 (2003) 621�/643626

Table 5
Systems studied
Authors Number of
data points
Liquid Gas T , K P1, bar Reactor mode N , rpm DT, m DImp., m HL, m HF, m
Chang [21] 272 Water N2 328�/378 13.7�/36.9 GIR 800�/1200 0.127 0.0635 0.242�/0.250 0.0670
CO 13.3�/36.4
Chang [21] 274 n -hexane H2 328�/378 5.9�/48.4 GIR 800�/1200 0.127 0.0635 0.248�/0.267 0.0670
N2 5.5�/50.9
CO 6.7�/44.5
CH4 5.0�/34.3
Chang [21] 273 n -decane H2 328�/378 9.2�/55.8 GIR 800�/1200 0.127 0.0635 0.247�/0.282 0.0670
N2 7.9�/51.1
CO 7.1�/49.7
CH4 7.2�/44.9
Chang [21] 292 n -tetrade-
cane
H2 328�/378 9.1�/59.6 GIR 800�/1200 0.127 0.0635 0.245�/0.273 0.0670
N2 8.4�/53.8
CO 8.3�/52.9
CH4 7.5�/48.0
Chang [21] 291 C6H12 H2 328�/378 7.5�/56.7 GIR 800�/1200 0.127 0.0635 0.246�/0.281 0.0670
N2 7.2�/51.8
CO 6.7�/48.5
CH4 5.3�/41.4
Koneripalli [53] 326 Methanol N2 328�/428 5.4�/49.2 GIR 800�/1200 0.127 0.0635 0.245�/0.265 0.0670
CO 4.4�/49.4 800�/1400
H2 3.3�/54.8 800�/1400
CH4 4.3�/40.9 800�/1200
CO2 3.3�/23.7 800�/1200
Koneripalli [53] 296 Ethanol N2 328�/428 6.0�/51.3 GIR 800�/1200 0.127 0.0635 0.245�/0.265 0.0670
CO 5.9�/50.9
H2 5.4�/51.4
CH4 5.4�/40.9
CO2 3.2�/27.6
Li [54] 295 Propane H2 297�/333 6.7�/37.6 SAR 800�/1200 0.125 0.0508 0.198�/0.223 0.0670
Li [54] 292 n -hexane H2 313�/353 9.5�/58.0 SAR 800�/1200 0.125 0.0508 0.202�/0.213 0.0670
C3H8 313�/353 1.4�/6.8 800�/1200 0.202�/0.213
C2H4 333 5.0�/15.6 1000 0.207
C3H6 333 2.8�/7.9 1000 0.207
Mizan [5] 303 n -hexane C3H6 313�/353 1.6�/8.5 SAR 800�/1200 0.125 0.0508 0.202�/0.213 0.0670
C2H4 �/ 3.3�/29.7
R.
Lem
oin
eet
al.
/C
hem
ical
En
gin
eering
an
dP
rocessin
g4
2(
20
03
)6
21�
/64
36
27

Table 5 (Continued )
Authors Number of
data points
Liquid Gas T , K P1, bar Reactor mode N , rpm DT, m DImp., m HL, m HF, m
Mizan [5] 234 Propylene C2H4 297�/333 2.4�/16.2 SAR 800�/1200 0.125 0.0508 0.198�/0.225 0.0670
H2 �/ 3.8�/31.6
Tekie [55] 398 C6H12 N2 330�/430 5.8�/34.1 SAR and GIR 400�/1200 0.115 0.0508 0.171�/0.268 0.0635
O2 �/ 5.5�/33.5
Mohammad [56] 235 Benzoic
acid
O2 473 0.9�/5.0 SAR and GIR 1000 0.076 0.0317 0.108 0.0413
N2 �/ 0.9�/5.0 �/ �/
Fillion [57] 654 Soybean oil H2 373�/473 1.0�/5.0 SAR and GIR 600�/1400 0.115 0.0508 0.171�/0.268 0.0635
N2 �/ 1.0�/5.0
Table 6a, b
Ranges of the BPNNs input parameters used in this study
Ymax (ln kLamax) Ymin (ln kLamin) rL, rG, 10�5�/m , 10�3�/sL, 10�9�/DA, P1, Reactor mode N , DImp./DT HF/HL
�/ �/ kg m�3 kg m�3 N s m�2 N m�1 m s�1 bar �/ rpm �/ �/
Ranges
6a
�/0.495 �/7.729 309.9 �/1011.1 0.05�/0.27 5.0�/668.3 1.2�/64.5 3.5�/153.9 0.86�/59.59 0�/SAR
1=GIR
400�/1400 0.406�/0.500 0.237 �/0.444
Ymax (log Shmax)
�/
Ymin (log Shmin)
�/ Re Sc Eu We Fr rG/rL
Reactor mode
�/ HF/DT
DT/DImp.
�/
HL/DImp.
�/
Ranges
6b
5.456 2.088 5571�/445 836 0.88�/1274.1 85�/41 876 285�/18 949 0.23�/3.52 6.4�/10�5
�/0.16
0�/SAR 1.05�/1.49 2�/2.46 3.52�/6.20
1�/GIR
R.
Lem
oin
eet
al.
/C
hem
ical
En
gin
eering
an
dP
rocessin
g4
2(
20
03
)6
21�
/64
36
28

The second phenomenon is under-training, which inter-
polates the untaught values relatively well, while pre-
dicting poorly the training data set.
3. Results and discussions
3.1. Architectures choices
All the experimental kLa data points collected were
used to build and validate the ANN correlations. In the
training algorithm of the BPNNs, the MSE was mini-mized for each epoch, i.e. iteration. As depicted in Fig.
3, the error appears to decrease with increasing the
number of hidden layers and neurons. A minimum error
was found for a network topology of 10-23-23-1 and 10-
30-30-1 for the dimensional and dimensionless BPNN,
respectively. Fig. 3 also shows that the relative error
between the networks does not significantly decrease
after corresponding topologies of 10-10-1 and 10-15-1. It
is important to mention that topologies of 10-23-23-1
and 10-30-30-1 possess a significant number of para-
meters, 829 and 1291, respectively, representing roughly
1/5 of the data used in the training step. The choice of
such topologies could lead to an over-training of theBPNNs and consequently will reduce their ability to
accurately interpolate kLa values. On the other hand,
the topologies of 10-10-1 and 10-15-1, with only 121 and
181 parameters, appear to be the optimal choice for the
construction of the dimensional and dimensionless
Fig. 1. Architecture of ANN.
R. Lemoine et al. / Chemical Engineering and Processing 42 (2003) 621�/643 629

BPNNs, respectively. It should also be mentioned that alearning rate of 0.25 as suggested in Refs. [52,61�/63] was
chosen with 10 000 epochs, since as shown in Fig. 4 the
MAE and MSE sensibly decrease with the number of
iterations. The weights of the two constructed BPNNs
are given in Tables 7 and 8.
3.2. Validation of the BPNNs
In the validation step, since the ANN acts as a ‘Black
Box’ and it is almost impossible to determine why a
specific BPNN would provide acceptable predictions,
two different steps were followed to overcome such a
problem. In the first step, cross validation method wasused [64,65], where numerous sub-networks with iden-
tical architecture and parameters were built and trained
using all the experimental data. In the second step, these
sub-networks were tested using the untaught kLa values
by Inga [58] and Martinez [66], as their studies were
conducted with different gas�/liquid systems, reactorsgeometries and operating conditions. Fig. 5 shows that
the prediction of these untaught kLa values using the
dimensional BPNN is acceptable with R2 of 86% and
standard deviation of 41%, whereas those for the
dimensionless BPNN are 87 and 61%, respectively.
This large standard deviation for the dimensionless
BPNN could be related to the over-training of this
BPNN and/or the inability of dimensionless numbers inproviding accurate influence of all variables involved.
3.3. Predictions of kLa values using BPNNs
Fig. 6a and b shows that the dimensional and
dimensionless BPNNs can predict kLa values with R2
of 90.5 and 88.6%, and corresponding standard devia-
tions of 23.3 and 24.1%, respectively. Figs. 7 and 8
compare the experimental kLa values with the predic-
tions of the dimensionless correlations proposed by Wu
[7] and Tekie et al. [8] in the SAR, and Chang [21] and
Forrester et al. [24] in the GIR. From Figs. 6�/8, it
appears that the BPNN correlations provide good
predictions, whereas the correlations by Wu [7], Tekieet al. [8], Chang [21] and Forrester et al. [24] fail to
satisfactorily predict the majority of the experimental
kLa values used in this study. This was expected since
their correlations did not consider several important
parameters, such as gas density, liquid surface tension or
reactor geometry, whose influences on kLa are obviously
significant.
Since acceptable agreements in both the validationand prediction steps were obtained with the dimensional
BPNN, 3-dimensional response surfaces were generated
and used to study the effect of liquid physicochemical
Fig. 2. Back-propagation algorithm.
Fig. 3. Error analysis on the BPNNs as a function of the number of
hidden layer and neurons.
R. Lemoine et al. / Chemical Engineering and Processing 42 (2003) 621�/643630

Fig. 4. Error analysis on the BPNNs as function of the epochs.
Table 7
Weights and biases of the 10-10-1 dimensional BPNN
Input weights ui ,j 1 2 3 4 5 6 7 8 9 10
1 �/0.08 �/6.61 �/1.49 4.08 12.54 1.73 1.92 �/1.11 �/0.73 �/2.53
2 �/0.52 �/4.06 4.71 3.25 �/2.48 3.29 1.15 �/4.42 �/1.55 �/11.52
3 1.85 0.15 �/2.55 �/1.17 �/5.97 �/3.59 �/2.24 �/2.30 �/2.71 19.13
4 �/2.08 2.18 0.32 1.21 5.10 �/0.60 5.66 �/1.43 �/3.36 �/6.35
5 �/7.20 2.64 �/2.68 �/3.30 �/4.08 �/2.03 7.08 2.07 �/4.01 �/6.47
6 �/0.32 �/1.65 4.17 1.96 �/1.42 3.29 �/3.78 �/1.56 �/0.04 �/6.71
7 3.09 1.30 �/1.82 0.22 �/3.25 �/4.97 3.43 3.73 �/2.91 �/2.99
8 �/8.38 �/2.03 1.38 8.31 1.71 6.65 3.20 1.61 3.12 �/2.02
9 �/1.62 3.07 �/0.16 �/4.12 �/0.96 4.03 2.35 �/0.76 0.52 �/1.82
10 10.79 8.01 �/6.39 �/2.87 3.00 �/11.58 0.43 12.21 �/7.31 �/0.43
1 2 3 4 5 6 7 8 9 10
Bias of hidden layer u0,i 2.90 0.38 4.68 �/0.88 6.59 �/1.92 �/2.53 0.34 1.20 �/8.69
1 2 3 4 5 6 7 8 9 10
Output weights wi 1.68 2.83 �/2.15 �/2.84 �/2.97 �/4.25 4.30 1.50 4.67 �/2.77
Bias of output neuron w0 �/2.33
R. Lemoine et al. / Chemical Engineering and Processing 42 (2003) 621�/643 631

Table 8
Weights and biases of the 10-15-1 dimensionless BPNN
1 2 3 4 5 6 7 8 9 10
Input weights ui ,j
1 �/1.29 �/5.11 �/1.74 2.19 �/12.71 �/15.95 2.98 0.57 �/0.83 3.47
2 �/0.29 2.69 �/1.01 2.99 1.26 �/1.71 �/6.94 1.22 1.99 �/2.06
3 0.20 �/3.89 �/2.85 2.51 2.96 �/12.51 7.72 �/7.65 �/9.90 �/12.47
4 4.37 �/1.36 3.70 �/3.22 �/2.52 10.15 �/0.21 �/1.38 �/0.62 �/3.68
5 0.53 �/7.92 11.89 �/0.68 2.09 6.66 0.68 �/4.37 �/5.37 2.86
6 8.33 �/6.88 7.03 �/2.58 0.23 1.75 �/13.77 3.82 �/6.78 1.68
7 �/5.32 2.37 2.19 �/8.26 1.92 �/10.53 4.00 �/4.57 0.27 2.46
8 �/2.52 8.02 �/5.07 3.64 3.78 �/13.32 6.07 �/1.80 �/1.74 1.33
9 �/0.30 4.93 �/3.69 6.99 �/10.05 6.77 �/5.12 �/0.21 2.72 0.49
10 3.32 0.07 �/4.60 �/3.24 �/11.54 �/2.98 1.17 3.45 �/1.86 2.91
11 �/1.62 3.20 �/2.31 �/24.67 �/7.42 �/3.71 0.29 0.51 �/2.19 4.18
12 2.15 �/5.18 0.18 8.50 9.46 2.32 5.16 �/4.96 �/4.22 4.08
13 4.12 9.82 �/1.82 3.03 �/9.84 11.56 �/7.00 �/1.66 �/5.52 13.60
14 0.86 �/3.95 �/9.76 �/2.01 �/3.74 �/8.19 4.14 0.55 5.25 6.52
15 0.52 �/8.31 �/1.38 3.06 0.15 �/2.80 4.70 �/8.07 �/5.58 �/10.76
1 2 3 4 5 6 7 8 9 10 11 12 13 14 15
Bias of hidden layer u0,i �/1.19 �/2.12 7.10 �/3.90 �/7.03 �/4.17 1.72 �/3.09 �/2.90 0.52 �/0.33 5.01 �/1.29 �/2.29 7.19
1 2 3 4 5 6 7 8 9 10 11 12 13 14 15
Output weights wi �/8.75 �/2.16 5.52 �/1.49 7.48 �/1.55 �/2.17 3.82 3.12 2.10 �/5.52 1.62 �/2.00 �/0.79 �/4.72
Bias of output neuron w0 �/0.36
R.
Lem
oin
eet
al.
/C
hem
ical
En
gin
eering
an
dP
rocessin
g4
2(
20
03
)6
21�
/64
36
32

properties, operating conditions and reactor geometries
on kLa for different industrial processes as given in the
following.
3.4. Effects of liquid physicochemical properties on kLa
Fig. 9a and b illustrates the effect of liquid viscosity
on kLa , in the SAR and GIR, respectively. This is
similar to the increase of liquid viscosity due to chemical
reactions as in Fischer�/Tropsch synthesis or hydroge-
nation of vegetable oil processes. As it can be observed
in Fig. 9a, kLa decreases slightly with increasing liquid
viscosity in the SAR, which is in agreement withliterature data [3,4]. In the SAR, the gas�/liquid inter-
facial area can be considered almost constant and
accordingly the decrease of kLa with increasing viscosity
can be attributed to the decrease of the mass transfer
coefficient, kL. In fact, an increase of the viscosity has
been reported to decrease the turbulences at the gas�/
liquid surface leading to a decrease of the surface
renewal rate and consequently kL [10,55,67,68]. In theGIR, the gas�/liquid interfacial area is not constant as
gas bubbles are induced into the liquid when operating
above the critical mixing speed for gas induction [69]. In
a GSR, Rushton and Bimbinet [70] for water/corn syrup
solution found that the gas holdup increases with liquid
viscosity for mL values less than 5�/10�3 Pa.s and then
decreases with further increase in liquid viscosity. In a
GIR, for water/CMC solution He et al. [71] reported
similar findings which were attributed to the effect of
liquid viscosity on the induced gas flow rate as described
by Aldrich and van Deventer [72] and Fillion et al. [69].
Vermulen et al. [73] reported a rather slight decrease of
the break-up rate, i.e. increase of the bubble coalescence
with increasing liquid viscosity. Thus, if the effect of
liquid viscosity on the gas holdup is stronger than that
on the bubble size, the gas�/liquid interfacial area, a is
expected to increase and then decrease with increasing
liquid viscosity. This means that increasing liquid
viscosity could increase and decrease kLa due its
resultant effect of a and kL. In this study, the behavior
of kLa follows that of kL in the SAR, whereas in the
GIR kLa is primarily affected by a rather than kL, as
can be seen in Fig. 9a and b, respectively.
Fig. 10a and b depicts the effect of liquid surface
tension on kLa in the SAR and GIR. This figure could
be used to speculate the effect of surface-active agents
and impurities on kLa in biochemical processes. Fig. 10a
Fig. 5. Validation and interpolation of kLa values using the BPNNs.
R. Lemoine et al. / Chemical Engineering and Processing 42 (2003) 621�/643 633

Fig. 6. Comparison between experimental and predicted kLa values of the BPNNs.
R.
Lem
oin
eet
al.
/C
hem
ical
En
gin
eering
an
dP
rocessin
g4
2(
20
03
)6
21�
/64
36
34

Fig. 7. Comparison between experimental and predicted kLa values from literature correlations in SAR.
R.
Lem
oin
eet
al.
/C
hem
ical
En
gin
eering
an
dP
rocessin
g4
2(
20
03
)6
21�
/64
36
35

Fig. 8. Comparison between experimental and predicted kLa values from literature correlations in GIR.
R.
Lem
oin
eet
al.
/C
hem
ical
En
gin
eering
an
dP
rocessin
g4
2(
20
03
)6
21�
/64
36
36

shows that kLa values obtained in the SAR increase
with increasing liquid surface tension, which follows the
behavior of kL reported by Levich [74] and Davies [67],
particularly under high turbulent conditions. In the
GIR, kLa was found to slightly decrease with increasing
liquid surface tension as illustrated in Fig. 10b. Calder-
bank [75] and Hinze [76] found that increasing liquid
surface tension substantially increases the average
bubble size in agitated reactors, which was found to
decrease the gas holdup as reported by He et al. [71] and
Albal et al. [3] in the GIR, and Calderbank [75] in the
GSR. This means that although increasing liquid surface
tension increases kL, it decreases the gas�/liquid inter-
facial area, which agrees with the findings by Patward-
han et al. [77] in the GIR and Calderbank [75] in the
GSR. As a result of this behavior kLa could decrease or
increase with increasing liquid surface tension in the
GIR. In this study, the effect of liquid surface tension on
a appears to be stronger than that on kL leading to an
increase of kLa with liquid surface tension in the GIR,
as can be seen in Fig. 10b.
Fig. 11a and b shows the effect of liquid density on
kLa in the SAR and GIR as an attempt to simulate the
effect of changing liquid density during polymerization
processes. As can be observed in this figure, kLa values
seem to decrease with increasing liquid density in both
reactor types. The available literature on the effect of
liquid density on the mass transfer coefficient, however,
is somewhat contradictory. For instance, Davies [67],
Kosinski et al. [78] and Calderbank and Moo-Young
[68] developed correlations where kL is proportional to
the liquid density to a power ranging from 1/4 to 1/2;
however, Farritor and Hughmark [79], Boussinesq [80]
and Higbie’s penetration theory [81] reported no effect
of liquid density on kL. Furthermore, Zlokarnik [82],
Aldrich and van Deventer [72] and Joshi and Sharma
[11] studied the effect of liquid density on the induced
gas flow rate in the GIR and concluded that an increase
of liquid density resulted in an enhancement of the
buoyancy forces acting on the gas bubbles which led to a
decrease of the induced gas flow rate. This decrease of
the induced gas flow rate with liquid density in the GIR
decreases the gas holdup and subsequently the gas�/
liquid interfacial area. Therefore, it seems that kLa
values decrease with increasing liquid density as a result
of the decrease of the gas�/liquid interfacial area in the
GIR as illustrated in Fig. 11b. From the similarity of the
kLa trends in both reactor types, however, it might be
Fig. 9. Effect of viscosity and mixing speed on kLa values in SAR and GIR.
Fig. 10. Effect of surface tension and mixing speed on kLa values in SAR and GIR.
R. Lemoine et al. / Chemical Engineering and Processing 42 (2003) 621�/643 637

inferred that the decrease of kLa with increasing liquid
density, observed in Fig. 11a, could be the result of
decreasing bubble entrainment in the SAR, which was
reported to occur by few investigators [2,3]. None-
theless, it can be concluded that increasing liquid density
decreases kLa as it affects primarily the gas�/liquid
interfacial area rather than kL in both reactor types.
Fig. 12a and b shows the effect of diffusivity on kLa in
the SAR and GIR which can be used to compare the
effect of hydrogen and carbon dioxide diffusivities on
kLa in Fischer�/Tropsch synthesis. In both reactor types,
kLa values were found to increase with increasing gas
diffusivity, which is in accord with several literature
findings [4,67,68,74,80,81,83]. For instance, Beenackers
and van Swaaij [83] reported that kL is proportional to
the diffusivity to a power ranging from 0.5 for the
penetration theory and 1.0 for the film model. Thus, it
can be concluded that kLa increases with the diffusivity
due to the increase of kL, since the diffusivity is
presumably independent of the gas�/liquid interfacial
area in both reactor types.
3.5. Effects of operating variables on kLa
Figs. 9�/11a and b illustrate the effect of mixing speed
on kLa in the SAR and GIR under operating conditions
typical to different industrial processes. In agreement
with the available literature on the SAR and GIR [2�/
13], kLa was found to increase with mixing speed. In the
SAR, the interfacial area can be considered almost
constant, and therefore the increase of kLa with N can
essentially be attributed to the increase of kL. Increasing
N intensifies the turbulences and thus the surface
renewal rate [10,55,79,83], which increases the mass
transfer coefficient in the SAR. In the GIR, the gas�/
liquid interfacial area is not constant, since at the critical
mixing speed for gas induction gas bubbles are induced
into the liquid [69]. Above this critical mixing speed,
further increase of N increases the induced gas flow rate
[69,71,72], which increases the gas holdup [69,72] and
the corresponding gas�/liquid interfacial area [72]. Thus,
both a and kL and subsequently kLa values increase
with mixing speed in the GIR. It should be mentioned,
Fig. 11. Effect of liquid density and mixing speed on kLa values in SAR and GIR.
Fig. 12. Effect of diffusivity and gas partial pressure on kLa values in SAR and GIR.
R. Lemoine et al. / Chemical Engineering and Processing 42 (2003) 621�/643638

however, that kLa values start to level off at high mixing
speeds (1200 rpm) indicating a fully developed hydro-
dynamic regime in the reactor [69].
Fig. 12a and b shows the effect of the gas partialpressure on kLa in the SAR and GIR, which could be
used to simulate the change of CO and H2 partial
pressures due to chemical reactions in Fischer�/Tropsch
synthesis. The effect of pressure on kLa is rather
contradictory as it was reported to be system-dependent
in the literature [3�/6,8�/10,14�/17,20�/22,28,29,53�/
58,66,84�/87]. In the SAR, however, the general trend
is that kL and subsequently kLa increase with pressure[3�/6,8�/10,20�/22,28,29,53�/58,66,84,85] due to the de-
crease of the system viscosity, which is similar to the
behavior seen in Fig. 12a. In the GIR, literature data
[88,89] indicated that an increase of pressure reduces the
average bubble size, which results in an increase of the
gas�/liquid interfacial area, a [89]. Thus, in the GIR,
both a and kL increase with increasing gas partial
pressure, leading to the increase of kLa as can beobserved in Fig. 12b.
3.6. Effects of reactor geometry and operating mode on
kLa
Fig. 13a and b presents the effect of DImp./DT
(impeller/reactor diameter ratio) and HF/HL (impeller
height from the bottom of the reactor/liquid height
ratio) on kLa for O2 in water in the SAR and GIR, andas can be seen, kLa appears to increase with both ratios
in the SAR, which is in agreement with the available
literature [90�/92]. It is generally accepted that an
increase of DImp./DT and HF/HL intensifies the turbu-
lences at the gas�/liquid surface, which leads to an
increase of the surface renewal rate and thus kL [74,79].
Under specific conditions, on the other hand, increasing
both these ratios can result in an enhancement of surfaceentrainment in the SAR, which further increases the
gas�/liquid interfacial area [2,3]. Therefore, both a and
kL and subsequently kLa increase with increasing DImp./
DT and HF/HL in the SAR. In the GIR, similar results
are observed as shown in Fig. 13b. In fact, an increase of
DImp./DT and HF/HL leads to an increase of the
pumping capacity of the impeller, which results in anincrease of the induced gas flow rate and subsequently
the gas holdup [11,69,71]. This increase of gas holdup
produces higher gas�/liquid interfacial area, which in
conjunction with an increase of kL provides higher kLa
values in the GIR.
Figs. 9�/13a and b depict the effect of reactor
operating mode on kLa for typical gases in a Fischer�/
Tropsch liquid, olefinic medium, vegetable oil andwater. As can be observed in these figures, kLa values
were found to be greater in the GIR than in the SAR. In
fact, in the GIR above the critical mixing speed for gas
induction [69], gas bubbles are induced in the liquid
phase which creates additional gas�/liquid interfacial
area leading to higher kLa values than those in the SAR
[10,55].
4. Conclusions
This study has demonstrated the potential of using
ANNs as a correlation/prediction tool for kLa in SARs
and GIRs. Using a large number of experimental data
points (4435), one dimensional and one dimensionlessBPNNs were constructed and successfully correlated
kLa values of typical industrial processes under wide
ranges of operating conditions. Due to its acceptable
predictions, the dimensional BPNN was used to simu-
late and study the effect of physicochemical properties,
operating conditions and reactor geometrical para-
meters on kLa in multiphase processes. The analysis of
the predicted results led to the following conclusion:
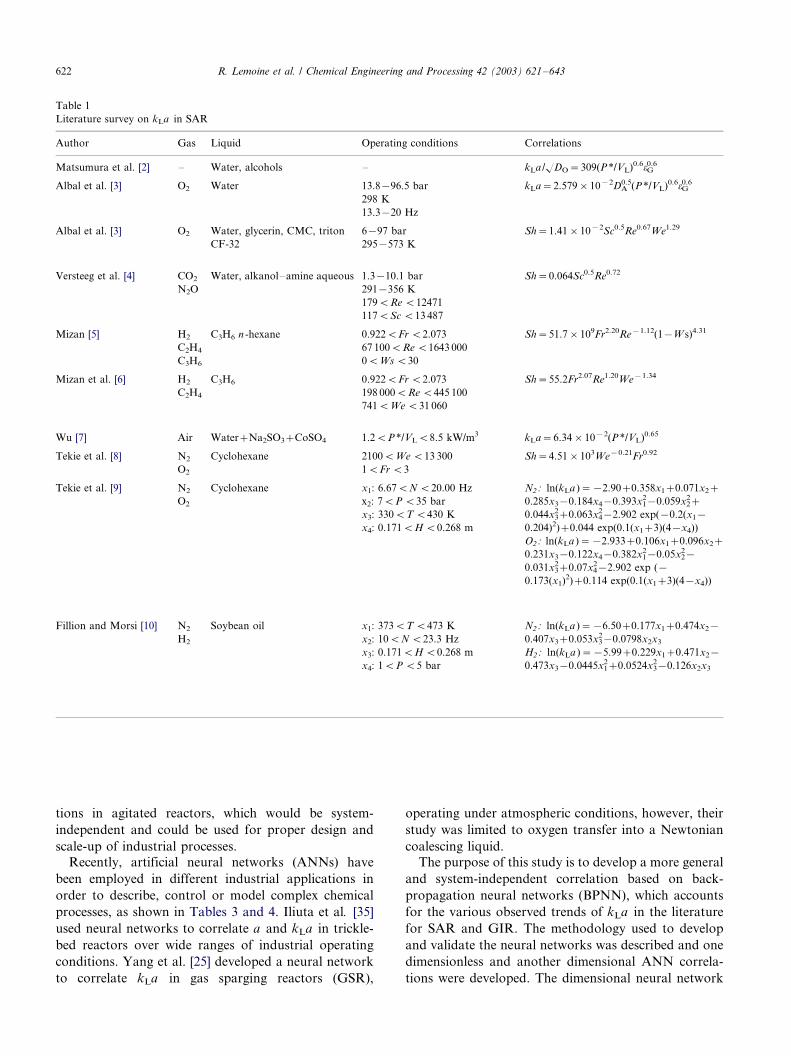
1) Increasing liquid viscosity (such as in Fischer�/
Tropsch synthesis or hydrogenation of vegetable
oil process due to chemical reaction) appeared to
decrease kLa values in the SAR. In the GIR,
Fig. 13. Effect of reactor geometry on kLa values in SAR and GIR.
R. Lemoine et al. / Chemical Engineering and Processing 42 (2003) 621�/643 639
however, increasing liquid viscosity was found to
increase and then decrease kLa values.
2) Increasing liquid density (such as in polymerization
processes) resulted in a decrease of kLa values inboth reactor types.
3) Increasing liquid surface tension (such as in bio-
chemical processes) was found to decrease kLa in
the GIR. In the SAR, however, increasing liquid
surface tension appeared to increase kLa values.
4) Increasing gas diffusivity and partial pressure (such
as in Fischer�/Tropsch synthesis) resulted in an
increase of kLa values in both reactor types.5) kLa values appeared to increase with increasing
mixing speed, and with DImp./DT as well as HF/HL
in the SAR and GIR for all the processes utilized in
this study.
6) kLa values in the GIR appeared to be always higher
than those in the SAR due to the increase of gas�/
liquid interfacial area in all the processes used in this
study.
Even though the ANNs appeared to be a viable
optimization and scale-up tool for industrial reactors, itshould be mentioned that the use of a larger kLa
database could further improve their predictive accu-
racy.
Appendix A: Nomenclature
a interfacial area (m�1)
CG gas phase concentration (kmol �/m�3)
CL liquid phase concentration (kmol �/m�3)
DA diffusivity (m2 �/s�1)
DImp. impeller diameter (m)
DT reactor diameter (m)
dh hydraulic diameter of Krischer�/Kast�dP
ffiffiffiffiffiffiffiffiffiffiffiffiffiffiffiffiffiffiffiffiffiffiffiffiffiffiffiffiffi16o=9p(1�o)23
q(m)
dP particle diameter (m)
dV sauter mean particle diameter (m)
E0 activation energy (J)
H liquid height above the impeller (m)
HImp. impeller height (m)
HB baffles height (m)
HL liquid height (m)
HF height between the tank and impeller bottom (m)
h heat transfer coefficient (J.K�1 �/m�2 �/s�1)
kL mass transfer coefficient (m �/s�1)
kLa volumetric mass transfer coefficient (s�1)
N mixing speed (rpm or Hz)
P1 gas partial pressure (bar)
P * power input (W)
R2 regression coefficient (%)
T temperature (K)
u0,i bias of the ith hidden neuron (�/)
ui ,j weight between the ith input neuron and the jth hidden neuron (�/)
usb superficial bubble velocity (m �/s�1)
UG superficial gas velocity (m �/s�1)
UL superficial liquid velocity (m �/s�1)
ULmf minimum velocity of fluidization (m �/s�1)
VL liquid volume (m3)
w0 bias of the output neuron (�/)
wi weight between the ith hidden neuron and the output neuron (�/)
wi molar fraction of the compound i in the emulsion Tables 3 and 4 (�/)
x10 normalized input vector
x1 coded variable for T (�/)
x2 coded variable for N (�/)
x3 coded variable for P (�/)
x4 coded variable for H (�/)
ypred net input signal of the output neuron (�/)
Ymax maximum value of the trained output data set (�/)
Ymin minimum value of the trained output data set (�/)
Ypred output signal of the output neuron (�/)
yi molar fraction of the compound i in the bubbles Table 3 and Table 4
(�/)
zpred i net input signal of the ith hidden neuron (�/)
Zpred i output signalof the ith hidden neuron (�/)
Greek letters
o porosity of the fixed bed (�/)
oG gas holdup (�/)
m viscosity (kg �/m�1 �/s�1 or Pa �/s)
r density (kg �/m�3)
s surface tension (N �/m�1)
s standard deviation: s�100�
ffiffiffiffiffiffiffiffiffiffiffiffiffiffiffiffiffiffiffiffiffiffiffiffiffiffiffiffiffiffiffiffiffiffiffiffiffiffiffiffiffiffiffiffiffiffiffiffiffiffiffiffiffiffiffiffiffiffiffiffiffiffiffiffiffiffiffiffiffiffiffiffiffiffiffiffiffiffiffiffiffiffiffiffiffiffiffiffiffiffiffiffiffiffiffi1
N � 1aN
j�1ðj1�YPred;j
YExp;jj�100
NaN
i�1j1�YPred;i
YExp;ijÞ2
vuuut (%)
Abbreviations
ANN artificial neural network
BPNN back-propagation neural network
DNNC dynamic neural network control
FF feed forward
GIR gas inducing reactor
GSR gas sparging reactor
HLN hidden layer neurons
ILN input layer neurons
IU international unit
MAE mean absolute error
ML multi-layer
MSE mean squared error
OLN output layer neurons
RMSE root mean squared error
SAR surface aeration reactor
SS conc steady state concentration, (g/Nm3 of
H2�/CO)
Indices
L liquid phase
G gas phase
S solid phase
Dimensionless numbers
Eu , Euler number P1/(DImp.2 �/rL�/N2)
Fr , Froude number (DImp.2 �/N2)/g
Fr *, modified Froude number N2DImp.2 /g (HL�/HF)
Re , Reynolds number DImp.2 �/rL�/N2/mL
ReL, Reynolds number
(bubble or particle)
UL�/rL�/dv/mL
Sc , Schmidt Number mL/rL�/DA
Sh , Sherwood number kLa �/DImp.2 /DA
ShG, Sherwood number
(bubble or particle)
kLa �/dv2/DA
Sh *, modified Sherwood number kLa /(g2rL/mL)1/3
We , Weber number D3imp.�/rL�/N2/sL
R. Lemoine et al. / Chemical Engineering and Processing 42 (2003) 621�/643640

Appendix B: Calculation procedure of the output signal
(1) The net input to (Z1) is denoted (z1) and is
calculated as follow:
(z1)�(u0)� [u](x10) (2)
The matrix [u] consists of n rows and 10 columns,
corresponding to the number of input variables and
nodes in the hidden layer 1:
It is also important to mention that each value of each
input vector x10 was normalized as follows:
Normalized value
�Actual value � Minimum value of the data set
Maximum value of the data set � Minimum value of the data set
(4)
(2) The activation function is applied to (z1) tocalculate the node output signal denoted (Z1):
Z1�F (z1) (5)
(3) The net input to (Z2) is denoted (z2) and is
calculated from the output signal, (Z1):
z2� (v0)� [v](Z1) (6)
The matrix [v] consists of m rows and n columns,
corresponding to the number of nodes in the hidden
layer 2 and 1:
(4) As in 2, the activation function is applied to (z2) to
calculate the node output signal of the hidden layer 2,
denoted (Z2):
Z2�F (z2) (8)
(5) The net input to (Ypred) is denoted (ypred) and iscalculated from the output signal, (Z2) and the output
weights, [w], as follow:
ypred�w0� [w](Z2) (9)
In this study, the output matrix of the weights consists
of 1 row and m columns
(6) Finally, the activation function is applied again to
ypred to calculate the output value, Ypred:
Ypred�F (ypred) (10)
In addition, since the PITTNET program normalizes all
vectors, the outputs (target) for the dimensional and
dimensionless BPNNs, ln(kLa ) and log(Sh ) respectively,
were calculated as follows:
ln(kLa) or log(Sh)�Ypred�(Ymax�Ymin)�Ymin (11)
With Ymax and Ymin given in Table 6.
References
[1] P.L. Mills, R.V. Chaudhari, Reaction engineering of emerging
oxidation processes, Catalysis Today 48 (1999) 17�/29.
[2] M.H. Matsumura, H. Masunaga, J. Kobayashi, Gas absorption
in an aerated stirred tank at high power input, J. Ferment.
Technol. 57 (1979) 107�/116.
[3] R.S. Albal, Y.T. Shah, A. Shumpe, N.L. Carr, Mass transfer in
multiphase agitated reactor, Chem. Eng. J. 27 (1983) 67�/80.
[4] G.F. Versteeg, P.M.M. Blauwhoff, W.P.M. van Swaaij, The effect
of diffusivity on gas�/liquid mass transfer in stirred vessels.
Experiments at atmospheric and elevated pressures, Chem. Eng.
Sci. 42 (1987) 1103�/1119.
[5] T.I. Mizan, Characterization of mass transfer of gases in olefinic
polymerization solvents and slurries in agitated reactors, MS.
Dissertation, University of Pittsburgh, Pittsburgh, PA, USA,
1992.
[6] T.I. Mizan, J. Li, B.I. Morsi, M.-Y. Chang, E. Maier, C.P.P.
Singh, Solubilities and mass transfer coefficients of gases in liquid
propylene in a surface-aeration agitated reactor, Chem. Eng. Sci.
49 (1994) 821�/830.
[7] H. Wu, An issue on applications of a disk turbine for gas�/liquid
mass transfer, Chem. Eng. Sci. 50 (1995) 2801�/2811.
[8] Z. Tekie, J. Li, B.I. Morsi, M.-Y. Chang, Gas�/liquid mass
transfer in cyclohexane oxidation process using gas-inducing and
surface-aeration agitated reactors, Chem. Eng. Sci. 52 (1997)
1541�/1551.
[9] Z. Tekie, J. Li, B.I. Morsi, Mass transfer parameters of O2 and N2
in cyclohexane under elevated pressures and temperatures: a
statistical approach, Ind. Eng. Chem. Res. 36 (1997) 3879�/3888.
[10] B. Fillion, B.I. Morsi, Gas�/liquid mass-transfer and hydrody-
namic parameters in a soybean oil hydrogenation process under
industrial conditions, Ind. Eng. Chem. Res. 39 (2001) 2157�/2168.
[11] J.B. Joshi, M.M. Sharma, Mass transfer and hydrodynamic
characteristics of gas-inducing type of agitated contactors, Can.
J. Chem. Eng. 65 (1977) 683�/695.
[12] Kara M. An Experimental Study of Hydrogen Mass Transfer
Rate in Liquid Hydrocarbons at High Temperatures and Pres-
sures, Ph.D. Dissertation, University of Pittsburgh, Pittsburgh,
PA, USA, (1981).
[13] S.B. Sawant, J.B. Joshi, V.G. Pangarkar, R.D. Mhaskar, Mass
transfer and hydrodynamic characteristics of the denver type of
flotation cells, Chem. Eng. J. 21 (1981) 11�/19.
[14] B.M. Karandikar, B.I. Morsi, Y.T. Shah, N.L. Carr, Effect of
water on the solubilities and mass transfer coefficients of gases in
a heavy fraction of Fischer-Tropsch products, Can. J. Chem. Eng.
65 (1987) 973�/981.
R. Lemoine et al. / Chemical Engineering and Processing 42 (2003) 621�/643 641

[15] M.-Y. Chang, J.G. Eiras, B.I. Morsi, Mass transfer characteristics
of gases in n-hexane at elevated pressures and temperatures in
agitated reactors, Chem. Eng. Process. 29 (1991) 49�/60.
[16] M.-Y. Chang, B.I. Morsi, Mass transfer characteristics of gases in
aqueous and organic liquids at elevated pressures and tempera-
tures in agitated reactors, Chem. Eng. Sci. 46 (1991) 2639�/2650.
[17] M.-Y. Chang, B.I. Morsi, Mass transfer characteristics of gases in
n-decane at elevated pressures and temperatures in agitated
reactors, Chem. Eng. J. 47 (1991) 33�/45.
[18] E. Dietrich, C. Mathieu, H. Delmas, J. Jenck, Raney-Nickel
catalyzed hydrogenations: gas�/liquid mass transfer in gas-in-
duced stirred slurry reactors, Chem. Eng. Sci. 47 (1992) 3597�/
3604.
[19] H. Hichri, A. Accary, J. Andrieu, Kinetics and slurry-type reactor
modeling during catalytic hydrogenation of o -cresol on Ni/SiO2,
Chem. Eng. Process. 30 (1991) 133�/140.
[20] M.-Y. Chang, B.I. Morsi, Solubilities and mass transfer coeffi-
cients of carbon monoxide in a gas-inducing reactor operating
with organic liquids under high pressures and temperatures,
Chem. Eng. Sci. 47 (1992) 3541�/3548.
[21] Chang M.-Y., Mass Transfer Characteristics of Gases in Aqueous
and Organic Liquids at Elevated Pressures and Temperatures in
Agitated Reactors, Ph.D. Dissertation, University of Pittsburgh,
Pittsburgh, PA, USA, (1991).
[22] N. Koneripalli, Z. Tekie, B.I. Morsi, Mass transfer characteristics
of gases in methanol and ethanol under elevated pressures and
temperatures, Chem. Eng. J. 54 (1994) 63�/77.
[23] A. Heim, A. Kraslawski, E. Rzyski, J. Stelmach, Aeration of
bioreactors by self-aspirating impellers, Chem. Eng. J. 58 (1995)
59�/63.
[24] S.E. Forrester, C.D. Rielly, K.J. Carpenter, Gas-inducing im-
peller design and performance characteristics, Chem. Eng. Sci. 53
(1998) 603�/615.
[25] H. Yang, B.S. Fang, M. Reuss, kLa correlation established on the
basis of a neural network model, Can. J. Chem. Eng. 77 (1999)
838�/843.
[26] J. Reisener, M.A. Reuter, J. Kruger, Modeling of the mass
transfer in gas-sparged electrolysers with neural networks, Chem.
Eng. Sci. 48 (1993) 1089�/1101.
[27] F. Garcıa-Ochoa, E. Gomez Castro, Estimation of oxygen mass
transfer coefficient in stirred tank reactors using artificial neural
networks, Enz. Micro. Tech. 28 (2001) 560�/569.
[28] J. Li, Z. Tekie, A. Mohammad, B.I. Morsi, Statistical assessment
of gas/liquid mass transfer in slurry-phase propylene polymeriza-
tion process, Can. J. Chem. Eng. 74 (1996) 77�/83.
[29] J.R. Inga, B.I. Morsi, Effect of catalyst loading on gas/liquid mass
transfer in slurry reactors: a statistical experimental approach,
Can. J. Chem. Eng. 75 (1997) 872�/881.
[30] E. Alvarez, J.M. Correa, C. Riverol, J.M. Navaza, Model based
in neural networks for the prediction of the mass transfer
coefficients in bubble columns. study in Newtonian and non-
Newtonian fluids, Int. Comm. Heat Mass Transfer 27 (2000) 93�/
98.
[31] M.A. Hussain, Review of the applications of neural networks in
chemical process control�/simulation and online implementation,
Art. Intel. Eng. 13 (1999) 55�/68.
[32] M. Fullana, F. Trabelsi, F. Recasens, Use of neural net
computing for statistical and kinetic modeling and simulation of
supercritical fluid extractors, Chem. Eng. Sci. 55 (2000) 79�/95.
[33] H.M. Henrique, E.L. Lima, D.E. Seborg, Model structure
determination in neural network models, Chem. Eng. Sci. 55
(2000) 5457�/5469.
[34] Y.P. I, W.T. Wu, Y.C. Liu, Neural network modeling for on-line
state estimation in fed-batch culture of L-lysine production, Bio.
Eng. J. 61 (1996) 35�/40.
[35] I. Iliuta, F. Larachi, B.P.A. Grandjean, G. Wild, Gas�/liquid
interfacial mass transfer in trickle-bed reactors: state of the art
correlations, Chem. Eng. Sci. 54 (1999) 5633�/5645.
[36] K. Jambunathan, S.L. Hartle, S. Ashforth-Frost, V.N. Fontama,
Evaluating convective heat transfer coefficients using neural
networks, Int. J. Heat Mass Transfer 39 (1996) 2329�/2332.
[37] M. Krothapally, S. Palanki, A neural network strategy for batch
process optimization, Comp. Chem. Eng. 21 (1997) 463�/468.
[38] F. Larachi, I. Iliuta, O. Rival, B.P.A. Grandjean, Prediction of
minimum fluidization velocity in three-phase fluidized-bed reac-
tors, Ind. Eng. Chem. Res. 39 (2000) 563�/572.
[39] T.M. Leib, P.L. Mills, J.J. Lerou, Fast response distributed
parameters fluidized bed reactor model for propylene partial
oxidation using feed-forward neural network methods, Chem.
Eng. Sci. 51 (1996) 2189�/2198.
[40] T.M. Leib, P.L. Mills, J.J. Lerou, J.R. Turner, Evaluation of
neural networks for simulation of three-phase bubble column
reactors, Trans IchemE 73 (Part A) (1995) 690�/696.
[41] P.M. Mills, A.Y. Zomaya, M.O. Tade, Adaptive model-based
control using neural networks, Int. J. Control 60 (1994) 1163�/
1192.
[42] C.A.O. Nascimento, R. Giudici, Neural network based approach
for optimization applied to an industrial nylon-6,6 polymerization
process, Comp. Chem. Eng. 22 (1998) 595�/600.
[43] C.A.O. Nascimento, R. Giudici, R. Guardani, Neural network
based approach for optimization of industrial chemical processes,
Comp. Chem. Eng. 24 (2000) 2303�/2314.
[44] NikraveshM., T.G. Farrell, Stanford, Control of nonisothermal
CSTR with time varying parameters via dynamic neural network
control (DNNC), Chem. Eng. J. 76 (2000) 1�/16.
[45] H. Qi, X.G. Zhou, L.H. Liu, W.K. Yuan, A hybrid neural
network-first principles model for fixed-bed reactor, Chem. Eng.
Sci. 54 (1999) 2521�/2526.
[46] B.K. Sharma, M.P. Sharma, S.K. Roy, S. Kumar, S.B. Ten-
dulkar, S.S. Tambe, B.D. Kulkarni, Fischer-Tropsch synthesis
with Co/SiO2-Al2O3 catalyst and steady-state modeling using
artificial neural networks, Fuel 77 (1998) 1763�/1768.
[47] A.M. Shaw, F.J. Doyle, III, J.S. Schwaber, A dynamic neural
network approach to nonlinear process modeling, Comp. Chem.
Eng. 21 (1996) 371�/385.
[48] S.B. Tendulkar, S.S. Tambe, I. Chandra, P.V. Rao, R.V. Naik,
B.D. Kulkarni, Hydroxylation of phenol to dihydroxybenzenes:
development of artificial neural-network-based process identifica-
tion and model predictive control strategies for a pilot plant scale
reactor, Ind. Eng. Chem. Res. 37 (1998) 2081�/2085.
[49] J. Thibault, B.P.A. Grandjean, A neural network methodology
for heat transfer data analysis, J. Heat Mass Transfer 34 (1991)
2063�/2070.
[50] J.A. Wilson, F.M. Zorzetto, A generalized approach to process
state estimation using hybrid artificial neural network/mechanistic
models, Comp. Chem. Eng. 21 (1996) 951�/963.
[51] X.G. Zhou, L.H. Liu, Y.C. Dai, W.K. Yuan, Modeling of a fixed-
bed reactor using the K-L expansion and neural networks, Chem.
Eng. Sci. 51 (1996) 2179�/2188.
[52] L. Fausset, Fundamentals of Neural Networks: Architectures,
Algorithms and Applications, Prentice Hall inc, Englewood Cliffs,
New Jersey, 1994.
[53] Koneripalli N., Mass Transfer Characteristics of Gases in
Methanol and Ethanol Under Elevated Pressures and Tempera-
tures in Agitated Reactors, Ph.D. Dissertation, University of
Pittsburgh, Pittsburgh, PA, USA, (1992).
[54] Li J., Mass Transfer and Mathematical Modeling For Propylene
Polymerization Process, Ph.D. Dissertation, University of Pitts-
burgh, Pittsburgh, PA, USA, (1995).
[55] Tekie Z., Mass Transfer and Modeling of Liquid-Phase Cyclo-
hexane Oxidation Process in Agitated Reactors, Ph.D. Disserta-
tion, University of Pittsburgh, Pittsburgh, PA, USA, (1997).
R. Lemoine et al. / Chemical Engineering and Processing 42 (2003) 621�/643642
[56] Mohammad A., Gas�/Liquid Mass Transfer Parameters in
Benzoic Acid Oxidation Process, Ph.D. Dissertation, University
of Pittsburgh, Pittsburgh, PA, USA, (1999).
[57] Fillion B., Modeling of Soybean Oil Hydrogenation Process,
Ph.D. Dissertation, University of Pittsburgh, Pittsburgh, PA,
USA, (2001).
[58] Inga J.R., Scale-up and Scale-down of Slurry Reactors: A New
Methodology, Ph.D. Dissertation, University of Pittsburgh,
Pittsburgh, PA, USA, (1997).
[59] J.C. Charpentier, Mass Transfer Rates in Gas�/Liquid Absorbers
and Reactors, Advances in Chemical Engineering, Academic
Press, 1981, p. 11.
[60] E. Buckingham, On physical similar systems: illustrations of the
use of dimensional equations, Phys. Rev. 4 (1914) 345�/376.
[61] Rumelhart D.E., G.E. Hinton and R.J. Williams, Learning
Internal Representations by Error Propagation, Parallel Distrib-
uted Processing: Explorations in the Microstructure of Cognition,
MA: The MIT Press, Foundations D.E. Rumelhart and J.L.
McClelland (eds.), Vol. 1 (1986), pp. 318-362.
[62] K. Funahashi, On the approximate realization of continuous
mappings by neural networks, Neural Networks 2 (1989) 183�/
192.
[63] K. Hornik, M. Stinchcombe, H. White, Multilayer feedforward
networks are universal approximators, Neural Networks 2 (1989)
359�/366.
[64] S. German, E. Bienenstock, R. Doursat, Neural networks and the
bias/variance dilemma, Neural Comput. 4 (1992) 1�/58.
[65] J.M. Twomey, A.E. Smith, Bias and variance of vadidation
methods for function approximation neural networks under
conditions of sparse data, IEEE Trans. Syst. Man Cybern. 28 (3
Part C) (1998) 417�/430.
[66] Martinez B. Mass Transfer Parameters of H2 and N2 in a Slurry
Agitated Reactor Operating under Industrial Conditions with
Organic Liquid Mixtures, M.S. Dissertation, University of
Pittsburgh, Pittsburgh, PA, USA (2000).
[67] J.T. Davies, Turbulence phenomena at free surfaces, AIChE J. 18
(1972) 169�/173.
[68] P.H. Calderbank, M.B. Moo-Young, The continuous phase heat
and mass-transfer properties of dispersion, Chem. Eng. Sci. 16
(1961) 39�/54.
[69] Fillion B., R. Lemoine, Y. Heintz and B.I. Morsi, Characteriza-
tion of Gas-Inducing Impeller at Elevated Temperatures and
Pressures, in press.
[70] J.H. Rushton, J.-J. Bimbinet, Holdup and flooding in air liquid
mixing, Canad. J. Chem. Eng. 46 (1968) 16�/21.
[71] D.X. He, S.H. Chiang, G.E. Klinzing, Operating characteristics of
a gas/liquid contactor using gas-inducing turbine, J. Chin. Inst.
Chem. Eng. 22 (1991) 321�/328.
[72] C. Aldrich, J.S.J. van Deventer, Observations on the effect of
medium density and viscosity on the rate of induced aeration in
agitated vessels, Metal. Mat. Trans. B. 25B (1994) 303�/306.
[73] T. Vermulen, G.M. Williams, G.E. Langlois, Chem. Eng. Prog. 51
(1955) 2(85F).
[74] V.G. Levich, Physicochemical Hydrodynamics, Prentice-Hall,
Englewood Cliffs NJ, 1962, pp. 689�/697.
[75] P.H. Calderbank, Physical rate processes in industrial fermenta-
tion. part I: the interfacial area in gas�/liquid contacting with
mechanical agitation, Trans. Inst. Chem. Eng. 36 (1958) 443�/463.
[76] J.O. Hinze, Fundamentals of the hydrodynamic mechanism of
splitting in dispersion processes, AIChE J. 1 (1955) 289.
[77] A.W. Patwardhan, J.B. Joshi, Design of gas-inducing reactors,
Ind. Eng. Chem. Res. 38 (1999) 49�/80.
[78] A.A. Kosinski, C.J. King, The influence of diffusivity on liquid
phase mass transfer to the free interface in a stirred vessel, AIChE
J. 12 (1966) 109�/116.
[79] R.E. Farritor, G.A. Hughmark, Mass transfer to the free interface
in a stirred vessel, AIChE J. 20 (1974) 1027�/1028.
[80] J. Boussinesq, J. Math. 6 (1905) 285.
[81] R. Higbie, The rate of absorption of a pure gas into a still liquid
during short periods of exposure, Trans. Am. Inst. Chem. Eng. 31
(1935) 365.
[82] M. Zlokarnik, Hollow stirrers for gassing of liquids. Determina-
tion of gas diffusion and wave performance, Chem. Ing. Eng. 38
(1966) 357�/366.
[83] A.A.C.M. Beenackers, W.P.M. van Swaaij, Mass transfer in gas�/
liquid slurry reactors, Chem. Eng. Sci. 48 (1993) 3109�/3139.
[84] A. Deimling, B.M. Karandikar, Y.T. Shah, N.L. Carr, Solubility
and mass transfer of CO and H2 in Fischer-Tropsch liquids and
slurries, Chem. Eng. J. 29 (1984) 127�/140.
[85] J.H. Lee, N.R. Foster, Mass transfer and solubility of O2 and CH4
in silicone fluids, Ind. Eng. Chem. Res. 29 (1990) 691�/696.
[86] F. Yoshida, S.-I. Arakawa, Pressure dependency of liquid phase
mass transfer coefficients, AIChE J. 14 (1968) 962�/963.
[87] M. Teramoto, S. Tai, K. Nishii, H. Teranishi, Effects of pressure
on liquid-phase mass transfer coefficients, Chem. Eng. J. 8 (1974)
223�/226.
[88] M.P. Wilkinson, H. Haringa, L.L. van Dierendonck, Mass
transfer and bubble size in a bubble column under pressure,
Chem. Eng. Sci. 49 (1994) 1417�/1427.
[89] T. Sridhar, O.E. Potter, Gas holdup and bubble diameter in
pressurized gas�/liquid stirred vessels, Ind. Eng. Chem. Fundam.
19 (1980) 21�/26.
[90] V.D. Metha, M.M. Sharma, Mass transfer in mechanically
agitated gas�/liquid contactors, Chem. Eng. Sci. 26 (1971) 461.
[91] H. Judat, Gas/liquid mass transfer in stirred vessels-a critical
review, Ger. Chem. Eng. 5 (1982) 357.
[92] R.V. Chaudhari, R.V. Gholap, G. Emig, H. Hofmann, Gas�/
liquid mass transfer in dead-end autoclave reactors, Can. J.
Chem. Eng. 65 (1987) 774.
R. Lemoine et al. / Chemical Engineering and Processing 42 (2003) 621�/643 643