
Prediction of the Bullet Effect for Rockfall Barriers: a ... · Prediction of the Bullet Effect for...
14
ORIGINAL PAPER Prediction of the Bullet Effect for Rockfall Barriers: a Scaling Approach M. Spadari • A. Giacomini • O. Buzzi • J. P. Hambleton Received: 4 October 2011 / Accepted: 14 November 2011 Ó Springer-Verlag 2011 Abstract The so-called ‘‘bullet effect’’ refers to the per- foration of a rockfall protection mesh by impact of a small block, which has a kinetic energy lower than the design value, where the design value is determined through tests with relatively large blocks. Despite playing a key role in the overall performance of a flexible rockfall barrier, this phenomenon is still poorly understood at present. An innovative approach for quantitatively characterizing this effect based on dimensional analysis is proposed in this paper. The analysis rests on a hypothesis that the relevant variables in the impact problem can be combined into three strongly correlated dimensionless parameters. The rela- tionship between these dimensionless parameters (i.e., the scaling relationship) is subsequently investigated and val- idated by means of data generated with a finite element model. The validation process shows that the dimension- less parameters are apt and that the proposed scaling relationship characterizes the bullet effect with a reason- able level of accuracy. An example from the literature involving numerical simulation of a full rock barrier is considered, and satisfactory agreement between the cal- culated performance of the barrier and that predicted by the established scaling relationship is observed. Keywords Rockfall barrier Kinetic energy Bullet effect Stress concentration Dimensional analysis 1 Introduction In many countries, rockfall represents a serious risk to people and infrastructures. Rockfall risks are mitigated either by stabilizing the rock mass or by installing pro- tective systems such as engineered barriers, shelters, or earth dams. Among available protective systems, rock- fall barriers, which typically consist of steel posts, cables, and a wire mesh, are attractive for the relative adaptivity of their design and the effective protection they provide over a broad range of impacting energy (Descoeudres et al. 1999). The impacting energy is usually determined as the sum of kinetic (translational) and rotational energy of the rock block at the instant just before it collides with the barrier. Both components of impacting energy are commonly obtained from numeri- cal simulations of rockfall trajectories for the particular slope under consideration. Protection barriers are usually tested to ascertain the threshold of impacting energy above which failure of the barrier will occur. This critical value of energy, or design value, is typically determined by means of experiments (Duffy and Smith 1990; Peila et al. 1998: Bertolo et al. 2009; Grassl et al. 2002; Hearn et al. 1995; Arndt et al. 2009), although numerical and analytical methods are increasingly being used to predict barrier performance (Anderheggen et al. 2002; Volkwein 2005; Cazzani et al. 2002; Cantarelli et al. 2008). Physical testing of barriers as they would be installed in the field is typically not a trivial exercise, and the free-fall test, a much simpler experiment, is often preferred to obtain an impact (Gerber 2001; EOTA 2008). In the free-fall test, where the rotational component of energy is negligible and total energy is solely kinetic, the impacting energy is determined simply by the block mass and drop height. In that case, a basic, unresolved question M. Spadari A. Giacomini O. Buzzi (&) J. P. Hambleton Centre for Geotechnical and Materials Modelling, The University of Newcastle, Callaghan, NSW 2308, Australia e-mail: [email protected] 123 Rock Mech Rock Eng DOI 10.1007/s00603-011-0203-0
Transcript of Prediction of the Bullet Effect for Rockfall Barriers: a ... · Prediction of the Bullet Effect for...
ORIGINAL PAPER
Prediction of the Bullet Effect for Rockfall Barriers:a Scaling Approach
M. Spadari • A. Giacomini • O. Buzzi •
J. P. Hambleton
Received: 4 October 2011 / Accepted: 14 November 2011
� Springer-Verlag 2011
Abstract The so-called ‘‘bullet effect’’ refers to the per-
foration of a rockfall protection mesh by impact of a small
block, which has a kinetic energy lower than the design
value, where the design value is determined through tests
with relatively large blocks. Despite playing a key role in
the overall performance of a flexible rockfall barrier, this
phenomenon is still poorly understood at present. An
innovative approach for quantitatively characterizing this
effect based on dimensional analysis is proposed in this
paper. The analysis rests on a hypothesis that the relevant
variables in the impact problem can be combined into three
strongly correlated dimensionless parameters. The rela-
tionship between these dimensionless parameters (i.e., the
scaling relationship) is subsequently investigated and val-
idated by means of data generated with a finite element
model. The validation process shows that the dimension-
less parameters are apt and that the proposed scaling
relationship characterizes the bullet effect with a reason-
able level of accuracy. An example from the literature
involving numerical simulation of a full rock barrier is
considered, and satisfactory agreement between the cal-
culated performance of the barrier and that predicted by the
established scaling relationship is observed.
Keywords Rockfall barrier � Kinetic energy � Bullet
effect � Stress concentration � Dimensional analysis
1 Introduction
In many countries, rockfall represents a serious risk to
people and infrastructures. Rockfall risks are mitigated
either by stabilizing the rock mass or by installing pro-
tective systems such as engineered barriers, shelters, or
earth dams. Among available protective systems, rock-
fall barriers, which typically consist of steel posts,
cables, and a wire mesh, are attractive for the relative
adaptivity of their design and the effective protection
they provide over a broad range of impacting energy
(Descoeudres et al. 1999). The impacting energy is
usually determined as the sum of kinetic (translational)
and rotational energy of the rock block at the instant just
before it collides with the barrier. Both components of
impacting energy are commonly obtained from numeri-
cal simulations of rockfall trajectories for the particular
slope under consideration.
Protection barriers are usually tested to ascertain the
threshold of impacting energy above which failure of the
barrier will occur. This critical value of energy, or design
value, is typically determined by means of experiments
(Duffy and Smith 1990; Peila et al. 1998: Bertolo et al.
2009; Grassl et al. 2002; Hearn et al. 1995; Arndt et al.
2009), although numerical and analytical methods are
increasingly being used to predict barrier performance
(Anderheggen et al. 2002; Volkwein 2005; Cazzani et al.
2002; Cantarelli et al. 2008). Physical testing of barriers as
they would be installed in the field is typically not a trivial
exercise, and the free-fall test, a much simpler experiment,
is often preferred to obtain an impact (Gerber 2001; EOTA
2008). In the free-fall test, where the rotational component
of energy is negligible and total energy is solely kinetic, the
impacting energy is determined simply by the block mass
and drop height. In that case, a basic, unresolved question
M. Spadari � A. Giacomini � O. Buzzi (&) � J. P. Hambleton
Centre for Geotechnical and Materials Modelling,
The University of Newcastle, Callaghan,
NSW 2308, Australia
e-mail: [email protected]
123
Rock Mech Rock Eng
DOI 10.1007/s00603-011-0203-0

arises as to which combination of block mass and velocity
should be used to achieve the desired impacting energy for
the test. The Swiss design guidelines (Gerber 2001), for
example, require using not one but multiple block dimen-
sions, including small sizes, for the approval of a rockfall
protection kit. This is motivated by the fact that a small
block impacting at high speed may perforate a barrier
despite having a kinetic energy lower than the critical value
determined from tests involving a large block. More gen-
erally, there is a size effect when dealing with impact of
blocks on a barrier. This effect is usually referred to as the
‘‘bullet effect’’ in the literature and it has been mentioned
by a number of researchers (Cazzani et al. 2002; Cantarelli
et al. 2008; Giani 1992; de Col and Cocco 1996; Volkwein
et al. 2005; Buzzi et al. 2011).
Figure 1 shows two manifestations of the bullet effect.
A typical failure in a steel wire mesh due to impact of a
small block can be seen in Fig. 1a, where a block with a
diameter of roughly 30 cm has impacted a rockfall barrier
between two horizontal cables and has perforated the mesh.
As discussed by De Col and Cocco (1996), failures of this
kind are usually localized in small areas of the mesh and do
not involve structural elements such as posts and cables.
Figure 1b shows the results obtained from a numerical
model developed by Cazzani et al. (2002). The dependence
of the mesh performance on the block size clearly appears:
the smaller the block, the smaller is the impacting energy at
failure. This raises the issue of the relevance of kinetic
energy as a design criterion, since it is evident that there is
no single value of kinetic energy (i.e., a design value) that
effectively defines a barrier’s ability to withstand impacts
over a range of block sizes.
Interestingly, numerical models can reproduce the loss
of performance associated with the bullet effect (Cazzani
et al. 2002; Buzzi et al. 2011), but the origin of the phe-
nomenon is seldom analyzed. It is generally conjectured
that this phenomenon is the result of stress concentration.
Quite recently, Buzzi et al. (2011) developed a numerical
model of block impact on a wire mesh and conducted some
analysis to investigate the idea of stress concentration. The
authors came to the conclusion that the progressive loss of
performance of a mesh can be related to a lower number of
wires entering into plasticity as the block size decreases.
Consequently, the wires elongate more to absorb the
energy and reach failure quicker. However, this failure
mechanism is partly a consequence of the modeling
assumptions (e.g., material behavior and mesh connec-
tions), and it is unsure if such a mechanism would prevail
in practice.
Despite the relevance of the bullet effect for the design
and performance of rockfall protective systems, there is a
clear lack of data in literature on this topic. More critically,
there is currently no efficient predictive method that could
be used to estimate the performance of a barrier for dif-
ferent sizes of impacting blocks. Extensive physical testing
or numerical modeling can potentially be employed to
check the barrier performance; however, such a process is
very time-consuming on account of not only the repetitions
required at various block sizes, but also the iterations
necessary to determine the block speed inducing failure at a
particular block size. A more efficient approach requiring a
fewer tests or lower computational cost is clearly needed.
It is herein proposed to use dimensional analysis to
characterize the performance of a barrier in terms of the
(a) (b)
0.2 0.4 0.6 0.8 1 1.2 1.4
Block Diameter [m]
0
100
200
300
400
500
Kin
etic
Ene
rgy
[kJ]
Fig. 1 Examples of the bullet effect: a perforated rockfall mesh, b kinetic energy at failure of a rockfall barrier for different block sizes (adapted
from Cazzani et al. (2002))
M. Spadari et al.
123

bullet effect. In the first part of the paper, dimensionless
parameters pertaining to a rock block impacting the wire
mesh within a rockfall barrier are derived after due iden-
tification of the relevant physical variables. The second
part of the paper presents the results of a numerical model
that has been developed using Abaqus 6.10 to create a
database of the responses of different meshes to the impact
of blocks of various sizes. Finally, the scaling relationships
determined through dimensional analysis and the numeri-
cal results are validated by comparison with results
obtained in a previous study for a full barrier. The results
suggest that the bullet effect can be satisfactorily charac-
terized by three essential dimensionless parameters con-
taining the relevant variables of the problem. For the first
time, a network of performance curves, referred to as the
‘‘Rockfall Barrier Performance Model’’, or RoBaP Model,
is produced and used to capture the dependence of the
barrier performance on the block size.
2 Definition of the Physical Problem
Before conducting the dimensional analysis, an idealization
of the rockfall impact problem is first described in relation
to real rockfall protection systems, and the relevant phys-
ical variables to be included in the analysis are identified.
Figure 2a shows a rockfall barrier and how it can
deform upon impact. The design of a barrier is not unique,
though it invariably revolves around several critical ele-
ments: foundations, posts, an intercepting structure (steel
mesh), and cables. Usually, the part of mesh located
between two successive posts is referred to as a ‘‘module’’.
It can be seen in Fig. 2a that the mesh is not necessarily
attached to all posts, which are mainly used to support the
cables.
The performance of a barrier upon impact is affected
by many variables. Some play a major role, while others
have a minor effect. For example, the coefficient of
friction between the mesh and the block, the Poisson’s
ratio of the steel mesh, and the mechanical properties of
the block (which typically does not fail upon impact) are
here considered to have negligible effect. On the contrary,
dimensions of the block, strength of the steel mesh, mesh
geometry and, last but not least, the stiffness of the system
all play a major role in the response of a rockfall barrier.
As a concept, ‘‘stiffness’’ refers to the extent to which the
barrier deforms upon impact. Interestingly, despite being a
crucial property of a rockfall barrier, stiffness is seldom
quantified on account of the many underlying factors that
influence this property. Among other factors, the overall
stiffness comes from the type of mesh (chain link or
double twist), deformability and ductility of steel, distance
Fig. 2 a Photograph of a
rockfall barrier after Peila and
Oggeri (2005). b Idealized
rockfall impact problem used
for the numerical model
showing aperture A,
spring stiffness K, and wire
diameter Dw
The Bullet Effect for Rockfall Barriers
123

between posts, length and height of the mesh, the effect of
energy dissipators (if present), the means by which the
posts and cables are supported, and the number of cables.
For the present study, concerning perforation of only a
small portion of the mesh in a rockfall barrier, the inde-
pendent factors that lead to the overall stiffness of the
barrier are irrelevant. That is, the full rockfall barrier need
not be considered in the analysis, and the free-fall impact
problem can be regarded as a block impacting a segment of
mesh that is somehow supported at the periphery by
springs of effective (nonlinear) stiffness, which in general
may vary specially over the region of support. By viewing
the problem in this way, no approximation has yet been
made, although it is clear that the degree to which the
idealized problem represents a real rockfall barrier depends
on the assumed position and stiffness of the springs. In this
paper, we assume for simplicity that the springs possess
constant linear stiffness, denoted by K, and they support a
rectangular region of mesh at regular intervals, as shown in
Fig. 2b. The merit of assuming constant linear stiffness is
in the resulting simplification of the analysis, although
some comments as to the determination of K for real sys-
tems is presented in the prediction exercise at the end of the
paper (Sect. 7). The rectangular region of mesh has height
H and length L [ H. It will be shown in Sect. 4 that H is
the key dimension in the impact problem, and H alone is
therefore included as a relevant variable in further analysis.
The configuration for the wire mesh is also shown in
Fig. 2b. The mesh is chain link (elementary cell of dia-
mond shape) as opposed to a double twist (elementary cell
of hexagonal shape), and each cell in the mesh is a dia-
mond (rhombus) whose shorter diagonal has length deno-
ted by A, where A is referred to as ‘‘aperture’’. The shape of
the diamond corresponds to an existing rockfall mesh. The
wire itself has a diameter Dw, and it is assumed as in the
work of Cazzani et al. (2002) that the material is elastic-
perfectly plastic with yield strength ry and a specified
failure strain. As discussed in Sect. 4, elastic properties of
the wire and the failure strain are held constant in the
analysis. Furthermore, the elastic properties of the wire are
seen as having secondary importance in the block impact
problem, and the failure strain is already a dimensionless
parameter. These quantities, as well as the density of the
wire, are therefore excluded here as explicit variables.
The shape of the impacting block, which is in accordance
with testing recommendations from ETAG 027 (EOTA
2008), is shown in Fig. 2b. The nominal length of the block’s
edges is denoted by Db. With the dimension defined in this
way, the block density suffices to fully characterize the rigid
block. The block density is denoted by q, and throughout the
paper a constant value of q = 2,400 kg/m3 is assumed since
the variability of density of natural dense rocks is fairly low
(Cazzani et al. 2002).
The performance of the idealized system is expressed in
terms of critical speed v, which is the minimum speed
required for a given block to perforate the mesh. On the
basis of the considerations above, it is implicitly assumed
that there exists some function f that relates v to the
remaining primary variables:
v ¼ f q; K; ry; H; A; Db; Dw
� �ð1Þ
where q is the block density, Db its characteristic length,
H the mesh height, A its aperture, Dw the wire diameter,
ry the material strength, and K the stiffness of the system.
3 Dimensional Analysis of Block Impact on a Barrier
Dimensional analysis rests on the Buckingham Pi Theorem
(Buckingham 1914), which states that a physical problem
involving N independent variables and P dimensions can
be reformulated using N–P dimensionless parameters. The
main motivation of performing dimensional analysis is to
reduce of the number of parameters required to describe a
problem (Langhaar 1951). As a convention, physical
(dimensional) quantities as defined in Sect. 2 are referred to
as ‘‘variables’’ throughout the paper, whereas the dimen-
sionless groups of variables are referred to as ‘‘dimen-
sionless parameters’’.
Equation 1, which describes the physical problem of
interest, involves eight variables and three dimensions
(time, length, and mass). According to the Buckingham Pi
theorem, Eq. 1 can be re-written using only five dimen-
sionless parameters. These five dimensionless parameters
are not, however, uniquely determined by the dimensions
of the eight original variables alone. In this paper, the
analysis proceeds by first postulating the key dimensionless
parameters and then using the numerical model to assess
their validity.
By analogy to other impact problems in solid mechanics
(Li and Jones 2000; Johnson 1972), it is proposed to group
the critical speed, the stiffness of the system and the height
of the mesh in the first dimensionless parameter, E*, as
follows:
E� ¼ qv2H
Kð2Þ
The parameter E* bears similarity to the ‘‘damage
number’’ used by Johnson (1972), with the main
differences being that q is the density of the impacting
block (as opposed to the material with which it collides),
and the stiffness of the barrier, rather than the yield
strength, appears in the denominator. Parameter E* is the
descriptor of barrier performance in terms of critical speed,
and it is hence referred to as the ‘‘performance parameter’’.
It should be noted that E* does not directly relate to kinetic
M. Spadari et al.
123

energy (i.e., 0.5 mv2, where m is block mass), but rather to
the square of critical speed.
It is assumed that the second fundamental dimensionless
parameter should quantify the stiffness of the barrier in
relation to the yield strength of the wire. This parameter,
denoted by S* and referred to as the ‘‘strength-stiffness
parameter’’, is therefore chosen as
S� ¼ K
Hryð3Þ
Large values of S* imply that the barrier is relatively
stiff, and deformation of the barrier prior to the onset of
yielding is small. Conversely, small values of S* imply that
large deformation will occur prior to failure.
Parameters E* and S* are independent of the charac-
teristic length of the block, Db, as well as the two
parameters pertaining to the geometry of the mesh, Dw
and A. Rather than defining three independent dimen-
sionless parameters to account for the influence of these
parameters (e.g., Db/H, Dw/H, and A/H), it is hypothesized
that Db, Dw, and A can be combined in a single dimen-
sionless parameter, called the ‘‘geometrical parameter’’
and defined as
G� ¼ AaDbbDc
w ð4Þ
where the exponents a, b, and c are as yet unknown but
satisfy the following condition, as required for dimensional
homogeneity:
aþ bþ c ¼ 0 ð5Þ
The strong assumption that Db, Dw, and A can be
lumped together in a single dimensionless parameters is
made with the expectation that stress concentrations are
determined by the local geometry of the mesh in relation to
the block size. This hypothesis is tested in due course in the
paper.
The dimensionless parameters proposed in this section
potentially form the basis for the following simple alter-
native to Eq. 1:
E� ¼ F S�;G�ð Þ ð6Þ
In accordance with the literature on dimensional analysis
and similitude, Eq. 6 is here referred to as the ‘‘scaling
relationship’’ for a block impacting a barrier. Rather than
identifying f, a function of seven variables in Eq. 1, the task
is now to identify F in Eq. 6, a function of only two
parameters. It remains to be shown, however, that Eq. 6
provides a reasonable approximation to the data available
for block impact on a barrier. Toward this purpose, the
remainder of the paper is dedicated to validation of Eq. 6
and the dimensionless parameters involved. In the present
study, the data used to validate Eq. 6 is generated using an
upgraded version of the numerical model developed by
Buzzi et al. (2011). An outline of this model is presented in
the next section.
4 Numerical Model
With a view toward investigating the soundness of Eq. 6
and the dimensionless parameters E*, S*, and G*, numer-
ical simulations of free-fall tests were performed using the
dynamic finite element code Abaqus/Explicit 6.10. This
section presents a broad overview of the numerical pro-
cedure and underlying assumptions.
4.1 Geometry
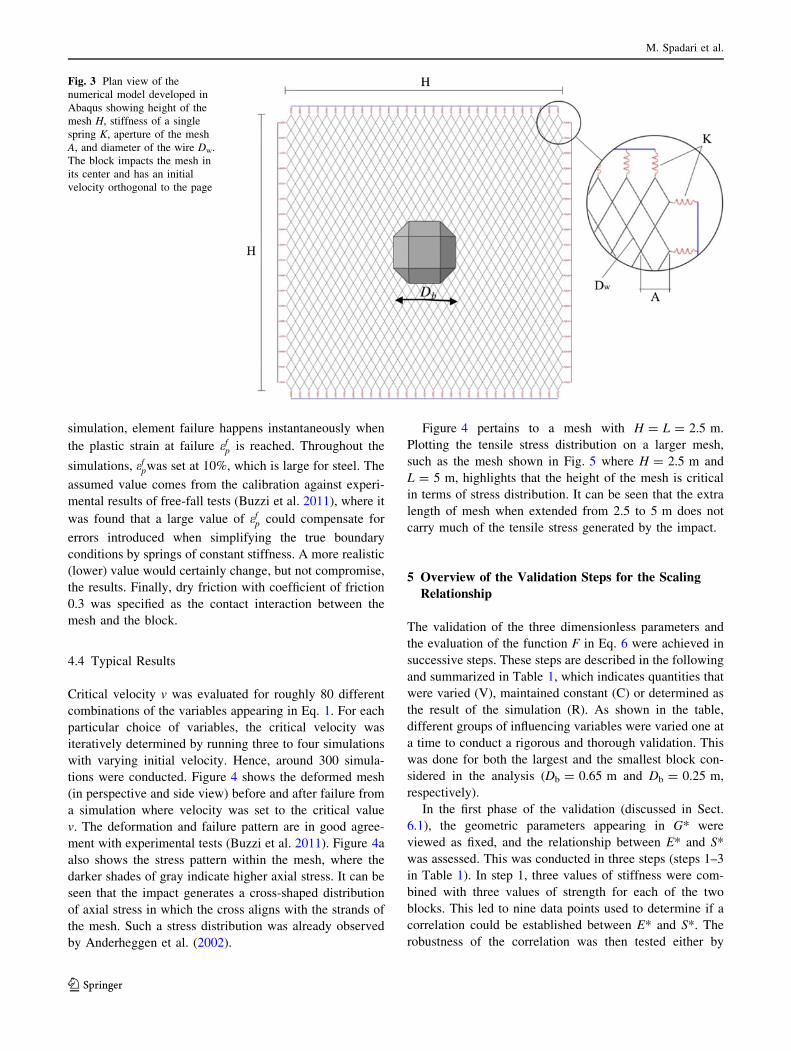
As discussed in Sect. 2, the numerical model is an ideali-
zation of a free-fall test on a full rockfall protection barrier.
It consists of a concrete block impacting vertically and
centrally on a steel mesh (Fig. 3). The mesh was connected
to rigid supports by means of springs of stiffness K, which
were added to the initial model developed by Buzzi et al.
(2011) to artificially vary the stiffness of the idealized
system. Rather than simulating the initial gravitationally
induced free fall, the block was placed in contact with the
mesh in the simulations and given a prescribed initial
velocity combined with gravitational loading to reproduce
the whole impact.
4.2 Mesh and Elements
The impacting block was made of four-node tetrahedral
elements (C3D4), and the steel wires were discretized
using two-node linear 3-D beam elements (B31). The beam
elements had a circular section of diameter Dw and were
rigidly connected at the nodes. Only one element was used
per diamond side. This choice might affect the results in
terms of matching experimentally observed mesh behavior,
but such a potential error is immaterial for the comparative
study of performance conducted in this paper. The springs
were inserted as connector elements between the outer
nodes and a support beam, which was constrained in dis-
placement and rotation.
4.3 Material and Contact Properties
In the present study, it is assumed that the impacting block
does not fail. Consequently, the block in the numerical
simulations was composed of elastic material with
parameters representative of concrete or rock (E = 30
GPa, m = 0.3 and q = 2,400 kg/m3). As discussed in Sect.
2, elastic-perfectly plastic behavior (E = 210 GPa, m = 0.3
and variable yield strength ry) was assumed for the steel of
the mesh, which had a density of 7,800 kg/m3. In the
The Bullet Effect for Rockfall Barriers
123
simulation, element failure happens instantaneously when
the plastic strain at failure efp is reached. Throughout the
simulations, efpwas set at 10%, which is large for steel. The
assumed value comes from the calibration against experi-
mental results of free-fall tests (Buzzi et al. 2011), where it
was found that a large value of efp could compensate for
errors introduced when simplifying the true boundary
conditions by springs of constant stiffness. A more realistic
(lower) value would certainly change, but not compromise,
the results. Finally, dry friction with coefficient of friction
0.3 was specified as the contact interaction between the
mesh and the block.
4.4 Typical Results
Critical velocity v was evaluated for roughly 80 different
combinations of the variables appearing in Eq. 1. For each
particular choice of variables, the critical velocity was
iteratively determined by running three to four simulations
with varying initial velocity. Hence, around 300 simula-
tions were conducted. Figure 4 shows the deformed mesh
(in perspective and side view) before and after failure from
a simulation where velocity was set to the critical value
v. The deformation and failure pattern are in good agree-
ment with experimental tests (Buzzi et al. 2011). Figure 4a
also shows the stress pattern within the mesh, where the
darker shades of gray indicate higher axial stress. It can be
seen that the impact generates a cross-shaped distribution
of axial stress in which the cross aligns with the strands of
the mesh. Such a stress distribution was already observed
by Anderheggen et al. (2002).
Figure 4 pertains to a mesh with H = L = 2.5 m.
Plotting the tensile stress distribution on a larger mesh,
such as the mesh shown in Fig. 5 where H = 2.5 m and
L = 5 m, highlights that the height of the mesh is critical
in terms of stress distribution. It can be seen that the extra
length of mesh when extended from 2.5 to 5 m does not
carry much of the tensile stress generated by the impact.
5 Overview of the Validation Steps for the Scaling
Relationship
The validation of the three dimensionless parameters and
the evaluation of the function F in Eq. 6 were achieved in
successive steps. These steps are described in the following
and summarized in Table 1, which indicates quantities that
were varied (V), maintained constant (C) or determined as
the result of the simulation (R). As shown in the table,
different groups of influencing variables were varied one at
a time to conduct a rigorous and thorough validation. This
was done for both the largest and the smallest block con-
sidered in the analysis (Db = 0.65 m and Db = 0.25 m,
respectively).
In the first phase of the validation (discussed in Sect.
6.1), the geometric parameters appearing in G* were
viewed as fixed, and the relationship between E* and S*
was assessed. This was conducted in three steps (steps 1–3
in Table 1). In step 1, three values of stiffness were com-
bined with three values of strength for each of the two
blocks. This led to nine data points used to determine if a
correlation could be established between E* and S*. The
robustness of the correlation was then tested either by
Fig. 3 Plan view of the
numerical model developed in
Abaqus showing height of the
mesh H, stiffness of a single
spring K, aperture of the mesh
A, and diameter of the wire Dw.
The block impacts the mesh in
its center and has an initial
velocity orthogonal to the page
M. Spadari et al.
123

investigating multiple combinations of stiffness and
strength yielding the same value of S* (step 2) or by
introducing different mesh dimensions (step 3).
In the second phase (discussed in Sect. 6.2), the expo-
nents appearing in G* (Eq. 4) were evaluated, and the
function F was partly defined. The validation of G*
involves, first and foremost, identification of the unknown
exponents a, b and c in Eq. 4. Instead of guessing the
possible combinations satisfying dimensional homogeneity
(Eq. 5), back analysis was performed to identify the
exponents in a more rigorous and systematic manner. To
accomplish this, different combinations of block size and
wire diameter yielding the same mesh performance were
determined (step 4 in Table 1). This provided information
about exponents b and c. Lastly, the value of a was
deduced from the condition of dimensional homogeneity,
and the overall validity of values determined for exponents
a, b, and c was checked in step 5.
6 Validation of the Proposed Scaling Relationship
6.1 Validation of E* and S*
The first step of the validation of the proposed scaling
relationship (Eq. 6) was to determine whether a
Fig. 4 a View of the deformed
mesh just before failure. The
shade of gray indicates the level
of axial stress in the wires (lightgray stress lower than 500 MPa;
dark gray stress from 500 to
1,500 MPa). b Side view of
deformed mesh just before
failure. c View of the failure
pattern (level of stress not
indicated on this subfigure).
Mesh of 2.5 per 2.5 m
The Bullet Effect for Rockfall Barriers
123

satisfactory correlation could be obtained between E* and
S* for fixed values of the variables appearing in G* (Eq. 4).
In addition to the critical velocity v, four parameters appear
in E* and S*: density of the block q, stiffness K, yield
strength ry, and the mesh height H. As discussed in Sect. 2,
q does not vary substantially between various types of rock
and concrete, and it was therefore considered fixed
(q = 2,400 kg/m3). On the other hand, K and ry are highly
variable, and to investigate the validity of Eq. 6, these
parameters were varied independently. The effect of
varying H is considered later in this section.
Figure 6 shows the result of the simulations for the
largest and smallest blocks considered in the analysis
(Db = 0.65 and 0.25 m, respectively), where simulations
were run at constant aperture (A = 70 mm), constant wire
diameter (Dw = 3 mm), constant mesh height (H = L =
2.5 m), and the nine combinations of K and ry from
Table 2. Figure 6 displays a clear linear correlation (on a
log–log scale) between E* and S* for the two different
block sizes, with relatively small scatter about the corre-
sponding trend lines. This suggests that E* and S* are
appropriate dimensionless parameters for characterizing
the critical block velocity with fixed geometric parameters
for the mesh (i.e., fixed G*). Figure 7 shows similar trend
lines evaluated for each of the block sizes considered
(Db = 0.25, 0.35, 0.4, 0.55 and 0.65 m). For clarity, the
data points are omitted in the figure.
Each trend in Fig. 7 corresponds to a given block size,
and it should be recalled that the simulations were run at
constant aperture (A = 70 mm) and wire diameter
(Dw = 3 mm). Consequently, as per Eq. 4, the trends
presented in Figs. 6 and 7 are evolutions at constant G*.
For each trend in Fig. 7, low values of S* correspond to
high strength and/or compliant systems. Consequently, the
critical speed required for a block to perforate the mesh is
high. On the other hand, when reducing the mesh strength
and/or stiffening the system (high values of S*), the crit-
ical speed decreases. This behavior is consistent with
experimental observations. Also, the relative position of
the trends is consistent with findings from experiments:
for a given system (i.e., for a given S*), the smaller the
block, the higher the critical speed required (i.e., E*).
Note that the existence of the bullet effect cannot be
evidenced from these trends alone, since higher speed is
always required to perforate a mesh as the blocks get
smaller, even without bullet effect. The manifestation of
the bullet effect in the proposed scaling relationship is
discussed in the last section of the paper. The network of
curves as shown in Fig. 7 is here referred to as the
‘‘Rockfall Barrier Performance Model’’ or, more simply,
the RoBaP Model.
For E* and S* to be appropriate dimensionless param-
eters, E* should remain constant as K and ry are varied in
proportion to one another (i.e., constant S*). To verify this,
additional simulations in which the same factor a was
High stress level Low stress level Medium stress
level
2.5 m
5 m
2.5 m
Fig. 5 Distribution of axial stresses within wires for mesh with
H = 2.5 m and L = 5 m upon impact (Db = 0.65 m, K = 50 kN/m,
ry = 1,600 MPa)
Table 1 Variations of the parameters and corresponding figures for
the different steps of validation (V varied, C constant, and R result)
Validation of Step Figure K ry H A Dw Db v
E*–S* 1 6, 7 V V C C C C R
E*–S* 2 8 V V C C C C R
E*–S* 3 9 C C V C C C R
G* 4 10 C C C C R V C
G* 5 11 C C C V V C R
Fig. 6 E* versus S* for two blocks (Db = 0.25 and 0.65 m) and for
nine different combinations of K and ry. Power trend lines are also
shown, where correlation coefficients are R2 = 0.94 and 0.99 for
Db = 0.65 and 0.25 m, respectively
M. Spadari et al.
123

applied to both stiffness and yield strength were performed,
where the factors a were selected so that
S� ¼ K
Lry¼ aK0ð Þ
L ary0
� � ; a 2 0:5; 0:8; 1:4; 2:2f g ð7Þ
In Eq. 7, K0 and ry0 are reference values of stiffness and
yield strength that determine the value of S*. Four different
values of S* (i.e., four pairs of K0 and ry0) were
considered, as shown in Table 3. By focusing only on the
smallest and largest blocks, a total of 32 data points were
generated in this way to validate the correlations between
E* and S* observed in Fig. 7.
Figure 8 shows E* determined from simulation at each
of the value of S* and a considered. In most cases, similar
values of E* were obtained at each different value of a.
Some scatter is evident, however, for the largest block
(Db = 0.65 m) with S* = 74.3 and 130. The reason behind
these deviations is unknown at present, but it is speculated
that edge effects (boundary conditions) play a role at these
points on account of the large size of the block combined
with high stiffness. Nevertheless, the results shown in
Fig. 8 basically confirm the existence of a relationship
between E* and S* and the possibility of quantifying the
bullet effect in terms of dimensionless parameters instead
of physical variables. It should be emphasized that the
trend lines shown in Fig. 8 are the same as those from
Fig. 6, implying that the previously established correlations
between E* and S* are quantitatively correct.
Up to this point, the mesh height H had been constant in
the analysis. This parameter appears in both E* and S*, and
it is therefore of interest to determine whether varying
H independently affects (i.e., maintains or destroys) the
correlation between these two dimensionless parameters. In
addition to the initial mesh configuration (2.5 9 2.5 m),
three other configurations were considered: 1 9 1 m,
2.5 9 5 m and 5 9 5 m. Parameters K and ry were kept
constant, with K = 50 kN/m and ry = 1,600 MPa, and
block sizes were again Db = 0.65 and 0.25 m. The
smallest mesh was not tested with the largest block, as
significant edge effects were expected.
Figure 9 shows the performance of the three mesh
configurations, where it can be seen that the results fall on,
or very close to, the trend lines obtained with the initial
mesh. This confirms that E* and S* are suitable dimen-
sionless parameters exhibiting a strong correlation. Indeed,
all physical parameters in E* and S*, apart from the
Table 2 Values of stiffness K and steel strength ry, used for the first
step of validation
K (kN/m) ry (MPa)
12, 50 and 130 400, 700 and 1,600
Nine combinations of K and ry were created from these values,
leading to nine values of S*. Other parameters were kept constant:
H = L = 2.5 m, Dw = 3.0 mm, and A = 70 mm
Fig. 7 Trend lines showing E* versus S* for all different values of Db
Table 3 Reference values of stiffness and yield strength, as well as
corresponding values of S*, used for validation of E* and S*
K0 (kN/m) ry0 (MPa) S*
12 1,600 3
50 1,600 12.5
130 700 74.3
130 400 130
Fig. 8 Verification of the correlation between E* and S* with
multiple combinations of K0/ry0 and a (H = 2.5 m, Dw = 3.0 mm,
and A = 70 mm)
The Bullet Effect for Rockfall Barriers
123

material density, have now been varied independently in
the analysis, and each time the same relationship between
E* and S* was obtained with reasonable accuracy.
6.2 Validation of G*
For G* and the proposed scaling relationship to be valid,
the relationship between E* and S* should remain
unchanged when the parameters appearing in the definition
of G* (aperture A, wire diameter Dw, and block diameter
Db) are varied independently, but G* itself remains con-
stant. As a first step toward identifying the exponents in the
definition of G*, we first consider the combinations of Dw
and Db that lead to constant values of E* and S* when A is
constant.
Using the results of the simulation with A = 70 mm,
Dw = 3 mm, H = 2.5 m, K = 50 kN/m, ry = 1,600
MPa, and Db = 0.65 m as a basis, a number of simulations
were performed to ascertain the manner in which block size
and wire diameter should be simultaneously reduced or
increased to maintain the mesh performance (E* = 10).
Three block size sizes (Db = 0.25, 0.35 and 0.55 m) were
considered in addition to the initial diameter of
Db = 0.65 m, and the three corresponding wire diameters
required to give E* = 10 were iteratively evaluated. This
process, which pertained to S* = 12.5, was then repeated
with S* = 74.3 (H = 2.5 m, K = 50 kN/m, ry = 1,600
MPa), and this yielded another three wire diameters that
were found to be approximately equal to those calculated
previously (Fig. 10a). Finally, the whole analysis was
repeated starting from a small block (Db = 0.25 m) and
progressively increasing the block size (Fig. 10b). Again,
the wire diameter Dw required to maintain constant E*
was found to be relatively insensitive to S*, which is
consistent with the proposed scaling relationship of
Eq. 6.
It can be seen in Fig. 10 that there is a strong correlation
between the block size Db and the wire diameter Dw
required to furnish constant E* at specified S*. Further-
more, the points in Fig. 10 can be satisfactorily fitted with a
Fig. 9 Influence of mesh height H on the correlation between E* and
S*. The gray shapes indicate the mesh shape and dimensions. H is
defined as the shortest dimension
Fig. 10 Values of wire diameter Dw required for each block size Db
so that E* is maintained constant. The analysis was performed
starting from Db = 0.65 m with a progressive reduction of the block
size (a), and from Db = 0.25 m with a progressive increase of the
block size (b). For each initial block size, two mesh configurations
were considered (S* = 12.5 and 74.3). Aperture of the mesh is
constant (A = 70 mm)
M. Spadari et al.
123

power-type curve, which can be written, for both values of
S*, as
DwD�3=4b ¼ g ð8Þ
where g is a constant. Since the aperture A is considered
constant in the back analysis, it does not explicitly appear
in Eq. 8; however, its effect can be accounted for in the
constant g. Namely, Eqs. 5 and 8 can be combined to find
g = G*A1/4 and
G� ¼ Dw
D3=4b A1=4
ð9Þ
To fully assess the validity of G* as defined in Eq. 9,
three different mesh apertures A were considered, and the
wire diameter was adjusted to keep G* constant (Table 4).
Simulations were performed with S* = 12.5 and 74.3, as
previously considered, and corresponding values of E*
were computed. The results are shown in Fig. 11, which
also plots the trends determined in Sect. 6.1. The computed
values of E* fall close to the previously established trend
lines, where unique values of G* can now be assigned to
each line. Figure 11 confirms that G*, as defined in Eq. 9,
is an appropriate dimensionless parameter. Namely,
parameters A, Dw, and Db can vary independently, but
only their combination as it appears in G* affects the
relationship between E* and S*.
By qualitative comparison with experiments, the physi-
cal meaning behind G* is also sound. For a given S* (given
strength and stiffness), a higher G* results in higher E*
(higher critical speed). An increase of G* can result not only
from a decrease in block size, which is the origin of the
bullet effect, but also from a decrease of mesh aperture or an
increase of wire diameter. In the later instances, the mesh is
made stronger (more steel per unit area) and the speed of the
block must increase to perforate the mesh.
7 Example of Prediction of the Bullet Effect
The significance of the proposed scaling relationship resides
in its predictive capacity. If test data corresponding to one
point in Fig. 7 are known, then without additional testing, the
performance of a wide range of other barriers can be
immediately estimated using curves similar to those pre-
sented in the figure, regardless of the particular values for the
block size, mesh characteristics, and system stiffness. In this
section, such an approach is tested using numerical data
presented by Cazzani et al. (2002) for a full barrier with
height H = 3 m (see Fig. 12a), square mesh cell (as opposed
to diamond shape before), and spherical blocks. The vari-
ables assumed in the previous study are given in Table 5.
A calibration process is employed to determine stiffness
K for the system analyzed by Cazzani et al. (2002), who
considered the full barrier rather than the simplified
equivalent described in this paper. First, it is recognized
that variables assumed previously with a block size of
Db = 1.3 m yield a value of G* = 0.0098, which is very
close to the value for one of the trend lines from Fig. 7
(Db = 0.55 m; G* = 0.0092). Considering the two values
of G* to be sufficiently close, the objective is then to find
the value of K which causes the parameters E* and S*, as
evaluated from the data of Cazzani et al., to fall on the
trend line from Fig. 7, given by
E� ¼ 920 S�ð Þ�1:65 ð10Þ
In this way, the equivalent stiffness for the full barrier
of Cazzani et al. can be iteratively computed as K =
8.1 kN/m, which corresponds to S* = 1.8.
Upon determining K, the critical velocities for smaller
blocks (diameters of 1, 0.75, 0.5, and 0.3 m) can be
predicted using the trends from Fig. 7 (0.008 B G* B
0.0164), the equations of which are presented in Table 6.
Note that the two smallest blocks used by Cazzani et al.
Table 4 Values of aperture A and wire diameter Dw used for the final
step of validation of G*
Db (m) Dw (mm) A (mm) G*
0.65 3 70 0.008
0.65 2.64 50 0.008
0.65 2.32 30 0.008
0.25 3 70 0.0164
0.25 2.64 50 0.0164
0.25 2.32 30 0.0164
Fig. 11 Correlation between E* and S* for various combinations of
mesh aperture A, wire diameter Dw, and block size Db leading to
G* = 0.008 and 0.0164
The Bullet Effect for Rockfall Barriers
123

(Db = 0.3 and 0.5 m) correspond to G* = 0.2 and 0.295,
respectively, which are out of the initial range obtained in
Fig. 7. To investigate these cases, two other trends were
defined by running more simulations as previously.
The equations presented in Table 6 can be used to
determine E* for each block, and from this value of E*, the
critical speed and the kinetic energy can also be predicted.
As the bullet effect is best seen when expressing the per-
formance of the barrier in terms of kinetic energy, Fig. 12b
compares the values of kinetic energy obtained by Cazzani
et al. (2002) to those predicted by the proposed scaling
relationship.
The predictive capacity of the scaling relationship when
applied to the bullet effect can be clearly seen in Fig. 12b.
The calibration was performed based on the block with
Db = 1.3 m, and hence there is a perfect match. Except
for the block with Db = 1.0 m, which is clearly abnormal,
the values of kinetic energy are predicted relatively well.
In particular, the progressive loss of performance (a
reflection of the bullet effect) is well captured. One might
argue that the increase of kinetic energy from
Db = 1.3–1 m displays a flaw in the proposed scaling
relationship. However, one must bear in mind that the
scaling relationship does not rely on the concept of kinetic
energy, and there is no condition that kinetic energy
cannot increase as the block size is reduced. Also, the
critical speed for the anomalous point has been somewhat
overestimated due to some approximations made during
this prediction exercise, and this projects into the esti-
mation of kinetic energy.
8 Conclusions
The scaling relationship proposed in this paper, alterna-
tively referred to as the RoBaP Model, provides a novel
means for quantifying the capacity of rockfall barriers to
withstand impact from rock blocks. The model is expressed
in terms of three key dimensionless parameters that com-
bine the most important physical variables involved in
barrier impact, including those for block size, barrier
stiffness, mesh geometry, and yield strength of the mesh.
(b)(a)
0.2 0.4 0.6 0.8 1 1.2 1.4
Block Diameter [m]
0
100
200
300
400
500
600
700
Kin
etic
Ene
rgy
[kJ]
Cazzani et al. (2002)
Prediction
Fig. 12 a View of the full barrier used by Cazzani et al. (2002). b Evolution of kinetic energy at failure as function of block diameter: original
numerical data by Cazzani et al. (2002) and prediction using the RoBaP model
Table 5 Variables assumed by Cazzani et al. (2002) and used in the
prediction exercise
H(m)
q(kg/m3)
A(m)
Dw
(mm)
ry
(MPa)
Block
diameter Db (m)
3 2,600 0.2 8 1,500 0.3, 0.5, 0.75, 1.0, 1.3
Table 6 Block diameters used by Cazzani et al. (2002) with corre-
sponding values of G* and roughly applicable trend lines from the
present study
Db (m) from
Cazzani et al.
G* from
Cazzani
et al.
G* from the
present study
Equation of trend line
1 0.0120 0.0116 E� ¼ 2; 663 S�ð Þ�1:67
0.75 0.0148 0.0128 E� ¼ 3; 387 S�ð Þ�1:64
0.5 0.0201 0.02 E� ¼ 6; 747 S�ð Þ�1:50
0.3 0.0295 0.0295 E� ¼ 11; 871 S�ð Þ�1:32
M. Spadari et al.
123

As the basis for the RoBaP Model, it is shown that these
three dimensionless parameters are strongly correlated,
with the correlations established based on results from a
large number of numerical simulations performed using the
finite element code ABAQUS/Explicit. In addition to
providing a concise means for representing barrier perfor-
mance over a range of variables, the RoBaP Model
encapsulates the so-called bullet effect referring to the
reduction in kinetic energy required to perforate a mesh as
the block size decreases. The ability of the model to cap-
ture the bullet effect is demonstrated through an explicit
example from literature where performance of a full
rockfall protection barrier was investigated. In this exam-
ple, the predicted values of kinetic energy are fairly close
to the data presented in the previous study and, most
importantly, the decrease in kinetic energy at failure with
decreasing block size is well captured.
Prior to this study, there was no efficient and practical
tool for the practitioners to estimate the performance of
barriers when impacted by blocks of different size. With
the RoBaP Model, test results for a single block size pro-
vide sufficient information to predict the performance for
other block sizes. Since experiments and numerical simu-
lations are typically performed at great expense in terms of
cost and/or time, this predictive capability of the model is
invaluable.
The RoBaP Model can be represented graphically as a
network of curves relating the so-called performance
parameter (E*), the strength-stiffness parameter (S*), and
the geometrical parameter (G*). The performance param-
eter E* quantifies the impact resistance of a barrier, and it
is not directly related to kinetic energy, but rather to the
critical block speed required to fail the barrier. The
parameter S* characterizes the extent to which a barrier
deforms prior to failure, and G* describes the local
geometry of the mesh in relation to the block size. As
shown in Fig. 11, E* and S* are linearly related on a log–
log scale, and an increase in G* causes an upward shift of
the E*–S* lines on such a plot. Mathematically, the rela-
tionship between E*, S*, and G* is defined by the function
F (see Eq. 6); however, an appropriate form for the full
function F is yet to be determined. Determining F is left for
future study, where additional data including that from
experiments might be utilized to verify the current
numerical trends. Indeed, slight differences can be expec-
ted because of the inherent simplifications of the numerical
modeling (e.g., elastic-perfectly plastic behavior, connec-
tions between elements of the system).
The existence of the bullet effect suggests that no single
value of kinetic energy (design value) can satisfactorily
quantify barrier performance over a range of block sizes.
The dependence of the design value on block size can be
attributed to the presence of both elastic and plastic
mechanisms of energy dissipation. For large blocks, the
kinetic energy is primarily dissipated within deformation
occurring in the barrier as a whole, and for small blocks,
localized plastic failures occur. The results of this study
suggest that kinetic energy as used in barrier performance
criteria should perhaps be abandoned in favor of the critical
speed, so that the analyst is automatically forced to think in
terms of ‘‘performance curves’’ rather than unique design
values. This paper is a first attempt to generate such
dimensionless performance curves.
References
Anderheggen E, Volkwein A, Grassl H (2002) Numerical simulation of
highly flexible rockfall protection systems. In: Proceedings of Fifth
World Congress on Computational Mechanics. Vienna, Austria
Arndt B, Ortiz T, Turner AK (2009) Colorado’s full-scale field testing
of rockfall attenuator systems. Transp Res E-Circular, E-C141.
Transportation Research Board, Colorado
Bertolo P, Oggeri C, Peila D (2009) Full-scale testing of draped nets
for rock fall protection. Can Geotech J 46(3):306–317. doi:
10.1139/T08-126
Buckingham E (1914) On physically similar systems: illustrations of
the use of dimensional analysis. Phys Rev 4:345–376
Buzzi O, Giacomini A, Spadari M, Fityus S (2011) Numerical
modeling of a rock fall mesh perforation upon impact. In:
Proceedings of the 13th International Conference of the
IACMAG 2011. Sydney, Australia, pp 1141–1146
Cantarelli G, Giani GP, Gottardi G, Govoni L (2008) Modelling
rockfall protection fences. In: The first world landslide forum—
Proceedings. ICL, Tokyo, pp 103–108
Cazzani A, Mongiovı L, Frenez T (2002) Dynamic finite element
analysis of interceptive devices for falling rocks. Int J Rock
Mech Min Sci 39(3):303–321. doi:10.1016/s1365-1609(02)
00037-0
De Col R, Cocco (1996) Motivazioni tecniche ed economiche per la
standardizzazione di prove sulle opere paramassi nella Provincia
Autonoma di Trento. In: Giornata di studio su ‘‘La protezione
contro la caduta di massi dai versanti rocciosi’’. GEAM, Torino,
pp 65–72
Descoeudres F, Montani Stoffel S, Boll A, Gerber W, Labiouse V
(1999) Rockfalls. In: Coping study on disaster resilient infra-
structure. IDNDR, Zurich, pp 37–47
Duffy JD, Smith DD (1990) Field tests and evaluation of rockfall
restraining nets. No. CA/TL-90/05, Final Report. California
Dept. of Transportation, San Luis Obispo
EOTA (2008) Guideline for European technical approval of falling
rock protection kits (ETAG 027). Brussels
Gerber W (2001) Guideline for the approval of rockfall protection
kits. Swiss Agency for the Environment, Forests and Landscape
(SAEFL), Swiss Federal Research Institute, Berne
Giani GP (1992) Rock slope stability analysis. Balkema, Rotterdam
Grassl H, Volkwein A, Anderheggen E, Ammann WJ (2002) Steel-net
rockfall protection—experimental and numerical simulation. In:
Seventh International Conference on Structures Under Shock
and Impact. Montreal, Canada, pp 143–153
Hearn G, Barrett RK, Henson HH (1995) Testing and modeling of
two rockfall barriers. In: Transportation research record, vol.
1504. National Research Council, Washington, pp 1–11
Johnson W (1972) Impact strength of materials. Edward Arnold,
London
The Bullet Effect for Rockfall Barriers
123

Langhaar HL (1951) Dimensional analysis and theory of models.
Wiley, New York
Li QM, Jones N (2000) On dimensionless numbers for dynamic
plastic response of structural members. Arch Appl Mech
70(4):245–254
Peila D, Oggeri C (2005) Barriere paramassi a rete - Tecnologia e
criteri pregettuali. GEAM, Torino
Peila D, Pelizza S, Sassudelli F (1998) Evaluation of behaviour of
rockfall restraining nets by full scale tests. Rock Mech Rock Eng
31(1):1–24
Volkwein A (2005) Numerical Simulation of flexible rockfall
protection systems. In: Proceedings of Computing in Civil
Engineering. ASCE, Cancun
Volkwein A, Melis L, Haller B, Pfeifer R (2005) Protection from
landslides and high speed rockfall events—reconstruction of
Chapman’s Peak Drive. In: IABSE Symposium Lisbon 2005.
Structures and extrem events. IABSE Reports vol. 90, incl. CD:
8 p
M. Spadari et al.
123


![Prediction of the Bullet Effect for Rockfall Barriers: a ... · characterize the performance of a barrier in terms of the (a) (b) 0.2 0.4 0.6 0.8 1 1.2 1.4 Block Diameter [m] 0 100](https://static.fdocuments.net/doc/165x107/5f9c74c98dd9345fc005f9a6/prediction-of-the-bullet-effect-for-rockfall-barriers-a-characterize-the-performance.jpg)


