
Prediction of remaining useful lifetime of industrial ... · 06/02/2014 · •Learning a...
12
Prediction of remaining useful lifetime of industrial machinery Beau Piccart, Wannes Meert DTAI RESEARCH GROUP -expert knowledge inspired feature generation -forecasting of vibration signals for early fault detection Prediction of remaining useful lifetime of industrial machinery • Use case description • The Data • Volume vs Quality • Pre-processing • Peaks analyses • Low-pass filtering • Trend separation • SAX representation • Feature generation • Handling large datasets: HDF5 • Learning a predictive model (Machine Learning) • Evaluation
Transcript of Prediction of remaining useful lifetime of industrial ... · 06/02/2014 · •Learning a...

Prediction of remaining useful lifetime of industrial machinery
Beau Piccart, Wannes Meert
DTAI RESEARCH GROUP
-expert knowledge inspired feature generation -forecasting of vibration signals for early fault detection
Prediction of remaining useful lifetime of industrial machinery
• Use case description • The Data
• Volume vs Quality • Pre-processing
• Peaks analyses • Low-pass filtering • Trend separation • SAX representation • Feature generation
• Handling large datasets: HDF5 • Learning a predictive model (Machine Learning) • Evaluation

DTAI RESEARCH GROUP
Predicting future vibration of a centrifuge
• Normal wear and dirt build-up cause the machine to vibrate
• Slow process • Our goal: predict the future long-term evolution
of vibration levels • Not: model process parameters dependency
• Data driven approach • Model machine degradation
Predict when this machine will need maintenance
The Data
DTAI RESEARCH GROUP
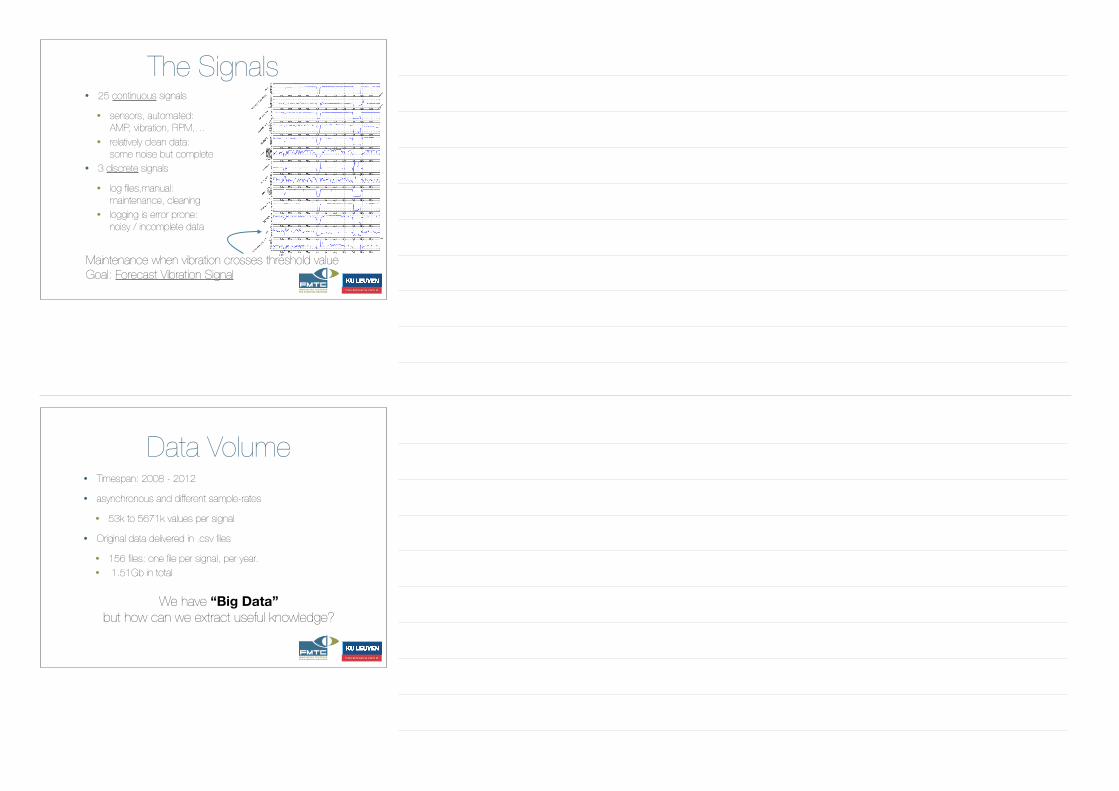
The Signals• 25 continuous signals
• sensors, automated:AMP, vibration, RPM,… • relatively clean data:some noise but complete
• 3 discrete signals
• log files,manual:maintenance, cleaning • logging is error prone:noisy / incomplete data
Maintenance when vibration crosses threshold value Goal: Forecast Vibration Signal
DTAI RESEARCH GROUP
Data Volume• Timespan: 2008 - 2012
• asynchronous and different sample-rates
• 53k to 5671k values per signal
• Original data delivered in .csv files
• 156 files: one file per signal, per year. • 1.51Gb in total
We have “Big Data” but how can we extract useful knowledge?

DTAI RESEARCH GROUP
Data Quality• Volume does not equal quality
• event logs are very noisy and incomplete • timestamps are imprecise, not always recorded, start
and stop is logged and can cover a huge timeframe (months), unclear event labelling (bullet this)
• Continuous signal are not synced, different sample rates, contain spikes of unknown origin
Data requires pre-processing in order to extract useful information
DTAI RESEARCH GROUP
Data Quality Analysis
23: Vibration signal• Lots of redundant information • Vibration is slightly correlated
(~0.5) with the other signals
Correlation MatrixHigh positive correlation
No correlation
High negative correlation

Data Pre-processing
DTAI RESEARCH GROUP
Peaks Analyses
From
To0
0 20
20
After a peak, the signal drops again immediately
Bi-gram: visual representation of transition probabilities
VIB

DTAI RESEARCH GROUP
Peak filtering• We are only interested in the long term trend
• Peaks reduce model accuracy
• Not part of the trend, irrelevant
• introduce noise in model
• Remove peaks using a low-pass filter
Expert knowledge
DTAI RESEARCH GROUP
Additional Peak features• We filter peaks out
• long term vibration trend remains • vibration is a manifestation of slowly evolving degradation process
• There might still be some information in the peaks:
• e.g. degradation causes more peaks • Add feature: % of peaks over a time interval (1 day) • Add feature: Variation of the signal over a time interval
VIB VIB
Expert knowledge

DTAI RESEARCH GROUP
Signal synchronisation and representation
• Signals are out of sync and have different sample rates • Necessary to resample the signal
• High sample-rate causes huge feature vectors • high input dimensionality, noisy values, overfitting
• under-sample, smooth the signal • Signals lie in different ranges:
• RPM [0-500], Vibration [0-10] • map values to same domain (SAX)
DTAI RESEARCH GROUP
0 1 2 3 4 5 6 7 8 9 10 11 12 13 14 15 16 17 18 19 20
0
1
2
3
4
5
6
7
8
9
10
Time
Vib
rati
on
Distribution of the data
Original signalPiecewise Aggregate Approximation
A
B
C
Symbolic Aggregate approXimation
a
b
a
a a
b bb b
c
Symbolic Aggregate approximation: SAX

DTAI RESEARCH GROUP
Event logs• Cleaning, washes, ... events are logged
• →derive time signals: e.g. time since last cleaning
DTAI RESEARCH GROUP
Rotations since cleaning
Total rotations since cleaning
washescatalyst
DTAI RESEARCH GROUP
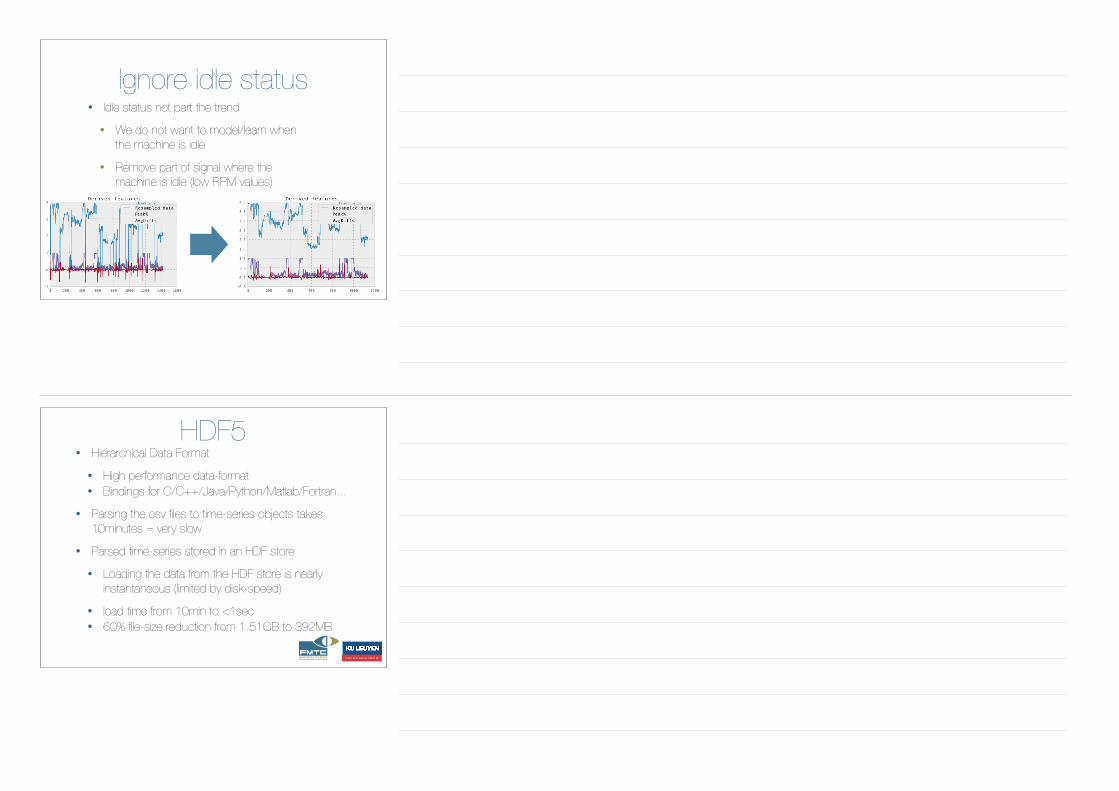
Ignore idle status• Idle status not part the trend
• We do not want to model/learn when the machine is idle
• Remove part of signal where the machine is idle (low RPM values)
DTAI RESEARCH GROUP
HDF5• Hierarchical Data Format
• High performance data-format • Bindings for C/C++/Java/Python/Matlab/Fortran...
• Parsing the csv files to time-series objects takes 10minutes = very slow
• Parsed time-series stored in an HDF store • Loading the data from the HDF store is nearly
instantaneous (limited by disk-speed) • load time from 10min to <1sec • 60% file-size reduction from 1.51GB to 392MB

Predictive Modelling
DTAI RESEARCH GROUP
Learning Task• Input: Variables of the SAX signals with history of 5
days • Output: Predicted vibration in 10 days • Model: Random Forest
• Can deal with multiple input streams • Can deal with continuous variables • Easy to implement in production • Robust against non-informative features
(automatic feature selection)

DTAI RESEARCH GROUP
Predicting VIB
First time VIB goes up to 5
• Training data on top, test at the bottom
• Predictions are made 14 days ahead
• Model works well as long as there’s no IID violation
• Independent and Identical Distribution
• Solution: update model with new data
DTAI RESEARCH GROUP
Gini importance:!SOI L-0.......................: 0.195311104193!Rotations since cleaning......: 0.112010866806!/AMP..........................: 0.0917042876089!/timeSincePreviousWash........: 0.0811065546714!Steps since /washes...........: 0.0596259232877!Time running..................: 0.0470618151919!/timeSinceLastCleaning........: 0.0423450348312!/BASEOUTPC....................: 0.0388930896939!Steps since /cleaning.........: 0.0359048247202!/SEALWATPI2...................: 0.0280585396855!/BEARING1FI...................: 0.0249685671137!/Analyzer_LLO_POD2............: 0.0193464457647!PeakFreqs.....................: 0.0177356417956!/Analyzer_Rec_Base_Tank.......: 0.015400923304!VIB var.......................: 0.0146786275824!/Analyzer_LLO_POD1............: 0.0135271504859!/SEALWATPI1...................: 0.0131637545405!/Valve_opening_HLO............: 0.0117474195951!/RPM..........................: 0.010464099647!/BEARZTI......................: 0.0101808053236!
Feature importances
gene
rate
d fea
ture
s ar
e am
ong
the
mos
t impo
rtant
!

DTAI RESEARCH GROUP
Predicting VIB: future steps
Steps in future
R2
Perfect prediction
Random prediction
DTAI RESEARCH GROUP
Conclusions• Lots of data doesn’t equal good data • Preprocessing is important • Expert knowledge helps design informative features • We can’t model what we haven’t seen before
• Models need to be updated regularly


