
PrediCtion of Pressures on an Advanced Propeller at an Angle … · · 2014-10-04Pressures on an...
28
Jr L NASA Technical Memoiandum 102374 AIAA±89-1060 . = ........... PrediCtion of Unsteady Blade SurfaCe _ -- ,D= __ . Pressures on an Advanced Propeller at an Angle of Attack M. Nallasamy Sverdrup Technology, Inc. NASA Lewis Research Center Group Cleveland, Ohio and J.F. Groeneweg National Aeronautics and Space Administration Lewis Research Center Cleveland, Ohio ...... November 1989 .......... (NASA-TM-IOZ374) PREOICTION OF UNSTEADY BLAUE SURFACE PRESSURFS ON AN ADVANCED p_O_ELLER AT AN ANGLE OF ATTACK (NASA) CSCL 28 p OlA G3102 N90-12560 Unclas 0243262 https://ntrs.nasa.gov/search.jsp?R=19900003244 2018-06-04T16:09:26+00:00Z
Transcript of PrediCtion of Pressures on an Advanced Propeller at an Angle … · · 2014-10-04Pressures on an...

Jr L
NASA Technical Memoiandum 102374
AIAA±89-1060
. =
........... PrediCtion of Unsteady Blade SurfaCe _-- ,D= __ .
Pressures on an Advanced Propeller
at an Angle of Attack
M. Nallasamy
Sverdrup Technology, Inc.
NASA Lewis Research Center Group
Cleveland, Ohio
and
J.F. Groeneweg
National Aeronautics and Space Administration
Lewis Research Center
Cleveland, Ohio ......
November 1989 ..........
(NASA-TM-IOZ374) PREOICTION OF UNSTEADY
BLAUE SURFACE PRESSURFS ON AN ADVANCED
p_O_ELLER AT AN ANGLE OF ATTACK (NASA)CSCL
28 pOlA
G3102
N90-12560
Unclas0243262
https://ntrs.nasa.gov/search.jsp?R=19900003244 2018-06-04T16:09:26+00:00Z

CO0
LO

Aerodynamic tests of the 9-ft diameter, single rotatlon SR7L NASA/Hamllton
standard design were run In the ONERA SI-MA wlnd tunnel in Modane, France.
B|ade surface steady and unsteady pressures were measured during early 1987 on
a two blade conflguratlon. I-3 (The complete elght blade propeller was not
tested due to drlve power IIm|tatlons.) The propfan test assessment flight
program (1987-1988) was managed by Lockheed Aeronautical Systems Company under
a contract to the NASA Lewis Research Center. The 9-ft propfan was flight
tested on a modified, instrumented Gulfstream GII business jet (Fig. l). The
objectives of the PTA program were to evaluate the propfan structural
integrity, source noise, cabin noise, flyover noise and enroute noise. Thus,
an extensive data base has been established for the development and valldatlon
of propfan aerodynamic and acoustic analyses.
In the PTA flight test program, the propfan propulsion system was mounted
on the left wlng of the modified GII aircraft. Thi_ location was chosen to
avoid flow field Interference wlth the maln propulsion Gulfstream engines and
to permit systematlc investigation of the propfan characterlstlcs. 4 A nacelle
tilt arrangement was employed to vary the Inflow angle to the propfan. The
variations In Inflow conditions were used to evaluate the effects on cyclic
stress of the propfan over a wide range of operating conditions. The inflow
condltlons also play an Important role In the generation of noise. The three
nacelle tilt angles of the test were -3 °, -l ° (tilt down) and +2 ° (tilt up).
The average inflow angle is dependent on the alrplane angle of attack, propfan
upwash angle and nacelle tilt. The complete nacelle tilt variation of 5° (-3 °
to +2°) provided an Inflow angle variation of 50. 5
Acoustic and performance data were acquired over a wide range of
operating conditions. The test points were specifically chosen to determlne
the near field noise characteristics as a function of flight Mach number,
altitude, propfan tlp speed, power and inflow angle.
2
The near fleld acoustic data for the basellne deslgn-polnt crulse
(M = 0.8) case of -I ° nacelle tilt have been analyzed In detail. 5 The
acoustic data measuredon a wlng boomoutboard of the propfan show that the
flrst f|ve harmonics have maximumsound pressure levels (SPL's) in the plane
of the propfan. The SPL's decrease in level with Increase In harmonic order
and all have slmilar directional characteristics. The sound pressure levels
were also predicted using Hanson's frequency domaln propeller noise radlatlon
theory. 6 The predictions show that the SPL levels are maximum at 0.25
diameter aft of the propeller plane. The levels are overpredicted by about 3
dB.
The effects of nacelle tilt on the fuselage and wing boom SPL's were
studied both at the cruise and takeoff conditions. Increasing nacelle tilt
resulted In significant reductions in SPL at the fuselage for a11 tip speeds.
At the wlng boom, the SPL's were found to increase wlth Increase In tilt
angle. On the average an acoustic sensitivity of about l dB/degree of nacelle
tilt was observed. Predictions of the SPL's for the nacelle tilt test cases
were also done by Hamilton Standard; however, the predicted fuselage and wing
boom SPL's showed very little sensitivity to nacelle tilt angle.
Predlctlon of the effect of inflow angle on the sound pressure levels
requires accurate computation or measurement of the unsteady blade surface
pressures. The linear analytical methods for computing the unsteady blade
loading may not predict the loading accurately enough at higher inflow angles
due to nonllnear processes Involved. In the present paper, the unsteady blade
pressures are computed by numerically solvlng the three-dlmenslonal unsteady
Euler equations. The only published three-dimenslonal unsteady Euler solution
for the propeller at angle of attack Is that of Witfield et al. 7 The emphasls
In that work was on validation of the solution algorithm for different
conflguratlons. The present paper provides, for the first tlme, detailed
3

unsteady Euler solutions of the propeller at an angle of attack. The angle of
attack induced unsteadiness Is Illustrated in the form of chordwlse, spanwlse
and azimuthal pressure distributions.
SOLUTIONOF THEUNSTEADYEULEREQUATIONS
The unsteady three-dlmenslonal Euler equations governing the |nvlscld
flow through a propeller are solved using the solution procedure developed by
Whitfleld.7, 8 (The details may be found In the references cited. Here only a
brief mention of the technique will be made.) The equations in conservatlve
differential form are transformed from a Cartesian reference frame to a time
dependent body fitted curvillnear reference frame.
are dlscretlzed employing a finite volume technique.
solver is used for block Interface flux definitions.
The transformed equations
An approximate Riemann
A Lower-Upper (LU)
implicit numerlca] scheme which possesses apparent unconditional stability is
used to solve the dlscretlzed equations. The flow fleld is represented by
multlblock composite grids to overcome computer core memory limitations. The
solutlon at each tlme step Is updatedby having only one block in memory while
the other blocks are stored in solid-state storage devices (SSD).
THE FLOW CONFIGURATION AND COMPUTATIONAL GRID
The conf|guratlon considered here is the eight blade 9-ft diameter SR7L
propeller (Fig. l), of the PTA program. The inflow angle chosen for the
present computations is 4.6 ° (corresponding to nacelle tilt of +2° in the PTA
program). The direction of rotation of the propeller and the reference for
the coordinates are shown on the side of the figure.
Each blade passage is discretlzed employing a 71 by 33 by II grid, in the
axial, radial and circumferential directions, respectively. Each passage grid
is divided into two blocks for computational convenience as mentioned before.
Thus, 16 blocks of grids are employed to describe the entire propeller flow
4

fleld with 206,184 nodal polnts. Each blade surface has 35 by 21 (chordwlse
by spanwise) grid points with higher resolution near the leading and tralling
edges. The solution presented here is for the cruise condltlo_1, Machnumber=
0.801 and advance ratio 3.122, with an Inflow angle of 4.6 °.
RESULTS AND DISCUSSION
The unsteady three-dlmenslonal Euler equatlons have been solved (from an
impulse start) for three complete revolutions of the propeller to get a
reasonably accurate soIutlon. The results of the third cycle are Fairly
stabillzed as can be seen from Fig. 2. The Figure shows the varlatlon of the
total power coefficient with azimuth angle. The total power coefficient
becomes nearly constant during the entire third revolution of the propeller.
The results of this cycle are analyzed further and presented. The predicted
total power is about 8 percent higher than the measured value. No chordwlse
pressure measurements are available for a direct comparlson of the
predictions. However, the predlctlons of unsteady surface pressures employing
the present solution technique were compared with data For SR3 eight bladed
model propeller In Ref. ? (Fig. 5). The comparisons were done at blade choFd
1ocatlon x/c = 0.1 and 0.5 at blade span 1ocatlons 0.?5 and 0.88 radius for
an inflow angle of 4° at Mach numbers 0.6 and 0.8. At the axial station
x/c = 0.5 the agreement of the predictions with measurements were very good on
both suction and pressure surfaces at Mach numbers 0.6 and 0.8. At the axial
location x/c = O.l, predicted surface pressures showed reasonable agreement
with data For M = 0.6 on both, suction and pressure surfaces. At the higher
Mach number, 0.8, the pressure side was in reasonable agreement with the
experiment but the suction side was not. The dlscrepancy was attributed to
the coarse grid near the leading edge For the rapldly expanding Flow on the
suction surface at this Mach number. In ReF. ?, 21 (axlal) by 12 (radial)

grld points on the blade were employed. H1th 35 (axial) by 21 (radial) grld
points on the blade surface and higher resolution near the leading and
trailing edges, employed in the present study a higher accuracy of the
predictions Is expected. The grid slze and distribution were arrlved at
during the comparison study of steady Euler solutlons with measurements for
the SRTL two bladed conflguratlons over a range of Mach numbers. 9
Figure 3(a) shows the varlatlon of the slngle blade power coefficient
with azimuth angle For two blades, one starting From ¢ - 0 (or @s = O)
position and other starting from @ = _ (or @s = _)" The expected slnusoldal
varlat|on of the loading due to angle of attack (_ = 4.6 °) Is clearly
exhlblted. However, the variation of power during a cycle Is slgnlflcantly
higher than one might expect. For the case of 4.6 ° inflow angle, the power
coefficient per blade varies +81 percent during a cycle. A careful look at
the plot reveals addltlonal detalls: the loading Is not exactly slnusoldal;
the 1oadlng Is not minimum at ¢ - 0 and the maximum in not at @ , _ as
orlglnally believed. The rising portion of the wave lasts for about 9/8
while the falllng portion of the wave last about 7/8 _. For the blade
starting at ¢ . O, the minimum loading occurs at _/8 and the maximum loading
occurs at about (_/8 +9/8 _ = 5/4 _) or 225 °. These points have to be borne
In mlnd during the analysls of the results.
A Fourier transform on the third cycle loading gives the blade power
coefficient Cp as Cp = 0.238 - 0.1987 cos wt - O.0511 sin wt. The 1oad_ng
spectrum shown In Fig. 3(b) Indicates that the first harmonlc domlnates the
loading. The oscillatlng part of the Cp lags behind the motion of the blade
by 14.4° .
The reduced frequency, which is a measure of the unsteadiness of the Flow
is defined as, k = wc/2U=, where c Is the blade chord length, w is the

blade rotational frequency and U® Is the Free stream velocity. The reduced
frequency for the present calculations Is k = 0.088, based on the chord
length at 75 percent radius.
For comparison purposes a steady state solution was obtalned for the same
advance ratio (3.122) and Mach number (0.801) but wlth zero angle of attack.
The steady blade surface pressure distributions are shown In Flg. 4. The
figure shows chordwlse pressure dlstributlons at eight spanwlse locations.
The unsteady blade surface pressure distributions presented in the succeeding
figures w11l be at one or more of these spanwlse locations. Thus, a direct
comparlson of the steady and unsteady pressure distributions can be made.
The detailed azimuthal variations of the chordwlse loading and blade
surface pressure distributions are illustrated In Figs. 5 to lO for three
radial stations namely, r/R = 0.36, 0.66 and 0.96. Figure 5 presents the
chordwlse loading variations as a function of azimuth angle, at the radial
station r/R = 0.36. At thls radial station, the blade Is negatively loaded
for the front half (0 to 50 percent) of the cord length for about 3/8 of a
revolution (¢ , 0°, 45 °, 90°) and the loading Is maximum at ¢ = 225 ° Thus,
the chordwlse loading undergoes a cyclic variation of substantlal amplitude.
The shape of the loadlng curve also changes enormously during the cycle. The
reasons for thls change become apparent from the actual blade surface
pressures shown In Fig. 6 for the same radial azimuthal locations. The
trailing edge shock appears on the suction surface during half the cycle
(@ = 135° to 270 °) while the shock appears on (or extends to) the pressure
surface for @ = 135° to 225 ° . The dramatic changes in the loading pattern
are clearly illustrated in this figure.
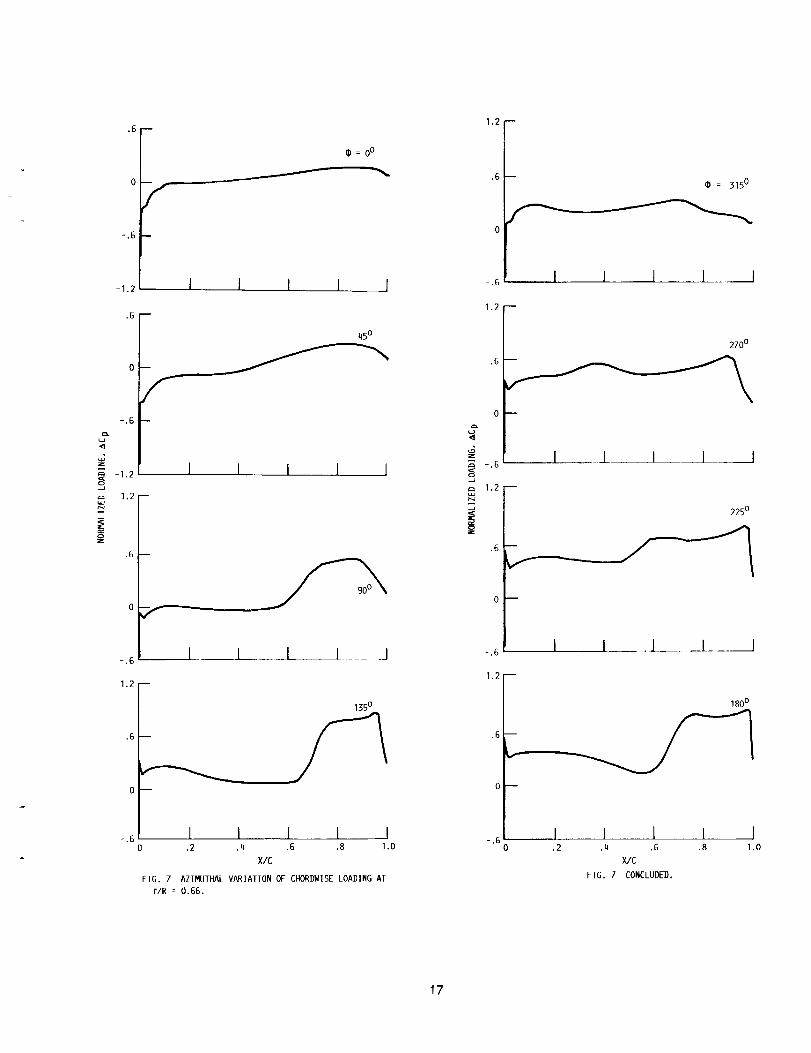
Figure 7 shows the azimuthal variation of chordwise loading distribution
at r/R = 0.66. The part of the revolution durlng which significant negative
7

1oadlng exists, is reduced for this radial station. A continuous change of
the space of the 1oadlng curve occurs over the revolution. The second half
(50 to lO0 percent chord) of the blade is highly loaded from ¢ - 90° to
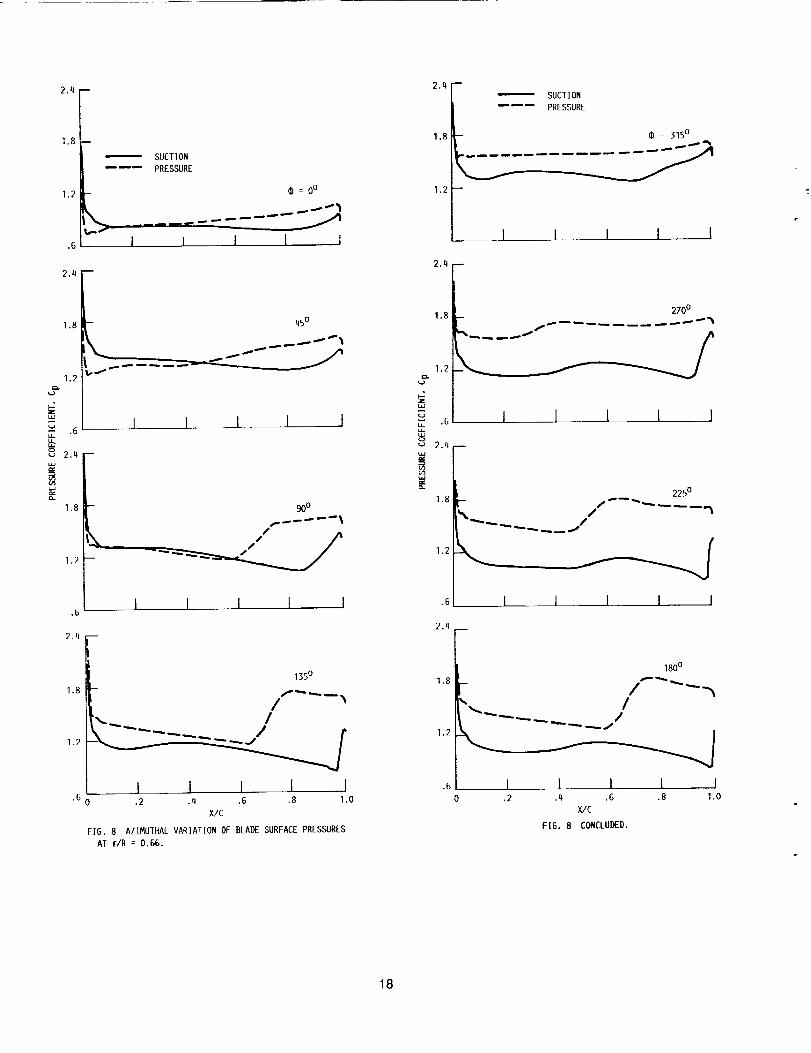
225 ° The blade surface pressures shown In Fig. 8 indicate the appearance of
the trailing edge shock for @ = 90° to 270 ° and a pressure jump on the
pressure slde occurs only for @ , 90° to 225 °, Thus, for the two radial
stations (0.36 and 0.66), the shocks appear only during parts of the cycle.
It Is also interesting to note that the shock on the pressure surface moves
upstream as we go from @ = 90° to 225 °.
The periodic motion of shock waves on oscillating airfoils In transonic
flow have been extensively studled and documented, lO Three types of shock
motion have been Identified; (1) Slnusoldal shock-wave motion (type A): The
shock-wave moves almost slnusoldally and exists during the complete cycle.
(2) Interrupted shock-wave motion (type B): This motion Is llke type A but
the shock disappears during part of a cycle and (3) Upstream propagated
shock-wave (type c): At slightly super crltical Mach Numbers, periodically a
shock-wave is formed on the upper surface of the airfoil and moves upstream
wh_le Increaslng in strength. No such detailed experimental study exists for
the three-dlmenslonal transonic Flows of the type considered in thls paper.
But, the results presented In Figs. 6 and 8 suggest that shock motions similar
to type B and type C occur In the unsteady three-dimensional transonlc Flows.
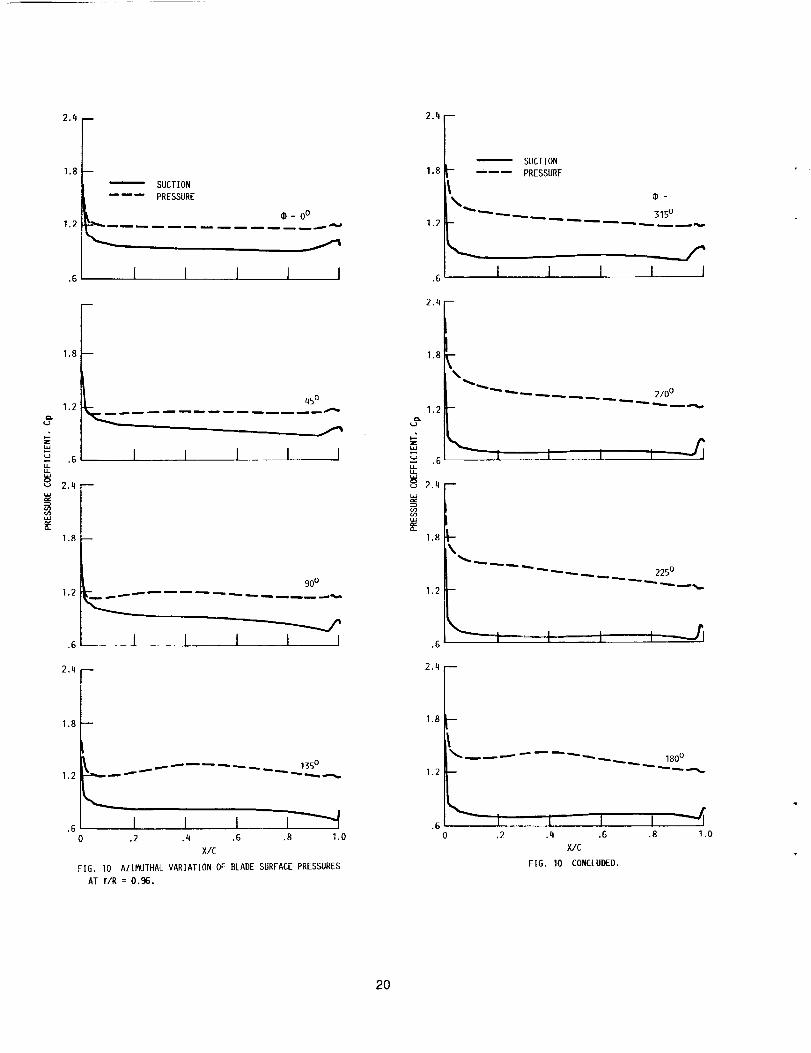
The azimuthal variation of chordwIse loading at the radial station
r/R - 0.96 is shown In Flg. 9. At this radial station, the changes in the
shape of the 1oadlng curve are marglnal, compared to those at r/R = 0.36 and
0.66. However, the location of the maximum loading moves From a point close
to the trailing edge to a point near the leading edge as we go From ¢ = 45° to
¢ = 315 °. The blade surface pressure variations shown in Fig. lO, indicate
that the shocks have diffused before they reached this radial station. It Is
interesting to note that the tip region is significantly loaded through the
complete revolution of the blade.
Figures II to 14 show the radial variation of the chordwlse pressure
distribution for four azimuthal angles, ¢ = 0°, 90°, 180° and 270 °
respectively. The radial variations of the chordwlse loading distribution at
¢ - 0° are shown in Flg. If. At thls azlmuthal location the blade Is very
lightly loaded throughout the span. A small negative loading exists almost up
to r/R = 0.80, which is due to the low local flow Incldence angle produced by
the angle of attack of the propeller. Figure 12 shows the radial variations
of the chordwlse pressure distributions at @ = 90°. At this azimuthal
location, shocks exist both on the suction and pressure surfaces from the hub
region to almost 90 percent span. Up to 80 percent span the loading is
primarily on the rearward half (50 to lO0 percent chord) of the blade.
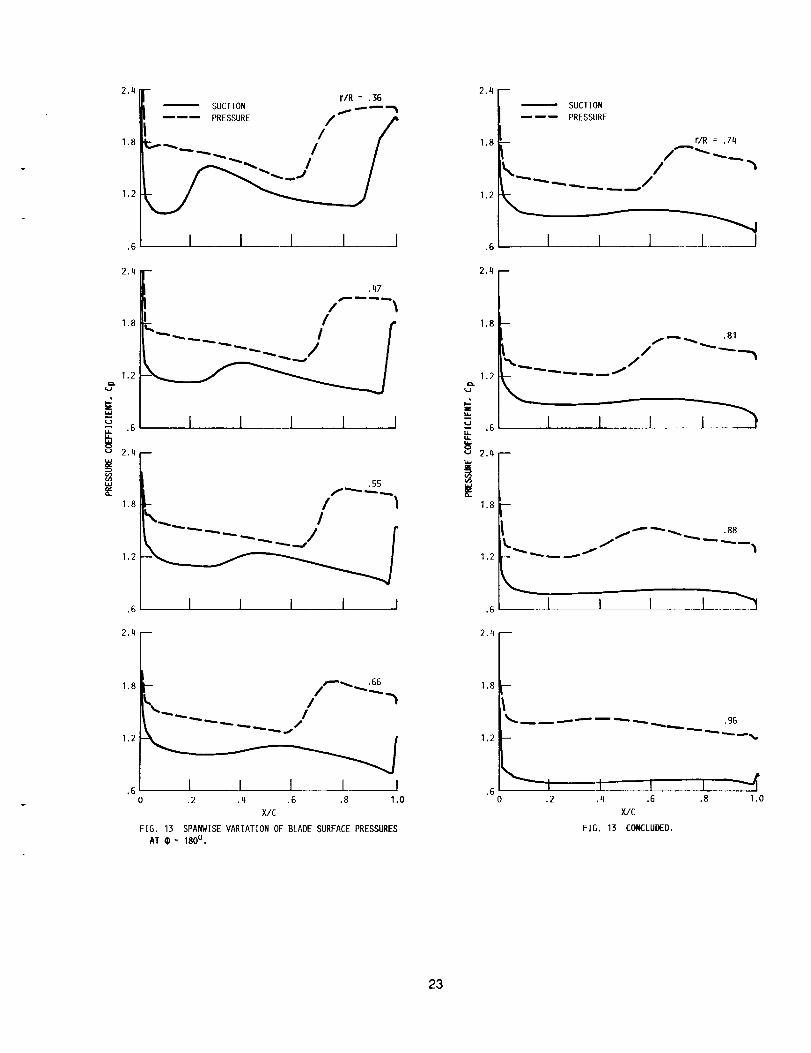
The spanwlse variation of the loading at ¢ = 180 ° Is shown In Fig. 13.
At this location the blade loading experiences a near maximum. At this
azimuthal location also, shocks appear on both suction and pressure surfaces
From the hub reglon. However, on the suction surface the trailing edge shock
Is diffused beyond about 62 percent span. The shock on the pressure surface
persists to 80 percent span, as for the @ = 90 ° position. Figure 14 shows
the spanwise variations of the loading for ¢ = 270 ° . At thls location no
shock exists on the pressure side of the blade. On the suction surface, a
shock appears at about 70 percent chord at the radial station near the hub,
r/R = 0.36. Nith increasing spanwlse distance, the shock moves toward the
trailing edge. The Four Figures (Figs. 11 to 14) demonstrate that the blade
loading changes significantly in the chordwlse, radial and azimuthal
directions durlng a revoIutlon, due to the angular inflow to the propeller.
9

The variations of the elemental power coefficient (dCp/dx) for the four
azimuthal locations (¢ : 0°, 90°, 180° and 270°) are shownIn Fig. 15. The
general shape of the curve Is the same as that obtained for a steady flow.
The magnitude of dCp/dx at any radial distance (x = r/R) depends on the
azimuthal location. Also shown In the figure is the curve for the steady flow
(a = O) solution. It is seen that the magnitude of the cyclic varlations of
loading depends on the spanwlse location.
The azimuthal variations of blade pressure coefficient at specified
points along the chord at the radial station r/R = 0.66 are shown In Fig. 16.
It can be seen that the response at the Individual points X/C : 0.036, 0.125,
0.53, 0.63 and 0.84 Is not exactly slnusoldal. The extent of the deviation
from the slnusoid depends on the chordwlse location and the surface (suction
or pressure surface) on which the point Is located. The departure from the
slnusoidal behavior may be due to the high inflow angle, and the presence of
shock waves. It should also be noted that the instantaneous pressure
coefficients are plotted In this figure rather than the fluctuations about the
mean value of the pressure.
CONCLUDING REMARKS
A numerical solution of the unsteady three-dlmenslonal Euler equatlons
has been obtained for the flow through a propeller at an angle of attack to
the mean flow. The results show the highly nonlinear nature of the loading
variations during a revolution. For parts of the revolution the blade is very
lightly loaded, while for other parts it is highly loaded with shocks
appearlng on both surfaces of the blade. The sound pressure levels, the
directivity and the azimuthal variation will be studied next employing the
unsteady blade pressure distribution obtained here.
lO
ACKNOWLEDGEMENTS
The authors wlsh to acknowledge the manyhelpful dlscusslons with
Dr. D. Hoyniak and Messrs. M. Janus, D. Huff and B. Clark during this research.
The work of the first author (MN) was supported under contract NAS3-25266
with the NASALewis Research Center.
REFERENCES
I. Bushnell, P. "Measurementof the Steady Surface Pressure Distribution of a
Slngle Rotation Large Scale AdvancedPropfan Blade at Math Numbersfrom
0.03 to 0.78," NASACR-182124,July 1988.
2. Bushne11, PL, Gnuber, M. and Parzych, D., "Measurementof Unsteady Blade
Surface Pressures on a S|ngle Rotation Large Scale AdvancedPropfan with
Angular and WakeInflow at MachNumbersfrom 0.02 to 0.70, NASACR-182123,
October 1988.
3. Cambell, W.A. Walnauskl, H.S. and Bushnell, P.R., "A Report on High Speed
Wind Tunnel Tests of the Large Scale AdvancedPropfan," AIAA-88-2802, July
1988.
4. Poland, D.T., Bartel, H.M. and Brown, P.C., "PTAF11ght Test Overview,"
AIAA-88-2803, July 1988.
5. LockheedAeronautical SystemsCompany,"Propfan Test Assessment: Flight
Test Results Review, "NASALewis ResearchCenter, November14, 1988.
6. Hanson, D.B., "Near-Field Frequency DomainTheory for Propeller Noise,"
AIAA Journal, VoI 23, 1985, pp. 499-504.
7. Whitfleld, D.L., Swafford, T.W., Janus, J.M., Mulac, R.A. and Belk, D.M.,
"Three Dlmensiona] Unsteady Euler Solutions for Propfans and Counter
Rotatlng Propfans," AIAA-87-1197, June 1987.
8. Janus, J.M. and Whitfield, D.L., "A Simple Time Accurate Turbomachinery
Algorithm with Numerica] Solutions of Uneven Blade Count Configuration,"
AIAA-88-0206, January 1989.
11

9. Nallasamy, M., Yamamotto, 0., Narsi, S. and Bober, L.J., "Large Scale
Advanced Propeller Blade Pressure Distributions: Prediction and Data",
AIAA-89-2696, accepted for publication in the Journal of Propulsion and
Power.
lO. Tijdeman, H. and Seebass, R., "Transonic Flow Past Oscillating Airfoils,"
Annual Review of Fluid Mechanics, Vol, 12, 1980, pp. 181-222.
iLOOKING "_
DOWNSTREAM *BLADE ROTATION SIDE VIEW
FIG. I SR7L PROPELLER INSTALLED ON THE TESTBED AIRCRAFT.
ORIGINAL PAGE
BLAC.K AND WHITE PHOTOGRAPH
12

2,5 B
2.0
]i
,=,= 1.5
.5--
1 I I I I I200 400 600 800 1000 1200
AZIMUTH ANGLE
FIG. 2 TOTAL POWER COEFFICIENT VARIATION WIIH AZIMUTH
ANGLE.
• 500
,375
_= ,25o
,125
1,0
0,1
.01
.001
_S
0 0
Imml )T
:,f ,', A-',' !,i \i
II/I
Y200 400 600
",,,A/
800 1000
\
n
AZIMUTH ANGLE
(a) POWER PER BLADE VARIATION WITH AZIMUTH ANGLE.
3
HARMONICS
(b) LOADING SPECTRUM.
FIG. 3
I14
I1200
13

14

.G--
-.6
-I .2
0 = 00
I I
.6--
450
0
-.6
-1.2
0
-,6 --
-,.2' I I I ._ I I
+'I1.2
• 6 /_ 35°
0 .2 .4 .6 ,8 1,0X/C
FIG. 5 AZIMUTHAL VARIATION OF CHORDWISELOADING AT
r/R = 0.36.
.6
÷
v_
i+
-1,2
0 : 3150
I I I I -J
1't1.2
0
_,8
"1.2 -- 225°
0
180o
.2 ,4 ,6 .8 I.o
x/c
FIG. 5 CONCLUDED.
15

3.2
1.2
.6
SUCTION
_ PRESSURE
00
II
I
3,2 --SUCTION
_ PRESSURE
2,q -- 315°
1.8 _
1.2
I 1 I I I .6 I I I 1 |
3.2 3.2
,,27002.4 2.4
1.8 1.8
1.2 i t,2
_ .G .6_ 3.2
3.2
_ 2.42.4 _-
1.8
1.2
.6
3.2
2.4
1.8
1.2
90 o
18,/
1.2
.60
I I l I I .6 ----
M
1350
- ,/
1 1 I I ,I.2 .h .G .8 1.0
X/C
FIG. 6 AZIMUTHAL VARIATION OF BLADE SURFACE
PRESSURES AT r/R = O.36.
-- 225 °
1..... l .... J ..... I I
3.2
2.q
1.8
1.2
.60
t 180o
f ,.....-- ,--._
/ f
I I I 1 I.2 .q .6 .8 1.0
X/C
FIG. 6 CONCLUDED.
16
-.6
-1.2
.6
-.6
-1.2
1.2r.,
.6 --
.6
-.6
1.2
.6
-,6
_) = 00
f
I I I 1 I
450
I I I I I
I I I i J
F0 .2 ,4 .6 ,8 1.0
x/c
FIG. 7 AZIMUTHAL VARIATION OF CHORDWISE LOADING AT
r/R = 0.66.
1.2
.6
-.6
1.2
.6
0
o_ -.6
1.2
N
.6
-.6
1.2
= 3150
I I ] I I
2700
2250
-.6
I I I 1
1800
I I I I I.2 .4 .6 .8 1.0
X/C
FIG. 7 CONCLUDED,
17
2°4
[,8
1.2
.6
2,4
SUCTIONm _ PRESSURE
= 0o
I I I I I
1,8
2,4
DII
1.2
2,LI --
SUCTION
PRESSURE
= Mso
I I 1 I
L_J
I t I _L_J _ .6 I 1 I • I IN
1.8 90o 1.8 - _ 225°
.6 • - I I I I J
I. 8 1350 180°1.8
1.2 1.2
_1 I I I ] .6 I .1 I I j.6 0 .2 .4 ,6 .8 1.0 0 ,2 .4 ,6
X/C .8 7,0X/C
FIG. 8 AZIMUTHAL VARIATION OF BLADE SURFACE PRESSURESAT r/R = 0.66. FIG. 8 CONCLUDED.
18

1,2 i
.6
-,6
F-'-"-
0 = 00
1.2
.6
I......[ ] I I
1,2 m
.6 --
-.6 I
1.2 m
.6 B
0 -
-.6 [
q5o
I ....I I I
90o
I I I .... I
-.6
1.2
.6
0
-.6
1.2
1.2 m
.6
-.6
-.G
-- 1350 1.2
.6
I I ] [ I,2 .4 .6 .8 1.0
X/C
FIG. 9 AZIMUTHAL VARIATION OF CHORDWISE LOADING AT
r/R = 0.96.
I I I I J
F2700
%
I I I I I
I I I t .... J
I I I I I.2 .q .6 .8 1.0
X/C
FIG. 9 CONCLUDED.
19
2.[I
1.8SUCT[ ON
---.- pRESsuRE®=o o
"
,G I
I,E
1.2
1,
90°
.E
2"hi _ _ SUCTTOtt1. ....--- ptESS_IE
__ ,r
2,4
1,8 _"
45° 1,:
1,8,
135o
___.L_.___.L_._-- ._ 1,o0 .2 ./4 ,G
X/C
FIG, 10 AZImuTHAL VI_RIAT_ONOF BLADE suRFACE pRESSURES
AT r/P. = 0.96,
270°
% _. .... 225°
2,[4
1.2
L....,.,.. _ _ -.-- _ 180 °
, fL
0 ,2 "_ yJC
FIG, 10 cOHCLIJOED.
2O

3,2
2.4
1.8
1,2
.6
2.4
1.8
1.2
.,=,
.6
'J 2.4
#.
"1.8
1.2
.6
m
-- SUCTION
------ PRESSURE
rlR = .36
!.I1
I I I ......... I I
/
.47
I I I I I
.55
mw
I I I I I
2.q
1,8
1,2
.60
I I .... I I I.2 .4 .6 .8 1.0
X/C
FIG. 11 SPANWISE VARIATION OF BLADE SURFACE PRESSURES
AT e = 0°.
3.2 i
2.4 n
1.8 --
1,2 --
.6
-- SUCTION
------ PRESSURE
r/R = .7(.I
1 I I I I
2.4
1.8
1.2
m
2.4
Q,.
1.8
1.2
.6
F.81
I I l I I
.88
I I I I I
2.4 --
1.2 --
1.2
.60
_I I III iII
I I I.2
.96lllliil_
.,...,m
,4 .G
XIC
FIG. 11 CONCLUDED.
I I,8 1.0
21

22
/
!Ic.......... _/
'
1,1.
_ I
,6
.6G
/- I
f -" __...%
'_.__ //
"_ 2.u+
6
6
.6 _/C.
FIG, 1"5 CO_Cl31I)EO'
_3

2.4 -- _ SUCTION r/R = .36 2"LII_ -- SUCTION
------ PRESSURE .-......-..."'_ L ------ PRESSURE
i d._...._ j'm_
1.8 li,'__ 1.8 | r/R = .]q
G I I l I I S I I I ]
2.q _ _ 2.4
'E1,8 1.8 _v_. _ _
1,2
.55
Z__ -- "----- .-.----_ _ .88
1 1 I I I .G ........... I 1 1 I I
2,[i _2.4 --
.661.8
1.2
.%
._ I I 1 I J .6o .2 ., ._ .8 ,.o o .2 .4 .6 .8
X/C X/C
F[G. lq SPANW[SE VARIATION OF BLADE SURFACEPRESSURES FIG. lq CONCLUDED.
AT e = 270 °.
1.0
24

1.7 ___ SUCTION------ PRESSURE //_"_.
1.6 /
1.4 --
1,3- I _ L1.2
(a) XIC = 0.036.
0.8
0.6
0.[I
X
0,2
0
-0.2O.2
1.6-- f \I' \
_ 7 j /1.2
- ,;ft,_-"-,,,x_ 1.o _, _/_._.
- /,, S,EADY"_ 20f18o°/,, ,..t.L°.. 1.8 /-_
../,'" ./ "x ,° / --.,"-" .__ _-- ._ 1.,_>,_,_ ,
" ./ /// ,oL L --_ l ]i/_ " (c) XIC = 0.53.
,..__ oo
'°I /^.1.8
I _2 __L I0.4 0.6 0.8 1.0 1,6 / _"
RADIAL DISTANCE, fir _"
FIG. 15 ELEMENTAL POWER COEFFICIENT l'4kT--_ _ ,'
ioi T--"'- I I(d) X/C = .63.
2.oI
1.8
1.6
1.4
1.2
1.0
.8I I__ I I100 200 300 qO0
AZIMUTH ANGLE
(e) XlC = 0.8_.
FIB. 16 BLADE-RESPOIISEAT DIFFERENT AXIAL LOCA-
TIONS ON fir = O.&&.
25

Report Documentation PageNational AeronauticsandSpace Administration
t. Report No. NASA TM-102374 2. Government Accession No.
AIAA-89-1060
4. Title and Subtitle
Prediction of Unsteady Blade Surface Pressures on an
Advanced Propeller at an Angle of Attack
7. Author(s)
M. Nallasamy and J.F. Groeneweg
9. Performing Organization Name and Address
National Aeronautics and Space AdministrationLewis Research Center
Cleveland, Ohio 44135-3191
12. Sponsoring Agency Name and Address
National Aeronautics and Space Administration
Washington, D.C. 20546-0001
3. Recipient's Catalog No.
5. Report Date
November 1989
6. Performing Organization Code
8. Performing Organization Report No.
E-5108
10. Work Unit No.
535-03-01
11. Contract or Grant No.
13. Type of Report and Period Covered
Technical Memorandum
14. Sponsoring Agency Code
15. Supplementary Notes
A shortened version of this report was presented at the 12th Aeroacoustics Conference sponsored by theAmerican Institute of Aeronautics and Astronautics, San Antonio, Texas, April 10-12, 1989. M. Nallasamy,
Sverdrup Technology, Inc., NASA Lewis Research Center Group, Cleveland, Ohio 44135; J.F. Groeneweg,
NASA Lewis Research Center.
16. Abstract
The paper considers the numerical solution of the unsteady, three-dimensional, Euler equations to obtain the blade
surface pressures of an advanced propeller at an angle of attack. The specific configuration considered is the SR7L
propeller at cruise conditions with a 4.6* inflow angle corresponding to the +2* nacelle tilt of the Propeller TestAssessment (PTA) flight test condition. The results indicate nearly sinusoidal response of the blade loading, with
angle of attack. For the first time, detailed variations of the chordwise loading as a function of azimuthal angle
are presented. It is observed that the blade is lightly loaded for part of the revolution and shocks appear from
hub to about 80 percent radial station for the highly loaded portion of the revolution.
17. Key Words (Suggested by Author(s))
Advanced propellers; Aeroacoustics; Computational
acoustics, Turboprop; Noise; Propeller aerodynamics;
Unsteady Euler solutions
18. Distribution Statement
Unclassified - Unlimited
Subject Category 02
19. Security Classif.Unclassified(Ofthis report) 20. Security Classif.Unclassified(Ofthis page) 21. No of26Pages
NASAFORMt62S OCT86 *For sale by the National Technical Information Service, Springfield, Virginia 22161
22. Price*
A03


![AN OPTIMAL ALGORITHM FOR COMPUTING ANGLE-CONSTRAINED SPANNERSmichiel/spanner-large-angle.pdf · In [21], Salowe presents an \angle-greedy" algorithm that constructs an angle-constrained](https://static.fdocuments.net/doc/165x107/60ad38e696195242005cec37/an-optimal-algorithm-for-computing-angle-constrained-spanners-michielspanner-large-anglepdf.jpg)


