Prediction of Mycotoxin Production by Detection of ... · from genus Penicillium and Geotrichum...
107
General rights Copyright and moral rights for the publications made accessible in the public portal are retained by the authors and/or other copyright owners and it is a condition of accessing publications that users recognise and abide by the legal requirements associated with these rights. • Users may download and print one copy of any publication from the public portal for the purpose of private study or research. • You may not further distribute the material or use it for any profit-making activity or commercial gain • You may freely distribute the URL identifying the publication in the public portal If you believe that this document breaches copyright please contact us providing details, and we will remove access to the work immediately and investigate your claim. Downloaded from orbit.dtu.dk on: Dec 17, 2017 Prediction of Mycotoxin Production by Detection of Volatile Metabolites Karlshøj, Kristian; Larsen, Thomas Ostenfeld; Nielsen, Per Væggemose Publication date: 2007 Document Version Publisher's PDF, also known as Version of record Link back to DTU Orbit Citation (APA): Karlshøj, K., Larsen, T. O., & Nielsen, P. V. (2007). Prediction of Mycotoxin Production by Detection of Volatile Metabolites.
Transcript of Prediction of Mycotoxin Production by Detection of ... · from genus Penicillium and Geotrichum...

General rights Copyright and moral rights for the publications made accessible in the public portal are retained by the authors and/or other copyright owners and it is a condition of accessing publications that users recognise and abide by the legal requirements associated with these rights.
• Users may download and print one copy of any publication from the public portal for the purpose of private study or research. • You may not further distribute the material or use it for any profit-making activity or commercial gain • You may freely distribute the URL identifying the publication in the public portal
If you believe that this document breaches copyright please contact us providing details, and we will remove access to the work immediately and investigate your claim.
Downloaded from orbit.dtu.dk on: Dec 17, 2017
Prediction of Mycotoxin Production by Detection of Volatile Metabolites
Karlshøj, Kristian; Larsen, Thomas Ostenfeld; Nielsen, Per Væggemose
Publication date:2007
Document VersionPublisher's PDF, also known as Version of record
Link back to DTU Orbit
Citation (APA):Karlshøj, K., Larsen, T. O., & Nielsen, P. V. (2007). Prediction of Mycotoxin Production by Detection of VolatileMetabolites.

Prediction of Mycotoxin Production by
Detection of Volatile Metabolites
Kristian Karlshøj Ph.D. ThesisApril 2007
BioCentrum-DTU TECHNICAL UNIVERSITY OF DENMARK

Kristian Karlshøj Center for Microbial Biotechnology BioCentrum‐DTU Technical University of Denmark DK‐2800 Kgs. Lyngby Denmark

I
PREFACE
The project was carried out at Center for Microbial Biotechnology at BioCentrum‐DTU, Technical University of Denmark and financed by Directorate for Food, Fisheries and Agro Business, grant no. FSK03‐DTU‐4, under the research programme Food Technology, Safety and Quality. I would like to thank my supervisors Thomas O. Larsen and Per V. Nielsen for our stimulating and encouraging talks and guidance throughout the study. Furthermore I would like to thank Thomas O. Larsen for inspiring me particularly in the field of analytical chemistry, especially gas chromatography and mass spectrometry and Per V. Nielsen for his great support on chemometrics. I am also grateful to Kristian F. Nielsen for introducing me to the more advanced sides of sample preparation and liquid chromatography including mass spectrometry. Jeorgos Trihaas is acknowledged for introducing me to the electronic nose and for inspiration in the field of chemometrics. I would like to thank Hanne Jakobsen, Ellen K. Lyhne (Kir), Mirella Simkus and Anni Jensen for helping me in the lab, with the instruments and cultures. I thank Jens C. Frisvad for stimulating talks on mycology. My office mates and fellow PhD students are also greatly appreciated for their inspirational talks and support. Last but not least I would like to thank my wife, family and friends for their support and encouragement.
Kristian Karlshøj

II

III
SUMMARY
Fungi from genus Penicillium play an important role in food and feed spoilage such as Penicillium expansum infection of apples (model system 1) and fungal spoilage of silage (model system 2). It is known that the incidence of P. expansum spoilage of apples is increased by damage to the apples hence P. expansum spoilage mainly occurs on windfall apples. Storage of windfall apples prior to industrial processing is therefore likely to be the main cause of P. expansum spoilage and thus mycotoxin content. Penicillium expansum spoilage of, and hence patulin content in, apples is a well known problem for the apple juice industry as apples are commonly stored prior to production, due to processing capacity limitations. Fungal spoilage of silage potentially poses a great problem in the agricultural industry. Spoilage constitutes a production loss to the farmer in the form of loss of biomass discarding of spoiled feed. The presence of mycotoxins may furthermore affect yield and health of the livestock. The focus of this study has been to investigate the possibility of prediction of mycotoxin production by detection of volatile metabolites via e‐nose analysis. The foremost aim has been to differentiate between fungal species and genera as well as to construct prediction models by correlating e‐nose data with mycotoxin concentrations both on synthetic media and in actual food and feed matrices. In all cases knowledge of the given habitats associated Funga has been applied. As a preliminary study it was confirmed, by GC‐MS analysis, that it is possible to distinguish very closely related fungi from the Penicillium roqueforti group; P. roqueforti and the patulin producing P. carneum and P. paneum, grown on artificial media by volatile metabolite profiling of mainly sesquiterpenes. In the initial e‐nose analysis study a cultivation method using artificial media was developed, in which fungi could be analyzed repeatedly with an e‐nose throughout the various growth stages. This method was used to analyze the headspace of several closely related cheese associated fungi, mainly from genus Penicillium and Geotrichum candidum; P. camemberti, P. nordicum, P. roqueforti and its closely related species P. paneum and P. carneum, as well as the non‐cheese associated fungus P. expansum. Headspace samples were also taken for GC‐MS analysis to generate an overview of the composition of the headspace of the cultures. This study proved that it was possible to differentiate between these closely related fungi by chemometric analysis of the e‐nose analysis data even if the volatile metabolite profiles, of in particular P. roqueforti and P. paneum, were very similar. HPLC analysis confirmed that the expected mycotoxins were produced under the given growth conditions. The first food / feed stuff model system chosen was apples used for apple juice production, as apple spoilage by Penicillium expansum and hence, contamination of apples by patulin is of major concern for the apple juice industry. Apples of the Golden Delicious and Jonagold varieties inoculated with P. expansum at the core‐ and surface were analyzed with an e‐nose both prior to and during different

IV
stages of laboratory scale apple juice production, mimicking the industrial apple juice production steps. Samples were analyzed by HPLC to determine the patulin concentration during various stages of apple juice production as well. The headspace of the whole apples was furthermore analyzed by GC‐MS in order to identify significant volatile biomarkers for P. expansum spoilage in apples. The volatile biomarkers were styrene, 3‐methyl‐1‐butanol, 3‐methyl‐1‐butanol acetate, methyl propanoate and 1‐methoxy‐3‐methyl benzene. Chemometric analysis of the e‐nose analysis data proved to be usable for distinguishing between contaminated and non‐contaminated apples and it was possible to construct a prediction model, predicting the concentration of patulin via the e‐nose measurements. The second food / feed stuff model system was chosen to be silage which is typically spoiled by fungi such as P. roqueforti, P. paneum and Monascus ruber resulting in mycotoxin contamination of the silage. Silage from one source was contaminated with the three mentioned fungi and the headspace of the contaminated silage was analyzed with an e‐nose. Furthermore silage from 15 other locations was analyzed to investigate the influence of silage variety on e‐nose analysis. The headspace was furthermore analyzed by GC‐MS to determine the volatile biomarkers for the various silage types as well as the volatile biomarkers for species specific fungal infection of silage. Chemometric analysis of the e‐nose analysis data proved to be usable for classification of silage as being non‐spoiled, spoiled by M. ruber, spoiled by P. paneum or spoiled by P. roqueforti. The chemometric analysis of e‐nose data also showed that the 16 silage samples clustered in 3 separate groups of which the headspace, analyzed by GC‐MS, of one group differed significantly from remaining two. Finally it was investigated what effect data parameterization of the e‐nose signal data could have on analysis. The parameters for the mathematical function describing e‐nose response curves were determined and several parameters such as total curve area, curve slope and wavelet decompositions of the signal were extracted. Chemometric analysis of data generated in the previous experiments was performed on the “raw data” generated by the e‐nose, specifically the maximum resistance measured (Ymax) and compared to chemometric analysis based on the parameters generated through mathematical modelling. The generated parameters were optimized to span the greatest possible variation with the least number of parameters. Both classification and regression modelling was performed with these two datasets. It was shown that with the datasets at hand there was no advantage in parameterization of the data. In conclusion it has been shown that prediction of mycotoxin production by e‐nose analysis is possible even in sample matrices containing a complex headspace such as apples and that it is possible to identify the spoilage organism in matrices with an equally complex headspace such as silage. The future perspectives for the application of e‐nose analysis in food and feed stuff quality control seem promising. There is still work to be done on construction of prediction models but the results of

V
this study strongly indicate that e‐nose technology has a great potential in e.g. screening samples in order to make spot sampling more efficient.

VI

VII
RESUMÉ
Skimmelsvampe af slægten Penicillium spiller en vigtig rolle i fordærv af fødevarer og foderstoffer så som Penicillium expansum infektion af æbler (modelsystem 1) og skimmelsvampinfektion af ensilage (modelsystem 2). Det er velkendt, at forekomsten af P. expansum fordærv i æbler stiger, hvis æblerne er skadet, derfor forekommer P. expansum råd i æbler først og fremmest i nedfaldsæbler. Lagring af nedfaldsæbler inden industriel processering er derfor sandsynligvis den vigtigste årsag til P. expansum fordærv og dermed mykotoksinindhold. Penicillium expansum fordærv af æbler og dermed tilstedeværelsen af patulin, er et velkendt problem for æblejuiceindustrien, da æbler almindeligvis bliver lagret inden produktion på grund af begrænset processkapacitet. Skimmelsvampeinfektion af ensilage er et potentielt stort problem for landbrugsindustrien. Fordærvet medfører et produktionstab for landmanden i form af tabt biomasse, da fordærvet foder kasseres. Tilstedeværelsen af mykotoksiner kan ydermere potentielt påvirke kvægets helbred og dermed landmandens udbytte. Fokus for dette studie har været at forudsige mykotoksindannelse ved detektion af flygtige metabolitter ved hjælp af e‐næseanalyse overordnede mål har været at kunne skelne mellem skimmelsvampearter og ‐slægter såvel som at konstruere forudsigelsesmodeller ved at korrelere e‐næsedata med mykotoksinkoncentrationer både på syntetiske medier og i fødevarer og foderstoffer. I alle tilfælde er viden om det givne habitats associerede funga blevet benyttet. Som et indledende studium blev det ved GC‐MS‐analyse bekræftet, at det er muligt at skelne mellem meget tæt beslægtede skimmelsvampe fra Penicillium roqueforti gruppen (P. carneum, P. paneum og P. roqueforti) dyrket på syntetiske medier ved profilering af de flygtige metabolitter, hovedsageligt sesquiterpener. Som introduktion til e‐næseanalyse blev en dyrkningsmetode udviklet, med hvilken skimmelsvampe gentagent kunne e‐næseanalyseres under alle vækststadier. Denne metode blev brugt til at analysere headspace fra adskillige tæt beslægtede, osteassocierede skimmelsvampe hovedsageligt fra slægten Penicillium: Geotrichum candidum, P. camemberti, P. nordicum, P. roqueforti og dens tæt beslægtede arter P. paneum og P. carneum, samt den ikkeosteassocierede P. expansum. Headspace prøver blev også analyseret med GC‐MS for at danne et overblik over sammensætningen af kulturernes headspace. Det viste sig muligt at skelne imellem disse tæt beslægtede skimmelsvampe ved kemometrisk analyse af e‐næsedata, selvom profilen af flygtige stoffer, især for P. roqueforti og P. paneum, var meget ens. HPLC‐analyse bekræftede, at de forventede mykotoksiner blev dannet under de givne vækstbetingelser. Æbler til brug i æblejuiceproduktione blev valgt som det første modelsystem for fødevarer / foderstoffer , da fordærv af æbler med P. expansum og dermed æblernes kontaminering med patulin udgør en stor bekymring for æblejuiceindustrien. Golden Delicious og Jonagold æbler, der var

VIII
overflade‐ og kernehuspodede med P. expansum, blev analyseret med en e‐næse både før og under forskellige æblejuiceproduktionstrin i laboratorieskala, der efterlignede den industrielle æblejuiceproduktion. Prøver blev analyseret med HPLC for at bestemme patulinkoncentrationen under forskellige trin af æblejuiceproduktionen. Headspace fra hele æbler blev yderligere analyseret ved GC‐MS for at identificere de flygtige biomarkører for P. expansum råd i æbler. De flygtige biomarkører var styren, 3‐methyl‐1‐butanol, 3‐methyl‐1‐butanolacetat, methylpropanoat og 1‐methoxy‐3‐methylbenzen. Kemometrisk analyse af e‐næseanalysedata viste det muligt at skelne imellem kontaminerede og ikke kontaminerede æbler og det var muligt at konstruere en forudsigelsesmodel for patulinkoncentration via e‐næsemålingerne. Ensilage blev valgt til det andet fødevare / foderstof modelsystem, da ensilage typisk bliver angrebet af skimmelsvampe så som P. roqueforti, P. paneum og Monascus ruber, hvilket resulterer i mykotoksinkontaminering af ensilagen. Ensilage fra én lokalitet blev podet med de tre nævnte skimmelsvampe, og headspace fra den inficerede ensilage blev analyseret med en e‐næse. Ensilage fra yderligere 15 andre lokaliteter blev analyseret for at undersøge indflydelsen af ensilagens variation på e‐næseanalysen. Headspace blev yderligere analyseret med GC‐MS for at bestemme de flygtige biomarkører for de forskellige ensilagetyper såvel som de flygtige biomarkører for artsspecifik skimmelsvampeinfektion af ensilagen. Kemometrisk analyse af e‐næsedata viste, at det er muligt at klassificere ensilage som værende enten ufordærvet, fordærvet af M. ruber, fordærvet af P. paneum eller fordærvet af P. roqueforti. Den kemometriske analyse af e‐næsedata viste også, at de 16 forskellige ensilager grupperedes i 3 grupper, af hvilke GC‐MS‐analyse viste, at én af grupperne skilte sig signifikant ud fra de resterende to. Til sidst blev det undersøgt, hvilken virkning parameterisering af e‐næsesignalerne kunne have på dataanalysen. Parametrene for den matematiske model, der beskriver e‐næseresponskurverne, blev bestemt, og adskillige parametre, så som total areal, hældning og wavelet dekompositioner af signalet, blev ekstraheret. Kemometrisk analyse af data fra tidligere forsøg blev udført på ”rådata” genereret af e‐næsen, specifikt den maksimalt målte resistans (Ymax). Denne analyse blev sammenlignet med kemometrisk analyse baseret på de ved matematisk modelering genererede parametre. De genererede parametre blev optimeret, så de udspændte den størst mulige variation med det mindst mulige antal parametre. Både klassifikations‐ og regressionsmodeller blev udført for disse to datasæt. Det blev vist, at der med de forhåndenværende datasæt ingen fordel var i at benytte parameterisering af data. Det konkluderes, at det er vist, at forudsigelse af mykotoksinproduktion ved e‐næseanalyse er mulig, selv i prøvematricer, så som æbler, der indeholder et komplekst headspace, og at det er muligt at identificere den organisme, der forårsager råd i en matrice, så som ensilage, med et lige så komplekst headspace. Fremtidsperspektiverne for benyttelsen af e‐næseanalyser i fødevare‐ og foderstofkvalitetskontrol ser lovende ud. Der er stadig arbejde, der skal gøres for at konstruere forudsigelsesmodeller, men

IX
resultaterne af dette studie indikerer kraftigt, at e‐næseteknologi har et stort potentiale i for eksempel screening af prøver, således at stikprøvekontrol kan gøres mere effektiv.

X

XI
LIST OF ORIGINAL PAPERS AND OTHER PUBLICATIONS
Karlshøj, K., Nielsen, P.V. and Larsen, T.O. Fungal Volatiles Biomarkers of Good and Bad Food Quality in Samson, R.A. and Dijksterhus, J. (Ed.). Food Mycology, 2007, CRC Press Boca Raton, FL. ISBN: 9780849398186. Karlshøj, K. & Larsen, T.O. Differentiation of Species from the Penicillium roqueforti Group by Volatile Metabolite Profiling. J. Agric. Food Chem. 2005, 53, 708‐715. Karlshøj, K., Nielsen, P.V. and Larsen, T.O. Differentiation of Mycotoxin Producing Fungi by Use of an Electronic Nose. J. Food Sci. 2007, 72, M187‐M192. Karlshøj, K. Nielsen, P.V. and Larsen, T.O. Prediction of Penicillium expansum Spoilage and Patulin Concentration in Apples used for Apple Juice Production by Electronic Nose Analysis. J. Agric. Food Chem. 2007, 55, 4289‐4298. Karlshøj, K. and Hansen, M.E. Effect of data parameterization on data analysis of electronic nose signals. (draft) Karlshøj, K., Drejer Storm, I.M.L., Nielsen, K.F., Nielsen, P.V. and Larsen, T.O. Prediction of Silage Spoilage by Electronic Nose Analysis. (draft) The reprints are published by kind permission from: CRC Press Boca Raton, FL. Journal of Agricultural and Food Chemistry, ACS Publications, Washington D.C. Journal of Food Science, IFT (Institute of Food Technologists), Chicago, IL.

XII
XIII
TABLE OF CONTENTS
PREFACE................................................................................................................... I SUMMARY ..............................................................................................................III RESUMÉ................................................................................................................ VII LIST OF ORIGINAL PAPERS AND OTHER PUBLICATIONS ......................................XI TABLE OF CONTENTS..........................................................................................XIII OBJECTIVE................................................................................................................1 INTRODUCTION
Karlshøj, K.; Nielsen, P. V.; Larsen, T. O. Fungal Volatiles: Biomarkers of Good and Bad Food Quality. In Food Mycology: A Multifaceted Approach to Fungi and Food, 1st ed.; Dijksterhuis, J., Samson, R. A., Eds.; CRC Press: Boca Raton, FL, 2007; Vol. 25, pp 279‐302. ..............................................................................................................................................3
FUNGAL BIOCHEMISTRY..........................................................................................4 VOLATILE METABOLITES.........................................................................................4 NON‐VOLATILE SECONDARY METABOLITES ..........................................................7 BIOMARKERS AND ASSOCIATED FUNGA.................................................................8 TRADITIONAL CHEMICAL ANALYSIS METHODS ..................................................10
HPLC ....................................................................................................................................... 11 Gas Chromatography and GC‐MS....................................................................................... 11
CASE I: IDENTIFICATION OF PENICILLIA AND DETECTION OF MYCOTOXIN
PRODUCTION BY VOLATILE METABOLITE PROFILING AND IDENTIFICATION......13 ELECTRONIC NOSE ANALYSIS...............................................................................14
How The Electronic Nose Works.......................................................................................... 14 Electronic Nose Sensors ......................................................................................................... 14 Conductivity Sensors............................................................................................................. 15 Chemometrics......................................................................................................................... 18 Neural Networks.................................................................................................................... 20
CASE II: DISCRIMINATING BETWEEN FOOD SPOILAGE FUNGI BY ELECTRONIC
NOSE TECHNOLOGY..............................................................................................21 CONCLUSIONS .......................................................................................................21
Acknowledgements ............................................................................................................... 21 REFERENCES...........................................................................................................22 PAPER 1
Karlshøj, K. & Larsen, T.O. Differentiation of Species from the Penicillium roqueforti Group by Volatile Metabolite Profiling. J. Agric. Food Chem. 2005, 53, 708‐715. ............ 27

XIV
PAPER 2 Karlshøj, K., Nielsen, P.V. and Larsen, T.O. Differentiation of Mycotoxin Producing Fungi by Use of an Electronic Nose. J. Food Sci. 2007, 72, M187‐M192. .......................... 37
PAPER 3 Karlshøj, K. Nielsen, P.V. and Larsen, T.O. Prediction of Penicillium expansum Spoilage and Patulin Concentration in Apples used for Apple Juice Production by Electronic Nose Analysis. J. Agric. Food Chem. 2007, 55, 4289‐4298.................................................... 45
PAPER 4 Karlshøj, K., Larsen, T.O., Nielsen, P.V. and Hansen, M.E. Effect of data parameterization on data analysis of electronic nose signals. (draft) ............................. 57
PAPER 5 Karlshøj, K., Drejer Storm, I.M.L., Nielsen, K.F., Nielsen, P.V. and Larsen, T.O. Prediction of Silage Spoilage by Electronic Nose Analysis. (draft)................................. 73
DISCUSSION & CONCLUSIONS ...............................................................................87 FUTURE PROSPECTS................................................................................................89

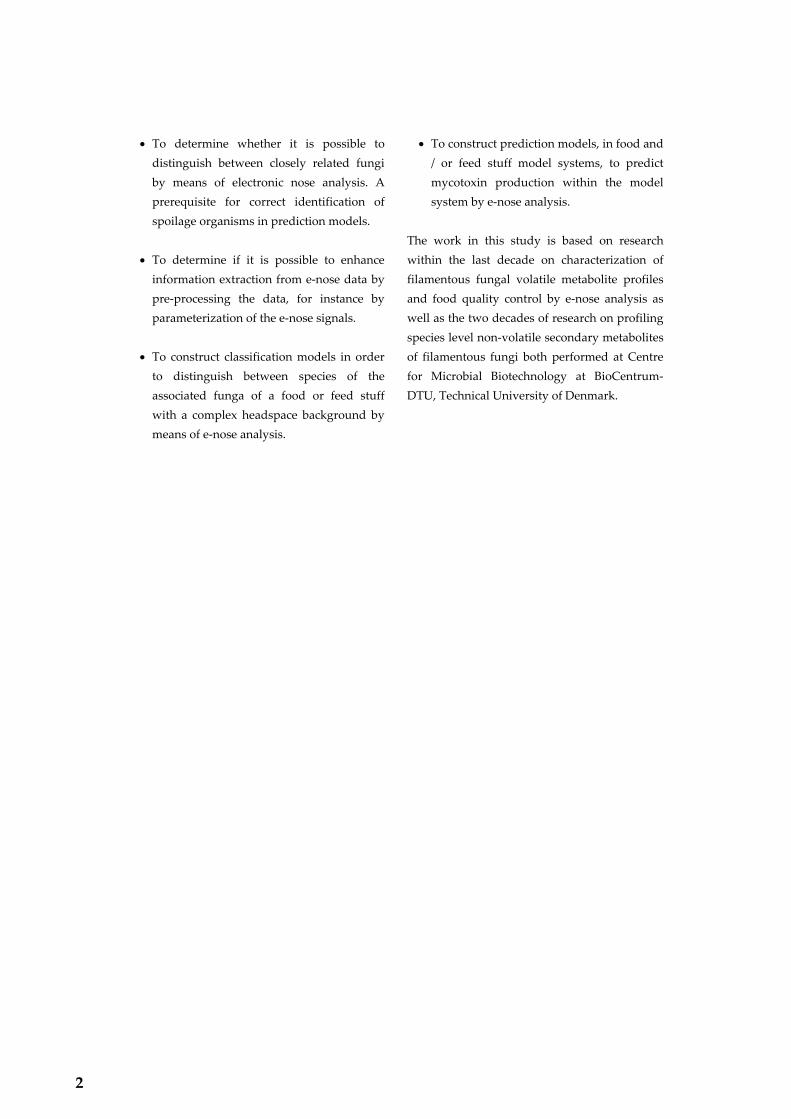
OBJECTIVE The main objective of this study has been to investigate whether unspecific detection of species specific fungal volatiles by e‐nose technology is applicable for prediction of mycotoxin production in food and feed stuffs, especially in foods and feed stuffs which exhibit a complex headspace background (Figure 17). It has therefore not been the scope of this study to explore the potential for predicting e.g. biomass by e‐nose analysis. It is evident that there is a great potential for such a method in food and feed stuff quality control. E‐nose analysis as means of predicting spoilage or mycotoxin production would in some cases be a much faster analysis method
compared to traditional methods, such as GC‐MS analysis to detect fungal contamination and HPLC analysis to detect mycotoxin content, especially when considering the workload in sample preparation particularly for HPLC samples. To achieve the main aim of this study the following goals were set: • To construct a method for fast and (semi) automated e‐nose analysis of the headspace of growing filamentous fungi, without accumulation of carbon dioxide and with as reduced a loss of volatile metabolites as possible.
Figure 17. The principle of indirect mycotoxin detection by e‐nose analysis of sample headspace.
1
• To determine whether it is possible to distinguish between closely related fungi by means of electronic nose analysis. A prerequisite for correct identification of spoilage organisms in prediction models.
• To determine if it is possible to enhance information extraction from e‐nose data by pre‐processing the data, for instance by parameterization of the e‐nose signals.
• To construct classification models in order to distinguish between species of the associated funga of a food or feed stuff with a complex headspace background by means of e‐nose analysis.
• To construct prediction models, in food and / or feed stuff model systems, to predict mycotoxin production within the model system by e‐nose analysis.
The work in this study is based on research within the last decade on characterization of filamentous fungal volatile metabolite profiles and food quality control by e‐nose analysis as well as the two decades of research on profiling species level non‐volatile secondary metabolites of filamentous fungi both performed at Centre for Microbial Biotechnology at BioCentrum‐DTU, Technical University of Denmark.
2

From: Chapter 14, "Fungal volatiles: Biomarkers of good and bad food quality. In Food Mycology: A Multifaceted Approach to Fungi andFood. Kristian Karlshøj, Per Væggemose Nielsen, Thomas Ostenfeld Larsen Center for Microbial Biotechnology, BioCentrum-DTU, Technical University of Denmark, Kgs. Lyngby, Denmark.
INTRODUCTION Most people have experienced the smell of fungal spoiled foods such as bread. The typical reaction is �this really smells bad� and most people will associate this with a mouldy smell. It has been shown that the odour thresholds of some off flavour related fungal volatile com-pounds are very low. The odour threshold for the earthy smelling terpene alcohol geosmin (Figure 1) in water is between 0.0082- 0.018 ppb and the musty smelling 2-methyl-isoborneol (Figure 1) has an odour threshold of 0.1 ppb in water (Medsker et al., 1969). Traditionally, specific fungal species have been used as starter cultures in certain fer-mented foods such as blue and white mould cheeses (Penicillium roqueforti; and Penicillium camemberti and Geotrichum candidum respec-tively) and soy sauce (Aspergillus oryzae and Aspergillus sojae). It is also well known that various mycotoxin producing fungi occur as contaminants in foods and feed stuffs, which is a considerable problem, in terms of food and feed quality and safety and hence economi-cally, as in 1985 FAO estimated that 25% of world crops (Pitt and Hocking, 1985) and as much as 50% of crops in developing countries, are contaminated with mycotoxins (Waller and Brayford, 1990; Pohland, 1993). It is therefore important that it is ensured that starter cultures are pure. Fungal detection is not only of importance in terms of food safety. For centuries, truffles, a most valuable fungal commodity, have been
found by use of pigs, which can smell the truf-fles odorous compounds very well and find them covered under soil. In the field of medi-cine, it is also important to be able to detect fungal infections, such as aspergillosis, as soon as possible. Food quality has, traditionally, often been assessed by sensory panel evaluation, for in-stance in quality control of cereals (Börjesson et al., 1996). Sensory panel analysis is a very labo-rious process as it requires a panel of sensory judges which is very expensive and time con-suming to train to a proficient level. Even a well trained sensory judge will give an at least partially subjective score in sensory panel analysis. There are further restrictions in using sensory panel analysis, as potentially toxic samples cannot be analyzed in this manner. Of the traditional analytical methods, GC-MS analysis is time consuming, but somewhat less expensive than sensory panel analysis or HPLC-DAD and LC-MS analysis. Data analysis
HO
Geosmin 2-Methylisoborneol
HO
Figure 1. Chemical structure of the mouldy smelling volatile fungal biomarkers geosmin and 2-methylisoborneol, two volatile compounds with extremely low odour-threshold values.
3

KARLSHØJ ET AL.
Alkanes
Alkenes
Methyl ketones
Secondary Alcohols
Primary Alcohols
Lactones
Aliphatic C8 compounds
Esters
Keto acids
Pyrazines
Fusel alcohols
Acetyl-CoA
Pyruvate
Glycolysis
Mevalonate
Mono-, Sesqui- & Diterpenes
Amino acids Fatty acids
Alkanes
Alkenes
Methyl ketones
Secondary Alcohols
Primary Alcohols
Lactones
Aliphatic C8 compounds
Esters
Keto acids
Pyrazines
Fusel alcohols
Acetyl-CoA
Pyruvate
Glycolysis
Mevalonate
Mono-, Sesqui- & Diterpenes
Amino acids Fatty acids
Keto acids
Pyrazines
Fusel alcohols
Acetyl-CoA
Pyruvate
Glycolysis
Mevalonate
Mono-, Sesqui- & Diterpenes
Amino acids Fatty acids
Pyrazines
Fusel alcohols
Acetyl-CoA
Pyruvate
Glycolysis
Mevalonate
Mono-, Sesqui- & Diterpenes
Amino acids Fatty acidsAcetyl-CoA
Pyruvate
Glycolysis
Mevalonate
Mono-, Sesqui- & Diterpenes
Amino acids Fatty acids
with all these techniques is complicated and requires skill and experience. HPLC-DAD and LC-MS analysis are expensive, both in terms of equipment, running costs and time consump-tion (Guernion et al., 2001). In recent years however, the electronic nose (e-nose) has been tested successfully for quality control of foods and feed stuffs. It has so far not been thoroughly tested whether it is possi-ble to link e-nose analysis with mycotoxin content/production, or to establish whether it is possible to predict mycotoxin production dur-ing production or storage. This is desirable as e-nose measurements are faster, cheaper and easily automated in industrial processes (Sim et al., 2003). Potentially, e-nose prediction models can be constructed, and with these data analy-sis could principally be performed by unskilled personnel. Following is a brief discussion of fungal biochemistry, with emphasis on volatile me-tabolites and mycotoxins as well as their appli-cation as biomarkers, the traditional chemical analysis methods for mycotoxins (HPLC and LC-MS) as well as for volatile organic com-pound (VOC) analysis (GC-MS) and finally, an in depth description of an electronic nose sys-tem and its potential applications for my-cotoxin prediction. A couple of cases will be shown for illustrative purposes. FUNGAL BIOCHEMISTRY Fungal presence can be detected in many ways. One such way concerns the production of the
sterol ergosterol, a plasma membrane compo-nent unique for fungi, and production of cell walls containing chitin. Fungi are also well known to produce a broad variety of extracel-lular enzymes, which are utilized in degrada-tion of nutrient macromolecules. Some metabo-lites, like ergosterol, are produced by almost all fungi, but most known secondary metabolites, such as mycotoxins and volatile terpenes, have been shown to be more restricted in their dis-tribution, for instance only being produced only by 1 to 15 species within genus Penicillium (Larsen and Frisvad, 1995a). VOLATILE METABOLITES Among the volatile metabolites produced by fungi are alcohols, aliphatic C8 compounds, alkanes, alkenes, esters, ketones, lactones, pyrazines and terpenes, an overview of the volatile metabolite pathways is shown in Fig-ure 2. The alcohols produced can be put into three categories according to their synthesis path-way. The first group comprises of primary alcohols which are produced in two reductive steps from fatty acid-CoA esters (Luckner, 1990). The second group, the fusel alcohols, is a product of the Ehrlich pathway. In this path-way amino acids (such as leucine, isoleucine and valine) are deaminated and the resulting β-keto acid decarboxylated, the resulting alde-hyde is reduced to the alcohol by the alcohol dehydrogenase enzyme (Figure 3) (Suoma-lainen, 1971; Berry, 1988).
Figure 2. Overview of the biosynthesis of important fungal volatile metabolites, adapted from (Börjesson, 1993; Larsen, 1994; Jelén and Wasowicz, 1998).
4

FUNGAL VOLATILES
-OOC
NH3+
-OOC
O O OH
-OOC
NH3+
-OOC
O O OH
-OOC
NH3+
-OOC
O O OH
Leucine
Iso-leucine
Valine
3-Methyl-butanol
2-Methyl-butanol
2-Methyl-propanol
Figure 3. Fusel alcohol pathways. The amino acid is deaminated, then decarboxylated and the aldehyde reduced to the resulting alcohol (Suomalainen, 1971; Gurney, 1997).
COOH
O
OHO
HO
OHCOOH
OHC
O2
"10-hydroxyperxoide"
+
1-octene-3-ol Figure 4. 1-Octen-3-ol synthesis. Linoleic acid is oxidized into a 10-hydroxyperoxide which in turn is cleaved into 1-octen-3-ol and a ten carbon fragment (Wurzenberger and Grosch, 1982; Wurzenberger and Grosch, 1984).
COOHCOOH
O O OH
Hexanoic acid β-ketohexanoic acid 2-Pentanone 2-Pentanol Figure 5. Methyl ketone synthesis example. The fatty acid is β-oxidatized by the usual pathway in the fatty acid metabolism. The β-keto acid is then decarboxylated to form the methyl ketone. The methyl ketone can be further reduced to the resulting secondary alcohol (Luckner, 1990). Secondary alcohols, which comprise the third group, are formed by reduction of methyl ketones (see below and Figure 5) (Hawke, 1966; Kinsella and Hwang, 1976; Kinderlerer, 1989). Aliphatic C8 compounds are produced by lipoxygenation; for instance 1-octen-3-ol is produced by oxidation of linoleic acid into a 10-hydroxyperxoide which is then cleaved into 1-octen-3-ol and a ten carbon fragment (Figure
4) (Wurzenberger and Grosch, 1982; Wuzen-berger and Grosch, 1984). Synthesis of alkanes and alkenes is done by decarboxylation of the corresponding fatty acids. The likely pathway for this is an α-oxidation with a β-keto acid intermediate. Further unsaturation of the alkene can be achieved by hydroxylation and dehydrogena-tion of the alkene (Luckner, 1990). The acid moiety of esters produced by fungi can be formed by three possible path-
5
KARLSHØJ ET AL.
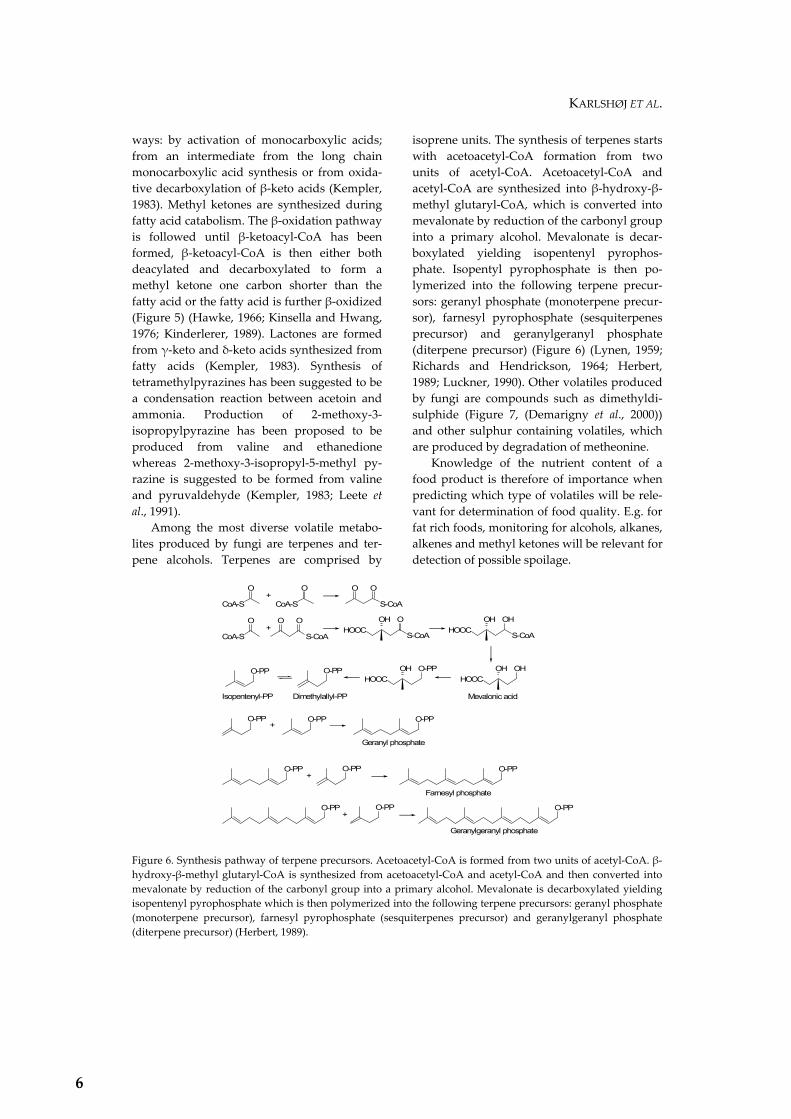
ways: by activation of monocarboxylic acids; from an intermediate from the long chain monocarboxylic acid synthesis or from oxida-tive decarboxylation of β-keto acids (Kempler, 1983). Methyl ketones are synthesized during fatty acid catabolism. The β-oxidation pathway is followed until β-ketoacyl-CoA has been formed, β-ketoacyl-CoA is then either both deacylated and decarboxylated to form a methyl ketone one carbon shorter than the fatty acid or the fatty acid is further β-oxidized (Figure 5) (Hawke, 1966; Kinsella and Hwang, 1976; Kinderlerer, 1989). Lactones are formed from γ-keto and δ-keto acids synthesized from fatty acids (Kempler, 1983). Synthesis of tetramethylpyrazines has been suggested to be a condensation reaction between acetoin and ammonia. Production of 2-methoxy-3-isopropylpyrazine has been proposed to be produced from valine and ethanedione whereas 2-methoxy-3-isopropyl-5-methyl py- razine is suggested to be formed from valine and pyruvaldehyde (Kempler, 1983; Leete et al., 1991). Among the most diverse volatile metabo-lites produced by fungi are terpenes and ter-pene alcohols. Terpenes are comprised by
isoprene units. The synthesis of terpenes starts with acetoacetyl-CoA formation from two units of acetyl-CoA. Acetoacetyl-CoA and acetyl-CoA are synthesized into β-hydroxy-β-methyl glutaryl-CoA, which is converted into mevalonate by reduction of the carbonyl group into a primary alcohol. Mevalonate is decar-boxylated yielding isopentenyl pyrophos-phate. Isopentyl pyrophosphate is then po-lymerized into the following terpene precur-sors: geranyl phosphate (monoterpene precur-sor), farnesyl pyrophosphate (sesquiterpenes precursor) and geranylgeranyl phosphate (diterpene precursor) (Figure 6) (Lynen, 1959; Richards and Hendrickson, 1964; Herbert, 1989; Luckner, 1990). Other volatiles produced by fungi are compounds such as dimethyldi-sulphide (Figure 7, (Demarigny et al., 2000)) and other sulphur containing volatiles, which are produced by degradation of metheonine. Knowledge of the nutrient content of a food product is therefore of importance when predicting which type of volatiles will be rele-vant for determination of food quality. E.g. for fat rich foods, monitoring for alcohols, alkanes, alkenes and methyl ketones will be relevant for detection of possible spoilage.
CoA-S
O
CoA-S
O
S-CoA
OO
CoA-S
O
S-CoA
OO
S-CoA
OOHHOOC
S-CoA
OHOHHOOC
OHOHHOOC
O-PPOHHOOC
O-PPO-PP
O-PP
O-PP
O-PP
+
+
Mevalonic acid
O-PPO-PP+
Isopentenyl-PP Dimethylallyl-PP
O-PP O-PP+
O-PP O-PP+
Geranyl phosphate
Geranylgeranyl phosphate
Farnesyl phosphate
Figure 6. Synthesis pathway of terpene precursors. Acetoacetyl-CoA is formed from two units of acetyl-CoA. β-hydroxy-β-methyl glutaryl-CoA is synthesized from acetoacetyl-CoA and acetyl-CoA and then converted into mevalonate by reduction of the carbonyl group into a primary alcohol. Mevalonate is decarboxylated yielding isopentenyl pyrophosphate which is then polymerized into the following terpene precursors: geranyl phosphate (monoterpene precursor), farnesyl pyrophosphate (sesquiterpenes precursor) and geranylgeranyl phosphate (diterpene precursor) (Herbert, 1989).
6
FUNGAL VOLATILES
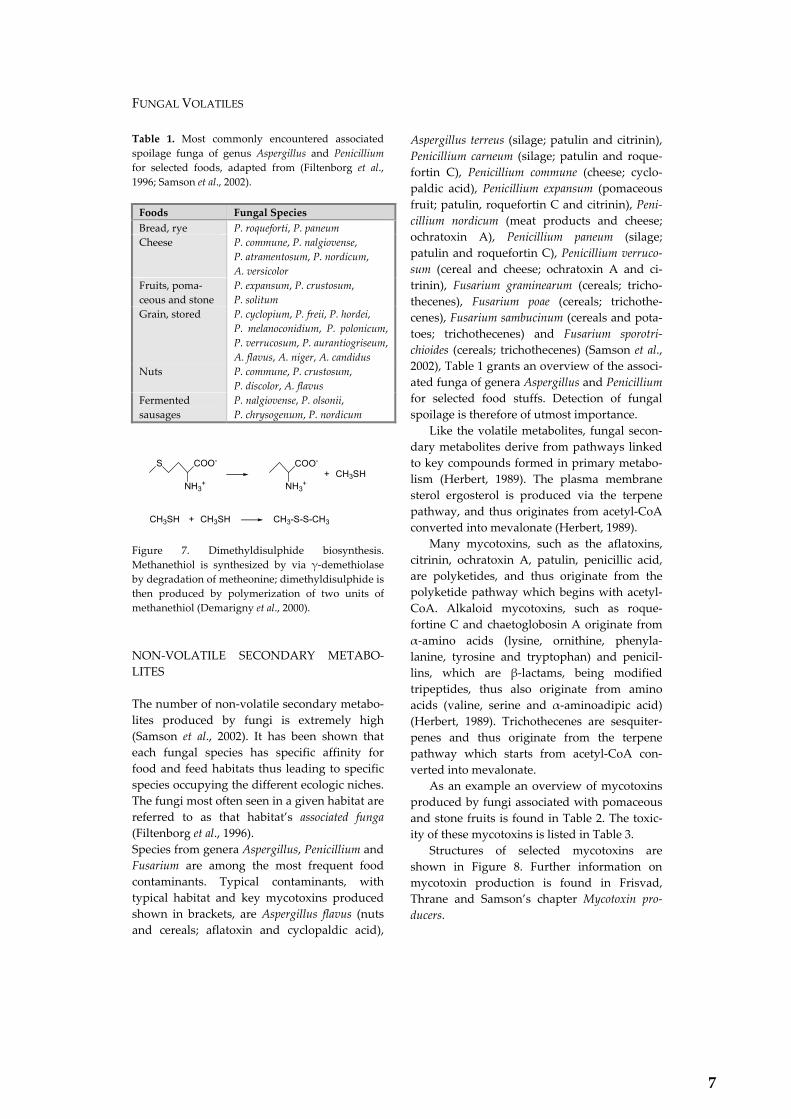
Table 1. Most commonly encountered associated spoilage funga of genus Aspergillus and Penicillium for selected foods, adapted from (Filtenborg et al., 1996; Samson et al., 2002).
Foods Fungal Species Bread, rye P. roqueforti, P. paneum Cheese P. commune, P. nalgiovense,
P. atramentosum, P. nordicum, A. versicolor
Fruits, poma-ceous and stone
P. expansum, P. crustosum, P. solitum
Grain, stored P. cyclopium, P. freii, P. hordei, P. melanoconidium, P. polonicum, P. verrucosum, P. aurantiogriseum, A. flavus, A. niger, A. candidus
Nuts P. commune, P. crustosum, P. discolor, A. flavus
Fermented sausages
P. nalgiovense, P. olsonii, P. chrysogenum, P. nordicum
CH3SHCOO-
NH3+
+COO-
NH3+
S
CH3SH CH3SH+ CH3-S-S-CH3 Figure 7. Dimethyldisulphide biosynthesis. Methanethiol is synthesized by via γ-demethiolase by degradation of metheonine; dimethyldisulphide is then produced by polymerization of two units of methanethiol (Demarigny et al., 2000). NON-VOLATILE SECONDARY METABO-LITES The number of non-volatile secondary metabo-lites produced by fungi is extremely high (Samson et al., 2002). It has been shown that each fungal species has specific affinity for food and feed habitats thus leading to specific species occupying the different ecologic niches. The fungi most often seen in a given habitat are referred to as that habitat�s associated funga (Filtenborg et al., 1996). Species from genera Aspergillus, Penicillium and Fusarium are among the most frequent food contaminants. Typical contaminants, with typical habitat and key mycotoxins produced shown in brackets, are Aspergillus flavus (nuts and cereals; aflatoxin and cyclopaldic acid),
Aspergillus terreus (silage; patulin and citrinin), Penicillium carneum (silage; patulin and roque-fortin C), Penicillium commune (cheese; cyclo-paldic acid), Penicillium expansum (pomaceous fruit; patulin, roquefortin C and citrinin), Peni-cillium nordicum (meat products and cheese; ochratoxin A), Penicillium paneum (silage; patulin and roquefortin C), Penicillium verruco-sum (cereal and cheese; ochratoxin A and ci-trinin), Fusarium graminearum (cereals; tricho-thecenes), Fusarium poae (cereals; trichothe-cenes), Fusarium sambucinum (cereals and pota-toes; trichothecenes) and Fusarium sporotri-chioides (cereals; trichothecenes) (Samson et al., 2002), Table 1 grants an overview of the associ-ated funga of genera Aspergillus and Penicillium for selected food stuffs. Detection of fungal spoilage is therefore of utmost importance. Like the volatile metabolites, fungal secon-dary metabolites derive from pathways linked to key compounds formed in primary metabo-lism (Herbert, 1989). The plasma membrane sterol ergosterol is produced via the terpene pathway, and thus originates from acetyl-CoA converted into mevalonate (Herbert, 1989). Many mycotoxins, such as the aflatoxins, citrinin, ochratoxin A, patulin, penicillic acid, are polyketides, and thus originate from the polyketide pathway which begins with acetyl-CoA. Alkaloid mycotoxins, such as roque-fortine C and chaetoglobosin A originate from α-amino acids (lysine, ornithine, phenyla-lanine, tyrosine and tryptophan) and penicil-lins, which are β-lactams, being modified tripeptides, thus also originate from amino acids (valine, serine and α-aminoadipic acid) (Herbert, 1989). Trichothecenes are sesquiter-penes and thus originate from the terpene pathway which starts from acetyl-CoA con-verted into mevalonate. As an example an overview of mycotoxins produced by fungi associated with pomaceous and stone fruits is found in Table 2. The toxic-ity of these mycotoxins is listed in Table 3. Structures of selected mycotoxins are shown in Figure 8. Further information on mycotoxin production is found in Frisvad, Thrane and Samson�s chapter Mycotoxin pro-ducers.
7

KARLSHØJ ET AL.
Table 2. Mycotoxins, capable of evoking acute or chronic diseases in vertebrate animals, produced by pomaceous and stone fruit associated fungi of genus Penicillium.
Species Mycotoxins P. crustosum Penitrem A � F; roquefortine C;
terrestric acid P. expansum Chaetoglobosin C; citrinin; com-
munesins; patulin; roquefortine C P. solitum -
Table 3: Toxicity type of mycotoxins listed in Table 2.
Mycotoxin Toxic activity Chaeteoglobosins Cytotoxic Citrinin Nephrotoxic Communesins Cytotoxic Patulin Carcinogenic, cyto-
toxic, generally toxic Penitrems Acutely toxic,
tremorgenic Roquefortine C Neurotoxic Terrestric acid Cardiotoxic
NH
OHOOC
O
OH
Cl
O
H
H
Ochratoxin A
O
O
OH
HO
O
O
Aflatoxin B1
O O
HO O
Patulin
NH
NNH
NH
N
O
O
Roquefortine C
OO
O
HO
Penicillic Acid
H
H
Figure 8. Chemical structure of selected mycotoxins. BIOMARKERS AND ASSOCIATED FUNGA In industrial food quality control, sensory panel analysis has traditionally been used. The trained panelists use terms such as musty, acidic or putrid to describe off flavours of the spoiled product. Unfortunately even the best trained sensory panel will yield subjective scores. Off flavours can also be studied by analytical chemistry, for instance by use of GC- MS. In such an analysis the level of geosmin, 2-
methyl-isoborneol and other off flavour related compounds, can be determined and chemom-etrics can be used to classify samples according to whether they have off flavours of any kind or not. It is important to remember that sample treatment can influence the volatile metabolite profile since for instance the compound 1-octen-3-ol will be formed in large amounts when fungal mycelium is destroyed (Kara-hadian et al., 1985). To make analysis easier it can be worth-while to focus on compounds generally en-countered in spoiled food. Two such com-pounds which indicate fungal spoilage are ergosterol and chitin, which thus are biomarkers for fungal growth/biomass and thus fungal spoilage. Chemical analysis, usually by HPLC, to determine the level of ergosterol has been proven to be a reliable measure for estimation of fungal CFU in a given sample (Cahagnier et al., 1983). By applying knowledge of the associated funga of a specific product and knowledge of volatile compounds produced by these fungi, it is possible to determine the fungal species in a sample. A list of associated spoilage fungi, and their habitat, of genus Aspergillus and Penicil-lium is shown in Table 1. For instance, if analy-sis for geosmin and 2-methyl-isoborneol is done, it is possible to distinguish between P. expansum (geosmin producer), P. solitum (2-methyl-isoborneol producer) and P. crustosum (produces both geosmin and 2-methyl-isoborneol), three Penicillium species associated with apple spoilage (for production of volatile compounds by species, see Table 4). These results were obtained on synthetic media, but they indicate a possibility for differentiation of spoilage fungi in foods as well. This distinction of course relies on the given media stimulating the production of these volatile compounds. Thus both volatile and non-volatile metabolites can be used as biomarkers. A biomarker can be more or less specific indicating fungal spoilage by pointing at a selected group, such as the terverticillate Penicillia series viridicata or series verrucosa, or even an individual species.
8

FUNGAL VOLATILES
Table 4. Volatiles produced by the most commonly encountered food spoilage species in Table 1, adapted from (Börjesson et al., 1992; Zeringue, Jr. et al., 1993; Larsen and Frisvad, 1995a; Fischer et al., 1999; Karlshøj and Lar-sen, 2005). Species Volatile metabolites A. candidus 3-methylfuran, 2-methyl-1-propanol, 1-penten-3-ol, 2-methyl-1-butanol, thujopsene,
ethyl hexanoate, 1-octen-3-ol ethyl ester, 2,3,5-trimethylfuran, anisole, 3-octanone, 3-cyclohepten-1-one, 3-methyl-1-butanol, 1-octen-3-ol, 3-methyl-1-heptene, 1,3,6-octatriene and one unidentified monoterpene
A. flavus 3-methylfuran, 2-methyl-1-propanol, 1-penten-3-ol, octadiene, limonene, thujop-sene, 3-methyl-1-butanol, 3-octanone, 3-octanol, 1-octen-3-ol, 1-octanol, cis-2-octen-1-ol, α-gurjunene, trans-caryophyllene, epi-bucyclosesqui-phellandrene, eremo-philene, β-cubebene, valencene, epizonaren, γ-selinene, γ-cadinene, cadinene, δ-cadinene, α-muurolene, aristolen, α-copaene
A. niger 2-methyl-borane, 2-methyl-bornene, α-pinene, 3-methyl-1-butanol, 3-octanone, 3-octanol, 1-octen-3-ol, 2-octen-1-ol, 1-octanol
A. versicolor 3-methylfuran, 2-methyl-1-propanol, 1-penten-3-ol, 2-methyl-1-butanol, octadiene, limonene, thujopsene, anisole, 1-(3-methylphenyl)-ethanone, 6-methyl-2-heptanone, χ-curcumene, α-muurolene, myrcene, 3-methyl-1-butanol, 1-octen-3-ol
P. atramentosum Ethyl acetate, methyl isobutanoate, ethyl isobutanoate, isobutyl acetate, ethyl 2-methyl-butanoate, ethyl isopentanoate, isobutyl isobutanoate, isobutyl 2-methyl butanoate, butyl isopentanoate
P. aurantiogriseum 2-methyl-1-propanol, 3-methyl-1-butanol, 1-ethyl-cyclopentene, 1,3-octadiene (two isomers), 3-heptanone, 3-octanone, γ-elemene, and two unidentified sesquiterpenes
P. chrysogenum 1-heptene, 1,3-octadiene (two isomers), 3-heptanone, 1-nonene, 1,3-nonadiene, 1-octen-3-ol, 3-octanone, 3-octanol
P. commune Ethyl acetate, 2-methyl-1-propanol, 3-methyl-1-butanol, 3-hexanone, 1,3-octadiene (two isomers), 3-heptanone, styrene, 1-octen-3-ol, 3-octanone, 3-octanol, 2-methyl-isoborneol, β-caryophyllene, (+)-aristolochene, and seven unidentified sesquiter-penes
P. crustosum Ethyl acetate, 2-methyl-1-propanol, ethyl propanoate, 3-methyl-1-butanol, di-methyldisulphide, ethyl isobutanoate, 1,3,5-cycloheptatriene, isobutyl acetate, ethyl butanoate, ethyl-2-methyl-butanoate, ethyl isopentanoate, Isopentyl acetate, sty-rene, ethyl pentanoate, 3-octanone, ethyl hexanoate, ethyl octanoate, 2-methyl-isoborneol, geosmin and an unidentified monoterpene
P. cyclopium One unidentified sesquiterpene P. discolor 2-methyl-3-butene-2-ol, 2-methyl-1-propanol, 3-methyl-1-butanol, isobutyl acetate,
3-octanone, 2-methyl-isoborneol, geosmin, four unidentified monoterpenes and three unidentified sesquiterpenes
P. expansum Ethanol, 2-methyl-1-propanol, 3-methyl-1-butanol, ethyl acetate, β-pinane, 1-methyoxy-3-methyl-benzene, zingiberene, α-bergamotene, β-bisabolene, geosmin and one unidentified sesquiterpene
P. freii 2-methyl-1-propanol, 3-methyl-1-butanol, 1,3-octadiene (two isomers), 3-octanone P. hordei 2-methyl-1-propanol, 3-methyl-1-butanol, 1,3,6-octatriene, 3-heptanone, β-
phellandrene, 3-octanone, limonene, 1,8-cineol, geosmin, γ-elemene and three unidentified sesquiterpenes
P. melanoconidium 2-methyl-1-propanol, 3-methyl-1-butanol, 1-ethyl-cyclopentene P. nalgiovense Ethyl acetate, 2-methyl-1-propanol, 3-octanone, RI1404 P. nordicum Acetone, 2-butanone, 2-methyl-1-propanol, 3-methyl-butanol, 2-pentanone, 2-
methyl-isoborneol P. olsonii 2-butanone, 2-methyl-1-propanol, 2-methyl-butanol, 2-heptanone, limonene, 2-
nonanone P. paneum Acetone, 2-methyl-1-propanol, 3-methyl-1-butanol, 2-pentanone, β-elemene, β-
caryophyllene, (+)-aristolochene, eremophilene, α-selinene, 14 unidentified ses-quiterpenes and two unidentified diterpenes
9
KARLSHØJ ET AL.
P. polonicum Ethyl acetate, 3-octanone, 2-methyl-isoborneol, γ-elemene, β-farnesene and three unidentified sesquiterpenes
P. roqueforti Acetone, 2-methyl-1-propanol, 3-methyl-1-butanol, 2-methyl-butanol, isobutyl acetate, 1-octene, 2-pentanone, 3-octanone, β-myrcene, p-cymene, limonene, li-nalool, β-patchoulene, β-elemene, diepi-α-cedrene, β-caryophyllene, patchoulene isomer, (+)-aristolochene, RI1528, eremophilene, α-selinene, valencene, β-bisabolene, himachalene, 17 unidentified sesquiterpenes and one unidentified diterpene
P. solitum 2-methyl-1-propanol, 3-methyl-1-butanol, ethyl 2-methyl-butanoate, isobutyl 2-methyl-butanoate, 2-methyl-butyl 2-methyl-butanoate (two enantiomers), 2-methyl-isoborneol, β-elemene, (+)-aristolochene and one unidentified monoterpene
P. verrucosum 2-butanone, 2-methyl-1-propanol, 2-pentanone, 3-pentene-2-one, 3-methyl-1-butanol, 3-octanone, 2-methyl-isoborneol
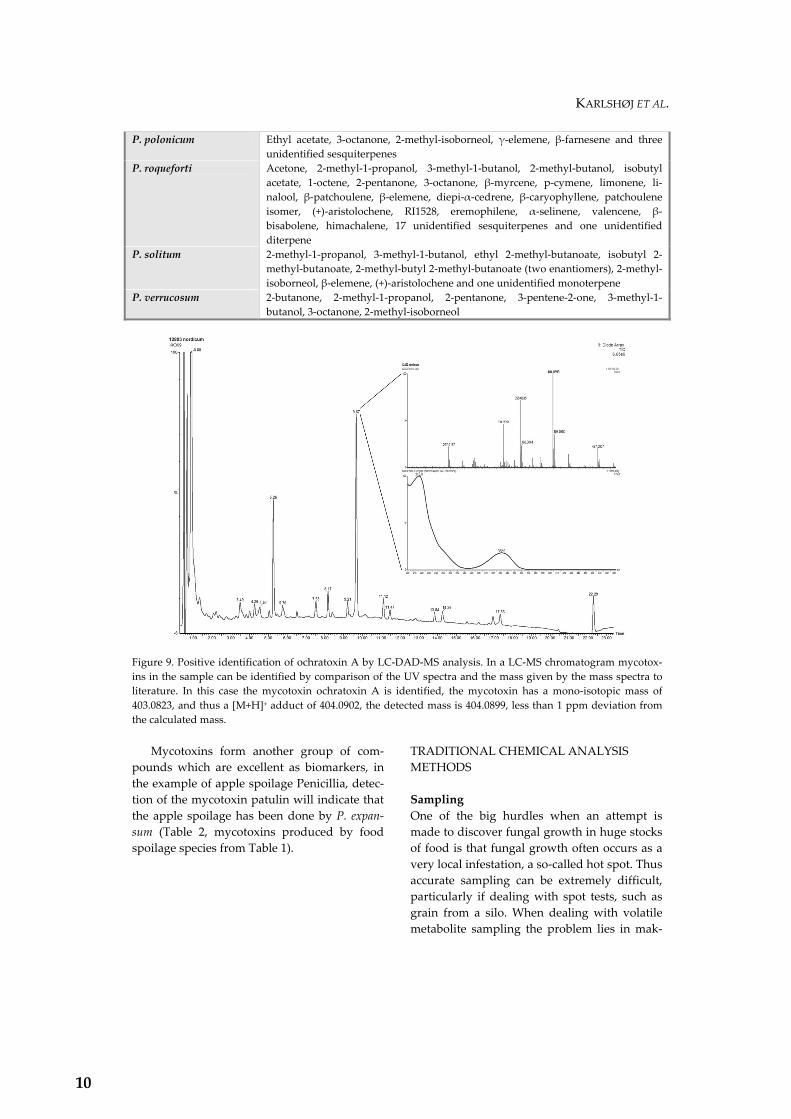
Figure 9. Positive identification of ochratoxin A by LC-DAD-MS analysis. In a LC-MS chromatogram mycotox-ins in the sample can be identified by comparison of the UV spectra and the mass given by the mass spectra to literature. In this case the mycotoxin ochratoxin A is identified, the mycotoxin has a mono-isotopic mass of 403.0823, and thus a [M+H]+ adduct of 404.0902, the detected mass is 404.0899, less than 1 ppm deviation from the calculated mass. Mycotoxins form another group of com-pounds which are excellent as biomarkers, in the example of apple spoilage Penicillia, detec-tion of the mycotoxin patulin will indicate that the apple spoilage has been done by P. expan-sum (Table 2, mycotoxins produced by food spoilage species from Table 1).
TRADITIONAL CHEMICAL ANALYSIS METHODS Sampling One of the big hurdles when an attempt is made to discover fungal growth in huge stocks of food is that fungal growth often occurs as a very local infestation, a so-called hot spot. Thus accurate sampling can be extremely difficult, particularly if dealing with spot tests, such as grain from a silo. When dealing with volatile metabolite sampling the problem lies in mak-
10
FUNGAL VOLATILES
ing sure that the correct sampling technique is applied, so that relevant compounds can be collected for analysis.
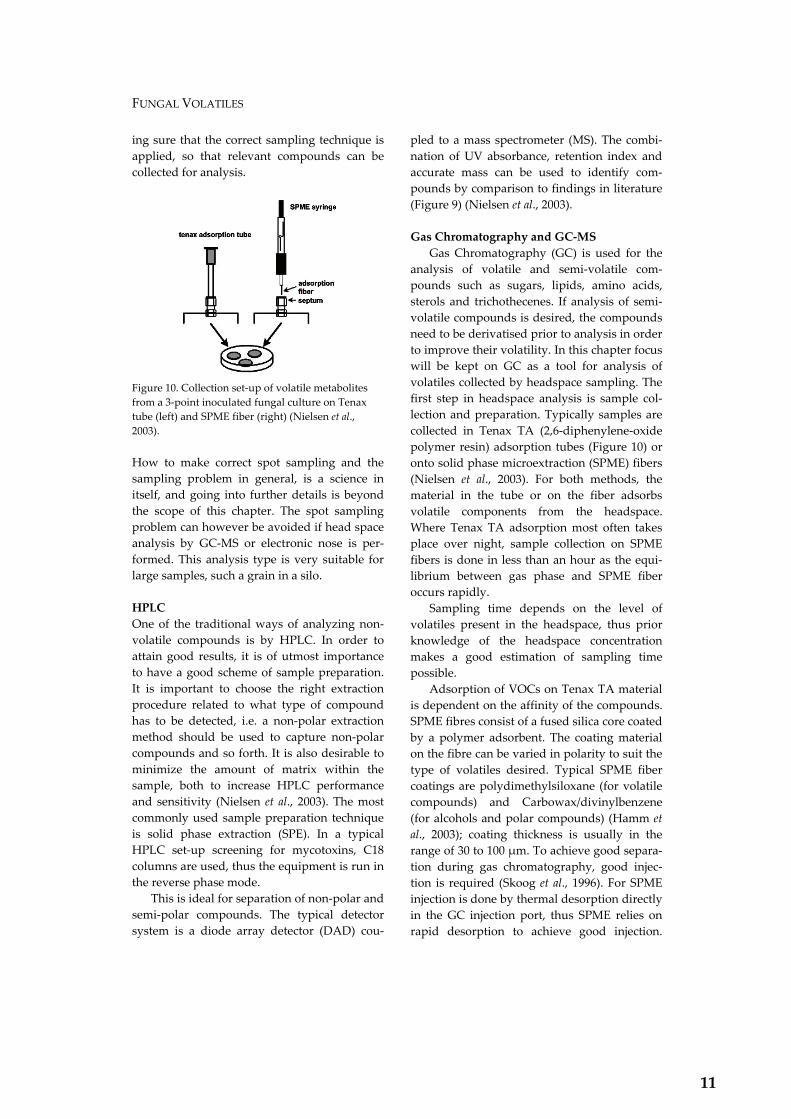
Figure 10. Collection set-up of volatile metabolites from a 3-point inoculated fungal culture on Tenax tube (left) and SPME fiber (right) (Nielsen et al., 2003). How to make correct spot sampling and the sampling problem in general, is a science in itself, and going into further details is beyond the scope of this chapter. The spot sampling problem can however be avoided if head space analysis by GC-MS or electronic nose is per-formed. This analysis type is very suitable for large samples, such a grain in a silo. HPLC One of the traditional ways of analyzing non-volatile compounds is by HPLC. In order to attain good results, it is of utmost importance to have a good scheme of sample preparation. It is important to choose the right extraction procedure related to what type of compound has to be detected, i.e. a non-polar extraction method should be used to capture non-polar compounds and so forth. It is also desirable to minimize the amount of matrix within the sample, both to increase HPLC performance and sensitivity (Nielsen et al., 2003). The most commonly used sample preparation technique is solid phase extraction (SPE). In a typical HPLC set-up screening for mycotoxins, C18 columns are used, thus the equipment is run in the reverse phase mode. This is ideal for separation of non-polar and semi-polar compounds. The typical detector system is a diode array detector (DAD) cou-
pled to a mass spectrometer (MS). The combi-nation of UV absorbance, retention index and accurate mass can be used to identify com-pounds by comparison to findings in literature (Figure 9) (Nielsen et al., 2003). Gas Chromatography and GC-MS Gas Chromatography (GC) is used for the analysis of volatile and semi-volatile com-pounds such as sugars, lipids, amino acids, sterols and trichothecenes. If analysis of semi-volatile compounds is desired, the compounds need to be derivatised prior to analysis in order to improve their volatility. In this chapter focus will be kept on GC as a tool for analysis of volatiles collected by headspace sampling. The first step in headspace analysis is sample col-lection and preparation. Typically samples are collected in Tenax TA (2,6-diphenylene-oxide polymer resin) adsorption tubes (Figure 10) or onto solid phase microextraction (SPME) fibers (Nielsen et al., 2003). For both methods, the material in the tube or on the fiber adsorbs volatile components from the headspace. Where Tenax TA adsorption most often takes place over night, sample collection on SPME fibers is done in less than an hour as the equi-librium between gas phase and SPME fiber occurs rapidly. Sampling time depends on the level of volatiles present in the headspace, thus prior knowledge of the headspace concentration makes a good estimation of sampling time possible. Adsorption of VOCs on Tenax TA material is dependent on the affinity of the compounds. SPME fibres consist of a fused silica core coated by a polymer adsorbent. The coating material on the fibre can be varied in polarity to suit the type of volatiles desired. Typical SPME fiber coatings are polydimethylsiloxane (for volatile compounds) and Carbowax/divinylbenzene (for alcohols and polar compounds) (Hamm et al., 2003); coating thickness is usually in the range of 30 to 100 µm. To achieve good separa-tion during gas chromatography, good injec-tion is required (Skoog et al., 1996). For SPME injection is done by thermal desorption directly in the GC injection port, thus SPME relies on rapid desorption to achieve good injection.
11

KARLSHØJ ET AL.
Tenax TA adsorption tubes are usually ther-mally desorbed, over a course up to half an hour, into a cold-trap. Once desorption of the Tenax adsorption tube is completed the cold trap is rapidly heated to release the volatile compounds which are then immediately intro-duced in the GC injector. Since the capacity of capillary columns is limited, it is important that the system is not overloaded. Therefore, most injector systems are of the split/splitless type (Wilson and Walker, 1994; Skoog et al., 1996). This is impor-tant in case samples are collected from a con-centrated source, for instance very close to the source of contamination or even immediately over a fungal culture. The split/splitless injector works by ensuring a constant flow onto the column, which is required to get reliable chro-matography, while part of the sample is in-jected onto the column, the majority of the sample will be ejected from the system through the split/vent, thus preventing the need for diluting samples (Grob, 1993). Since the amount of volatile compounds bound to an SPME fiber will be substantially less than what is bound in a Tenax tube, GC-MS analysis from SPME samples typically start in splitless mode to get proper sample application on the GC column. The columns typically used in GC-MS systems are fused silica columns. The station-ary phase on these columns can vary in polar-ity and film thickness and is chosen according to the polarity and volatility of the sample to be analyzed. Column polarity commonly varies between the non-polar DB-5 columns [(5%-Phenyl)-methylpolysil-oxane] and low/ me-dium polar DB-1701 columns [(14%-Cyanopropyl-phenyl)-methylpolysil-oxane] (Skoog et al., 1996). For analytical purposes the column dimensions are typically between 0.18 mm and 0.32 mm internal diameter (capillary column) by 30 m length. When selecting col-umn film diameter, it is a choice between high separation power (thin column film) and higher capacity (thick column film). The thick film columns are better suited for separation of highly volatile compounds (Grob, 1993; Skoog et al., 1996). For instance for non-polar com-pounds such as mono- and sesquiterpenes, a non-polar column, such as a DB-5 column, is
preferable for better separation of the com-pounds (König et al., 1999). GC columns are placed inside an oven for control of tempera-ture. During a typical GC run the oven tem-perature is increased from 30 to 270 °C over a period between 30 to 60 minutes. By increasing the column temperature the volatile com-pounds in the sample will further be split by affinity to the stationary phase as a compound with high affinity to the stationary phase re-quires a higher temperature to leave the sta-tionary phase than a compound with less affin-ity for the stationary phase. The most common detector on any GC system is a flame ionization detector (FID). This detector utilizes a hydrogen / air flame for detection primarily of carbon containing com-pounds (Skoog et al., 1996). It is a highly robust detector, with a sensitivity level of approxi-mately 10-13 g/s (Wilson and Walker, 1994; Skoog et al., 1996), but it does not yield any structural information, and on a single column GC instrument it cannot be used for compound identification. If identification is desired, using only an FID detector, the sample must be ana-lyzed on two columns of differing type, and a standard of the compound must be analyzed as well for comparison of retention time / reten-tion index. When more information about the volatile compounds is required, such as mass, for identification of the compound, mass spec-trometers are used. Mass spectrometers are often used in combination with an FID. The typical mass spectrometer used for GC is a quadropole instrument. Mass spectral analysis provides structural information through the fragmentation pattern, the mass spectrum, formed by electron impact ionization (EI) this pattern can be searched in a database library for compound identification. Sensitivity in MS can be improved by a factor of around 50 from ng to pg level by scanning for few selected characteristic ions i.e. selected ion recording (SIR / SIM). Unfortunately MS cannot yield information on isomers and some compounds (Ramaswami et al., 1988) unless coupled to a GC system equipped with chiral columns as well as usage of chiral standards.
12

FUNGAL VOLATILES
Case I: Identification of Penicillia and Detection of Mycotoxin Production by Volatile Metabolite Pro-filing and Identification It is believed that volatile metabolites play an important role in the chemical interactions between fungi and their surrounding organ-isms. Recently, it has been shown that volatile metabolites produced by Penicillium paneum inhibit mycelial growth of different species of fungi belonging to a variety of genera (Chitarra et al., 2004) and it has also been shown that 1-octen-3-ol inhibits germination of spores from P. paneum, as well as induction of microcycle conidiation, showing that this compound is acting like a fungal hormone during fungal development in P. paneum (Chitarra et al., 2004; Chitarra et al., 2005). It has been shown that the volatile metabo-lite profile is usually species specific within genus Penicillium (Larsen and Frisvad, 1995a). Fungal volatile metabolites include alcohols, ketones, esters, hydrocarbons such as small alkenes and mono and sesquiterpenes, of which the terpenes were shown to be most relevant for species identification (Larsen and Frisvad, 1995b). It is important to remember that the production of volatile metabolites is highly media specific, for instance the produc-tion of ketones and secondary alcohols derive from lipid degradation. When analyzing vari-ous series such as series viridicata, series cam-emberti and series verrucosa, within genus Peni-cillium, it has been shown to be difficult to differentiate the fungi to species level (Larsen et al., 2001). In those cases, the differentiation will be on a series level and the volatile com-pounds will be series specific instead of species specific. In some cases differentiation of species proves easier as with the very closely related species Penicillium carneum, P. paneum and P. roqueforti can be differentiated through volatile metabolite profiling and identification of par-ticularly terpenes (Karlshøj and Larsen, 2005) (Figure 11). For P. roqueforti, for instance, the major sesquiterpenes compounds produced are β-elemene, selenine, patchuline (Larsen and Frisvad, 1995b) as well as (+)-aristolochene (Demyttenaere et al., 2001) whereas P. carneum produces far less terpenes but large amounts of 3-methyl-1-butanol.
It has been shown, using the knowledge that it is possible to differentiate species from genus Penicillium on basis of terpene profile, that it is possible to detect a fungal contamina-tion at a ratio of 1000:1 of a P. roqueforti culture with P. commune within three days by analysis of volatile metabolites (Larsen, 1997), at a stage where it was very difficult to detect the con-tamination by morphological studies of the mixed culture. This was achieved by combining SPME with SIR MS analysis mainly of ions character-istic to sesquiterpenes specific to the cheese associated fungi, such as 2-methyl-isoborneol and β-caryophyllene for P. commune and limo-nene, β-elemene and β-caryophyllene for P. roqueforti, providing a method for starter cul-ture cross contamination checking.
Figure 11. Chromatograms of the RI interval 1340-1800 for A: P. carneum, B: P. roqueforti and C: P. paneum. The abundance scale is in percentage of the abun-dance given in the top left corner of each chroma-togram. The difference in volatile metabolite profile between the species is evident.
13
KARLSHØJ ET AL.
A series of studies have shown correlations between production of specific volatile metabo-lites and mycotoxin production. Release of specific sesquiterpenes unique to mycotoxeno-genic Aspergillus flavus isolates, among them α-gurjunene, trans-caryophyllene and γ-cadinene, was shown to be correlated to afla-toxin biosynthesis, and the decline of aflatoxin biosynthesis was also correlated to the disap-pearance of the specific sesquiterpenes from the headspace (Zeringue, Jr. et al., 1993). Pro-duction of terpenes, among them trichodiene, has been shown to be biomarkers for produc-tion of trichothecenes in Fusarium species (Jelén et al., 1995; Pasanen et al., 1996; Demyttenaere et al., 2004) and it has been shown that it is possi-ble to distinguish between different toxino-genic Fusarium species through sesquiterpene profiling (Demyttenaere et al., 2004). A good review on fungal volatile metabolites can be found in Jelén and Wasowicz (1998). ELECTRONIC NOSE ANALYSIS How the Electronic Nose Works The electronic nose can be compared to the mammalian olfactory system where gasses stimulate receptors. The stimulated receptors send nerve signals to the olfactory cortex where they are analyzed and interpreted. It has been shown that the receptors generally are quite non-selective, though a few compounds like geosmin have a very low threshold value, thus a given receptor responds to many com-pounds and that many receptors respond to a given compound. This gives rise to patterns of responses for the olfactory cortex to analyze and interpret (Pearce, 1997). Like its counter-part, the electronic nose consists of a number of non-specific receptors, its sensors, whose signal patterns are analyzed, by either a neural net-work or chemometrics for interpretation. Like the mammalian olfactory system, the electronic nose relies on an array of receptors, a sensor array. As seen in the following section, there are several different approaches to sensor design in terms of how the compounds are detected
and thus what kind of signal pattern is gener-ated for analysis. Electronic nose technology has many appli-cations. It has been used for screening for toxic gases, volatile organic compounds and food related compounds. Especially within the field of food technology, electronic noses have been applied in quality control (Maul et al., 2000; Werlein, 2001; Rye and Mercer, 2003; Berna et al., 2004; Vinaixa et al., 2004; García-González et al., 2004; Balasubramanian et al., 2004; Trihaas et al., 2005a), process control (Zondervan et al., 1999), maturity monitoring (Brezmes et al., 2005; Trihaas and Nielsen, 2005; Marrazzo et al., 2005; Trihaas et al., 2005b) etc. This has been done on both raw materials and manufactured products. Until now the potential of the electronic nose to replace methods like GC-MS and HPLC / LC-MS for indirect mycotoxin estimation has not been explored. Obviously, for this potential to be realistic the e-nose has to be capable of separation of fungal species among a given associated funga when analyzing samples from a particular habitat. When comparing e-nose analysis with GC-MS analysis some of the key differences are that the e-nose sensors may not yield a sensitive respond to some of the com-pounds which can be found as key com-pounds, by GC-MS analysis, for a given food contamination problem (Schaller et al., 1998; Kohl, 2001). On the other hand, e-nose analysis has a potential for automation through con-struction of prediction models by chemomet-rics or neural network analysis. In addition, e-nose analysis is a very rapid method and thus suitable for high throughput screening. Electronic Nose Sensors The different sensor types used in electronic noses can be divided into four groups. 1. Conductivity sensors: Metal oxide semicon-
ductors (MOS), intrinsically conductive polymer chemiresistors (ICP) and conduc-tive polymer composite chemiresistors (CP)
2. Electrostatic potential sensors: Metal oxide semiconductor field effect transistors (MOSFET) and gas sensitive field effect transistor sensors (GASFET)
14

FUNGAL VOLATILES
3. Acoustic resonance sensors: Thickness-shear mode / quartz crystal microbalance / bulk acoustic wave (TSM / QCM / BAW) and surface acoustic wave (SAW)
4. Optical vapour sensors: Polymer-deposited optical sensors (DPO) and self-encoded bead (SEB)
Conductivity Sensors Metal Oxide Semiconductor Sensors Metal oxide semiconductors (MOS) have been used commercially as gas alarms since the 1960s (Schaller et al., 1998). It took more than 20 years for the first cross-reactive MOS sensor array to be demonstrated, by Persaud and Dodd (1982). The sensors usually consist of a cylindrical ceramic former, which contains a heating element. The ceramic former is coated with a film of semiconductor material (Bartlett and Gardner, 1992; Strike et al., 1999; Gardner and Bartlett, 1999). There are two types of semiconductors used, negative electron type (n-type) or posi-tive hole (p-type). For p-type conductors, the density of holes in the valence band exceeds electron density in the conduction band the opposite is the case for n-type semiconductors. Electrical conduction in p-type semiconductors is mostly due to the movement of positive holes whereas electrical conductivity in n-type semiconductors is mostly due to the movement of electrons. N-type semiconductors, which usually consist of zinc oxide, tin dioxide, iron (III) oxide or titanium dioxide, respond mainly to reducing gases, while p-type semiconduc-tors, which normally are oxides of nickel or cobalt, mainly respond to oxidizing com-pounds (Mielle, 1996). The semiconductor film can be coated as either a thick film (10-300 µm) or a thin film (6-1000 nm). Thin films, though harder to manufacture reproducibly, offer faster responses as well as higher sensitivity. Most often, commercial MOS sensors are of the thick film type (Schaller et al., 1998). Sensor selectivity can be changed by vari-ous means. The semiconductor film can be doped with catalytic metals, (usually platinum or palladium), the operating temperature can be shifted (in the range of 50-400 °C) and the
particle size in the semiconductor films poly-crystalline structure can be changed (Watson and Yates, 1985; Morrison, 1987; Mielle, 1996; Albert et al., 2000; Strike et al., 1999). Both reactions will lead to a change in the semiconductor material and thus to the meas-ured change in conductivity. Overall, the MOS sensors are less selective than for instance CP, BAW, SAW and MOSFET sensors (Mielle, 1996). MOS sensors are typi-cally operated at high temperatures to increase reactivity and decrease the sensitivity to water (Albert et al., 2000). Sensitivity to water, and therefore high operating temperature, along with a very high sensitivity to ethanol, poisoning by sulphur containing compounds as well as weak acids and slow baseline recovery when subjected to high molecular weight compounds are all drawbacks to this sensor type (Mielle, 1996; Schaller et al., 1998). Conducting Polymer Sensors Conducting polymer sensors have been ap-plied as electronic nose sensors since the 1980s (Pelosi and Persaud, 1988; Bartlett et al., 1989). They are comprised of a substrate, fiberglass or silicone, coated by a conducting organic poly-mer between the two electrodes, which are usually gold plated (Amrani et al., 1995; Mielle, 1996). The polymer used is typically polypyr-role, polyaniline or polythiopene (Figure 13). The polymers act as the sensing unit of the sensor. The polymers in intrinsically conduc-tive polymer chemiresistor sensors (ICP) are linear backboned comprised of repeating con-jugated organic monomers that act as one-dimensional conductors as electrons will travel mostly through the conjugated linear back-bone. In conductive polymer composite chemiresistor sensors (CP) polymers, carbon black or polypyrrole is used as the conductor, while non-conducting organic polymers serve as the insulating substrate (Strike et al., 1999). To change the selectivity of the conductive polymer sensor changes in the polymerization conditions as well as the counter ion in use can be made. Furthermore, the oxidation state of the polymer can be changed after deposition on the sensor (Schaller et al., 1998). It has been
15

KARLSHØJ ET AL.
Figure 12. Schematic diagrams of five of the most common sensor types. MOS, Metal oxide semicon-ductor; CP, Conducting polymer; BAW, Bulk acous-tic wave; SAW, Surface acoustic wave; MOSFET, Metal oxide semiconductor field effect transistor (Schaller et al., 1998; Albert et al., 2000).
shown that use of chiral material for the poly-mer in carbon black polymer composites (CP sensors) leads to the ability to differentiate between enantiomer compounds (Severin et al., 1998). It is also possible to imbed biomaterials such as antibodies, enzymes or cells in the polymer if so desired. When a CP or ICP sensor is exposed to volatile compounds some of these will be ad-sorbed in the polymer causing swelling and altering the electron flow in the polymer. This will cause the measured change in conductivity (Shiers, 1995; Albert et al., 2000). Conducting polymer sensors are operated at low temperatures (below 50 °C), which causes extreme sensitivity to moisture (Shiers, 1995). It has proven difficult to manufacture conductive polymer sensors reproducibly, due to the polymerization step that is hard to con-trol (Mielle, 1996; Partridge et al., 1996). Electrostatic Potential Sensors Metal oxide semiconductor field effect transistor sensors (MOSFET) were firstly re-ported used by Lundström et al. in 1975 (Lund-ström et al., 1975; Lundström et al., 1990; Lund-ström et al., 1993). The MOSFET sensor is con-structed of three layers: the top layer, the so-called gate, comprises of metal, underneath this is an insulating layer of an oxide, usually SiO2, and in the bottom the semi-conducting substrate, often a p-type silicon with n-type channels on both sides of the metal gate (Schaller et al., 1998; Albert et al., 2000). In MOSFET sensors the metal gate traditionally consists of aluminium, whereas catalytic met-als, such as palladium, platinum and iridium, are used, as the only difference in construction, in gas sensitive field effect transistor sensors (GASFET).
n S n NH n
HN
nPolyacetylene Polythiophene Polypyrrole Polyaniline
Figure 13. Structure of polymer backbone in insulating form for CP sensors (Albert et al., 2000).
Semiconductor
Substrate
Electrode
Electrode
Semiconducto
Substrate
MOS
Electrode
Polymer
Substrate
CP
Crysta
Coating
Electrode
BAW
CrystaCoating
Electrode SAW
Semiconductor
Insulator SiO2
Catalytic
Electrodes
MOSFET
Round
Flat
Flat
16

FUNGAL VOLATILES
Selectivity and sensitivity of MOSFET sensors can be changed by alterations in operating temperature, the type of metal used in the metal gate (i.e. change between catalytic and non-catalytic metals) and the microstructure of the metal in the metal gate (Lundström et al., 1975; Lundström et al., 1990; Albert et al., 2000). Palladium is preferable for hydrogen sensing and platinum and iridium for sensing polar compounds (Lundström et al., 1992; Albert et al., 2000). The metal gate can be applied as either a continuous (thick) film (100-400 nm), or a dis-continuous (thin) film (3-30 nm) (Müller and Lange, 1986; Sundgren et al., 1990; Winquist et al., 1992; Schaller et al., 1998). The thick film sensors primarily respond to compounds, which can be dehydrogenated, whereas the thin film sensors also respond to compounds such as carbon monoxide and ammonia (Lund-ström et al., 1975; Lundström et al., 1990; Spetz et al., 1992; Schaller et al., 1998). The dehydro-genation takes place on the metal gate, the hydrogen can adsorb to the gate and diffuse to the SiO2 / metal interface were it forms a dipole layer. This changes the electrostatic potential of the MOSFET sensor (Bergveld, 1985; Lund-ström et al., 1992). Apart from adsorptions and reactions on the metal gate and hydrogen dif-fusion to the metal-insulator interface, thin film sensors also have their electrostatic potential changed on the insulator surface due to reac-tions of polar compounds on the metal oxide surface (Lundström et al., 1975; Lundström et al., 1990). MOSFET sensors are silicon based and thus operate at temperatures below 250 °C (Strike et al., 1999). Typical operating temperatures for MOSFET sensors are in the range of 50 to 200 °C (Lundström et al., 1975; Lundström et al., 1990). These sensors, like MOS sensors, exhibit a fairly low sensitivity to moisture and fur-thermore are quite robust. On the down side, high manufacturing expertise is required for good sensor quality and reproducibility (Schaller et al., 1998).
Acoustic Resonance Sensors King in 1964 introduced bulk acoustic wave sensors (BAW) also referred to as thickness-shear mode sensors (TSM), and by the name quartz crystal microbalance (QCM) (King, 1964). Wohltjen and Dessy introduced surface acoustic wave sensors (SAW) in 1979 (Wohltjen and Dessy, 1979a; Wohltjen and Dessy, 1979b; Wohltjen and Dessy, 1979c). Martin et al. re-ported the first use of SAW sensors in the 1980s (Martin et al., 1983; Martin et al., 1984; Martin et al., 1985). Both BAW and SAW sensors consist of crystal discs, usually made of either quartz, lithium niobate or lithium thantalate coated with for instance chromatographic stationary phases, polymer films or other non-volatile compounds that adsorb vapors (Guilbault and Jordan, 1988; Nieuwenhuizen and Nederlof, 1992; Holmberg, 1997; Strike et al., 1999). In a BAW sensor the electrodes are positioned on top of and below the crystal, with coating on top of the electrodes. In a SAW sensor, the electrodes are both positioned on top of the crystal with the coating in between the elec-trodes (Albert et al., 2000). The coating on BAW sensors is quite thin (1 µm to 10 nm) and SAW sensors are constructed on such a minute scale as to be compatible with planar integrated circuits fabrication technology (Caliendo and Verona, 1992; Wünsche et al., 1995; Mielle, 1996). In order to change the selectivity of the sensor, the coating used can be changed, and choices in coating are nearly limitless (Mielle, 1996; Hodgins, 1997; Strike et al., 1999). Both BAW and SAW sensors, being vibrat-ing crystals, exhibit resonance vibrations when an alternating current is applied to them, even at room temperature. This vibration is also dependant on the mass of the crystal. Thus when volatile compounds are adsorbed on the coating, the mass of the sensor increases which causes the resonance frequency of the sensor to change. This change is measured (Hodgins, 1997; Strike et al., 1999; Albert et al., 2000). BAW sensors generate three-dimensional waves through the crystal, perpendicular to the sur-face of the crystal and are operated at frequen-cies between 10-30 MHz. In SAW sensors the
17
KARLSHØJ ET AL.
waves generated are two-dimensional, only penetrating approximately one wavelength into the crystal. The SAW sensors are operated at frequencies between 100MHz to 1 GHz (Nieuwenhuizen and Nederlof, 1992; Holm-berg, 1997; Albert et al., 2000). Due to its minute size, SAW sensors are very robust. They are also more sensitive than BAW sensors though both are less sensitive than the other sensor types. Because of their operating frequencies SAW sensors are much noisier than BAW sen-sors (Mielle, 1996; Hodgins, 1997). Unfortu-nately the coating technology is as yet not fully controlled, thus leading to poor batch-to-batch reproducibility. The acoustic sensors exhibit a high sensitivity to temperature and humidity fluctuations (Mielle, 1996; Doleman et al., 1998). Optical Vapour Sensors Polymer-deposited optical sensors (DPO) are comprised of an optical fibre on which an indicator is immobilized on the tip. The immo-bilized indicator is coated with a polymer. In self-encoded bead sensors (SEB) thousands of tiny beads (3.2 µm), of polymer or ceramic materials, are immobilized in acid-etched wells on the tip of the optical fibre. The beads consist of a ceramic or polymer material containing a vapour sensing dye. One of the dyes typically used in either sensor type is Nile Red. If a change in specificity is required the polymer, and for SEB also ceramic, material can be changed (Dickinson et al., 1997; Walt et al., 1998). When vapour is adsorbed in the polymer the polarity of the surroundings of the vapour-sensing dye changes and the dye changes col-our. In general, the more polar the vapour adsorbed, the more red-shifted the absorption and/or emission spectra of the dye will be. In PDO sensors many data can be collected simul-taneously. Among those are changes in inten-sity, fluorescence lifetime and spectral shape (Albert et al., 2000). SMB sensors can be con-structed in very small arrays, which will give rise to short response times and increased sensitivity. Five seconds is usually ample time for proper response and recovery of the sensor in experiments (Albert et al., 2000).
The most commonly used sensor types are MOS and CP sensors. Due to the high power consumption of MOS systems, almost all port-able e-nose systems apply CP sensors. Electronic Nose Signal Analysis As with any other analysis method, proper data analysis of electronic nose signals is cru-cial. It is therefore important to know what you wish to achieve with your analysis in order to choose a proper data analysis technique. Apart from choice of technique, there are details to keep in mind when performing data analysis. Even the most successful analysis is worthless unless proper data analysis is performed. Chemometrics Use of chemometrics is the traditional data analysis tool for e-nose data. There is a broad variety of chemometric tools available and the most common ones are briefly described in the following section. Principal Component Analysis Principal component analysis (PCA) is fre-quently used to get an overview of the data obtained. One of the objectives of PCA is to reduce the dimensionality of data in order to make data analysis easier. Reduction of dimen-sionality also reduces the level of noise in the data, as the noise is omitted from the PCA model. PCA will also change the coordinate system of the data, moving the centre point to where the average data are (Esbensen, 2001). In PCA, data are described by principal compo-nents (PCs). The first PC is always chosen so that it explains the maximal variance, which is the same as minimizing the summed square transverse distances from the data points to the PC (least squares approach), the second PC is always orthogonal to the first PC and is chosen so it describes the second highest variance. The third PC must orthogonal to the first two and so on (Esbensen, 2001). The maximal number of PCs in any PCA is no higher than the number of components minus one or the number of variables, which ever of the two is lower. In most cases PCA models consist of few PC�s (typically one to four). Thus in PCA dividing data into structure and noise can be achieved.
18
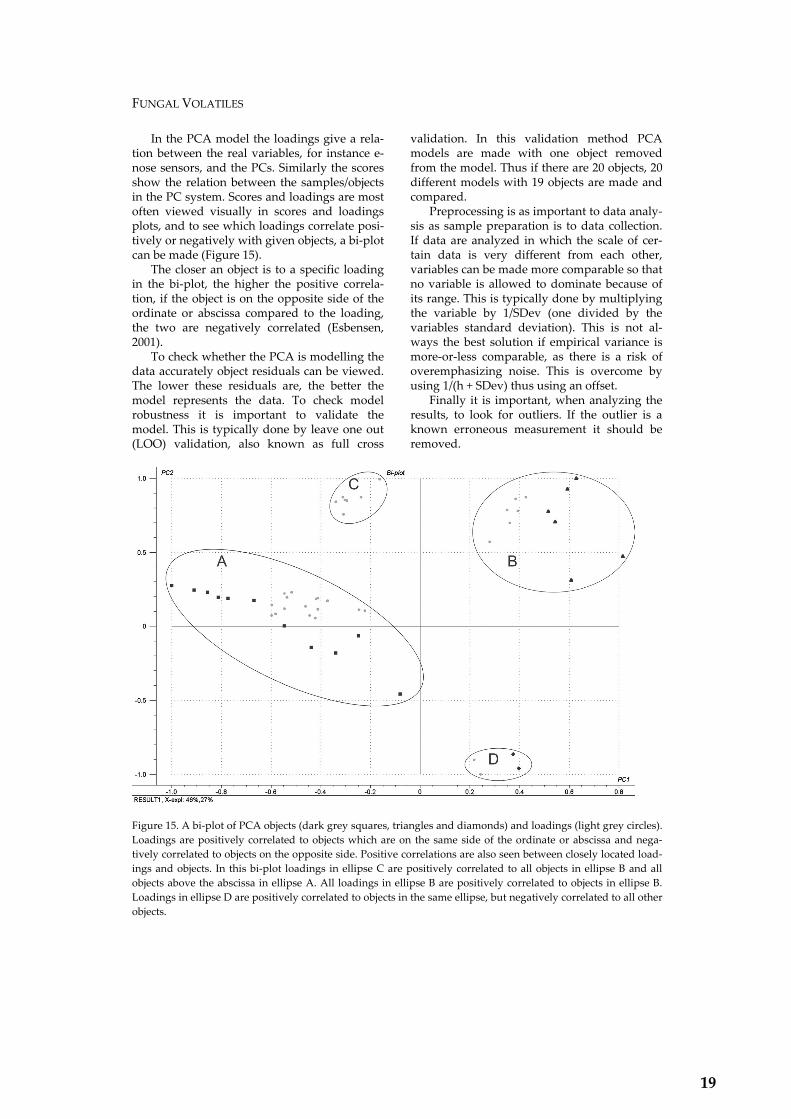
FUNGAL VOLATILES
In the PCA model the loadings give a rela-tion between the real variables, for instance e-nose sensors, and the PCs. Similarly the scores show the relation between the samples/objects in the PC system. Scores and loadings are most often viewed visually in scores and loadings plots, and to see which loadings correlate posi-tively or negatively with given objects, a bi-plot can be made (Figure 15). The closer an object is to a specific loading in the bi-plot, the higher the positive correla-tion, if the object is on the opposite side of the ordinate or abscissa compared to the loading, the two are negatively correlated (Esbensen, 2001). To check whether the PCA is modelling the data accurately object residuals can be viewed. The lower these residuals are, the better the model represents the data. To check model robustness it is important to validate the model. This is typically done by leave one out (LOO) validation, also known as full cross
validation. In this validation method PCA models are made with one object removed from the model. Thus if there are 20 objects, 20 different models with 19 objects are made and compared. Preprocessing is as important to data analy-sis as sample preparation is to data collection. If data are analyzed in which the scale of cer-tain data is very different from each other, variables can be made more comparable so that no variable is allowed to dominate because of its range. This is typically done by multiplying the variable by 1/SDev (one divided by the variables standard deviation). This is not al-ways the best solution if empirical variance is more-or-less comparable, as there is a risk of overemphasizing noise. This is overcome by using 1/(h + SDev) thus using an offset. Finally it is important, when analyzing the results, to look for outliers. If the outlier is a known erroneous measurement it should be removed.
Figure 15. A bi-plot of PCA objects (dark grey squares, triangles and diamonds) and loadings (light grey circles). Loadings are positively correlated to objects which are on the same side of the ordinate or abscissa and nega-tively correlated to objects on the opposite side. Positive correlations are also seen between closely located load-ings and objects. In this bi-plot loadings in ellipse C are positively correlated to all objects in ellipse B and all objects above the abscissa in ellipse A. All loadings in ellipse B are positively correlated to objects in ellipse B. Loadings in ellipse D are positively correlated to objects in the same ellipse, but negatively correlated to all other objects.
19

KARLSHØJ ET AL.
X T
W
Y U
Q
The influence plot can be used to check whether a sample has a high residual (poorly fitted by the model), a high leverage (high influence on the model) or both (Esbensen, 2001). Principal Component Regression & Partial Least Squares Regression These chemometric methods are used when prediction is desired. It is used to predict the value of Y, the dependent variable, (for in-stance the level of a given volatile component) from an X matrix, the independent variable, of measurements (for instance e-nose measure-ments) by regression. Construction of the pre-diction model is divided into calibration and validation. In the calibration step known X and Y values, measured in the way that is going to be used in future measurements, and which are representative for the future X measurements are used to construct the prediction model. Validation is then performed with a (or sev-eral) test set to ensure the prediction ability of the model. The test sets are important, and the use of multiple test sets for validation is ad-vised. It is important that test sets used differ from one another (Esbensen, 2001). In Principal component regression (PCR) the prediction model is made by multi-linear regression of Y on a PCA model of X. An approximated view of partial least squares regression (PLS) is that the PLS predic-tion model is constructed by multi-linear re-gression of a PCA model of Y on a PCA model of X Figure 16. PLS prediction model is construction. The PCA done on X is based on a starting point score vector obtained from Y (u1) thus obtaining the �load-ing-weight� vector w which in turn is used to calcu-late the vector t. The PCA done on Y is based on t being the starting point score vector instead of vector u yielding the vector q. Multi-linear regression of the PCA model of Y on the PCA model of X is then performed yielding the PLS model (Esbensen, 2001).
This is not completely the case, as the PCA done on X is based on a starting point score vector obtained from Y and the later PCA done on Y is based on a starting point score vector obtained from the PCA on X (Figure 16). This is done to reduce the influence of large X values that do not correlate with Y (Esbensen, 2001). Soft Independent Modelling of Class Analogy For classification purposes, soft independent modelling of class analogy (SIMCA) is used. The classification model is usually based on individual PCA models of the classes. Con-struction of the classification model is a two step process consisting of training and classifi-cation. The model is trained by construction of the PCA models consisting of each class. If the classes are known, the classification is a super-vised classification (Esbensen, 2001). During the actual classification the models constructed in training are used to predict whether a new, unknown sample, belongs to any (several) of the classes described by the SIMCA model (Esbensen, 2001). Neural Networks Neural networks (NNs), or more accurately artificial neural networks, consist of an inter-connected group of artificial neurons through which information is processed through a mathematical or computational model. This means that NNs are non-linear statistical data modelling tools with which for instance pat-terns in data can be found (Gurney, 1997). When using NNs for data analysis the NN has to learn how to interpret data. The typical way of teaching the NN to interpret data, for classi-fication or prediction modelling, is to do su-pervised learning. This is done by feeding the NN data pairs of input data (x) and output data (y) with which the NN will seek to find the function that matches the examples. This is typically done by trying to minimize the mean-squared error between the NNs output value and the target output value (y) (Gurney, 1997). When using the learning algorithm it is impor-tant to make sure that the NN does not over-fit the training data and thus fails to find the true statistical process which generates the data.
20
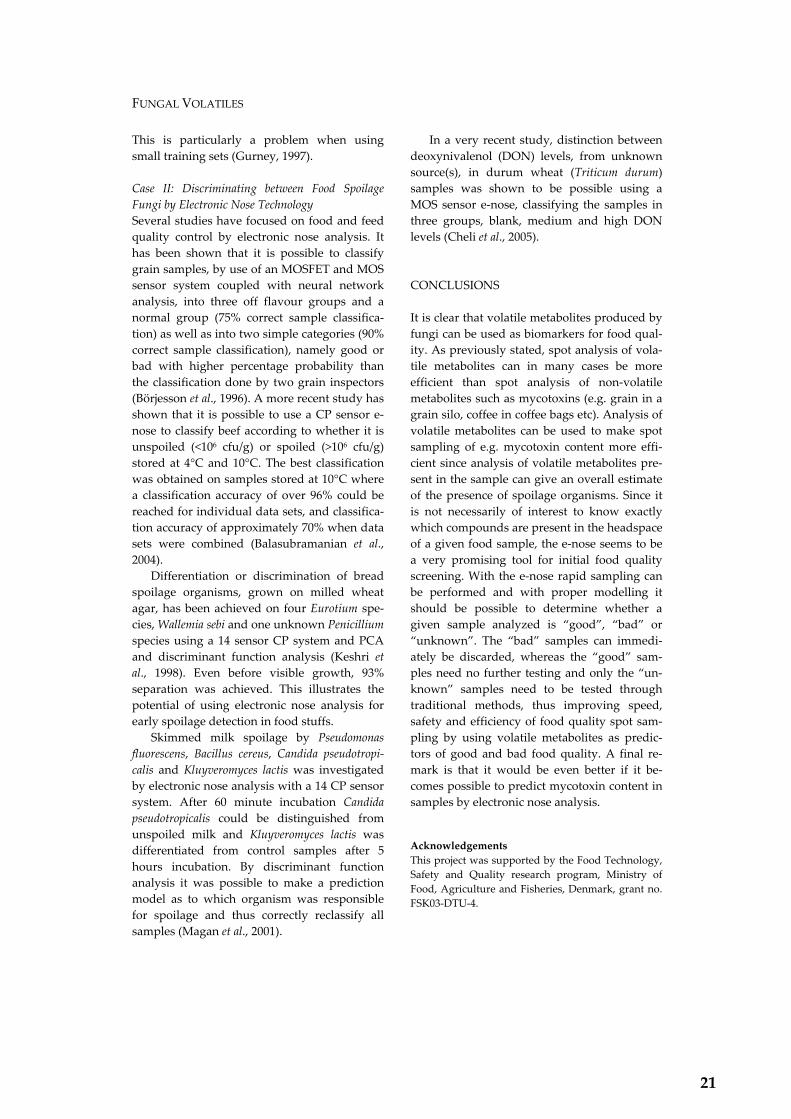
FUNGAL VOLATILES
This is particularly a problem when using small training sets (Gurney, 1997). Case II: Discriminating between Food Spoilage Fungi by Electronic Nose Technology Several studies have focused on food and feed quality control by electronic nose analysis. It has been shown that it is possible to classify grain samples, by use of an MOSFET and MOS sensor system coupled with neural network analysis, into three off flavour groups and a normal group (75% correct sample classifica-tion) as well as into two simple categories (90% correct sample classification), namely good or bad with higher percentage probability than the classification done by two grain inspectors (Börjesson et al., 1996). A more recent study has shown that it is possible to use a CP sensor e-nose to classify beef according to whether it is unspoiled (<106 cfu/g) or spoiled (>106 cfu/g) stored at 4°C and 10°C. The best classification was obtained on samples stored at 10°C where a classification accuracy of over 96% could be reached for individual data sets, and classifica-tion accuracy of approximately 70% when data sets were combined (Balasubramanian et al., 2004). Differentiation or discrimination of bread spoilage organisms, grown on milled wheat agar, has been achieved on four Eurotium spe-cies, Wallemia sebi and one unknown Penicillium species using a 14 sensor CP system and PCA and discriminant function analysis (Keshri et al., 1998). Even before visible growth, 93% separation was achieved. This illustrates the potential of using electronic nose analysis for early spoilage detection in food stuffs. Skimmed milk spoilage by Pseudomonas fluorescens, Bacillus cereus, Candida pseudotropi-calis and Kluyveromyces lactis was investigated by electronic nose analysis with a 14 CP sensor system. After 60 minute incubation Candida pseudotropicalis could be distinguished from unspoiled milk and Kluyveromyces lactis was differentiated from control samples after 5 hours incubation. By discriminant function analysis it was possible to make a prediction model as to which organism was responsible for spoilage and thus correctly reclassify all samples (Magan et al., 2001).
In a very recent study, distinction between deoxynivalenol (DON) levels, from unknown source(s), in durum wheat (Triticum durum) samples was shown to be possible using a MOS sensor e-nose, classifying the samples in three groups, blank, medium and high DON levels (Cheli et al., 2005). CONCLUSIONS It is clear that volatile metabolites produced by fungi can be used as biomarkers for food qual-ity. As previously stated, spot analysis of vola-tile metabolites can in many cases be more efficient than spot analysis of non-volatile metabolites such as mycotoxins (e.g. grain in a grain silo, coffee in coffee bags etc). Analysis of volatile metabolites can be used to make spot sampling of e.g. mycotoxin content more effi-cient since analysis of volatile metabolites pre-sent in the sample can give an overall estimate of the presence of spoilage organisms. Since it is not necessarily of interest to know exactly which compounds are present in the headspace of a given food sample, the e-nose seems to be a very promising tool for initial food quality screening. With the e-nose rapid sampling can be performed and with proper modelling it should be possible to determine whether a given sample analyzed is �good�, �bad� or �unknown�. The �bad� samples can immedi-ately be discarded, whereas the �good� sam-ples need no further testing and only the �un-known� samples need to be tested through traditional methods, thus improving speed, safety and efficiency of food quality spot sam-pling by using volatile metabolites as predic-tors of good and bad food quality. A final re-mark is that it would be even better if it be-comes possible to predict mycotoxin content in samples by electronic nose analysis. Acknowledgements This project was supported by the Food Technology, Safety and Quality research program, Ministry of Food, Agriculture and Fisheries, Denmark, grant no. FSK03-DTU-4.
21

KARLSHØJ ET AL.
REFERENCES Albert, K. J., Lewis, N. S., Schauer, C. L., Sotzing, G.
A., Stitzel, S. E., Vaid, T. P., and Walt, D. R. (2000). Cross-reactive chemical sensor arrays. Chemical Reviews 100:2595-2626.
Amrani, M. E. H., Persaud, K. C., and Payne, P. A. (1995). High-frequency measurements of con-ducting polymers: development of a new tech-nique for sensing volatile chemicals. Measure-ment Science and Technology 6:1500-1507.
Balasubramanian, S., Panigrahi, S., Logue, C. M., Marchello, M., Doetkott, C., Gu, H., Sherwood, J., and Nolan, L. (2004). Spoilage identification of beef using an electronic nose system. Transac-tions of the American Society of Agricultural En-gineers 47:1625-1633.
Bartlett, P. N., Archer, P. B. M., and Ling-Chung, S. K. (1989). Conducting polymer gas sensors Part I: Fabrication and characterisation. Sensors and Ac-tuators 19:125-140.
Bartlett, P. N., and Gardner, J. W. (1992). Odour sensors for an electronic nose In Sensors and sen-sory systems for an electronic nose (Gardner, J. W. and Bartlett, P. N., ed.), Proceedings of the NATO advanced research workshop, Reykjavik 1991. Kluwer, Dordrecht, pp 31-51.
Bergveld, P. (1985). Impact of MOSFET-based sen-sors. Sensors and Actuators 8:109-127.
Berna, A. Z., Lammertyn, J., Saevels, S., Natale, C. D., and Nicolai, B. M. (2004). Electronic nose systems to study shelf life and cultivar effect on tomato aroma profile. Sensors and Actuators B: Chemi-cal 97:324-333.
Berry, D. R. (1988). Physiology of industrial fungi. Blackwell Scientific Publications, Oxford, pp 1-285.
Börjesson, T. (1993). Volatile fungal metabolites as indicators of mould growth in stored cereals, Doctoral thesis at the Department of Microbiol-ogy, Uppsala Genetic Center, Swedish University of Agricultural Sciences, ISBN: 91-576-4706-2.
Börjesson, T., Eklöv, T., Jonsson, A., Sundgren, H., and Schnürer, J. (1996). Electronic nose for odor classification of grains. Cereal Chemistry 73:457-461.
Börjesson, T., Stöllman, U., and Schnürer, J. (1992). Volatile metabolites produced by six fungal spe-cies compared with other indicators of fungal growth on cereal grains. Applied and Environ-mental Microbiology 58:2599-2605.
Brezmes, J., López Fructuoso, M. L., Llobet, E., Vila-nova, X., Recasens, I., Orts, J., Saiz, G., and Cor-reig, X. (2005). Evaluation of an electronic nose to assess fruit ripeness. IEEE Sensors Journal 5:97-108.
Cahagnier, B., Richard-Molard, D., and Poisson, J. (1983). Èvolution de la teneur en ergostérol des grains au cours de la conservation, une possibili-té d'évaluation quantitative et rapide de leur my-coflore. Sciences des Aliments 3:219-244.
Caliendo, C., and Verona, E. (1992). Surface acoustic wave (SAW) gas sensor In Gas Sensors (Sberve-glieri, G., ed.), Kluwer Academic Publishers, Dordrecht, pp 281-306.
Cheli, F., Dell'Orto, V., Pinotti, L., Campagnoli, A., and Tognon, G. (2005). Implementation of the electronic nose for the identification of mycotox-ins in durum wheat (Triticum durum). Veterinary Research Communications 29:391-393.
Chitarra, G. S., Abee, T., Rombouts, F. M., and Dijksterhuis, J. (2005). 1-Octen-3-ol inhibits co-nidia germination of Penicillium paneum despite of mild effects on membrane permeability, respi-ration, intracellular pH, and changes the protein composition. FEMS Microbiology Ecology 54:67-75.
Chitarra, G. S., Abee, T., Rombouts, F. M., Posthu-mus, M. A., and Dijksterhuis, J. (2004). Germina-tion of Penicillium paneum conidia is regulated by 1-octen-3-ol, a volatile self-inhibitor. Applied and Environmental Microbiology 70:2823-2829.
Demarigny, Y., Berger, C., Desmasures, N., Gueguen, M., and Spinnler, H. E. (2000). Flavour sulphides are produced from methionine by two different pathways by Geotrichum candidum. Journal of Dairy Research 67:371-380.
Demarne, V. and Sanjinés, R. (1992). Thin film semi-conducting metal oxide gas sensors In Gas Sen-sors (Sberveglieri, G.,ed.), Kluwer Academic Publishers, Dordrecht, pp 89-116.
Demyttenaere, J. C. R., Adams, A., Belleghem, K. van, De Kimpe, N., König, W. A., and Tkachev, A. V. (2001). De novo production of (+)-aristolochene by sporulated surface cultures of Penicillium roqueforti. Phytochemistry 59:597-602.
Demyttenaere, J. C. R., Moriña, R. M., De Kimpe, N., and Sandra, P. (2004). Use of headspace solid-phase microextraction and headspace sorptive extraction for the detection of the volatile me-tabolites produced by toxigenic Fusarium spe-cies. Journal of Chromatography A 1027:147-154.
Dickinson, T. A., Walt, D. R., White, J., and Kauer, J. S. (1997). Generating sensor diversity through combinatorial polymer synthesis. Analytical Chemistry 69:3413-3418.
Doleman, B. J., Severin, E. J., and Lewis, N. S. (1998). Trends in odor intensity for human and elec-tronic noses: relative roles of odorant vapor pres-sure vs. molecularly specific odorant binding. Proceedings of the National Academy of Sciences of the USA 95:5442-5447.
22

FUNGAL VOLATILES
Esbensen, K. H. (2001). Multivariate data analysis -In practice. CAMO AS, Oslo, pp 1-598.
Filtenborg, O., Frisvad, J. C., and Thrane, U. (1996). Moulds in food spoilage. International Journal of Food Microbiology 33:85-102.
Fischer, G., Schwalbe, R., Möller, M., Ostrowski, R., and Dott, W. (1999). Species-specific production of microbial volatile organic compounds (MVOC) by airborne fungi from a compost facil-ity. Chemosphere 39:795-810.
García-González, D. L., Barie, N., Rapp, M., and Aparicio, R. (2004). Analysis of virgin olive oil volatiles by a novel electronic nose based on a miniaturized SAW sensor array coupled with SPME enhanced headspace enrichment. Journal of Agricultural and Food Chemistry 52:7475-7479.
Gardner, J. W. and Bartlett, P. N. (1999). Electronic nose principles and applications. Oxford Univer-sity Press, Oxford, pp 1-264.
Grob, K. (1993). Split and splitless injection in capil-lary gas chromatography. Hüthig, Heidelberg, pp 1-547.
Guernion, N., Ratcliffe, N. M., Spencer-Phillips, P. T. N., and Howe, R. (2001). Identifying bacteria in human urine: Current practice and the potential for rapid, near-patient diagnosis by sensing vola-tile organic compounds. Clinical Chemistry and Laboratory Medicine 39:893-906.
Guilbault, G. and Jordan, J. M. (1988). Analytical uses of piezoelectric crystal: a review. Critical Re-views in Analytical Chemistry 19:1-28.
Gurney, K. (1997). An introduction to neural net-works. University College London, London, pp. 1-248.
Hamm, S., Lesellier, E., Bleton, J., and Tchapla, A. (2003). Optimization of headspace solid phase microextraction for gas chromatography/mass spectrometry analysis of widely different volatil-ity and polarity terpenoids in olibanum. Journal of Chromatography A 1018:73-83.
Hawke, J. C. (1966). Reviews of the progress of dairy science. Section D. Dairy chemistry. The forma-tion and metabolism of methyl ketones and re-lated compounds. Journal of Dairy Research 33:225-243.
Herbert, R. B. (1989). The biosynthesis of secondary metabolites. St Edmundsbury Press Ltd, Bury St Edmunds, pp 1-231.
Hodgins, D. (1997). Techniques for analyzing food aroma. Marcel Dekker Inc., New York, pp 331-371.
Holmberg, M. (1997). Data evaluation for an elec-tronic nose. Doctoral thesis at the Department of Physics and Measurement Technology, Linköping University, ISBN: 91-7871-913-5.
Jelén, H. H., Mirocha, C. J., Wasowicz, E., and Kaminski, E. (1995). Production of volatile ses-quiterpenes by Fusarium sambucinum strains with different abilities to synthesize trichothecenes. Applied and Environmental Microbiology 61:3815-3820.
Jelén, H. H., and Wasowicz, E. (1998). Volatile fungal metabolites and their relation to the spoilage of agricultural commodities. Food Reviews Interna-tional 14:391-426.
Karahadian, C., Josephson, D. B., and Lindsay, R. C. (1985). Contribution of Penicillium sp. to the fla-vour of Brie and Camembert cheese. Journal of Dairy Science 68:1865-1877.
Karlshøj, K., and Larsen, T. O. (2005). Differentiation of species from the Penicillium roqueforti group by volatile metabolite profiling. Journal of Agricul-tural and Food Chemistry 53:708-715.
Kempler, G. M. (1983). Production of flavour com-pounds by microorganisms. Advances in Ap-plied Microbiology 29:29-51.
Keshri, G., Magan, N., and Voysey, P. (1998). Use of an electronic nose for the early detection and dif-ferentiation between spoilage fungi. Letters in Applied Microbiology 27:261-264.
Kinderlerer, J. (1989). Volatile metabolites of filamen-tous fungi and their role in food flavour In Jour-nal of Applied Bacteriology Symposium Sup-plement pp. 133S-144S.
King, W. H. (1964). Piezoelectric sorption detector. Analytical Chemistry 36:1735-1739.
Kinsella, J. E., and Hwang, D. H. (1976). Enzymes of Penicillium roqueforti involved in the biosynthesis of cheese flavour. Critical Reviews in Food Sci-ence and Nutrition 8:191-228.
Kohl, D. (1992). Fundamentals and recent develop-ments of homogeneous semiconducting sensors In Sensors and sensory systems for an electronic nose (Gardner, J. W., and Bartlett, P. N., ed.), Proceedings of the NATO advanced research workshop, Reykjavik 1991, Kluwer, Dordrecht, pp 53-76.
Kohl, D. (2001). Function and applications of gas sensors. Journal of Physics D: Applied Physics 34:R125-R149.
König, W. A., Bölow, N., and Saritas, Y. (1999). Iden-tification of sesquiterpene hydrocarbons by gas phase analytical methods. Flavour and Fragrance Journal 14:367-378.
Larsen, T. O. (1994). Chemosystematics of species in genus Penicillium based on profiles of volatile metabolites. Doctoral thesis at the The Mycology Group, Department of Biotechnology, Technical University of Denmark, ISBN: 87-88584-03-8.
Larsen, T. O. (1997). Identification of cheese-associated fungi using selected ion monitoring of
23

KARLSHØJ ET AL.
volatile terpenes. Letters in Applied Microbiol-ogy 24:463-466.
Larsen, T. O., and Frisvad, J. C. (1995a). Characteriza-tion of volatile metabolites from 47 Penicillium-taxa. Mycological Research 99:1153-1166.
Larsen, T. O., and Frisvad, J. C. (1995b). Chemosys-tematics of Penicillium based on profiles of vola-tile metabolites. Mycological Research 99:1167-1174.
Larsen, T. O., Svendsen, A., and Smedsgaard, J. (2001). Biochemical characterization of ochra-toxin A-producing strains of the genus Penicil-lium. Applied and Environmental Microbiology 67:3630-3635.
Leete, E., Bjorklund, J. A., Reineccius, G. A., and Cheng, T. B. (1991). Biosynthesis of 3-isopropyl-2-methoxypyrazine and other alkylpyrazines: widely distributed flavour compounds. In Bio-formation of Flavours (Patterson, R. L. S., Charl-wood, B. V., MacLeod, G., and Williams, A. A., ed.), The Royal Society of Chemistry, Cambridge, pp 75-95.
Luckner, M. (1990). Secondary metabolism in micro-organisms, plants and animals. Springer-Verlag, Berlin, pp. 1-549.
Lundström, I., Hedborg, E., Spetz, A., Sundgren, H., and Winquist , F. (1992). Electronic noses based on field effect structures In Sensors and sensory systems for an electronic nose (Gardner, J. W. and Bartlett, P. N., ed.), Proceedings of the NATO advanced research workshop, Reykjavik 1991, Kluwer, Dordrecht, pp 303-319.
Lundström, I., Shivaraman, S., Svensson, C., and Lundkvist, L. (1975). A hydrogen-sensitive MOS field-effect transistor. Applied Physics Letters 26:55-57.
Lundström, I., Spetz, A., Winquist, F., Ackelid, U., and Sundgren, H. (1990). Catalytic metals and field-effect devices. A useful combination. Sen-sors and Actuators B: Chemical B1:15-20.
Lundström, I., Svensson, C., Spetz, A., Sundgren, H., and Winquist, F. (1993). From hydrogen sensors to olfactory images - twenty years with catalytic field-effect devices. Sensors and Actuators, B: Chemical B13:16-23.
Lynen, F. (1959). New aspects of acetate incorpora-tion into isoprenoid precursors In Biosynthesis of terpenes and sterols (Wolstenholme, G. E. W., and O'Conner, M., ed.), J. and A. Churchill Ltd., London, pp 95-116.
Magan, N., Pavlou, A., and Chrysanthakis, I. (2001). Milk-sense: a volatile sensing system recognises spoilage bacteria and yeasts in milk. Sensors and Actuators B: Chemical 72:28-34.
Marrazzo, W. N., Heinemann, P. H., Crassweller, R. E., and LeBlanc, E. (2005). Electronic nose chemi-
cal sensor feasibility study for the differentiation of apple cultivars. Transactions of the American Society of Agricultural Engineers 48:1995-2002.
Martin, S. J., Schwartz, S. K., Gunshor, R. L., and Pierret, R. F. (1983). Surface acoustic wave reso-nators on a ZnO-on-Si layered medium. Journal of Applied Physics 54:561-569.
Martin, S. J., Schweizer, K. S., Ricco, A. J., and Zip-perian, T. E. (1985). In Gas sensing with surface acoustic wave devices. Transducers '85: 1985, In-ternational Conference on Solid-State Sensors and Actuators - Digest of Technical Papers, pp 71-73.
Martin, S. J., Schweizer, K. S., Schwartz, S. K., and Gunshor, R. L. (1984). Vapor sensing by means of a ZnO-on-Si surface acoustic wave resonator. In Proceeding IEEE Ultrasonics Symposium, Dallas, pp. 207-212.
Maul, F., Sargent, S. A., Sims, C. A., Baldwin, E. A., Balaban, M. O., and Huber, D. J. (2000). Tomato flavour and aroma quality as affected by storage temperature. Journal of Food Science 65:1228-1237.
Medsker, L., Jenkins, L. D., Thomas, J. F., and Kock, C. (1969). Odorous compounds in natural waters. 2-Exo-hydroxy-2-methyl-boran, the major com-pound produced by several actinomycetes. Envi-ronmental Science and Technology 3:476-477.
Mielle, P. (1996). "Electronic noses": Towards objec-tive instrumental characterization of food aroma. Trends in Food Science and Technology 7:432-438.
Morrison, S. R. (1987). Selectivity in semiconductor gas sensors. Sensors and Actuators 12:425-440.
Müller, R., and Lange, E. (1986). Multidimensional sensor for gas analysis. Sensors and Actuators 9:39-48.
Nielsen, K. F., Smedsgaard, J., Larsen, T. O., Lund, F., Thrane, U., and Frisvad, J. C. (2003). Chemical identification of fungi: Metabolite profiling and metabolomics In Fungal Biotechnology in Agri-cultural, Food, and Environmental Applications (Arora, D. K., ed.), Marcel Dekker, Inc., New York, pp 19-35.
Nieuwenhuizen, M. S., and Nederlof, A. J. (1992). Silicon based surface acoustic wave gas sensors In Sensors and sensory systems for an electronic nose (Gardner, J. W., and Bartlett, P. N., ed.), Pro-ceedings of the NATO advanced research work-shop, Reykjavik 1991, Kluwer, Dordrecht, pp 131-145.
Partridge, A. C., Harris, P., and Andrews, M. K. (1996). High sensitivity conducting polymer sen-sors. Analyst 121:1349-1353.
Pasanen, A. L., Lappalainen, S., and Pasanen, P. (1996). Volatile organic metabolites associated
24

FUNGAL VOLATILES
with some toxic fungi and their mycotoxins. Analyst 121:1949-1954.
Pearce, T. C. (1997). Computational parallels between the biological olfactory pathway and its analogue `The Electronic Nose': : Part I. Biological olfac-tion. Biosystems 41:43-67.
Pelosi, P. and Persaud, K. (1988). Sensors and sensory systems for advanced robots. Springer-Verlag, Berlin, pp 361-381.
Persaud, K., and Dodd, G. (1982). Analysis of dis-crimination mechanisms in the mammalian olfac-tory system using a model nose. Nature 299:352-355.
Pitt, J. I., and Hocking, A. D. (1985). Fungi and food spoilage. Academic Press, Sydney, pp. 1-413.
Pohland, A. E. (1993). Mycotoxins in review. Food Additives and Contaminants 10:17-28.
Ramaswami, S. K., Briscese, P., Gargiullo, R. J., and von Geldern, T. (1988). Sesquiterpene hydrocar-bons: from mass confusion to orderly line-up. In Flavours and Fragrances: A World Perspec-tive.Proceedings of the 10th International Con-gress of Essential Oils, Fragrances and Flavours, Washington, DC, U.S.A., 16-20 November 1986, pp 951-980.
Richards, J. H., and Hendrickson, J. B. (1964). The biosynthesis of steroids, terpenes and acetogen-ins. W.A.Benjamin, Inc., New York, pp 1-416.
Rye, G. G., and Mercer, D. G. (2003). Changes in headspace volatile attributes of apple cider re-sulting from thermal processing and storage. Food Research International 36:167-174.
Samson, R. A., Hoekstra, E. S., Frisvad, J. C., and Filtenborg, O. (2002). Introduction to food- and airborne fungi. Centraalbureau voor Schimmel-cultures, Utrecht, pp 1-389.
Schaller, E., Bosset, J. O., and Escher, F. (1998). "Elec-tronic Noses" and their application to food. Food Science and Technology 31:305-316.
Severin, E. J., Sanner, R. D., Doleman, B. J., and Lewis, N. S. (1998). Differential detection of en-antiomeric gaseous analytes using carbon black-chiral polymer composite, chemically sensitive resistors. Analytical Chemistry 70:1440-1443.
Shiers, V. P. (1995). Electronic nose technology - evaluations and developments for the food in-dustry In: Food Ingredients Europe: Conference Proceedings. Pp 198-200.
Shimizu, Y., and Egashira, M. (1999). Basic aspects and challenges of semiconductor gas sensors. MRS Bulletin 24:18-24.
Sim, C. O., Ahmad, M. N., Ismail, Z., Othman, A. R., Noor, N. A. M., and Zaihidee, E. M. (2003). Chemometric classification of herb - Orthosiphon stamineus according to its geographical origin us-
ing virtual chemical sensor based upon fast GC. Sensors 458-471.
Skoog, D. A., West, D. M., and Holler, F. J. (1996). Fundamentals of analytical chemistry interna-tional edition. Saunders College Publishing, New York, pp 1-870.
Spetz, A., Winquist , F., Sundgren, H., and Lund-ström, I. (1992). Field effect gas sensors In Gas Sensors (Sberveglieri, G., ed.), Kluwer Academic Publishers, Dordrecht, pp 219-279.
Strike, D. J., Meijerink, M. G. H., and Koudelka-Hep, M. (1999). Electronic noses - A mini-review. Fre-senius' Journal of Analytical Chemistry 364:499-505.
Sundgren, H., Lundström, I., Winquist, F., Lukkari, I., Carlsson, R., and Wold, S. (1990). Evaluation of a multiple gas mixture with a simple MOSFET gas sensor array and pattern recognition. Sensors and Actuators, B: Chemical B2:115-123.
Suomalainen, H. (1971). Yeast and its effect on the flavour of alcoholic beverages. Journal of the In-stitute of Brewing 77:164-177.
Trihaas, J., and Nielsen, P. V. (2005). Electronic nose technology in quality assessment: monitoring the ripening process of Danish blue cheese. Journal of Food Science 70:44-49.
Trihaas, J., Nielsen, P. V., and van den Tempel, T. (2005a). Electronic nose technology in quality as-sessment. Predicting the volatile composition of Danish blue cheese. Journal of Food Science 70:392-400.
Trihaas, J., Vognsen, L., and Nielsen, P. V. (2005b). Electronic nose: New tool in modelling the ripen-ing of Danish blue cheese. International Dairy Journal 15:679-691.
Vinaixa, M., Marin, S., Brezmes, J., Llobet, E., Vila-nova, X., Correig, X., Ramos, A., and Sanchis, V. (2004). Early detection of fungal growth in bak-ery products by use of an electronic nose based on mass spectrometry. Journal of Agricultural and Food Chemistry 52:6068-6074.
Waller, J. M., and Brayford, D. (1990). Fusarium dis-eases in the tropics. Tropical Pest Management 36:181-194.
Walt, D. R., Dickinson, T., White, J., Kauer, J., John-son, S., Engelhardt, H., Sutter, J., and Jurs, P. (1998). Optical sensor arrays for odor recogni-tion. Biosensors and Bioelectronics 13:697-699.
Watson, J. and Yates, R. A. (1985). A solid-state gas sensor. Electronic Engineering 57:47-57.
Werlein, H. D. (2001). Discrimination of chocolates and packaging materials by an electronic nose. European Food Research and Technology 212:529-533.
25

KARLSHØJ ET AL.
Wilson, K. and Walker, J. (1994). Principles and techniques of practical biochemistry. Cambridge University Press, Cambridge, pp. 1-586.
Winquist, F., Sundgren, H., Hedborg, E., Spetz, A., and Lundström, I. (1992). Visual images of gas mixtures produced with field-effect structures. Sensors and Actuators, B: Chemical B6:157-161.
Wohltjen, H. and Dessy, R. (1979a). Surface acoustic wave probe for chemical analysis I. Introduction and instrument description. Analytical Chemis-try 51:1458-1465.
Wohltjen, H. and Dessy, R. (1979b). Surface acoustic wave probe for chemical analysis II. Gas chroma-tography detector. Analytical Chemistry 51:1465-1470.
Wohltjen, H. and Dessy, R. (1979c). Surface acoustic wave probe for chemical analysis III. Thermome-chanical polymer analyzer. Analytical Chemistry 51:1470-1478.
Wünsche, L. F., Vuilleumier, C., Keller, U., Byfield, M. P., May, I. P., and Kearney, M. J. (1995). Scent characterisation: from human perception to elec-tronic nose In Proceedings of the 13th Interna-tional Congress of Flavours, Fragrances and Es-
sential Oils, 15-19 October 1995, Istanbul, Turkey, pp. 295-313.
Wurzenberger, M. and Grosch, W. (1982). The enzy-matic oxidative breakdown of linoleic acid in mushrooms (Psalliota bispora). Zeitschrift für Le-bensmittel-Untersuchung und -Forschung 175:186-190.
Wurzenberger, M. and Grosch, W. (1984). Origin of the oxygen in the products of the enzymatic cleavage reaction of linoleic acid to 1-octen-3-ol and 10-oxo-trans-8-decenoic acid in mushrooms (Psalliota bispora). Biochemica et Biophysica Acta 794:18-24.
Zeringue, H. J., Jr., Bhatnagar, D., and Cleveland, T. E. (1993). C15H24 volatile compounds unique to aflatoxigenic strains of Aspergillus flavus. Applied and Environmental Microbiology 59:2264-2270.
Zondervan, C., Muresan, S., Jonge, H. G., Velzen, E. U. T., Wilkinson, C., Nijhuis, H. H., and Leguijt, T. (1999). Controlling Maillard reactions in the heating process of blockmilk using an electronic nose. Journal of Agricultural and Food Chemis-try 47:4746-4749.
26

PAPER 1
Karlshøj, K. & Larsen, T.O. Differentiation of Species from the Penicillium roqueforti Group by Volatile Metabolite Profiling. J. Agric. Food Chem. 2005, 53, 708‐715.
27

28
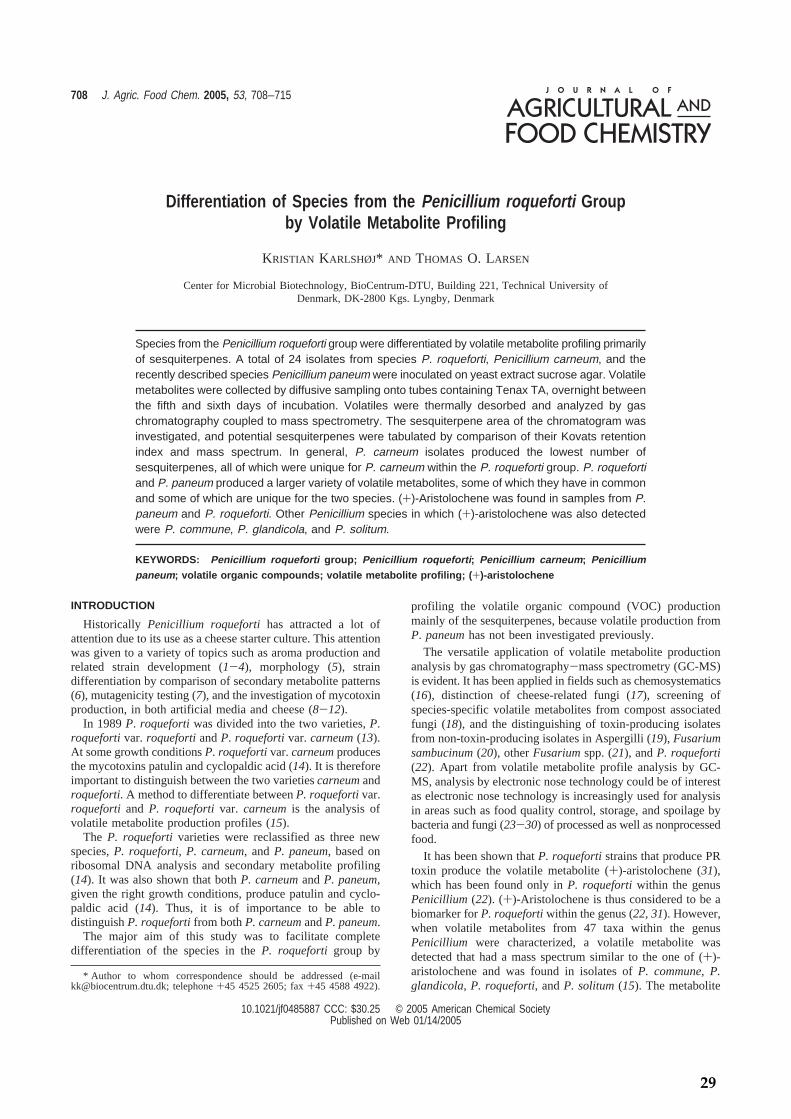
Differentiation of Species from the Penicillium roqueforti Groupby Volatile Metabolite Profiling
KRISTIAN KARLSHØJ* AND THOMAS O. LARSEN
Center for Microbial Biotechnology, BioCentrum-DTU, Building 221, Technical University ofDenmark, DK-2800 Kgs. Lyngby, Denmark
Species from the Penicillium roqueforti group were differentiated by volatile metabolite profiling primarilyof sesquiterpenes. A total of 24 isolates from species P. roqueforti, Penicillium carneum, and therecently described species Penicillium paneum were inoculated on yeast extract sucrose agar. Volatilemetabolites were collected by diffusive sampling onto tubes containing Tenax TA, overnight betweenthe fifth and sixth days of incubation. Volatiles were thermally desorbed and analyzed by gaschromatography coupled to mass spectrometry. The sesquiterpene area of the chromatogram wasinvestigated, and potential sesquiterpenes were tabulated by comparison of their Kovats retentionindex and mass spectrum. In general, P. carneum isolates produced the lowest number ofsesquiterpenes, all of which were unique for P. carneum within the P. roqueforti group. P. roquefortiand P. paneum produced a larger variety of volatile metabolites, some of which they have in commonand some of which are unique for the two species. (+)-Aristolochene was found in samples from P.paneum and P. roqueforti. Other Penicillium species in which (+)-aristolochene was also detectedwere P. commune, P. glandicola, and P. solitum.
KEYWORDS: Penicillium roqueforti group; Penicillium roqueforti; Penicillium carneum; Penicilliumpaneum; volatile organic compounds; volatile metabolite profiling; (+)-aristolochene
INTRODUCTION
Historically Penicillium roqueforti has attracted a lot ofattention due to its use as a cheese starter culture. This attentionwas given to a variety of topics such as aroma production andrelated strain development (1-4), morphology (5), straindifferentiation by comparison of secondary metabolite patterns(6), mutagenicity testing (7), and the investigation of mycotoxinproduction, in both artificial media and cheese (8-12).
In 1989 P. roqueforti was divided into the two varieties, P.roqueforti var. roqueforti and P. roqueforti var. carneum (13).At some growth conditions P. roqueforti var. carneum producesthe mycotoxins patulin and cyclopaldic acid (14). It is thereforeimportant to distinguish between the two varieties carneum androqueforti. A method to differentiate between P. roqueforti var.roqueforti and P. roqueforti var. carneum is the analysis ofvolatile metabolite production profiles (15).
The P. roqueforti varieties were reclassified as three newspecies, P. roqueforti, P. carneum, and P. paneum, based onribosomal DNA analysis and secondary metabolite profiling(14). It was also shown that both P. carneum and P. paneum,given the right growth conditions, produce patulin and cyclo-paldic acid (14). Thus, it is of importance to be able todistinguish P. roqueforti from both P. carneum and P. paneum.
The major aim of this study was to facilitate completedifferentiation of the species in the P. roqueforti group by
profiling the volatile organic compound (VOC) productionmainly of the sesquiterpenes, because volatile production fromP. paneum has not been investigated previously.
The versatile application of volatile metabolite productionanalysis by gas chromatography-mass spectrometry (GC-MS)is evident. It has been applied in fields such as chemosystematics(16), distinction of cheese-related fungi (17), screening ofspecies-specific volatile metabolites from compost associatedfungi (18), and the distinguishing of toxin-producing isolatesfrom non-toxin-producing isolates in Aspergilli (19), Fusariumsambucinum (20), other Fusarium spp. (21), and P. roqueforti(22). Apart from volatile metabolite profile analysis by GC-MS, analysis by electronic nose technology could be of interestas electronic nose technology is increasingly used for analysisin areas such as food quality control, storage, and spoilage bybacteria and fungi (23-30) of processed as well as nonprocessedfood.
It has been shown that P. roqueforti strains that produce PRtoxin produce the volatile metabolite (+)-aristolochene (31),which has been found only in P. roqueforti within the genusPenicillium (22). (+)-Aristolochene is thus considered to be abiomarker for P. roqueforti within the genus (22, 31). However,when volatile metabolites from 47 taxa within the genusPenicillium were characterized, a volatile metabolite wasdetected that had a mass spectrum similar to the one of (+)-aristolochene and was found in isolates of P. commune, P.glandicola, P. roqueforti, and P. solitum (15). The metabolite
* Author to whom correspondence should be addressed ([email protected]; telephone +45 4525 2605; fax +45 4588 4922).
708 J. Agric. Food Chem. 2005, 53, 708−715
10.1021/jf0485887 CCC: $30.25 © 2005 American Chemical SocietyPublished on Web 01/14/2005
29

Tabl
e1.
Vola
tile
Org
anic
Com
poun
dPr
ofile
sfo
rth
eP.
roqu
efor
tiG
roup
,RI1
340−
1800
a
P.ca
rneu
mP.
roqu
efor
tiP.
pane
um
com
pdR
I34
7468
8468
8568
8814
042
1947
867
5414
408
1441
214
420
1442
516
401
1640
316
404
1640
724
729
2474
811
839
1392
914
356
1640
224
721
2472
324
728
113
43X
XX
XX
XX
213
50X
XX
XX
XX
313
68X
XX
XX
XX
413
98X
XX
XX
XX
5b14
00X
XX
XX
XX
614
02X
XX
XX
X7b
1407
XX
XX
XX
814
14X
XX
XX
9b14
18X
XX
XX
XX
XX
XX
X10
1428
XX
XX
XX
XX
XX
XX
XX
XX
X11
b14
41X
XX
XX
XX
XX
1214
42X
XX
XX
X13
1461
XX
XX
XX
XX
XX
X14
b14
67X
XX
XX
XX
XX
XX
XX
XX
X15
b14
80X
XX
XX
XX
XX
XX
1614
85X
XX
XX
XX
1714
88X
XX
XX
XX
XX
1814
94X
XX
XX
XX
XX
X19
1494
XX
XX
XX
2014
98X
XX
XX
XX
2115
05X
XX
XX
2215
11X
XX
XX
X23
1514
XX
XX
XX
XX
XX
24b
1517
XX
XX
XX
2515
24X
XX
XX
XX
2615
27X
XX
27b
1532
XX
XX
XX
XX
XX
XX
XX
XX
X28
1535
XX
XX
X29
b15
40X
XX
XX
XX
XX
XX
XX
XX
3015
45X
XX
XX
XX
XX
XX
XX
X31
b15
47X
XX
XX
XX
XX
XX
XX
X32
b15
51X
XX
XX
XX
3315
67X
XX
X34
b15
72X
XX
XX
X35
1574
XX
XX
XX
XX
XX
XX
36b
1578
XX
XX
XX
3715
98X
XX
XX
XX
3816
37X
XX
XX
XX
3916
84X
XX
XX
XX
XX
X40
1686
XX
XX
XX
XX
XX
X41
1695
XX
XX
XX
XX
XX
X42
1702
XX
XX
XX
X43
1758
XX
X44
1773
XX
XX
4517
89X
XX
XX
4617
89X
X47
1790
X48
1800
XX
XX
XX
aAn
“X”
indi
cate
sth
atth
evo
latil
ew
asde
tect
edin
sam
ples
from
this
isol
ate.
For
com
poun
dsun
ique
for
asp
ecie
sw
ithin
the
grou
pth
e“X
”is
give
nin
bold
face
type
(X).
For
com
poun
dspr
oduc
edby
mor
eth
anon
eof
the
thre
esp
ecie
sth
e“X
”is
give
nin
italic
type
(X).
bC
ompo
und
5,�-
patc
houl
ene;
com
poun
d7,
zing
iber
ene;
com
poun
d9,
�-el
emen
e;co
mpo
und
11,
diep
i-R-c
edre
ne;
com
poun
d14
,�-
cary
ophy
llene
;co
mpo
und
15,
�-pa
tcho
ulen
eis
omer
;co
mpo
und
24,
geos
min
;com
poun
d27
,(+)
-aris
tolo
chen
e;co
mpo
unt2
9,er
emop
hile
ne;c
ompo
und
31,R
-sel
inen
e;co
mpo
und
32,v
alen
cene
;com
poun
d34
,�-b
isab
olen
e;co
mpo
und
36,�
-him
acha
lene
.
Differentiation of Species from the Penicillium roqueforti Group J. Agric. Food Chem., Vol. 53, No. 3, 2005 709
30
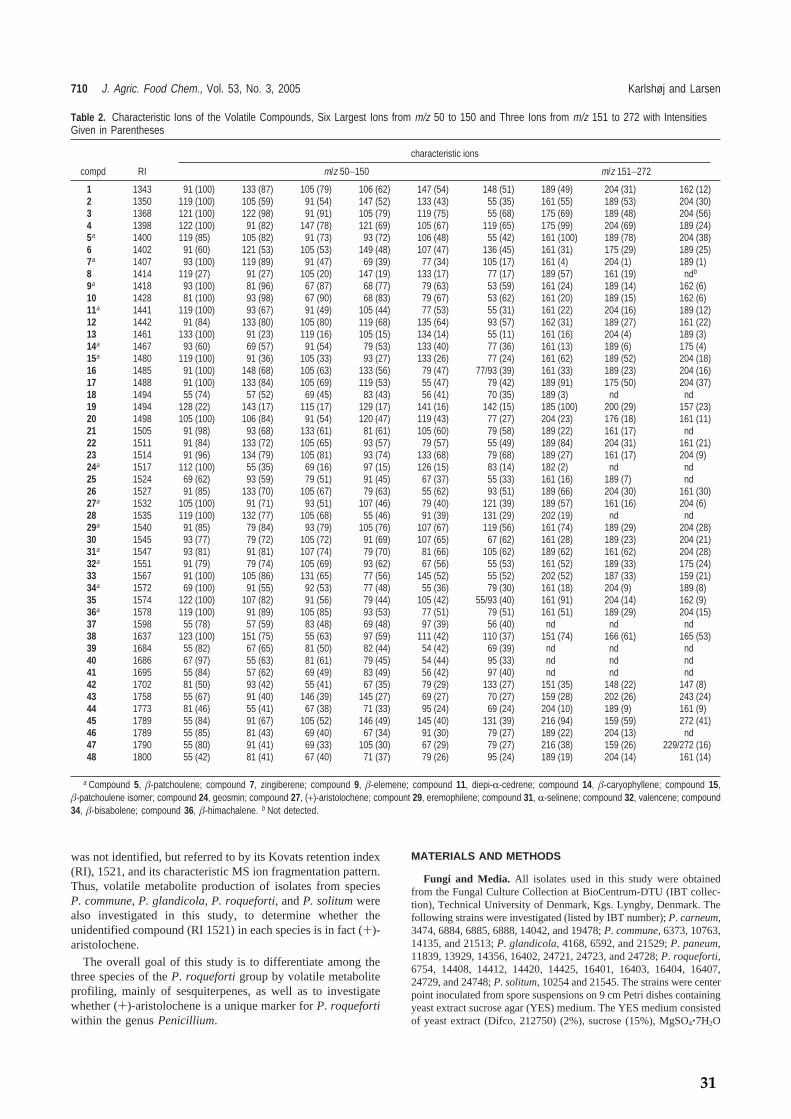
was not identified, but referred to by its Kovats retention index(RI), 1521, and its characteristic MS ion fragmentation pattern.Thus, volatile metabolite production of isolates from speciesP. commune, P. glandicola, P. roqueforti, and P. solitum werealso investigated in this study, to determine whether theunidentified compound (RI 1521) in each species is in fact (+)-aristolochene.
The overall goal of this study is to differentiate among thethree species of the P. roqueforti group by volatile metaboliteprofiling, mainly of sesquiterpenes, as well as to investigatewhether (+)-aristolochene is a unique marker for P. roquefortiwithin the genus Penicillium.
MATERIALS AND METHODS
Fungi and Media. All isolates used in this study were obtainedfrom the Fungal Culture Collection at BioCentrum-DTU (IBT collec-tion), Technical University of Denmark, Kgs. Lyngby, Denmark. Thefollowing strains were investigated (listed by IBT number); P. carneum,3474, 6884, 6885, 6888, 14042, and 19478; P. commune, 6373, 10763,14135, and 21513; P. glandicola, 4168, 6592, and 21529; P. paneum,11839, 13929, 14356, 16402, 24721, 24723, and 24728; P. roqueforti,6754, 14408, 14412, 14420, 14425, 16401, 16403, 16404, 16407,24729, and 24748; P. solitum, 10254 and 21545. The strains were centerpoint inoculated from spore suspensions on 9 cm Petri dishes containingyeast extract sucrose agar (YES) medium. The YES medium consistedof yeast extract (Difco, 212750) (2%), sucrose (15%), MgSO4‚7H2O
Table 2. Characteristic Ions of the Volatile Compounds, Six Largest Ions from m/z 50 to 150 and Three Ions from m/z 151 to 272 with IntensitiesGiven in Parentheses
characteristic ions
compd RI m/z 50−150 m/z 151−272
1 1343 91 (100) 133 (87) 105 (79) 106 (62) 147 (54) 148 (51) 189 (49) 204 (31) 162 (12)2 1350 119 (100) 105 (59) 91 (54) 147 (52) 133 (43) 55 (35) 161 (55) 189 (53) 204 (30)3 1368 121 (100) 122 (98) 91 (91) 105 (79) 119 (75) 55 (68) 175 (69) 189 (48) 204 (56)4 1398 122 (100) 91 (82) 147 (78) 121 (69) 105 (67) 119 (65) 175 (99) 204 (69) 189 (24)5a 1400 119 (85) 105 (82) 91 (73) 93 (72) 106 (48) 55 (42) 161 (100) 189 (78) 204 (38)6 1402 91 (60) 121 (53) 105 (53) 149 (48) 107 (47) 136 (45) 161 (31) 175 (29) 189 (25)7a 1407 93 (100) 119 (89) 91 (47) 69 (39) 77 (34) 105 (17) 161 (4) 204 (1) 189 (1)8 1414 119 (27) 91 (27) 105 (20) 147 (19) 133 (17) 77 (17) 189 (57) 161 (19) ndb
9a 1418 93 (100) 81 (96) 67 (87) 68 (77) 79 (63) 53 (59) 161 (24) 189 (14) 162 (6)10 1428 81 (100) 93 (98) 67 (90) 68 (83) 79 (67) 53 (62) 161 (20) 189 (15) 162 (6)11a 1441 119 (100) 93 (67) 91 (49) 105 (44) 77 (53) 55 (31) 161 (22) 204 (16) 189 (12)12 1442 91 (84) 133 (80) 105 (80) 119 (68) 135 (64) 93 (57) 162 (31) 189 (27) 161 (22)13 1461 133 (100) 91 (23) 119 (16) 105 (15) 134 (14) 55 (11) 161 (16) 204 (4) 189 (3)14a 1467 93 (60) 69 (57) 91 (54) 79 (53) 133 (40) 77 (36) 161 (13) 189 (6) 175 (4)15a 1480 119 (100) 91 (36) 105 (33) 93 (27) 133 (26) 77 (24) 161 (62) 189 (52) 204 (18)16 1485 91 (100) 148 (68) 105 (63) 133 (56) 79 (47) 77/93 (39) 161 (33) 189 (23) 204 (16)17 1488 91 (100) 133 (84) 105 (69) 119 (53) 55 (47) 79 (42) 189 (91) 175 (50) 204 (37)18 1494 55 (74) 57 (52) 69 (45) 83 (43) 56 (41) 70 (35) 189 (3) nd nd19 1494 128 (22) 143 (17) 115 (17) 129 (17) 141 (16) 142 (15) 185 (100) 200 (29) 157 (23)20 1498 105 (100) 106 (84) 91 (54) 120 (47) 119 (43) 77 (27) 204 (23) 176 (18) 161 (11)21 1505 91 (98) 93 (68) 133 (61) 81 (61) 105 (60) 79 (58) 189 (22) 161 (17) nd22 1511 91 (84) 133 (72) 105 (65) 93 (57) 79 (57) 55 (49) 189 (84) 204 (31) 161 (21)23 1514 91 (96) 134 (79) 105 (81) 93 (74) 133 (68) 79 (68) 189 (27) 161 (17) 204 (9)24a 1517 112 (100) 55 (35) 69 (16) 97 (15) 126 (15) 83 (14) 182 (2) nd nd25 1524 69 (62) 93 (59) 79 (51) 91 (45) 67 (37) 55 (33) 161 (16) 189 (7) nd26 1527 91 (85) 133 (70) 105 (67) 79 (63) 55 (62) 93 (51) 189 (66) 204 (30) 161 (30)27a 1532 105 (100) 91 (71) 93 (51) 107 (46) 79 (40) 121 (39) 189 (57) 161 (16) 204 (6)28 1535 119 (100) 132 (77) 105 (68) 55 (46) 91 (39) 131 (29) 202 (19) nd nd29a 1540 91 (85) 79 (84) 93 (79) 105 (76) 107 (67) 119 (56) 161 (74) 189 (29) 204 (28)30 1545 93 (77) 79 (72) 105 (72) 91 (69) 107 (65) 67 (62) 161 (28) 189 (23) 204 (21)31a 1547 93 (81) 91 (81) 107 (74) 79 (70) 81 (66) 105 (62) 189 (62) 161 (62) 204 (28)32a 1551 91 (79) 79 (74) 105 (69) 93 (62) 67 (56) 55 (53) 161 (52) 189 (33) 175 (24)33 1567 91 (100) 105 (86) 131 (65) 77 (56) 145 (52) 55 (52) 202 (52) 187 (33) 159 (21)34a 1572 69 (100) 91 (55) 92 (53) 77 (48) 55 (36) 79 (30) 161 (18) 204 (9) 189 (8)35 1574 122 (100) 107 (82) 91 (56) 79 (44) 105 (42) 55/93 (40) 161 (91) 204 (14) 162 (9)36a 1578 119 (100) 91 (89) 105 (85) 93 (53) 77 (51) 79 (51) 161 (51) 189 (29) 204 (15)37 1598 55 (78) 57 (59) 83 (48) 69 (48) 97 (39) 56 (40) nd nd nd38 1637 123 (100) 151 (75) 55 (63) 97 (59) 111 (42) 110 (37) 151 (74) 166 (61) 165 (53)39 1684 55 (82) 67 (65) 81 (50) 82 (44) 54 (42) 69 (39) nd nd nd40 1686 67 (97) 55 (63) 81 (61) 79 (45) 54 (44) 95 (33) nd nd nd41 1695 55 (84) 57 (62) 69 (49) 83 (49) 56 (42) 97 (40) nd nd nd42 1702 81 (50) 93 (42) 55 (41) 67 (35) 79 (29) 133 (27) 151 (35) 148 (22) 147 (8)43 1758 55 (67) 91 (40) 146 (39) 145 (27) 69 (27) 70 (27) 159 (28) 202 (26) 243 (24)44 1773 81 (46) 55 (41) 67 (38) 71 (33) 95 (24) 69 (24) 204 (10) 189 (9) 161 (9)45 1789 55 (84) 91 (67) 105 (52) 146 (49) 145 (40) 131 (39) 216 (94) 159 (59) 272 (41)46 1789 55 (85) 81 (43) 69 (40) 67 (34) 91 (30) 79 (27) 189 (22) 204 (13) nd47 1790 55 (80) 91 (41) 69 (33) 105 (30) 67 (29) 79 (27) 216 (38) 159 (26) 229/272 (16)48 1800 55 (42) 81 (41) 67 (40) 71 (37) 79 (26) 95 (24) 189 (19) 204 (14) 161 (14)
a Compound 5, �-patchoulene; compound 7, zingiberene; compound 9, �-elemene; compound 11, diepi-R-cedrene; compound 14, �-caryophyllene; compound 15,�-patchoulene isomer; compound 24, geosmin; compound 27, (+)-aristolochene; compount 29, eremophilene; compound 31, R-selinene; compound 32, valencene; compound34, �-bisabolene; compound 36, �-himachalene. b Not detected.
710 J. Agric. Food Chem., Vol. 53, No. 3, 2005 Karlshøj and Larsen
31
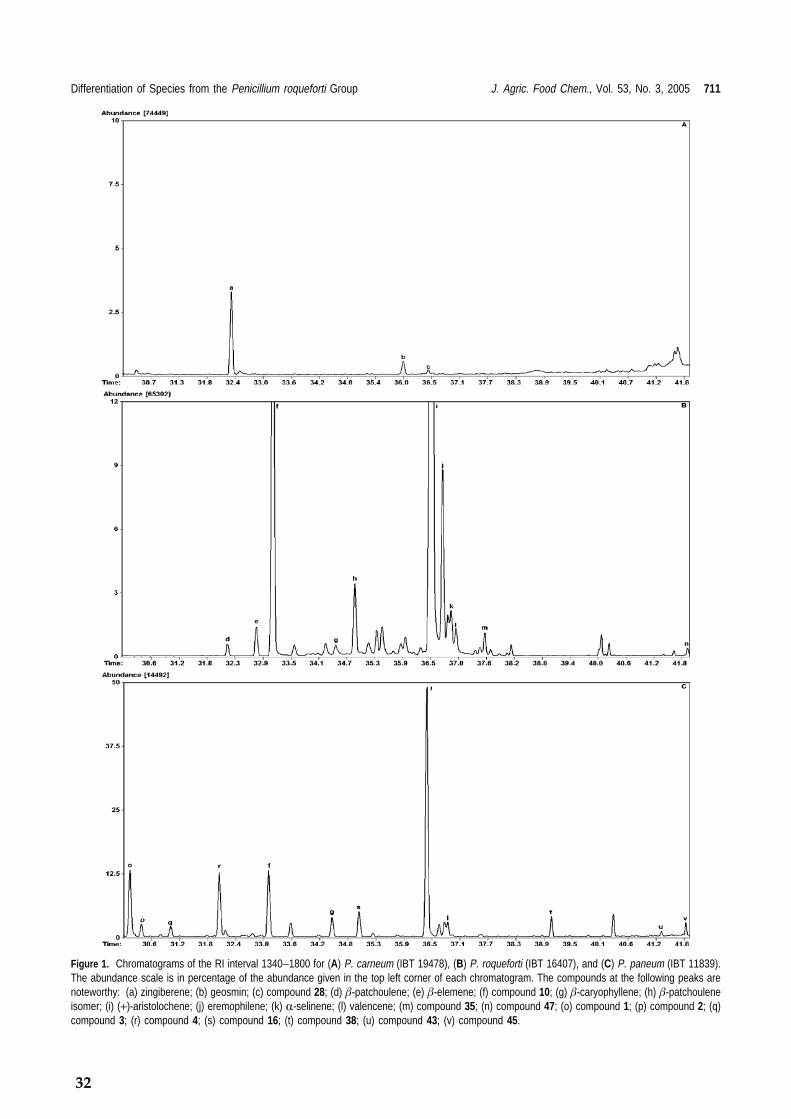
Figure 1. Chromatograms of the RI interval 1340−1800 for (A) P. carneum (IBT 19478), (B) P. roqueforti (IBT 16407), and (C) P. paneum (IBT 11839).The abundance scale is in percentage of the abundance given in the top left corner of each chromatogram. The compounds at the following peaks arenoteworthy: (a) zingiberene; (b) geosmin; (c) compound 28; (d) �-patchoulene; (e) �-elemene; (f) compound 10; (g) �-caryophyllene; (h) �-patchouleneisomer; (i) (+)-aristolochene; (j) eremophilene; (k) R-selinene; (l) valencene; (m) compound 35; (n) compound 47; (o) compound 1; (p) compound 2; (q)compound 3; (r) compound 4; (s) compound 16; (t) compound 38; (u) compound 43; (v) compound 45.
Differentiation of Species from the Penicillium roqueforti Group J. Agric. Food Chem., Vol. 53, No. 3, 2005 711
32
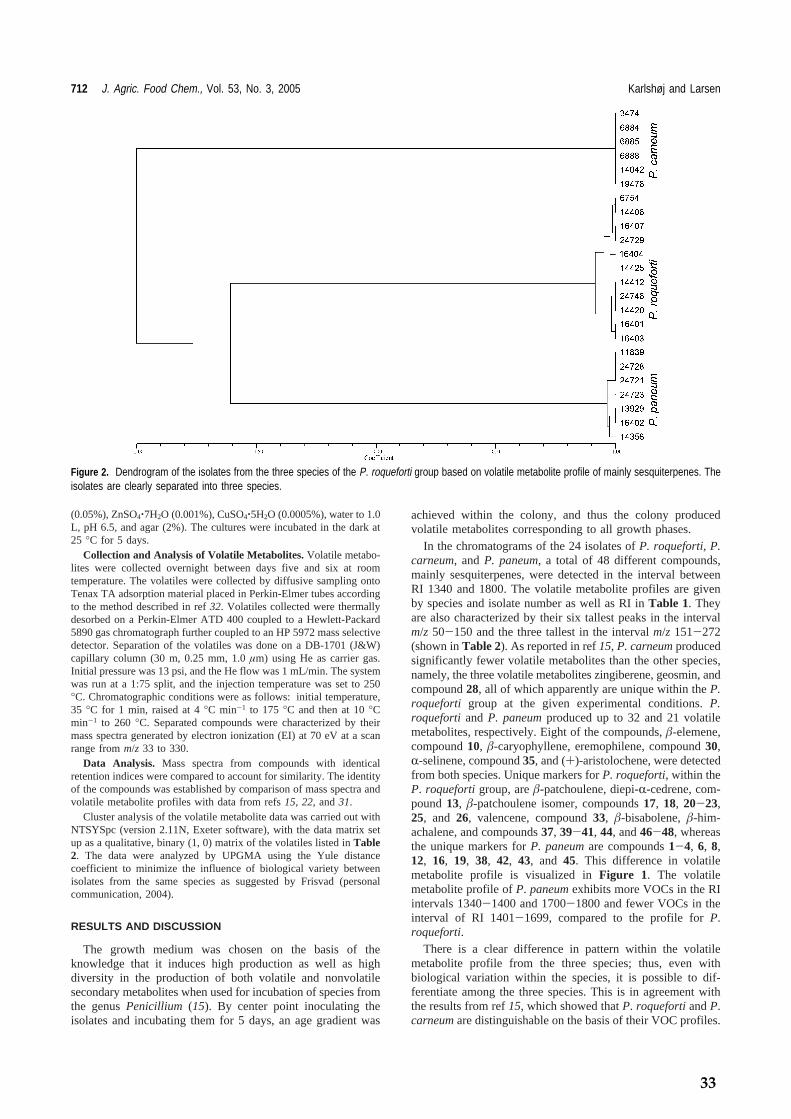
(0.05%), ZnSO4‚7H2O (0.001%), CuSO4‚5H2O (0.0005%), water to 1.0L, pH 6.5, and agar (2%). The cultures were incubated in the dark at25 °C for 5 days.
Collection and Analysis of Volatile Metabolites. Volatile metabo-lites were collected overnight between days five and six at roomtemperature. The volatiles were collected by diffusive sampling ontoTenax TA adsorption material placed in Perkin-Elmer tubes accordingto the method described in ref 32. Volatiles collected were thermallydesorbed on a Perkin-Elmer ATD 400 coupled to a Hewlett-Packard5890 gas chromatograph further coupled to an HP 5972 mass selectivedetector. Separation of the volatiles was done on a DB-1701 (J&W)capillary column (30 m, 0.25 mm, 1.0 μm) using He as carrier gas.Initial pressure was 13 psi, and the He flow was 1 mL/min. The systemwas run at a 1:75 split, and the injection temperature was set to 250°C. Chromatographic conditions were as follows: initial temperature,35 °C for 1 min, raised at 4 °C min-1 to 175 °C and then at 10 °Cmin-1 to 260 °C. Separated compounds were characterized by theirmass spectra generated by electron ionization (EI) at 70 eV at a scanrange from m/z 33 to 330.
Data Analysis. Mass spectra from compounds with identicalretention indices were compared to account for similarity. The identityof the compounds was established by comparison of mass spectra andvolatile metabolite profiles with data from refs 15, 22, and 31.
Cluster analysis of the volatile metabolite data was carried out withNTSYSpc (version 2.11N, Exeter software), with the data matrix setup as a qualitative, binary (1, 0) matrix of the volatiles listed in Table2. The data were analyzed by UPGMA using the Yule distancecoefficient to minimize the influence of biological variety betweenisolates from the same species as suggested by Frisvad (personalcommunication, 2004).
RESULTS AND DISCUSSION
The growth medium was chosen on the basis of theknowledge that it induces high production as well as highdiversity in the production of both volatile and nonvolatilesecondary metabolites when used for incubation of species fromthe genus Penicillium (15). By center point inoculating theisolates and incubating them for 5 days, an age gradient was
achieved within the colony, and thus the colony producedvolatile metabolites corresponding to all growth phases.
In the chromatograms of the 24 isolates of P. roqueforti, P.carneum, and P. paneum, a total of 48 different compounds,mainly sesquiterpenes, were detected in the interval betweenRI 1340 and 1800. The volatile metabolite profiles are givenby species and isolate number as well as RI in Table 1. Theyare also characterized by their six tallest peaks in the intervalm/z 50-150 and the three tallest in the interval m/z 151-272(shown in Table 2). As reported in ref 15, P. carneum producedsignificantly fewer volatile metabolites than the other species,namely, the three volatile metabolites zingiberene, geosmin, andcompound 28, all of which apparently are unique within the P.roqueforti group at the given experimental conditions. P.roqueforti and P. paneum produced up to 32 and 21 volatilemetabolites, respectively. Eight of the compounds, �-elemene,compound 10, �-caryophyllene, eremophilene, compound 30,R-selinene, compound 35, and (+)-aristolochene, were detectedfrom both species. Unique markers for P. roqueforti, within theP. roqueforti group, are �-patchoulene, diepi-R-cedrene, com-pound 13, �-patchoulene isomer, compounds 17, 18, 20-23,25, and 26, valencene, compound 33, �-bisabolene, �-him-achalene, and compounds 37, 39-41, 44, and 46-48, whereasthe unique markers for P. paneum are compounds 1-4, 6, 8,12, 16, 19, 38, 42, 43, and 45. This difference in volatilemetabolite profile is visualized in Figure 1. The volatilemetabolite profile of P. paneum exhibits more VOCs in the RIintervals 1340-1400 and 1700-1800 and fewer VOCs in theinterval of RI 1401-1699, compared to the profile for P.roqueforti.
There is a clear difference in pattern within the volatilemetabolite profile from the three species; thus, even withbiological variation within the species, it is possible to dif-ferentiate among the three species. This is in agreement withthe results from ref 15, which showed that P. roqueforti and P.carneum are distinguishable on the basis of their VOC profiles.
Figure 2. Dendrogram of the isolates from the three species of the P. roqueforti group based on volatile metabolite profile of mainly sesquiterpenes. Theisolates are clearly separated into three species.
712 J. Agric. Food Chem., Vol. 53, No. 3, 2005 Karlshøj and Larsen
33

The three species were further investigated by hierarchicalcluster analysis of the VOC data. This was desired, as it wasthe distinction of species rather than variety within the species,which was the objective of this study. The resulting dendrogram(Figure 2) shows clear separation of the three species, with P.paneum and P. roqueforti showing a closer relationship witheach other than with P. carneum.
Because P. paneum and P. roqueforti had fairly similarvolatile metabolite profiles, distinguishing them by use of anelectronic nose might be more difficult than distinguishing anyof the two from P. carneum. This of course is valid only if thesesquiterpenes play an important role in the overall volatile
metabolite profiles as perceived by the electronic nose sensors.Work is in progress in our laboratory to investigate whether itis possible to distinguish the species in the P. roqueforti groupby electronic nose as an instrument to predict mycotoxinproduction by species differentiation.
The presence of (+)-aristolochene was determined by com-parison of RI and mass spectrum, including deconvolution ofthe peaks and relative peak intensities, with an authentic sample.Figure 3 shows a comparison of matching mass spectra of (+)-aristolochene from the authentic sample and a compound withthe same RI from a P. paneum sample (IBT 11839). Detection
Figure 3. Mass spectrum comparison matching spectra from (A) (+)-aristolochene from the authentic sample and a compound of similar RI from (B) asample of P. paneum (IBT 11839).
Differentiation of Species from the Penicillium roqueforti Group J. Agric. Food Chem., Vol. 53, No. 3, 2005 713
34

of (+)-aristolochene in P. roqueforti matches the resultspublished in ref 31.
Among the 48 VOCs detected, three diterpenes, all unidenti-fied, were found. The diterpenes were compounds 43 and 45,found in samples from P. paneum, and compound 47, found insamples from P. roqueforti. Volatile diterpene hydrocarbonshave rarely been reported from fungi as done in ref 33. Withinthe genus Penicillium only volatile mono- and sesquiterpeneshave been described (15-18, 22, 31, 34-36).
In conclusion, it has been demonstrated that P. paneum hasa unique volatile metabolite profile when compared to P.roqueforti and P. carneum. This clearly supports P. paneumbeing a separate species within the P. roqueforti group. Second,(+)-aristolochene turned out not to be a unique biomarker forP. roqueforti because it was detected in volatile samples fromP. commune, P. glandicola, P. paneum, and P. solitum. Thefact that this important group of fungi can be distinguished byGC-MS makes it feasible that electronic nose technology canalso be applied for quality control purposes in the food industry.This, of course, is of particular interest in the cheese industryduring both production and storage.
ABBREVIATIONS USED
YES, yeast extract sucrose agar; GC-MS, gas chromatogra-phy-mass spectrometry; RI, Kovats retention index; VOC,volatile organic compound; EI, electron ionization.
ACKNOWLEDGMENT
We thank Jan Demyttenaere for kindly providing the authenticsample used in the identification of (+)-aristolochene and HanneJakobsen for technical assistance.
LITERATURE CITED
(1) Dolezalek, J.; Hoza, I. Effect of Penicillium roqueforti strainson the formation of aldehydes and methyl ketones in cream.Prum. PotraVin 1969, 20, 171-175.
(2) Bianchi-Salvadori, B. The production of Penicillium roquefortiand its use in making Gorgonzola cheese. Dtsch. Molk.-Ztg.1987, 108, 1237-1240.
(3) Larroche, C.; Tallu, B.; Gros, J. B. Aroma production by sporesof Penicillium roqueforti on a synthetic medium. J. Ind.Microbiol. 1988, 1-8.
(4) Fan, T. Y.; Hwang, D. H.; Kinsella, J. E. Methyl ketoneformation during germination of Penicillium roqueforti. J. Agric.Food Chem. 1976, 24, 443-448.
(5) Moreau, C. Penicillium roqueforti, its morphology, physiology,use in cheesemaking, and mycotoxins. Lait 1980, 60, 254-271.
(6) Engel, G.; Teuber, M. Differentiation of Penicillium roquefortistrains by thin-layer chromatography of metabolites. Milchwis-senschaft 1983, 38, 513-516.
(7) Schoch, U.; Luethy, J.; Schlatter, C. Mutagenicity testing ofcommercial strains of Penicillium camemberti and P. roqueforti.Z. Lebensm. Unters. Forsch. 1984, 178, 351-355.
(8) Schoch, U.; Luethy, J.; Schlatter, C. Mycotoxins from Penicilliumroqueforti and P. camemberti in cheese. I. Occurrence ofchemically-identified mycotoxins. Milchwissenschaft 1984, 39,76-80.
(9) Engel, G.; Prokopek, D. No detection of Penicillium roquefortitoxin in cheese. Milchwissenschaft 1979, 34, 272-274.
(10) Szoltysek, K. Toxic metabolites of Penicillium roqueforti. Rocz.Panstw. Zakl. Hig. 1982, 33, 39-43.
(11) Harwig, J.; Blanchfield, B. J.; Scott, P. M. Patulin productionby Penicillium roqueforti Thom from grape. Can. Inst. FoodSci. Technol. J. 1978, 11, 149-151.
(12) Medina, M.; Gaya, P.; Nunez, M. Production of PR toxin androquefortine by Penicillium roqueforti isolates from Cabrales bluecheese. J. Food Prot. 1985, 48, 118-121.
(13) Frisvad, J. C.; Filtenborg, O. Terverticillate Penicillia: Chemo-taxonomy and Mycotoxin Production. Mycologia 1989, 81, 837-861.
(14) Boysen, M.; Skouboe, P.; Frisvad, J.; Rossen, L. Reclassificationof the Penicillium roqueforti group into three species on the basisof molecular genetic and biochemical profiles. Microbiology1996, 142, 541-549.
(15) Larsen, T. O.; Frisvad, J. C. Characterization of VolatileMetabolites from 47 Penicillium-Taxa. Mycol. Res. 1995, 99,1153-1166.
(16) Larsen, T. O.; Frisvad, J. C. Chemosystematics of PenicilliumBased on Profiles of Volatile Metabolites. Mycol. Res. 1995,99, 1167-1174.
(17) Larsen, T. O. Identification of cheese-associated fungi usingselected ion monitoring of volatile terpenes. Lett. Appl. Microbiol.1997, 24, 463-466.
(18) Fischer, G.; Schwalbe, R.; Moller, M.; Ostrowski, R.; Dott, W.Species-specific production of microbial volatile organic com-pounds (MVOC) by airborne fungi from a compost facility.Chemosphere 1999, 39, 795-810.
(19) Zeringue, H. J., Jr.; Bhatnagar, D.; Cleveland, T. E. C15H24
volatile compounds unique to aflatoxigenic strains of AspergillusflaVus. Appl. EnViron. Microbiol. 1993, 59, 2264-2270.
(20) Jelen, H. H.; Mirocha, C. J.; Wasowicz, E.; Kaminski, E.Production of volatile sesquiterpenes by Fusarium sambucinumstrains with different abilities to synthesize trichothecenes. Appl.EnViron. Microbiol. 1995, 61, 3815-3820.
(21) Demyttenaere, J. C. R.; Morina, R. M.; De Kimpe, N.; Sandra,P. Use of headspace solid-phase microextraction and headspacesorptive extraction for the detection of the volatile metabolitesproduced by toxigenic Fusarium species. J. Chromatogr. A 2004,1027, 147-154.
(22) Jelen, H. H. Volatile Sesquiterpene Hydrocarbons Characteristicfor Penicillium roqueforti Strains Producing PR Toxin. J. Agric.Food Chem. 2002, 50, 6569-6574.
(23) Olsson, J.; Borjesson, T.; Lundstedt, T.; Schnurer, J. Detectionand quantification of ochratoxin A and deoxynivalenol in barleygrains by GC-MS and electronic nose. Int. J. Food Microbiol.2002, 72, 203-214.
(24) Borjesson, T.; Eklov, T.; Jonsson, A.; Sundgren, H.; Schnurer,J. Electronic nose for odor classification of grains. Cereal Chem.1996, 73, 457-461.
(25) Jonsson, A.; Winquist, F.; Schnurer, J.; Sundgren, H.; Lundstrom,I. Electronic nose for microbial quality classification of grains.Int. J. Food Microbiol. 1997, 35, 187-193.
(26) Berna, A. Z.; Lammertyn, J.; Saevels, S.; Natale, C. D.; Nicolai,B. M. Electronic nose systems to study shelf life and cultivareffect on tomato aroma profile. Sens. Actuators, B 2004, 97,324-333.
(27) Korel, F.; Balaban, M. O. Microbial and sensory assessment ofmilk with an electronic nose. J. Food Sci. 2002, 67, 758-764.
(28) Magan, N.; Pavlou, A.; Chrysanthakis, I. Milk-sense: a volatilesensing system recognises spoilage bacteria and yeasts in milk.Sens. Actuators, B 2001, 72, 28-34.
(29) Keshri, G.; Magan, N.; Voysey, P. Use of an electronic nose forthe early detection and differentiation between spoilage fungi.Lett. Appl. Microbiol. 1998, 27, 261-264.
(30) Magan, N.; Evans, P. Volatiles as an indicator of fungal activityand differentiation between species, and the potential use ofelectronic nose technology for early detection of grain spoilage.J. Stored Prod. Res. 1999, 36, 319-340.
(31) Demyttenaere, J. C. R.; Adams, A.; van Belleghem, K.; DeKimpe, N.; Konig, W. A.; Tkachev, A. V. De novo productionof (+)-aristolochene by sporulated surface cultures of Penicilliumroqueforti. Phytochemistry 2001, 59, 597-602.
(32) Larsen, T. O.; Frisvad, J. C. A simple method for collection ofvolatile metabolites from fungi based on diffusive sampling fromPetri dishes. J. Microbiol. Methods 1993, 19, 297-305.
714 J. Agric. Food Chem., Vol. 53, No. 3, 2005 Karlshøj and Larsen
35

(33) Oikawa, H.; Toshima, H.; Ohashi, S.; Konig, W. A.; Kenmoku,H.; Sassa, T. Diversity of diterpene hydrocarbons in fungusPhoma betae. Tetrahedron Lett. 2001, 42, 2329-2332.
(34) Demyttenaere, J. C. R.; Morina, R. M.; Sandra, P. Monitoringand fast detection of mycotoxin-producing fungi based onheadspace solid-phase microextraction and headspace sorptiveextraction of the volatile metabolites. J. Chromatogr. 2003, 985,127-135.
(35) Schnurer, J.; Olsson, J.; Borjesson, T. Fungal Volatiles asIndicators of Food and Feeds Spoilage. Fungal Genet. Biol. 1999,27, 209-217.
(36) Nilsson, T.; Larsen, T. O.; Montanarella, L.; Madsen, J. Ø.Application of headspace solid-phase microextraction for theanalysis of volatile metabolites emitted by Penicillium species.J. Microbiol. Methods 1996, 25, 245-255.
Received for review August 26, 2004. Revised manuscript receivedNovember 26, 2004. Accepted November 28, 2004. This work wassupported by the Food Technology, Safety and Quality researchprogram, Ministry of Food, Agriculture and Fisheries, Denmark.
JF0485887
Differentiation of Species from the Penicillium roqueforti Group J. Agric. Food Chem., Vol. 53, No. 3, 2005 715
36
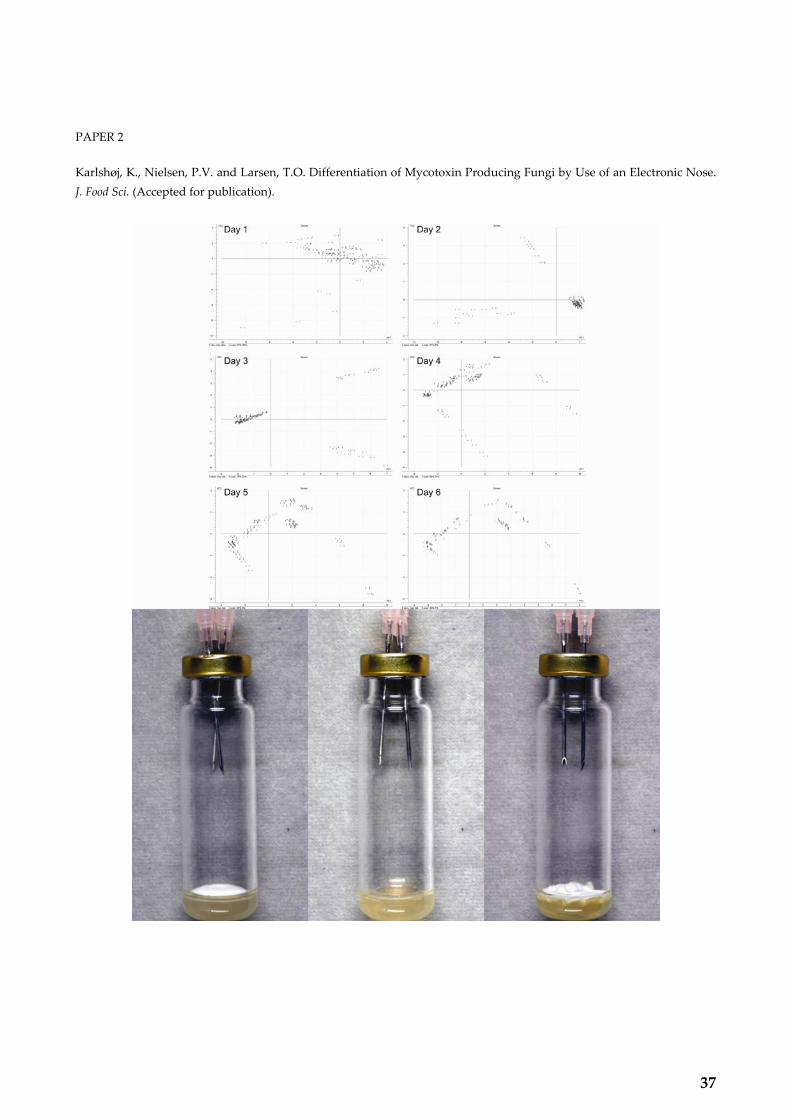
PAPER 2
Karlshøj, K., Nielsen, P.V. and Larsen, T.O. Differentiation of Mycotoxin Producing Fungi by Use of an Electronic Nose. J. Food Sci. (Accepted for publication).
37

38

M:Fo
odMi
crob
iolog
y&Sa
fety
JFS M: Food Microbiology and Safety
Differentiation of Closely RelatedFungi by Electronic Nose AnalysisK. KARLSHøJ, P.V. NIELSEN, AND T.O. LARSEN
ABSTRACT: In this work the potential of electronic nose analysis for differentiation of closely related fungi has beendescribed. A total of 20 isolates of the cheese-associated species Geotrichum candidum, Penicillium camemberti, P.nordicum, and P. roqueforti and its closely related species P. paneum, P. carneum as well as the noncheese-associatedP. expansum have been investigated by electronic nose, GC-MS, and LC-MS analysis. The isolates were inoculated onyeast extract sucrose agar in 20-mL headspace flasks and electronic nose analysis was performed daily for a 7-d period.To assess which volatile metabolites the electronic nose potentially responded to, volatile metabolites were collectedby diffusive sampling overnight onto tubes containing Tenax TA, between the 7th and 8th day of incubation. Volatileswere analyzed by gas chromatography coupled to mass spectrometry and the results indicated that mainly alcohols(ethanol, 2-methyl-1-propanol, and 3-methyl-1-butanol) and ketones (acetone, 2-butanone, and 2-pentanone) wereproduced at this stage. The volatile metabolite profile proved to be species specific. Nonvolatile metabolites werecollected on the 8th day of incubation and mycotoxin analysis was performed by high pressure liquid chromatographycoupled to a diode array detector and a time of flight mass spectrometer. Several mycotoxins were detected in samplesfrom the species P. nordicum, P. roqueforti, P. paneum, P. carneum, and P. expansum. Differentiation of closely relatedmycotoxin producing fungi incubated on yeast extract sucrose agar has been achieved, indicating that there is apotential for predicting production of mycotoxins on food and feedstuffs by electronic nose analysis.
Keywords: biomarkers, electronic nose, fungi, mycotoxins, volatile metabolites
Introduction
Volatile metabolites produced by fungi have traditionally beenanalyzed by gas chromatography coupled to mass spectrometry
(GC-MS) (Jelen and others 1995; Larsen and Frisvad 1995a, 1995b;Larsen 1997; Demyttenaere and others 2001, 2004; Jelen 2002, 2003).It has been shown that the profile of volatile metabolites producedby species of genus Penicillium can be used as a tool for chemotax-onomy (Larsen and Frisvad 1995a, 1995b)—even when it comes toclosely related species (Karlshøj and Larsen 2005)—and for distinc-tion of cheese-related fungi (Larsen 1997). This is therefore a poten-tial tool for indirect prediction of mycotoxin production. Mycotox-ins and other nonvolatile metabolites have traditionally been de-tected by use of high performance liquid chromatography coupledto diode array detection (HPLC-DAD) and often also to mass spec-trometry (LC-DAD-MS) (Smedsgaard 1997; Chao-Ling and others2000; Sewram and others 2000; Shephard and Leggott 2000; Venturaand others 2004). Similarly, profiling of nonvolatile metabolites, my-cotoxins included, has also been used in chemotaxonomy of fungifrom genus Penicillium (Frisvad and Filtenborg 1983, 1989). Unfor-tunately both LC and GC methods are time and resource consuming.It is, therefore, desirable to develop faster and cheaper tools.
In several industries a new analysis method for quality controlhas appeared—the electronic nose (e-nose). The nonspecific sensorresponse gathered by an e-nose can be used for classification andprediction purposes; for instance, it has been used for food qualitycontrol, storage, and spoilage by bacteria and fungi (Borjesson andothers 1996; Jonsson and others 1997; Keshri and others 1998; Maganand Evans 1999; Magan and others 2001; Korel and Balaban 2002;
MS 20060434 Submitted 8/8/2006, Accepted 4/30/2007 . Authors are withCenter for Microbial Biotechnology, BioCentrum-DTU, Building 221, Tech-nical Univ. of Denmark, DK-2800 Kgs. Lyngby, Denmark. Direct inquiries toauthor Karlshøj (E-mail: [email protected]).
Olsson and others 2002; Balasubramanian and others 2004; Vinaixaand others 2004; Cheli and others 2005; Hansen and others 2005;Trihaas and Nielsen 2005) of processed as well as nonprocessed food.
It has been shown that cheese, like most other food and feed-stuffs, has an associated funga (Lund and others 1995, 1996;Filtenborg and others 1996). For cheese, this associated funga con-sists of species that are used as starter cultures in some cheeses (Peni-cillium roqueforti in blue mold cheeses and Penicillium camem-berti and Geotrichum candidum in Camembert cheeses) (Samsonand others 1977; Moreau 1980; Rousseau 1984; Bianchi-Salvadori1987; Marth and Yousef 1991) as well as species that are solely con-taminants (for example, P. nordicum, P. carneum and P. paneum).Contaminants are unwanted for several reasons, not least due totheir ability to produce mycotoxins, which several studies haveshown (Jarvis 1983; Frisvad and Filtenborg 1989; Siemens and Zawis-towski 1993; Frisvad and Samson 2004). Among the mycotoxins pro-duced by cheese-associated fungi the most important mycotoxinsare Ochratoxin A (P. nordicum), Patulin (P. carneum and P. paneum),Mycophenolic acid (P. carneum and P. roqueforti), Roquefortine A(P. carneum and P. roqueforti), Roquefortine C (P. paneum and P.roqueforti), and Cyclopiazonic acid (P. camemberti) (Jarvis 1983;Frisvad and others 2004).
The overall goal of this study has been to investigate whetherit is possible to classify closely related fungi incubated on yeastextract sucrose (YES) medium by use of an e-nose as well asto analyze the samples for mycotoxin production to ascertainwhether mycotoxins have been produced under the growth con-ditions used in this study. These investigations will thus help de-termine whether the e-nose could be a potential tool for identifi-cation of mycotoxinogenic fungi on food and feedstuffs, and hencewhether there is potential for more detailed quality control by pre-diction of mycotoxin production in food and feedstuffs by e-noseanalysis.
C© 2007 Institute of Food Technologists Vol. 72, Nr. 6, 2007—JOURNAL OF FOOD SCIENCE M187doi: 10.1111/j.1750-3841.2007.00399.xFurther reproduction without permission is prohibited
39
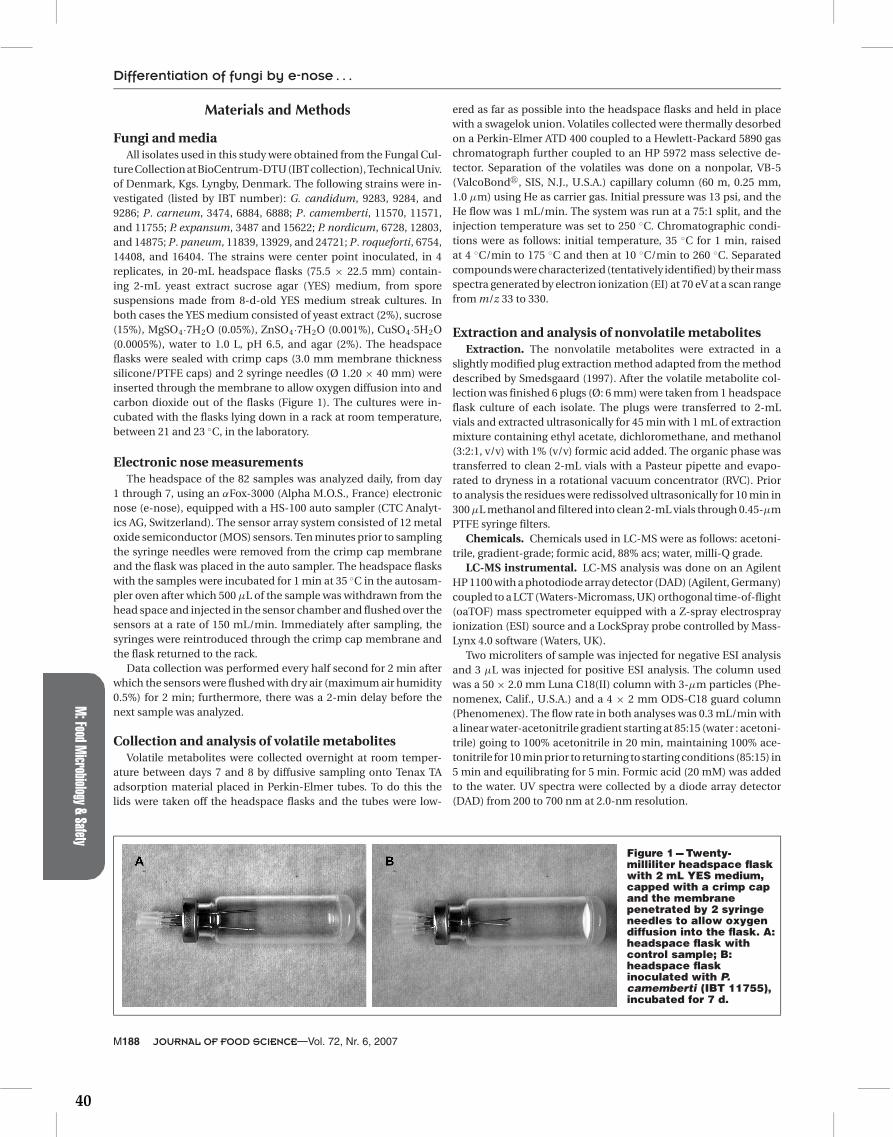
M:FoodMicrobiology&Safety
Differentiation of fungi by e-nose . . .
Materials and Methods
Fungi and mediaAll isolates used in this study were obtained from the Fungal Cul-
ture Collection at BioCentrum-DTU (IBT collection), Technical Univ.of Denmark, Kgs. Lyngby, Denmark. The following strains were in-vestigated (listed by IBT number): G. candidum, 9283, 9284, and9286; P. carneum, 3474, 6884, 6888; P. camemberti, 11570, 11571,and 11755; P. expansum, 3487 and 15622; P. nordicum, 6728, 12803,and 14875; P. paneum, 11839, 13929, and 24721; P. roqueforti, 6754,14408, and 16404. The strains were center point inoculated, in 4replicates, in 20-mL headspace flasks (75.5 × 22.5 mm) contain-ing 2-mL yeast extract sucrose agar (YES) medium, from sporesuspensions made from 8-d-old YES medium streak cultures. Inboth cases the YES medium consisted of yeast extract (2%), sucrose(15%), MgSO4·7H2O (0.05%), ZnSO4·7H2O (0.001%), CuSO4·5H2O(0.0005%), water to 1.0 L, pH 6.5, and agar (2%). The headspaceflasks were sealed with crimp caps (3.0 mm membrane thicknesssilicone/PTFE caps) and 2 syringe needles (Ø 1.20 × 40 mm) wereinserted through the membrane to allow oxygen diffusion into andcarbon dioxide out of the flasks (Figure 1). The cultures were in-cubated with the flasks lying down in a rack at room temperature,between 21 and 23 ◦C, in the laboratory.
Electronic nose measurementsThe headspace of the 82 samples was analyzed daily, from day
1 through 7, using an αFox-3000 (Alpha M.O.S., France) electronicnose (e-nose), equipped with a HS-100 auto sampler (CTC Analyt-ics AG, Switzerland). The sensor array system consisted of 12 metaloxide semiconductor (MOS) sensors. Ten minutes prior to samplingthe syringe needles were removed from the crimp cap membraneand the flask was placed in the auto sampler. The headspace flaskswith the samples were incubated for 1 min at 35 ◦C in the autosam-pler oven after which 500 µL of the sample was withdrawn from thehead space and injected in the sensor chamber and flushed over thesensors at a rate of 150 mL/min. Immediately after sampling, thesyringes were reintroduced through the crimp cap membrane andthe flask returned to the rack.
Data collection was performed every half second for 2 min afterwhich the sensors were flushed with dry air (maximum air humidity0.5%) for 2 min; furthermore, there was a 2-min delay before thenext sample was analyzed.
Collection and analysis of volatile metabolitesVolatile metabolites were collected overnight at room temper-
ature between days 7 and 8 by diffusive sampling onto Tenax TAadsorption material placed in Perkin-Elmer tubes. To do this thelids were taken off the headspace flasks and the tubes were low-
Figure 1 --- Twenty-milliliter headspace flaskwith 2 mL YES medium,capped with a crimp capand the membranepenetrated by 2 syringeneedles to allow oxygendiffusion into the flask. A:headspace flask withcontrol sample; B:headspace flaskinoculated with P.camemberti (IBT 11755),incubated for 7 d.
ered as far as possible into the headspace flasks and held in placewith a swagelok union. Volatiles collected were thermally desorbedon a Perkin-Elmer ATD 400 coupled to a Hewlett-Packard 5890 gaschromatograph further coupled to an HP 5972 mass selective de-tector. Separation of the volatiles was done on a nonpolar, VB-5(ValcoBond�, SIS, N.J., U.S.A.) capillary column (60 m, 0.25 mm,1.0 µm) using He as carrier gas. Initial pressure was 13 psi, and theHe flow was 1 mL/min. The system was run at a 75:1 split, and theinjection temperature was set to 250 ◦C. Chromatographic condi-tions were as follows: initial temperature, 35 ◦C for 1 min, raisedat 4 ◦C/min to 175 ◦C and then at 10 ◦C/min to 260 ◦C. Separatedcompounds were characterized (tentatively identified) by their massspectra generated by electron ionization (EI) at 70 eV at a scan rangefrom m/z 33 to 330.
Extraction and analysis of nonvolatile metabolitesExtraction. The nonvolatile metabolites were extracted in a
slightly modified plug extraction method adapted from the methoddescribed by Smedsgaard (1997). After the volatile metabolite col-lection was finished 6 plugs (Ø: 6 mm) were taken from 1 headspaceflask culture of each isolate. The plugs were transferred to 2-mLvials and extracted ultrasonically for 45 min with 1 mL of extractionmixture containing ethyl acetate, dichloromethane, and methanol(3:2:1, v/v) with 1% (v/v) formic acid added. The organic phase wastransferred to clean 2-mL vials with a Pasteur pipette and evapo-rated to dryness in a rotational vacuum concentrator (RVC). Priorto analysis the residues were redissolved ultrasonically for 10 min in300 µL methanol and filtered into clean 2-mL vials through 0.45-µmPTFE syringe filters.
Chemicals. Chemicals used in LC-MS were as follows: acetoni-trile, gradient-grade; formic acid, 88% acs; water, milli-Q grade.
LC-MS instrumental. LC-MS analysis was done on an AgilentHP 1100 with a photodiode array detector (DAD) (Agilent, Germany)coupled to a LCT (Waters-Micromass, UK) orthogonal time-of-flight(oaTOF) mass spectrometer equipped with a Z-spray electrosprayionization (ESI) source and a LockSpray probe controlled by Mass-Lynx 4.0 software (Waters, UK).
Two microliters of sample was injected for negative ESI analysisand 3 µL was injected for positive ESI analysis. The column usedwas a 50 × 2.0 mm Luna C18(II) column with 3-µm particles (Phe-nomenex, Calif., U.S.A.) and a 4 × 2 mm ODS-C18 guard column(Phenomenex). The flow rate in both analyses was 0.3 mL/min witha linear water-acetonitrile gradient starting at 85:15 (water : acetoni-trile) going to 100% acetonitrile in 20 min, maintaining 100% ace-tonitrile for 10 min prior to returning to starting conditions (85:15) in5 min and equilibrating for 5 min. Formic acid (20 mM) was addedto the water. UV spectra were collected by a diode array detector(DAD) from 200 to 700 nm at 2.0-nm resolution.
M188 JOURNAL OF FOOD SCIENCE—Vol. 72, Nr. 6, 2007
40

M:Fo
odMi
crob
iolog
y&Sa
fety
Differentiation of fungi by e-nose . . .
Negative ESI was performed at a resolution > 5000 (full width halfmaximum [FWHM]), with the [M-H]− ion of leucine enkephalin ([M-H]− 554.2615 Da) as the lock mass. The capillary was held at 2500 V,cone 1 (skimmer 1) at 30 V, and cone 2 (skimmer 2) at 3 V.
Positive ESI was performed at a resolution > 6000 (FWHM), using[M+H]+ ion of leucine enkephalin ([M+H]+ 556.2615 Da) as the lockmass. The capillary was held at 3200 V, cone 1 (skimmer 1) at 30 V,and cone 2 (skimmer 2) at 5 V.
For both positive and negative ESI, the desolvation temperaturewas 450 ◦C, desolvation gas (nitrogen) at 500 L/h. The source waskept at 120 ◦C for negative ESI and 110 ◦C during positive ESI. MSspectra were collected as centroid data from m/z 100 to 1000 at a rateof 0.4 s per spectrum with 0.1 s interscan time. Reference spectrumwas collected every 3 s.
Data analysisElectronic nose data. The features extracted from the e-nose
system responses were evaluated by principal component analysis(PCA) as well as by classification using soft independent modelingof class analogy (SIMCA) with each species (class) analyzed as a PCAgroup (Esbensen 2001). The e-nose data were standardized by mul-tiplication with the inverse of the standard deviation and analyzedusing systematic cross validation to account for the 4 replicates ofeach sample. For the analysis the software package The Unscramblerversion 9.1 (CAMO, Norway) was used.
Volatile metabolites. Compounds were selected if the peakheight was at least 20% of the height of the tallest peak in the chro-matogram in order to only select major compounds produced. Massspectra from compounds with identical retention indices were com-pared to account for similarity. The identity of the compounds wasestablished by comparison of mass spectra and volatile metabolite
Figure 2 --- PCA scores plots from e-nose analysis of the 7 species, showing the separation at the 6th day analysis. 0,Blank; 1, G. candidum; 2, P. camemberti; 3, P. nordicum; 4, P. expansum; 5, P. paneum; 6, P. carneum; 7, P. roqueforti.
profiles with data from the NIST mass spectral library (NIST92 li-brary).
Nonvolatile metabolites. Mycotoxins were identified by com-parison of UV spectra and m/z values with data from Nielsen andSmedsgaard (2003).
Results and Discussion
YES was selected as growth medium as it is known to induce highproduction of a wide range of both volatile and nonvolatile sec-
ondary metabolites when used for incubation of species of genusPenicillium (Larsen and Frisvad 1995a). The isolates were centerpoint inoculated for 2 reasons. This inoculation method will resem-ble a point/spot infection in a given food or feedstuff; it will alsoinduce an age gradient in the colony as it grows, thus enabling pro-duction of both volatile and nonvolatile metabolites correspondingto all growth phases.
The PCA scores plots from the e-nose analyses, days 1 through7, reveal a growing differentiation of the fungal species, peaking atbest visible separation on days 4 through 6, with the most efficientseparation at day 6 (Figure 2). On day 6 measurements gave riseto a PCA scores plot in which all species, except P. nordicum, wereseparated from the control samples; furthermore, G. candidum, P.carneum, and P. expansum all grouped separately, showing differen-tiation of the mentioned species (Figure 2). P. roqueforti could not becompletely distinguished from P. paneum or P. camemberti thoughslight grouping is evident.
The late, and poor, separation of P. nordicum from the blanksamples is likely be related to the relatively slow growth of saidspecies on YES medium compared to the other species investigated.P. nordicum is most often encountered on substrates rich in proteinand/or fat (Frisvad and Samson 2004). The very oblong shape of the
Vol. 72, Nr. 6, 2007—JOURNAL OF FOOD SCIENCE M189
41

M:FoodMicrobiology&Safety
Differentiation of fungi by e-nose . . .
P. roqueforti group, stretching between 3 other species (P. nordicum,P. paneum, and P. camemberti) as seen in Figure 2, indicates a largebiological variation within the species regarding volatile metaboliteproduction, as sensed by the electronic nose.
By SIMCA analysis the total percentage of correct classifica-tion of fungal species varied between less than 10% to over 90%(Table 1), with the best classification achieved on day 6 with 93.9%correct classified. It is also seen that the control samples and speciesP. nordicum and P. paneum proved to be the hardest to classifyoverall.
The GC-MS analysis of the isolates shows that 14 major and anumber of minor compounds not reported here were produced bythe 7 species. The volatile metabolite profiles are given by speciesand isolate number as well as Kovats retention index (RI) in Table 2.As seen in the table, the identified compounds are mainly alcoholsand ketones, and several of the compounds were detected in morethan one of the analyzed species. For G. candidum production ofdimethyldisulfide proved to be unique within the analyzed species.P. camemberti and P. expansum have fairly similar profiles, withinthe major compounds noted, as ethanol, 2-methyl-1-propanol, and3-methyl-1-butanol were detected for both and only 1 compoundwas differing: ethylacetate, which was only detected from P. ex-pansum isolates. P. paneum and P. roqueforti proved to have verysimilar volatile metabolite profiles as well, since acetone, 2-methyl-1-propanol, 2-pentanone, 3-methyl-1-butanol and an unknowncompound (unknown 1 in Table 2) were detected from both. These2 isolates differ in the sesquiterpenes detected, where 4 sesquiter-penes not detected in any of the other species were detected from P.roqueforti and 1 sesquiterpene, unique for the species was detectedin samples from P. paneum in this analysis. Lastly, an unknown com-pound (unknown 2 in Table 2), which was not detected in P. paneum,was also detected in samples from P. roqueforti. Four of the volatilemetabolites detected in samples from P. roqueforti and P. paneumwere also detected in samples from P. nordicum; namely acetone, 2-butanone, 2-methyl-1-propanol, and 2-pentanone and no volatilemetabolites unique to the species were detected. Only 2 volatilemetabolites were detected in major amounts for P. carneum: ace-tone and 3-methyl-1-butanol, the latter in extreme quantities com-pared to any other metabolites measured in this entire analysis. Allof the above findings correspond well with those reported in litera-ture (Larsen and Frisvad 1995a; Berger and others 1999; Aldarf andothers 2002).
It is interesting to note that P. roqueforti and P. paneum, whichgroup close to one another in the PCA analysis of e-nose data, alsoproduce very similar volatile metabolite profiles in the analysis per-formed after 8 d incubation. It could be interesting to investigate thechange in volatile metabolite profile concurrent with e-nose mea-surements to determine whether there is a correlation between thedetected compounds and e-nose signals.
Table 1 --- Classification of fungal species by SIMCA anal-ysis of e-nose measurements
Day 1 (%) 2 (%) 3 (%) 4 (%) 5 (%) 6 (%) 7 (%)
Blanks 0.0 0.0 75.0 0.0 0.0 50.0 0.0G. candidum 41.7 100.0 100.0 100.0 100.0 100.0 8.3P. camemberti 0.0 80.0 100.0 100.0 70.0 90.0 80.0P. carneum 0.0 0.0 58.3 100.0 100.0 100.0 100.0P. expansum 12.5 100.0 100.0 100.0 100.0 100.0 100.0P. nordicum 0.0 0.0 58.3 33.3 58.3 83.3 25.0P. paneum 8.3 8.3 33.3 16.7 33.3 100.0 75.0P. roqueforti 0.0 16.7 25.0 66.7 83.3 100.0 91.7Avg correct clas. 8.5 37.8 65.9 68.3 73.2 93.9 63.4
Rate of correct classification shown by species as well as overall per day. Tab
le2
---M
ajo
rvo
lati
lem
eta
bo
lite
sd
ete
cte
dth
ein
vest
iga
ted
fun
gi
G.c
and
idu
mP.
cam
emb
erti
P.n
ord
icu
mP.
exp
ansu
mP.
pan
eum
P.ca
rneu
mP.
roq
uef
ort
i
Ret
enti
on
ind
exC
om
po
un
d92
8392
8492
8611
570
1157
111
755
6728
1280
314
875
3487
1562
211
839
1392
924
721
3474
6884
6888
6754
1440
816
404
504
Eth
anol
Sa
SS
SS
519
Ace
tone
SS
SS
SS
SS
SS
SS
SS
S58
42-
But
anon
eU
bU
599
Eth
ylac
etat
eU
U60
92-
Met
hyl-1
-pro
pano
lS
SS
SS
SS
SS
SS
SS
S66
62-
Pen
tano
neS
SS
714
3-M
ethy
l-1-b
utan
olS
SS
SS
SS
SS
SS
SS
S71
8U
nkno
wn
1S
SS
SS
S73
5D
imet
hyld
isul
fide
UU
U99
7U
nkno
wn
2U
U11
28(2
04)
U11
44(2
04)
U11
51(2
04)
U12
96(2
04)
UU
U
aS
:Com
poun
dspr
oduc
edby
mor
eth
an1
ofth
e7
spec
ies.
bU
:Com
poun
dsun
ique
toa
spec
ies.
M190 JOURNAL OF FOOD SCIENCE—Vol. 72, Nr. 6, 2007
42
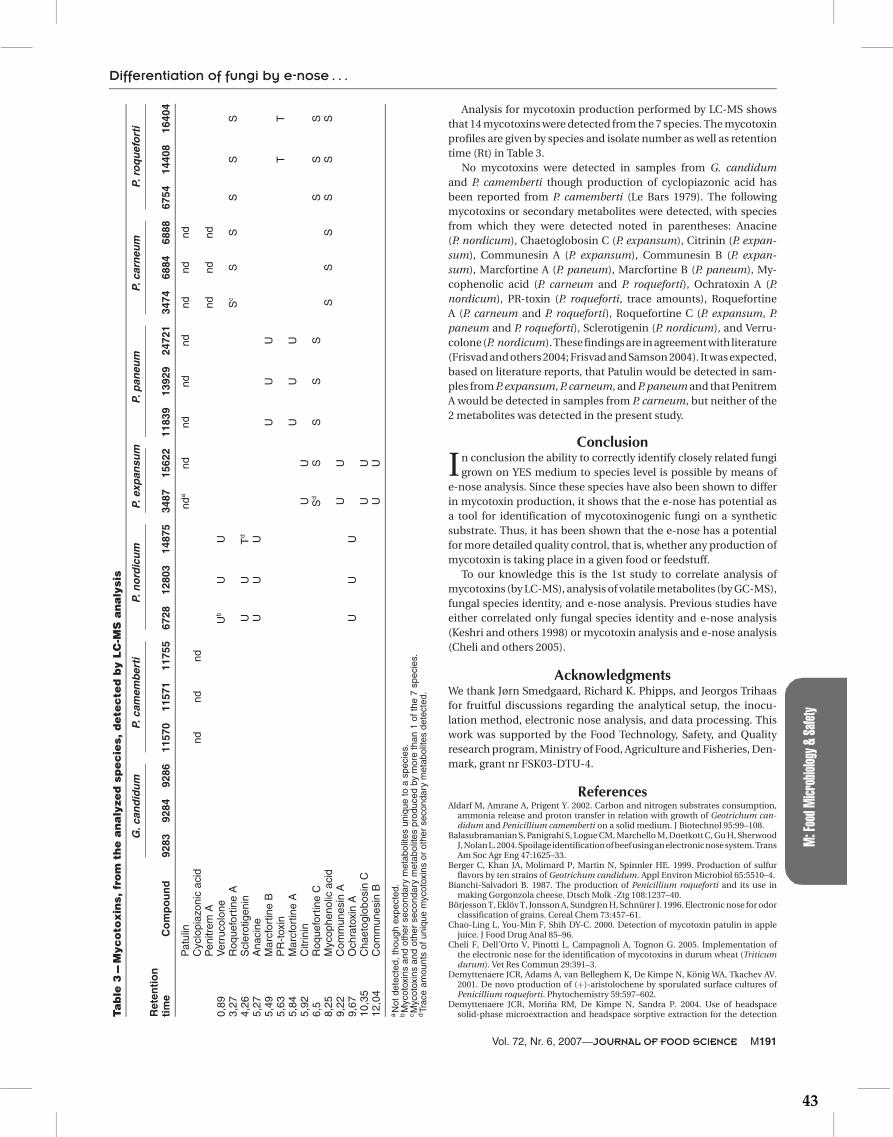
M:Fo
odMi
crob
iolog
y&Sa
fety
Differentiation of fungi by e-nose . . .
Tab
le3
---M
yco
tox
ins,
fro
mth
ea
na
lyze
dsp
ec
ies,
de
tec
ted
by
LC
-MS
an
aly
sis
G.c
and
idu
mP.
cam
emb
erti
P.n
ord
icu
mP.
exp
ansu
mP.
pan
eum
P.ca
rneu
mP.
roq
uef
ort
i
Ret
enti
on
tim
eC
om
po
un
d92
8392
8492
8611
570
1157
111
755
6728
1280
314
875
3487
1562
211
839
1392
924
721
3474
6884
6888
6754
1440
816
404
Pat
ulin
nda
ndnd
ndnd
ndnd
ndC
yclo
piaz
onic
acid
ndnd
ndP
enitr
emA
ndnd
nd0,
89V
erru
colo
neU
bU
U3,
27R
oque
fort
ine
AS
cS
SS
SS
4,26
Scl
erot
igen
inU
UT
d
5,27
Ana
cine
UU
U5,
49M
arcf
ortin
eB
UU
U5,
63P
R-t
oxin
TT
5,84
Mar
cfor
tine
AU
UU
5,92
Citr
inin
UU
6,5
Roq
uefo
rtin
eC
Sd
SS
SS
SS
S8,
25M
ycop
heno
licac
idS
SS
SS
S9,
22C
omm
unes
inA
UU
9,67
Och
rato
xin
AU
UU
10,3
5C
haet
oglo
bosi
nC
UU
12,0
4C
omm
unes
inB
UU
aN
otde
tect
ed,t
houg
hex
pect
ed.
bM
ycot
oxin
san
dot
her
seco
ndar
ym
etab
olite
sun
ique
toa
spec
ies.
cM
ycot
oxin
san
dot
her
seco
ndar
ym
etab
olite
spr
oduc
edby
mor
eth
an1
ofth
e7
spec
ies.
dTr
ace
amou
nts
ofun
ique
myc
otox
ins
orot
her
seco
ndar
ym
etab
olite
sde
tect
ed.
Analysis for mycotoxin production performed by LC-MS showsthat 14 mycotoxins were detected from the 7 species. The mycotoxinprofiles are given by species and isolate number as well as retentiontime (Rt) in Table 3.
No mycotoxins were detected in samples from G. candidumand P. camemberti though production of cyclopiazonic acid hasbeen reported from P. camemberti (Le Bars 1979). The followingmycotoxins or secondary metabolites were detected, with speciesfrom which they were detected noted in parentheses: Anacine(P. nordicum), Chaetoglobosin C (P. expansum), Citrinin (P. expan-sum), Communesin A (P. expansum), Communesin B (P. expan-sum), Marcfortine A (P. paneum), Marcfortine B (P. paneum), My-cophenolic acid (P. carneum and P. roqueforti), Ochratoxin A (P.nordicum), PR-toxin (P. roqueforti, trace amounts), RoquefortineA (P. carneum and P. roqueforti), Roquefortine C (P. expansum, P.paneum and P. roqueforti), Sclerotigenin (P. nordicum), and Verru-colone (P. nordicum). These findings are in agreement with literature(Frisvad and others 2004; Frisvad and Samson 2004). It was expected,based on literature reports, that Patulin would be detected in sam-ples from P. expansum, P. carneum, and P. paneum and that PenitremA would be detected in samples from P. carneum, but neither of the2 metabolites was detected in the present study.
Conclusion
In conclusion the ability to correctly identify closely related fungigrown on YES medium to species level is possible by means of
e-nose analysis. Since these species have also been shown to differin mycotoxin production, it shows that the e-nose has potential asa tool for identification of mycotoxinogenic fungi on a syntheticsubstrate. Thus, it has been shown that the e-nose has a potentialfor more detailed quality control, that is, whether any production ofmycotoxin is taking place in a given food or feedstuff.
To our knowledge this is the 1st study to correlate analysis ofmycotoxins (by LC-MS), analysis of volatile metabolites (by GC-MS),fungal species identity, and e-nose analysis. Previous studies haveeither correlated only fungal species identity and e-nose analysis(Keshri and others 1998) or mycotoxin analysis and e-nose analysis(Cheli and others 2005).
AcknowledgmentsWe thank Jørn Smedgaard, Richard K. Phipps, and Jeorgos Trihaasfor fruitful discussions regarding the analytical setup, the inocu-lation method, electronic nose analysis, and data processing. Thiswork was supported by the Food Technology, Safety, and Qualityresearch program, Ministry of Food, Agriculture and Fisheries, Den-mark, grant nr FSK03-DTU-4.
ReferencesAldarf M, Amrane A, Prigent Y. 2002. Carbon and nitrogen substrates consumption,
ammonia release and proton transfer in relation with growth of Geotrichum can-didum and Penicillium camemberti on a solid medium. J Biotechnol 95:99–108.
Balasubramanian S, Panigrahi S, Logue CM, Marchello M, Doetkott C, Gu H, SherwoodJ, Nolan L. 2004. Spoilage identification of beef using an electronic nose system. TransAm Soc Agr Eng 47:1625–33.
Berger C, Khan JA, Molimard P, Martin N, Spinnler HE. 1999. Production of sulfurflavors by ten strains of Geotrichum candidum. Appl Environ Microbiol 65:5510–4.
Bianchi-Salvadori B. 1987. The production of Penicillium roqueforti and its use inmaking Gorgonzola cheese. Dtsch Molk -Ztg 108:1237–40.
Borjesson T, Eklov T, Jonsson A, Sundgren H, Schnurer J. 1996. Electronic nose for odorclassification of grains. Cereal Chem 73:457–61.
Chao-Ling L, You-Min F, Shih DY-C. 2000. Detection of mycotoxin patulin in applejuice. J Food Drug Anal 85–96.
Cheli F, Dell’Orto V, Pinotti L, Campagnoli A, Tognon G. 2005. Implementation ofthe electronic nose for the identification of mycotoxins in durum wheat (Triticumdurum). Vet Res Commun 29:391–3.
Demyttenaere JCR, Adams A, van Belleghem K, De Kimpe N, Konig WA, Tkachev AV.2001. De novo production of (+)-aristolochene by sporulated surface cultures ofPenicillium roqueforti. Phytochemistry 59:597–602.
Demyttenaere JCR, Morina RM, De Kimpe N, Sandra P. 2004. Use of headspacesolid-phase microextraction and headspace sorptive extraction for the detection
Vol. 72, Nr. 6, 2007—JOURNAL OF FOOD SCIENCE M191
43
M:FoodMicrobiology&Safety
Differentiation of fungi by e-nose . . .
of the volatile metabolites produced by toxigenic Fusarium species. J ChromatogrA 1027:147–54.
Esbensen KH. 2001. Multivariate data analysis–in practice. Oslo: CAMO AS. 598 p.Filtenborg O, Frisvad JC, Thrane U. 1996. Moulds in food spoilage. Int J Food Microbiol
33:85–102.Frisvad JC, Filtenborg O. 1983. Classification of terverticillate Penicillia based on
profiles of mycotoxins and other secondary metabolites. Appl Environ Microbiol46:1301–10.
Frisvad JC, Filtenborg O. 1989. Terverticillate Penicillia: chemotaxonomy and myco-toxin production. Mycologia 81:837–61.
Frisvad JC, Samson RA. 2004. Polyphasic taxonomy of Penicillium subgenus Penicil-lium: a guide to identification of food and air-borne terverticillate Penicillia andtheir mycotoxins. Stud Mycol 1–173.
Frisvad JC, Smedsgaard J, Larsen TO, Samson RA. 2004. Mycotoxins, drugs and otherextrolites produced by species in Penicillium subgenus Penicillium. Stud Mycol49:201–42.
Hansen T, Petersen MA, Byrne DV. 2005. Sensory based quality control utilising anelectronic nose and GC-MS analyses to predict end-product quality from raw ma-terials. Meat Sci 69:621–34.
Jarvis B. 1983. Mould and mycotoxins in mouldy cheeses. Microbiol Alim Nutr 187–91.Jelen HH. 2002. Volatile sesquiterpene hydrocarbons characteristic for Penicillium
roqueforti strains producing PR toxin. J Agric Food Chem 50:6569–74.Jelen HH. 2003. Use of solid phase microextraction (SPME) for profiling fungal volatile
metabolites. Lett Appl Microbiol 36:263–7.Jelen HH, Mirocha CJ, Wasowicz E, Kaminski E. 1995. Production of volatile sesquiter-
penes by Fusarium sambucinum strains with different abilities to synthesize tri-chothecenes. Appl Environ Microbiol 61:3815–20.
Jonsson A, Winquist F, Schnurer J, Sundgren H, Lundstrom I. 1997. Electronic nose formicrobial quality classification of grains. Int J Food Microbiol 35:187–93.
Karlshøj K, Larsen TO. 2005. Differentiation of species from the Penicillium roquefortigroup by volatile metabolite profiling. J Agric Food Chem 53:708–15.
Keshri G, Magan N, Voysey P. 1998. Use of an electronic nose for the early detectionand differentiation between spoilage fungi. Lett Appl Microbiol 27:261–4.
Korel F, Balaban MO. 2002. Microbial and sensory assessment of milk with an electronicnose. J Food Sci 67:758–64.
Larsen TO. 1997. Identification of cheese-associated fungi using selected ion monitor-ing of volatile terpenes. Lett Appl Microbiol 24:463–6.
Larsen TO, Frisvad JC. 1995a. Characterization of volatile metabolites from 47 Penicil-lium-taxa. Mycol Res 99:1153–66.
Larsen TO, Frisvad JC. 1995b. Chemosystematics of Penicillium based on profiles ofvolatile metabolites. Mycol Res 99:1167–74.
Le Bars J. 1979. Cyclopiazonic acid production by Penicillium camemberti Thom andnatural occurrence of this mycotoxin in cheese. Appl Environ Microbiol 38:1052–5.
Lund F, Filtenborg O, Frisvad JC. 1995. Associated mycoflora of cheese. Food Microbiol12:173–80.
Lund F, Filtenborg O, Westall S, Frisvad JC. 1996. Associated mycoflora of rye bread.Lett Appl Microbiol 23:213–7.
Magan N, Evans P. 1999. Volatiles as an indicator of fungal activity and differentia-tion between species, and the potential use of electronic nose technology for earlydetection of grain spoilage. J Stored Prod Res 36:319–40.
Magan N, Pavlou A, Chrysanthakis I. 2001. Milk-sense: a volatile sensing system recog-nises spoilage bacteria and yeasts in milk. Sens Actuators, B 72:28–34.
Marth EH, Yousef AE. 1991. Fungi and dairy products. In: Arora DK, Mukerji KG, MarthEH, editors. Handbook of applied mycology, Vol. 3. New York: Marcel Dekker. p375–414.
Moreau C. 1980. Penicillium roqueforti, its morphology, physiology, use in cheesemak-ing, and mycotoxins. Lait 60:254–71.
Nielsen KF, Smedsgaard J. 2003. Fungal metabolite screening: database of 474mycotoxins and fungal metabolites for dereplication by standardised liquidchromatography-UV-mass spectrometry methodology. J Chromatogr A 1002:111–36.
Olsson J, Borjesson T, Lundstedt T, Schnurer J. 2002. Detection and quantification ofochratoxin A and deoxynivalenol in barley grains by GC-MS and electronic nose. IntJ Food Microbiol 72:203–14.
Rousseau M. 1984. Study of the surface flora of traditional Camembert cheese byscanning electron microscopy. Milchwissenschaft 39:129–35.
Samson RA, Eckardt C, Orth R. 1977. The taxonomy of Penicillium species from fer-mented cheeses. Antonie Leeuwenhoek 43:341–50.
Sewram V, Nair JJ, Nieuwoudt TW, Leggott NL, Shephard GS. 2000. Determinationof patulin in apple juice by high-performance liquid chromatography-atmosphericpressure chemical ionization mass spectrometry. J Chromatogr A 897:365–74.
Shephard GS, Leggott NL. 2000. Chromatographic determination of the mycotoxinpatulin in fruit and fruit juices. J Chromatogr A 882:17–22.
Siemens K, Zawistowski J. 1993. Occurrence of PR imine, a metabolite of Penicilliumroqueforti, in blue cheese. J Food Prot 56:317–9, 325.
Smedsgaard J. 1997. Micro-scale extraction procedure for standardized screening offungal metabolite production in cultures. J Chromatogr A 760:264–70.
Trihaas J, Nielsen PV. 2005. Electronic nose technology in quality assessment: moni-toring the ripening process of Danish blue cheese. J Food Sci 70:44–9.
Ventura M, Gomez A, Anaya I, Diaz J, Broto F, Agut M, Comellas L. 2004. Determinationof aflatoxins B1, G1, B2 and G2 in medicinal herbs by liquid chromatography-tandemmass spectrometry. J Chromatogr A 1048:25–9.
Vinaixa M, Marin S, Brezmes J, Llobet E, Vilanova X, Correig X, Ramos A, Sanchis V.2004. Early detection of fungal growth in bakery products by use of an electronicnose based on mass spectrometry. J Agric Food Chem 52:6068–74.
M192 JOURNAL OF FOOD SCIENCE—Vol. 72, Nr. 6, 2007
44
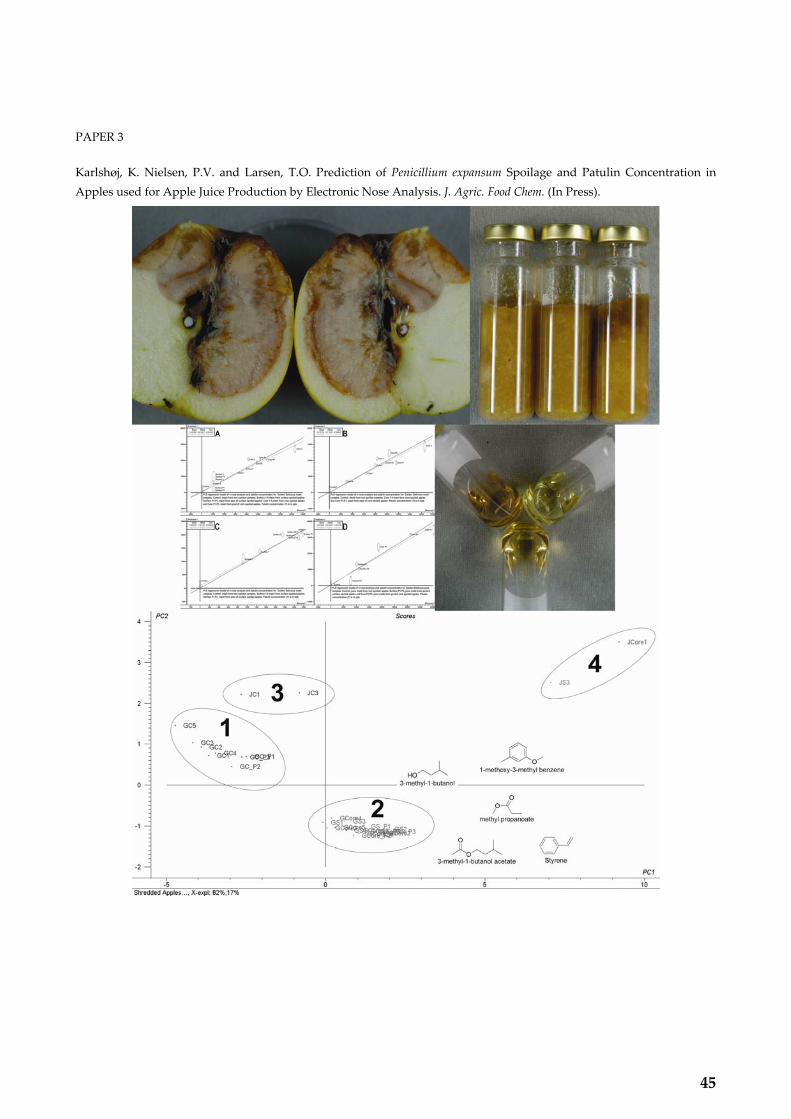
PAPER 3
Karlshøj, K. Nielsen, P.V. and Larsen, T.O. Prediction of Penicillium expansum Spoilage and Patulin Concentration in Apples used for Apple Juice Production by Electronic Nose Analysis. J. Agric. Food Chem. (In Press).
45

46

ARTICLES
Prediction of Penicillium expansum Spoilage and PatulinConcentration in Apples Used for Apple Juice Production by
Electronic Nose Analysis
KRISTIAN KARLSHØJ,* PER V. NIELSEN, AND THOMAS O. LARSEN
Center for Microbial Biotechnology, BioCentrum-DTU, Building 221, Technical University ofDenmark, DK-2800 Kgs. Lyngby, Denmark
Classification models for Penicillium expansum spoilage of apples and prediction models for patulinconcentration in apples usable for apple juice production were made on the basis of electronic nose(e-nose) analysis correlated to HPLC quantification of patulin. A total of 15 Golden Delicious and 4Jonagold apples were surface sterilized and divided into three groups per variety. The Golden Deliciousgroup consisted of five apples each. Group 1 was untreated control, group 2 was surface inoculatedwith P. expansum, and group 3 was inoculated in the core with P. expansum. The apples wereincubated at 25 °C for 10 days. E-nose analysis was performed daily. At day 10 the Golden Deliciousapples were individually processed for apple juice production. During apple juice production the mashand juice were analyzed by e-nose, and samples were taken for patulin analysis by HPLC. The volatilemetabolite profile was obtained by collection of volatile metabolites, on tubes containing Tenax TA,overnight between the 9th and 10th days of incubation and subsequent analysis of the collectedcompounds by GC-MS. Prediction models using partial least-squares, with high correlation, forprediction of patulin concentration in shredded apples as well as apple juice were successfully created.It was also shown that it is possible to classify P. expansum spoilage in apples correctly on the basisof soft independent modeling of class analogy classification of e-nose analysis data. To the authors’knowledge this is the first report of a regression model between e-nose data and mycotoxin contentin which actual concentrations are reported. This implies that it is possible to predict mycotoxinproduction and concentration by e-nose analysis.
KEYWORDS: Patulin; electronic nose; prediction models; Penicillium expansum ; apple juice; volatile
organic compounds; volatile metabolite profiling
INTRODUCTION
In the food industry quality control typically relies on randomsampling of the product, description of flavor and aroma bysensory panels, volatile and/or headspace analysis by GC-MS,and mycotoxin analysis by HPLC (1). These methods are bothtime-consuming and expensive; therefore, it is desirable toimprove quality control measures, for instance, by combiningrapid analysis of volatiles with correlations to mycotoxinproduction.
The electronic nose (e-nose) has already shown its potentialas a replacement for sensory panel analysis, for instance, inquality control of fruit ripeness (2), grain odor (3), packagedpoultry meat (4), meat end-products (5), and Danish blue cheese(6-8) and even as a replacement for GC-MS analysis (9, 10).
Remaining to be done is the analysis of mycotoxin content,which is still performed by HPLC or LC-MS analysis. Only alimited number of studies (11, 12) have tried to make predictionsof mycotoxin contents based on e-nose response. Olsson et al.(12), in their combined GC-MS and e-nose analysis of grainsamples, did show the possibility of predicting the mycotoxinlevel in spoiled grain by partial least-squares (PLS) modeling.The model could not, however, differentiate with sufficientaccuracy between samples containing more or less than 5µg/kg ochratoxin A, the threshold level established by the SwedishNational Food Administration. Cheli et al. (11) looked atidentifying mycotoxins in durum grain by e-nose analysis butdid not identify the spoilage organism or go beyond principalcomponent analysis (PCA) investigation to make a correlationmodel between e-nose data and mycotoxin concentrations.
To investigate the potential for mycotoxin prediction bye-nose analysis we chose to work with apples, as the associated
* Corresponding author (telephone+45 4525 2725; fax+45 4588 4922;e-mail [email protected]).
J. Agric. Food Chem. 2007, 55, 4289−4298 4289
10.1021/jf070134x CCC: $37.00 © 2007 American Chemical SocietyPublished on Web 04/26/2007
47

funga of apples is fairly limited (13), especially in storagecontamination, wherePenicillium expansumby far is thedominant species. It is known that the incidence ofP. expansumspoilage of apples is increased by damage to the apples; hence,P. expansumspoilage mainly occurs on windfall apples. Storageof windfall apples prior to industrial processing is thereforelikely to be the main cause ofP. expansumspoilage and thusmycotoxin content.P. expansumis a known patulin producer(14), and food safety authorities, such as the U.S. Food andDrug Administration (FDA) and the Commission of theEuropean Communities (EC), have introduced a threshold levelof acceptance, 50 ppb, regarding patulin content in apple juiceand other apple products (15, 16).
P. expansumspoilage of and hence patulin content in applesis a well-known problem for the apple juice industry as applesare commonly stored prior to production due to processingcapacity limitations; furthermore, apples used for juice produc-tion are frequently of a lesser quality than apples sold forconsumption in, for instance, supermarkets. Because of thespoilage and mycotoxin problem several HPLC analysis methodshave been developed for patulin quantification in apple juicesamples (17-21). Several different sample preparation methodshave also been developed in order to have a more robust analysiswith increased sensitivity (22, 23).
Because apple juice production is an industrial process it isnot feasible or for that matter possible to inspect individual applequality visually. It is therefore desirable to use screeningmethods that are rapid and can be used in large scale; e-noseanalysis has a potential to fulfill these requirements.
The first aim of this study was to use e-nose analysis toclassify both spoiled and nonspoiled samples, thus creating aclassification model. Second, it was aimed to correlate the e-noseresponse with the mycotoxin level in a given sample, thuscreating a prediction model for mycotoxin content based one-nose analysis. It was not the aim of this study to predictbiomass. The choice of model system in this study was applesused for apple juice production and the major problem in applejuice production, that is, storage spoilage byP. expansumandhence patulin production byP. expansum. The study wasconducted as a “worst case” study by analysis of spoiled ornonspoiled samples. In this study the choice of apple varietyfor the major part of the study was Golden Delicious, whereasJonagold apples were chosen for investigating apple varietyinfluence on the e-nose analysis and prediction modeling.
MATERIALS AND METHODS
Fungi and Media. The P. expansumisolate, IBT 3487, the typeculture used in this study, was obtained from the Fungal CultureCollection at BioCentrum-DTU (IBT collection), Technical Universityof Denmark, Kgs. Lyngby, Denmark. The apples, Golden Deliciousand Jonagold, used in the experiment were obtained from the localsupermarket and were surface sterilized by immersion in 96% ethanolfor 1 min, then immersion in 3% hypochlorite solution for 1 min, andre-immersion in the 96% ethanol bath for 1 min, after which the appleswere rinsed with autoclaved Milli-Q water and dried in a sterilizedlaminar flow bench.
A total of 15 Golden Delicious apples were surface sterilized anddivided into three groups of 5 apples (replicates) each. Group 1 wasuntreated control, group 2 was surface-inoculated withP. expansum,and group 3 was inoculated in the core withP. expansum. Four Jonagoldapples were surface sterilized, of which two apples were used asuntreated control apples, one apple was surface-inoculated withP.expansum, and one apple was core-inoculated withP. expansum.
The surface-inoculated apples were stab wounded with a sterilizedneedle (7 mm deep wound), and 20µL of spore suspension (>106
spores/mL) was put on the wound.Core-inoculated apples were inoculated through the flower opening
via a syringe, and 0.2 mL of spore suspension (>106 spores/mL) wasinjected. The apples were individually incubated in ethanol-sterilized600 mL beaker glasses covered with Parafilm M (Alcan Packaging,Menasha, WI) at 25°C in the dark for 10 days.
Apple Juice Production. Juice was only made from GoldenDelicious apples. The processing steps were performed by imitatingindustrial apple juice production methods. After the 10 day incubation,the apples were individually shredded. Between 15 and 15.3 g was putin headspace flasks for electronic nose analysis (both Golden Deliciousand Jonagold samples), and between 2 and 2.4 g was stored inheadspace flasks for HPLC analysis (Golden Delicious samples only).The e-nose samples (Golden Delicious samples only) were treated with12µL of 10× diluted pectinase solution (Pectinex Smash) (Novozymes,Bagsværd, Denmark) and the samples left for 30 min at roomtemperature. The juice was then pressed using a funnel and Whatmanfilters (Whatman International, Brentford, U.K.) by pressing the mashwith a metal spatula. The juice was collected in 20 mL headspace flasks(75.5 × 22.5 mm), and the flasks were sealed with crimp caps (3.0mm membrane thickness silicone/PTFE caps). The juice was thenpasteurized by immersion of the bottle in a 98°C water bath for 60 s.After pasteurization, 10µL of 3× diluted pectinase solution was added,and the samples were heated in a 53°C cabinet for 60 min. Clearingof the juice was performed by adding 2-3 grains of Clarit WGBentonite (Su¨d-Chemie AG, Moosburg, Germany), after which thesample was shaken for 5 min; then 10µL of Gammasol Kieselsol(Gamma Chemie GmbH, Darmstadt, Germany) solution was added,
Figure 1. Discoloring of apple flesh by P. expansum in Jonagold apples (left) and the resulting apple mash (right). The four flasks with apple mash arefrom (A) a core-infected apple, (B, B) two control apples (mash showing browning at the surface), and (C) a surface-infected apple.
4290 J. Agric. Food Chem., Vol. 55, No. 11, 2007 Karlshøj et al.
48

and the sample was shaken for another 5 min. Finally, approximately10 µg of Rousselot gelatin 75 PS 30 was added, and the sample wasshaken for another 5 min and then left overnight in the 53°C cabinet.The cleared samples were centrifuged (15000g) for 5 min, and thesupernatant was transferred to fresh 20 mL headspace flasks (75.5×22.5 mm), which were sealed with crimp caps (3.0 mm membranethickness silicone/PTFE caps).
Collection and Analysis of Volatile Metabolites.Volatile metabo-lites were collected overnight from all 15 whole Golden Deliciousapples between days 9 and 10. The volatiles were collected by diffusivesampling onto Tenax TA adsorption material placed in Perkin-Elmertubes, and the tubes were placed inside glass beakers. Volatiles collectedwere thermally desorbed on a Perkin-Elmer ATD 400 coupled to aHewlett-Packard 5890 gas chromatograph further coupled to a HP 5972mass selective detector. Separation of the volatiles was done on a 60m, 0.25 mm i.d., 1.0µm VB-5 ValcoBond capillary column (SIS,Ringoes, NJ) using He as carrier gas. Initial pressure was 13 psi, andthe He flow was 1 mL/min. The system was run at a 75:1 split, andthe injection temperature was set to 250°C. Chromatographic conditionswere as follows: initial temperature, 35°C for 1 min, raised at 4°C/min to 175°C and then at 10°C/min to 260°C. Separated compoundswere characterized (tentatively identified) by their mass spectragenerated by electron ionization (EI) at 70 eV at a scan range fromm/z 33 to 330.
Electronic Nose Measurements.The headspace of the all 15 GoldenDelicious whole apples was analyzed daily on an e-nose from days 1through 10 by manual injection of 1500µL of the headspace from the600 mL beakers containing each apple using a gastight Hamiltonsyringe. For all of the shredded apple samples (both Golden Deliciousand Jonagold) and all of the juice samples (only Golden Delicious) anHS-100 autosampler (CTC Analytics AG, Zwingen, Switzerland) wasused; these samples were incubated for 1 min at 35°C, after which1500µL of the sample was withdrawn from the headspace and injectedin the sensor chamber and flushed over the sensors at a rate of 150mL/min. All e-nose samples were analyzed on anRFox-3000 (AlphaM.O.S., Toulouse, France) e-nose. The sensor array system consistedof 12 metal oxide semiconductor (MOS) sensors. MOS sensors areknown to be among the least moisture sensitive sensors available (24).
Data collection was performed every half second for 2 min, afterwhich the sensors were flushed with dry air (maximum air humidity) 0.5%) for 2 min; furthermore, there was a 2 min delay before thenext sample was analyzed.
Extraction and Analysis of Patulin. Extraction.A modified versionof the method used by Eisele and Gibson (23) was used. Ten millilitersof Milli-Q water was added to each headspace flask containing 2.0-2.4 g of apple mash and left for extraction on an ultrasound bath for30 min; 2.5 mL of supernatant from each sample was transferred to2.5 mL Eppendorf tubes and centrifuged at 15000g for 5 min. Strata-X(30 mg/1 mL, 33 µm) polymeric reversed phase SPE columns(Phenomenex, Torrance, CA) were prepared for sample purificationby rinsing the columns with 2× 1 mL of methanol (Sigma-Aldrich,St. Louis, MO) and then with 2× 1 mL of Milli-Q water. Two
milliliters of sample was loaded on each column, after which thecolumns were washed with 2× 1 mL of 1% sodium bicarbonate andthen 2× 1 mL of 1% acetic acid solution. The columns were left todry for 1 min, after which the samples were eluted into HPLC vialswith 1.5 mL of 30% acetonitrile.
Quantification of Patulin.Patulin standards were made at concentra-tions of 10, 25, 50, 100, and 205µg/L by diluting a standard (100µg/mL in chloroform) (Supelco, Bellefonte, PA) in acetonitrile andanalyzed by HPLC.
Patulin RecoVery from Apples.Two grams of apple mash was spikedwith patulin standard (100µg/mL in chloroform) at the followinglevels: 2, 4, 7.5, 12.5, and 20 mg/kg (by adding 40, 80, 150, 250, and400µL of patulin standard to the apples, respectively). The chloroformwas removed by nitrogen evaporation while the samples were kept at40 °C on a heating block. After this, the samples were treated as theother apple samples by SPE and analyzed by HPLC.
Chemicals. Chemicals used in HPLC analysis were as follows:acetonitrile, gradient grade, and trifluoroacetic acid (Sigma-Aldrich,St. Louis, MO); water, Milli-Q grade.
HPLC-DAD Instrument. HPLC-DAD analysis was done on anAgilent HP 1100 with a photodiode array detector (DAD) (Agilent,Boblingen, Germany). Ten microliters of sample was injected, althoughfor the patulin standards only 3µL was injected. The column usedwas a 150× 2.0 mm i.d., 3µm CuroSil-PFP column (Phenomenex)with a 4× 2 mm i.d. Phenyl (phenylpropyl) guard column (Phenom-enex). The flow rate was 0.3 mL/min with a linear water/acetonitrilegradient starting at 96:4 (water/acetonitrile) going to 25% acetonitrilein 5 min, and then returning to starting conditions (96:4) in 3 min andequilibrating for 8 min. Trifluoroacetic acid (50 ppm) was added to
Figure 2. Discoloring of apple flesh by P. expansum in Golden Delicious apples (left) and the resulting apple mash (right). The three flasks with applemash are from (A) a control apple (mash already showing more browning at the surface), (B) a surface-infected apple, and (C) a core-infected apple.
Figure 3. Apple juice from Golden Delicious apples with various amountsof P. expansum spoilage: (A) juice from control apples; (B) juice fromsurface-infected apples; (C) juice from core-infected apples.
Patulin Prediction by E-Nose Analysis J. Agric. Food Chem., Vol. 55, No. 11, 2007 4291
49
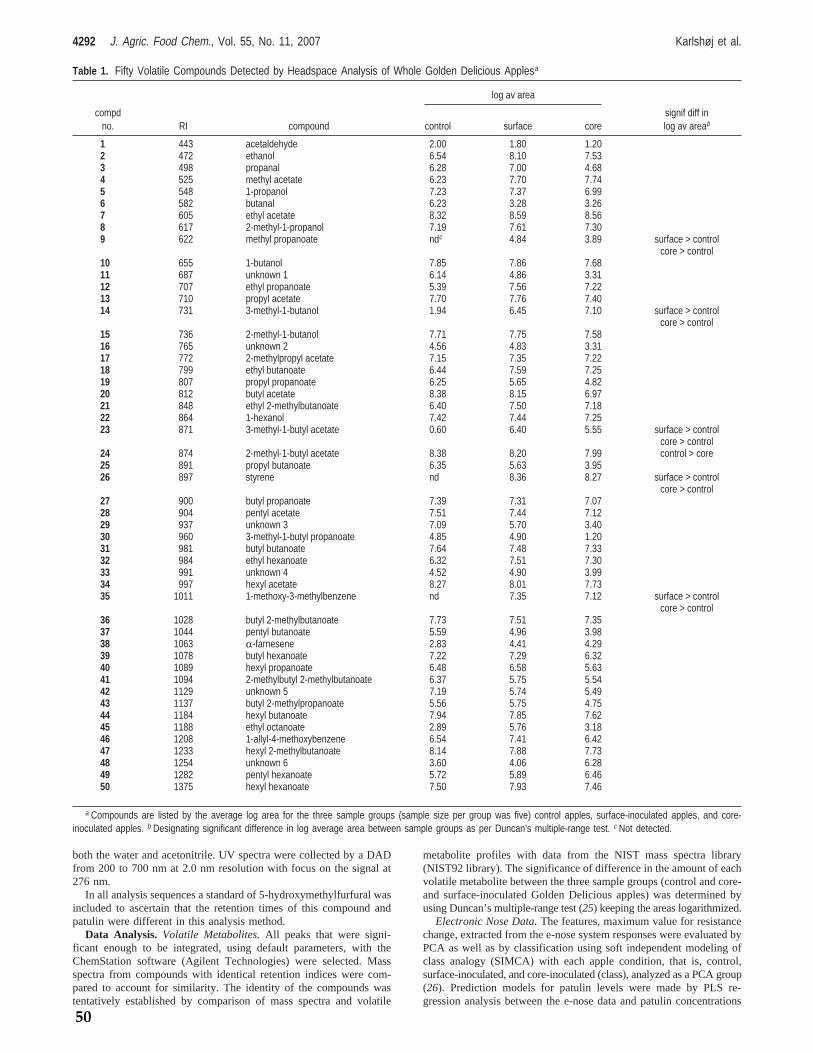
both the water and acetonitrile. UV spectra were collected by a DADfrom 200 to 700 nm at 2.0 nm resolution with focus on the signal at276 nm.
In all analysis sequences a standard of 5-hydroxymethylfurfural wasincluded to ascertain that the retention times of this compound andpatulin were different in this analysis method.
Data Analysis. Volatile Metabolites.All peaks that were signi-ficant enough to be integrated, using default parameters, with theChemStation software (Agilent Technologies) were selected. Massspectra from compounds with identical retention indices were com-pared to account for similarity. The identity of the compounds wastentatively established by comparison of mass spectra and volatile
metabolite profiles with data from the NIST mass spectra library(NIST92 library). The significance of difference in the amount of eachvolatile metabolite between the three sample groups (control and core-and surface-inoculated Golden Delicious apples) was determined byusing Duncan’s multiple-range test (25) keeping the areas logarithmized.
Electronic Nose Data.The features, maximum value for resistancechange, extracted from the e-nose system responses were evaluated byPCA as well as by classification using soft independent modeling ofclass analogy (SIMCA) with each apple condition, that is, control,surface-inoculated, and core-inoculated (class), analyzed as a PCA group(26). Prediction models for patulin levels were made by PLS re-gression analysis between the e-nose data and patulin concentrations
Table 1. Fifty Volatile Compounds Detected by Headspace Analysis of Whole Golden Delicious Applesa
log av area
compdno. RI compound control surface core
signif diff inlog av areab
1 443 acetaldehyde 2.00 1.80 1.202 472 ethanol 6.54 8.10 7.533 498 propanal 6.28 7.00 4.684 525 methyl acetate 6.23 7.70 7.745 548 1-propanol 7.23 7.37 6.996 582 butanal 6.23 3.28 3.267 605 ethyl acetate 8.32 8.59 8.568 617 2-methyl-1-propanol 7.19 7.61 7.309 622 methyl propanoate ndc 4.84 3.89 surface > control
core > control10 655 1-butanol 7.85 7.86 7.6811 687 unknown 1 6.14 4.86 3.3112 707 ethyl propanoate 5.39 7.56 7.2213 710 propyl acetate 7.70 7.76 7.4014 731 3-methyl-1-butanol 1.94 6.45 7.10 surface > control
core > control15 736 2-methyl-1-butanol 7.71 7.75 7.5816 765 unknown 2 4.56 4.83 3.3117 772 2-methylpropyl acetate 7.15 7.35 7.2218 799 ethyl butanoate 6.44 7.59 7.2519 807 propyl propanoate 6.25 5.65 4.8220 812 butyl acetate 8.38 8.15 6.9721 848 ethyl 2-methylbutanoate 6.40 7.50 7.1822 864 1-hexanol 7.42 7.44 7.2523 871 3-methyl-1-butyl acetate 0.60 6.40 5.55 surface > control
core > control24 874 2-methyl-1-butyl acetate 8.38 8.20 7.99 control > core25 891 propyl butanoate 6.35 5.63 3.9526 897 styrene nd 8.36 8.27 surface > control
core > control27 900 butyl propanoate 7.39 7.31 7.0728 904 pentyl acetate 7.51 7.44 7.1229 937 unknown 3 7.09 5.70 3.4030 960 3-methyl-1-butyl propanoate 4.85 4.90 1.2031 981 butyl butanoate 7.64 7.48 7.3332 984 ethyl hexanoate 6.32 7.51 7.3033 991 unknown 4 4.52 4.90 3.9934 997 hexyl acetate 8.27 8.01 7.7335 1011 1-methoxy-3-methylbenzene nd 7.35 7.12 surface > control
core > control36 1028 butyl 2-methylbutanoate 7.73 7.51 7.3537 1044 pentyl butanoate 5.59 4.96 3.9838 1063 R-farnesene 2.83 4.41 4.2939 1078 butyl hexanoate 7.22 7.29 6.3240 1089 hexyl propanoate 6.48 6.58 5.6341 1094 2-methylbutyl 2-methylbutanoate 6.37 5.75 5.5442 1129 unknown 5 7.19 5.74 5.4943 1137 butyl 2-methylpropanoate 5.56 5.75 4.7544 1184 hexyl butanoate 7.94 7.85 7.6245 1188 ethyl octanoate 2.89 5.76 3.1846 1208 1-allyl-4-methoxybenzene 6.54 7.41 6.4247 1233 hexyl 2-methylbutanoate 8.14 7.88 7.7348 1254 unknown 6 3.60 4.06 6.2849 1282 pentyl hexanoate 5.72 5.89 6.4650 1375 hexyl hexanoate 7.50 7.93 7.46
a Compounds are listed by the average log area for the three sample groups (sample size per group was five) control apples, surface-inoculated apples, and core-inoculated apples. b Designating significant difference in log average area between sample groups as per Duncan’s multiple-range test. c Not detected.
4292 J. Agric. Food Chem., Vol. 55, No. 11, 2007 Karlshøj et al.
50
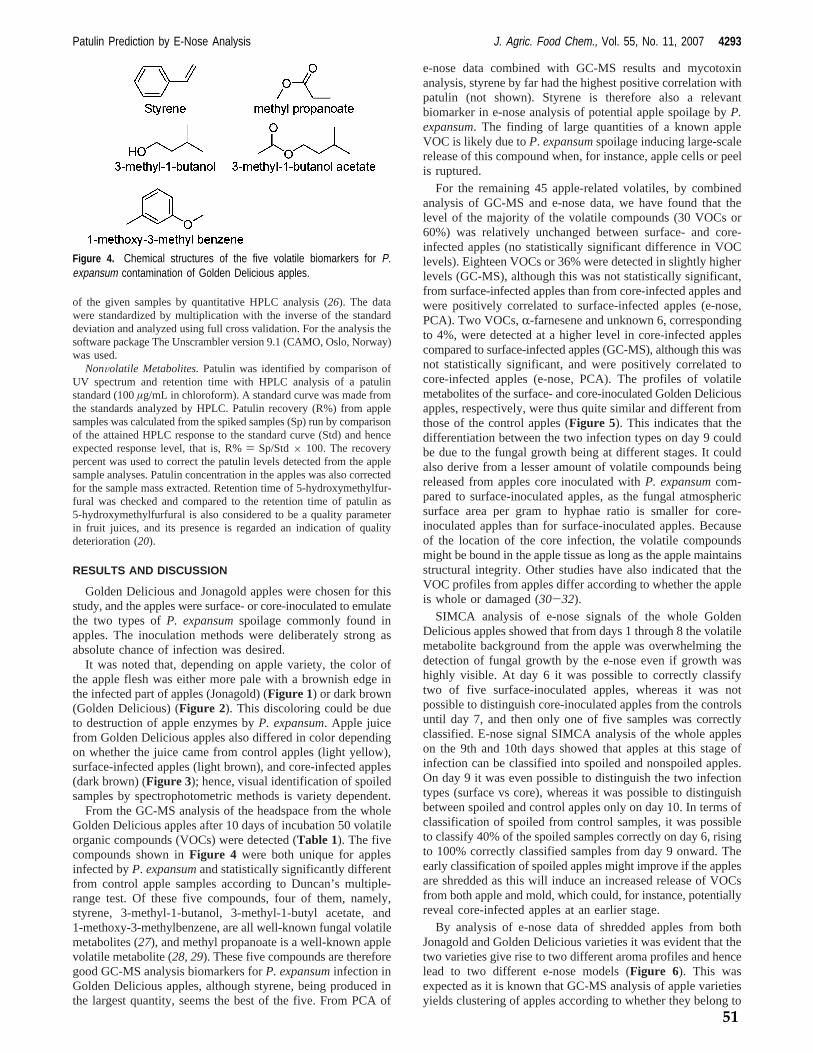
of the given samples by quantitative HPLC analysis (26). The datawere standardized by multiplication with the inverse of the standarddeviation and analyzed using full cross validation. For the analysis thesoftware package The Unscrambler version 9.1 (CAMO, Oslo, Norway)was used.
NonVolatile Metabolites.Patulin was identified by comparison ofUV spectrum and retention time with HPLC analysis of a patulinstandard (100µg/mL in chloroform). A standard curve was made fromthe standards analyzed by HPLC. Patulin recovery (R%) from applesamples was calculated from the spiked samples (Sp) run by comparisonof the attained HPLC response to the standard curve (Std) and henceexpected response level, that is, R%) Sp/Std× 100. The recoverypercent was used to correct the patulin levels detected from the applesample analyses. Patulin concentration in the apples was also correctedfor the sample mass extracted. Retention time of 5-hydroxymethylfur-fural was checked and compared to the retention time of patulin as5-hydroxymethylfurfural is also considered to be a quality parameterin fruit juices, and its presence is regarded an indication of qualitydeterioration (20).
RESULTS AND DISCUSSION
Golden Delicious and Jonagold apples were chosen for thisstudy, and the apples were surface- or core-inoculated to emulatethe two types ofP. expansumspoilage commonly found inapples. The inoculation methods were deliberately strong asabsolute chance of infection was desired.
It was noted that, depending on apple variety, the color ofthe apple flesh was either more pale with a brownish edge inthe infected part of apples (Jonagold) (Figure 1) or dark brown(Golden Delicious) (Figure 2). This discoloring could be dueto destruction of apple enzymes byP. expansum. Apple juicefrom Golden Delicious apples also differed in color dependingon whether the juice came from control apples (light yellow),surface-infected apples (light brown), and core-infected apples(dark brown) (Figure 3); hence, visual identification of spoiledsamples by spectrophotometric methods is variety dependent.
From the GC-MS analysis of the headspace from the wholeGolden Delicious apples after 10 days of incubation 50 volatileorganic compounds (VOCs) were detected (Table 1). The fivecompounds shown inFigure 4 were both unique for applesinfected byP. expansumand statistically significantly differentfrom control apple samples according to Duncan’s multiple-range test. Of these five compounds, four of them, namely,styrene, 3-methyl-1-butanol, 3-methyl-1-butyl acetate, and1-methoxy-3-methylbenzene, are all well-known fungal volatilemetabolites (27), and methyl propanoate is a well-known applevolatile metabolite (28, 29). These five compounds are thereforegood GC-MS analysis biomarkers forP. expansuminfection inGolden Delicious apples, although styrene, being produced inthe largest quantity, seems the best of the five. From PCA of
e-nose data combined with GC-MS results and mycotoxinanalysis, styrene by far had the highest positive correlation withpatulin (not shown). Styrene is therefore also a relevantbiomarker in e-nose analysis of potential apple spoilage byP.expansum. The finding of large quantities of a known appleVOC is likely due toP. expansumspoilage inducing large-scalerelease of this compound when, for instance, apple cells or peelis ruptured.
For the remaining 45 apple-related volatiles, by combinedanalysis of GC-MS and e-nose data, we have found that thelevel of the majority of the volatile compounds (30 VOCs or60%) was relatively unchanged between surface- and core-infected apples (no statistically significant difference in VOClevels). Eighteen VOCs or 36% were detected in slightly higherlevels (GC-MS), although this was not statistically significant,from surface-infected apples than from core-infected apples andwere positively correlated to surface-infected apples (e-nose,PCA). Two VOCs,R-farnesene and unknown 6, correspondingto 4%, were detected at a higher level in core-infected applescompared to surface-infected apples (GC-MS), although this wasnot statistically significant, and were positively correlated tocore-infected apples (e-nose, PCA). The profiles of volatilemetabolites of the surface- and core-inoculated Golden Deliciousapples, respectively, were thus quite similar and different fromthose of the control apples (Figure 5). This indicates that thedifferentiation between the two infection types on day 9 couldbe due to the fungal growth being at different stages. It couldalso derive from a lesser amount of volatile compounds beingreleased from apples core inoculated withP. expansumcom-pared to surface-inoculated apples, as the fungal atmosphericsurface area per gram to hyphae ratio is smaller for core-inoculated apples than for surface-inoculated apples. Becauseof the location of the core infection, the volatile compoundsmight be bound in the apple tissue as long as the apple maintainsstructural integrity. Other studies have also indicated that theVOC profiles from apples differ according to whether the appleis whole or damaged (30-32).
SIMCA analysis of e-nose signals of the whole GoldenDelicious apples showed that from days 1 through 8 the volatilemetabolite background from the apple was overwhelming thedetection of fungal growth by the e-nose even if growth washighly visible. At day 6 it was possible to correctly classifytwo of five surface-inoculated apples, whereas it was notpossible to distinguish core-inoculated apples from the controlsuntil day 7, and then only one of five samples was correctlyclassified. E-nose signal SIMCA analysis of the whole appleson the 9th and 10th days showed that apples at this stage ofinfection can be classified into spoiled and nonspoiled apples.On day 9 it was even possible to distinguish the two infectiontypes (surface vs core), whereas it was possible to distinguishbetween spoiled and control apples only on day 10. In terms ofclassification of spoiled from control samples, it was possibleto classify 40% of the spoiled samples correctly on day 6, risingto 100% correctly classified samples from day 9 onward. Theearly classification of spoiled apples might improve if the applesare shredded as this will induce an increased release of VOCsfrom both apple and mold, which could, for instance, potentiallyreveal core-infected apples at an earlier stage.
By analysis of e-nose data of shredded apples from bothJonagold and Golden Delicious varieties it was evident that thetwo varieties give rise to two different aroma profiles and hencelead to two different e-nose models (Figure 6). This wasexpected as it is known that GC-MS analysis of apple varietiesyields clustering of apples according to whether they belong to
Figure 4. Chemical structures of the five volatile biomarkers for P.expansum contamination of Golden Delicious apples.
Patulin Prediction by E-Nose Analysis J. Agric. Food Chem., Vol. 55, No. 11, 2007 4293
51

the red skin, green skin (Golden Delicious), or red and greenskin (Jonagold) category (33).
The HPLC analysis method developed proved sufficient todistinguish between 5-hydroxymethylfurfural and patulin withretention times of 4.77 and 5.79 min, respectively (Figure 7).
Patulin analysis revealed that patulin, in Golden Deliciousapples, had been produced at quite high levels byP. expansumin both core and surface inoculations. The patulin concentrationswere 3-4 times higher in core-inoculated apples compared tothe surface-inoculated apples, probably due to the higher degree
Figure 5. GC-MS chromatogram of the headspace from Golden Delicious apples: (A) control apple; (B) core-infected apple; (C) surface-infected apple.The abundance scale is in percentage of the abundance given in the top left corner of each chromatogram. The noteworthy compounds are numberedcorresponding to the numbering of compounds in Table 1 .
4294 J. Agric. Food Chem., Vol. 55, No. 11, 2007 Karlshøj et al.
52
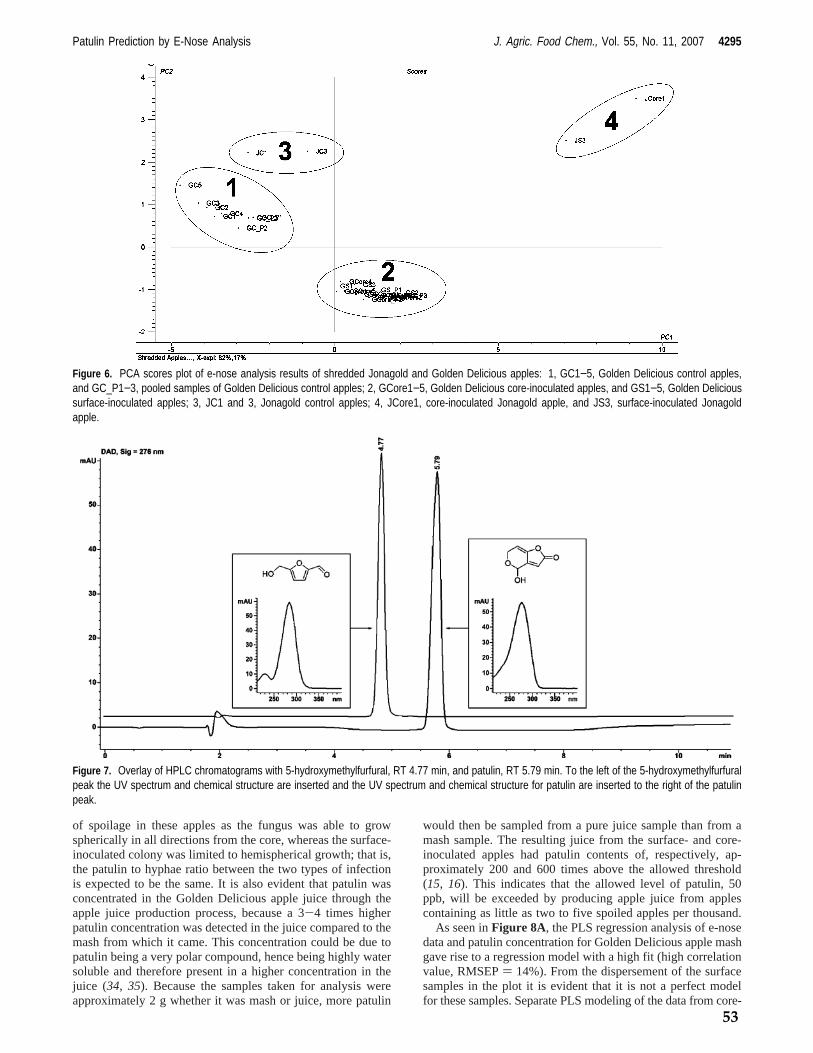
of spoilage in these apples as the fungus was able to growspherically in all directions from the core, whereas the surface-inoculated colony was limited to hemispherical growth; that is,the patulin to hyphae ratio between the two types of infectionis expected to be the same. It is also evident that patulin wasconcentrated in the Golden Delicious apple juice through theapple juice production process, because a 3-4 times higherpatulin concentration was detected in the juice compared to themash from which it came. This concentration could be due topatulin being a very polar compound, hence being highly watersoluble and therefore present in a higher concentration in thejuice (34, 35). Because the samples taken for analysis wereapproximately 2 g whether it was mash or juice, more patulin
would then be sampled from a pure juice sample than from amash sample. The resulting juice from the surface- and core-inoculated apples had patulin contents of, respectively, ap-proximately 200 and 600 times above the allowed threshold(15, 16). This indicates that the allowed level of patulin, 50ppb, will be exceeded by producing apple juice from applescontaining as little as two to five spoiled apples per thousand.
As seen inFigure 8A, the PLS regression analysis of e-nosedata and patulin concentration for Golden Delicious apple mashgave rise to a regression model with a high fit (high correlationvalue, RMSEP) 14%). From the dispersement of the surfacesamples in the plot it is evident that it is not a perfect modelfor these samples. Separate PLS modeling of the data from core-
Figure 6. PCA scores plot of e-nose analysis results of shredded Jonagold and Golden Delicious apples: 1, GC1−5, Golden Delicious control apples,and GC_P1−3, pooled samples of Golden Delicious control apples; 2, GCore1−5, Golden Delicious core-inoculated apples, and GS1−5, Golden Delicioussurface-inoculated apples; 3, JC1 and 3, Jonagold control apples; 4, JCore1, core-inoculated Jonagold apple, and JS3, surface-inoculated Jonagoldapple.
Figure 7. Overlay of HPLC chromatograms with 5-hydroxymethylfurfural, RT 4.77 min, and patulin, RT 5.79 min. To the left of the 5-hydroxymethylfurfuralpeak the UV spectrum and chemical structure are inserted and the UV spectrum and chemical structure for patulin are inserted to the right of the patulinpeak.
Patulin Prediction by E-Nose Analysis J. Agric. Food Chem., Vol. 55, No. 11, 2007 4295
53
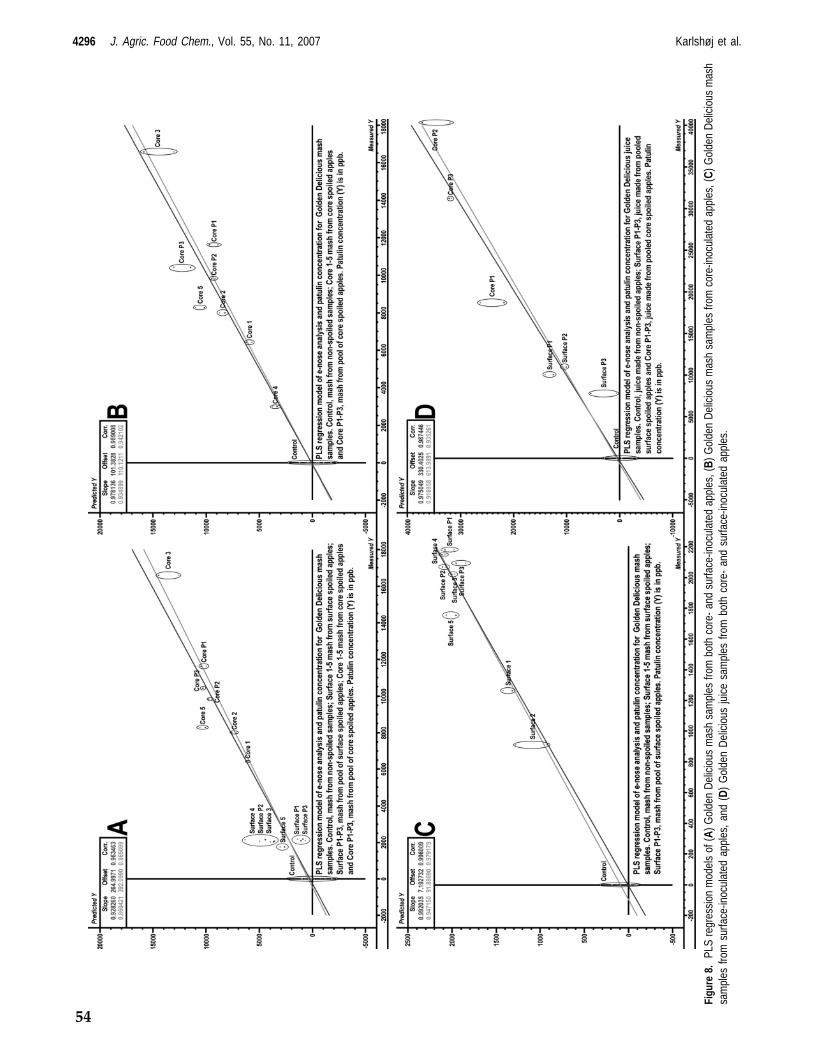
Figu
re8.
PLS
regr
essi
onm
odel
sof
(A)G
olde
nD
elic
ious
mas
hsa
mpl
esfro
mbo
thco
re-a
ndsu
rface
-inoc
ulat
edap
ples
,(B)
Gol
den
Del
icio
usm
ash
sam
ples
from
core
-inoc
ulat
edap
ples
,(C)
Gol
den
Del
icio
usm
ash
sam
ples
from
surfa
ce-in
ocul
ated
appl
es,a
nd(D
)G
olde
nD
elic
ious
juic
esa
mpl
esfro
mbo
thco
re-
and
surfa
ce-in
ocul
ated
appl
es.
4296 J. Agric. Food Chem., Vol. 55, No. 11, 2007 Karlshøj et al.
54

and surface-inoculated Golden Delicious apples show even betterfits, with RMSEP values of 11 and 9%, respectively (Figure8B,C), which leads to the conclusion that the two systems,surface- and core-inoculated apples, are indeed two separateentities which cannot easily be covered by one model. This isnot too surprising because there is a big difference in the surfaceto hyphae ratio between the two types of spoilage. PLSregression modeling of e-nose data and patulin concentrationfor the Golden Delicious juice samples also gave a high-fitregression model with a RMSEP of 12% (Figure 8D). For thejuice samples it seems that one model covers both the surfaceinoculation and core inoculation samples.
To our knowledge this is the first report of a regression modelbetween e-nose data and mycotoxin content in which actualconcentrations are reported. In a previous study (11) theinvestigation was limited to looking at levels (high, low) ofmycotoxins, whereas the regression modeling in another study(12) was less accurate and less reliable.
From the results of this “worst case” study it seems verypromising to use an e-nose for quality control in the apple juiceindustry, although additional work has to be carried out toproduce prediction models for the various apple varieties, andprobably also mixes of apple varieties, used in production.Because this study was a worst case scenario, additionalexperiments will have to be performed to determine the cutoffconcentration for patulin prediction by e-nose analysis. Otherfactors, such as the influence of apple shredding on e-noseprediction of spoilage and patulin concentration, could also beinvestigated. The results indicate that it would be feasible toanalyze at one of two points during production. E-nose analysisshould be carried out either right after shredding of the applesor on the finished juice. The advantage of early, in terms ofproduction, analysis is that there are several process steps inwhich it is possible to rectify any patulin problem, whereasanalysis of the finished juice will yield information on the qualityof the finished product. In either case patulin can be, andindustrially is, removed by treatment with charcoal (36), ascorbicacid (37), or irradiation (38).
Altogether this study has proven it possible to classify spoiledfrom nonspoiled apples during the apple juice production stepsand at some points even to distinguish between spoilage type(surface and core) by e-nose analysis. It has also been provenpossible to create regression models that can be used for quiteexact prediction of patulin content in Golden Delicious apples.These results of course are valid for only the chosen cultivar,Golden Delicious, but suggest that it ought to be possible toachieve similar prediction models with any given apple cultivar.To make industrially relevant prediction models it is requiredto measure many more samples, to use mixed samples of varioustypes of spoilage, to make measurements on various degreesof spoilage, and of course to expand the model with differentvarieties of apples and mixes of apple varieties. We believethat this study is the first study to show correlation betweene-nose analysis data and mycotoxin concentration. The resultsof this study show a great potential for e-nose prediction ofmycotoxin levels even in systems with a high level of volatilesfrom the matrix such as silage, grain, and fruit juices.
ACKNOWLEDGMENT
We thank Vallø saft A/S for providing materials and chemicalsspecific for apple juice production, Kristian Fog Nielsen forfruitful discussions on sample preparation and quantitativeanalysis of patulin in apple mash, and Hanne Jakobsen fortechnical assistance.
LITERATURE CITED
(1) Karlshøj, K.; Nielsen, P. V.; Larsen, T. O. Fungal volatiles:biomarkers of good and bad food quality. InFood Mycology:A Multifaceted Approach to Fungi and Food, 1st ed.; Dijkster-huis, J., Samson, R. A., Eds.; CRC Press: Boca Raton, FL, 2007;Vol. 25, pp 279-302.
(2) Brezmes, J.; Fructuoso, Ma. L. L.; Llobet, E.; Vilanova, X.;Recasens, I.; Orts, J.; Saiz, G.; Correig, X. Evaluation of anelectronic nose to assess fruit ripeness.IEEE Sens. J.2005, 5,97-108.
(3) Borjesson, T.; Eklo¨v, T.; Jonsson, A.; Sundgren, H.; Schnu¨rer,J. Electronic nose for odor classification of grains.Cereal Chem.1996, 73, 457-461.
(4) Rajama¨ki, T.; Alakomi, H. L.; Ritvanen, T.; Skytta¨, E.; Smolan-der, M.; Ahvenainen, R. Application of an electronic nose forquality assessment of modified atmosphere packaged poultrymeat.Food Control2006, 17, 5-13.
(5) Hansen, T.; Petersen, M. A.; Byrne, D. V. Sensory based qualitycontrol utilising an electronic nose and GC-MS analyses topredict end-product quality from raw materials.Meat Sci.2005,69, 621-634.
(6) Trihaas, J.; Vognsen, L.; Nielsen, P. V. Electronic nose: newtool in modelling the ripening of Danish blue cheese.Int. DairyJ. 2005, 15, 679-691.
(7) Trihaas, J.; Nielsen, P. V.; van den Tempel, T. Electronic nosetechnology in quality assessment. Predicting the volatile com-position of Danish blue cheese.J. Food Sci.2005, 70, 392-400.
(8) Trihaas, J.; Nielsen, P. V. Electronic nose technology in qualityassessment: monitoring the ripening process of Danish bluecheese.J. Food Sci.2005, 70, 44-49.
(9) Marrazzo, W. N.; Heinemann, P. H.; Saftner, R. A.; Crassweller,R. E.; LeBlanc, E. Electronic nose chemical sensor versus gaschromatography: a feasibility study for the differentiation ofapple flavors and essences.Trans. Am. Soc. Agric. Eng.2005,48, 2003-2006.
(10) Olsson, J.; Bo¨rjesson, T.; Lundstedt, T.; Schnu¨rer, J. Volatilesfor mycological quality grading of barley grains: determinationsusing gas chromatography-mass spectrometry and electronicnose.Int. J. Food Microbiol.2000, 59, 167-178.
(11) Cheli, F.; Dell’Orto, V.; Pinotti, L.; Campagnoli, A.; Tognon,G. Implementation of the electronic nose for the identificationof mycotoxins in durum wheat (Triticum durum). Vet. Res.Commun.2005, 29, 391-393.
(12) Olsson, J.; Bo¨rjesson, T.; Lundstedt, T.; Schnu¨rer, J. Detectionand quantification of ochratoxin A and deoxynivalenol in barleygrains by GC-MS and electronic nose.Int. J. Food Microbiol.2002, 72, 203-214.
(13) Filtenborg, O.; Frisvad, J. C.; Thrane, U. Moulds in food spoilage.Int. J. Food Microbiol.1996, 33, 85-102.
(14) Samson, R. A.; Hoekstra, E. S.; Frisvad, J. C.; Filtenborg, O.Introduction to Food- and Airborne Fungi, 6th ed.; Centraal-bureau voor Schimmelcultures: Utrecht, The Netherlands, 2002.
(15) Murphy, J. Food Advisory Committee supports FDA’s plan toset patulin safety level for apple juice.Food Chem. News1999,41, 15.
(16) The commission of the European Communities CommissionRegulation (EC) No 1425/2003.Off. J. Eur. Union2003, L 203/1-L 203/3.
(17) Shephard, G. S.; Leggott, N. L. Chromatographic determinationof the mycotoxin patulin in fruit and fruit juices.J. Chromatogr.,A 2000, 882, 17-22.
(18) Chao-Ling, L.; You-Min, F.; Shih, D. Y.-C. Detection ofmycotoxin patulin in apple juice.J. Food Drug Anal.2000, 85-96.
(19) Sewram, V.; Nair, J. J.; Nieuwoudt, T. W.; Leggott, N. L.;Shephard, G. S. Determination of patulin in apple juice by high-performance liquid chromatography-atmospheric pressure chemi-cal ionization mass spectrometry.J. Chromatogr., A2000, 897,365-374.
Patulin Prediction by E-Nose Analysis J. Agric. Food Chem., Vol. 55, No. 11, 2007 4297
55

(20) Gokmen, V.; Acar, J. Rapid reversed-phase liquid chromato-graphic determination of patulin in apple juice.J. Chromatogr.,A 1996, 730, 53-58.
(21) Gokmen, V.; Acar, J. Simultaneous determination of 5-hy-droxymethylfurfural and patulin in apple juice by reversed-phaseliquid chromatography.J. Chromatogr., A1999, 847, 69-74.
(22) Trucksess, M. W.; Yifeng, T. Solid-phase extraction method forpatulin in apple juice and unfiltered apple juice.J. AOAC Int.1999, 82, 1109-1113.
(23) Eisele, T. A.; Gibson, M. Z. Syringe-cartridge solid-phaseextraction method for patulin in apple juice.J. AOAC Int.2003,86, 1160-1163.
(24) Mielle, P. “Electronic noses”: towards objective instrumentalcharacterization of food aroma.Trends Food Sci. Technol.1996,7, 432-438.
(25) Duncan, D. B. Multiple range and multipleF tests.Biometrics1955, 11, 1-42.
(26) Esbensen, K. H.MultiVariate Data Analysissin Practice, 5thed.; CAMO AS: Oslo, Norway, 2001.
(27) Larsen, T. O.; Frisvad, J. C. Characterization of volatilemetabolites from 47Penicillium-taxa. Mycol. Res.1995, 99,1153-1166.
(28) Dimick, P. S.; Hoskin, J. C. Review of apple flavoursstate ofthe art.Crit. ReV. Food Sci. Nutr.1983, 18, 387-409.
(29) Flath, R. A.; Black, D. R.; Forrey, R. R.; McDonald, G. M.;Mon, T. R.; Teranishi, R. Volatiles in Gravenstein apple essenceidentified by gas chromatography-mass spectrometry.J. Chro-matogr. Sci.1969, 7, 508-512.
(30) Knee, M.; Hatfield, S. G. S. A comparison of methods formeasuring the volatile components of apple fruits.J. FoodTechnol.1976, 11, 485-493.
(31) Rizzolo, A.; Polesello, A.; Polesello, S. Use of headspacecapillary GC to study the development of volatile compoundsin fresh fruit.J. High Resolut. Chromatogr.1992, 15, 472-477.
(32) Kakiuchi, N.; Moriguchi, S.; Fukuda, H.; Ichimura, N.; Kato,Y.; Banba, Y. Volatile compounds of various cultivars of applefruits. J. Jpn. Soc. Hortic. Sci.1986, 55, 280-289.
(33) Young, J. C.; Chu, C. L. G.; Xuewen, L.; Honghui, Z. Estervariability in apple varieties as determined by solid-phasemicroextraction and gas chromatography-mass spectrometry.J. Agric. Food Chem.2004, 52, 8086-8093.
(34) Rychlik, M.; Schieberle, P. Model studies on the diffusionbehavior of the mycotoxin patulin in apples, tomatoes, and wheatbread.Eur. Food Res. Technol.2001, 212, 274-278.
(35) Laidou, I. A.; Thanassoulopoulos, C. C.; Liakopoulou-Kyrikides,M. Diffusion of patulin in the flesh of pears inoculated withfour post-harvest pathogens.J. Phytopathol.2001, 149, 457-461.
(36) Sands, D. C.; McIntyre, J. L.; Walton, G. S. Use of activatedcharcoal for the removal of patulin from cider.Appl. EnViron.Microbiol. 1976, 32, 388-391.
(37) Brackett, R. E.; Marth, E. H. Ascorbic acid and ascorbate causedisappearance of patulin from buffer solutions and apple juice.J. Food Prot.1979, 42, 864-866.
(38) Zegota, H.; Zegota, A.; Bachman, S. Effect of irradiation onthe patulin content and chemical composition of apple juiceconcentrate.Z. Lebensm. Unters. Forsch.1988, 187, 235-238.
Received for review January 16, 2007. Revised manuscript receivedMarch 22, 2007. Accepted March 22, 2007. This work was supportedby the “Food technology, safety and quality” research program,Ministry of Food, Agriculture and Fisheries, Denmark.
JF070134X
4298 J. Agric. Food Chem., Vol. 55, No. 11, 2007 Karlshøj et al.
56

PAPER 4
Karlshøj, K., Larsen, T.O., Nielsen, P.V. and Hansen, M.E. Effect of data parameterization on data analysis of electronic nose signals. (draft)
57

58
Effect of data parameterization on electronic nose
signal data analysis
Kristian Karlshøj*, Thomas Ostenfeld Larsen, Per Væggemose Nielsen and
Michael Adsetts Edberg Hansen
Center for Microbial Biotechnology, BioCentrum-DTU, Building 221,
Technical University of Denmark, DK-2800 Kgs. Lyngby, Denmark
* E-mail: [email protected], Phone: +45 4525 2725, Fax: +45 4588 4922
Abstract The parameters for the theoretic mathematical function describing the response curves of
the metal oxide semiconductor (MOS) sensor based electronic nose (e-nose) were determined and
several parameters such as total curve area, curve slope and wavelet decompositions of the signal
were extracted. Chemometric analysis of fungal spoilage data generated in the previous experiments
was performed on the “raw data” generated by the e-nose, specifically the maximum resistance
measured (Ymax) and compared to chemometric analysis based on the parameters generated through
mathematical modeling. The generated parameters were optimized to span the greatest possible
variation with the least number of parameters. These parameters proved to be of the wavelet
decomposition type. Both classification and regression modeling was performed with the two
datasets, Ymax and wavelet parameters and it was shown that with the datasets at hand there was no
advantage in parameterization of the data.
Keywords: parameterization, electronic nose analysis, chemometrics, signal analysis
Introduction
The use of an electronic nose (e-nose) for headspace analysis has become widespread, for instance
in the food and feed industries, such as meat spoilage detection [1-2], shelf life effect on tomato
aroma [3], fruit ripeness assessment [4], grain quality assessment [5-9], prediction of cheese quality
[10-12]. E-nose analysis has also emerged in other fields such as for detection of fungal
contamination of library paper [13], medical diagnostics [14-15] and prediction of patulin
concentration in apples [16]. Thus great effort is made in producing analysis results with electronic
59

nose instruments and it is therefore desirable to maximize the data quality gained from these
analyses.
Until now the main focus in improving e-nose analysis has been based on improving the entire e-
nose analysis process from sensor technology [17-18] through feature extraction [19-20] and pattern
recognition [21-22]. Carmel et al., in 2003, reported how to achieve optimal function
parameterization of e-nose signals by employing a Lorentzian model, they also tested a double-
sigmoid model, which though having a better fit, lacked in robustness compared to the Lorentzian
model. They found that using the best fitting parameters from this Lorentzian model as the e-nose
features enhanced the performance of the classification algorithms leading to improved
classification. Their work was based on data produced by e-nose analysis of 30 pure chemicals.
The aim of our work was to investigate features extracted, such as function parameters as per
Carmel et al.’s double-sigmoid model, maximum response values (Ymax), area, derivatives (i.e.
slope) etc, yields the best data analysis for classification as well as regression modeling purposes
compared to the raw data delivered by the e-nose software. The samples used in this investigation
were more complex compared to Carmel et al.’s study. Our focus was based on two systems,
classification of closely related fungi grown on yeast extract sucrose (YES) agar and correlations
between and prediction of the mycotoxin patulin concentration in and e-nose analysis of apples
infected by Penicillium expansum. It is well known that fungi produce a large variety of volatile
metabolites, the profiles of which, if determined by GC-MS analysis, can be used for classification
[23-26]. It is also well known that apples produce a wide variety of ester and alcohol volatile
metabolites [27-30] which add to the complexity of the data. Since the most commonly used e-nose
sensors have been of the metal oxide semi-conductor (MOS) or conducting polymer (CP) types, in
this work our focus was on a MOS sensor based e-nose systems.
Experimental
Samples 1: Classification of closely related fungi grown on YES medium
All isolates used in this study were obtained from the Fungal Culture Collection at BioCentrum-
DTU (IBT collection), Technical University of Denmark, Kgs. Lyngby, Denmark. The following
strains were investigated (listed by IBT number); G. candidum, 9283, 9284 and 9286; P. carneum,
3474, 6884, 6888; P. camemberti, 11570, 11571 and 11755; P. expansum, 3487 and 15622; P.
nordicum, 6728, 12803 and 14875; P. paneum, 11839, 13929 and 24721; P. roqueforti, 6754,
14408 and 16404. The strains were center point inoculated, in four replicates, in 20 ml headspace
60

flasks (75.5 × 22.5 mm) containing 2 ml YES medium, from spore suspensions made from 8 day
old YES medium streak cultures. In both cases the YES medium consisted of yeast extract (2%),
sucrose (15%), MgSO4·7H2O (0.05%), ZnSO4·7H2O (0.001%), CuSO4·5H2O (0.0005%), water to
1.0 L, pH 6.5, and agar (2%). The headspace flasks were sealed with crimp caps (3.0 mm
membrane thickness silicone/PTFE caps) and two syringe needles (Ø 1.20 × 40 mm) were inserted
through the membrane to allow oxygen diffusion into and carbon dioxide out of the flasks. The
cultures were incubated with the flasks lying down in a rack at room temperature in the laboratory.
Electronic nose analysis
The headspace was analyzed daily, from day one through seven, using an αFox-3000 (Alpha
M.O.S., France) electronic nose, equipped with a HS-100 auto sampler (CTC Analytics AG,
Switzerland). The sensor array system consisted of 12 metal oxide semiconductor (MOS) sensors.
10 minutes prior to sampling the syringe needles were removed from the crimp cap membrane and
the flask placed in the auto sampler. Immediately after sampling, the syringes were re-introduced
through the crimp cap membrane and the flask returned to the rack. The samples were incubated for
1 minute at 35 °C after which 500 µl of the sample was withdrawn from the head space and injected
in the sensor chamber and flushed over the sensors at a rate of 150 ml min-1.
Data collection was performed every half second for 2 minutes after which the sensors were flushed
with dry air (maximum air humidity 0.5%) for 2 minutes; furthermore, there was a 2 minute delay
before the next sample was analyzed.
Samples 2: Penicillium expansum on apples
The Penicillium expansum isolate, IBT 3487, the P. expansum type culture, used in this study was
obtained from the Fungal Culture Collection at BioCentrum-DTU (IBT collection), Technical
University of Denmark, Building 221, DK-2800 Kgs. Lyngby, Denmark. The apples, Golden
delicious, used in the experiment were obtained from the local supermarket and were surface
sterilized by immersion in 96% ethanol for one minute, then immersion in 3% hypochlorite solution
for one minute and re-immersed in the 96% ethanol bath for one minute after which the apples were
rinsed with autoclaved Milli-Q water and dried in a sterilized laminar flow bench.
The surface inoculated apples were stab wounded with a sterilized needle (7 mm deep wound)
and 20 µL spore suspension (> 106 spores / mL) was put on the wound.
Core inoculated apples were inoculated through the flower opening and via a syringe 0.2 mL
spore suspension (> 106 spores / mL) was injected. The apples were individually incubated in
61

ethanol sterilized 600 mL beaker glasses covered with Parafilm M® (Alcan packaging, USA) at 25
°C in the dark for ten days.
After the ten day incubation the apples were individually shredded. Between 15 and 15.3 g was
put in headspace flasks for electronic nose analysis and between 2 and 2.4 g was stored in
headspace flasks for HPLC analysis. The e-nose samples were treated with 12 µL 10x diluted
pectinase solution (Pectinex® Smash, Novozymes, Denmark) and the samples left for 30 minutes at
room temperature. The juice was then pressed using a funnel and Whatman® filters (Whatman
international, UK) pressing the mash with a metal spatula. The juice was collected in 20 ml
headspace flasks (75.5 × 22.5 mm) and the flasks were sealed with crimp caps (3.0 mm membrane
thickness silicone/PTFE caps). The juice was then pasteurized by immersion of the bottle in a 98 °C
water bath for 60 seconds. After pasteurization 10 µL 3x diluted pectinase solution (Pectinex®
Smash, Novozymes, Denmark) was added and the samples heated in a 53 °C cabinet for 60
minutes. Clearing of the juice was performed by adding 2-3 grains of Bentonite (CLARIT® WG,
Süd-Chemie AG, Germany) after which the sample was shaken for five minutes, then 10 µL
Kieselsol (Gammasol, Gamma chemie GmbH, Germany) solution was added and the sample shaken
for another five minutes. Finally approximately 10 µg gelatin (Rousselot™ gelatin 75 PS 30) was
added, the sample shaken for another five minutes and then left over night in the 53 °C cabinet. The
cleared samples were centrifuged (15000x g) for 5 minutes and the supernatant was transferred to
fresh 20 mL headspace flasks (75.5 × 22.5 mm) which were sealed with crimp caps (3.0 mm
membrane thickness silicone/PTFE caps).
Electronic nose analysis
The headspace of the whole apples was analyzed on an electronic nose daily, from day one
through ten by manual injection of 1500 µL of the headspace using a gastight Hamilton syringe. For
the shredded apple and juice samples a HS-100 auto sampler (CTC Analytics AG, Switzerland) was
used, these samples were incubated for 1 minute at 35 °C after which 1500 µL of the sample was
withdrawn from the head space and injected in the sensor chamber and flushed over the sensors at a
rate of 150 ml min-1. All e-nose samples were analyzed on an αFox-3000 (Alpha M.O.S., France)
electronic nose (e-nose). The sensor array system consisted of 12 metal oxide semiconductor
(MOS) sensors.
Data collection was performed every half second for 2 minutes after which the sensors were
flushed with dry air (maximum air humidity 0.5%) for 2 minutes; furthermore, there was a 2 minute
delay before the next sample was analyzed.
62
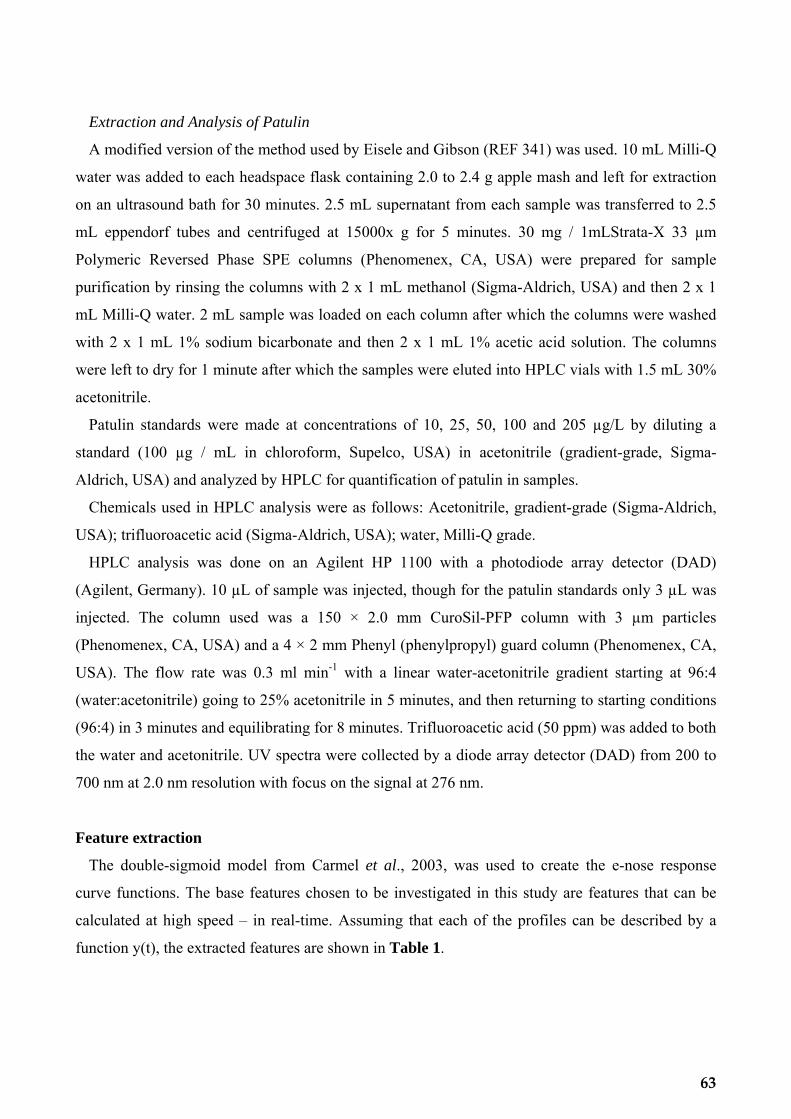
Extraction and Analysis of Patulin
A modified version of the method used by Eisele and Gibson (REF 341) was used. 10 mL Milli-Q
water was added to each headspace flask containing 2.0 to 2.4 g apple mash and left for extraction
on an ultrasound bath for 30 minutes. 2.5 mL supernatant from each sample was transferred to 2.5
mL eppendorf tubes and centrifuged at 15000x g for 5 minutes. 30 mg / 1mLStrata-X 33 µm
Polymeric Reversed Phase SPE columns (Phenomenex, CA, USA) were prepared for sample
purification by rinsing the columns with 2 x 1 mL methanol (Sigma-Aldrich, USA) and then 2 x 1
mL Milli-Q water. 2 mL sample was loaded on each column after which the columns were washed
with 2 x 1 mL 1% sodium bicarbonate and then 2 x 1 mL 1% acetic acid solution. The columns
were left to dry for 1 minute after which the samples were eluted into HPLC vials with 1.5 mL 30%
acetonitrile.
Patulin standards were made at concentrations of 10, 25, 50, 100 and 205 µg/L by diluting a
standard (100 µg / mL in chloroform, Supelco, USA) in acetonitrile (gradient-grade, Sigma-
Aldrich, USA) and analyzed by HPLC for quantification of patulin in samples.
Chemicals used in HPLC analysis were as follows: Acetonitrile, gradient-grade (Sigma-Aldrich,
USA); trifluoroacetic acid (Sigma-Aldrich, USA); water, Milli-Q grade.
HPLC analysis was done on an Agilent HP 1100 with a photodiode array detector (DAD)
(Agilent, Germany). 10 µL of sample was injected, though for the patulin standards only 3 µL was
injected. The column used was a 150 × 2.0 mm CuroSil-PFP column with 3 µm particles
(Phenomenex, CA, USA) and a 4 × 2 mm Phenyl (phenylpropyl) guard column (Phenomenex, CA,
USA). The flow rate was 0.3 ml min-1 with a linear water-acetonitrile gradient starting at 96:4
(water:acetonitrile) going to 25% acetonitrile in 5 minutes, and then returning to starting conditions
(96:4) in 3 minutes and equilibrating for 8 minutes. Trifluoroacetic acid (50 ppm) was added to both
the water and acetonitrile. UV spectra were collected by a diode array detector (DAD) from 200 to
700 nm at 2.0 nm resolution with focus on the signal at 276 nm.
Feature extraction
The double-sigmoid model from Carmel et al., 2003, was used to create the e-nose response
curve functions. The base features chosen to be investigated in this study are features that can be
calculated at high speed – in real-time. Assuming that each of the profiles can be described by a
function y(t), the extracted features are shown in Table 1.
63

Table 1. The function extracted parameters used in this study.
Y_max_t Maximum value (location)
Y_max Maximum value (value)
Int Total integral
Inta Total integral (from time 0 to Y_max_t)
Intb Total integral (from time Y_max_t to end)
Inta/Int Integral ratio
Intb/Int Integral ratio
OP_p Signal (p-percent quantile)
OD_p Differentiated signal (p-percent quantile)
A Wavelet is used to decompose the signal into it’s time-frequency components, i.e. it shows how
the signal changes during acquisition (see Figure 1). Wavelets (The wavelet transform, WT) [32,
33] are mathematical functions that split data into different frequency components, and then study
each component with a resolution matched to its scale. Whereas the perhaps more known Fourier
transformation (FT) [35] also deals with separating a signal into its frequency components, the most
interesting dissimilarity between these two kinds of transforms is that individual wavelet functions
are localized in “space”. Fourier sine and cosine functions are not. In other words, the FT only gives
what frequency components exist in the signal and the time and frequency information can not be
seen at the same time. The WT splits the signal into its frequency local components, and hence
overcomes these problems, and the WT breaks the signal into its "wavelets", scaled and shifted
versions of a so-called "mother wavelet". This localization feature, along with wavelets’
localization of frequency, makes many functions and operators using wavelets “sparse” when
transformed into the wavelet domain. This sparseness, in turn, results in a number of useful
applications such as data compression, detecting features, and removing noise from time series
signals [36-39].
The (continuous) wavelet transform is calculated from
( ) ( )
( )
( ) ( ) ( )
*
,
CWT , ,
1
CWT ,
ψ ψ
ψτ
τ τ
τψ
τ ψ ∗
= Ψ
−⎛ ⎞= • ⎜ ⎟⎝ ⎠
= •
∫
∫
x x
x s
s s
tx t dtss
s X T t dt
64

where is the mother wavelet (type of transformation). One of the choices that has to be made in the
WT is the choice of motherwavelet.
( ),1
stt
ssττψ ψ∗ −⎛ ⎞= ⎜ ⎟
⎝ ⎠
where τ is the translation of the mother wavelet (location in the signal) and s is the scale. It is out of
the scope in this paper to go into all the WT details, and therefore the reader is referred to the large
amount of literature for further details [32-39].
The main point to remember in this transformation is that the signal is split into its local
frequencies. These frequencies are then used in the further feature extraction. As an example please
look at Figure 1. Here we have an e-nose signal (upper part) that has been wavelet transformed
Figure 1. Overview of some of the time dependant signal changes a Wavelet decomposition of the
signal can reveal.
65

(WT) using the Daubechies Wavelet (2nd order) as motherwavelet. The middle figure shows the
wavelet transform (the coefficients) at different scales (y-axis) at different time points.
Looking at the transformation we see that at a higher scale the low frequent changes are more
distinct in the decay region of the signal whereas the high frequent changes are more distinct at a
lower resolution.
Since the coefficients (each time-scale pair) indicate the amount of “energy” at that specific level
we will use the WT to extract features that are distinct for the e-nose sensor responses, and use
those in our comparison. First we condense the WT by extracting the maximum and minimum
values for the time and scale axes. The WT is calculated for both the original signal as well as for
the differentiated signal. The features extracted from these two profiles are listed in Table 2.
Data analysis
The features, maximum value for resistance change, extracted from the e-nose system responses
as well as the features extracted by parameterization of the e-nose response curves were evaluated
Table 2. The Daubechies Wavelet (2nd order) parameters used in this study. W1_p Wavelet decomposition of signal (p-percent quantile along scale-axis)
W1_max_t Wavelet decomposition of signal (Max value position along scale-axis)
W1_max Wavelet decomposition of signal (Max value along scale-axis)
W1_min_t Wavelet decomposition of signal (Max value position along scale-axis)
W1_min Wavelet decomposition of signal (Max value position along scale-axis)
W2_p Wavelet decomposition of signal (p-percent quantile along time-axis)
W2_max_t Wavelet decomposition of signal (Max value position along time-axis)
W2_max Wavelet decomposition of signal (Max value along time-axis)
W2_min_t Wavelet decomposition of signal (Max value position along time-axis)
W2_min Wavelet decomposition of signal (Max value position along time-axis)
ODW1_p Wavelet decomposition of differentiated signal (p-percent quantile along scale-axis)
ODW1_max_t Wavelet decomposition of differentiated signal (Max value position along scale-axis)
ODW1_max Wavelet decomposition of differentiated signal (Max value along scale-axis)
ODW1_min_t Wavelet decomposition of differentiated signal (Max value position along scale-axis)
ODW1_min Wavelet decomposition of differentiated signal (Max value position along scale-axis)
ODW2_p Wavelet decomposition of differentiated signal (p-percent quantile along time-axis)
ODW2_max_t Wavelet decomposition of differentiated signal (Max value position along time-axis)
ODW2_max Wavelet decomposition of differentiated signal (Max value along time-axis)
ODW2_min_t Wavelet decomposition of differentiated signal (Max value position along time-axis)
ODW2_min Wavelet decomposition of differentiated signal (Max value position along time-axis)
66

by principal component analysis (PCA) as well as by classification using soft independent modeling
of class analogy (SIMCA) with each condition (class) analyzed as a PCA group [31]. For the
extracted parameters the best parameters for each analysis were chosen by investigating the
loadings plot of an initial PCA to pick the loadings responsible for the highest variation within the
data. Prediction models for patulin levels (sample 2) were made by PLS regression analysis
between the e-nose data and patulin concentrations of the given samples by quantitative HPLC
analysis [31]. The data were standardized by multiplication with the inverse of the standard
deviation and analyzed using full cross validation. For the analysis the software package The
Unscrambler version 9.1 (CAMO, Norway) was used.
Results
Samples 1: Classification of closely related fungi grown on YES medium
The results of the SIMCA analysis of both Ymax data and the features extracted via parameterization
shown as the percentage of correctly classified samples are shown in Table 3.
Samples 2: Penicillium expansum on apples
The results of the SIMCA analysis of both Ymax data and the features extracted via parameterization
shown as the percentage of correctly classified samples are shown in Table 4.
The results of the PLS regression analysis of both Ymax data and the features extracted via
parameterization versus patulin concentration, shown as the fit (R2) and root mean square error in
percent (RMSEP) are shown in Table 5.
Table 3. Comparison of percentage of correct classification of fungi grown on YES medium by
SIMCA classification of e-nose data; Ymax and the best parameter model available. Day 1 Day 2 Day 3 Day 4 Day 5 Day 6 Day 7
Ymax Parameters Ymax Parameters Ymax Parameters Ymax Parameters Ymax Parameters Ymax Parameters Ymax Parameters
Control 0.0% 0.0% 0.0% 50.0% 75.0% 50.0% 0.0% 0.0% 0.0% 0.0% 50.0% 25.0% 0.0% 0.0%
G. candidum 41.7% 0.0% 100.0% 100.0% 100.0% 100.0% 100.0% 100.0% 100.0% 100.0% 100.0% 91.7% 8.3% 0.0%
P. camemberti 0.0% 0.0% 80.0% 80.0% 100.0% 80.0% 100.0% 100.0% 70.0% 90.0% 90.0% 90.0% 80.0% 90.0%
P. carneum 0.0% 0.0% 0.0% 0.0% 58.3% 91.7% 100.0% 100.0% 100.0% 100.0% 100.0% 100.0% 100.0% 100.0%
P. expansum 12.5% 0.0% 100.0% 87.5% 100.0% 100.0% 100.0% 100.0% 100.0% 100.0% 100.0% 100.0% 100.0% 50.0%
P. nordicum 0.0% 0.0% 0.0% 16.7% 58.3% 8.3% 33.3% 0.0% 58.3% 33.3% 83.3% 75.0% 25.0% 0.0%
P. paneum 8.3% 0.0% 8.3% 0.0% 33.3% 75.0% 16.7% 8.3% 33.3% 50.0% 100.0% 100.0% 75.0% 58.3%
P. roqueforti 0.0% 0.0% 16.7% 8.3% 25.0% 66.7% 66.7% 83.3% 83.3% 58.3% 100.0% 100.0% 91.7% 83.3%
Avg correct class. 8.5% 0.0% 37.8% 39.0% 65.9% 72.0% 68.3% 64.6% 73.2% 70.7% 93.9% 90.2% 63.4% 51.2%
67
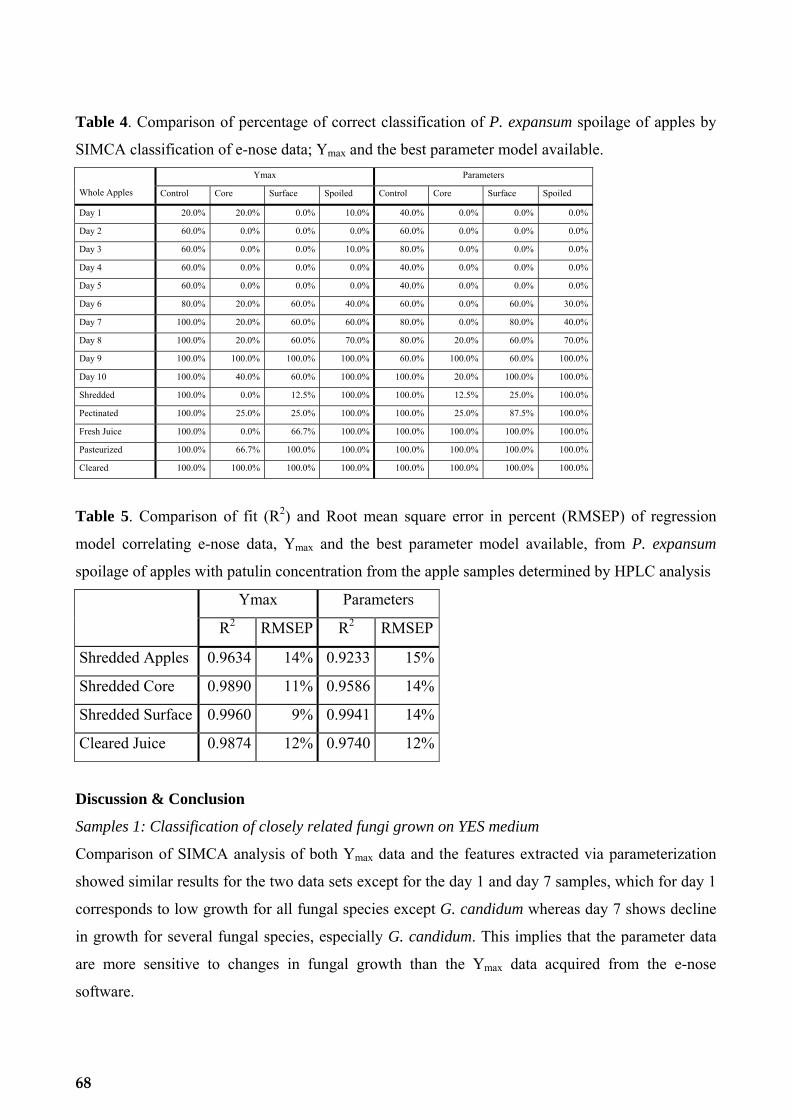
Table 4. Comparison of percentage of correct classification of P. expansum spoilage of apples by
SIMCA classification of e-nose data; Ymax and the best parameter model available. Ymax Parameters
Whole Apples Control Core Surface Spoiled Control Core Surface Spoiled
Day 1 20.0% 20.0% 0.0% 10.0% 40.0% 0.0% 0.0% 0.0%
Day 2 60.0% 0.0% 0.0% 0.0% 60.0% 0.0% 0.0% 0.0%
Day 3 60.0% 0.0% 0.0% 10.0% 80.0% 0.0% 0.0% 0.0%
Day 4 60.0% 0.0% 0.0% 0.0% 40.0% 0.0% 0.0% 0.0%
Day 5 60.0% 0.0% 0.0% 0.0% 40.0% 0.0% 0.0% 0.0%
Day 6 80.0% 20.0% 60.0% 40.0% 60.0% 0.0% 60.0% 30.0%
Day 7 100.0% 20.0% 60.0% 60.0% 80.0% 0.0% 80.0% 40.0%
Day 8 100.0% 20.0% 60.0% 70.0% 80.0% 20.0% 60.0% 70.0%
Day 9 100.0% 100.0% 100.0% 100.0% 60.0% 100.0% 60.0% 100.0%
Day 10 100.0% 40.0% 60.0% 100.0% 100.0% 20.0% 100.0% 100.0%
Shredded 100.0% 0.0% 12.5% 100.0% 100.0% 12.5% 25.0% 100.0%
Pectinated 100.0% 25.0% 25.0% 100.0% 100.0% 25.0% 87.5% 100.0%
Fresh Juice 100.0% 0.0% 66.7% 100.0% 100.0% 100.0% 100.0% 100.0%
Pasteurized 100.0% 66.7% 100.0% 100.0% 100.0% 100.0% 100.0% 100.0%
Cleared 100.0% 100.0% 100.0% 100.0% 100.0% 100.0% 100.0% 100.0%
Table 5. Comparison of fit (R2) and Root mean square error in percent (RMSEP) of regression
model correlating e-nose data, Ymax and the best parameter model available, from P. expansum
spoilage of apples with patulin concentration from the apple samples determined by HPLC analysis
Ymax Parameters
R2 RMSEP R2 RMSEP
Shredded Apples 0.9634 14% 0.9233 15%
Shredded Core 0.9890 11% 0.9586 14%
Shredded Surface 0.9960 9% 0.9941 14%
Cleared Juice 0.9874 12% 0.9740 12%
Discussion & Conclusion
Samples 1: Classification of closely related fungi grown on YES medium
Comparison of SIMCA analysis of both Ymax data and the features extracted via parameterization
showed similar results for the two data sets except for the day 1 and day 7 samples, which for day 1
corresponds to low growth for all fungal species except G. candidum whereas day 7 shows decline
in growth for several fungal species, especially G. candidum. This implies that the parameter data
are more sensitive to changes in fungal growth than the Ymax data acquired from the e-nose
software.
68

Samples 2: Penicillium expansum on apples
Comparison of SIMCA analysis of both Ymax data and the features extracted via parameterization
showed that for samples taken from the whole apples the SIMCA analysis of Ymax data performs
better than the parameter data set SIMCA whereas it is opposite when dealing with processed
samples (shredded apples through cleared apple juice).
For the PLS regression correlation of e-nose analysis to patulin concentration Ymax gave rise to
higher fits as well as lower root mean square error in percent than the parameter data set analysis.
All in all the findings of this study contradict the conclusions of Carmel et al., who used “30
volatile odorous pure chemicals.... intentionally chosen from many different families, so that they
would represent a broad range of possible stimuli.” and found that the use of the parameters
describing e-nose sensor response gave rise to better classification than any other data analysis
method. The data used in our study are more complex as each sample contains a mixture of VOCs
and many of the samples have highly similar profiles, such as apple vs. spoiled apple where the
VOC profile difference no higher than 6%.
Acknowledgments
This work was supported by the “Food technology, safety and quality” research program, Ministry
of Food, Agriculture and Fisheries, Denmark.
References
[1] S. Balasubramanian, S. Panigrahi, C.M. Logue, M. Marchello, C. Doetkott, H. Gu, J.
Sherwood, L. Nolan, Spoilage identification of beef using an electronic nose system, Trans.
Amer. Soc. Agric. Engin. 47 (5) (2004) 1625-1633.
[2] T. Rajamäki, H.L. Alakomi, T. Ritvanen, E. Skyttä, M. Smolander, R. Ahvenainen,
Application of an electronic nose for quality assessment of modified atmosphere packaged
poultry meat, Food Control 17 (1) (2006) 5-13.
[3] A.Z. Berna, J. Lammertyn, S. Saevels, C.D. Natale, B.M. Nicolai, Electronic nose systems to
study shelf life and cultivar effect on tomato aroma profile, Sens. Actuators, B 97 (2-3) (2004)
324-333.
69
[4] J. Brezmes, Ma.L.L. Fructuoso, E. Llobet, X. Vilanova, I. Recasens, J. Orts, G. Saiz, X.
Correig, Evaluation of an electronic nose to assess fruit ripeness, IEEE Sens. J. 5 (1) (2005)
97-108.
[5] N. Magan, P. Evans, Volatiles as an indicator of fungal activity and differentiation between
species, and the potential use of electronic nose technology for early detection of grain
spoilage, J Stored Prod Res 36 (1999) 319-340.
[6] A. Jonsson, F. Winquist, J. Schnürer, H. Sundgren, I. Lundström, Electronic nose for
microbial quality classification of grains, Int J Food Microbiol 35 (2) (1997) 187-193.
[7] T. Börjesson, T. Eklöv, A. Jonsson, H. Sundgren, J. Schnürer, Electronic nose for odor
classification of grains, Cereal Chem 73 (4) (1996) 457-461.
[8] J. Olsson, T. Börjesson, T. Lundstedt, J. Schnürer, Volatiles for mycological quality grading
of barley grains: determinations using gas chromatography-mass spectrometry and electronic
nose, Int J Food Microbiol 59 (3) (2000) 167-178.
[9] R. Paolesse, A. Alimelli, E. Martinelli, C.D. Natale, A. D'Amico, M.G. D'Egidio, G. Aureli,
A. Ricelli, C. Fanelli, Detection of fungal contamination of cereal grain samples by an
electronic nose, Sensors and Actuators: B. Chemical 119 (2) (2006) 425-430.
[10] J. Trihaas, P.V. Nielsen, Electronic nose technology in quality assessment: monitoring the
ripening process of Danish blue cheese, J Food Sci 70 (1) (2005) 44-49.
[11] J. Trihaas, L. Vognsen, P.V. Nielsen, Electronic nose: New tool in modelling the ripening of
Danish blue cheese, Int. Dairy J. 15 (6-9) (2005) 679-691.
[12] J. Trihaas, P.V. Nielsen, T. van den Tempel, Electronic nose technology in quality assessment.
Predicting the volatile composition of Danish blue cheese. J Food Sci 70 (6) (2005) 392-400.
[13] O. Canhoto, F. Pinzari, C. Fanelli, N. Magan, Application of electronic nose technology for
the detection of fungal contamination in library paper, International Biodeterioration and
Biodegradation 54 (4) (2004) 303-309.
[14] C.W. Hanson, E.R. Thaler, Electronic nose prediction of a clinical Pneumonia score:
Biosensors and microbes, Anesthesiology - Hagerstown 102 (1) (2005) 63-68.
[15] R. Dutta, J.W. Gardner, E.L. Hines, ENT bacteria classification using a neural network based
cyranose 320 electronic nose, Sensors, 2004. Proceedings of IEEE 2004) 324-325.
[16] K. Karlshøj, P.V. Nielsen, T.O. Larsen, Prediction of Penicillium expansum Spoilage and
Patulin Concentration in Apples used for Apple Juice Production by Electronic Nose
Analysis, J. Agric. Food Chem. 2007)
70
[17] B.C. Muñoz, G. Steinthal, S. Sunshine, Conductive polymer-carbon black composites-based
sensor arrays for use in an electronic nose, Sensor Review 19 (4) (1999) 300-305.
[18] D.L. García-González, N. Barie, M. Rapp, R. Aparicio, Analysis of virgin olive oil volatiles
by a novel electronic nose based on a miniaturized SAW sensor array coupled with SPME
enhanced headspace enrichment, J. Agric. Food Chem. 52 (25) (2004) 7475-7479.
[19] A. Leone, C. Distante, N. Ancona, K.C. Persaud, E. Stella, P. Siciliano, A powerful method
for feature extraction and compression of electronic nose responses, Sens. Actuators, B 105
(2) (2005) 378-392.
[20] L. Carmel, S. Levy, D. Lancet, D. Harel, A feature extraction method for chemical sensors in
electronic noses, Sens. Actuators, B 93 (1-3) (2003) 67-76.
[21] A. Ortega, S. Marco, T. Sundic, J. Samitier, New pattern recognition systems designed for
electronic noses, Sens. Actuators, B 69 (3) (2000)
[22] P.E. Keller, Overview of electronic nose algorithms, Neural Networks, 1999. IJCNN '99.
International Joint Conference on 1 (1999) 309-312.
[23] T.O. Larsen, Identification of cheese-associated fungi using selected ion monitoring of
volatile terpenes, Lett Appl Microbiol 24 (6) (1997) 463-466.
[24] T.O. Larsen, J.C. Frisvad, Characterization of volatile metabolites from 47 Penicillium-taxa,
Mycol Res 99 (1995) 1153-1166.
[25] T.O. Larsen, J.C. Frisvad, Chemosystematics of Penicillium based on profiles of volatile
metabolites, Mycol Res 99 (1995) 1167-1174.
[26] K. Karlshøj, T.O. Larsen, Differentiation of species from the Penicillium roqueforti group by
volatile metabolite profiling, J. Agric. Food Chem. 53 (3) (2005) 708-715.
[27] M.L. López, M.T. Lavilla, M. Riba, M. Vendrell, Comparison of volatile compounds in two
seasons in apples: Golden Delicious and Granny Smith, Journal of Food Quality 21 (2) (1998)
155-166.
[28] J.C. Young, C.L.G. Chu, L. Xuewen, Z. Honghui, Ester variability in apple varieties as
determined by solid-phase microextraction and gas chromatography-mass spectrometry, J.
Agric. Food Chem. 52 (26) (2004) 8086-8093.
[29] R.A. Flath, D.R. Black, R.R. Forrey, G.M. McDonald, T.R. Mon, R. Teranishi, Volatiles in
Gravenstein apple essence identified by gas chromatography-mass spectrometry, J
Chromatogr Sci 7 (8) (1969) 508-512.
71

[30] N. Kakiuchi, S. Moriguchi, H. Fukuda, N. Ichimura, Y. Kato, Y. Banba, Volatile compounds
of various cultivars of apple fruits, J Jpn Soc Hortic Sci 55 (3) (1986) 280-289.
[31] K.H. Esbensen, Multivariate Data Analysis -In Practice, CAMO AS, 2001.
[32] D. B. Percival and A. T. Walden, Wavelet Methods for Time Series Analysis, Cambridge
University Press (2000), ISBN 0-5216-8508-7.
[33] P. S. Addison, The Illustrated Wavelet Transform Handbook, Institute of Physics (2002),
ISBN 0-7503-0692-0
[34] C. S. Burrus and R. A. Gopinath, H. Guo. Introduction to wavelets and wavelet transforms, A
primer (1998). Upper Saddle River, NJ (USA): Prentice Hall.
[35] T. W. Körner, Fourier analysis. Cambridge, UK: Cambridge University Press, 1996
[36] C. Chiann and P. A. Morettin. A wavelet analysis for time series. Journal of Nonparametric
Statistics, 10(1):1–46, 1999.
[37] G. C. Feng, P. C. Yuen, and D. Q. Dai. Human face recognition using PCA on wavelet
subband. SPIE Journal of Electronic Imaging, 9(2), 2000.
[38] D. Keim and M. Heczko. Wavelets and their applications in databases. Tutorial Notes of
ICDE 2001, 2001.
[39] P. Vaidyanathan. Multirate digital filters, filter banks, polyphase networks, and applications: a
tutorial. In Proc. IEEE, number 78, pages 56–93, 1990.
72

PAPER 5
Karlshøj, K., Drejer Storm, I.M.L., Nielsen, K.F., Nielsen, P.V. and Larsen, T.O. Prediction of Silage Spoilage by Electronic Nose Analysis. (draft)
73

74

Prediction of Silage Spoilage and Mycotoxin
Production by Electronic Nose Analysis
KRISTIAN KARLSHØJ, IDA M. L. DREJER STORM, KRISTIAN F. NIELSEN, PER V.
NIELSEN, AND THOMAS O. LARSEN*
Center for Microbial Biotechnology, BioCentrum-DTU, Building 221, Technical University of
Denmark, DK-2800 Kgs. Lyngby, Denmark
*Corresponding author Tel: +45 4525 2632; Fax: +45 4588 4922; E-mail: [email protected]
ABSTRACT: Classification models for Penicillium paneum, Penicillium roqueforti and Monascus
ruber spoilage and mycotoxin in maize silage were made on basis of electronic nose analysis of the
head space. For each of the three days analysis, two isolates of each fungal species, as well as a
mixture of the three fungi were inoculated on maize silage (6 replicates each). Of the 21 control
samples used, 6 were from the maize silage used for inoculation and the remaining were from 15
different maize silages. The silage was incubated at 25 °C for thirteen days. Electronic nose and
GC-MS analysis of the headspace was performed on days three, six and thirteen. Selected
mycotoxin and secondary metabolites: marcfortine A, mycophenolic acid, roquefortine C, PR-toxin,
were measured in the silage on the three days. It was shown that it is possible to classify the
spoilage by P. roqueforti, P. paneum or M. ruber in silage correctly to species level on basis of soft
independent modeling of class analogy classification of electronic nose analysis data.
KEYWORDS: Silage, Electronic nose, prediction models, volatile organic compounds, volatile
metabolite profiling.
INTRODUCTION
Maize silage is a very important feed for dairy cattle. In Denmark its use has more than five-
doubled in Denmark since 1990 (1) and it is often used as the main part of the feed all year round.
Unfortunately growth of filamentous fungi is often seen in silage stacks (2-4). This constitutes a
production loss to the farmer due to loss of biomass during spoilage and the discarding of spoiled
75

feed. However most importantly presence of mycotoxins may furthermore affect yield and health of
the livestock (5-7) and perhaps also be carried over to milk or meat. A quick, cheap and easy
method for the detection of filamentous fungi and their mycotoxins in silage is therefore desirable.
Maize silage is produced by natural lactic acid fermentation of whole crop maize after these have
been chopped, heavily compacted and covered with plastic. Plant enzymes and bacteria quickly
consume the available oxygen lowering the concentration to a few percent while CO2 concentration
rises above 20%. The lactic acid bacteria (LAB) then begin fermenting sugars to primarily lactic
and acetic acid thus lowering the pH to below 4 (8). The combination of low pH, low oxygen
concentration, high carbon dioxide concentration and large amounts of LAB preserves the silage so
it can be stored for up to 14 months. Spoilage bacteria can not grow in such a harsh environment
and filamentous fungi only to a very limited extend.
Due to improper ensiling procedures, insufficient wrapping, damaging of the plastic and other
factors spoilage of the silage may occur. Some of the most common filamentous fungi that occur in
maize silage are Penicillium roqueforti, Penicillium paneum, Monascus ruber and Byssochlamys
nivea (2-4;9). Together they are capable of producing more than 70 mycotoxins and other
secondary metabolites e.g. patulin, citrinin, PR-toxin, mycophenolic acid, roquefortine C (10).
Fungal spoilage may be visible as colored “hot spots” or layers in the silage. But with a daily use
of several tons of silage it is not possible to sort out all spoiled lumps. Besides, even healthy
looking silage may contain up to 106 viable fungal units per gram (unpublished results), P.
roqueforti seems to present in most silage (Unpublished results). The isolation and identification of
fungi from hot-spots can also be problematic by classical microbial techniques. Species, like P.
roqueforti with a large production of spores are easily over-represented and may conceal less
sporulating species, like Monascus and P. paneum.
The e-nose is a cheap and easy method of analysis which potentially can be brought to
problematic silage stacks in the field. With this study we therefore wish to explore the capabilities
of the e-nose to identify silage spoiled by filamentous fungi since it has already been shown that the
e-nose is capable of detecting fungal spoilage in a high background matrix such as apples used for
apple juice production (11).
The first aim of this study was to use e-nose analysis to classify spoiled “hotspot” like samples
from non-spoiled samples, as well as classifying the spoilage by fungal species responsible for the
deterioration, thus creating a classification model. Secondly it was aimed to correlate the e-nose
response with the mycotoxin level in a given sample, thus creating a prediction model for
76
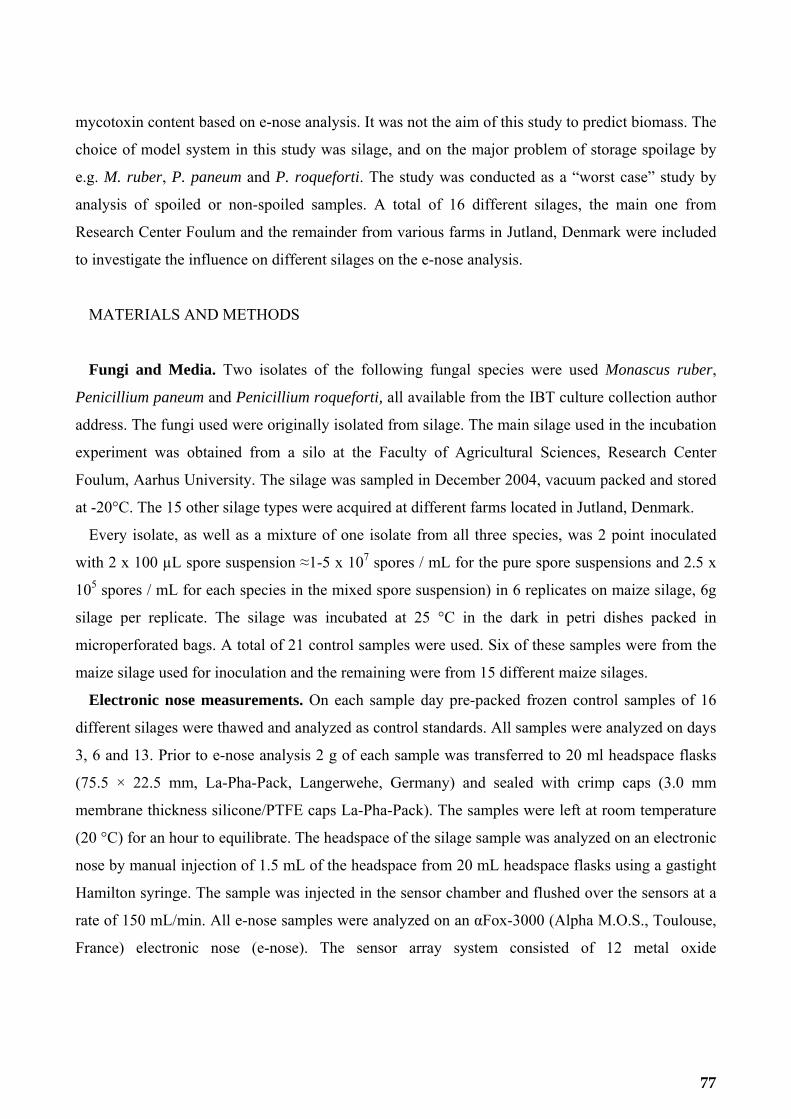
mycotoxin content based on e-nose analysis. It was not the aim of this study to predict biomass. The
choice of model system in this study was silage, and on the major problem of storage spoilage by
e.g. M. ruber, P. paneum and P. roqueforti. The study was conducted as a “worst case” study by
analysis of spoiled or non-spoiled samples. A total of 16 different silages, the main one from
Research Center Foulum and the remainder from various farms in Jutland, Denmark were included
to investigate the influence on different silages on the e-nose analysis.
MATERIALS AND METHODS
Fungi and Media. Two isolates of the following fungal species were used Monascus ruber,
Penicillium paneum and Penicillium roqueforti, all available from the IBT culture collection author
address. The fungi used were originally isolated from silage. The main silage used in the incubation
experiment was obtained from a silo at the Faculty of Agricultural Sciences, Research Center
Foulum, Aarhus University. The silage was sampled in December 2004, vacuum packed and stored
at -20°C. The 15 other silage types were acquired at different farms located in Jutland, Denmark.
Every isolate, as well as a mixture of one isolate from all three species, was 2 point inoculated
with 2 x 100 µL spore suspension ≈1-5 x 10⁷ spores / mL for the pure spore suspensions and 2.5 x
105 spores / mL for each species in the mixed spore suspension) in 6 replicates on maize silage, 6g
silage per replicate. The silage was incubated at 25 °C in the dark in petri dishes packed in
microperforated bags. A total of 21 control samples were used. Six of these samples were from the
maize silage used for inoculation and the remaining were from 15 different maize silages.
Electronic nose measurements. On each sample day pre-packed frozen control samples of 16
different silages were thawed and analyzed as control standards. All samples were analyzed on days
3, 6 and 13. Prior to e-nose analysis 2 g of each sample was transferred to 20 ml headspace flasks
(75.5 × 22.5 mm, La-Pha-Pack, Langerwehe, Germany) and sealed with crimp caps (3.0 mm
membrane thickness silicone/PTFE caps La-Pha-Pack). The samples were left at room temperature
(20 °C) for an hour to equilibrate. The headspace of the silage sample was analyzed on an electronic
nose by manual injection of 1.5 mL of the headspace from 20 mL headspace flasks using a gastight
Hamilton syringe. The sample was injected in the sensor chamber and flushed over the sensors at a
rate of 150 mL/min. All e-nose samples were analyzed on an αFox-3000 (Alpha M.O.S., Toulouse,
France) electronic nose (e-nose). The sensor array system consisted of 12 metal oxide
77

semiconductor (MOS) sensors. MOS sensors are known to be among the least moisture sensitive
sensors available (12).
Data collection was performed every half second for 2 min after which the sensors were flushed
with dry air (maximum air humidity 0.5%) for 2 min; furthermore, there was a 2 min delay before
the next sample was analyzed.
Collection and Analysis of Volatile Metabolites. Volatile metabolites were collected overnight
after e-nose analysis on days 3, 6 and 13. The volatiles were collected by diffusive sampling onto
Tenax TA adsorption material placed in Perkin Elmer tubes. Volatiles were thermally desorbed
(300 °, 30 min) on a Perkin Elmer ATD 400 coupled to a Hewlett Packard 5890 gas chromatograph
further coupled to a HP 5972 mass spectrometer. Separation of the volatiles was done on a 60 m,
0.25 mm i.d., 1.0 µm VB-5 ValcoBond capillary column (SIS, Ringoes NJ, USA) using He as
carrier gas. Initial pressure was 13 psi, and the He flow was 1 mL/min. The system was run at a
75:1 split, and the injection temperature was set to 250 °C. Chromatographic conditions were as
follows: initial temperature, 35 °C for 1 min, raised at 4 °C/min to 175 °C and then at 10 °C/min to
260 °C. Separated compounds were characterized (tentatively identified) by their mass spectra
generated by electron ionization (EI) at 70 eV at a scan range from m/z 33 to 330 (2.53 scans / sec).
Analysis of Secondary Metabolites and Mycotoxins.
Analysis pending.
Data Analysis.
Electronic nose data. The features, maximum value for resistance change, extracted from the e-
nose system responses were evaluated by principal component analysis (PCA) as well as by
classification using soft independent modeling of class analogy (SIMCA) with each spoilage
condition, i.e. each fungal species as well as the control samples (class) analyzed as a PCA group
(13). Prediction models for patulin levels were made by PLS regression analysis between the e-nose
data and patulin “concentrations” of the given samples by semi-quantitative HPLC analysis (13).
The data were standardized by multiplication with the inverse of the standard deviation and
analyzed using full cross validation. For the analysis the software package The Unscrambler version
9.1 (CAMO, Norway) was used.
Volatile metabolites. All peaks that were significant enough to be integrated, using default
parameters, with the ChemStation software (Agilent Technologies) were selected. Mass spectra
78

from compounds with identical retention indices were compared to account for similarity. The
identity of the compounds was tentatively established by comparison of mass spectra and volatile
metabolite profiles with data from the NIST mass spectra library (NIST92 library). The significance
of difference in the amount of each volatile metabolite between the six sample groups (control, M.
ruber infected, P. paneum infected, P. roqueforti infected and the fungal mixture infected) was
determined by using Duncan’s Multiple Range Test (14) keeping the areas logarithmized.
Secondary Metabolites and Mycotoxins. Pending.
RESULTS AND DISCUSSION
Sixteen different silages were chosen for this study to investigate the influence on silage on
spoilage prediction. One of the silages was inoculated to emulate fungal “hotspots” commonly
found in silage stacks. The inoculation methods were deliberately strong as absolute chance of
infection was desired.
It was noted that the silage used for the inoculation experiment was biased towards M. ruber
spoilage. Hence M. ruber germinated and grew faster than the Penicillium species. It was also noted
that in the mixed spore inoculated silage M. ruber completely dominated spoilage by visual
inspection though it germinated and grew slower than in the pure M. ruber samples. On day 3 only
very small colonies of M. ruber were visible in 5 of the 10 samples analyzed and no growth was
visible in the remaining samples. On day 6 the growth of M. ruber was visible in all M. ruber
samples as well as the fungal mixture samples, 8 of 10 P. paneum samples had visible growth
though with some impurities of M. ruber whereas there was no visible growth in the P. roqueforti
samples. On Day 13 growth was visible on all inoculated samples except for 2 P. roqueforti
samples, for both P. paneum and P. roqueforti samples as well as the control samples M. ruber
impurities were spotted on roughly 1/3 of the samples.
SIMCA analysis of e-nose signals of samples from day 3 did not lead to any differentiation of
control and inoculated samples. On day 6 it was possible to classify M. ruber, P. paneum and the
mixed spores spoiled samples (as one group) from control samples whereas no differentiation of P.
roqueforti samples was possible. SIMCA analysis of the 13 day samples proved it possible to
classify spoilage 100% as well as classify the spoilage types at a high degree of certainty; M. ruber
(90%, the remaining 10% classified as P. roqueforti infected), P. paneum (100%) and P. roqueforti
(100%), the mixed spore samples were all classified as M. ruber infected (Figure 1). The silage
samples seemed to cluster in 3 distinct groups.
79
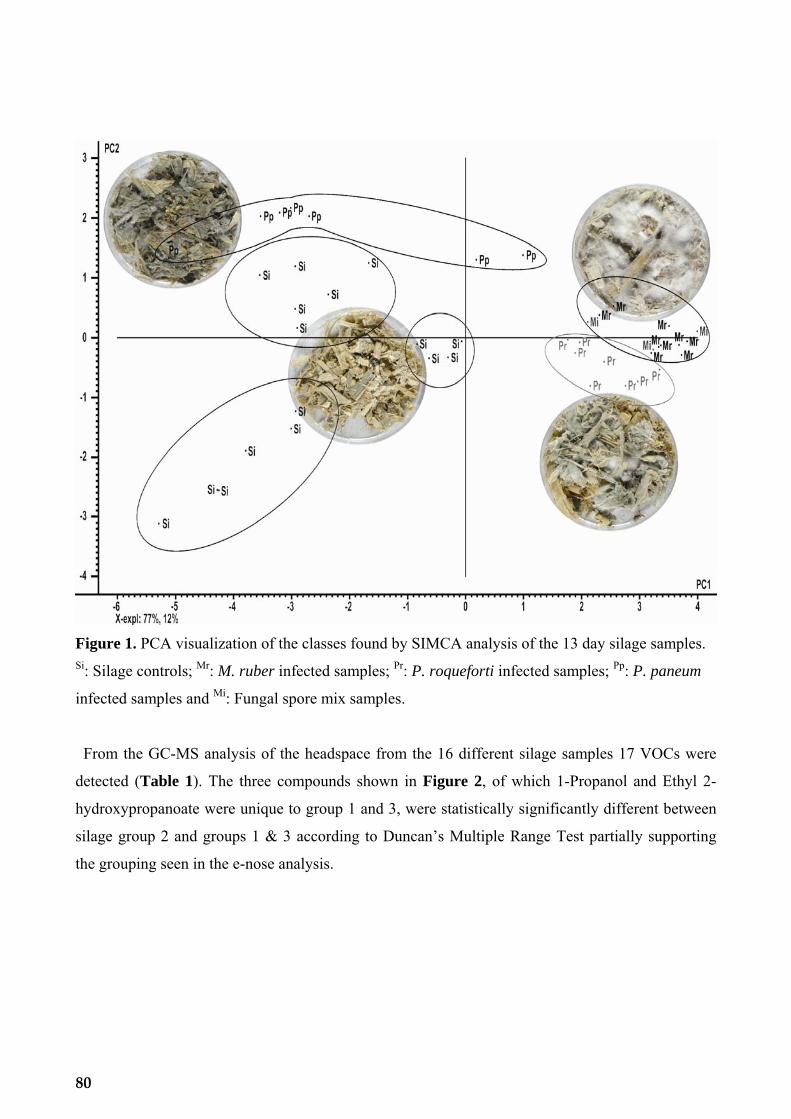
Figure 1. PCA visualization of the classes found by SIMCA analysis of the 13 day silage samples. Si: Silage controls; Mr: M. ruber infected samples; Pr: P. roqueforti infected samples; Pp: P. paneum
infected samples and Mi: Fungal spore mix samples.
From the GC-MS analysis of the headspace from the 16 different silage samples 17 VOCs were
detected (Table 1). The three compounds shown in Figure 2, of which 1-Propanol and Ethyl 2-
hydroxypropanoate were unique to group 1 and 3, were statistically significantly different between
silage group 2 and groups 1 & 3 according to Duncan’s Multiple Range Test partially supporting
the grouping seen in the e-nose analysis.
80

Table 1. The 17 Volatile Compounds Detected by Headspace Analysis of 16 Different Silage
Samples Forming 3 Groups as Designated by the E-nose Analysis. Compounds are Listed by the
Average Log Area for the Three Sample Groups (Sample Size Per Group Was Five For Group One,
Four For Group Two and Six For Group Three. 1: Designating Significant Difference in Log
Average Area From Sample Groups Not Noted by a 1 as Per Duncan’s Multiple Range Test.
RI Compound Silage Group 1
(log avg area)
Silage Group 2
(log avg area)
Silage Group 3
(log avg area)
473 Ethanol 6.05 nd 4.76
499 Propanal nd nd 1.12
552 1-Propanol 7.691 nd 4.761
577 2,3-Butanedione 1.46 1.85 1.24
587 2-Butanone 4.51 5.47 1.30
595 Acetic acid 7.821 1.99 7.941
604 Ethyl Acetate 4.83 nd 5.93
618 2-Methyl-1-propanol 1.46 3.36 1.18
648 3-Methylbutanal 1.37 nd 1.11
656 1-Butanol nd nd 1.13
706 2-Pentanone 2.79 5.34 1.21
708 3-Hydroxy-2-butanone 1.66 1.76 1.39
711 Propyl acetate 2.74 nd 1.17
734 3-Methyl-1-butanol 7.38 5.68 7.36
737 2-Methyl-butanol 1.42 3.40 1.16
815 Ethyl 2-hydroxypropanoate 7.091 nd 4.581
856 3-Hexen-1-ol 2.68 nd 3.43
nd not detected.
GC-MS analysis of the headspace from control silage 1 compared to silage infected with M. ruber,
the fungal mix, P. paneum and P. roqueforti show that, through Duncan’s multiple range test, out of
12 detected compounds (Table 2) 9, of which one is an unknown compound, are indicators for
silage (Figure 3), 1 is an indicator for M. ruber infection (Figure 4) and 2 are indicators for P.
paneum and P. roqueforti infection (Figure 4). Prior to diffusive sampling of volatiles onto Tenax
TA adsorption it was noted that the P. paneum and P. roqueforti samples exhibited a slight smell of
81

1-Propanol Acetic acid
Ethyl 2-hydroxypropanoate
HOO
OH
O
OOH
Figure 2. Chemical structures of the three
volatile biomarkers differentiating the three
silage groups.
Ethanol 1-Propanol 2-Butanol
Acetic acid 3-Methylbutanal
Propyl acetate 3-Methyl-1-butanol
Ethyl 2-hydroxypropanoate
HO HOOH
OOH
O
O
O HO
O
OOH
Figure 3. Chemical structures of the eight
known of the nine volatile silage biomarkers.
ammonia, which is not absorbed onto tenax. Also the P. paneum samples exhibited a slight smell of
1-Octene-3-ol which was also not detected in the GC-MS analysis. In general the fungal
contaminated samples had a “weaker” odor than the pure silage samples. Of the three fungal
contaminated silages the P. paneum contaminated silage exhibited the strongest odor and the M.
ruber infected silage the weakest smell. It is noteworthy that fungal spoilage of silage showed to
remove the silage volatile background almost completely.To our knowledge this is the first report of
identification of specific spoilage organisms in a microbial complex environment such as silage by
e-nose analysis.
From the results of this “worst case” study it seems very promising to use an e-nose for quality
control of silage by plug analysis although additional work has to be carried out in order to produce
prediction models for the various silage types. As it has been shown that it is possible to classify
fungal contamination of silage to species level the next step would be to investigate whether it is
possible to produce prediction models as seen in (11) for non-volatile biomarkers / mycotoxins
produced by silage infecting fungi such as mevalonin (M. ruber), andrastin A (P. paneum & P.
roqueforti), marcfortin A (P. paneum), mycophenolic acid (P. roqueforti), PR toxin (P. roqueforti)
and roquefortin C (P. paneum, P. roqueforti)
82

Table 2. The 12 Volatile Compounds Detected by Headspace Analysis of Silage. Compounds are
Listed by the Average Log Area for the Five Sample Groups (Sample Size Per Group Was Five For
Silage and Mix Samples and Ten for the remainder), Control Silage, M. ruber Infected Silage,
Mixed Spore Infected Silage, P. paneum infected Silage and P. roqueforti Infected Silage. 1:
Designating Significant Difference in Log Average Area From Sample Groups Not Noted by a 1 as
Per Duncan’s Multiple Range Test, 2: Designating Significant Difference in Log Average Area
From Sample Groups Not Noted by a 2 as Per Duncan’s Multiple Range Test. RI Compound Control
Silage
(log avg
area)
M. ruber
(log avg area)
Mix
(log avg area)
P. paneum
(log avg area)
P. roqueforti
(log avg area)
473 Ethanol 8.091 nd nd 0.72 nd
552 1-Propanol 8.251 nd nd 1.47 nd
592 2-Butanol 7.871 nd nd 0.77 nd
595 Acetic Acid 8.521 nd nd nd 2.451
604 Ethyl Acetate nd 6.331 7.021 6.701 nd
648 3-Methylbutanal 5.571 nd nd nd 0.682
711 Propyl acetate 7.611 nd nd 0.66 nd
734 3-Methyl-1-butanol 7.11 nd nd 0.68 nd
815 Ethyl 2-hydroxypropanoate 7.871 nd nd 2.26 1.47
908 Unknown 1 7.181 nd nd nd nd
1119 4-Ethyl-2-methylphenol nd nd nd 5.881 5.721
1302 Unknown 2 nd nd nd 1.56 nd
nd not detected
Ethyl acetate
O
O
4-Ethyl-2-methylphenol
OH
Figure 4. Chemical structures of Ethyl acetate, a
volatile biomarker for M. ruber infection of
silage and 4-Ethyl-2-methylphenol, a volatile
biomarker for P. paneum and P. roqueforti
infection of silage.
83

Altogether this study has proven it possible to classify spoiled from non-spoiled silage as well as
identifying the fungal species causing the spoilage. These results of course are only valid for the
chosen silage type, but suggest that it ought to be possible to achieve similar prediction models with
any given type of silage. In order to make industrially relevant prediction models it is required to
measure many more samples, to create prediction models for all relevant mycotoxins, and to
investigate whether it is possible to distinguish between all the different fungi associated with
silage. We believe that this study is the first study to show classification of the spoilage organism in
a highly complex system such as silage. The results of this study show a great potential for e-nose
quality control of silage.
ACKNOWLEDGMENT:
We would like to thank Hanne Jakobsen for technical assistance.
Note: This work was supported by the “Food technology, safety and quality” research program,
Ministry of Food, Agriculture and Fisheries, Denmark.
Literature cited
1. Danmarks Statistik, URL www.statistikbanken.dk. (StatBank Denmark, Statistics Denmark)
2. Auerbach, H.; Oldenburg, E.; Weissbach, F. Incidence of Penicillium roqueforti and roquefortine C in silages. J. Sci. Food Agr. 1998, 76, 565-572.
3. Nout, M. J. R.; Bouwmeester, H. M.; Haaksma, J.; Vandijk, H. Fungal Growth in Silages of Sugar-Beet Press Pulp and Maize. J. Agr. Sci. Cambridge 1993, 121, 323-326.
4. Pelhate, J. Maize silage: Incidence of moulds during conservation. Folia Vet. Lat. 1977, 7, 1-16.
5. Driehuis, F.; Oude Elferink, S. J. W. H. The impact of the quality of silage on animal health and food safety: A review. Vet. Quart. 2000, 22, 212-216.
6. Scudamore, K. A.; Livesey, C. T. Occurrence and significance of mycotoxins in forage crops and silage: a review. J. Sci. Food Agr. 1998, 77, 1-17.
7. Hussein, H. S.; Brasel, J. M. Toxicity, metabolism, and impact of mycotoxins on humans and animals. Toxicology 2001, 167, 101-134.
8. McDonald, P.; Henderson, N.; Heron, S. The Biochemistry of Silage, 2nd ed.; Chalcombe Publications: Southampton, 1991.
84

9. Garon, D.; Richard, E.; Sage, L.; Bouchart, V.; Pottier, D.; Lebailly, P. Mycoflora and Multimycotoxin Detection in Corn Silage: Experimental Study. J. Agric. Food Chem. 2006, 54, 3479-3484.
10. O'Brien, M.; Nielsen, K. F.; O'Kiely, P.; Forristal, P. D.; Fuller, H.; Frisvad, J. C. Mycotoxins and Other Secondary Metabolites Produced in Vitro by Penicillium paneum Frisvad and Penicillium roqueforti Thom Isolated from Baled Grass Silage in Ireland. J. Agric. Food Chem. 2007, 54, 9268-9276.
11. Karlshøj, K.; Nielsen, P. V.; Larsen, T. O. Prediction of Penicillium expansum Spoilage and Patulin Concentration in Apples used for Apple Juice Production by Electronic Nose Analysis. J. Agric. Food Chem. 2007.
12. Mielle, P. "Electronic noses": Towards objective instrumental characterization of food aroma. Trends Food Sci. Tech. 1996, 7, 432-438.
13. Esbensen, K. H. Multivariate data analysis -In practice, 5th ed.; CAMO AS: Oslo, 2001.
14. Duncan, D. B. Multiple Range and Multiple F Tests. Biometrics 1955, 11, 1-42.
85

86
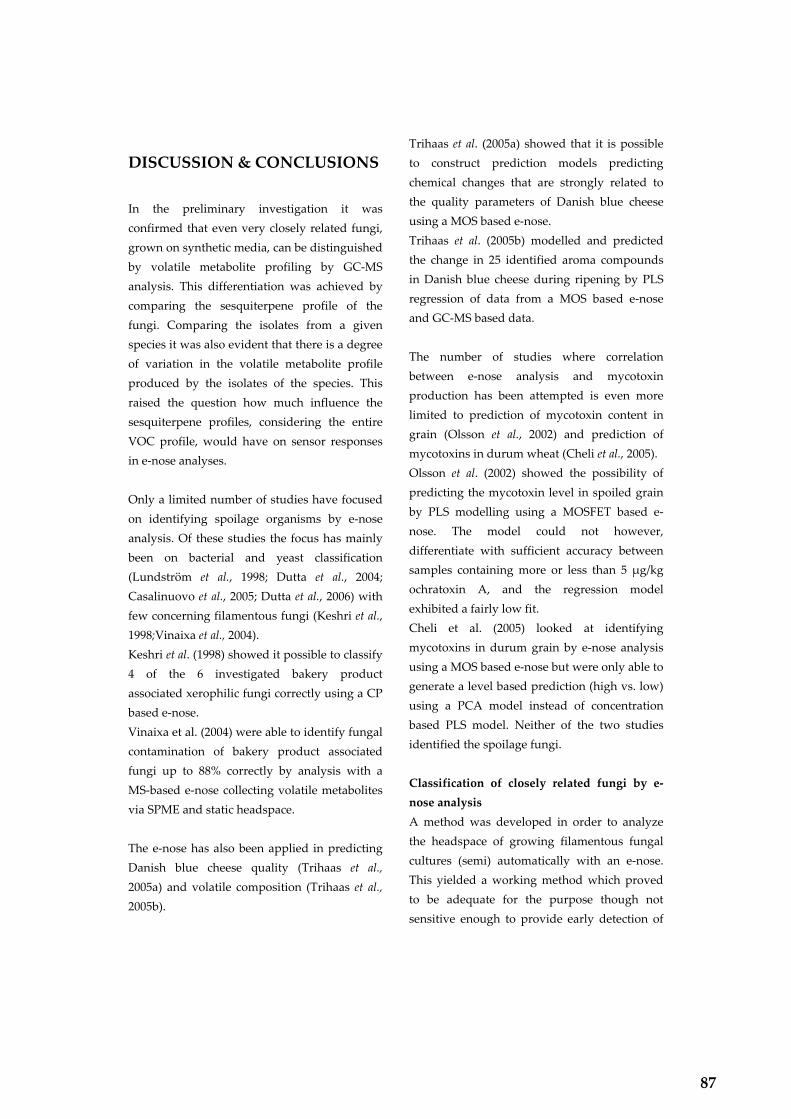
DISCUSSION & CONCLUSIONS In the preliminary investigation it was confirmed that even very closely related fungi, grown on synthetic media, can be distinguished by volatile metabolite profiling by GC‐MS analysis. This differentiation was achieved by comparing the sesquiterpene profile of the fungi. Comparing the isolates from a given species it was also evident that there is a degree of variation in the volatile metabolite profile produced by the isolates of the species. This raised the question how much influence the sesquiterpene profiles, considering the entire VOC profile, would have on sensor responses in e‐nose analyses. Only a limited number of studies have focused on identifying spoilage organisms by e‐nose analysis. Of these studies the focus has mainly been on bacterial and yeast classification (Lundström et al., 1998; Dutta et al., 2004; Casalinuovo et al., 2005; Dutta et al., 2006) with few concerning filamentous fungi (Keshri et al., 1998;Vinaixa et al., 2004). Keshri et al. (1998) showed it possible to classify 4 of the 6 investigated bakery product associated xerophilic fungi correctly using a CP based e‐nose. Vinaixa et al. (2004) were able to identify fungal contamination of bakery product associated fungi up to 88% correctly by analysis with a MS‐based e‐nose collecting volatile metabolites via SPME and static headspace. The e‐nose has also been applied in predicting Danish blue cheese quality (Trihaas et al., 2005a) and volatile composition (Trihaas et al., 2005b).
Trihaas et al. (2005a) showed that it is possible to construct prediction models predicting chemical changes that are strongly related to the quality parameters of Danish blue cheese using a MOS based e‐nose. Trihaas et al. (2005b) modelled and predicted the change in 25 identified aroma compounds in Danish blue cheese during ripening by PLS regression of data from a MOS based e‐nose and GC‐MS based data. The number of studies where correlation between e‐nose analysis and mycotoxin production has been attempted is even more limited to prediction of mycotoxin content in grain (Olsson et al., 2002) and prediction of mycotoxins in durum wheat (Cheli et al., 2005). Olsson et al. (2002) showed the possibility of predicting the mycotoxin level in spoiled grain by PLS modelling using a MOSFET based e‐nose. The model could not however, differentiate with sufficient accuracy between samples containing more or less than 5 μg/kg ochratoxin A, and the regression model exhibited a fairly low fit. Cheli et al. (2005) looked at identifying mycotoxins in durum grain by e‐nose analysis using a MOS based e‐nose but were only able to generate a level based prediction (high vs. low) using a PCA model instead of concentration based PLS model. Neither of the two studies identified the spoilage fungi. Classification of closely related fungi by e‐nose analysis A method was developed in order to analyze the headspace of growing filamentous fungal cultures (semi) automatically with an e‐nose. This yielded a working method which proved to be adequate for the purpose though not sensitive enough to provide early detection of
87

spoilage since a loss of volatile metabolites was allowed in order to allow oxygen and carbon dioxide diffusion to and from the cultures. The results from analyzing four repeats of every isolate showed that the method developed was robust as the four measurements were quite identical. Working with three isolates per species showed that there is a fairly large diversity between isolates within a species in terms of volatile metabolite profiles and hence e‐nose sensor response. This did not prevent differentiation of the species but added to the complexity of the task. HPLC analysis of the cultures also proved that the cultivation method did not restrict the fungi from producing the expected mycotoxins. Up to 94% of the samples were correctly identified to species level from a total of 7 fungal species, of which 3 belong to the very closely related P. roqueforti group. The results of this study manage to identify the contaminants to species level, whereas Vinaixa et al. (2004) stop at genus level and even then with a lower classification percentage. Keshri et al. (1998) classify 4 of 6 species, though this is only after 48 hours which suggests that Keshri et al. (1998) could probably attain a higher degree of correct classification, although fewer species were involved than in this study. Detection apple spoilage and prediction of patulin concentration in apples and juice E‐nose analysis of Penicillium expansum infected Golden Delicious and Jonagold apples proved that it is possible to distinguish spoiled apples from non‐spoiled apples, both for whole apples as well as apple pulp and apple juice despite the high VOC background from the apples. In this analysis it was also shown that the e‐nose detects this change on basis of a small change in the overall headspace, as the volatile
metabolites which are indicative of P. expansum spoilage only constituted 6% of the total amount of volatiles measured. PLS regression models, both for apple pulp and apple juice, showed a high correlation between patulin concentration and e‐nose measurements, and therefore showed that it is possible to construct prediction models for patulin in apples. This experiment also showed that e‐nose response is dependant on apple variety and very likely to show the same tendency as GC‐MS, where analysis of various apple cultivars has shown, that apples group by peel colour (green, red or red and green). Before e‐nose analysis can be applied industrially further studies have to be conducted in which it is investigated what the threshold for patulin prediction by e‐nose analysis is; furthermore extensive sampling must be carried out to produce prediction models suitable for the variations in apple varieties encountered in the apple juice industry. This study produces a PLS based regression model prediction of patulin concentration whereas, for instance, Cheli et al.’s (2005) study does not manage to produce a correlation model between mycotoxins and e‐nose analysis data, only predicting low or high levels based on a PCA scores plot analysis. Compared to Olsson et al.’s (2002) study, the fit of the regression model in this study is much higher which makes the correlation model of this study more reliable. It can be discussed whether the level of spoilage in the two studies was similar, but this is a quite complex issue to resolve and would require for instance comparing the dry weight ratio of fungal culture in the two sample systems. Compared to the combined results from the studies by Trihaas et al. (2005a, 2005b) it seems feasible to speculate that it would be possible to
88
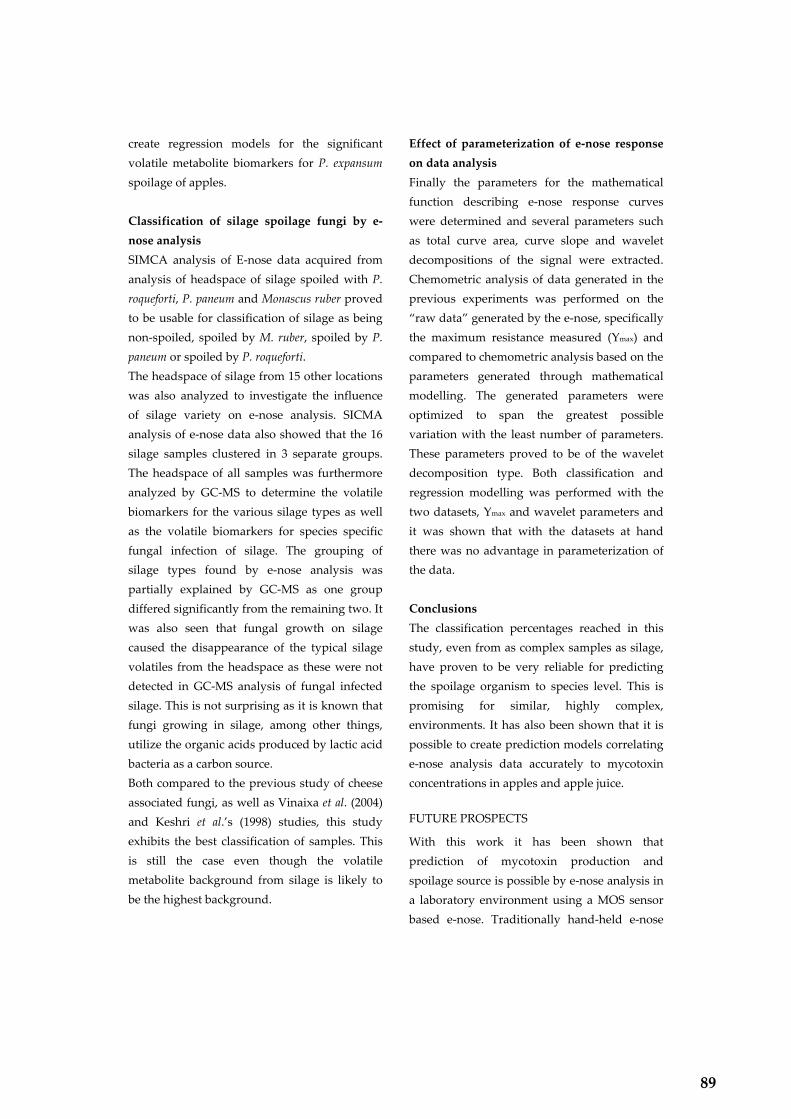
create regression models for the significant volatile metabolite biomarkers for P. expansum spoilage of apples. Classification of silage spoilage fungi by e‐nose analysis SIMCA analysis of E‐nose data acquired from analysis of headspace of silage spoiled with P. roqueforti, P. paneum and Monascus ruber proved to be usable for classification of silage as being non‐spoiled, spoiled by M. ruber, spoiled by P. paneum or spoiled by P. roqueforti. The headspace of silage from 15 other locations was also analyzed to investigate the influence of silage variety on e‐nose analysis. SICMA analysis of e‐nose data also showed that the 16 silage samples clustered in 3 separate groups. The headspace of all samples was furthermore analyzed by GC‐MS to determine the volatile biomarkers for the various silage types as well as the volatile biomarkers for species specific fungal infection of silage. The grouping of silage types found by e‐nose analysis was partially explained by GC‐MS as one group differed significantly from the remaining two. It was also seen that fungal growth on silage caused the disappearance of the typical silage volatiles from the headspace as these were not detected in GC‐MS analysis of fungal infected silage. This is not surprising as it is known that fungi growing in silage, among other things, utilize the organic acids produced by lactic acid bacteria as a carbon source. Both compared to the previous study of cheese associated fungi, as well as Vinaixa et al. (2004) and Keshri et al.’s (1998) studies, this study exhibits the best classification of samples. This is still the case even though the volatile metabolite background from silage is likely to be the highest background.
Effect of parameterization of e‐nose response on data analysis Finally the parameters for the mathematical function describing e‐nose response curves were determined and several parameters such as total curve area, curve slope and wavelet decompositions of the signal were extracted. Chemometric analysis of data generated in the previous experiments was performed on the “raw data” generated by the e‐nose, specifically the maximum resistance measured (Ymax) and compared to chemometric analysis based on the parameters generated through mathematical modelling. The generated parameters were optimized to span the greatest possible variation with the least number of parameters. These parameters proved to be of the wavelet decomposition type. Both classification and regression modelling was performed with the two datasets, Ymax and wavelet parameters and it was shown that with the datasets at hand there was no advantage in parameterization of the data. Conclusions The classification percentages reached in this study, even from as complex samples as silage, have proven to be very reliable for predicting the spoilage organism to species level. This is promising for similar, highly complex, environments. It has also been shown that it is possible to create prediction models correlating e‐nose analysis data accurately to mycotoxin concentrations in apples and apple juice.
FUTURE PROSPECTS
With this work it has been shown that prediction of mycotoxin production and spoilage source is possible by e‐nose analysis in a laboratory environment using a MOS sensor based e‐nose. Traditionally hand‐held e‐nose
89

systems have been equipped with CP sensors, such as the Cyranose 320 (Cyrano Science, Pasadena, California, USA) which due to their high sensitivity to changes in sample moisture have proven difficult to apply industrially. MOS based hand‐held e‐nose systems have started to become available such as the PEN3 (Airsense analytics GmbH, Schwerin, Germany). This development can potentially strengthen e‐nose analysis as a method which can be applied outside the lab. If the e‐nose is also supplied with proper prediction models for the given task, the simplicity of operation of the instrument can potentially allow non‐skilled personnel to operate it and hence analyze samples without the need for expensive laboratory equipment and highly skilled personnel. The e‐nose can be applied as a tool for detecting the right samples to be analyzed further by LC‐MS or GC‐MS, hence improving spot sampling. Apart from the mentioned areas, the e‐nose has a great potential for use in clinical studies, for identification and detection of for instance aspergillosis. Thus the areas where e‐nose technology can potentially be used are highly diverse.
REFERENCES
Casalinuovo, I. A., Pierro, D., Bruno, E., Francesco, and P., Coletta, M. (2005). Experimental use of a new surface acoustic wave sensor for the rapid identification of bacteria and yeasts. Letters in Applied Microbiology 42:24‐29.
Cheli, F., DellʹOrto, V., Pinotti, L., Campagnoli, A., and Tognon, G. (2005). Implementation of the electronic nose for the identification of mycotoxins in durum wheat (Triticum durum). Veterinary Research Communications 29:391‐393.
Dutta, R., Gardner, J. W., and Hines, E. L. (2004). ENT bacteria classification using a neural network based cyranose 320 electronic nose. Sensors, 2004. Proceedings of IEEE 324‐325.
Dutta, R., Das, A., Stocks, N. G., and Morgan, D. (2006). Stochastic resonance‐based electronic nose: A novel way to classify bacteria. Sensors and Actuators B: Chemical 115:17‐27.
Keshri, G., Magan, N., and Voysey, P. (1998). Use of an electronic nose for the early detection and differentiation between spoilage fungi. Letters in Applied Microbiology 27:261‐264.
Lundström, I., Holmberg, M., Gustafsson, F., Hörnsten, E. G., Winquist, F., Lennart, E., and Ljung, L. (1998) Bacteria classification based on feature extraction from sensor data. Biotechnology Techniques 12:319‐324.
Olsson, J., Börjesson, T., Lundstedt, T., and Schnürer, J. (2002). Detection and quantification of ochratoxin A and deoxynivalenol in barley grains by GC‐MS and electronic nose. International Journal of Food Microbiology 72:203‐214.
Trihaas, J., Vognsen, L., and Nielsen, P. V. (2005a). Electronic nose: New tool in modelling the ripening of Danish blue cheese. International Dairy Journal 15:679‐691.
Trihaas, J., Nielsen, P. V., and van den Tempel, T. (2005b) Electronic nose technology in quality assessment. Predicting the volatile composition of Danish blue cheese. Journal of Food Science 70:392‐400.
Vinaixa, M., Marin, S., Brezmes, J., Llobet, E., Vilanova, X., Correig, X., Ramos, A., and Sanchis, V. (2004). Early detection of fungal growth in bakery products by use of an electronic nose based on mass spectrometry. Journal of Agricultural and Food Chemistry 52:6068‐6074.
90