Prediction of Gas-hydrate Equilibrium, Stability and ...
135
Rochester Institute of Technology Rochester Institute of Technology RIT Scholar Works RIT Scholar Works Theses 5-27-2020 Prediction of Gas-hydrate Equilibrium, Stability and Kinetic Prediction of Gas-hydrate Equilibrium, Stability and Kinetic Nucleation in Porous Media Nucleation in Porous Media Yali Zhang [email protected] Follow this and additional works at: https://scholarworks.rit.edu/theses Recommended Citation Recommended Citation Zhang, Yali, "Prediction of Gas-hydrate Equilibrium, Stability and Kinetic Nucleation in Porous Media" (2020). Thesis. Rochester Institute of Technology. Accessed from This Dissertation is brought to you for free and open access by RIT Scholar Works. It has been accepted for inclusion in Theses by an authorized administrator of RIT Scholar Works. For more information, please contact [email protected].
Transcript of Prediction of Gas-hydrate Equilibrium, Stability and ...

Rochester Institute of Technology Rochester Institute of Technology
RIT Scholar Works RIT Scholar Works
Theses
5-27-2020
Prediction of Gas-hydrate Equilibrium, Stability and Kinetic Prediction of Gas-hydrate Equilibrium, Stability and Kinetic
Nucleation in Porous Media Nucleation in Porous Media
Yali Zhang [email protected]
Follow this and additional works at: https://scholarworks.rit.edu/theses
Recommended Citation Recommended Citation Zhang, Yali, "Prediction of Gas-hydrate Equilibrium, Stability and Kinetic Nucleation in Porous Media" (2020). Thesis. Rochester Institute of Technology. Accessed from
This Dissertation is brought to you for free and open access by RIT Scholar Works. It has been accepted for inclusion in Theses by an authorized administrator of RIT Scholar Works. For more information, please contact [email protected].

R.I.T
Prediction of Gas-hydrate Equilibrium, Stability and Kinetic
Nucleation in Porous Media
by
Yali Zhang
A dissertation submitted in partial fulfillment of the requirements for the degree of Doctorate of Philosophy in Microsystems Engineering
Microsystems Engineering Program Kate Gleason College of Engineering
Rochester Institute of Technology Rochester, New York
May 27, 2020

2
Prediction of Gas-hydrate Equilibrium, Stability and Kinetic Nucleation in Porous Media by
Yali Zhang
Committee Approval:
We, the undersigned committee members, certify that we have advised and/or supervised the candidate on the work described in this dissertation. We further certify that we have reviewed the dissertation manuscript and approve it in partial fulfillment of the requirements of the degree of Doctor of Philosophy in Microsystems Engineering.
______________________________________________________________________________ Dr. Patricia Taboada-Serrano Date Associate Professor, Department of Chemical Engineering - KGCOE
______________________________________________________________________________ Dr. Michael Schrlau Date Associate Professor, Department of Mechanical Engineering - KGCOE
______________________________________________________________________________ Dr. Nathaniel Barlow Date Assistant Professor, School of Mathematical Sciences - COS
______________________________________________________________________________ Dr. Megan Elwood Madden Date Professor, Robert & Doris Klabzuba Chair, Stubbeman-Drace Presidential Professor of Geology and Geophysics, University of Oklahoma
______________________________________________________________________________ Committee member Date Affiliation
Certified by:
______________________________________________________________________________ Dr. Bruce Smith Date Director, Microsystems Engineering Program

3
ABSTRACT
Kate Gleason College of Engineering Rochester Institute of Technology
Degree: Doctor of Philosophy Program: Microsystems Engineering
Author’s Name: Yali Zhang
Advisor’s Name: Dr. Patricia Taboada-Serrano
Dissertation Title: Prediction of Gas-hydrate Equilibrium, Stability and Kinetic Nucleation in
Porous Media
Natural gas-hydrates are crystalline inclusion compounds with gas molecules (guest
compounds) trapped within a host lattice formed by water molecules in an ice-like hydrogen-
bonded framework. Natural gas-hydrates have the potential to become an important carbon-based
resource addressing the increasing energy demand, and they pose a risk in terms of climate change.
Accurate estimates of gas-hydrates global inventory, understanding of formation and dissociation
processes of gas-hydrates, and evaluation of their environmental impact require models that
accurately describe gas-hydrate stability in sediments and predict gas-hydrate kinetic nucleation
processes. The hypothesis driving this work is that incorporation of selected sediment properties,
i.e., surface energies and pore diameter, can lead to more accurate predictions of hydrate
equilibrium, stability and nucleation in porous media.
In this work, a model for gas-hydrate equilibrium in porous media was developed from
basic thermodynamic principles and tested against available experimental data published in the
scientific literature. The proposed model predicts reported experimental data with high accuracy
for the range of pore sizes (3.4 ~ 24.75 nm) of different materials reported in the literature. It was
found that the wettability of the pore surface affects the shape of the hydrate phase inside the pore
and consequently influences the equilibrium pressures of gas-hydrates formed in porous media.

4
A predictive macroscopic mathematical model describing the kinetic nucleation of gas-
hydrates was developed based on Classical Nucleation Theory (CNT) in order to formulate
correction factors for three types of interfaces mostly encountered in natural sediments (gas-liquid
interface, liquid-solid interface and three-phase boundary lines). This approach, which
incorporates the interfacial properties of sediments, can efficiently provide a fundamental
understanding on the dependence of the formation mechanism of gas hydrates on a wide range of
interfacial properties (wettability, substrate size, interfacial tension). The model predicts that
hydrate nucleation is energetically favorable on confined surfaces with smaller contact-angle
values, i.e., hydrophilic surfaces. Comparison between different types of interfaces leads to the
conclusion that the nucleation of gas hydrates preferentially occurs in larger sediment pores. At
the beginning of methane hydrate formation, for example, hydrate will preferentially nucleate at
the gas-liquid interface. With the increase of hydrate volume or growth of the hydrate phase, the
center of crystal growth moves towards the liquid-solid interface. In natural systems, gas hydrates
form first on the concave liquid/solid interface and gas/liquid interface in sandstone sediments,
gas/liquid interface and gas/liquid/solid triple boundary line in clay sediments and gas/liquid
interface in pipeline with oil droplets.
The inclusion of sediment properties in the model for gas-hydrate equilibrium in sediments
predict experimental data within a margin of %AAD lower than 2%, a significant improvement
upon previous modeling attempts. Additionally, the inclusion of sediment properties in the models
for kinetic nucleation of gas hydrates result in mathematical models that capture the qualitative
information obtained from examination of gas-hydrate core samples. Therefore, the hypothesis of
the present work was proven.

5
ACKNOWLEDGMENTS
I am heartily grateful to my advisor Dr. Taboada-Serrano, who provided me with the
guidance and opportunity to work on this project and advised me to completion of this work. I
would like to show my gratitude to my dissertation committee members, Dr. Elwood Madden, Dr.
Schrlau, and Dr. Barlow, for their instructive suggestions and valuable comments on this thesis. I
would also like to express my appreciation to the Microsystems Engineering program and the
department of Chemical Engineering for their amazing support. Thanks go to Dr. Weinstein for
his continuous support and insightful suggestions on my research. Thanks go also to Dr. Costas
Tsouris from the Oak Ridge National Laboratory and Georgia Institute of Technology for
stimulating our interest in this work, and to Dr. Peter Brewer and his team from Monterey Bay
Aquarium Research Institute who provided the natural perspective for this work. I am also grateful
to Julie Olney and Lisa Zimmerman for their continuous and reliable administrative support. I am
deeply indebted to my parents, my husband Binghui Deng, my son William Deng, and friends for
their help, support and understanding.
Lastly, I would like to acknowledge the financial support from the Kate Gleason Fund at
the Rochester Institute of Technology.

6
Table of Contents
CHAPTER 1 INTRODUCTION ......................................................................................................... 1
1.1 Overview .......................................................................................................................................... 2
1.2 Gas Hydrates .................................................................................................................................. 2
1.3 Structure of Gas Hydrates .......................................................................................................... 3
1.4 Development of Research on Gas Hydrates .......................................................................... 5
1.5 Relevance of Gas Hydrates ........................................................................................................ 7
1.5.1 Gas Hydrates in Flow Assurance .......................................................................................... 7
1.5.2 Gas Hydrates for Natural Gas Storage and Transport ..................................................... 10
1.5.3 Gas Hydrates as Energy Source ......................................................................................... 12
1.5.4 Gas Hydrates Risk to Global Climate .................................................................................. 14
1.6 Summary ........................................................................................................................................ 15
CHAPTER 2 RESEARCH DESIGN AND OBJECTIVES ................................................................... 16
2.1 Motivation ...................................................................................................................................... 17
2.2 Problem Statement ..................................................................................................................... 19
2.2.1 Equilibrium and Stability of Gas-hydrates .......................................................................... 19
2.2.2 Kinetic Nucleation Rate of Gas-hydrates ............................................................................ 20
2.3 Hypothesis and Objectives ....................................................................................................... 21
CHAPTER 3 MODEL FOR GAS-HYDRATE EQUILIBRIUM IN POROUS MEDIA THAT
INCORPORATES PORE-WALL PROPERTIES ............................................................................... 23
3.1 Motivation ...................................................................................................................................... 24
3.2 Types of Sediments .................................................................................................................... 25
3.3 Background ................................................................................................................................... 26
3.4 Model Description ....................................................................................................................... 27
3.4.1 Mechanical Equilibrium.......................................................................................................... 34
3.4.2 Chemical Equilibrium ............................................................................................................. 37
3.5 Results and Discussion ............................................................................................................. 42
3.5.1 Comparison of Model Predictions and Experimental Data .............................................. 43
3.5.2 Effect of Interfaces in Model Accuracy ................................................................................ 46
3.5.3 Effect of Kihara Potential Parameters on Model Accuracy .............................................. 47
3.5.4 Prediction of Gas-hydrate Equilibrium in Large Sediment Pores ................................... 50
3.6 Conclusions .................................................................................................................................. 52

7
CHAPTER 4 INTERFACIAL EFFECTS ON THE ENERGY BARRIER FOR GAS-HYDRATE CAGE
AND ICE HETEROGENEOUS NUCLEATION ................................................................................. 53
4.1 Motivation ...................................................................................................................................... 54
4.2 Types of Interfaces ..................................................................................................................... 56
4.3 Model Description on Correction Factors............................................................................. 57
4.3.1 Correction factors for heterogeneous nucleation at the gas/liquid interface ................. 58
4.3.2 Correction factors for heterogeneous nucleation on a solid substrate ........................... 62
4.3.3 Correction factors for heterogeneous nucleation at the gas/liquid/solid triple boundary line ...................................................................................................................................................... 69
4.4 Effects of Interfaces on Energy Barrier for Nucleation ..................................................... 74
4.4.1 Gas/liquid interface – bulk ..................................................................................................... 74
4.4.2 Convex surface – particles and particulates ...................................................................... 76
4.4.3 Concave surfaces – porous media ...................................................................................... 77
4.4.4 Gas/liquid/solid triple boundary ............................................................................................ 81
4.5 Conclusions .................................................................................................................................. 83
CHAPTER 5 INTERFACIAL EFFECTS ON KINETIC NUCLEATION OF GAS-HYDRATE ............. 85
5.1 Motivation and Background ..................................................................................................... 86
5.2 Model for Kinetic Nucleation Rate of Gas-hydrate ............................................................. 88
5.3 Effects of Foreign Interfaces on Nucleation Process of Gas-hydrate ........................... 92
5.3.1 Concave liquid/solid interface ............................................................................................... 92
5.3.2 Convex liquid/solid interface ................................................................................................. 94
5.3.3 Gas/liquid interface ................................................................................................................ 97
5.3.4 Gas/liquid/solid triple boundary ............................................................................................ 98
5.4 Discussion ..................................................................................................................................... 99
5.4.1 Effects of liquid/solid interfaces ............................................................................................ 99
5.4.2 Effects of gas/solid interfaces ............................................................................................. 101
5.4.3 Effects of various interfaces ................................................................................................ 102
5.5 Conclusions ................................................................................................................................ 105
CHAPTER 6 SUMMARY AND CONCLUSIONS ............................................................................ 107
CHAPTER 7 FUTURE WORK RECOMMENDATION ................................................................... 112
REFERENCES .............................................................................................................................. 118

1
CHAPTER 1 INTRODUCTION

2
1.1 Overview
Natural gas hydrates (NGH), also known as burning ice, are believed to be an ideal source
of natural gas for future exploitation. The extraction of gas containing especially methane from
NGH accumulations is expected to play an increasing important role in global energy supply with
a forecasted annual growth of 1.7% in the next two decades1.
Traditionally, gas-hydrates have attracted wide attention due to their detrimental effects in
the petroleum industry. Gas-hydrates can form in natural gas pipelines during natural gas
production and transportation processes leading to clogging of the pipelines and disruption of
operations. It was later discovered that gas-hydrates occur naturally in widespread environments
around the globe. Recently, storing and transporting natural gas in the form of solid gas hydrates
has gathered attention as a promising alternative method for gas storage and transportation due to
the advantages of low cost, safety at relatively low pressures and high temperatures. Additionally,
NGH present a high risk with respect to global climate as will be explained below. Over the past
decades, significant effort has been conducted to study the behavior of NGH. In this chapter,
background knowledge about NGH will be covered, including structure of NGH, applications of
NGH and the state-of-the art on the research of NGH.
1.2 Gas Hydrates
Natural gas hydrates, gas-hydrates for short, are crystalline inclusion compounds with gas
molecules (guest compounds) trapped within a host lattice formed by water molecules in an ice-
like hydrogen-bonded framework as depicted. Van der Waals forces (physical bonding) between
the guest molecule and water molecules stabilize the structure of gas-hydrates, preventing it from
collapsing into the conventional ice structure2,3. Common guest-gas molecules include low-
molecular weight hydrocarbons such as methane, ethane and other gases like H2S, CO2, H2 and N2.

3
Gas-hydrates are metastable compounds, whose formation and decomposition is determined by
the environmental conditions in which they are formed, including temperature, pressure,
composition of gas, salinity of water and the physical properties of their reservoirs. Gas-hydrates
can be stable over a wide range of pressures and temperatures. For example, methane hydrates are
stable from 70 to 350 K (-334 to 170 ) at pressures from 20 nPa to 2 GPa (2.90075 10 to
2.90075 10 psia)4.
Gas-hydrates possess some unique properties, such as their large storage capacity for gas
in stable conditions. For instance, 1 m3 of water is capable of storing 216 m3 of methane to form
1.26 m3 of gas-hydrates at standard temperature/pressure conditions. This is equivalent to 1.09 m3
of ice without gas trapped. Therefore, in a unit volume of solid gas-hydrates, 80% of the volume
is occupied by water molecules and 20% by gas molecules4,5.
1.3 Structure of Gas Hydrates
Most of the volume of gas-hydrates is occupied by water, thus many properties of gas-
hydrates are similar to those of ice (e.g., density, physical appearance, and refractive index). The
cavities of gas-hydrates are larger than the basic unit of ice crystal in order to allow guest molecules
to be trapped inside6. Gas-hydrates exist mainly in three types of crystalline structures depending
on the temperature and pressure conditions and the size of the guest molecules. These crystalline
structures are known as structure I (sI), structure II (sII), and structure H (sH)6. X-ray diffraction,
Raman spectroscopy and nuclear magnetic resonance (NMR) spectroscopy are the most effective
experimental techniques to confirm and characterize the structures of gas-hydrates6. The structures
sI and sII were confirmed by Von Stackelberg, Muller2,3 and Claussen7–9 via X-ray diffraction
experiments. After 20 years, Ripmeester et al. discovered the structure H with NMR, X-ray and
neutron powder diffraction measurements10. It was found that water molecules form different

4
patterns and cages through hydrogen bonds in each structure. Only one guest molecule can be
trapped inside each cage.
Table.1. Summary of the structural details of three common unit crystals based on values reported by C.A. Koh, E.D. Sloan et al.11
Hydrate Structure I II H
Cavity Small Large Small Large Small Medium Large
Description 512 51262 512 51264 512 435663 51268
Number of cavities per unit
cell
2 6 16 8 3 2 1
Average cavity radius (Å) 3.95 4.33 3.91 4.73 3.91† 4.06† 5.71†
Coordination number* 20 24 20 28 20 20 36
Number of water per unit cell 46 136 34
*Number of oxygens at the periphery of each cavity. †Es mates of structure H cavi es from geometric models.
The basic cage, the building blocker for all the three structures, is the 512 cage (so called
pentagonal dodecahedral cage or small cage), i.e., the cage contains 12 pentagonal faces. Structure
I (sI) is most commonly encountered in nature because natural deposits generally generate methane
gas (biogenic gas) without heavier hydrocarbon molecules. As shown in Table 1, the sI is
composed of two small 512 cages and six medium 51262 cages (this cage contains 12 pentagonal
and 2 hexagonal faces on the cage). Guest molecules such as CH4, CO2, H2S, C2H6 normally form
gas-hydrates with the structure I. The other two hydrate structures (sII and sH) as shown in Table
1 are less commonly found in natural environments but occur more commonly in artificially-
synthesized hydrates with larger hydrocarbons. Gas-hydrates formed in oil and gas pipelines are
mostly of structure II or structure H because natural-gas is composed of large amounts of heavier
hydrocarbon molecules (e.g., propane, butane, pentane) and small amounts of methane molecules.

5
Structure II includes 16 small 512 cages and 8 large hexacaidecahedral cage (cage of 51264 contains
12 pentagonal and 4 hexagonal faces on the cage). Larger guest molecules (e.g., C3H8, O2, N2, Ar,
Kr) can form structure II. Structure sH is made up of 3 small 512 cages, 2 mid-sized 435663 cages
(contains 3 square, 6 pentagons and 3 hexagons on the cage) and 1 large icosahedral 51268 cage,
which has 12 pentagonal and 8 hexagonal faces on the cage. Large molecules such as butane,
methylcyclohexane and larger hydrocarbons usually form structure H. Surprisingly, hydrogen also
forms hydrate of structure H6,11.
Not all gas molecules are able to form gas-hydrates. There are two basic requirements for
a gas molecule to form hydrates12. On one hand, the gas molecule should not be able to form or
contain strong or moderately strong hydrogen bonds (e.g., H-F). On the other hand, the size of
guest molecule should be located in the range between 3.5Å and 9Å. At normal pressures, guest
molecules smaller than 3.5Å are too small to stabilize gas-hydrate cavities and molecules larger
than 9Å are too large to fit into a gas-hydrate cavity without distorting the lattice. In addition, guest
molecules between 3.5Å and 7.5Å can only form sI or sII6,11. Gas mixtures usually form mixed
hydrate structures.
1.4 Development of Research on Gas Hydrates
In 1778, Priestley first observed clathrate hydrates by bubbling SO2 into freezing water
under laboratory conditions. In addition, he also discovered that gas-hydrates formed from other
types of gas, including oxygen, hydrogen and others. However, Priestley didn’t describe the
crystals he synthesized as gas-hydrates. Thirty three years afterwards, Sir Humphrey Davy
obtained aqueous chlorine clathrate (hydrate) in 1811 and named the crystal as a hydrate of gas.
Therefore, Priestley is the first scientist who synthesized gas-hydrates in a laboratory and Davy is
the first scientist to identify the materials as gas-hydrates. During the period from 1811 to 1934,

6
there was no significant research effort on the behavior of gas-hydrates. Research interests mainly
focused on identifying the types of gas-hydrates and at which conditions (pressures and
temperatures) gas-hydrates can form. Gas-hydrates were still a curiosity for scientists before
19344,11.
In 1934, Hammerschmidt was the first to find that solid gas-hydrates can plug natural-gas
pipelines during gas transportation processes. From 1934 to 1965, the number of publications
about gas-hydrates grew exponentially. Research on gas-hydrates during this period was
principally motivated by flow assurance during gas production and transport. There are 144
publications that mainly investigate the formation conditions of gas-hydrates in bulk and provide
effective methods to prevent gas-hydrates from clogging natural-gas pipelines. In addition, over
this period of time, macroscopic models were developed to describe the phenomenon of pipeline
plugging, and microscopic structures of gas-hydrates were also determined with microscopic
tools4,11.
In 1965, Makogon suggested that natural gas-hydrates can form in cooled sediments, which
was later proved by laboratory experiments with real core samples. Starting in 1965, most of the
research has focused on natural gas-hydrates in sediments, which are believed to be an
unconventional source of energy in the coming future4. During the period from 1970 to 2005,
natural gas-hydrates research programs were established in various countries worldwide4. Natural
gas hydrates occur in geographically diverse settings, either in marine sediments or permafrost
environments. After 2000, research interest on the accumulation of gas-hydrates was extended to
moons and other planets such as Mars due to their low temperature and high pressure conditions,
as well as the gases present around them13–15.

7
Over the past decade, diverse topics related to gas-hydrates attracted researchers’ attention,
including: (1) potential of gas-hydrates as a promising future source of energy; (2) description,
characterization and production performance of natural gas-hydrates deposits; (3) gas production
from gas-hydrates; (4) thermodynamic stability of gas-hydrates; (5) kinetics of formation of
hydrocarbon hydrates; (6) inhibition of gas-hydrates formation in pipelines and flowlines; (7)
potential applications of gas-hydrates for gas storage, transportation, gas separation and carbon
dioxide sequestration16; and (8) accumulations of gas-hydrates in planetary material (e.g., Martian
subsurface)14. In addition, the risk posed by gas-hydrates (especially methane-hydrates) with
respect to global climate has gained increasing attention4,16. According to the published research
work, there are 82 countries conducting research work related to gas-hydrates. Among them, three
counties (e.g., the United States, China and Japan) have produced 50% of the total number of
publications as of 20161.
1.5 Relevance of Gas Hydrates
1.5.1 Gas Hydrates in Flow Assurance
Naturally, oil and gas wells always produce undesired water along with hydrocarbons. This
mixture is suitable to form gas-hydrates. When the temperature decreases into the hydration range,
gas-hydrates form and plug oil and gas pipelines, which can result in severe operational problems
in the petroleum industry. Gas-hydrates deposit on pipe walls and further agglomerate to form
large plugs during drilling, production, transportation and processing of oil and gas. Sometimes
gas-hydrate formation causes pipeline blockages and other serious safety problems. For example,
when the temperature is above the hydration range, gas-hydrates formed in pipelines will
dissociate and detach first at the pipe wall. Then, any pressure gradient across the pipe will make
the gas-hydrate plug move rapidly down the pipelines like a projectile. As a result, the downstream

8
gas will be compressed which will either cause pipeline blowouts or result in explosion of the plug
through pipeline bends11. In other cases, when the pipeline is locally heated, the released gas from
the hydrate plug sometimes can result in pipeline ruptures due to extremely high local pressures11.
A proposed conceptual model is applied to describe gas-hydrates formation in a multiphase
flow system containing water, oil, and gas17. In this model, four stages are involved in the
mechanism of hydrate formation and deposition in hydrate plugging. First, water droplets are
entrained in oil phase and gas bubbles are entrained in water phase. Second, gas hydrate formation
occurs at the interfaces of water-oil and water-gas, followed by the third stage of aggregation of
gas hydrates. Finally, hydrate particles agglomerate to larger aggregates that may cause a complete
blockage18. The surface of gas-hydrates is inherently hydrophilic19. A thin layer of water film
covers the hydrate surface, which results in a capillary bridge between gas-hydrates particles20,21.
Gas-hydrates particles are bound together through capillary forces. As a result, agglomeration of
hydrate particles always presents the high risk of blockage in oil and gas production and
transportation lines.
Some methods have been developed to avoid gas hydrate plugs, including removing water
prior to pipeline transportation, raising the temperature (e.g. insulation, bundles, electric or hot
water heating), lowering the pressure, and shifting the equilibrium conditions for hydrate
formation to lower temperatures and higher pressures by adding some thermodynamic inhibitors
(TIs)22. These methods are very expensive and inconvenient, such as heated pipelines or the need
for chemicals injection and regeneration facilities. In addition, TIs are not environmentally friendly
due to their chemical toxicity23. In the last several decades, low dosage hydrate inhibitors (LDHIs),
including kinetic hydrate inhibitors (KHIs) and anti-agglomerants (AAs), have become more
attractive for subsea gas or oil production and transportation due to their effectiveness at low

9
dosage. Low dosage hydrate inhibitors do not change the thermodynamic conditions of the system,
but they mainly work on the early stage of hydrate formation by altering the rheological properties
of fluids in the system.
Kinetic hydrate inhibitors are usually water-soluble polymers, which can delay crystal
nucleation or decrease hydrate formation rates in pipelines. Therefore, hydrocarbon fluids can be
transported for a long time without hydrate agglomeration in lines. The lower the temperature
below the equilibrium temperature in hydrate region, the shorter the hydrate induction time will
be delayed and the less effective any inhibitor will become24. That is, the effectiveness of KHIs is
limited when the subcooling (∆ : driving force for hydrate formation) is larger than 12 .22
Compared with KHIs, AAs are surface active chemicals which are effective at more
extreme conditions (i.e. deeper field with higher sub-cooling) than KHIs. Anti-agglomerants do
not hinder formation of hydrate crystal, but keep the hydrate particles small and away from other
particles so that hydrate particles can be transported along with the fluids instead of forming plugs
in pipelines. The schematic of a typical AA is show in Figure. 1.25 Anti-agglomerants, as
surfactants, contain hydrophilic heads which can attach to the hydrate crystal surface to modify
the wetting properties of hydrate surface and hydrophobic (lipophilic) tails that make the crystal
surface oil-wet and make hydrate particles easy to disperse in the liquid phase. Anti-agglomerants
can decrease the capillary force between hydrate particles by lowering water-oil interfacial tension
and increasing the contact angle of water molecules on the hydrate surface, thus preventing
aggregation.

10
Fig.1. Schematic of an AA surfactant molecule, identifying hydrophilic and lipophilic based on the characterization
by Zerpa et al.25
1.5.2 Gas Hydrates for Natural Gas Storage and Transport
Natural gas is expected to be the primary energy source for global economic development
in the following decades. Therefore, it is necessary to develop effective technologies to store and
transport natural gas safely and economically1,26. Many approaches have been studied worldwide
for the storage and transport of natural gas. Natural gas can be stored and transported in the form
of gas, liquid or solid.
Regarding to the available methods for the storage and transport of natural gas, one of the
most common pathways for storing natural gas is underground inventory which includes depleted
oil/gas reservoirs, aquifers and salt caverns. As for the transport of natural gas in gaseous form,
gas pipeline is the most common method but sometimes it’s not practical when one considers the
distance, cost, feasibility and accessibility of the delivery location. Compressed natural gas (CNG)
is a smaller-scale method for natural gas storage and transportation. However, this approach
usually requires extremely high pressure ( 200 bars). With respect to safety concerns and storage
capacity, CNG is not suitable for large-scale natural gas storage and long distance transport.
Liquefied Natural Gas (LNG), natural gas stored and transported in form of liquid, has been
considered as the most appropriate method for commercial application because of its tremendous
volumetric storage capacity (600 v/v at STP conditions). However, this approach requires

11
extremely low temperature (-162 ) in order to keep natural gas stable and to overcome some
other issues such as boil-off during the large-scale storage and long-distance transport processes.
Therefore, the wide application of this method in natural gas storage and transport is discouraged.
With respect to transport of natural gas in solid form, adsorbed natural gas (ANG) is one possible
pathway to store natural gas by utilizing sorbent materials such as carbon nanotubes (CNTs),
graphene, and some other metal organic frameworks. These sorbents are expected to provide
higher storage capacity for natural gas due to their larger surface area and higher porosity
compared to other methods discussed above26. However, the volumetric storage capacity reported
in this method is lower which limits its practical application in the storage and transport of natural
gas. Further studies are required to determine appropriate materials for the practical application of
this approach.27
Solidified Natural Gas (SNG), which attempts to store and transport natural gas in the form
of solid gas-hydrates, has been considered as a promising alternative for gas storage and
transportation due to the advantages of low cost, safety at relatively low pressures and high
temperatures (around water freezing point), and tremendous storage capacity (1 m3 of methane
hydrate is capable of storing 216 m3 methane at standard temperature/pressure conditions)5 when
compared to other methods (Liquid Natural Gas (LNG) and Compressed Natural Gas (CNG))28.
In addition, the method of SNG is environmentally friendly as it only utilizes water and very low
concentration of promoters. Natural gas trapped in the gas-hydrates can be almost completely
recovered by simple depressurization or thermal stimulation26.
Currently, the process of applying the method of SNG to store and transport natural gas
consists of four steps: formation of gas-hydrates; processing of the formed gas-hydrates; storage
and transport of the processed gas-hydrates and dissociation of the gas-hydrates. Among them, the

12
formation of gas-hydrates is the most important part. Furthermore, formation rate and storage
capacity of gas-hydrates are the essential technological challenges for the application of SNG.
Therefore, enhancing the formation rate of gas-hydrates and improving the storage capacity of gas-
hydrate are significant steps to be taken as they can effectively reduce capital-equipment and
operation-cost requirements.29
1.5.3 Gas Hydrates as Energy Source
Global demand for energy is expected to increase from 524 quadrillion BTUs in 2010 to
820 quadrillion BTUs in 2040.1 It has been predicted that more than 76% of global energy
consumption will be provided by carbon based sources in 2040, in spite of the predicted growth of
other renewable energy sources1,30. Natural gas is expected to play an increasing important role in
global energy supply with a forecasted annual growth of 1.7% in the next two decades.1 Therefore,
untapped natural-gas sources will need to be developed to cover the increasing energy demand. In
fact, natural gas is a kind of energy resource with 50% lower of CO2 emissions than coal or oil.26
Natural gas-hydrates occur in geographically diverse settings, either in marine sediments
or permafrost environments, which makes them an ideal source of natural gas for future
exploitation. Natural gas-hydrates are considered to be distributed globally. Interest in gas hydrates
as a natural gas source has become more prominent only in the last 50 years.1 It is believed that
the amount of energy stored as natural gas in naturally-occurring hydrates is larger than the
worldwide conventional natural-gas reserves combined.2,3,6 Many approaches have been attempted
to estimate the total amount of natural gas-hydrates on earth. Previous estimates varied from 0.2
10 methane (STP) to 3053 10 methane (STP).1 These large variations are due to
limitations of information regarding gas-hydrate deposits (e.g., porosity, availability of methane
and water, sedimentary conditions, etc.).1 Most of these estimates of gas-hydrates reservoirs come

13
from indirect seismic evidence obtained with bottom simulating reflector (BSR) indications.1–3,11
These measurements carry a high level of uncertainty.11 Over the past four decades, estimates of
energy content in gas-hydrates has decreased over time due to improved understanding and
increased knowledge generated by field exploration of gas-hydrates reservoirs. Fugacity-based
models to describe gas-hydrates stability regions were developed in parallel, which provide good
predictions about the amount of energy when compared to field results.1 These models have helped
to round the estimates to a number of 44 10 methane (STP) for continental gas-hydrates.1
Current estimates are not equally accurate for all types of reservoirs. Permafrost gas-hydrates are
usually concentrated in lenses or beads, facilitating exploration and modeling. Ocean gas-hydrates,
on the other hand, can be highly dispersed thus increasing the uncertainty in measurements and
models.
Experiments conducted on permafrost and ocean hydrates have verified that gas-hydrates
reserved in sediments could be economically recovered at locations of high concentrations.11 It has
been estimated that the energy trapped in ocean hydrates should be several orders of magnitude
larger than that in permafrost hydrates.11 However, the estimates of the energy trapped in ocean
hydrates exhibits larger error than that of the permafrost hydrated energy, making the identification
of concentrated ocean gas-hydrates reservoirs more difficult.11
Currently, proposed methods to economically recover methane from gas-hydrates usually
follow one of these three principles: (1) depressurization of gas-hydrates to destabilize and release
methane; (2) thermalization to break up the water hydrogen bonds releasing methane; and (3)
addition of strong hydrogen-bonding chemicals to disrupt gas-hydrate structures.11 Theoretically,
it is technically feasible to produce methane from gas-hydrates in the ocean or in the permafrost
but it would require large investments. It is desirable to have means to predict more accurately true

14
volume, location and methane concentration of gas-hydrate reservoirs in order to progress towards
exploitation.
1.5.4 Gas Hydrates Risk to Global Climate
Beyond production, one must consider that risk of gas-hydrates pose to global climate. The
concept of “the clathrate gun hypothesis” has been proposed, which indicates that methane from
gas-hydrates can make significant contributions to climate change.31,32 This concept was
developed based on the geological record that a gas-hydrates reservoir collapse around 14,000
years ago released enough methane to increase atmospheric methane concentration levels by as
much as 4%,11,33 and, that this increase may have triggered a period of global warming. In addition,
according to the World Meteorological Organization (WMO), the atmospheric concentration of
methane has continuously increased from 1984 to 2016 and reached a new high of about 1853
parts per billion (ppb) in 2016. This amount is about 257% of the pre-industrial level.34 It has been
reported that the global warming potential of methane is about 28 times more than that of carbon
dioxide.35 Possibly, the release of large volume of methane gas from methane-hydrates into the
atmosphere is one of the reasons contributing to the observed methane increase.
Gas-hydrates can form and be stabilized in certain regions of marine and permafrost
sediments with proper pressures (depth) and temperatures.36 In marine sediments, gas-hydrates are
only stable at depths below the seafloor.11 When the conditions are outside the equilibrium region
(temperature above and/or pressure below the equilibrium conditions), methane hydrates
dissociate into liquid water and gaseous methane. A fraction of this gaseous methane, which has
not been oxidized by microbes, can then enter into the atmosphere and act as a potent greenhouse
gas (a given volume of methane causes about 28 times more greenhouse gas warming than carbon

15
dioxide)37,38. Therefore, the evolution of large quantities of methane from gas-hydrates is plausibly
one explanation for environmental perturbations involving atmospheric warming.11
Dissociation of gas-hydrates deposited in seafloor can also result in the mass movement
and further significantly reduce the slope stability. The unstable slope can be hazardous to
foundations of equipment under the sea level, such as pipelines, platforms and manifolds.11
Furthermore, collapse of ocean sediments can trigger destabilization of more gas-hydrates to
spontaneously release the gaseous methane into the atmosphere, which may cause the rise of sea
level and further global warming.
1.6 Summary
Gas-hydrates are crystalline inclusion compounds with gas molecules (e.g., methane,
ethane, propane, carbon dioxide, nitrogen and hydrogen sulfide) trapped within a host lattice
formed by water molecules in an ice-like, hydrogen-bonded framework at elevated pressures and
reduced temperatures. Gas-hydrates have attracted increasing research interests over the past
decades. The published research on gas-hydrates mainly focus on four fields of gas-hydrates,
including pipeline flow assurance, gas storage and transportation, application as an energy
resource and environmental effects. Great amount of effort has been carried out in order to
understand the behavior of natural gas-hydrates, mechanism of gas-hydrates formation and
dissociation, stability and environmental impact of gas-hydrates.

16
CHAPTER 2 RESEARCH DESIGN AND OBJECTIVES

17
2.1 Motivation
As stated earlier, natural gas-hydrates are significantly important as an energy resource and
contributors to climate change. Being able to fully estimate the size and gas-content of natural gas-
hydrate reservoirs is not just important in terms of future natural gas exploitation, but also from an
environmental perspective, considering that methane gas is a potent greenhouse gas. Therefore,
it’s crucial to have the capability to predict the volume and stability zones of natural gas-hydrates
in marine and permafrost sediments, which can guide the design of technologies for harvesting
methane and natural gas from hydrate deposits, and, most importantly, predict destabilization of
those deposits that may result in catastrophic gas release.2,3 Accurate estimates of size and gas-
content of gas-hydrate reservoirs has yet to be achieved, since estimates are highly dependent on
thermodynamic models (assumptions) used in order to predict the zones of temperature and
pressure where gas hydrates are thermodynamically stable.1 It has been proposed that one of the
main reasons for the uncertainties in model predictions of gas-hydrate stability zones is due to
current models not fully including sediment properties in their formulations.1
In order to better control the process of gas-hydrates dissociation and the risk of natural
gas-hydrates to global climate change, it is necessary to understand the formation process of gas-
hydrates. Gas hydrate formation is a process which mainly consists of three stages before reaching
equilibrium conditions: saturation, induction, and growth.3 The first stage is the dissolution of gas
molecules in the liquid until the liquid is completely saturated with gas. It takes a certain amount
of equilibration time to reach the saturation point. The second stage, known as nucleation stage, is
the induction stage in which small hydrate nuclei form or dissociate randomly until a cluster of
critical radius is achieved. Once the time necessary to form nuclei of critical radius has been
reached, the growth stage begins.3 During the last stage gas hydrate grows rapidly and the gas

18
consumption increases linearly with time. Finally, the formation/dissociation of gas-hydrates
achieves equilibrium under proper temperatures and pressures.
Most of experimental approaches conducted on the formation process of gas-hydrate focus
on providing macroscopic rates of gas-hydrate growth. Few experimental studies focus on the
nucleation process due to the temporal and spatial limitations of experimental monitors. However,
studying nucleation process of gas-hydrates is an important part for understanding the formation
process of gas-hydrates. Particularly, understanding how the sediment properties affect the
nucleation process (heterogeneous nucleation) can help to understand the dissociation process of
natural gas-hydrates in sediments. In addition, nucleation process of gas-hydrates plays an
important role in other applications. For example, high nucleation rate can significantly enhance
the formation rate of gas-hydrates for gas storage and transport. Lowering the nucleation rate of
gas-hydrates can bring down the formation rate of gas-hydrates for avoiding gas-hydrates plugs in
pipelines.
Based on the published literature, heterogeneous nucleation takes place more frequently
than homogeneous nucleation because of the extremely slow nucleation rate of homogeneous
nucleation39. In addition, a large volume of experimental work has provided evidence that foreign
surfaces play an important role in the processes of kinetic formation and dissociation of gas-
hydrates as well as the equilibrium of gas-hydrates.40–43 Therefore, it is necessary to understand
how the confinement surface properties modulate the nucleation process and equilibrium
conditions of gas-hydrates in porous media in order to predict the behavior of gas-hydrates in
natural marine and permafrost sediments.

19
2.2 Problem Statement
2.2.1 Equilibrium and Stability of Gas-hydrates
Gas hydrates naturally exist in mesoporous sediments with small mean pore radii44–46,
which are characteristic of fine-grained sediments. In bulk conditions (e.g., in pipelines and other
equipment), gas hydrates are stable at temperatures around the freezing point of water and
pressures above 3.15 MPa.47 The equilibrium pressure required to stabilize hydrates in sediments
shifts to higher pressure values than the one at bulk conditions for the same temperature. This fact
was first confirmed by Handa and Stupin47 who conducted experiments to investigate the
equilibrium behavior of methane and propane hydrates in 70Å-radius porous media. These
experiments showed that the equilibrium pressure of gas hydrates in porous media is 20-100%
higher than those for hydrates in the bulk. Uchida et al.48,49 measured the equilibrium conditions
of methane, propane and carbon dioxide hydrates in pores of different sizes and observed that the
equilibrium pressures of hydrates shifted significantly upward compared with that of the bulk
hydrates at a given temperature. In light of these experiments, a selected number of models have
been developed to adapt phase-equilibrium thermodynamic models that had been proposed for
hydrates in bulk in order to describe gas-hydrate behavior in sediments.
It must be noted that the thermodynamic models for gas hydrates in porous media
developed thus far make use of capillary effects within the chemical equilibrium condition as the
means to adapt bulk-hydrate models to hydrates in sediments. However, these corrections do not
include sediment properties, i.e., interactions of the sediments with all phases present in marine
gas-hydrate reservoirs (free gas, liquid water and hydrate phases). It is believed that the omission
of adequate sediment properties is one of the main causes for the large uncertainty of current
models used to predict size and gas-content of gas-hydrate reservoirs.

20
2.2.2 Kinetic Nucleation Rate of Gas-hydrates
Once the thermodynamic conditions required for the existence of gas-hydrate have been
established, gas-hydrate nucleation is a stochastic process which can produce a catastrophic
appearance of the gas-hydrate phase. Understanding the nucleation process of gas-hydrates is the
first step to understand and control the formation and dissociation processes of gas-hydrates.50
Many experimental results have indicated that gas-hydrates formation process can be effectively
promoted with the presence of foreign surfaces due to the large amounts of nucleation sites
provided.51–62 However, the mechanisms behind these experimental results and how the surface
properties enhance the nucleation process are not well understood. In addition, with respect to
energy exploitation from gas-hydrate accumulations, field results and numerical simulations of gas
production have suggested that complex physical and chemical processes involving multiple
phases and multiple components can cause an unexpected rate of gas production from gas-
hydrates.16,63,64 The arguments behind this suggestion include the following: (1) the effects
between solid surface and fluid can hinder the depressurization-induced gas production from
natural gas-hydrates reservoirs; (2) the morphology of rock surface can enhance the dissociation
rate of gas-hydrates to some degree; and (3) the reduction of permeability and porosity can result
in a significant reduction of gas production from natural gas-hydrates reservoirs.63 Therefore,
understanding how the foreign interface properties affect the nucleation process of gas-hydrates
can provide insights into possible effects of solid surfaces in the dissociation process of gas-
hydrates.
Studying the nucleation process of gas-hydrates experimentally is extremely challenging
due to the difficulties in obtaining direct experimental measurements of the nucleation process.42,65
Recently, some researchers studied the nucleation of gas-hydrates in the presence of solid surfaces

21
with Molecular Dynamics (MD) Simulations, which have been considered as an effective method
to numerically understand the mechanisms of heterogeneous nucleation processes when the
driving force in high enough.66–69 MD simulations are limited to quantitatively analyze the
nucleation rate of hydrates with various conditions (wide range of temperature value and interface
properties) due to the limitations of timescale, length-scale and computation capacities of
molecular approaches.70 Therefore, more efficient and cheaper analysis aimed at quantitatively
analyzing how the confinement surface properties modulate the nucleation process of gas-hydrates
is still needed.
2.3 Hypothesis and Objectives
The ultimate goal of the study is to develop macroscopic mathematic models to predict
how the properties of porous media (sediments) affect the thermodynamic equilibrium conditions
and the nucleation rate of gas-hydrates in sediments. The hypothesis driving the work is that the
inclusion of appropriate sediment-properties, i.e., pore size, wettability, surface curvature and
interfacial energies, can enable more accurate prediction of gas-hydrate stability and nucleation
rate.
The first objective is to develop a model to predict the equilibrium conditions of gas-
hydrates in porous media. Thermodynamic equilibrium criteria will be applied to an ideal
cylindrical pore, validated against published experimental porous media rather than correcting an
existing model originally formulated for bulk conditions. The effects of confinement surface will
be then naturally included in the mechanical equilibrium condition. The shape of the hydrate phase
within the ideal cylindrical pore will be determined by the interfacial energies and the wetting
angles of all the phases involved and the properties of the pore walls. Model parameters involved

22
will be obtained from independent sources published in the literature, including independent
experimental measurements when available. This practice will ensure that the model is predictive.
The second objective of this work is to develop a mathematical model, incorporating the
interface properties (wettability, surface curvature, substrate size and interfacial energies), to
quantitatively describe the effects of various interfaces on the energy barrier and nucleation rate
for hydrate nucleation. Incorporating this phenomenon into expressions for the rate of hydrate
growth will enable eventual validation with experimental data for gas-hydrate growth. It is
expected that such an approach will provide fundamental understanding on how the interface
properties modulate the kinetic nucleation of gas-hydrates in a wide range of interfaces, and further
understanding on how to effectively control the formation and dissociation of gas hydrates by
modulating the properties of interfaces.

23
CHAPTER 3 MODEL FOR GAS-HYDRATE EQUILIBRIUM IN POROUS
MEDIA THAT INCORPORATES PORE-WALL PROPERTIES

24
3.1 Motivation
Naturally-occurring gas hydrates (in permafrost and marine sediments) have the potential
to contribute as a carbon-based source to the increasing energy demand. Accurate estimates of gas-
hydrate global inventory, development of strategies for their exploitation, and the evaluation of
their environmental impact require models that accurately present the physics of gas hydrates in
marine sediments. Over the past decades, a number of thermodynamic models for gas hydrates in
porous media were developed. Models thus far make use of capillary effects within the chemical
equilibrium condition as the means to adapt bulk-hydrate models to hydrates in sediments.71–74
Inclusion of capillary effects in chemical equilibrium conditions implies that chemical potentials
are affected by interfacial energies, which is in fact a mechanical effect on the boundaries of the
system. In addition, these corrections do not include sediment properties, i.e., interactions of the
sediments with all phases present in marine gas-hydrate reservoirs (free gas, liquid water and
hydrate phases).75
In this chapter, a new thermodynamic model for gas hydrates in pores predicting the
equilibrium conditions of gas hydrates in porous media is presented. There are three assumptions
leading the proposed model; (1) porous spaces are simplified as ideal cylindrical pores; (2) pores
are not completely saturated with liquid phase: continuous free gas and dissolved gas are present
in the pore; (3) the equilibrium pressure in the hydrate phase is different from that in liquid phase,
but equal to that in gas phase and at the interfaces. This proposed model differs from previous
models in the following aspects: (1) equilibrium criteria were applied directly to the cylindrical
pore and its surroundings instead of incorporating capillary effects into bulk-equilibrium models;
(2) the application of mechanical equilibrium criteria organically incorporates properties of the
pore walls and interfaces into the equilibrium conditions; (3) the effects of confinement are then

25
naturally included in the mechanical equilibrium condition; (4) the interfacial energies and the
wetting angles of all the phases involved and the properties of the pore walls determine the shape
of the hydrate phase within the ideal cylindrical pore. Model parameters were obtained from
independent sources published in the literature, including independent experimental measurements
when available. The model predictions presented in this work depict high accuracy when compared
to available experimental data in the literature.
3.2 Types of Sediments
Most of natural gas-hydrates in nature form in permafrost and ocean sediments. According
to the well reservoir accumulations, natural gas-hydrates deposits can be characterized into four
classes:76,77 (1) reservoir accumulations are at the base of the gas-hydrates stability zone (GHSZ),
and free gas exists in the hydrate-bearing layer; (2) gas-hydrates deposits are at the base of, or
within the GHSZ, and a hydrate-saturated interval above a free water zone is involved; (3) gas-
hydrates reservoirs are fully saturated with gas-hydrates phase without free water or free gas; (4)
fine-grained accumulations present low intrinsic permeability and further low gas-hydrates
saturations.
Most gas-hydrate reservoirs, especially marine reservoirs, are usually composed of
unconsolidated sediments. Depending on the environment where gas-hydrates form, gas-hydrate
deposits are classified into four types (type C, F, M, R).77 Type C deposits comprise of poorly
consolidated coarser-grained sediments. This type of deposit represents much of the permafrost
settings but a smaller proportion of marine settings. With current technologies, type C deposits are
the most promising reservoirs for potential energy recovery from gas-hydrates. In addition, type C
contains two sub-types: CTB (thinly bedded) and CMB (massively-beded). Type F of gas-hydrate
deposits are formed in sediments that are unconsolidated, fine-grained and low permeability. Type

26
F deposits are believed to be a potential energy resource. Type M deposits are massive hydrate
mounds, which are related to cold seeps in very shallow sediments or outcrop on the sea floor. In
the case type R deposits, gas-hydrates usually form in the porous media within rocks.
3.3 Background
Before 1999, most measurements and models focused on gas-hydrates formed in bulk
conditions. Research work related to bulk gas-hydrates is crucial to understand the behavior of
gas-hydrates in pipelines and flowlines. However, natural gas-hydrates mostly occur in porous
media. The porous medium can significantly influence the equilibrium pressures of gas-hydrates.
Handa and Stupin47 first found that the porous media could significantly modulate the equilibrium
pressures of methane and propane hydrates. In 1998, Uchida and his coworkers measured the
equilibrium pressures for methane hydrates in pores of different sizes and found that pore size
influences the equilibrium conditions of methane hydrates.49
In light of these experimental discoveries, Clarke et al. in 1999 proposed a model to predict
the behavior of hydrate phase in submicron-sized pores (pore diameter of 140Å). The proposed
model first incorporated the capillary effect by including Kelvin’s equation into the condition for
chemical equilibrium for gas hydrates. However, the interfacial tension considered in this model
was only the one between liquid and gas phases. The pore size was assumed to be in uniform size
in Clarke’s work. When compared to experimental data, Clarke’s model predicted the correct order
of magnitude of the equilibrium pressure but was not quantitatively accurate. It predicted
experimental data for gas-hydrate equilibrium in sediments with a deviation of 15% in the case of
methane hydrate and a deviation of 29% for propane hydrate.71 Also in 1999, Clennell et al. derived

27
an empirical model for hydrate stability from analysis of hydrate samples recovered from marine
sediments,78 which is particular to specific conditions.
Klauda and Sandler improved upon the previous models by applying the interfacial tension
between hydrate and liquid water to correct the condition for chemical equilibrium in 2000.72 Their
model presented an absolute deviation from experimental data for hydrate equilibrium in
sediments as low as 3.27% for low temperatures by adjusting the parameters of the Kihara cell
potential used to model hydrate chemical potential.72 In 2001, Klauda and Sandler extended their
model to generic sediments via the incorporation of pore-size distributions and shape factors to
account for the hydrate phase.74
Turner et al. incorporated the Kelvin-Clapeyron equation into the thermodynamic
equilibrium model for hydrates in bulk in order to investigate the sensitivity of methane hydrate
equilibrium to sediment pore size.79
Though models became increasingly more accurate, gains in accuracy were obtained at the
expense of the use of one or more adjustable parameters. This work conducts fundamental
thermodynamic analysis leading to straight forward incorporation of sediment properties to the
proposed model.
3.4 Model Description
The model system, an ideal cylindrical pore, is assumed to be a closed system insulated
with exception to the connections to two reservoirs. This system is connected through a thermal
gate to a large, insulated reservoir of constant temperature (a thermostat) and through a piston to
large, insulated reservoir of constant pressure (a barostat). At equilibrium, the total internal energy
change for the global system (the closed system and the reservoirs) should be zero, leading to the
following equation (as depicted in Figure.2):

28
= 0 (1)
The global system contains the following subsystems: free gas (G); liquid (L); hydrate (H); gas-
hydrate interface (α); liquid-hydrate interface (Gβ) and reservoirs (surr). Note that the subscript j
in the following equations represents the hydrate-forming gas (j 1) and water (j 2) in the
system.
Fig.2. Schematic of the global system used in the model (based on Tester & Modell).
For the gas phase:
= ∑ μ N (2)
For the liquid phase:
= ∑ μ N (3)
For the hydrate phase:
= ∑ μ N (4)
For the gas-hydrate interface (α):
= ∑ μ N (5)
For the liquid-hydrate interface (β):

29
= ∑ μ N (6)
For the surroundings (i.e., reservoirs):
= (7)
Where U is the internal energy, S is entropy, V is volume, N is the number of components, T is
temperature, P is pressure, and μ is chemical potential of component. Substituting eqs (2)—(7)
into eq (1);
μ N μ N
μ N μ N
μ N 0
(8)
The temperature and pressure of the liquid phase are assumed to be equal to the temperature and
pressure of the large insulated reservoirs:
(9)
Additionally, since the system is closed, the following must be true:
N N N N N ( 1, 2) (10)
Then, substituting the set of eqs (9) and (10) into eq (8), the following condition for equilibrium
is obtained:

30
μ μ N
μ μ N μ μ N μ μ N
0
(11)
In order for the equilibrium condition (eq 11) to be met, thermal equilibrium dictates that the
temperature of all phases and interphases must be equal to that of the thermal reservoir or
thermostat. Additionally, chemical equilibrium demands that the chemical potential of each
component in all phases must be equal within the closed system.
μ μ μ μ μ (j=1, 2) (12)
Finally, mechanical equilibrium is then given by eq (13).
0
(13)
The gas-hydrate interface and the liquid-hydrate interface are assumed to pertain to the hydrate
phase. Therefore, the two interfaces bear the pressure of the hydrate phase which is different from
that in liquid water (i.e., the pressure of the reservoir RP).
Then, eq (13) is simplified to:
0 (14)

31
Additionally, it is assumed that the pressure in the hydrate phase is equal to that in the gas phase
because gas phase is highly compressible and the interfacial tension (130 mJ/m2) 80 of the hydrate
phase is very large. Finally, eq (14) can be further simplified to the following mechanical
equilibrium condition:
0 (15)
It must be noted that the constant pressure reservoir has a piston, so it accommodates changes in
volume during phase change. Gas hydrates behave similarly to water ice in the sense that expansion
takes place during phase change, which will be compensated by our constant-pressure reservoir
Rp. It was determined that the loss in density during liquid water-hydrate phase transition is 9%,3,81
which will be captured in our model as follows: dV 1.09dV .
With these considerations, the final mechanical equilibrium condition for the system is given by
the following expression:
0.92
(16)
Therefore, at thermodynamic equilibrium conditions, eqs (12) and (16) must be met for gas
hydrate to be stable at any given P, T and sediment properties.
The experimental study of Bahman Tohidi et al.82 suggested that the amount of free-gas in
some marine-sediment hydrate reservoirs is significant, as depicted in the schematic presented in
Figure 3 based on this work. Free-gas bubbles coexist with dissolved-gas-saturated liquid in the
sediments in most cases82–84. Additionally, the few experiments on gas-hydrate equilibrium in
porous materials reported in the literature79,81,85–87 were performed by wetting the porous media
and then pressurizing with hydrate-forming gas. In light of these studies, which will be used for
model validation, the proposed model assumed that the hydrate-crystallization process begins at

32
the gas-water interface to form a hydrate crust around the free-gas bubble. Additionally, the water
phase was assumed to be saturated with dissolved methane gas, and to present characteristic
surface-wetting behaviors depending on the surface properties of the porous medium.
Fig.3. Schematic prepared based on the photograph of gas hydrates formation in porous media from experimental study of Tohidi et al 82.
Fig.4. Schematic of the idealized cylindrical pore during gas-hydrate formation.
For simplicity, the porous materials were idealized as cylindrical pores according to the
schematic presented in Figure 4. As stated earlier, there are three phases present in the cylindrical
pore: gas phase (G), liquid phase (L) and solid hydrate phase (H). There are two interfaces in the
pore: the hydrate-gas interface (α), and the hydrate-liquid interface (β). The hydrate phase (H) was

33
assumed to adopt the form of a concave-convex lens as depicted in Figure 5, in agreement with
the experimental observations by Bahman Tohidi et al.82 and Li et al.83,84
From geometry, the volume of gas hydrate formed in the cylindrical pore was calculated
using the two hemispheres formed by the interfaces, as follows:
| Γ 3 Γ Γ 3 Γ | (17)
Where r is the pore radius, the function Γ is defined as Γ 1 sinθ cosθ⁄ , and the angle θ
can take values between 0° and 90°, depending on the angle of the gas-hydrate interface on a given
surface. In a similar way, the function Γ is defined as Γ 1 sinτ cosτ⁄ , where τ can take
values between 0° and 90°, depending on the angle of the hydrate-liquid interface on a given
surface.
Fig.5. Schematic of the concave-convex gas-hydrate lens formed in the idealized cylindrical pore.

34
The same geometrical analysis was performed to determine the area of the hemispherical
caps as follows:
1 Γ (18)
1 Γ (19)
By differentiating eqs (18) to (19) and then combining with eq (16), the final expression for the
mechanical equilibrium conditions is as follows:
2 1 Γ 2 1 Γ
0.92 ∙ 12 Γ 3 Γ Γ 3 Γ
(20)
The parameters needed to apply the mechanical equilibrium condition are the hydrate-water
interfacial tension (σ ), the hydrate-gas interfacial tension (σ ), the pore size ( ) and the wetting
angles (θ and τ), which can be obtained from available independent experimental measurements.
3.4.1 Mechanical Equilibrium
The mechanical equilibrium, given by eq (20), requires values of surface interfacial tension
and wetting angles since it is based on the premise that the shape of the hydrate phase is determined
by the surface interactions and wetting angles of liquid-water and gas-hydrate on the porous wall.
Additionally, it was assumed that formation of gas hydrate would initially take place at the gas-
water interface. Therefore, the hydrate phase would adopt the shape of a lens, i.e., the thickness of
hydrate formed in the center of the pore is expected to be larger than that around the edges. The
angle of the gas-hydrate interface on the porous wall is expected to be larger than that of hydrate-
liquid interface. In order to keep the model predictive, values for interfacial tensions and wetting
angles were procured from independent studies in the open literature.

35
A. Water-hydrate and gas-hydrate Interfacial tensions
Experimental measurements of interfacial tension between hydrates and liquid water at
phase equilibrium conditions in porous media have not been reported in the literature. Therefore,
theoretically-estimated values for hydrate-water interfacial tension proposed in the
literature71,81,86,88–90 were used to select the value of interfacial tension (as shown in Table 2). These
values were tested against hydrate-ice-equilibrium conditions for 70-Å pores91. In 2001, Klauda
and Sandler72,74 proposed that water-hydrate interfacial tension should be the effective interfacial
tension during gas hydrate formation in porous media. Klauda and other researchers applied the
value of ice-liquid water interfacial tension ( 26.7mJ/ in their models due to the
similarities between hydrate and ice. In the following years, other theoretical values for water-
hydrate interfacial tension were proposed by applying the Gibbs-Thomson equation to the
reduction in hydrate-formation temperature in porous media with respect to this value in bulk
phase81,86,89.
Table 2. Theoretical hydrate-water interfacial tension used to predict methane-hydrate-formation pressures in 70Å-radius silica gel (based on Pesaran and Shariati 92)
hydrate-liquid interfacial tesion (mJ/m2)
AAD% References
72 18.89 Clarke et al., 1999
39 13.6 Uchida et al., 1999
32 12.83 Anderson et al.,2003
26.7 12.19 Henry et al., 1999;
Smith et al., 2002
17 10.98 Uchida et al., 2002

36
Due to the lack of direct experimental data for the interfacial tension between hydrate and
liquid water phase, the theoretical value used in this work is the one with the highest accuracy in
the prediction of hydrate-formation-pressure inside 70Å-radius silica gel as measured by Handa
and Stupin.85 The value of 17mJ/ estimated by Uchida et al. in 2002 produced the highest
accuracy for predicting hydrate-formation in silica gel with absolute average deviation (AAD%)
of 10.98%, as presented in Table 2. As for the interfacial tension of hydrate-gas interface, it is
assumed to be similar to the interfacial tension of ice. It has been reported that the interfacial
tension of ice is 130mJ/ 80.
B. Wetting angles
Most previous models 71–74,78,88, assumed that one interface, either between gas and liquid-
water or between liquid-water and solid phases, was determinant of equilibrium. Therefore, the
other interfaces were neglected. In addition, shape factors were applied in these models. Klauda et
al. 72,74 proposed that hydrate initially formed in the shape of a spherical cap (a shape factor of 2)
and eventually completely filled the cylindrical pores (a shape factor of 1). Other models assumed
that the hydrate-liquid water always maintained a spherical cap (shape factor of 2) 71–74. However,
if the contributions of both interfaces (water-hydrate and gas-hydrate) are comparably significant,
shape factors may not capture the hydrate phase accurately. This effect should be more marked at
equilibrium conditions above 270K, where liquid water, solid hydrate and gas phase coexist inside
the porous medium. An indication of this issue is apparent on the fact that predictions of the wan
der Waals-Platteeuw (vdWP) model significantly overestimated the equilibrium pressures at
temperatures higher than 269 K and fugacity model showed significant deviation above 274 K 74.

37
The wetting angle of liquid water on solid surface varies significantly depending on the
solid surface. The experimental data for hydrate equilibrium in porous media used to compare the
predictive capabilities of the proposed model used silica glass and silica gel as porous material.
From the published literature, it was surmised that the measured average contact angles of water
on silica glass is 24° 93 and 15.2° on silica gel 94. There is no experimental measurement of the
curvature of hydrate structures in porous media. In addition, there are also no theoretical estimates
of the angle between the gas-hydrate-pore-wall phases since the models proposed thus far have
not taken into consideration the contribution of the gas-hydrate-solid interactions.
3.4.2 Chemical Equilibrium
The chemical equilibrium, eq (12), was implemented in terms of fugacities rather than
chemical potential, i.e., the fugacities of each component in all phases must be equal. Fugacities
for each component in the gas phase were calculated from the Peng-Robinson equation of state.
The fugacity of methane in liquid was calculated via the application of Henry’s Law 2,72. The
fugacity of methane in the hydrate phase was calculated using the Peng-Robinson equation of state.
In the case of water in liquid and hydrate phase, chemical equilibrium requires that:
, , , (21)
Where the fugacity of water in the hydrate phase can be calculated with the following equation 72
, , exp exp
, , exp∆ ,
(22)

38
Where , , is the fugacity of the hypothetical empty hydrate lattice. The Van der Waals
and Plateeuw (vdWP) model was used to calculate the difference in chemical potential due to
occupation of the empty hydrate lattice by gas molecules, as shown in the following equation 2:
∆ ∆ (23)
In eq (23), is the chemical potential of water in the empty hydrate represents the chemical
potential of water in other equilibrium phases (i.e. liquid water, ice, or both). ∆ , is the
difference between the chemical potential of water in empty hydrate and filled hydrate phase,
which can be calculated from the following equation 2,72.
∆ , ln 1 Θ
(24)
In eq (24), is the number of cage m per water molecule in the hydrate lattice Θ represents
the occupancy fraction of cage m by a guest j. The phenomena of cage occupation can be
considered to be similar to Langmuir adsorption 2,3,72.
Θ ,,
1 ∑ ,
(25)
Where , is the fugacity of guest I in gas phase is the Langmuir constant of
component j in the cavity m that is defined as 2,3,72
4exp ⁄
(26)

39
In eq (26), is the spherically symmetric cell potential, which shows the interaction between
a guest and the cavity according to the distance r between the guest molecule and water molecules.
This cell potential contains all guest-host interactions in the cage. According to Kihara model 73,95,
cell potential can be expressed as
2
(27)
Where
1 ⁄ ⁄ 1 ⁄ ⁄ ⁄
(28)
In eq (27) and (28), is the coordination number, is the radius of shell or the cavity. ɛ is
the depth of the energy well, a is the core radius of gas molecule and σ is the core distance at zero
potential. The gas parameters ɛ, a and σ are called Kihara parameters.
According to the vdWP model, the guest-host interactions are assumed to only exist
between the first shell of water molecules and guest molecule. However, some other studies 96–99
have proven that the second and third shells of water molecules can also significantly interact with
the guest molecule. That is, the cell potential includes contributions from the first, second,
and third shells as follows 72:
(29)
The corresponding coordination numbers and cell radii for each shell used in this work
are listed in Table 3 72.
Table 3. Shell Radii

40
Struture Cage Shell Radius (Å)
Shell Coordination Number
1st 2nd 3rd 1st 2nd 3rd
Ⅰ 512 3.906 6.593 8.086 20 20 50
51262 4.326 7.078 8.285 24 24 50
Ⅱ 512 3.902 6.667 8.079 20 20 50
51264 4.682 7.464 8.782 28 28 50
The fugacity of water in the hypothetical empty hydrate lattice and liquid are calculated
from eqs 30 – 31, respectively 72:
, , , , exp , , , , ⁄ (30)
, , , , , exp , , ⁄ (31)
Where , represents the vapor pressure of water in phase i. , is the fugacity
coefficient which was assumed to be equal to 1 because the vapor pressures of the water phase at
the temperatures studied in this work is very low.
The solubility of methane gas in water in equilibrium with gas hydrates was estimated
following the work by Klauda et al., 72 even though we realize that the confinement from porous
medium will somewhat affect the methane gas solubility. In addition, the molar volumes for liquid
water and empty hydrate lattice were also estimated by using the equations proposed by Klauda et
al., 72 eqs (32 – 34). The molar volumes of liquid water phases used in Klauda’s model were fitted
to experimental data from NIST 100 with the average absolute deviation (%AAD) of 0.57%..
,
exp 10.9241 2.5 10 273.15 3.532 10 0.101325
1.559 10 0.101325

41
(32)
, ,
11.835 2.217 10 2.242 1010
8.006 10
5.448 10
(33)
, ,
17.13 2.249 10 2.013 10 1.009 1010
8.006 10 5.448 10
(34)
The vapor pressures of water in ice and liquid water phase can be calculated with eq (35)72,
which was deduced by fitting the experimental data from the CRC Handbook101 to quasi-
polynomial, QL1 form102. This equation can also be applied beyond the range of fitting due to its
good predictive capabilities102. This equation was proved by Klauda and Sandler 72 to be used to
calculate the vapor pressure of water in the empty hydrate lattice, which is dependent on the guest
and the structure of hydrate.
ln ln
(35)
The values for the constants presented in eq (35) for ice liquid water and empty hydrate lattice
were provided by Klauda and Sandler 72 (as shown is Table 4).

42
Table 4. Vapor Pressure Constants in eq (35) 72
phase A B C D 103
ice 4.6056 -5501.1243 2.9446 -8.1431
water 4,1539 -5500.9332 7.6537 -16.1277
guest A B C D 103
CH4 (sI) 4.6477 -5242.979 2.7789 -8.7156
3.5 Results and Discussion
The workflow depicted in Figure 6 was implemented in Matlab in order to solve the model
numerically and thus predict the equilibrium pressures of gas hydrates in porous media. Eq (22)
and (31) for fugacities are numerically solved with the Matlab variable-step solver with respect to
the pressure. First, at a given temperature value, a pressure value was proposed to calculate the
pressure in the hydrate phase using the eq (20). Afterwards, the chemical potential and fugacity of
water in different phases was calculated from eqs (22, 24 and 31). The objective function to be
minimized was the absolute value squared difference of water fugacities in different phases (i.e.
chemical equilibrium). The pressure was corrected using a numerical Newton-Raphson technique
until the objective function was within a given tolerance (10-9).

43
Fig.6. Schematic of the workflow for solving the equilibrium pressure at various temperatures.
3.5.1 Comparison of Model Predictions and Experimental Data
Figure 7, Figure 8, Table 5 and Table 6 depict the model predictions compared to
experimental data and other models reported in the literature, respectively. As seen from Table 5
and 6, the proposed model predicts the experimental data with higher accuracy when compared to
those of three other models for methane-hydrate-formation in porous media: vdWP model, Clark’s
model and Klauda’s model.
Table 5. Percent AAD from Experiments of the Proposed Model Predictions of Porous Methane Hydrate
Porous media
water contact angle (τ)
hydrate contact angle (θ)
pore size model
%AAD
silica gel 15.2° 75° 34 Å 1.54 70 Å 0.46
152.5 Å 0.98
silica glass 24° 85° 59.5 Å 2.47
154.4 Å 2.38 247.5 Å 2.11

44
Table 6. Percent AAD from Experiments of Different Model Predictions of Porous Methane Hydrate
Model
%AAD
silica gel (Handa & Stupin 1992)
silica glass (Uchida 1999)
silica gel (Seo 2002)
VdWP model 6.342 7.609-18.243 ——
Clark model 0.95-15 —— ——
Klauda model 5.688 3.332-6.105 ——
This work 0.38-0.56 2.11-2.47 0.55-1.54
Fig.7. Equilibrium conditions of methane hydrate in silica gel pores.
Handa and Stupin85 and Seo et al103 measured equilibrium pressures of methane hydrate in
silica-gel-porous-media. As seen in Figure 7 and Table 5, equilibrium pressures predicted with our
model for the pore size of 70 Å show good agreement with experimental data provided by Handa
and Stupin with percent absolute average deviation (%AAD) of 0.4862%. The model of Clark
et.al.71 overpredicts the equilibrium pressures with a deviation of 15%. The vdWP model performs
with an average of 6.342%. Model of Klauda and Sandler also overestimates the equilibrium

45
pressures of methane hydrate by 5.688% compared with experimental data. Seo et al.103 measured
the equilibrium conditions of methane hydrates in silica gel samples of different pore sizes using
a similar experimental procedure to that of Handa and Stupin.85 As shown in Table 5, our model
predictions for the given average-pore-size samples of 34 Å, 70 Å and 152.5 Å by Seo et al.103
slightly overestimate the equilibrium pressures of methane-hydrate with %AAD of 0.9113%,
0.7951% and 0.1276%, respectively. As explained in the Model Description section, the gas-
hydrate-pore wall angle had to be optimized for each material in order to better describe the
experimental data. The angle of the gas-hydrate interface on the silica gel surface was determined
to be 75° for pore sizes between 34 and 152.5 Å in this work.
Fig.8. Equilibrium conditions of methane hydrate in silica glass pores.
For silica glass porous media, Uchida et al.86 investigated the equilibrium pressures of
methane hydrate in pore sizes of 59.5 Å, 154.5 Å and 247.5 Å at higher temperatures than 277 K.
As shown in Table 6 and Figure 8, predictions of equilibrium pressures using the model proposed

46
in this work for the experimental samples of Uchida et al.86 agree with the presented experimental
data with %AAD of 2.0675%, 1.2598% and 0.0393%, respectively. The vdWP model over-
predicted the equilibrium pressures with average deviations of 18.243%, 9.291% and 7.609%,
respectively. The model of Klauda and Sandler also overestimated the equilibrium pressures of
methane hydrate by 3.332%, 6.105% and 3.484%, respectively, compared with experimental
data.74 In the case of silica glass, the gas-hydrate interface on the silica glass surface was
determined to be 85°.
3.5.2 Effect of Interfaces in Model Accuracy
Clark et al.71 and Klauda et al.74 employed shape factors to describe the structure
geometries of methane hydrates in porous medium. The morphology of the gas-solid-liquid
interfaces might be much more complicated than the assumed spherical cap or cylindrical cap.
Interactions between the sediments and all phases present (free gas, liquid water and hydrate
phases) probably play a significant role in shaping the geometries of methane hydrates formed in
gas-hydrate reservoirs, as stated in Chong’s work75. In order to investigate the effects of sediment
properties on the equilibrium conditions of methane hydrates in porous media, contact angles,
which relate to the wettability of porous surface, were incorporated in the new model as described
in the Model Description section. This approach may explain why the proposed model depicted
higher accuracy for describing experimental data when compared to previous models.
It has been proposed that the wettability of the sediments’ surface can significantly
influence the equilibrium pressures of gas hydrate in gas-hydrate reservoirs75. Surfaces can be
classified into two types: hydrophilic (water attracting), and hydrophobic (water repellent) surface
according to the surface properties. The hydrophilicity of the surface is captured by the contact

47
angle and the interfacial energy of water on the surface in the proposed model. In the hydrophilic
surfaces, a larger amount of energy might be required to incorporate tightly-bound water to the
surface into the hydrate phase, thus resulting in higher equilibrium pressures. The contact angle of
water on silica glass and silica gel are similar. Thus, as depicted in Figure 9, the experimental
equilibrium pressures of methane hydrate at similar pore sizes are also indistinguishable in these
two porous materials. It is necessary to conduct a series of experiments with materials of dissimilar
surface properties in order to determine the effects of wettability of the sediment on the equilibrium
conditions of gas hydrate in porous media, which is described by the proposed model.
Fig.9. Equilibrium conditions of methane hydrate in 152-154 Å-radii porous media for different materials.
3.5.3 Effect of Kihara Potential Parameters on Model Accuracy
Investigations on previous models point towards the fact that model predictions are very
sensitive to the values of Kihara parameters used, which can significantly influence the cavity
occupations of gas hydrates72. Kihara parameters can be calculated from results of viscosity

48
measurements104 or be derived from the second virial coefficient105. The values of Kihara potential
parameters for methane guest used in gas hydrates reported in literature are listed in Table 7. In
fact, the parameters for the Kihara potential were “tuned” to improve the performance of models
in order to better predict experimental data in some cases.
In this work, we adopted parameters of the Kihara potential that were obtained via
experiments aimed at characterizing the crystalline structure of hydrates. The parameter a (Å)
represents the core radius of the guest gas molecule, which is considered a spherical core. In
general, parameter a is believed to be a reliable parameter of general validity that should not be
fitted, and it was fixed at 0.3834 Å (value provided by Sloan 3). The parameter ɛ corresponds to
the maximum attractive potential which is a measure of how strongly the guest molecule and the
water molecules attract each other. This parameter is assumed to be constant in this paper for any
given hydrate structure and it was fixed at the value provided by Sloan 3. Finally, parameter σ,
which stands for the core distance between guest molecule and water molecule at zero
intermolecular potential, was allowed to float between the range of values listed in Table 7.

49
Table 7. Kihara potential parameters of CH4 from literature.
Reference ɛ/k(K) a (Å) σ (Å) Methods
JM Herri 2012 166.36 0.3834 3.05
Kihara parameters were calculated from experimental data
JM Herri 2011
157.85 0.3834 3.1439 Experimental study
Kihara parameters were regressed from experimental results of this
study
154.47 0.3834 3.111
158.71 0.3834 3.1503
Sloan 1998 154.54 0.3834 3.165
Experimentally fitted hydrate guest Kihara parameters
Sloan 2007 155.593 0.3834 3.1439
A. L. Ballard 2000 154.1815 0.3834 3.1695
L.S.Tee 1966 232.2 0.3834 2.7382
Kihara parameters were determined from experimental viscosities and/or second virial
coefficients
Klauda & Sandler 2000
232.2 0.28 3.505
Kihara parameters were derived from viscosity or second virial
coefficient data
Mohammadi 2005
153.69 0.295 3.2512 Experimental and model
Y. S. Kim 2003 141.52 0.3834 2.9488 Experimental and modeling work Kihara parameters were fitted to
available data.
J. P. Schroeter 1983 153.22 0.30017 3.2363 Experimental study
D. Avlonitis 1993 227.13 0.393 2.779 Kihara potential parameters of
gases from second virial coefficient data
M. A. Clarke 2003 151.7117 0.3834 2.2699
Kihara parameters were regressed
by minimizing the differences between experimental data and
predicted value.

50
In order to get a representative core-distance value, we simultaneously validated the model
with the available experimental data points for each of the experimental systems used in this work.
The goal was to maximize the probability of representing as many experimental data points as
possible, within the constraint that the core distance correlated linearly with the temperature at the
same rate (i.e., equal slope). It was found that the core distance slightly decreases with increasing
pore size in the proposed model, as depicted in Figure 10. The reason for this phenomenon may
be that the proposed model captures the effect of confinement on gas-hydrate-equilibrium
conditions in porous media via slight variations of the core distance value. The value of core
distance for different pore sizes ranged from 2.73 Å to 3.06 Å. When the pore radius becomes
larger, the core distance value σ decreases towards the value for bulk hydrate phase. 104
Fig.10. Schematic of relation between core distance and temperatures.
3.5.4 Prediction of Gas-hydrate Equilibrium in Large Sediment Pores
Gas hydrates naturally occur in the form of small hydrate crystals in sedimentary porous
media. According to visual observations of gas hydrates within natural sediments, there are mainly

51
three types of gas-hydrates reservoirs: (1) poorly consolidated coarser-grained sediments
containing massive blocks or sheets of gas hydrates; (2) unconsolidated, fine-grained and low
permeability sediments containing cemented hydrates; and (3) consolidated rock such as clay and
mud containing hydrate nodules, layers, and fracture- and vein-infillings106–108. The pore sizes of
these common sediment samples are usually measured by mercury porosimetry and proton nuclear
magnetic resonance (NMR)107,109,110. It has been found that pore diameters in these scenarios range
from a macroscopic to microscopic scale107. For instance, sandstone usually has about 50% of its
pores with size smaller than 54 microns. While shale has about 50% of its pores with size smaller
than 20 nm109,110. Permafrost sediments are usually composed of unconsolidated gravels which can
form larger pore sizes in millimeter scale111. Little experimental work has been conducted on
predicting the equilibrium conditions of gas hydrates in large pores with diameter ranges from a
few micrometers to few millimeters, as to provide suitable experimental data for validation of the
proposed model.
Fig.11. Model predictions for gas hydrate equilibrium in sample natural sediments. Note that no fittings were used in order to improve the smoothness of the predicted data.

52
In order to better understand the equilibrium conditions of gas hydrates in natural
sediments, the equilibrium conditions of gas hydrates in porous media with mean pore radii of 5
μm, 30 μm and 30 mm are predicted with the proposed model. As shown in Figure 11, the
equilibrium pressure of gas hydrates in these types of porous media range from 3.4 MPa to 15.3
MPa when the temperature increase from 275.15 K to 290.15 K. In porous media with smaller
pore size, slightly larger pressures are required to help gas hydrates reach at the equilibrium states.
3.6 Conclusions
A model for gas-hydrate equilibrium in pores developed from basic thermodynamic
analysis is proposed and validated against available experimental data in this work. The proposed
model presents high predictive accuracy when compared to experimental data with the average
AAD of less than 1%. The mechanical equilibrium condition of the model takes the effects of
sediment properties (wettability, interfacial tension) into account to describe the conditions of
stability of gas hydrate in porous media, in a very straight-forward manner. The wettability of the
pore surface affects the equilibrium pressures of gas hydrate formed in porous media, and the shape
of the hydrate phase. However, experimental data are available only for surfaces of similar surface
properties. The effects of sediment properties captured in the proposed model should be further
tested experimentally.

53
CHAPTER 4 INTERFACIAL EFFECTS ON THE ENERGY BARRIER FOR
GAS-HYDRATE CAGE AND ICE HETEROGENEOUS NUCLEATION

54
4.1 Motivation
Naturally, hydrate-bearing sediments usually exhibit low porosity and permeability with
microscale pore sizes74,75,112. In synthetic porous media for gas-hydrates formation, nanoscale pore
sizes are commonly encountered81,85,86. Thus, heterogeneous nucleation takes place more
frequently than homogeneous nucleation because of the extremely slow nucleation rate of
homogeneous nucleation113. With the presence of foreign surfaces, including gas-liquid interfaces,
solid-liquid interfaces and gas-liquid-solid triple boundary lines, the energy barrier for nucleation
can be effectively reduced, and nucleation can be facilitated. Therefore, it is critical to understand
how foreign surfaces modulate the energy barrier enabling heterogeneous nucleation.
The phenomenon of ice formation and growth in porous media (e.g. sediments) has
attracted considerable research effort in recent years due to the fact that large parts of the earth’s
surface are covered by cold or seasonally-frozen regions. In these regions, sediment pores are filled
with ice and expanded by the growth of ice crystals due to water transfer and accumulation from
unfrozen areas to frozen areas. When temperature is above the freezing point, the melting of solid
ice weakens the pore structure because the damaged pores lose the support of solid ice114–117. As a
result, the cycle of liquid freezing in the winter and thawing in the spring results in severe damage
to external facilities, such as road pavement, natural gas or water pipelines, buildings and other
civil structure foundations. From the freshwater resource perspective, about 75% of the freshwater
on earth is stored as ice in sediments. Preventing the phenomenon of frost heave, i.e. ice formation,
may benefit the biota in those sediments118. Therefore, it is crucial to understand the nucleation
and growth processes of ice in porous media in order to predict and further prevent the
phenomenon of frost heave.

55
Most of the experimental and theoretical work on frost heave has focused on the growth of
existing ice crystals inside porous media114–116,118,119. According to the work of K. A. Jackson and
Bruce Chalmers, the types of soil, contact angles for the ice-soil interface, grain size and
permeability of the soil may significantly influence the rate of growth of heave120. However, there
is a dearth of work on the nucleation process itself, i.e., the birth of ice crystals in the first place.
As we all know, nucleation is the first step in the kinetic formation of a new thermodynamic phase.
It will be extremely helpful to slow down the heave rate by reducing the nucleation rate or
inhibiting nuclei formation.
With respect to the formation of gas hydrates, understanding the nucleation process of gas
hydrates is of great importance to understand the formation mechanisms of gas hydrates. Gas
hydrates form in natural gas pipelines and laboratory environments under proper temperature and
pressure conditions. In addition, gas hydrates naturally exist in mesoporous sediments containing
pores with diameters in the micro-size or nano-size region121,122. In bulk liquid or large pores, some
experimental work on gas hydrates formation suggests that gas hydrates preferentially form a
hydrate film at the gas/liquid interface123,124. In micro-size or nano-size pores, gas hydrates are
likely to form at the triple boundary lines along the gas/liquid/solid three phases125. Therefore, the
gas/liquid interfaces and the triple boundary lines play an important role in the heterogeneous
nucleation process of gas hydrates formation.
Studying the nucleation process with experimental methods is extremely challenging due
to the experimental-resolution limitations on time and space scale. Recently, some researchers
studied the nucleation of ice in the presence of solid surfaces with Molecular Dynamics (MD)
Simulations, which is an effective method to study the mechanism of heterogeneous nucleation
process67,126–128. However, the nucleation rate of ice in porous media can’t be quantitatively

56
analyzed with MD simulations due to limitations of time and length scale. Experimental methods
can provide macroscopic rates of crystal growth, but not initial nucleation rates129–132. Therefore,
a macroscopic mathematic model that captures nucleation rate and incorporates this phenomenon
in the rate of crystal growth to allow comparison with experimental data, would be the most
effective approach to study the problem. In recent years, some theoretical investigations have been
conducted to study the heterogeneous nucleation of ice on the surface of insoluble particles using
the theoretical framework of Classical Nucleation Theory (CNT)133–135. However, there are few
theoretical studies aiming to quantitatively describe how sediment surfaces modulate the
nucleation process. In addition, to the best of our knowledge, few theoretical work has been
conducted to describe the effects of gas/liquid interfaces on gas hydrates nucleation and no work
reported on gas hydrates nucleation at the triple boundary lines.
In this chapter, a mathematical model was developed with incorporation of careful
thermodynamic analyses in order to understand the effects of confinement surfaces properties,
including contact angle, substrate size and surface geometry, on the nucleation energy barrier of
ice/gas-hydrates in porous media. Taking this study one step further, future work will be conducted
to predict the nucleation rate of ice and gas-hydrates in porous media and understand how various
interfaces properties modulate the nucleation process of ice/gas-hydrates in porous media.
4.2 Types of Interfaces
Foreign interfaces are very commonly encountered during the heterogeneous nucleation
process in sedimentary porous media. For example, confinement walls within sediments, dust
particles or inhibitors in porous media, liquid-solid interfaces (planar, concave and convex surfaces)
are frequently encountered during the nucleation process136. With the assumption of the presence

57
of continued gas and liquid phases in porous media, gas-liquid interface should be considered
during the nucleation process in bulk solution or in large pores. With the formation of ice/gas-
hydrates in small pores, three-phase boundary lines might exist in porous media. The properties of
these interfaces (contact angle, interfacial energy, and substrate curvature) no doubt play an
important role in modulating the nucleation process of gas hydrates.
4.3 Model Description on Correction Factors
According to classical nucleation theory (CNT), the nucleation of ice/gas hydrates is a
process of statistical fluctuation of building molecules in supersaturated liquid due to thermal
vibration, which can result in the occurrence of some unstable ordered solid molecular clusters.
These clusters will shrink or expand as the fluctuation of monomers in the liquid allows for
incorporation of water molecules into the clusters. In this case, the flux of building molecules into
the critical nucleus is thermodynamically favored. Then, a stable solid phase can be formed from
the liquid phase after the nucleation and growth processes taking place133. The nucleation process
can be described by the nucleation rate, which is characterized as the number of critical nuclei
formed over a time unit. In order to quantitatively analyze the nucleation process, a thermodynamic
component (the change of Gibbs free energy during the formation of the critical ice nucleus from
the liquid phase) and a kinetic component (diffusive flux of water molecules) should be
incorporated into the formulation of nucleation rate133,134.
Heterogeneous nucleation is more common in nature due to the presence of interfaces,
including gas/liquid interface, liquid/solid interface, and gas/liquid/solid triple boundary lines. In
the case of ice, the nature of the interaction between water molecules and the surface may also
play a role in nucleation, i.e., hydrophobic or hydrophilic interactions. These effects will be

58
relevant when studying ice nucleation in soils and porous materials. Three types of surfaces,
including flat, concave and convex surfaces, are the most common surfaces in porous materials
and sediments. From the thermodynamic perspective, a flat surface is the simplest geometry which
can significantly lower the energy barrier for heterogeneous nucleation136–138. From the perspective
of practical situations, concave surfaces such as pore walls and convex surfaces such as dust
particles are more commonly encountered in mesoporous sediments136,137,139. In the case of gas
hydrates, the nucleation of gas hydrates likely happens at the interface of gas/liquid in the bulk of
aqueous solution or in large pores and fractures as suggested in open literature123,124. In micro-size
or nano-size pores, the triple boundary line plays an important role in the nucleation process of gas
hydrates.
4.3.1 Correction factors for heterogeneous nucleation at the gas/liquid interface
In the bulk of an aqueous solution or in large pores, the interface of gas/liquid is flat. A
lens-shaped critical nucleus forms at the gas/liquid interface (Figure. 12). As shown in Figure. 12,
and represent the angles of the crystal/gas and the crystal/liquid interfaces, respectively. The
values of and depend on the interfacial energies between the phases present ( , and
). The radius of the two hemispherical caps are described with and , respectively. The
change of Gibbs free energy during nucleation process can be mathematically expressed as follows,
including a volume term and a surface term:
∆ ∆ (36)
Where numbers 1, 2 and 3 denote the gas phase, critical nucleus and liquid surface, respectively.
The parameter is the interfacial energy between phase i and phase j. The quantity is the

59
interfacial area between phase i and phase j. Parameter is the geometrical volume of the critical
nucleus.
Fig. 12. Schematic of the formation of a lens-shape nucleus at the gas/liquid interface.
Through careful geometrical and mathematical analysis, we can get a suite of correlations
between nucleus volume and interfacial areas. The correlations are as follows,
13
2 3 2 3
(37)
2 1
(38)
2 1
(39)
1
(40)
Where , . The relationship between interfacial energies and geometrical
angles is given by eq (41) according to the Law of Sines.

60
(41)
and
(42)
Combining all these equations, we can derive the free energy ∆ for the nucleation of critical
nucleus at the gas/liquid interface by substituting Equation (37) – (40) into eq (36). In so doing,
we are naturally incorporating the effects of the gas/liquid interface into the expression of the
energy barrier for nucleation, as follows:
∆13
∆ 3 2 3 ∆ 3 2 3
(43)
Where is represents the radius of the critical nucleus required for a given energy barrier for the
nucleation of a critical nucleus. By taking the first derivative of this free energy with respect to ,
we obtain eq (44).
∆
∆ 2 2 3
(44)
When we set the first derivative to zero, we can get the critical radius of nucleus leading to crystal
growth and its associated energy barrier, which includes a correction factor for modifying the
homogeneous nucleation energy barrier to be used in heterogeneous nucleation at the gas/liquid

61
interface. The corresponding equations for the critical radius, the energy barrier and the correction
factor are given below:
2∆
(45)
∆ ∗ 163∆
(46)
14
2 31
12 3
(47)
Where represents the correction factor to describe the effects of the gas/liquid interface on
the energy barrier for heterogeneous nucleation.
Fig. 13. Correction factor for nucleation at gas/liquid interface as a function of angle θ and angle θ .

62
Figure 13 depicts the dependence of the correction factor on the geometrical angles
of the crystal nucleus. As shown in Figure 13, the correction factor increases with incresing value
of and , and varies in the range of 0~1. When both of and take the value of 90°, the
correction factor is 1, and the critical nucleus will form the shape of sphere. This scenario
corresponds to homogeneous nucleation, which is highly unlikely. Conversely, when the values of
and are equal to zero, the correction factor is zero. In this case, there is no energy barrier for
the nucleation process. The nucleation process happens spontaneously at the interface of gas/liquid
in the shape of a flat film. This scenario takes place at very beginning of the nucleation process.
However, as the nucleus grows, it adopts a lens shape with the hemispherical caps determined by
interfical energies. Lenses of ice or gas hydrates have been observed in nature.
4.3.2 Correction factors for heterogeneous nucleation on a solid substrate
A good starting point for the analysis of heterogeneous nucleation on a solid surface is to
study the nucleation process on a planar surface. Furthermore, the nucleation process on a planar
surface can be used as a control system to examine the physical meaning of models for concave
surfaces (i.e., pore wall and porous materials) and convex surfaces (i.e., dust particles). In fact, a
pore can be modeled via imposing curvature on a flat surface to form a cylinder. A particle surface
can be assumed as a curved flat surface with spherical shape.
The flat surface is assumed to be smooth in order to better formulate the model for the
nucleation process from the thermodynamic perspective. Figure 14 depicts a schematic of a
spherical-cap nucleus forming on a flat surface. Numbers 1, 2 and 3 are used to represent the liquid
phase, critical nucleus and solid flat surface, respectively. The parameter is the interfacial
energy between phase i and phase j.

63
Fig. 14. Schematic of the formation of a spherical-cap ice nucleus on a planer surface.
Applying the same procedure used for nucleation at a gas/liquid interface, one formulates
an expression for the Gibbs free energy required to form the critical nucleus and calculates its first
derivative to obtain the critical radius 136:
The only difference is the application of Young’s Equation in order to correlate contact
angle to interfacial energies for the system depicted in Figure 14:
(48)
We can obtain the following equation for the Gibbs free energy required to form the critical nucleus;
as described above:
∆13
∆ 2 3
(49)
The critical size of the nucleus and the energy barrier for forming the nucleus are derived
by differentiating eq (49) with respect to nucleus radius ( ). The first-order derivative must be
zero, which allows to obtain the critical size , as shown below.
∆ 4 ∆ 8 2 3
4

64
(50)
There is only one solution for ∆ 0 in this case:
2∆
(51)
Then we can obtain the critical energy ∆ ∗ for the critical nucleus on the smooth flat surface by
substituting Equation (51) into Equation (49), which allows for the identification of a correction
factor for Gibbs energy that takes into consideration the presence of the flat surface.
∆ ∗ 163∆
(52)
2 3 /4
(53)
Where is the correction factor for heterogeneous nucleation in the presence of a smooth flat
surface, value of this correlation varies with the contact angle with the flat surface. One should
note that the shape of the nucleus as a hemispherical cap on the flat surface is reflected in the
correction factor. A similar analysis procedure is employed in order to derive the correction factors
for nucleation on concave and convex surfaces in the following sections.
Pores of mesoporous sediments are idealized as cylindrical pores (concave surfaces) and
dust particles are assumed to take the shape of spheres (convex surfaces). Figure 15 shows a
schematic of the expected geometries for nucleation on curved surfaces: a semi-spherical-cap
nucleus inside the pore wall (concave surface), and a semi-spherical-cap nucleus on the outer
surface of the spherical particle (convex surface), respectively. Similar to the case of a flat surface,
1, 2 and 3 represent the liquid phase, critical nucleus and solid substrate, respectively. The

65
parameter represents the volume of the formed critical nucleus. The quantity is the
interfacial energy between phase i and phase j. The parameter is the interfacial area between
phase i and phase j. The angle is the contact angle between the critical nucleus and the substrate,
while angles and are the geometric angles. The following radii are defined as follows: is
the critical size of the nucleus and is the radius of the substrate. In the case of concave surface,
. However, in the case of convex surface, .
Fig. 15. Schematic of the formation of a spherical-cap ice nucleus on the pore wall (left) and dust particle (right).
From geometric analysis, the volume of the critical nucleus with critical size on the solid
substrate can be calculated from the following equations:
13
2 3 1, 2
(54)
Here, if the nucleation process occurs on concave surface, . Otherwise, if nucleation
process happens on convex surface, . In addition, from the same geometrical analyses,
the interface areas of the spherical-cap nucleus are derived as follows:

66
2 1
(55)
2 1
(56)
Substituting equations (54) through (56) into equation (36), the final expression for the change in
free energy is as follows:
∆13
∆ 2 3 2 3
2 1 1
(57)
∆13
∆ 2 3 2 3
2 1 1
(58)
Equations (57) and (58) correspond to the free energy change for nucleation on a concave pore
wall and a convex particle, respectively. The critical size of the nucleus and the energy barrier for
forming the nucleus can be obtained via differentiating the equations (57) and (58) with respect to
radius and equating the results to zero, in a similar way as it was done for the flat surface case. The
first-order derivative of ∆ corresponds to the following equation:
∆∆ 2 2 3
(59)
When equating the previous expression to zero, the critical size is obtained:
2∆

67
(60)
Substituting equation (60) into equations (57) and (58) and rearranging terms, the equations used
to calculate the free energy required to form the critical nucleus of critical size of can be obtained
for both cases as follows:
∆ ∗ 163∆
,
(61)
1 3 1 2 3 /2
(62)
1 3 1 2 3 /2
(63)
Where ⁄ ; √
; √
; ′√
; ′√
Where is the aspect ratio, i.e., the ratio of substrate radius to critical radius of nucleus. Again,
the parameter coresponds to the correction factor or geometric factor to describe the effects of
surfaces on the energy barrier for heterogeneous nucleation. Eqs (62) and (63) present the
geometric factor for concave surface and convex surface, respectively. These two equations, are
similar to the ones derived by Fletcher 139 and Qian 136,137 for the case of convex surfaces, and can
be used in order to incorporate the effects of concave and convex surfaces on the energy barrier of
nucleation. These two equations show that the correction factor depends on contact angle and
aspect ratio .
The difference between the correction factors for the three types of surfaces (flat, convex
or particle, and concave or pore) and the correction factor for the flat surface, , ∆ is plotted as
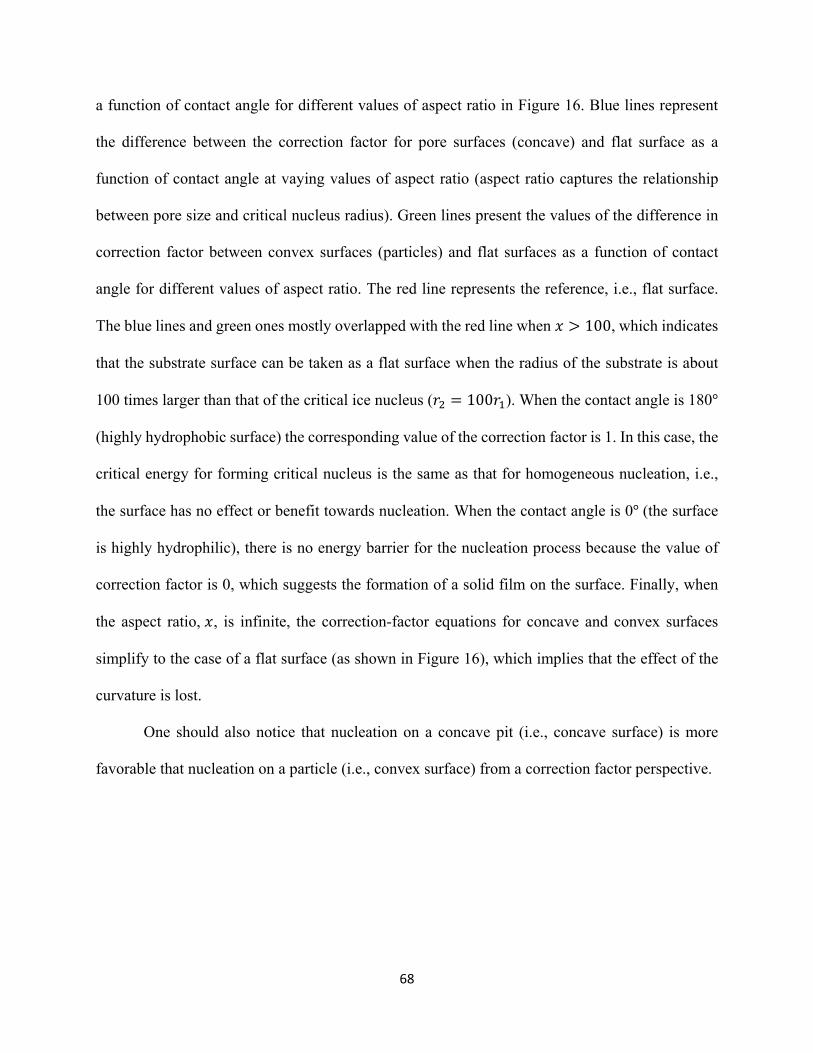
68
a function of contact angle for different values of aspect ratio in Figure 16. Blue lines represent
the difference between the correction factor for pore surfaces (concave) and flat surface as a
function of contact angle at vaying values of aspect ratio (aspect ratio captures the relationship
between pore size and critical nucleus radius). Green lines present the values of the difference in
correction factor between convex surfaces (particles) and flat surfaces as a function of contact
angle for different values of aspect ratio. The red line represents the reference, i.e., flat surface.
The blue lines and green ones mostly overlapped with the red line when 100, which indicates
that the substrate surface can be taken as a flat surface when the radius of the substrate is about
100 times larger than that of the critical ice nucleus ( 100 ). When the contact angle is 180°
(highly hydrophobic surface) the corresponding value of the correction factor is 1. In this case, the
critical energy for forming critical nucleus is the same as that for homogeneous nucleation, i.e.,
the surface has no effect or benefit towards nucleation. When the contact angle is 0° (the surface
is highly hydrophilic), there is no energy barrier for the nucleation process because the value of
correction factor is 0, which suggests the formation of a solid film on the surface. Finally, when
the aspect ratio, , is infinite, the correction-factor equations for concave and convex surfaces
simplify to the case of a flat surface (as shown in Figure 16), which implies that the effect of the
curvature is lost.
One should also notice that nucleation on a concave pit (i.e., concave surface) is more
favorable that nucleation on a particle (i.e., convex surface) from a correction factor perspective.

69
Fig. 16. Difference between the correction factor on a curved surface and a flat surface (∆f f f ) as a function of contact angle θ at different values of aspect ratio x.
4.3.3 Correction factors for heterogeneous nucleation at the gas/liquid/solid triple
boundary line
In porous media, when gas, liquid and solid (three phases) are present in the system, the
interfaces between the three phases can play an important role in the nucleation process. In the
case of gas hydrates nucleation, experimental work has shown that the nucleation process of gas
hydrates prefers to take place at the triple boundary line in porous media containing free gas and
liquid phase 125. In order to understand how the gas/liquid/solid triple boundary line affects the
nucleation process inside pores, a similar thermodynamic analysis as the one used in the previous
sections is applied to formulate the correction factor for lens-shaped crystal clusters formed along
the gas/liquid/solid boundary lines (as shown in Figure 17). The parameters of and describe
the contact angles of liquid and critical nucleus inside the confinement surface, respectively. The

70
values of angles and depend on the wettability properties of the confinement surface (i.e.,
the pore walls).
Fig. 17. Lens-shaped nucleus of hydrates at the gas/liquid interface in nanoscale pores.
The Gibbs free energy required to form the shape of nucleus along the triple boundary line
depicted in Figure 17 is given by eq (64).
∆ ∆
(64)
Numbers 1, 2 and 3 are used to represent the gas phase, critical nucleus and liquid phase,
respectively. The parameter is the interfacial energy between phase i and phase j. The quantity
is the interfacial area between phase i and phase j. Parameter is the geometrical volume of
the critical nucleus.
After careful geometrical and mathematical analysis, we can get the correlations for the volume of
critical nucleus and interfacial areas. The correlations are as follows:

71
13
2 3 2 3
(65)
2 1
(66)
2 1
(67)
Where , . The relationship between interfacial energies and geometrical
angles should follow eq (68) according to Young’s Equation.
cos
(68)
Then we can derive the free energy ∆ required to form the critical nucleus at the gas/liquid/solid
triple boundary line by substituting equation (65) – (68) into eq (64), which allows for taking the
incorporation of the effects of the triple boundary line into the expression for Gibbs free energy
change.
∆13
∆ 2 3 2 3
2 1 1 cos
(69)
Where is assumed to represent the radius of the critical nucleus in order to obtain the energy
barrier for the nucleation of critical nucleus. By taking the first derivative of free energy with
respect to , we can get eq (70).

72
∆
∆ 2 2 3
(70)
Then set the first derivative to be equal to zero in order to obtain the critical radius of nucleus and
energy barrier, which includes a correction factor for adjusting the term for homogeneous
nucleation for application to heterogeneous nucleation at the gas/liquid/solid triple boundary line.
2∆
(71)
∆ ∗ 163∆
(72)
Through careful thermodynamic and mathematical analyses, the expression for the
correction factor of the lens-shaped hydrate nucleus inside pores is given by (73).
12
1 311
1 1
1
12 3
Similar to the situation of nucleation at gas/liquid interface, the value of correction factor for
nucleation at the triple boundary line depends on the values of and . Where ,
, and the value of angle varies from 0° to 180°, depending on the angle of the gas
hydrates interface on a given solid surface. The angle can take values between 0° and 180°,
depending on the angle of the hydrate-liquid interface on a given surface. The values of these two

73
angles depend on the specific surface energies of gas/liquid, gas/hydrate and hydrate/liquid
interfaces. The shape of the critical hydrate nucleus is determined by the values of these two
contact angles. When these two angles vary in the range of 0° ~ 90°, it means that the confinement
surface is water wetting (hydrophilic). Otherwise, when the confinement surface is hydrophobic,
both of the angles will locate in the range of 90° ~ 180°.
Fig. 18. Correction factor for nucleation at gas/liquid/solid triple boundary line as a function of contact angle θ and θ (a), (b) zooms in the region of 0°~90° and (c) shows the schematics of nucleus formed under special conditions.
The correction factor for heterogeneous nucleation at the triple boundary line is plotted as
a function of contact angle and (Figure 18(a) and 18(b)). As shown in Figure 18(c), at the
special condition of 0°, 180° or 180°, 0°, the correction factor takes the
value of 1. This situation corresponds to the formation of a thin, spherical lens on a fully
hydrophobic surface, which has not been observed. When takes the value of 90° and for any

74
value of , the correction factor is equal to zero. Under this condition, the triple boundary line is
flat and the nucleation process spontaneously occurs at the triple boundary line in the form of a
flat film. This case has not been observed inside pores, but on gas/liquid interfaces. With respect
to the conditions of 0° , 0° or 180° , 180° , the critical nucleus takes a
spherical shape that is the same as homogeneous nucleation. Thus, the values of correction factor
are equal to 1. When 90°, 0° or 90°, 180°, semi-spherical nuclei form at
the gas/liquid/solid interface in the solution. In this case, the energy barrier for heterogeneous
nucleation at the triple boundary line is half of that for homogeneous nucleation.
When the values of the contact angles zoom in the region of 0°~90°, as shown in Figure
18(b), we can observe that the value of correction factor for nucleation at the triple boundary line
decreases with increasing the values of the contact angles and . When 0°, 0°, the
value of correction factor is equal to unity and the critical nucleus will take the shape of a sphere.
In this case, water molecules in the liquid prefer to immobilize on the solid surface, and the triple
boundary line doesn’t support the nucleation process. The energy barrier for this condition is the
same as that for homogeneous nucleation. That is, highly hydrophilic sediment surfaces do not
support the nucleation process in the center of the pore. Nucleation preferentially occurs in porous
media with slightly hydrophobic surface properties. Finally, the interaction of the liquid phase with
the surface (captured in ) more strongly determines the nucleation process.
4.4 Effects of Interfaces on Energy Barrier for Nucleation
4.4.1 Gas/liquid interface – bulk
The effects of gas/liquid interface on the energy barrier for nucleation are analyzed based
on the previous thermodynamic work on correction factors. The model is applied to ice nucleation
in order to explore its capabilities. Therefore, the parameter of interfacial energy for gas/ice is

75
applied to obtain the energy barrier for heterogeneous nucleation at the gas/liquid interface. The
shape of the formed nucleus depends on the values of the geometrical angles and .
Fig. 19. (a) Energy barrier for nucleation at the gas/liquid interface as a function of θ ; (b) Energy barrier for nucleation at the gas/liquid interface as a function of θ .
As shown in Figure 19, with increasing the temperature of the system, the energy barrier
for nucleation will increase when either or is determined by the properties of water and gas
phase. In order to understand the effects of geometrical angles on the kinetic nucleation, the effects
of and on energy barrier for nucleation were studied separately. When the value of is set
as 30° (Figure 19(a)), the value of energy barrier increases with the value of at any temperature
plane. In a similar way, Figure 19(b) shows that the energy barrier also increases with at any
temperature plane when is set at a certain value, for example 30° in this case. However, it must
be noted that a much larger energy barrier must be overcome when reaches a value of 90° in
Figure 19(a) compared to that in Figure 19(b). Therefore, it’s relatively easier for kinetic nucleation
to occur on the liquid side of the interface rather than on the gas side.

76
4.4.2 Convex surface – particles and particulates
When the nucleation process occurs on grain particles, the properties of the particle surface
can also modulate the nucleation process of ice in porous media. Figure 20(a) clearly shows that
the energy barrier for ice nucleation on particle surfaces is smaller than that for homogeneous
nucleation. When the contact angle is close to the value of 180°, particle surfaces do not support
the nucleation process of ice. In this case, the value of the energy barrier for heterogeneous
nucleation on particle surface (convex surfaces) is the same as that for homogeneous nucleation.
As for the effects of contact angles, the nucleation process is favored by smaller contact angles,
i.e., hydrophilic surfaces. In addition, the energy barrier for nucleation is increased with increasing
temperature and the hydrophobicity of the system when the value of contact angle varies from 20°
to 100°. The advantage of the presence of particles as nucleation sites is increasingly lost for
contact angles greater than 100°.
Fig. 20. (a) Energy barrier for nucleation on convex surfaces as a function of temperature and contact angle; (b) Energy barrier for nucleation on convex surfaces as a function of temperature and particle size.
As opposed to the beneficial effects of confinement on nucleation, one can see that the
effects of particle size are marginal on nucleation. Figure 20(b) presents the dependence of energy
barrier for nucleation on aspect ratio ( ) (i.e., ratio of particle size over critical nucleus). It is clear

77
that the energy barrier for ice nucleation decreases with increasing the value of aspect ratio ( ) for
a given contact angle. That is, it is easier to nucleate on larger particles due to the smaller energy
barrier for the nucleation process. In fact, the energy barrier for nucleation on convex surfaces is
slightly larger than that on flat surfaces. As for the effects of particle size, the value of energy
barrier decreases slightly when the aspect ratio increases from 0.5 to 10 at very low temperatures.
Furthermore, the energy barrier on a convex particle surface is almost the same as that on a flat
surface when the aspect ratio reaches at the value of 10. Interestingly, temperature, and not the
presence of the surface, is the main factor influencing the energy barrier for nucleation on convex
(i.e., particle) surfaces.
4.4.3 Concave surfaces – porous media
4.4.3.1Effectsofcontactangles
In this section, effects of concave surfaces (pore wall) on the nucleation process are studied.
In order to study the effects of contact angles on the energy barrier in porous media, the pore sizes
were maintained at preselected values. Figure 21(a) depicts the effects of contact angle and
temperature on the number of building units (i.e., water molecules) required to form a critical
nucleus at an aspect ratio of 2, which translates into a pore radius twice as large as the critical
nucleus radius. In the case of highly hydrophilic surfaces (contact angles close to zero) the pore
surface resulted in smaller critical nuclei at all temperatures, i.e., less number of building-block
molecules ( ) were required to be incorporated into the critical nucleus. For contact angles
between 30° and 150° , lower temperatures significantly enhance the nucleation process by
decreasing the number of building units needed to form a critical nucleus. In the case of highly
hydrophobic surfaces, contact angles between 160° and 180°, the positive effects of the pore walls

78
towards nucleation are increasingly lost at higher temperatures, leading to a region (represented
by bright yellow in the figure), where nucleation happens as if in a homogenous phase. In addition,
as we can see from Figure 21(a), larger super cooling (the difference between experimental
temperature and water freezing point) consistently improves the kinetic nucleation of ice by
reducing the size of the critical nucleus.
Fig. 21. (a) Size of critical ice nucleus changes with temperatures and contact angles in porous media; (b) Energy barrier for ice nucleation changes with respect to temperatures and contact angles in porous media.
Similarly, the energy barrier for ice nucleation is also modulated by the surface wettability
of the porous media for any given pore size (Figure 21(b)). As shown in Figure 21(a), when the
surface is highly hydrophilic (contact angle greater than zero and less than 40°), the energy barrier
for nucleation is very close to zero. As the contact angle increases at any given temperature plane,
one can notice a steep increase of the energy barrier at contact angles greater than 40°. In fact,
when the contact angle is larger than 160°, the energy barrier for ice nucleation is almost the same
as that for homogeneous nucleation. When the contact angle between ice nucleus and the pore
surface is equal to 180°, the energy barrier becomes larger and equivalent to that for homogeneous
nucleation of ice, i.e., the advantage gained by the presence of the surface is lost. This phenomenon

79
can be visualized on Figure 21(a), where it is clear that the smaller the contact angle, the lower the
energy barrier for nucleation. It is clear that increasing contact angle drives the system towards
homogeneous nucleation of ice. When temperature changes in the range of 233-260 K, the value
of energy barrier increases dramatically with the temperature. That is, the energy barrier for ice
nucleation is lowered under increased sub-cooling. Furthermore, the effect of contact angle is
diminished by lowering temperature. Interestingly, the nature of the surface is not as crucial when
the energy driving force is high.
4.4.3.2Effectofporesize
In order to visualize how pore size of sediment affects the nucleation process of ice on
confinement surface in porous media at a given wettability property of the system, the wettability
of the confinement surfaces was maintained at a certain value. Figure 22 depicts the dependence
of the number of water molecules required to form a critical nucleus as a function of temperature
and aspect ratio (i.e., the ratio of pore radius to size of critical nucleus) at a contact angle of 120°.
As shown in Figure 22, it was found that larger pores require larger amount of water molecules
involved in the formation of the ice nucleus. That means, larger pores will generate larger ice
germs. Therefore, smaller pores favor ice nucleation, i.e., fewer water molecules need to be
immobilized in the solid phase to form a nucleus. When aspect ratio x changes from 0.5 to 2, the
critical size of ice nucleus increases sharply. In fact, when the pore size is ten times larger than
that of the critical nucleus, the critical size of ice germ is very close to that formed on a flat surface.

80
Fig. 22. Water molecules required for critical nucleus as a function of temperature and pore size for (a) aspect ratios up to 100, and (b) zoom in on aspect ratios up to 10. The right boundary of the surfaces represents the behavior of
flat surfaces. The contact angle was maintained at 120°.
Fig. 23. Energy barrier as a function of temperature and pore size for (a) aspect ratios up to 100, and (b) zoom in on aspect ratios up to 10. The right boundary of the surfaces represents the behavior of flat surfaces. The contact angle
was maintained at 120°.
As for the effects of pore size on energy barrier for nucleation in porous media, it was
found that nucleation energy barrier increases with increasing temperature and aspect ratio. Figure
23 depicts similar behavior for energy barrier to that of the number of water molecules required to
form a nucleus: energy barrier for ice nucleation is lowered by lower temperatures. In addition, the
nucleation energy barrier is enhanced when the aspect ratio gets larger. The energy barrier
increases sharply with aspect ratio , when is less than 2, at which point it increases at a slow
rate. When the aspect ratio x is larger than 100, the energy barrier for nucleation in porous media

81
is almost the same as that for nucleation on the planar surface. In this case, the pore surface acts
as a planar surface. This confirms that nucleation is more favorable in smaller, more confined
spaces, when nucleation happens on the pore walls (i.e., nuclei growth on the solid surface).
4.4.4 Gas/liquid/solid triple boundary
As for the effects of triple boundary line on the energy barrier for nucleation in porous
media with three phases, it was found that the energy barrier increases with the temperature (as
shown in Figure 24). The disadvantages of high temperatures during nucleation process can be
counterbalanced by changing the highly hydrophilic surface into hydrophobic surface (increasing
the value of contact angle or ). In addition, when contact angle or takes the value of
90°, the energy barrier for nucleation at the triple boundary line is close to zero. In this case, the
triple boundary line is flat, which is the same as that for nucleation at gas/liquid interface.
Additionally, the maximum energy barrier is much higher than that for other cases. Therefore, it
is possible that nucleation at the three-phase boundary line is the most challenging one among all
the cases discussed in this work.
Fig. 24. (a) Energy barrier for nucleation at the gas/liquid/solid triple boundary line as a function of θ ; (b) Energy barrier for nucleation at the gas/liquid/solid triple boundary line as a function of θ .

82
It must be noted that nucleation at the triple boundary line inside pores is favored by larger
pores of hydrophobic surfaces. This outcome contradicts the findings of nucleation on the concave
surfaces, where nucleation on hydrophilic pores of smaller diameters is favorable. These are not
contradictory findings, but reflections of two different scenarios. In the case of the triple-boundary
line in larger pores, the nucleus sits at the center of the pore. On the other hand, on the concave
surface of very small pores, the nucleus rests on the pore wall.
It is well known that the energy change (∆ ) determines the energy barrier for nucleation
when the size of the nucleus reaches the critical size. In this case, thermodynamic analysis for the
homogeneous nucleation leads to the expression: ∆ ∗ ∆ ∙ ∙ 4 . According
to the discussion in previous sections, an appropriate correction factor is applied to extend the
expression of energy barrier for homogeneous nucleation to the case of heterogeneous nucleation
in different types of situations. Therefore, the thermodynamic analysis for energy barrier for
heterogeneous nucleation leads to interesting conclusions regarding the shape of crystalline phases
at different interfaces. It can be easily noticed from equation (74) that the spherical nucleus
expected in homogeneous nucleation is “modified” by correction factor according to different
scenarios. That is, the effects of foreign surfaces on the nucleation process lead to different shapes
of nuclei which deviate from spherical shapes. Accordingly, the correction factor can be
understood as a shape factor that characterizes the relationship between the shapes of nuclei formed
at foreign interfaces and that expected during homogeneous nucleation.
∆ ∗ ∆ ∗ ∙ ∆ ∙ ∙ ∙ 4 ∙
(74)

83
It is clear that viable nucleation aided by interfaces results in the formation of crystal lenses,
rather than spherical particles. These predictions agree with observations of ice and natural gas
hydrates in porous media 114,115,123,124.
4.5 Conclusions
In this work, three types of surfaces, including gas/liquid interface, solid surfaces (planar,
concave and convex surfaces) and three-phase boundary lines, are modeled with the aim to
understand their effects on heterogeneous nucleation in porous media. Careful thermodynamic
analyses are conducted on the correction factor that characterizes the effects of foreign interfaces
on nucleation activation energy. The correction factor for energy barrier for heterogeneous
nucleation can also be understood as the shape factor that adjusts the spherical shape for
homogeneous nucleation into that of lense-shaped nuclei formed at foreign interfaces.
As for the interface of gas/liquid, the value of correction factor determines the shape of the
formed nucleus. Nucleation process preferentially occurs along the interface and inside the liquid
phase. When the critical nucleus is in the shape of sphere, correction factor is 1. In this case, energy
barrier for nucleation at gas/liquid interface is exactly the same as that for homogeneous nucleation.
As for the effects of solid surfaces, our results suggest that the correction factor for convex
surface is always larger than that for flat surface, as opposed to the trend for concave surfaces
where the correction factor is lower than the flat-surface one. In other words, there exists a higher
energy barrier for nucleation on convex surfaces (particles) than that on flat surfaces, and the
lowest energy barrier occurs on concave surfaces (inside small pores).
Additionally, by considering that the wettability of the solid surfaces can vary from highly
hydrophilic to highly hydrophobic (contact angle from 0° to 180°), it was found that the nucleation
of ice is more energetically favorable on surfaces with smaller contact angles. Contact angles

84
ranging from 0° to 160° can significantly enhance the nucleation process of ice in porous media.
As for the effects of substrate size, it was found that larger pores result in larger ice germs in the
case of concave pore surfaces, and smaller pores can enhance the nucleation process. However, as
the pore size increases, nucleation rate within the pore wall approximates that on a flat surface,
resulting in the loss of the advantage induced by confinement. In the case of convex surfaces, the
particle size has only marginal effect on the energy barrier, and approximates the flat surface as
particle size increases. In fact, ice nucleation is more energetically favorable on concave surfaces
(on small pore walls) and less so on convex surfaces (on particles) with nucleation on flat surfaces
as the boundary between these two regions.
As for the triple boundary lines, the value of correction factor is determined by the
wettability of solid surface and the radius of the pore. Interestingly, it was also found that the
correction factor is smaller in porous media with larger contact angle value, suggesting that the
nucleation process is favored by hydrophobic confinement surfaces. Compared to other cases,
nucleation at the triple boundary line needs to overcome higher energy barriers. In addition, the
nucleation process mostly prefers to occur at solid surfaces with lower energy barrier, form a
thermodynamic perspective.

85
CHAPTER 5 INTERFACIAL EFFECTS ON KINETIC NUCLEATION OF
GAS-HYDRATE

86
5.1 Motivation and Background
The formation of gas hydrates is a stochastic process which mainly consists of three stages
before reaching equilibrium conditions: saturation, induction, and growth140. The first stage is the
dissociation of gas molecules in the liquid until the liquid is completely saturated with gas. It takes
a certain amount of equilibration time to reach the saturation point. The second stage is the
induction stage, in which small hydrate nuclei form or randomly dissociate until a critical cluster
radius is reached140. This stage is also known as nucleation stage. Once the time necessary to form
nuclei of critical radius has been reached, the growth stage begins. During this last stage, gas
hydrate particles grow rapidly, and gas consumption increases linearly with time when measured
experimentally141. Understanding the nucleation process of gas hydrates could be the key point to
understand other applications including the extraction of gas containing especially methane from
gas-hydrate accumulations, the storage and transportation of natural gas and the flow assurance of
natural gas and oil pipelines.
Gas hydrates naturally form in sedimentary porous media, where foreign interfaces (i.e.,
gas/liquid interface, liquid/solid interface, and three-phase boundary line) are very commonly
encountered during the formation of gas hydrates. The properties of these interfaces (contact angle,
interfacial energy, and substrate curvature) no doubt play an important role in modulating the
nucleation process of gas-hydrates. Li and his coworkers142 studied the growth kinetics of hydrate
film in synthetic systems by injecting a single gas bubble to liquid phase into a gas chamber and
found that a hydrate layer formed at the gas/liquid interface. According to the work of Dimo
Kashchiev143, Eric F, May and his coworkers144, heterogeneous nucleation on solid substrate is
more energetically favorable than nucleation either in the bulk solution or on the gas/liquid
interface. Additionally, Molecular Dynamics (MD) simulations conducted by Defever et al. have

87
shown that the wettability of solid surfaces influences the nucleation of gas hydrates by adjusting
the concentration of gas molecules145.
Unfortunately, there is no clear understanding on the effects of the various interface
properties on the nucleation process of gas hydrates in porous media. Very little work has been
conducted to quantitatively describe how these interfaces and their properties (i.e., surface
wettability, interface curvature and interfacial energies) modulate the nucleation rate of gas
hydrates and which interface is most energetically favorable for gas-hydrate nucleation at the
beginning. Furthermore, it is very difficult to study this problem with experimental methods. On
the one hand, nucleation is perhaps the most challenging part to understand due to difficulties in
obtaining direct experimental measurements of the nucleation process or statistically collecting
significant dataset to obtain the whole range of formation probability distribution146. On the other
hand, the application of experimental approaches is limited to certain conditions (low driving force)
with a narrow range of research variables146.
Molecular Dynamics (MD) simulations are considered a powerful tool to understand the
nucleation mechanisms of gas hydrates microscopically when the driving force is high enough.
Molecular Dynamics simulations are limited in terms of quantitatively analyzing the effects of
various interfaces present in porous media due to limitations of time, length scale and computation
capacities of molecular approaches146. Thus, a macroscopic mathematic model, incorporating the
interface properties, can be a promising and efficient way to capture the effects of various
interfaces on the hydrate nucleation quantitatively and to make comparisons in a wide range.
Incorporating this phenomenon into expressions for the rate of hydrate growth would enable
validation with experimental data on hydrate formation. Such an approach would then effectively

88
provide a fundamental understanding on how to control the formation and dissociation of gas
hydrates by modulating the properties of presented foreign interfaces.
5.2 Model for Kinetic Nucleation Rate of Gas-hydrate
The kinetic-nucleation of gas-hydrates involves the fluctuation of hydrate-building units in
supersaturated liquid due to temperature or pressure vibrations of the system. The nucleation rate
of gas hydrates can be characterized as the number of hydrate clusters with critical size formed
over time. According to classical nucleation theory (CNT), two components, including a
thermodynamic component (the change of Gibbs free energy during the formation of the critical
hydrate nucleus from the liquid phase) and a kinetic component (diffusive flux of hydrate building
units in the liquid to incorporate into the clusters), are involved to describe the nucleation rate of
gas hydrates133,134,143. Once the clusters achieve the critical size, the incorporation of hydrate
building units into the nuclei is thermodynamically favored, which will further facilitate the growth
of the water clusters. Nucleation rate of gas hydrates indicates the rate at which critical hydrate
nuclei will form in a volume of liquid phase per second.
Kashchiev and Firoozabadi143 analyzed the nucleation rate of gas hydrates both in
isothermal and isobaric regimes based on the nucleation theory. The stationary nucleation rate of
one-component gas hydrates ( or ) can be calculated with the following
formulation (eq (75))143.
∙ ∗ ∙ exp∆
∙ exp∆ ∗
(75)

89
In that equation, ∗ can be applied to represent the frequency with which the hydrate building units
would attach to the hydrate nucleus at equilibrium conditions; ( or ) is the
concentration of nucleation sites in the system, which is determined by the type of nucleation; and
is the Boltzmann constant. The term of ∆ ∗ represents the energy barrier required to overcome
to form a hydrate cluster with hydrate building units. The term of ∆ is the driving force for the
incorporation of hydrate building units into hydrate nucleus. In the isobaric regime with constant
pressure, the driving force is estimated from ∆ ∆ ∆ , 2⁄ , where
∆ is the difference between the entropies of the old and the new phase at . The value of
∆ can be estimated from the correlation ∆ ∆ ⁄ where ∆ (J) is the enthalpy of latent
heat (per hydrate building unit) of dissociation of the hydrate crystal into gaseous phase and liquid
phase at . At 0.1 MPa and 273.2 K, ∆ 9.0 10 and ∆ , 4.63 10 ⁄ is
measured for methane hydrate147. The values of ∆ produce ∆ 22.2 at 293.2K and
∆ 23.2 at 281.2K for methane hydrate143,147.
The kinetic parameter of Zeldovich factor (Z) represents the non-equilibrium feature of the
nucleation process, which describes the probability of the subcritical nuclei to grow into a stable
crystal due to Brownian motion of the subcritical nuclei. The parameter Z usually has a value
between 0.01 and 1. The value of 1 can be achieved when the system reaches equilibrium state. In
other cases, the value of Z can be estimated with the correlation143:
∆ ∗ (76)
Where is the number of hydrate building units incorporated into a hydrate nucleus. Based on the
classical nucleation theory, the terms of and ∆ ∗ for one-component gas hydrate nucleation can
be estimated with the following expressions143:
8 27Δ⁄ (77)

90
∆ ∗ 4 27Δ⁄ (78)
In those expressions, the parameter is a numerical shape factor (e.g., 36 ⁄ for spherical,
cap, or lens-shaped nucleus), is the volume of a hydrate building unit composed of one gas
molecule, and water molecules. One can use 0.216 for methane hydrate. The
parameter represents the surface free energy of hydrate/liquid interface, which is estimated to be
17 mJ/m2 based on the public literature (as found in Chapter 3). With the presence of foreign
interfaces, the term incorporates the correction factors with which the critical size and energy
barrier for homogeneous nucleation is adjusted for heterogeneous nucleation. The schematics of
the foreign interfaces commonly encountered in porous media are shown in Figure 25, including
three types of liquid/solid interfaces, gas/liquid interface and gas/liquid/solid triple boundary lines.
Fig. 25. (a) Schematic of planar liquid/solid interface; (b) Schematic of concave liquid/solid interface; (c) Schematic of convex liquid/solid interface; (d) Schematic of gas/liquid interface; (e) Schematic of gas/liquid/solid triple
boundary line.
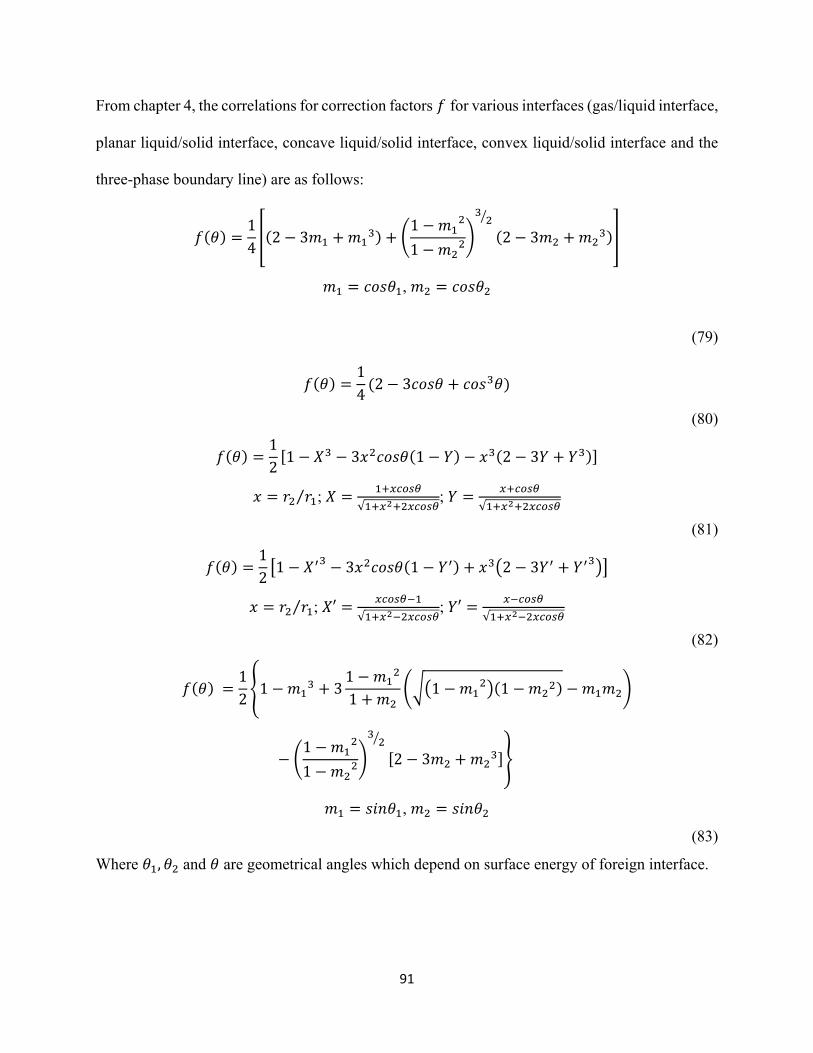
91
From chapter 4, the correlations for correction factors for various interfaces (gas/liquid interface,
planar liquid/solid interface, concave liquid/solid interface, convex liquid/solid interface and the
three-phase boundary line) are as follows:
14
2 31
12 3
,
(79)
142 3
(80)
121 3 1 2 3
⁄ ; √
; √
(81)
121 3 1 2 3
⁄ ; ′√
; ′√
(82)
12
1 311
1 1
1
12 3
,
(83)
Where , and are geometrical angles which depend on surface energy of foreign interface.

92
With the nucleation rate predicted with Classical Nucleation Theory (CNT), the probability
of hydrate formation can be expressed as a function of time when a constant driving force is applied
on the system (as shown in eq (84))144,146. The fluctuation of induction time and formation
probability of hydrate formation can also be examined in terms of the effects of foreign interfaces
on the nucleation process of gas hydrates, using the following expression:
1 ∙
(84)
Where represents the cumulative formation probability of gas hydrates. is the stationary
nucleation rate of gas hydrates estimated by equation (75). is the induction time144,146.
5.3 Effects of Foreign Interfaces on Nucleation Process of Gas-hydrate
5.3.1 Concave liquid/solid interface
5.3.1.1Effectsofconcavesurfacewettability
Fig. 26. (a) Cumulative probability of methane hydrates formation on concave surface versus time and contact angle at subcooling of 8 K; (b) Cumulative probability of methane hydrates formation on concave surface versus time and
contact angle at subcooling of 20 K.

93
Figure 26 depicts the effects of contact angle of decreasing hydrophilicity on the
cumulative formation probability to form a critical hydrate nucleus at an aspect ratio of 2 (i.e., the
radius of the concave surface is twice as large as the critical nucleus radius) and a constant driving
force. Figure 26 (a) and (b) are correspond to constant driving forces of 8 K (sub-cooling ∆
8 ) and 20 K (∆ 20 ), respectively. It was found that the sensitivity of formation probability
to concave surface wettability can be significantly reduced by increasing the driving force (the
degree of sub-cooling). As shown in Figure 26, the induction time for methane hydrate formation
increases when the wettability of the concave surface is changed from hydrophilic to hydrophobic.
This trend is more obvious when contact angle is larger than 90°. When contact angle is larger
than the value of 150°, the advantage of the presence of substrate surface as nucleation sites is
increasingly lost. In this case, the induction time required for methane-hydrates formation on
concave liquid/solid interface is very close to that for homogeneous nucleation.
5.3.1.2Effectsofconcavesurfacecurvature
Surface curvature is inversely proportional to the aspect ratio (i.e., the ratio of the radius
of the pore to the critical nucleus). In order to visualize how the curvature of the concave surface
influences the nucleation rate and induction time of methane hydrates, the wettability of the
concave surfaces and driving force for the system was maintained at a certain value. Figure 27
depicts the dependence of the cumulative probability of methane hydrates formation on time and
aspect ratio (i.e., the ratio of concave surface radius to the radius of critical hydrate nucleus) when
the contact angle is fixed at 120°. Figure 27(a) and Figure 27(b) is for the system with sub-cooling
values corresponding to 8 K and 20 K, respectively. As in the previous case, increase in the degree
of sub-cooling (driving force) can significantly reduce the sensitivity of nucleation process of
methane hydrates to the curvature (aspect ratio) of concave surface.

94
As shown in Figure 27, it was found that nucleation of methane hydrates is always
favorable on concave liquid/solid interface rather than flat liquid/solid interface. With the
fluctuation of the surface curvature, it was shown that induction time for methane hydrates
formation increases with the aspect ratio of concave surface. Therefore, nucleation of methane
hydrates is favored by concave surfaces with larger curvature (smaller aspect ratio). When the
aspect ratio is larger than 10 ( 10), the induction time for nucleation on concave liquid/solid
interface is close to that on flat liquid/solid interface. The advantages of concave surfaces as the
nucleation sites over flat surface is completely lost when aspect ratio is large than 100 ( 100).
Fig. 27. (a) Cumulative probability of methane hydrates formation on concave surface versus time and aspect ratio at subcooling of 8 K; (b) Cumulative probability of methane hydrates formation on concave surface versus time and
aspect ratio at subcooling of 20 K.
5.3.2 Convex liquid/solid interface
5.3.1.1Effectsofconvexsurfacewettability
When the nucleation of methane hydrates occurs on grain particles, the properties of
convex liquid/solid interface (wettability, particle size or curvature) play an important role during
the nucleation process of methane hydrates in porous media. Figure 28 shows the effects of
wettability of convex surface on the cumulative probability of methane hydrates formation when
a constant driving force is given (sub-cooling ∆ 8 ).

95
Fig. 28. Cumulative probability of methane hydrates formation on convex surface versus time and contact angle at subcooling of 8 K.
It was found that the induction time for hydrate formation increases as the wettability of
the convex surface goes from slightly hydrophilic to highly hydrophobic. In this case, the
nucleation process of methane hydrate preferentially takes place on the convex surface with
smaller contact angle (i.e., hydrophilic surface). In addition, the cumulative probability of methane
hydrates formation on convex liquid/solid interfaces is always larger than that for homogeneous
nucleation in the case of hydrophilic surfaces. As shown in Figure 28, when the contact angle is
larger than the value of 150°, the formation probability is almost the same as that for homogeneous
nucleation. Hydrophobic particle surfaces do not support the nucleation process. Additionally, the
advantage of the presence of particles as nucleation sites is increasingly lost for contact angles
greater than 90°. That is, the nucleation process of methane hydrates is more sensitive to contact

96
angles when the nucleation process occurs on hydrophilic particle surface compared to the case of
hydrophobic surface.
5.3.1.2Effectsofconvexsurfacecurvature
Fig. 29. Cumulative probability of methane hydrates formation on hydrophilic convex surface (left: contact angle is 60°) and hydrophobic convex surface (right: contact angle is 120°) versus time and aspect ratio (surface curvature)
at subcooling of 8 K.
As opposed to the beneficial effects of surface wettability on nucleation, one can see that
the effects of curvature (particle size) of convex surface are marginal on the probability of methane
hydrates formation and detrimental in character compared to flat surfaces (as shown in Figure 29).
Figure 29 presents the dependence of the cumulative formation probability of methane hydrates
on aspect ratio (i.e., ratio of particle radius over the radius of critical nucleus). It is clear that smaller
particles have a detrimental effect on nucleation process for a given contact angle (as shown in
figure 29: left 60° and right 120°) and driving force (sub-cooling ∆ 8 ). In fact, the
induction time for hydrates formation is slightly longer than that on flat surface. Regarding to the
effects of particle sizes, it shows that the induction time for hydrate formation gradually decreases

97
when the aspect ratio increases from 0.5 to 10. When the aspect ratio reaches at the value of 100,
the induction time required for nucleation on convex particle surface is almost the same as that on
flat surface.
5.3.3 Gas/liquid interface
In the bulk of an aqueous solution or large pores, the interface of gas/liquid is flat. A lens-
shaped critical nucleus forms at the gas/liquid interface (as shown in Figure 25(d)). As shown in
Figure 25(d), and represent the angles of the crystal/gas and the crystal/liquid interfaces,
respectively. The values of and depend on the interfacial energies between the phases
present, including the interfacial energy between gas phase and hydrate phase , the interfacial
energy between gas phase and liquid phase and the interfacial energy between hydrate phase
and liquid phase .
Fig. 30. (a) Cumulative probability of methane hydrates formation on gas/liquid interface versus time and angle at subcooling of 8 K; (b) Cumulative probability of methane hydrates formation on gas/liquid interface versus time
and angle at subcooling of 8 K.
Figure 30(a) shows the cumulative formation probability of methane hydrates as a function
of time and crystal/gas angle when a constant crystal/liquid angle ( 20°) and driving force

98
(sub-cooling ∆ 8 ) is given. And, Figure 30(b) describes the cumulative formation
probability of methane hydrates as a function of time and crystal/liquid angle when the
crystal/gas angle ( 20°) and driving force (subcooling ∆ 8 ) is given. It was found that
the time required for the nucleation of hydrate crystals increases with increasing either angle or
angle . As shown in Figure 30(a), the induction time for cumulative formation probability of
0.0027 varies from 10 s to 10 . s when the angle increases from 30° to 150°. Figure 30(b)
shows that the induction time for cumulative formation probability of 0.0027 increases from 10
s to 10 . s when the angle increases from 30° to 150°. The induction time for methane-
hydrates nucleation is more sensitive to angle than angle . Therefore, nucleation of methane
hydrates is more energetically favorable to occur inside the liquid phase rather than in the gas
phase.
5.3.4 Gas/liquid/solid triple boundary
In porous media with small pore radius, when gas, liquid and solid (three phases) are
present in the system, the interfaces between the three phases can play an important role in the
nucleation process. As shown in Figure 25(e), a lens-shaped crystal cluster formed along the
gas/liquid/solid boundary lines inside the cylindrical pore. The parameters of and describe
the contact angles of liquid and critical nucleus on the confinement surface, respectively. The
values of angles and depend on the wettability properties of the confinement surface (i.e.,
the pore walls).
Figure 31 shows that cumulative formation probability of methane hydrates is significantly
reduced with decreasing the value of or . That is, the induction time for hydrates nucleation
increases when surface (pore wall) wettability changes from hydrophobic to hydrophilic. Highly

99
hydrophilic pore walls will not support the nucleation of methane hydrates at the triple boundary
line. In addition, the induction time for hydrates nucleation is more sensitive to contact angle of
than . The nucleation of methane hydrates prefers to take place inside the liquid phase rather
than in the gas phase.
Fig. 31. Cumulative probability of methane hydrates formation on gas/liquid/solid triple boundary line versus time and contact angles and at subcooling of 8 K.
5.4 Discussion
5.4.1 Effects of liquid/solid interfaces
Regarding the effects of liquid/solid interfaces on the nucleation process of methane
hydrates, Table 8 shows the sensitivity of induction time to contact angle at a cumulative
probability equal to 0.27 % for the three surfaces discussed above. The value of 0.27% is
corresponding to the inflection point of the curve for cumulative formation probability, which is
assumed to represent the beginning of nucleation process in this work. It was found that induction

100
time increases with increasing the contact angle when a constant driving force (sub-cooling ∆
8 ) and aspect ratio ( 2) is given. Given a certain contact angle, nucleation on concave surface
requires shorter induction time while that on convex surface needs longer induction time and that
on flat surface falls in between. Highly hydrophilic surfaces can significantly increase the
nucleation rate of methane hydrates. In addition, the advantage of the presence of solid surface as
nucleation sites is almost lost for contact angles greater than 150°. In this case, induction time
required for nucleation on all the solid substrates is very close to that for homogeneous nucleation.
Table 8. Induction time required for cumulative formation probability of 0.27% for substrate surface at various
contact angle.
° ° ° °
Concave Surface 10 10 . 10 . 10
Flat Surface 10 10 10 . 10 .
Convex Surface 10 10 . 10 . 10 .
Homogeneous 10 .
Table 9 summarizes the effects of curvature (reciprocal of aspect ratio ) of liquid/solid
interfaces for a contact angle for all the substrate surfaces equal to 60°. It was found that nucleation
of methane hydrates is more energetically favorable on concave surfaces and less so on convex
surfaces with nucleation on flat surface in between when a constant driving force (sub-cooling
∆ 8 ) is given. The induction time required for cumulative probability of 0.27% on concave
surface increases with increasing aspect ratio, as shown in Table 9. That is, nucleation of methane
hydrates is favored by concave surfaces with larger curvatures. As for convex surfaces, induction

101
time for cumulative probability of 0.27% decreases with increasing the aspect ratio. Therefore,
nucleation of methane hydrates is more favorable to occur on larger particles (larger aspect ratio).
When the aspect ratio of curved surfaces (concave and convex surfaces) exceeds the value of 10,
the induction time for nucleation on curved surfaces is very close to that on flat surface. The
advantages of curved surfaces over flat surface as the nucleation sites are almost lost.
Table 9. Induction time required for cumulative formation probability of 0.27% for substrate surface with various
aspect ratio.
.
Concave Surface 10 . 10 . 10 10 .
Convex Surface 10 . 10 10 . 10 .
Flat Surface 10 .
5.4.2 Effects of gas/solid interfaces
As mentioned in Chapter 3, methane hydrates in smaller pores required higher pressure of
lower temperature to guarantee the stability and equilibrium status. Here, comparisons and analysis
of methane-hydrates nucleation in large pores (nucleation on gas/liquid interface) and small pores
(nucleation on gas/liquid/solid triple boundary line) are carried out. For the same shape and volume
of hydrate crystal, induction time increases when nucleation propagates from large pores to small
pores (as shown in Figure 32). That is, the formation of methane hydrates preferentially occurs in
larger pores rather than in smaller pores. This phenomenon can be understood from a strictly
physical perspective. The nucleus critical size is the minimum size required for the newly-formed,
gas-hydrate phase to grow. If the nucleus critical size required for the formation and growth of a
hydrate phase exceeds the space available within the sediment pore, the probability of developing
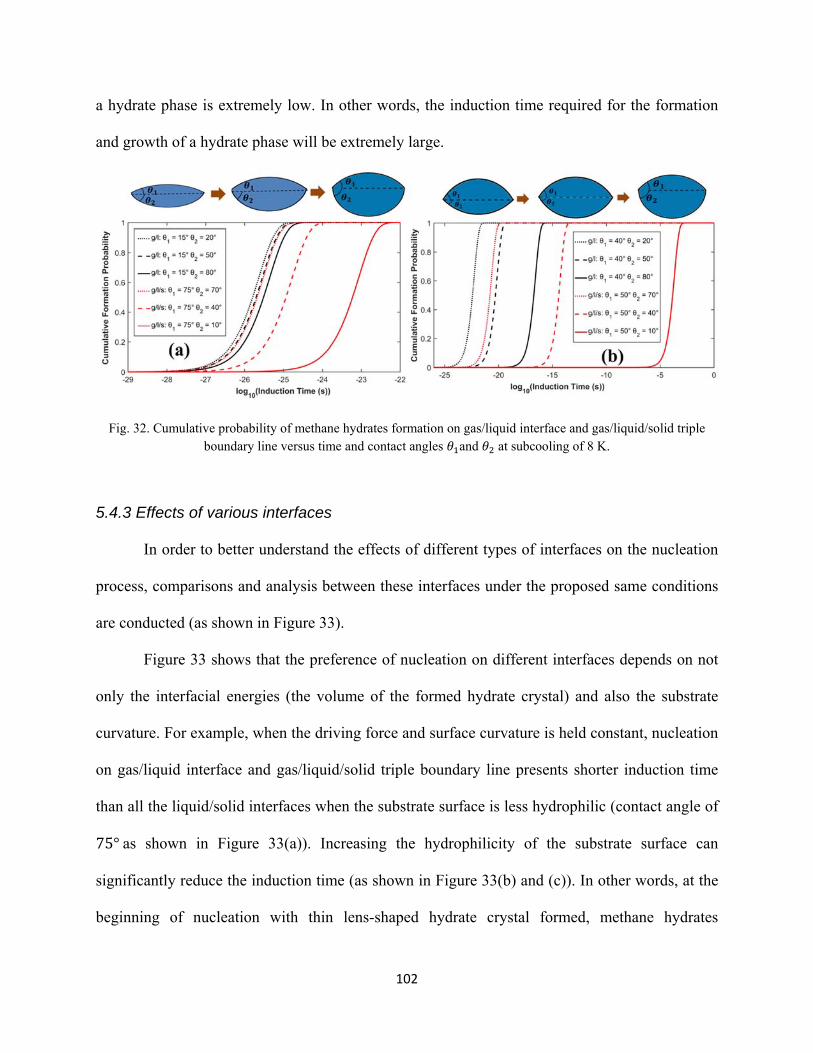
102
a hydrate phase is extremely low. In other words, the induction time required for the formation
and growth of a hydrate phase will be extremely large.
Fig. 32. Cumulative probability of methane hydrates formation on gas/liquid interface and gas/liquid/solid triple boundary line versus time and contact angles and at subcooling of 8 K.
5.4.3 Effects of various interfaces
In order to better understand the effects of different types of interfaces on the nucleation
process, comparisons and analysis between these interfaces under the proposed same conditions
are conducted (as shown in Figure 33).
Figure 33 shows that the preference of nucleation on different interfaces depends on not
only the interfacial energies (the volume of the formed hydrate crystal) and also the substrate
curvature. For example, when the driving force and surface curvature is held constant, nucleation
on gas/liquid interface and gas/liquid/solid triple boundary line presents shorter induction time
than all the liquid/solid interfaces when the substrate surface is less hydrophilic (contact angle of
75° as shown in Figure 33(a)). Increasing the hydrophilicity of the substrate surface can
significantly reduce the induction time (as shown in Figure 33(b) and (c)). In other words, at the
beginning of nucleation with thin lens-shaped hydrate crystal formed, methane hydrates

103
energetically favors to form at gas/liquid interface and gas/liquid/solid boundary line and then
moves to from on the liquid/solid interface. In another case, when a constant driving force is given
to form a certain lens-shaped hydrate crystal, the preference for nucleation on convex liquid/solid
interface is significantly reduced when the aspect ratio for the curved surface changes from 2 to
0.5.
Fig. 33. Cumulative probability of methane hydrates formation at various interfaces versus time at subcooling of 8 K.

104
Fig. 34. Cumulative probability of methane hydrates formation in different sediment porous media at sub-cooling of 8K: (a) coarse-grain sandstone porous media; (b) fine-grain clay porous media; (c) pipeline with oil droplets in
water.
In order to understand the effects of natural sediments on the formation of gas hydrates,
the formation probability of methane hydrates in three types of natural systems are analyzed.
Figure 34 (a) shows the formation probability of methane hydrates in a coarse-grain sandstone
system, which is highly hydrophilic with contact angle of 30°. It was found that gas-hydrate
formation in this system has a very short induction time. In addition, the preference of gas-hydrate
formation follows this order: concave surface, gas/liquid interface, flat surface and convex surface,
and finally gas/liquid/solid boundary line. In the case of fine-grain clays, which is less hydrophilic
than sandstone, as shown in Figure 34 (b), formation of gas hydrates requires shorter induction
time at the interface of gas/liquid and three-phase boundary line than that at all of the liquid/solid
interfaces. Figure 34 (c) depicts a pipeline system with the presence of gas phase, liquid phase and

105
oil droplets. The surface of oil droplets is highly hydrophobic with a constant contact angle of
120°. In this pipeline system, formation of gas hydrates is energetically favorable at the gas/liquid
interface and less so by the interfaces with oil on them. These model predictions on formation
probability of methane hydrates qualitatively agree with the experimental observations on gas
hydrates formation.
5.5 Conclusions
Gas hydrates have attracted a lot of research attention due to the wide applications,
including natural gas pipeline flow assurance, natural gas storage and transport, energy resource
and environmental effects. Understanding the nucleation process of gas hydrates could be the key
point to understand these applications. Modeling of the kinetic nucleation of gas-hydrates can be
applied to predict and analyze the effects of various interfaces on the nucleation process of gas
hydrates in an efficient and more general way as they do not have the limitations of experimental
methods in time and scale of measurements.
In this work, a model for the kinetic nucleation of gas hydrates on different interfaces,
including gas/liquid interface, liquid/solid interface and gas/liquid/solid triple boundary line, was
developed based on classical nucleation theory. The concept of cumulative formation probability
of gas hydrates was applied to intuitively compare and analyze the effects of various foreign
interfaces on the nucleation process. It was found that the formation probability of gas hydrates
can be significantly affected by the driving force and interface properties (i.e., interfacial energies,
wettability, and surface curvature). When the driving force is large enough, the sensitivity of
nucleation to interfacial properties is significantly diminished.

106
With respect to the effects of liquid/solid interfaces on nucleation of methane hydrates, it
was found that nucleation is always more energetically favorable on concave surfaces and less so
on convex surfaces while nucleation on flat surfaces falls in between for the same value of driving
force. In addition, nucleation of methane hydrates on solid surfaces is more favored by hydrophilic
surfaces, which translates into shorter induction time to achieve a certain formation probability.
When the contact angle is greater than 150°, the advantage of the presence of solid surfaces as
nucleation sites is almost lost. Regarding to surface curvatures, nucleation of methane hydrates
preferentially occurs on concave surfaces with larger curvatures (smaller aspect ratio ) than on
flat surface, and even less on convex surfaces with smaller curvatures (larger ). As for the effects
of gas/liquid interface and gas/liquid/solid triple boundary line, longer induction time is required
to form the same volume of hydrate crystal on gas/liquid/solid triple boundary line than that on
gas/liquid interface. That is, nucleation of methane hydrates preferentially occurs in large pores
rather than in small pores. Furthermore, the preference in terms of formation of methane hydrates
on different interfaces changes with the size of the formed hydrate crystal and the curvature of the
solid surfaces for any given driving force. Modeling predictions show that methane hydrates form
first on concave surface and gas/liquid interface then other liquid/solid interfaces and last on
gas/liquid/solid triple boundary line in a hydrophilic coarse-grain sandstone system. In a less
hydrophilic fine-grain clay system, modeling predictions show that methane hydrates form first on
gas/liquid interface and gas/liquid/solid triple boundary line and then on liquid/solid interfaces. In
a pipeline system with highly hydrophobic oil droplets, methane hydrates preferentially form on
gas/liquid interface and then on liquid/solid interfaces.

107
CHAPTER 6 SUMMARY AND CONCLUSIONS

108
Gas-hydrates are ice-like crystalline inclusion-compounds stabilized by gas molecules
trapped in a host lattice formed by water molecules, which form a hydrogen-bonded framework
under proper conditions, pressure and temperature. Understanding the behavior of gas-hydrates
has become increasingly important in the fields of flow assurance, gas storage and transport,
energy resource management and climate change. Being able to fully estimate the volume and gas-
content of natural gas-hydrate reservoirs in sediments is not just important in terms of potential
natural gas exploitation, but also from an environmental perspective, considering that methane gas
is a potent greenhouse gas. In addition, it’s crucial to understand the kinetic nucleation of gas-
hydrates in order to better predict the patterns of formation of gas hydrates in natural sediments or
inhibit the formation of gas-hydrates for flow assurance. The key to gaining understanding and
predictive capabilities of the formation and stability of gas hydrates in sediments lays in capturing
accurately the role that the sediment plays in these processes. Therefore, the hypothesis guiding
this work is that the inclusion of appropriate sediment-properties, i.e., pore size, wettability,
surface curvature and interfacial energies, can enable more accurate prediction of gas-hydrate
stability and mathematically capturing nucleation scenarios and probabilities.
In this work, a model for gas-hydrates equilibrium in pores was developed from basic
thermodynamic analysis and validated against available experimental data published in the
literature. The model organically incorporates sediment properties like pore size, wettability and
interfacial energy. The proposed model presents high predictive accuracy when compared to
experimental data with the average AAD of less than 2%. The mechanical equilibrium condition
of the model takes the effects of sediment properties (wettability, interfacial tension) into account
to describe the conditions of stability of gas hydrate in porous media, in a very straight-forward
manner. It was found that equilibrium conditions for gas-hydrates are highly dependent on the pore

109
size. The wettability of the pore surface affects the equilibrium pressures of gas hydrate formed in
porous media, and the shape of the hydrate phase. However, experimental data are available only
for surfaces of similar surface properties. The effects of sediment properties captured in the
proposed model should be further tested experimentally. The success of the proposed model in
predicting experimental data of gas-hydrate equilibrium in porous media can be attributed to the
successful incorporation of sediment properties into its constitutive equations. This supports the
validity of the hypothesis.
In this work, a mathematical model was developed in order to describe the effects of foreign
interfaces (i.e., gas/liquid interface, liquid/solid interface and three-phase boundary line) on kinetic
nucleation of gas-hydrates in sediments of varying characteristics. The model incorporates
interface properties (interfacial interaction energies, wettability and substrate size), and was
applied to quantitatively describe the effects of various foreign interfaces on the cumulative
formation probability of methane hydrates. The model included a successful incorporation of
sediment properties in the thermodynamic component of hydrate nucleation rates within the
framework of the Classical Nucleation Theory (CNT). It was found that the nucleation process of
methane hydrates can be significantly affected by the interplay between driving force and
interfacial properties. The sensitivity of probability and induction time for nucleation to interfacial
properties can be significantly diminished by increasing the driving force (sub-cooling), i.e.,
interfacial effects on the activation energy required for nucleation can be effectively
counterbalanced with larger driving forces for the process. In addition, it was shown that
nucleation of methane hydrates is kinetically favored within large sediment pores rather than
within small pores. This model prediction agrees with observations of core samples of gas-hydrate-
bearing sediments. As for the effects of liquid/solid interfaces, it was found that the formation
110
probability of methane hydrates can be significantly modulated by surface wettability and surface
curvature. Nucleation of methane hydrates is always more energetically favorable on concave
surfaces and less so on convex surfaces, with the flat surface case acting as the barrier in between
the two behaviors. In addition, nucleation of gas hydrates is favored by highly-hydrophilic surfaces
and concave surfaces with smaller curvatures, when considering nucleation of hydrate on solid
interfaces. The curvature of convex liquid/solid interface has only marginal effects on the
nucleation process of methane hydrates. Finally, the location where gas hydrate will start
nucleating on different types of interfaces is a function of the size of the formed hydrate crystal
and the curvature and wettability of the solid surface for a given driving force. Modeling
predictions show that methane hydrates form first on concave liquid/solid interface and gas/liquid
interface then other types of liquid/solid interfaces and last on gas/liquid/solid triple boundary line
in a hydrophilic coarse-grain sandstone system. In a less hydrophilic fine-grain clay system,
modeling predictions show that methane hydrates form first on gas/liquid interface and
gas/liquid/solid triple boundary line and then on liquid/solid interfaces. In a pipeline system with
highly hydrophobic oil droplets, methane hydrates preferentially form on gas/liquid interface and
then on liquid/solid interfaces. One can picture hydrate lenses growing from the center of the pore
towards the perimeter, and then starting to plug the pores by covering the pore walls during
continuous growth. This prediction agrees with growth mechanisms proposed based on
observations of core samples from hydrate-bearing sediments,125,142,148 which also supports the
validity of the hypothesis guiding the present work.
Summarizing, it can be stated that the hypothesis guiding the present work was proven:
incorporation of appropriate sediment-properties (i.e., pore size, surface interaction energies,
surface wettability and surface geometry) can better predict and analyze the equilibrium conditions

111
and provide insight into nucleation occurrence of gas hydrates that qualitatively agrees with gas-
hydrate observations. The incorporation of sediment properties into the model for gas hydrates
equilibrium conditions predicts the available experimental data with an absolute average deviation
(%AAD) less than 2%, a significant improvement upon previous modeling attempts. In addition,
the inclusion of sediment properties in the models for kinetic nucleation of gas hydrates result in
mathematical models that qualitatively capture the information obtained from examination of gas-
hydrate core samples and observations of gas hydrates in synthetic systems.

112
CHAPTER 7 FUTURE WORK RECOMMENDATION
113
As final remarks, while much work has been done and much has been achieved, the
exploration on gas-hydrate equilibrium, stability and kinetics is far from being completed. We
would like to recommend some very attractive future work focusing on the areas briefly described
below.
First, natural porous media (e.g., sand and silt) usually exhibits a wide range of pore sizes.
The pore size distribution can be narrow in some locations, while in others it can be broad.
Additionally, natural porous media has a heterogeneous composition with a distribution of
interfacial properties. For this reason, developing approaches to incorporate pore size distributions
and distribution of properties of natural sediments into the hydrate-equilibrium model can help
improve its accuracy, not only in terms of thermodynamic equilibrium, but in terms of the
estimates of gas content in gas-hydrate reservoirs.
Second, from the perspective of energy recovery, it is crucial to understand the dissociation
process of methane hydrates and methane gas production behavior. Therefore, a theoretical
mathematical model, which incorporates the properties of foreign interfaces (e.g., liquid/solid
interface, gas/liquid interface and gas/liquid/solid boundary line) present in porous media, can be
developed to understand how the foreign interfaces affect the kinetic dissociation process and
further control methane hydrate dissociation. This model will be based on the nucleation model
developed in the present work.
Finally, from a practical point of view, the findings of the kinetic nucleation study can be
applied in two fields: the design of promoters to enhance hydrate formation rates from natural gas
storage and transportation perspective; and the design of kinetic hydrate inhibitors (KHI) to
prevent the formation of gas hydrates from a flow assurance perspective. For example, hydrophilic
surfaces with small pits will help to enhance the nucleation of gas hydrates. Small particles with

114
wettability of highly hydrophobic nature are promising to be used to delay or inhibit the formation
of gas hydrates.

115
Nomenclature
Characters
= Langmuir constant
= fugacity
Θ , = fraction of cage capacity
= chemical potential
= number of cages per water molecule in the crystal lattice
= activity coefficient
= fugacity coefficient
Δ = change in a property
= maximum attractive potential
= core distance at zero potential
Γ = function depending on contact angle
= internal energy
= entropy
= enthalpy
= Boltzmann constant
= Avogadro’s number
= number of water molecules
= radial distance
= pore radius
= pressure
= Temperature
= gas constant
= cell radius of each shell
= molar volume
= cell potential
= cell potential for shell i
= coordination number of the cage

116
= compressibility factor
I = hydrate structure I
II = hydrate structure II
= objective function
= tolerance
= molar composition in the liquid phase
Superscripts and subscripts
H = hydrate phase
L = liquid phase
V= vapor phase
eβ = empty hydrate phase
IG = ideal gas phase
α = gas-hydrate interface
β = hydrate-liquid interface
= interfacial energy of gas-hydrate interface
= surface area of gas-hydrate interface
= interfacial energy of hydrate-liquid interface
= surface area of hydrate-liquid interface
θ = angle of gas-hydrate interface on the surface of porous wall
τ = angle of hydrate-liquid interface on the surface of porous wall
p = pore
w = water
g = guest
sat = saturated conditions
surr = surroundings of the system, i.e., barostat and thermostat
= ice or liquid water
m = cage type
∆ = the Gibbs free energy change for the formation of crystal nucleus per unit volume
= correction factor to describe the effects of foreign interfaces on nucleation
∆ = energy barrier for homogeneous nucleation
= number of ice nuclei in a volume of parent phase per second

117
∗ = attach frequency of hydrate building units to the hydrate nucleus at equilibrium conditions
= concentration of nucleation sites in the system
∆ = driving force for the transfer of a building unit across the solid-liquid interface
∆ ∗ = energy barrier for heterogeneous nucleation
= the probability of hydrate formation

118
REFERENCES
(1) Chong, Z. R.; Yang, S. H. B.; Babu, P.; Linga, P.; Li, X.-S. Review of Natural Gas Hydrates as an Energy Resource: Prospects and Challenges. Appl. Energy 2016, 162, 1633–1652. https://doi.org/10.1016/j.apenergy.2014.12.061.
(2) Sloan, E. D. Clathrate Hydrates of Natural Gases, Second Edition, Revised and Expanded; CRC Press, 1998.
(3) Sloan, E. D.; Koh, C. Clathrate Hydrates of Natural Gases, Third Edition; CRC Press, 2007.
(4) Makogon, Y. F.; Holditch, S. A.; Makogon, T. Y. Natural Gas-Hydrates — A Potential Energy Source for the 21st Century. J. Pet. Sci. Eng. 2007, 56 (1), 14–31. https://doi.org/10.1016/j.petrol.2005.10.009.
(5) Park, S.-S.; Lee, S.-B.; Kim, N.-J. Effect of Multi-Walled Carbon Nanotubes on Methane Hydrate Formation. J. Ind. Eng. Chem. 2010, 16 (4), 551–555. https://doi.org/10.1016/j.jiec.2010.03.023.
(6) Koh, C. A.; Sloan, E. D.; Sum, A. K.; Wu, D. T. Fundamentals and Applications of Gas Hydrates. Annu. Rev. Chem. Biomol. Eng. 2011, 2 (1), 237–257. https://doi.org/10.1146/annurev-chembioeng-061010-114152.
(7) Claussen, W. F. A Second Water Structure for Inert Gas Hydrates. J. Chem. Phys. 1951, 19 (11), 1425–1426. https://doi.org/10.1063/1.1748079.
(8) Claussen, W. F. Erratum: Suggested Structures of Water in Inert Gas Hydrates. J. Chem. Phys. 1951, 19 (5), 662–662. https://doi.org/10.1063/1.1748327.
(9) Claussen, W. F.; Polglase, M. F. Solubilities and Structures in Aqueous Aliphatic Hydrocarbon Solutions. J. Am. Chem. Soc. 1952, 74 (19), 4817–4819. https://doi.org/10.1021/ja01139a026.
(10) Ripmeester, J. A.; Tse, J. S.; Ratcliffe, C. I.; Powell, B. M. A New Clathrate Hydrate Structure. Nature 1987, 325 (6100), 135–136. https://doi.org/10.1038/325135a0.
(11) Sloan, E. D. Fundamental Principles and Applications of Natural Gas Hydrates. Nature 2003, 426 (6964), 353–363. https://doi.org/10.1038/nature02135.
(12) Jeffrey, G. A. Hydrate Inclusion Compounds. J. Incl. Phenom. 1984, 1 (3), 211–222. https://doi.org/10.1007/BF00656757.
(13) GEO_ExPro_v12i4.Pdf. (14) Pellenbarg, R. E.; Max, M. D.; Clifford, S. M. Methane and Carbon Dioxide Hydrates on
Mars: Potential Origins, Distribution, Detection, and Implications for Future in Situ Resource Utilization. J. Geophys. Res. Planets 2003, 108 (E4). https://doi.org/10.1029/2002JE001901.
(15) Duxbury, N. S.; Nealson, K. H.; Romanovsky, V. E. On the Possibility of Clathrate Hydrates on the Moon. J. Geophys. Res. Planets 2001, 106 (E11), 27811–27813. https://doi.org/10.1029/2000JE001425.
(16) Wood, D. A. Gas Hydrate Research Advances Steadily on Multiple Fronts: A Collection of Published Research (2009–2015). J. Nat. Gas Sci. Eng. 2015, 24, A1–A8. https://doi.org/10.1016/j.jngse.2015.04.019.
(17) Turner, D. J. Clathrate Hydrate Formation in Water-in-Oil Dispersions; Colorado School of Mines., 2005.

119
(18) Aman, Z. M.; Sloan, E. D.; Sum, A. K.; Koh, C. A. Lowering of Clathrate Hydrate Cohesive Forces by Surface Active Carboxylic Acids. Energy Fuels 2012, 26 (8), 5102–5108. https://doi.org/10.1021/ef300707u.
(19) Colombel, E.; Gateau, P.; Barré, L.; Gruy, F.; Palermo, T. Discussion of Agglomeration Mechanisms between Hydrate Particles in Water in Oil Emulsions. Oil Gas Sci. Technol. - Rev. IFP 2009, 64 (5), 629–636. https://doi.org/10.2516/ogst/2009042.
(20) Jiménez-Ángeles, F.; Firoozabadi, A. Induced Charge Density and Thin Liquid Film at Hydrate/Methane Gas Interfaces. J. Phys. Chem. C 2014, 118 (45), 26041–26048. https://doi.org/10.1021/jp507160s.
(21) Austvik, T.; Li, X.; Gjertsen, L. H. Hydrate Plug Properties: Formation and Removal of Plugs. Ann. N. Y. Acad. Sci. 912 (1), 294–303. https://doi.org/10.1111/j.1749-6632.2000.tb06783.x.
(22) Gao, S. Hydrate Risk Management at High Watercuts with Anti-Agglomerant Hydrate Inhibitors. Energy Fuels 2009, 23 (4), 2118–2121. https://doi.org/10.1021/ef8009876.
(23) Mokhatab, S.; Wilkens, R. J.; Leontaritis, K. J. A Review of Strategies for Solving Gas-Hydrate Problems in Subsea Pipelines. Energy Sources Part Recovery Util. Environ. Eff. 2007, 29 (1), 39–45. https://doi.org/10.1080/009083190933988.
(24) Kelland, M. A. History of the Development of Low Dosage Hydrate Inhibitors. Energy Fuels 2006, 20 (3), 825–847. https://doi.org/10.1021/ef050427x.
(25) Zerpa, L. E.; Salager, J.-L.; Koh, C. A.; Sloan, E. D.; Sum, A. K. Surface Chemistry and Gas Hydrates in Flow Assurance. Ind. Eng. Chem. Res. 2011, 50 (1), 188–197. https://doi.org/10.1021/ie100873k.
(26) Veluswamy, H. P.; Kumar, A.; Seo, Y.; Lee, J. D.; Linga, P. A Review of Solidified Natural Gas (SNG) Technology for Gas Storage via Clathrate Hydrates. Appl. Energy 2018, 216, 262–285. https://doi.org/10.1016/j.apenergy.2018.02.059.
(27) Casco, M. E.; Martínez-Escandell, M.; Gadea-Ramos, E.; Kaneko, K.; Silvestre-Albero, J.; Rodríguez-Reinoso, F. High-Pressure Methane Storage in Porous Materials: Are Carbon Materials in the Pole Position? Chem. Mater. 2015, 27 (3), 959–964. https://doi.org/10.1021/cm5042524.
(28) Di Profio, P.; Arca, S.; Rossi, F.; Filipponi, M. Comparison of Hydrogen Hydrates with Existing Hydrogen Storage Technologies: Energetic and Economic Evaluations. Int. J. Hydrog. Energy 2009, 34 (22), 9173–9180. https://doi.org/10.1016/j.ijhydene.2009.09.056.
(29) Hao, W.; Wang, J.; Fan, S.; Hao, W. Evaluation and Analysis Method for Natural Gas Hydrate Storage and Transportation Processes. Energy Convers. Manag. 2008, 49 (10), 2546–2553. https://doi.org/10.1016/j.enconman.2008.05.016.
(30) 2018-Outlook-for-Energy.Pdf. (31) Anonymous. Methane Hydrates in Quaternary Climate Change: The Clathrate Gun
Hypothesis. Eos Trans. Am. Geophys. Union 83 (45), 513–516. https://doi.org/10.1029/2002EO000359.
(32) Maslin, M.; Owen, M.; Day, S.; Long, D. Linking Continental-Slope Failures and Climate Change: Testing the Clathrate Gun Hypothesis. Geology 2004, 32 (1), 53–56. https://doi.org/10.1130/G20114.1.
(33) Klebnikov, S. The Clathrate Gun Hypothesis: A Call to Action to the EPA. Penn Sustain. Rev. 2016, 1 (8).
(34) Organization, W. M. WMO Statement on the State of the Global Climate in 2017; Climate Change; 2017.

120
(35) Hatzikiriakos, S. G.; Englezos, P. The Relationship between Global Warming and Methane Gas Hydrates in the Earth. Chem. Eng. Sci. 1993, 48 (23), 3963–3969. https://doi.org/10.1016/0009-2509(93)80375-Z.
(36) Ruppel, C. Tapping Methane Hydrates for Unconventional Natural Gas. Elements 2007, 3 (3), 193199. https://doi.org/10.2113/gselements.3.3.193.
(37) Yvon-Durocher, G.; Allen, A. P.; Bastviken, D.; Conrad, R.; Gudasz, C.; St-Pierre, A.; Thanh-Duc, N.; del Giorgio, P. A. Methane Fluxes Show Consistent Temperature Dependence across Microbial to Ecosystem Scales. Nature 2014, 507 (7493), 488–491. https://doi.org/10.1038/nature13164.
(38) Shakhova, N.; Semiletov, I. Methane Release and Coastal Environment in the East Siberian Arctic Shelf. J. Mar. Syst. 2007, 66 (1), 227–243. https://doi.org/10.1016/j.jmarsys.2006.06.006.
(39) Knott, B. C.; Molinero, V.; Doherty, M. F.; Peters, B. Homogeneous Nucleation of Methane Hydrates: Unrealistic under Realistic Conditions. J. Am. Chem. Soc. 2012, 134 (48), 19544–19547. https://doi.org/10.1021/ja309117d.
(40) Kashchiev, D.; Firoozabadi, A. Nucleation of Gas Hydrates. J. Cryst. Growth 2002, 243 (3), 476–489. https://doi.org/10.1016/S0022-0248(02)01576-2.
(41) Bai, D.; Chen, G.; Zhang, X.; Wang, W. Nucleation of the CO2 Hydrate from Three-Phase Contact Lines. Langmuir 2012, 28 (20), 7730–7736. https://doi.org/10.1021/la300647s.
(42) Bai, D.; Chen, G.; Zhang, X.; Sum, A. K.; Wang, W. How Properties of Solid Surfaces Modulate the Nucleation of Gas Hydrate. Sci. Rep. 2015, 5, 12747. https://doi.org/10.1038/srep12747.
(43) Bai, D.; Chen, G.; Zhang, X.; Wang, W. Microsecond Molecular Dynamics Simulations of the Kinetic Pathways of Gas Hydrate Formation from Solid Surfaces. Langmuir 2011, 27 (10), 5961–5967. https://doi.org/10.1021/la105088b.
(44) Anderson, R.; Llamedo, M.; Tohidi, B.; Burgass, R. W. Experimental Measurement of Methane and Carbon Dioxide Clathrate Hydrate Equilibria in Mesoporous Silica. J. Phys. Chem. B 2003, 107 (15), 3507–3514. https://doi.org/10.1021/jp0263370.
(45) Clennell, M. B.; Hovland, M.; Booth, J. S.; Henry, P.; Winters, W. J. Formation of Natural Gas Hydrates in Marine Sediments: 1. Conceptual Model of Gas Hydrate Growth Conditioned by Host Sediment Properties. J. Geophys. Res. Solid Earth 104 (B10), 22985–23003. https://doi.org/10.1029/1999JB900175.
(46) Griffiths, F. J.; Joshi, R. C. CHANGE IN PORE SIZE DISTRIBUTION DUE TO CONSOLIDATION OF CLAYS. TECHNICAL NOTE. GEOTECHNIQUE 1989, 39 (1).
(47) Handa, Y. P.; Stupin, D. Yu. Thermodynamic Properties and Dissociation Characteristics of Methane and Propane Hydrates in 70-.ANG.-Radius Silica Gel Pores. J. Phys. Chem. 1992, 96 (21), 8599–8603. https://doi.org/10.1021/j100200a071.
(48) Uchida, T.; Ebinuma, T.; Ishizaki, T. Dissociation Condition Measurements of Methane Hydrate in Confined Small Pores of Porous Glass. J. Phys. Chem. B 1999, 103 (18), 3659–3662. https://doi.org/10.1021/jp984559l.
(49) Uchida, T.; Ebinuma, T.; Takeya, S.; Nagao, J.; Narita, H. Effects of Pore Sizes on Dissociation Temperatures and Pressures of Methane, Carbon Dioxide, and Propane Hydrates in Porous Media. J. Phys. Chem. B 2002, 106 (4), 820–826. https://doi.org/10.1021/jp012823w.

121
(50) Ripmeester, J. A.; Alavi, S. Some Current Challenges in Clathrate Hydrate Science: Nucleation, Decomposition and the Memory Effect. Curr. Opin. Solid State Mater. Sci. 2016, 20 (6), 344–351. https://doi.org/10.1016/j.cossms.2016.03.005.
(51) Kim, N.-J.; Park, S.-S.; Kim, H. T.; Chun, W. A Comparative Study on the Enhanced Formation of Methane Hydrate Using CM-95 and CM-100 MWCNTs. Int. Commun. Heat Mass Transf. 2011, 38 (1), 31–36. https://doi.org/10.1016/j.icheatmasstransfer.2010.10.002.
(52) Park, S.-S.; Lee, S.-B.; Kim, N.-J. Effect of Multi-Walled Carbon Nanotubes on Methane Hydrate Formation. J. Ind. Eng. Chem. 2010, 16 (4), 551–555. https://doi.org/10.1016/j.jiec.2010.03.023.
(53) Moraveji, M. K.; Golkaram, M.; Davarnejad, R. Effect of CuO Nanoparticle on Dissolution of Methane in Water. J. Mol. Liq. 2013, 180, 45–50. https://doi.org/10.1016/j.molliq.2012.12.014.
(54) Ganji, H.; Aalaie, J.; Boroojerdi, S. H.; Rod, A. R. Effect of Polymer Nanocomposites on Methane Hydrate Stability and Storage Capacity. J. Pet. Sci. Eng. 2013, 112, 32–35. https://doi.org/10.1016/j.petrol.2013.11.026.
(55) Arjang, S.; Manteghian, M.; Mohammadi, A. Effect of Synthesized Silver Nanoparticles in Promoting Methane Hydrate Formation at 4.7 MPa and 5.7 MPa. Chem. Eng. Res. Des. 2013, 91 (6), 1050–1054. https://doi.org/10.1016/j.cherd.2012.12.001.
(56) Takahata, M.; Kashiwaya, Y.; Ishii, K. Kinetics of Methane Hydrate Formation Catalyzed by Iron Oxide and Carbon under Intense Stirring Conditions. Mater. Trans. 2010, 51 (4), 727–734. https://doi.org/10.2320/matertrans.M2009369.
(57) Aliabadi, M.; Rasoolzadeh, A.; Esmaeilzadeh, F.; Alamdari, A. Experimental Study of Using CuO Nanoparticles as a Methane Hydrate Promoter. J. Nat. Gas Sci. Eng. 2015, 27, 1518–1522. https://doi.org/10.1016/j.jngse.2015.10.017.
(58) Najibi, H.; Shayegan, M. M.; Heidary, H. Experimental Investigation of Methane Hydrate Formation in the Presence of Copper Oxide Nanoparticles and SDS. J. Nat. Gas Sci. Eng. 2015, 23, 315–323. https://doi.org/10.1016/j.jngse.2015.02.009.
(59) Park, S.-S.; An, E.-J.; Lee, S.-B.; Chun, W.; Kim, N.-J. Characteristics of Methane Hydrate Formation in Carbon Nanofluids. J. Ind. Eng. Chem. 2012, 18 (1), 443–448. https://doi.org/10.1016/j.jiec.2011.11.045.
(60) Pasieka, J.; Coulombe, S.; Servio, P. Investigating the Effects of Hydrophobic and Hydrophilic Multi-Wall Carbon Nanotubes on Methane Hydrate Growth Kinetics. Chem. Eng. Sci. 2013, 104, 998–1002. https://doi.org/10.1016/j.ces.2013.10.037.
(61) 27, M. G. on M.; Am, 2015 at 10:32. MIT researchers pioneer technique for mass-producing graphene http://www.extremetech.com/extreme/206573-mit-researchers-pioneer-technique-for-mass-producing-graphene (accessed Apr 22, 2016).
(62) Ghozatloo, A.; Hosseini, M.; Shariaty-Niassar, M. Improvement and Enhancement of Natural Gas Hydrate Formation Process by Hummers’ Graphene. J. Nat. Gas Sci. Eng. 2015, 27, Part 2, 1229–1233. https://doi.org/10.1016/j.jngse.2015.09.069.
(63) Cheng, Y.; Li, L.; Yuan, Z.; Wu, L.; Mahmood, S. Finite Element Simulation for Fluid–Solid Coupling Effect on Depressurization-Induced Gas Production from Gas Hydrate Reservoirs. J. Nat. Gas Sci. Eng. 2013, 10, 1–7. https://doi.org/10.1016/j.jngse.2012.10.001.
(64) Tabatabaie, S. H.; Pooladi-Darvish, M. Analytical Solution for Gas Production from Hydrate Reservoirs Underlain with Free Gas. J. Nat. Gas Sci. Eng. 2009, 1 (1), 46–57. https://doi.org/10.1016/j.jngse.2009.03.006.

122
(65) Warrier, P.; Khan, M. N.; Srivastava, V.; Maupin, C. M.; Koh, C. A. Overview: Nucleation of Clathrate Hydrates. J. Chem. Phys. 2016, 145 (21), 211705. https://doi.org/10.1063/1.4968590.
(66) Bai, D.; Chen, G.; Zhang, X.; Wang, W. Microsecond Molecular Dynamics Simulations of the Kinetic Pathways of Gas Hydrate Formation from Solid Surfaces. Langmuir 2011, 27 (10), 5961–5967. https://doi.org/10.1021/la105088b.
(67) Bai, D.; Chen, G.; Zhang, X.; Sum, A. K.; Wang, W. How Properties of Solid Surfaces Modulate the Nucleation of Gas Hydrate. Sci. Rep. 2015, 5, 12747. https://doi.org/10.1038/srep12747.
(68) Bai, D.; Chen, G.; Zhang, X.; Wang, W. Nucleation of the CO2 Hydrate from Three-Phase Contact Lines. Langmuir 2012, 28 (20), 7730–7736. https://doi.org/10.1021/la300647s.
(69) Liang, S.; Kusalik, P. G. The Nucleation of Gas Hydrates near Silica Surfaces. Can. J. Chem. 2014, 93 (8), 791–798. https://doi.org/10.1139/cjc-2014-0443.
(70) Walsh, M. R.; Beckham, G. T.; Koh, C. A.; Sloan, E. D.; Wu, D. T.; Sum, A. K. Methane Hydrate Nucleation Rates from Molecular Dynamics Simulations: Effects of Aqueous Methane Concentration, Interfacial Curvature, and System Size. J. Phys. Chem. C 2011, 115 (43), 21241–21248. https://doi.org/10.1021/jp206483q.
(71) Clarke, M. A.; Pooladi-Darvish, M.; Bishnoi, P. R. A Method To Predict Equilibrium Conditions of Gas Hydrate Formation in Porous Media. Ind. Eng. Chem. Res. 1999, 38 (6), 2485–2490. https://doi.org/10.1021/ie980625u.
(72) Klauda, J. B.; Sandler, S. I. A Fugacity Model for Gas Hydrate Phase Equilibria. Ind. Eng. Chem. Res. 2000, 39 (9), 3377–3386. https://doi.org/10.1021/ie000322b.
(73) Waals, J. H. van der; Platteeuw, J. C. Clathrate Solutions. In Advances in Chemical Physics; Prigogine, I., Ed.; John Wiley & Sons, Inc., 1958; pp 1–57. https://doi.org/10.1002/9780470143483.ch1.
(74) Klauda, J. B.; Sandler, S. I. Modeling Gas Hydrate Phase Equilibria in Laboratory and Natural Porous Media. Ind. Eng. Chem. Res. 2001, 40 (20), 4197–4208. https://doi.org/10.1021/ie000961m.
(75) Chong, Z. R.; Yang, S. H. B.; Babu, P.; Linga, P.; Li, X.-S. Review of Natural Gas Hydrates as an Energy Resource: Prospects and Challenges. Appl. Energy 2016, 162, 1633–1652. https://doi.org/10.1016/j.apenergy.2014.12.061.
(76) Moridis, G.; Collett, T. Strategies for Gas Production from Hydrate Accumulations under Various Geologic Conditions. 2003.
(77) Koh, C. A.; Sum, A. K.; Sloan, E. D. State of the Art: Natural Gas Hydrates as a Natural Resource. J. Nat. Gas Sci. Eng. 2012, 8, 132–138. https://doi.org/10.1016/j.jngse.2012.01.005.
(78) Clennell, M. B.; Hovland, M.; Booth, J. S.; Henry, P.; Winters, W. J. Formation of Natural Gas Hydrates in Marine Sediments: 1. Conceptual Model of Gas Hydrate Growth Conditioned by Host Sediment Properties. J. Geophys. Res. Solid Earth 1999, 104 (B10), 22985–23003. https://doi.org/10.1029/1999JB900175.
(79) Turner, D. J.; Cherry, R. S.; Sloan, E. D. Sensitivity of Methane Hydrate Phase Equilibria to Sediment Pore Size. Fluid Phase Equilibria 2005, 228–229, 505–510. https://doi.org/10.1016/j.fluid.2004.09.025.
(80) Hansen, E. W.; Gran, H. C.; Sellevold, E. J. Heat of Fusion and Surface Tension of Solids Confined in Porous Materials Derived from a Combined Use of NMR and Calorimetry. J. Phys. Chem. B 1997, 101 (35), 7027–7032. https://doi.org/10.1021/jp9710594.

123
(81) Uchida, T.; Ebinuma, T.; Takeya, S.; Nagao, J.; Narita, H. Effects of Pore Sizes on Dissociation Temperatures and Pressures of Methane, Carbon Dioxide, and Propane Hydrates in Porous Media. J. Phys. Chem. B 2002, 106 (4), 820–826. https://doi.org/10.1021/jp012823w.
(82) Tohidi, B.; Anderson, R.; Clennell, M. B.; Burgass, R. W.; Biderkab, A. B. Visual Observation of Gas-Hydrate Formation and Dissociation in Synthetic Porous Media by Means of Glass Micromodels. Geology 2001, 29 (9), 867–870. https://doi.org/10.1130/0091-7613(2001)029<0867:VOOGHF>2.0.CO;2.
(83) Li, S.-L.; Sun, C.-Y.; Liu, B.; Li, Z.-Y.; Chen, G.-J.; Sum, A. K. New Observations and Insights into the Morphology and Growth Kinetics of Hydrate Films. Sci. Rep. 2014, 4, 4129. https://doi.org/10.1038/srep04129.
(84) Li, S.-L.; Sun, C.-Y.; Liu, B.; Feng, X.-J.; Li, F.-G.; Chen, L.-T.; Chen, G.-J. Initial Thickness Measurements and Insights into Crystal Growth of Methane Hydrate Film. AIChE J. 2013, 59 (6), 2145–2154. https://doi.org/10.1002/aic.13987.
(85) Handa, Y. P.; Stupin, D. Yu. Thermodynamic Properties and Dissociation Characteristics of Methane and Propane Hydrates in 70-.ANG.-Radius Silica Gel Pores. J. Phys. Chem. 1992, 96 (21), 8599–8603. https://doi.org/10.1021/j100200a071.
(86) Uchida, T.; Ebinuma, T.; Ishizaki, T. Dissociation Condition Measurements of Methane Hydrate in Confined Small Pores of Porous Glass. J. Phys. Chem. B 1999, 103 (18), 3659–3662. https://doi.org/10.1021/jp984559l.
(87) Yousif, M. H.; Sloan, E. D. Experimental Investigation of Hydrate Formation and Dissociation in Consolidated Porous Media. SPE Reserv. Eng. 1991, 6 (04), 452–458. https://doi.org/10.2118/20172-PA.
(88) Henry, P.; Thomas, M.; Clennell, M. B. Formation of Natural Gas Hydrates in Marine Sediments: 2. Thermodynamic Calculations of Stability Conditions in Porous Sediments. J. Geophys. Res. Solid Earth 1999, 104 (B10), 23005–23022. https://doi.org/10.1029/1999JB900167.
(89) Anderson, R.; Llamedo, M.; Tohidi, B.; Burgass, R. W. Experimental Measurement of Methane and Carbon Dioxide Clathrate Hydrate Equilibria in Mesoporous Silica. J. Phys. Chem. B 2003, 107 (15), 3507–3514. https://doi.org/10.1021/jp0263370.
(90) Smith, D. H.; Wilder, J. W.; Seshadri, K. Methane Hydrate Equilibria in Silica Gels with Broad Pore-Size Distributions. AIChE J. 2002, 48 (2), 393–400. https://doi.org/10.1002/aic.690480222.
(91) Wilder, J. W.; Seshadri, K.; Smith, D. H. Modeling Hydrate Formation in Media with Broad Pore Size Distributions. Langmuir 2001, 17 (21), 6729–6735. https://doi.org/10.1021/la010377y.
(92) Pesaran, A.; Shariati, A. Effect of Capillary Term Parameters on the Thermodynamic Modeling of Methane Hydrate Formation in Porous Media. J. Nat. Gas Sci. Eng. 2013, 14, 192–203. https://doi.org/10.1016/j.jngse.2013.06.003.
(93) Li Tong, W.; K. Tan, M.; Kai Chin, J.; S. Ong, K.; Mun Hung, Y. Coupled Effects of Hydrophobic Layer and Vibration on Thermal Efficiency of Two-Phase Closed Thermosyphons. RSC Adv. 2015, 5 (14), 10332–10340. https://doi.org/10.1039/C4RA14589E.
(94) Ouabbas, Y.; Dodds, J.; Galet, L.; Chamayou, A.; Baron, M. Particle–Particle Coating in a Cyclomix Impact Mixer. Powder Technol. 2009, 189 (2), 245–252. https://doi.org/10.1016/j.powtec.2008.04.031.

124
(95) Parrish, W. R.; Prausnitz, J. M. Dissociation Pressures of Gas Hydrates Formed by Gas Mixtures. Ind. Eng. Chem. Process Des. Dev. 1972, 11 (1), 26–35. https://doi.org/10.1021/i260041a006.
(96) John, V. T.; Holder, G. D. Contribution of Second and Subsequent Water Shells to the Potential Energy of Guest-Host Interactions in Clathrate Hydrates. J. Phys. Chem. 1982, 86 (4), 455–459. https://doi.org/10.1021/j100393a008.
(97) John, V. T.; Papadopoulos, K. D.; Holder, G. D. A Generalized Model for Predicting Equilibrium Conditions for Gas Hydrates. AIChE J. 1985, 31 (2), 252–259. https://doi.org/10.1002/aic.690310212.
(98) Zele, S. R.; Lee, S.-Y.; Holder, G. D. A Theory of Lattice Distortion in Gas Hydrates. J. Phys. Chem. B 1999, 103 (46), 10250–10257. https://doi.org/10.1021/jp9917704.
(99) Sparks, K. A.; Tester, J. W.; Cao, Z.; Trout, B. L. Configurational Properties of Water Clathrates: Monte Carlo and Multidimensional Integration versus the Lennard-Jones and Devonshire Approximation. J. Phys. Chem. B 1999, 103 (30), 6300–6308. https://doi.org/10.1021/jp9903108.
(100) Chase, M. W.; National Institute of Standards and Technology (U.S.). NIST-JANAF Thermochemical Tables; American Chemical Society ; American Institute of Physics for the National Institute of Standards and Technology: Washington, D.C.]; Woodbury, N.Y., 1998.
(101) Lide, D. R. CRC Handbook of Chemistry and Physics: A Ready-Reference Book of Chemical and Physical Data : 1995-1996.; CRC Press: Boca Raton, 1995.
(102) Růržička, K.; Majer, V. Simple and Controlled Extrapolation of Vapor Pressures toward the Triple Point. AIChE J. 1996, 42 (6), 1723–1740. https://doi.org/10.1002/aic.690420624.
(103) Seo, Y.; Lee, H.; Uchida, T. Methane and Carbon Dioxide Hydrate Phase Behavior in Small Porous Silica Gels: Three-Phase Equilibrium Determination and Thermodynamic Modeling. Langmuir 2002, 18 (24), 9164–9170. https://doi.org/10.1021/la0257844.
(104) Tee, L. S.; Gotoh, S.; Stewart, W. E. Molecular Parameters for Normal Fluids. Kihara Potential with Spherical Core. Ind. Eng. Chem. Fundam. 1966, 5 (3), 363–367. https://doi.org/10.1021/i160019a012.
(105) Intermolecular Potential Functions and the Second and Third Virial Coefficients. J. Chem. Phys. 1964, 41 (2), 429–437. https://doi.org/10.1063/1.1725884.
(106) Madden, M. E.; Ulrich, S.; Szymcek, P.; McCallum, S.; Phelps, T. Experimental Formation of Massive Hydrate Deposits from Accumulation of CH4 Gas Bubbles within Synthetic and Natural Sediments. Mar. Pet. Geol. 2009, 26 (3), 369–378. https://doi.org/10.1016/j.marpetgeo.2008.04.002.
(107) Clennell, M. B.; Hovland, M.; Booth, J. S.; Henry, P.; Winters, W. J. Formation of Natural Gas Hydrates in Marine Sediments: 1. Conceptual Model of Gas Hydrate Growth Conditioned by Host Sediment Properties. J. Geophys. Res. Solid Earth 1999, 104 (B10), 22985–23003. https://doi.org/10.1029/1999JB900175.
(108) Koh, C. A.; Sum, A. K.; Sloan, E. D. State of the Art: Natural Gas Hydrates as a Natural Resource. J. Nat. Gas Sci. Eng. 2012, 8, 132–138. https://doi.org/10.1016/j.jngse.2012.01.005.
(109) Minagawa, H.; Nishikawa, Y.; Ikeda, I.; Miyazaki, K.; Takahara, N.; Sakamoto, Y.; Komai, T.; Narita, H. Characterization of Sand Sediment by Pore Size Distribution and Permeability Using Proton Nuclear Magnetic Resonance Measurement. J. Geophys. Res. Solid Earth 2008, 113 (B7). https://doi.org/10.1029/2007JB005403.

125
(110) Zachara, J.; Brantley, S.; Chorover, J.; Ewing, R.; Kerisit, S.; Liu, C.; Perfect, E.; Rother, G.; Stack, A. G. Internal Domains of Natural Porous Media Revealed: Critical Locations for Transport, Storage, and Chemical Reaction. Environ. Sci. Technol. 2016, 50 (6), 2811–2829. https://doi.org/10.1021/acs.est.5b05015.
(111) Gas Hydrates-Not So Unconventional http://www.geoexpro.com/articles/2009/02/gas-hydrates-not-so-unconventional (accessed Nov 10, 2018).
(112) The Outlook for Energy: A View to 2040 http://corporate.exxonmobil.com/en/energy/energy-outlook/2017-highlights/a-view-to-2040 (accessed Mar 17, 2017).
(113) Knott, B. C.; Molinero, V.; Doherty, M. F.; Peters, B. Homogeneous Nucleation of Methane Hydrates: Unrealistic under Realistic Conditions. J. Am. Chem. Soc. 2012, 134 (48), 19544–19547. https://doi.org/10.1021/ja309117d.
(114) Ming, F.; Zhang, Y.; Li, D. Experimental and Theoretical Investigations into the Formation of Ice Lenses in Deformable Porous Media. Geosci. J. 2016, 20 (5), 667–679. https://doi.org/10.1007/s12303-016-0005-1.
(115) Ming, F.; Li, D. Experimental and Theoretical Investigations on Frost Heave in Porous Media https://www.hindawi.com/journals/mpe/2015/198986/ (accessed Mar 26, 2018). https://doi.org/10.1155/2015/198986.
(116) Everett, D. H. The Thermodynamics of Frost Damage to Porous Solids. Trans. Faraday Soc. 1961, 57 (0), 1541–1551. https://doi.org/10.1039/TF9615701541.
(117) Talamucci, F. Freezing Processes in Porous Media: Formation of Ice Lenses, Swelling of the Soil. Math. Comput. Model. 2003, 37 (5), 595–602. https://doi.org/10.1016/S0895-7177(03)00053-0.
(118) Fowler, A.; Krantz, W. A Generalized Secondary Frost Heave Model. SIAM J. Appl. Math. 1994, 54 (6), 1650–1675. https://doi.org/10.1137/S0036139993252554.
(119) Peppin, S.; Majumdar, A.; Style, R.; Sander, G. Frost Heave in Colloidal Soils. SIAM J. Appl. Math. 2011, 71 (5), 1717–1732. https://doi.org/10.1137/100788197.
(120) Jackson, K. A.; Chalmers, B. Freezing of Liquids in Porous Media with Special Reference to Frost Heave in Soils. J. Appl. Phys. 1958, 29 (8), 1178–1181. https://doi.org/10.1063/1.1723397.
(121) Garcia-Bengochea, I.; Altschaeffl, A. G.; Lovell, C. W. Pore Distribution and Permeability of Silty Clays. J. Geotech. Eng. Div. 1979, 105 (7), 839–856.
(122) Kleinberg, R. L.; Griffin, D. D. NMR Measurements of Permafrost: Unfrozen Water Assay, Pore-Scale Distribution of Ice, and Hydraulic Permeability of Sediments. Cold Reg. Sci. Technol. 2005, 42 (1), 63–77. https://doi.org/10.1016/j.coldregions.2004.12.002.
(123) Madden, M. E.; Ulrich, S.; Szymcek, P.; McCallum, S.; Phelps, T. Experimental Formation of Massive Hydrate Deposits from Accumulation of CH4 Gas Bubbles within Synthetic and Natural Sediments. Mar. Pet. Geol. 2009, 26 (3), 369–378. https://doi.org/10.1016/j.marpetgeo.2008.04.002.
(124) Li, S.-L.; Sun, C.-Y.; Liu, B.; Feng, X.-J.; Li, F.-G.; Chen, L.-T.; Chen, G.-J. Initial Thickness Measurements and Insights into Crystal Growth of Methane Hydrate Film. AIChE J. 2013, 59 (6), 2145–2154. https://doi.org/10.1002/aic.13987.
(125) Tohidi, B.; Anderson, R.; Clennell, M. B.; Burgass, R. W.; Biderkab, A. B. Visual Observation of Gas-Hydrate Formation and Dissociation in Synthetic Porous Media by Means of Glass Micromodels. Geology 2001, 29 (9), 867–870. https://doi.org/10.1130/0091-7613(2001)029<0867:VOOGHF>2.0.CO;2.

126
(126) Bi, Y.; Cao, B.; Li, T. Enhanced Heterogeneous Ice Nucleation by Special Surface Geometry. Nat. Commun. 2017, 8, 15372. https://doi.org/10.1038/ncomms15372.
(127) Yan, D.; Zeng, Q.; Xu, S.; Zhang, Q.; Wang, J. Heterogeneous Nucleation on Concave Rough Surfaces: Thermodynamic Analysis and Implications for Nucleation Design. J. Phys. Chem. C 2016, 120 (19), 10368–10380. https://doi.org/10.1021/acs.jpcc.6b01693.
(128) Liang, S.; Kusalik, P. G. Nucleation of Gas Hydrates within Constant Energy Systems. J. Phys. Chem. B 2013, 117 (5), 1403–1410. https://doi.org/10.1021/jp308395x.
(129) Campbell, J. M.; Meldrum, F. C.; Christenson, H. K. Observing the Formation of Ice and Organic Crystals in Active Sites. Proc. Natl. Acad. Sci. 2017, 114 (5), 810–815. https://doi.org/10.1073/pnas.1617717114.
(130) Tobo, Y. An Improved Approach for Measuring Immersion Freezing in Large Droplets over a Wide Temperature Range. Sci. Rep. 2016, 6, 32930. https://doi.org/10.1038/srep32930.
(131) Fukuta, N. Experimental Studies on the Growth of Small Ice Crystals. J. Atmospheric Sci. 1969, 26 (3), 522–531. https://doi.org/10.1175/1520-0469(1969)026<0522:ESOTGO>2.0.CO;2.
(132) Acker, J. P.; Elliott, J. A. W.; McGann, L. E. Intercellular Ice Propagation: Experimental Evidence for Ice Growth through Membrane Pores. Biophys. J. 2001, 81 (3), 1389–1397. https://doi.org/10.1016/S0006-3495(01)75794-3.
(133) Ickes, L.; Welti, A.; Hoose, C.; Lohmann, U. Classical Nucleation Theory of Homogeneous Freezing of Water: Thermodynamic and Kinetic Parameters. Phys. Chem. Chem. Phys. 2015, 17 (8), 5514–5537. https://doi.org/10.1039/C4CP04184D.
(134) Ickes, L.; Welti, A.; Lohmann, U. Classical Nucleation Theory of Immersion Freezing: Sensitivity of Contact Angle Schemes to Thermodynamic and Kinetic Parameters. Atmos Chem Phys 2017, 17 (3), 1713–1739. https://doi.org/10.5194/acp-17-1713-2017.
(135) Hartmann, S.; Niedermeier, D.; Voigtländer, J.; Clauss, T.; Shaw, R. A.; Wex, H.; Kiselev, A.; Stratmann, F. Homogeneous and Heterogeneous Ice Nucleation at LACIS: Operating Principle and Theoretical Studies. Atmos Chem Phys 2011, 11 (4), 1753–1767. https://doi.org/10.5194/acp-11-1753-2011.
(136) Qian, M.; Ma, J. The Characteristics of Heterogeneous Nucleation on Concave Surfaces and Implications for Directed Nucleation or Surface Activity by Surface Nanopatterning. J. Cryst. Growth 2012, 355 (1), 73–77. https://doi.org/10.1016/j.jcrysgro.2012.06.031.
(137) Qian, M.; Ma, J. Heterogeneous Nucleation on Convex Spherical Substrate Surfaces: A Rigorous Thermodynamic Formulation of Fletcher’s Classical Model and the New Perspectives Derived. J. Chem. Phys. 2009, 130 (21), 214709. https://doi.org/10.1063/1.3146810.
(138) Volmer M. Über Keimbildung Und Keimwirkung Als Spezialfälle Der Heterogenen Katalyse. Z. Für Elektrochem. Angew. Phys. Chem. 2014, 35 (9), 555–561. https://doi.org/10.1002/bbpc.192900026.
(139) Fletcher, N. H. Size Effect in Heterogeneous Nucleation. J. Chem. Phys. 1958, 29 (3), 572–576. https://doi.org/10.1063/1.1744540.
(140) Clathrate Hydrates of Natural Gases, Third Edition https://www.crcpress.com/Clathrate-Hydrates-of-Natural-Gases-Third-Edition/Sloan-Jr-Koh/9780849390784 (accessed Apr 17, 2016).
(141) Pasieka, J.; Coulombe, S.; Servio, P. The Effect of Hydrophilic and Hydrophobic Multi-Wall Carbon Nanotubes on Methane Dissolution Rates in Water at Three Phase

127
Equilibrium (V-L-w-H) Conditions. Ind. Eng. Chem. Res. 2014, 53 (37), 14519–14525. https://doi.org/10.1021/ie502457c.
(142) Li, S.-L.; Sun, C.-Y.; Liu, B.; Li, Z.-Y.; Chen, G.-J.; Sum, A. K. New Observations and Insights into the Morphology and Growth Kinetics of Hydrate Films. Sci. Rep. 2014, 4 (1), 1–6. https://doi.org/10.1038/srep04129.
(143) Kashchiev, D.; Firoozabadi, A. Nucleation of Gas Hydrates. J. Cryst. Growth 2002, 243 (3), 476–489. https://doi.org/10.1016/S0022-0248(02)01576-2.
(144) May, E. F.; Lim, V. W.; Metaxas, P. J.; Du, J.; Stanwix, P. L.; Rowland, D.; Johns, M. L.; Haandrikman, G.; Crosby, D.; Aman, Z. M. Gas Hydrate Formation Probability Distributions: The Effect of Shear and Comparisons with Nucleation Theory. Langmuir 2018, 34 (10), 3186–3196. https://doi.org/10.1021/acs.langmuir.7b03901.
(145) DeFever, R. S.; Sarupria, S. Surface Chemistry Effects on Heterogeneous Clathrate Hydrate Nucleation: A Molecular Dynamics Study. J. Chem. Thermodyn. 2018, 117, 205–213. https://doi.org/10.1016/j.jct.2017.08.021.
(146) Lim, V. W. S.; Metaxas, P. J.; Zhen, J.; Stanwix, P. L.; Johns, M. L.; Aman, Z. M.; May, E. F. Subcooling and Induction Time Measurements of Probabilistic Hydrate Formation. In Offshore Technology Conference Asia 2018, OTCA 2018; Offshore Technology Conference, 2018.
(147) Handa, Y. P. Compositions, Enthalpies of Dissociation, and Heat Capacities in the Range 85 to 270 K for Clathrate Hydrates of Methane, Ethane, and Propane, and Enthalpy of Dissociation of Isobutane Hydrate, as Determined by a Heat-Flow Calorimeter. J. Chem. Thermodyn. 1986, 18 (10), 915–921. https://doi.org/10.1016/0021-9614(86)90149-7.
(148) Chaouachi, M.; Falenty, A.; Sell, K.; Enzmann, F.; Kersten, M.; Haberthür, D.; Kuhs, W. F. Microstructural Evolution of Gas Hydrates in Sedimentary Matrices Observed with Synchrotron X-Ray Computed Tomographic Microscopy. Geochem. Geophys. Geosystems 2015, 16 (6), 1711–1722. https://doi.org/10.1002/2015GC005811.


![Predicting the Coefficients of the Daubert and Danner ... · -liquid equilibrium data for3 neural network [2]. Lashkarbolooki et al. also studied the phase equilibrium for prediction](https://static.fdocuments.net/doc/165x107/60b4a72d7ec9236416285b32/predicting-the-coefficients-of-the-daubert-and-danner-liquid-equilibrium-data.jpg)