Predicting rut depth induced by an 8-wheeled …...RESEARCH PAPER Predicting rut depth induced by an...
10
RESEARCH PAPER Predicting rut depth induced by an 8-wheeled forwarder in fine-grained boreal forest soils Jori Uusitalo 1 & Jari Ala-Ilomäki 2 & Harri Lindeman 1 & Jenny Toivio 3 & Matti Siren 2 Received: 4 June 2019 /Accepted: 26 March 2020 # The Author(s) 2020 Abstract & Key message Rut depth in fine-grained boreal soils induced by an 8-wheeled forwarder is best predicted with soil moisture content, cumulative mass of machine passes, bulk density and thickness of the humus layer. & Context Forest machines are today very heavy and will cause serious damage to soil and prevent future growth if forest operations are carried out at the wrong time of the year. Forest operations performed during the wettest season should therefore be directed at coarse-grained soils that are not as prone to soil damage. & Aims The study aimed at investigating the significance of the most important soil characteristics on rutting and developing models that can be utilized in predicting rutting prior to forest operations. & Methods A set of wheeling tests on two fine-grained mineral soil stands in Southern Finland were performed. The wheeling experiments were conducted in three different periods of autumn in order to get the largest possible variation in moisture content. The test drives were carried out with an 8-wheeled forwarder. & Results Soil moisture content is the most important factor affecting rut depth. Rut depth of an 8-wheeled forwarder in fine- grained boreal soil is best predicted with soil moisture content, cumulative mass of machine passes, bulk density and thickness of the humus layer. & Conclusion The results emphasize the importance of moisture content on the risk of rutting in fine-grained mineral soils, especially with high moisture content values when soil saturation reaches 80%. The results indicate that it is of high importance that soil type and soil wetness can be predicted prior to forest operations. Keywords Bearing capacity . Trafficability . Compaction 1 Introduction Forest machines are today rather heavy, typically from 20 to 40 t, and may cause significant soil deformation if forest operations are not well planned. When the loading induced by the vehicle exceeds the bearing capacity of the soil, the soil begins to compact and deform. Exceeding the bearing capac- ity of soil leads to rutting and deformation, where soil particles Handling Editor: Céline Meredieu Contribution of the co-authors All authors participated in planning and collection of the material. Data analyses and writing of the paper was chiefly conducted by the first author (Jori UUSITALO). All authors participated in finalizing the paper. * Jori Uusitalo [email protected] Jari Ala-Ilomäki [email protected] Harri Lindeman [email protected] Jenny Toivio [email protected] Matti Siren [email protected] 1 Natural Resources Institute Finland (Luke), Production Systems, Korkeakoulunkatu 7, 33720 Tampere, Finland 2 Natural Resources Institute Finland (Luke), Production Systems, Maarintie 6, 02150 Espoo, Finland 3 Department of Forest Sciences, University of Helsinki, P.O. Box 27, FI-00014 Helsinki, Finland https://doi.org/10.1007/s13595-020-00948-y / Published online: 20 April 2020 Annals of Forest Science (2020) 77: 42
Transcript of Predicting rut depth induced by an 8-wheeled …...RESEARCH PAPER Predicting rut depth induced by an...

RESEARCH PAPER
Predicting rut depth induced by an 8-wheeled forwarderin fine-grained boreal forest soils
Jori Uusitalo1& Jari Ala-Ilomäki2 & Harri Lindeman1
& Jenny Toivio3& Matti Siren2
Received: 4 June 2019 /Accepted: 26 March 2020# The Author(s) 2020
Abstract& Key message Rut depth in fine-grained boreal soils induced by an 8-wheeled forwarder is best predicted with soilmoisture content, cumulative mass of machine passes, bulk density and thickness of the humus layer.& Context Forest machines are today very heavy and will cause serious damage to soil and prevent future growth if forestoperations are carried out at the wrong time of the year. Forest operations performed during the wettest season should thereforebe directed at coarse-grained soils that are not as prone to soil damage.& Aims The study aimed at investigating the significance of the most important soil characteristics on rutting and developingmodels that can be utilized in predicting rutting prior to forest operations.& Methods A set of wheeling tests on two fine-grained mineral soil stands in Southern Finland were performed. The wheelingexperiments were conducted in three different periods of autumn in order to get the largest possible variation in moisture content.The test drives were carried out with an 8-wheeled forwarder.& Results Soil moisture content is the most important factor affecting rut depth. Rut depth of an 8-wheeled forwarder in fine-grained boreal soil is best predicted with soil moisture content, cumulative mass of machine passes, bulk density and thickness ofthe humus layer.& Conclusion The results emphasize the importance of moisture content on the risk of rutting in fine-grained mineral soils,especially with high moisture content values when soil saturation reaches 80%. The results indicate that it is of high importancethat soil type and soil wetness can be predicted prior to forest operations.
Keywords Bearing capacity . Trafficability . Compaction
1 Introduction
Forest machines are today rather heavy, typically from 20 to40 t, and may cause significant soil deformation if forest
operations are not well planned. When the loading inducedby the vehicle exceeds the bearing capacity of the soil, the soilbegins to compact and deform. Exceeding the bearing capac-ity of soil leads to rutting and deformation, where soil particles
Handling Editor: Céline Meredieu
Contribution of the co-authors All authors participated in planning andcollection of the material. Data analyses and writing of the paper waschiefly conducted by the first author (Jori UUSITALO). All authorsparticipated in finalizing the paper.
* Jori [email protected]
Jari Ala-Ilomä[email protected]
Harri [email protected]
Jenny [email protected]
Matti [email protected]
1 Natural Resources Institute Finland (Luke), Production Systems,Korkeakoulunkatu 7, 33720 Tampere, Finland
2 Natural Resources Institute Finland (Luke), Production Systems,Maarintie 6, 02150 Espoo, Finland
3 Department of Forest Sciences, University of Helsinki, P.O. Box 27,FI-00014 Helsinki, Finland
https://doi.org/10.1007/s13595-020-00948-y
/ Published online: 20 April 2020
Annals of Forest Science (2020) 77: 42

are displaced in both vertical and horizontal directions.Usually, soil deformation occurring during timber harvestingincludes both elements of compaction and rutting. The bottomof ruts is the most probably compacted and displacement ofsoil particles in the lateral direction creates bulges at the edgesof the ruts (Haas et al. 2016; Toivio et al. 2017; Marra et al.2018).
Both rutting and compaction are harmful to future forestgrowth. Soil compaction implies limitations in oxygen andwater supply to soil microorganisms and plants, and with neg-ative consequences for soil respiration, microbiological activ-ity and forest growth. Soil compaction is expressed typicallydirectly with the increase of bulk density (BD), the decrease ofsoil porosity or indirectly with the increase of penetration re-sistance (PR). Rutting, instead, provides sinks for small pud-dles that may completely prevent the activity of roots andaerobic microorganism.Water has difficulties to percolate intothe soil if the bottom of the rut is compacted. In addition to thisbiological harm, rutting may to a great extent be considered asone of the most important aesthetic problems caused by forestoperations.
The magnitude of soil deformation predominantly desig-nates how serious are the problems it causes. Kozlowski(1999) stated that the upper limits of BD at which roots donot penetrate wet soils vary from about 1.4 to 1.6 g cm−3 forfine-textured soils to 1.75 g cm−3 for coarser-textured soils.Rut depths of 10 cm are generally considered as the break-even point for the acceptable level of ruts (SuomenMetsäkeskus 2019). In most soft wet soils, forest machinesmay cause almost 40 cm deep ruts (Uusitalo and Ala-Ilomäki2013; Allman et al. 2017; Toivio et al. 2017). Ruts are chieflycategorized by rut depth, but the magnitude of rut damagemay also be expressed by rut width (Edlund et al. 2012;Uusitalo et al. 2015), or a combination of rut depth and width(Liu et al. 2010). Haas et al. (2016) and Marra et al. (2018)have presented a methodology where volume of bulges andruts can be measured with photogrammetry.
There are plenty of factors that affect the magnitude ofrutting. These may be divided into three categories: soil prop-erties, operational factors and technical factors. In mineralsoils, moisture content may be regarded as the most importantfactor affecting soil bearing capacity (Han et al. 2006; Vega-Nieva et al. 2009) since increase in wetness weakens the phys-ical bonds between the soil particles. Soil strength is alsoknown to be affected by the average particle size (Freitag1987; Smith et al. 1997). Obviously, moisture content andgrain size distribution are strongly correlated; coarse-grainedsoils cannot hold high moisture contents (Karafiath andNowatski 1978). The organic matter content in the soil hasalso been shown to affect the strength of the soil (Smith et al.1997). Mineral soils in boreal forests usually contain an or-ganic topsoil layer, the strength of which is distinctly belowthat of mineral soil.
Operational factors may also have a crucial role in soildeformation. Successful timing of the operation is the keyelement in avoiding significant soil disturbance; moisture sen-sitive soils should be harvested during dry or frozen periods.At harvest, logging trail networks should be carefully plannedby directing main routes to the areas withstanding the heaviestload, minimizing the number of passes on trails with lowbearing capacity or by widening trail width by steering thetires not to follow exactly the same track in every pass(Uusitalo et al. 2015). Rutting can also be minimized by pro-cessing the trees above the trail leading to formulation ofprotective brash mat (Murphy et al. 2009; Poltorak et al.2018; Labelle et al. 2019). Technical factors that decrease soildamage include total mass of a machine (Ampoorter et al.2010; Liu et al. 2010), tire dimensions (Haas et al. 2016), tirepressures (Eliasson 2005), tracks (Bygdén et al. 2003; Sakaiet al. 2008; Haas et al. 2016), steering and transmission system(Edlund et al. 2012), distribution of vertical stress induced bytires or tracks (Vossbrink and Horn 2004; Horn et al. 2007)and traffic intensity (Ampoorter et al. 2010).
Although the phenomenon of rutting has been largely stud-ied, fairly few studies have reported practical modelspredicting the magnitude of rutting (i.e. rut depths) in a forestenvironment. Modelling of ruts may in principal be construct-ed by two different methods. Firstly, we can construct simplemachine-dependent empirical models for predicting ruttingcaused by a typical forest machine which means that the mod-el is valid only for machines having similar tire size, tirepressure and load carried out. Sirén et al. (2013) investigatedrut formation in Norway spruce dominated forests and noticedthat in rather dry mineral soils rut depths were affected bycumulative mass hauled over the measurement point, thick-ness of the logging residue mat and soil stoniness. In finegrained mineral soils, rut depths can be predicted with cumu-lative mass, volumetric water content (VWC) and PR (Sirénet al. 2019b). Uusitalo and Ala-Ilomäki (2013) reported thatruts in pine bogs may best be predicted by a model includingthe volume of trees, shear modulus, machine type and numberof passes as the main predictors. Allman et al. (2017) haveshown that rut depth on mineral forest soils can be predictedby moisture content.
Secondly, machine-independent models can be construct-ed. Rut prediction can be estimated with two empirical modelstructures; with soil properties—soil strength (PR) relation-ship and with empirical formulas describing the interactionbetween soil and wheel, such as the WES methodology. Themethodology is based on empirically created, non-dimensional wheel numerics which relate the measured PRto the load carried out by the tire and various principal tiredimensions (Turnage 1984). Vega-Nieva et al. (2009) appliedthe WES method with the formulas and empirical parameterssuggested in the ECOWOOD project (Saarilahti 2002) andfound out that the models produce reliable results.
42 Page 2 of 10 Annals of Forest Science (2020) 77: 42
Many previous investigations have stressed the importanceof moisture as the main factor of soil strength, especially infine-grained soils (Ayers and Perumpral 1982; Elbanna andWitney 1987; Smith et al. 1997; Uusitalo et al. 2019).Moisture content of soil varies significantly by season andweather conditions which mean that soil strength is also high-ly variable. As much as 80–90% of the commercial loggingoperations in the Nordic countries are carried out with verysimilar forest machines having eight 700 mm wide tires, it istherefore practical to investigate the direct relation betweensoil properties, traffic intensity and rutting caused by thesevehicles.
The study aimed at exploring the most important charac-teristics in predicting rutting and to developing suitablemodels for predicting rutting on fine-grained mineral soilscaused by the most typical forest machine used in these con-ditions. The model to be developed should be simple andadequate for practical use in forestry. We had a hypothesis thatin fine-grained soils, soil moisture content has a very impor-tant role. Therefore, we decided to arrange wheeling experi-ments on the same fine-grained forest area in three differentperiods of the year.
2 Materials and methods
Field studies were conducted on a test site that comprised twoseparate test blocks, A and B, located in the municipality ofVihti in Southern Finland. Block A (60° 24.6 N, 24° 23.2 E,around 60 m above sea level) was an even-aged Norwayspruce (Picea abies (L.) Karst) stand on a silty-clayey soilwith a shallow (1–5 cm) humus horizon. The relief was aneven slope with a minor inclination to the northwest. The soilwas prepared by ploughing before planting approx. 30 yearsago. Block B (60° 24.4 N, 24° 22.4 E, around 70 m above sealevel) was a forest of natural origin with different tree speciesand age classes. The stand was mostly Norway spruce domi-nated with a mixture of birch (Betula pendula Roth) and aspen(Populus tremula L.). It was located in a dell and characterisedby a silty-sandy soil with a variable thickness (5–20 cm) oforganic layer with a shallow peat layer in moist patches.
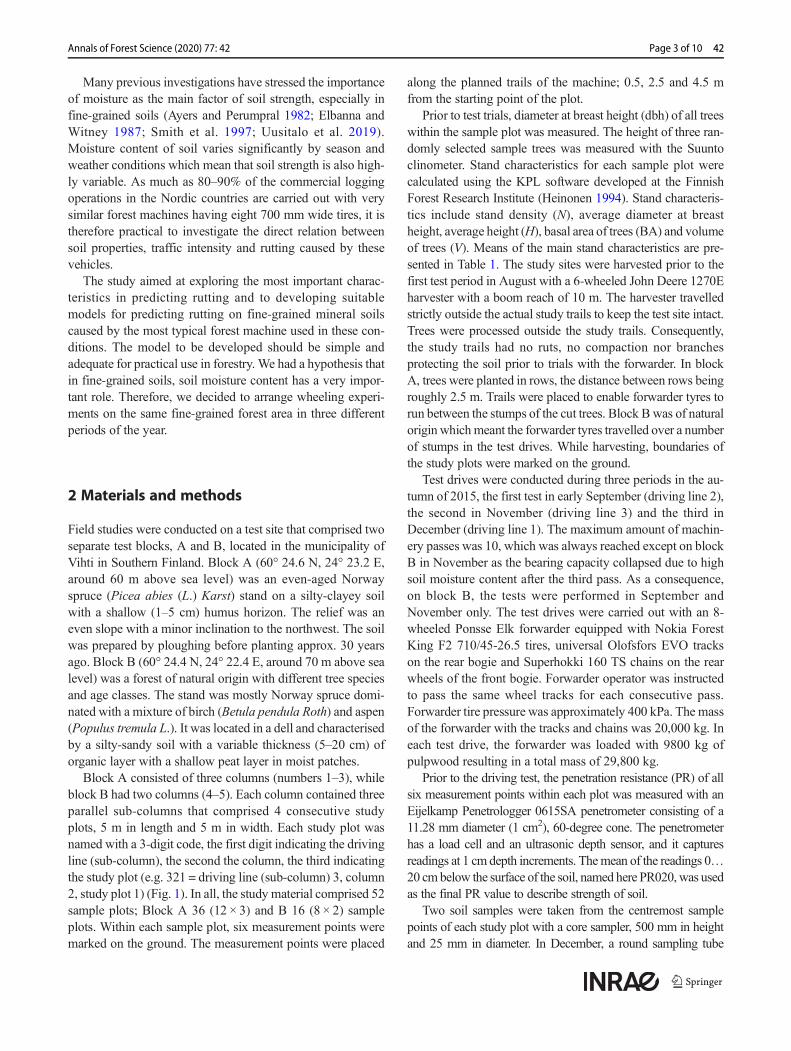
Block A consisted of three columns (numbers 1–3), whileblock B had two columns (4–5). Each column contained threeparallel sub-columns that comprised 4 consecutive studyplots, 5 m in length and 5 m in width. Each study plot wasnamed with a 3-digit code, the first digit indicating the drivingline (sub-column), the second the column, the third indicatingthe study plot (e.g. 321 = driving line (sub-column) 3, column2, study plot 1) (Fig. 1). In all, the study material comprised 52sample plots; Block A 36 (12 × 3) and B 16 (8 × 2) sampleplots. Within each sample plot, six measurement points weremarked on the ground. The measurement points were placed
along the planned trails of the machine; 0.5, 2.5 and 4.5 mfrom the starting point of the plot.
Prior to test trials, diameter at breast height (dbh) of all treeswithin the sample plot was measured. The height of three ran-domly selected sample trees was measured with the Suuntoclinometer. Stand characteristics for each sample plot werecalculated using the KPL software developed at the FinnishForest Research Institute (Heinonen 1994). Stand characteris-tics include stand density (N), average diameter at breastheight, average height (H), basal area of trees (BA) and volumeof trees (V). Means of the main stand characteristics are pre-sented in Table 1. The study sites were harvested prior to thefirst test period in August with a 6-wheeled John Deere 1270Eharvester with a boom reach of 10 m. The harvester travelledstrictly outside the actual study trails to keep the test site intact.Trees were processed outside the study trails. Consequently,the study trails had no ruts, no compaction nor branchesprotecting the soil prior to trials with the forwarder. In blockA, trees were planted in rows, the distance between rows beingroughly 2.5 m. Trails were placed to enable forwarder tyres torun between the stumps of the cut trees. Block B was of naturalorigin whichmeant the forwarder tyres travelled over a numberof stumps in the test drives. While harvesting, boundaries ofthe study plots were marked on the ground.
Test drives were conducted during three periods in the au-tumn of 2015, the first test in early September (driving line 2),the second in November (driving line 3) and the third inDecember (driving line 1). The maximum amount of machin-ery passes was 10, which was always reached except on blockB in November as the bearing capacity collapsed due to highsoil moisture content after the third pass. As a consequence,on block B, the tests were performed in September andNovember only. The test drives were carried out with an 8-wheeled Ponsse Elk forwarder equipped with Nokia ForestKing F2 710/45-26.5 tires, universal Olofsfors EVO trackson the rear bogie and Superhokki 160 TS chains on the rearwheels of the front bogie. Forwarder operator was instructedto pass the same wheel tracks for each consecutive pass.Forwarder tire pressure was approximately 400 kPa. The massof the forwarder with the tracks and chains was 20,000 kg. Ineach test drive, the forwarder was loaded with 9800 kg ofpulpwood resulting in a total mass of 29,800 kg.
Prior to the driving test, the penetration resistance (PR) of allsix measurement points within each plot was measured with anEijelkamp Penetrologger 0615SA penetrometer consisting of a11.28 mm diameter (1 cm2), 60-degree cone. The penetrometerhas a load cell and an ultrasonic depth sensor, and it capturesreadings at 1 cm depth increments. Themean of the readings 0…20 cmbelow the surface of the soil, named here PR020,was usedas the final PR value to describe strength of soil.
Two soil samples were taken from the centremost samplepoints of each study plot with a core sampler, 500 mm in heightand 25 mm in diameter. In December, a round sampling tube
Page 3 of 10 42Annals of Forest Science (2020) 77: 42

with a diameter of 46mmwas used. The soil core extracted fromthe soil was divided into three sections, an organic layer and twomineral soil subsamples 10 cm in length, the first starting fromthe upper boundary of the mineral soil. The thickness of theorganic layer was measured in the field while the bulk density(BD), volumetric water content (VWC), soil organic matter(SOM) and grain size distribution were later analysed in thelaboratory, separately for the upper (0–10 cm) and lower (10–20 cm) section of the inorganic part of the core sample.
The mineral soil samples were analysed in the laboratorywith standard laboratory procedures for bulk density, watercontent and grain size distribution. Since the initial analysesshowed that the upper soil samples are clearly more significantfrom a bearing capacity point of view than the lower samples,the final analyses focused only on the upper soil samples.Hence, the variables BD, VWC, SOM and contents of eachgrain size class refer to values derived from the upper soilsample (0–10 cm from the top of the mineral soil).Characteristics of the test soils in terms of grain size distribu-tion and SOM are shown in Table 2.
After each test run, the depth of the ruts caused by the for-warder at each measurement point was measured with a hori-zontal laser levelling device and a laser levelling rod equippedwith a laser beam detector. The device was first placed at arandom location along the trail to obtain a reference height,which was then marked on the surface of a nearby tree.Sample lines across the trails were marked to the ground inorder to keep measuring point locations constant. The groundlevel reference level outside the wheel ruts was first measuredon the left and the right of the wheel rut centre. The laserlevelling rod used for measuring the height was pushed lightlyagainst the ground to compact any loose surface layer
Fig. 1 Layout of the block–column–sub-column sample plot design on the Vihti site
Table 1 Mean of the main stand characteristic by columns for the twostudied stands (block A and B)
Column BA (m2/ha) DBH (cm) Stand volume (m3/ha)
1 37 14.6 307
2 32 13.6 256
3 28 13.5 222
Block A mean 32 13.9 262
4 32 20.8 341
5 26 20.4 257
Block B mean 29 20.6 299
BA basal area, DBH diameter at breast height (1.3 m)
42 Page 4 of 10 Annals of Forest Science (2020) 77: 42

vegetation, and the distance to the reference mark was calculat-ed by reading the level of the laser beam detector attached to thesurface of the laser levelling rod. The depth of both wheel rutswas measured by placing the laser levelling rod at the bottom ofthe rut, reading the relative height of the bottom and calculatingthe depth of the ruts by comparing these values to the closestground reference level. The total over-drivenmass for each pass(mass) was calculated by summing up the mass of the loadedforwarder (29,800 kg) for each time it passes the sample plot.
Modelling the relationship between rut depths and the mostimportant predictors was executed using the IBM SPSS v.25software following the MIXED procedure and applying therestricted maximum likelihood (REML) estimation method.For repeated measurements of rut depths, let k denotes thenumber of the machine pass and j denotes sample plot withincolumn i. The basic form of the mixed model predicting PRcharacteristics was as follows:
Rutijk ¼ b0 þ b X þ ui þ vij þ yijk ð1Þ
where Rutijk is the dependent variable for Rut, b0 is the con-stant, b (row) is the vector of the (fixed) regression coeffi-cients, X (column) is the vector of the continuous and binaryexplanatory variables, ui is the random term (variance) forblock i, vij is the random term (variance) for sample plot j inblock i, and yijk is the auto-regressive error term for repeatedmeasurements ijk.
In order to account for correlation for repeated measure-ments of the same measurement point, residual effect wasmodelled with first order auto-regressive AR (1) covariancestructure meaning that successive measurements are more cor-related, with correlation coefficient ρmeas and variance σ2
meas.The fit of the models was compared by using the AkaikeInformation Criterion (AIC). It was noticed that the relation-ships between the dependent and the most important predic-tors are not linear. Initial examination of the data showedclearly that rut depth increased exponentially with highVWC values, especially when VWC reached 45% where soilmay be regarded as almost fully saturated. Therefore, suitabletransformations to the predictors were made prior to analyses.
3 Results
Means of themain soil properties by subcolumns are presented inTable 3. As expected, VWC increased from September (drivingline 2) to November (driving line 3) markedly, but only slightlyfrom November to December (driving line 1) (Table 3). Thethickness of humus layer varied 2.5–11.5 cm and PR0200.841–2.134 kPa. The correlation matrix of the most importantsoil characteristics is presented in Table 4. Clay content, BD,SOM and VWC are significantly correlated with each other.Penetration resistance is only correlated with VWC.
The thickness of the humus layer and VWC has the greatestinfluence on the rut depths. The role of VWC seems to becrucial, especially with high VWC values. Rut depths of thefirst three machine passes by the number of pass and VWC areshown in Fig. 2. Mean of rut depths stays below 10 cm withlow VWC values. The relationship between VWC and rutdepth is rather linear until a VVW of roughly 45%, i.e. thesoil, is almost or completely saturated. After that the risk of thebearing capacity of soil collapsing increases exponentially.The high variation of rut depths with high VWC values canpartly be explained by the role stumps and roots of trees thatincrease variation of dynamic loads induced by wheels.
The best models for predicting rut depth based on moisturecontent as the main predictor are presented in Table 5. RaisingVWC to the third power yielded the best results in explaining rutdepth. In addition, the cumulative mass of machine passes, BDand the thickness of the humus layer were also found to besignificant predictors in the model, which already containedVWC3 as the main predictor (model 1). Tree stock included arather small variation (Table 1). It is therefore no wonder that treecharacteristics were not found to be significant in modelling rutdepths.
The behaviour of model 1 is illustrated in Fig. 3 a and bwith two different soil types. The first soil (Fig. 3a) representsfine-grained soil with high BD (1.3 g cm−3) and thin humuslayer (4 cm) and the other one (Fig. 3b) fine-grained soil withlow BD (0.7 g cm−3) and thick humus layer (12 cm). Rutdepth was also modelled with a structure where PR was setas the main predictor (model 3). Including the thickness of the
Table 2 Means of proportion of grain sizes of the inorganic component of soil samples (the first 10 cm from the starting point of the mineral soil) bycolumns. N = 52
Columns Clay(< 0.002 mm)
FSi/MSi (0.002–0.02 mm) CSi (0.02–0.063 mm) FSa (0.063–0.2 mm) MSa (0.2–0.63 mm) CSa (0.63-2 mm) SOM
1 50.7 30.3 8.1 6.7 3.6 0.7 9.7
2 51.6 26.6 5.9 8.3 6.3 1.4 9.4
3 44.7 30.6 5.3 6.5 9.2 3.7 8.5
4 25.6 7.6 4.6 32.8 20.3 9.1 8.2
5 35.8 8.9 2.9 20.9 21.6 9.9 7.6
FSi fine silt,MSimedium silt,CSi coarse silt, FSa fine sand,MSamedium sand,CSa coarse sand, SOM soil organic matter (% of the total mass of dry soil)
Page 5 of 10 42Annals of Forest Science (2020) 77: 42

humus layer in the model slightly improved the fit of themodel (model 4). Including both PR and VVW as predictorsin the same model is not wise since they are so stronglycorrelated.
4 Discussion
Wheeling tests were executed in identical soil at three differentpoints of time during the autumn in order to find out the effectof soil moisture on rutting. As expected, soil moisture contentmay be regarded as the most important factor in predicting
rutting of forest machines in fine-grained mineral soils. Thefindings are in line with the previous findings that have fo-cused either on moisture content—soil strength relationship(Ayers and Perumpral 1982; Elbanna and Witney 1987;Smith et al. 1997; Uusitalo et al. 2019) or moisturecontent—soil disturbance relationship (Cambi et al. 2016;Allman et al. 2017; Sirén et al. 2019a, b).
In distinction to previous findings, we stress the radicalchanges of bearing capacity with high moisture contentvalues. It seems that moisture content bearing capacity rela-tionship is almost linear from dry to almost saturated soil andafter that the bearing capacity of the soil collapses in manycases. In our data, the radical changes in the bearing capacityoccurred at VWC values of roughly 45%. This corresponds tosaturation of roughly 80%. This phenomenon can be ex-plained by significant changed in the cohesive forces betweenthe soil particles when complete or almost complete saturationhas been achieved. We modelled the relationship between rutdepth and moisture content by raising VWC to third power.
In addition to soil moisture content, the cumulative mass ofthe machine passes has a significant effect on the rut depth. Inthe final model, the cumulative mass of machine passes wastransformed to a logarithmic scale. It corresponds to the effectof the number of passes on rut depths, where the effect of thefirst pass is the greatest and increase in rut depth after theconsecutive passes diminishes to zero. This is a very well-known phenomenon presented and modelled in numerousstudies (e.g. Abebe et al. 1989).
BD and the thickness of the humus layer were alsofound to be significant predictors of rutting. The meanof BD in the sample plots varied between 0.75 to
Table 3 Means of volumetricwater content (VWC), bulkdensity (BD), mean penetrationresistance 0–20 cm below thesurface of the soil (PR020) andthickness of humus layer (humuslayer) by sub-columns. Eachsubcolumn includes 4 samples
Driving line Sub-column VWC (%) BD (g/cm3) PR020 (kPa) Humus layer (cm)
1 11 40.9 1.05 0.920 2.5
12 40.4 1.10 0.951 3.6
13 40.2 1.05 1.050 4.2
Mean 40.5 1.07 0.974 3.4
2 21 25.5 0.82 1.585 3.5
22 21.5 0.75 1.562 2.8
23 24.9 0.92 2.137 4.4
24 36.3 1.11 1.251 5.1
25 37.9 1.26 1.132 10.4
Mean 29.2 0.97 1.533 5.2
3 31 36.4 0.88 0.987 2.6
32 33.1 0.80 0.841 3.1
33 39.2 1.00 1.209 2.9
34 48.5 1.21 0.861 8.9
35 47.8 1.23 1.055 11.4
Mean 38.5 0.96 1.002 4.3
Mean 35.1 0.99 1.221 4.5
Table 4 Pearson correlation coefficients and their significances (Pvalue) between the main soil characteristics. N = 52. “Double asterisks”indicate that correlation is significant at the 0.01 level. Abbreviations areas follows:
PR020 BD VWC Clay SOM
PR020 1 − 0.268 − 0.536** 0.013 0.010
0.054 0.000 0.924 0.945
BD 1 0.700** − 0.616** − 0.673**
0.000 0.000 0.000
VWC 1 − 0.397** − 0.457**
0.004 0.001
Clay 1 0.631**
0.000
SOM 1
PR020mean penetration resistance 0–20 cm below the surface of the soil,VWC volumetric water content, BD bulk density (g/cm3 ), Clay propor-tion of clay (< 0.002 mm) in the inorganic matter (%), SOM soil organicmatter (% of the total mass of soil)
42 Page 6 of 10 Annals of Forest Science (2020) 77: 42

1.26 g cm−3 which is consistent with previous findings inboreal soils (Périé and Ouimet 2011; Sirén et al. 2019b).It is not a surprise that BD of the mineral soil layer iscorrelated to bearing capacity, since the relationship be-tween BD and soil strength (in terms of PR) has beenreported by numerous researchers (Ayers and Perumpral1982; Elbanna and Witney 1987; Smith et al. 1997;Uusitalo et al. 2019). The well-known negative correla-tion between BD and SOM (e.g. Heiskanen et al. 2018)was also found in our data set.
The thickness of the humus layer in the sample plots variedbetween 2.5 and 11.4 cm, the mean being 4.5 cm which is inline with the findings of a large data set from Finland(Westman 1990). The strength of the organic layer is knownto be rather weak. PR of the organic soil is known to varybetween 300 and 600 kPa (Uusitalo and Ala-Ilomäki 2013)which means that after two to three machine passes, the or-ganic layer has been displaced horizontally or compactedagainst the mineral soil. It is therefore no surprise that thethickness of the humus layer was found to be a significant
Table 5 Mixed linear models predicting rut depth (cm). The parameters are as follows:
Model parameter 1 2 3 4
Estimate (SE) Sig. Estimate (SE) Sig. Estimate (SE) Sig. Estimate (SE) Sig.
Fixed
Intercept − 35.3 (3.43) .000 − 39.9 (2.30) .000 − 32.4 (2.59) .000 − 37.3 (2.41) .000
Ln Mass, kg 3.86 (0.183) .000 3.86 (0.183) .000 3.86 (0.183) .000 3.86 (0.183) .000
VWC3, % 0.0000917 (0.0000166) .001 0.0000431 (0.0000145) .005
PR020 − 1.02 (0.536) .059 − 0.978 (0.525) .064
BD, g/cm3 − 5.76 (3.16) .075 .000
Humus layer, cm 1.11 (0.172) .000 0.681 (0.169) .001 0.883 (0.166) .000
Random
ui 0.909 .535 0.795 .538 10.1 .211 1.24 .472
vij 6.54 .000 6.99 .000 10.2 .000 7.84 .000
σ2meas 16.3 .000 16.3 .000 16.3 .000 16.3 .000
ρmeas 0.707 .000 0.707 .000 0.707 .000 0.707 .000
AIC 6220.7 6228.1 6227.7 6211.8
Ln Mass natural logarithmic of the cumulative mass of machine passes, VWC3 volumetric water content raised to the third power, PR020 meanpenetration resistance 0–20 cm below the surface of the soil, BD bulk density of the soil, Humus layer thickness of the humus layer, AIC AkaikeInformation Criterion
Fig. 2 Rut depths of the first threemachine passes by VWC in thesoil
Page 7 of 10 42Annals of Forest Science (2020) 77: 42

predictor of rut depth. Recently, it has been shown that thethickness of the humus layer is well correlated with the type ofvegetation coverage and clay content (Heiskanen et al. 2018).It means that the thickness of the humus layer may, to a certainextent, be estimated with topographical and remote sensingdata.
The thickness of the humus layer has a crucial role in forma-tion of the rut depth, especially with regard to the first pass of themachine. In the second and consecutive passes, the characteris-tics of the inorganic layer play themajor role. The greater amountof water the soil can hold the more plastic the soil gets. In ourexperiments, the deepest ruts formed in the plots that were situ-ated in a dell characterized by a silty-sandy soil. The plots situ-ated on a slope had a higher consistency of clay, but the soil didnot reach saturation point even during the most humid season ofthe year. This can be explained by the low water permeability offat clay soils (Karafiath and Nowatski 1978).
In addition to the model structure based on the moisturecontent, rut depth can also be estimated with the model struc-ture where PR is set as the main predictor. Including bothVWC and PR in the model, predicting rutting is not very wisesince these variables are strongly correlated. PR as a predictorhas its strengths and weaknesses. PR treats the soil types in-dependently, not taking into account whether the soil is inor-ganic or organic. A low PR inevitably leads to deep ruts. Theweak point of PR information is that the moisture content hasa different bearing with strength in organic and inorganic soils.Therefore, if the moisture content of soil changes, one shouldknow the thickness of the humus layer and PR for the humuslayer and inorganic layer separately in order to adjust the PRresults to the updated moisture content.
Variation of rut depth with low PR values was especiallyhigh. Our data included ten plots out of 52 where the PR of thefirst 20 cm in soil was less than 800 kPa, but heavy traffic didnot always result in serious rut depths. The variation in thick-ness of the humus layer has distinct influence on that. The dataalso indicates that differences of PR in non-saturated and sat-urated soils are not as radical as the differences in rut depths.This is good to keep in mind when the classic WES method-ology is applied in predicting rut depth. In this sense, moisturecontent may be regarded as a more powerful predictor of rut
Fig. 3 Influence of theVWC and cumulativemass ofmachine passes on rut depth with a constant BD of 1.3 g cm−3 and thickness of humus layer of 4 cm(a) and with 0.7 g cm−3 and 12 cm, respectively (b). 30T to 120T refers to cumulative masses between 30 t and 120 t
Fig. 4 Comparison of the models predicting rutting by forest machine inrelation to VWC of the inorganic layer at a depth of 0–10 cm with themodels presented in Table 6
42 Page 8 of 10 Annals of Forest Science (2020) 77: 42

depth since it takes into account the extreme influence ofdegree of saturation on rutting more efficiently.
We believe that model 1 where VWC, cumulative mass ofmachine passes, BD and thickness of the humus layer are themain predictors is versatile enough to be utilized in various cir-cumstances of forest soils where the inorganic layer is comprisedof fine particles. The model performance in comparison to themodels presented by Allman (2017), Sirén et al. (2019b) in fine-grained and Sirén et al. (2019a) in middle grained soils is illus-trated in Fig. 4, and the summary of the parameters used in thesemodels is shown in Table 6. In the study by Allman et al. (2017),there was no control of machine passes nor cumulative mass, butonly the final rut depths after all machine traffic were reported.The study by Sirén et al. (2019b) in fine-grained mineral soilincluded sample plots with a considerably smaller proportion ofclay content. The difference between fine-grained and mid-grained soils in terms of rut depth is significant.
The models created in this study may be applied inpredicting the risk of rutting prior to forest operations.Apparently, moisture content in the soil will in the future bepredicted with sophisticated hydrological models that arebased on topographical and meteorological data and on dataof growing stock. Significant steps are also being taken in theprediction of soil properties (Heiskanen et al. 2018). This kindof model structures will give forest practitioners possibilitiesto adjust the timing of forest operations, avoid sensitive areawithin the stand and fine-tune machine specifications.
The models presented should give reliable estimates onsimilar soils and when similar machine specifications areused. If total mass of machine or mass distribution betweenfront and rear bogies significantly differs from the machinespecifications used in this study, there is no guarantee thatmodels give unbiased predictions. However, we believe thatthe same soil parameters will stay as the most important com-ponents in prediction of rut depth. Moreover, it has to benoticed that the wheeling experiments were performed with-out any protective brush mat. It is well-known that the protec-tive mat effectively reduces magnitude of soil displacement(Poltorak et al. 2018; Labelle et al. 2019).
5 Conclusions
Rutting of soil on fine-grained forest soils caused by an 8-wheeled forest machine can be predicted rather confidently.Soil moisture content and thickness of the humus layer are themost important soil characteristics in predicting rut depth. Inaddition to these, soil bulk density is significantly importantpredictor affecting rutting, but the parameter is rather labori-ous to measure or predict in practice. The seasonal variation insoil moisture is high in boreal forests, and wet conditions caninterrupt mechanical operations on low trafficability sites. Theresults indicate that it is of high importance that soil type andsoil wetness can be predicted prior to forest operations.
Acknowledgements Open access funding provided by NaturalResources Institute Finland (LUKE). We would like to express our grat-itude to Metsä Forest and the personnel of Metsäkoneurakointi PekkaLiiri Oy for their support.
Funding information The work has been accomplished in the EFFORTEproject that has received funding from the Bio Based Industries JointUndertaking under the European Union’s Horizon 2020 research andinnovation programme under grant agreement No 720712.
Data availability The data may be accessed with special request from thecorresponding author.
Compliance with ethical standards
Conflict of interest The authors declare that they have no conflict ofinterests.
Open Access This article is licensed under a Creative CommonsAttribution 4.0 International License, which permits use, sharing, adap-tation, distribution and reproduction in any medium or format, as long asyou give appropriate credit to the original author(s) and the source, pro-vide a link to the Creative Commons licence, and indicate if changes weremade. The images or other third party material in this article are includedin the article's Creative Commons licence, unless indicated otherwise in acredit line to the material. If material is not included in the article'sCreative Commons licence and your intended use is not permitted bystatutory regulation or exceeds the permitted use, you will need to obtainpermission directly from the copyright holder. To view a copy of thislicence, visit http://creativecommons.org/licenses/by/4.0/.
Table 6 Summary of the models predicting rut depth in fine-grained and mid-grained soils. The proportion of soil type refers to the number of sampleplots falling into the specific category out of all sample plots (e.g. 5/6 means that five sample plots out of six samples fall into the specific category)
Reference Proportion of soil type from all sample plots Model
Clay > 10% Clay < 10%, fines > 30% Clay < 10%, fines < 30%
Allman et al. (2017) – 5/6 1/6 RUT = 4.52 + 0.24 ×GVC
Sirén et al. (2019a) – 1/7 6/7 ln(RUT) = 0.285 + 0.000011 ×mass + 0.016 × VWC
Sirén et al. (2019b) 3/7 1/7 3/7 ln(RUT) = 0.028 + 0.0000084 ×mass + 0.079 × VWC
This study, model 1 13/13 – – RUT = -35.3 + ln(mass) + 0.0000917 × VWC3–5.76 ×BD+ 1.11 × humus layer
RUT rut depth, cm; GVC Gravimetric water content, %. Other abbreviations as presented earlier
Page 9 of 10 42Annals of Forest Science (2020) 77: 42

References
Abebe AT, Tanaka T, Yamazaki M (1989) Soil compaction by multiplepasses of a rigid wheel relevant for optimization of traffic. JTerramech 26:139–148. https://doi.org/10.1016/0022-4898(89)90003-7
Allman M, Jankovský M, Messingerová V, Allmanová Z (2017) Soilmoisture content as a predictor of soil disturbance caused bywheeled forest harvesting machines on soils of the WesternCarpathians. J For Res 28:283–289. https://doi.org/10.1007/s11676-016-0326-y
Ampoorter E, VanNevel L, De Vos B et al (2010) Assessing the effects ofinitial soil characteristics, machine mass and traffic intensity on for-est soil compaction. For Ecol Manag 260:1664–1676. https://doi.org/10.1016/j.foreco.2010.08.002
Ayers P, Perumpral J (1982) Moisture and density effect on cone index.Trans ASAE 25:1169–1172. https://doi.org/10.13031/2013.33691
Bygdén G, Eliasson L, Wästerlund I (2003) Rut depth, soil compactionand rolling resistance when using bogie tracks. J Terramech 40:179–190. https://doi.org/10.1016/j.jterra.2003.12.001
Cambi M, Certini G, Fabiano F et al (2016) Impact of wheeled andtracked tractors on soil physical properties in a mixed conifer stand.IForest:9. https://doi.org/10.3832/ifor1382-008
Edlund J, Bergsten U, Löfgren B (2012) Effects of two different forward-er steering and transmission drive systems on rut dimensions. JTerramech 49:291–297. https://doi.org/10.1016/j.jterra.2012.03.004
Elbanna EB, Witney BD (1987) Cone penetration resistance equation as afunction of the clay ratio, soil moisture content and specific weight. JTerramech 24:41–56. https://doi.org/10.1016/0022-4898(87)90058-9
Eliasson L (2005) Effects of forwarder tyre pressure on rut formation andsoil compaction. Silva FennMonogr 39:549–557. https://doi.org/10.14214/sf.366
Freitag DR (1987) A proposed strength classification test for fine-grainedsoils. J Terramech 24:25–39. https://doi.org/10.1016/0022-4898(87)90057-7
Haas J, Hagge Ellhöft K, Schack-Kirchner H, Lang F (2016) Using pho-togrammetry to assess rutting caused by a forwarder-a comparisonof different tires and bogie tracks. Soil Tillage Res 163:14–20.https://doi.org/10.1016/j.still.2016.04.008
Han H, Page-dumroese D, Han S (2006) Effects of slash, machine passes,and soil moisture on penetration resistance in a cut-to-length har-vesting. Int J For Eng 17:11–24. https://doi.org/10.1080/14942119.2006.10702532
Heinonen J (1994) Koealojen puu- ja puustotunnusten laskentaohjelmaKPL. Käyttöohje. Finnish For Res Institute, Res Pap 504:80
Heiskanen J, Hallikainen V, Uusitalo J, Ilvesniemi H (2018) Co-variationrelations of physical soil properties and site characteristics of Finnishupland forests. Silva Fenn 52:articel id 9948. 18 p. https://doi.org/10.14214/sf.9948
Horn R, Vossbrink J, Peth S, Becker S (2007) Impact of modern forestvehicles on soil physical properties. For Ecol Manag 248:56–63.https://doi.org/10.1016/j.foreco.2007.02.037
Karafiath L, Nowatski EA (1978) Soil mechanics for off-road vehicleengineering. Trans Tech Publications, Clausthal
Kozlowski TT (1999) Soil compaction and growth of woody plants.Scand J For Res 14:596–619. https://doi.org/10.1080/02827589908540825
Labelle ER, Poltorak BJ, Jaeger D (2019) The role of brush mats inmitigating machine-induced soil disturbances: an assessment usingabsolute and relative soil bulk density and penetration resistance.Can J For Res 49:164–178. https://doi.org/10.1139/cjfr-2018-0324
Liu K, Ayers P, Howard H, Anderson A (2010) Influence of soil andvehicle parameters on soil rut formation. J Terramech 47:143–150.https://doi.org/10.1016/j.jterra.2009.09.001
Marra E, Cambi M, Fernandez-Lacruz R et al (2018) Photogrammetricestimation of wheel rut dimensions and soil compaction after in-creasing numbers of forwarder passes. Scand J For Res 33:613–620. https://doi.org/10.1080/02827581.2018.1427789
Murphy G, Brownlie R, Kimberley M, Beets P (2009) Impacts of forestharvesting related soil disturbance on end-of-rotation wood quality andquantity in a New Zealand radiata pine forest. Silva Fenn 43:147–160
Périé C, Ouimet R (2011) Organic carbon, organic matter and bulk den-sity relationships in boreal forest soils. Can J Soil Sci 88:315–325.https://doi.org/10.4141/cjss06008
Poltorak BJ, Labelle ER, Jaeger D (2018) Soil displacement duringground-based mechanized forest operations using mixed-woodbrush mats. Soil Tillage Res 179:96–104. https://doi.org/10.1016/j.still.2018.02.005
Saarilahti M (2002) Soil interaction model. ECOWOOD project deliver-able D2. Helsinki, Finland
Sakai H, Nordfjell T, Suadicani K et al (2008) Soil compaction on forestsoils from different kinds of tires and tracks and possibility of accu-rate estimate. Croat J For Eng 29:15–27
Sirén M, Ala-Ilomäki J, Mäkinen H et al (2013) Harvesting damagecaused by thinning of Norway spruce in unfrozen soil. Int J ForEng 24:60–75. https://doi.org/10.1080/19132220.2013.792155
Sirén M, Ala-ilomäki J, Lindeman H et al (2019a) Soil disturbance bycut-to-lengthmachinery onmid. Silva Fenn 53:1–24. https://doi.org/10.14214/sf.10134
Sirén M, Salmivaara A, Ala-Ilomäki J et al (2019b) Predicting forwarderrut formation on fine-grainedmineral soils. Scand J For Res 34:145–154. https://doi.org/10.1080/02827581.2018.1562567
Smith CW, Johnston M, Lorentz S (1997) The effect of soil compactionand soil physical properties on the mechanical resistance of SouthAfrican forestry soils. Geoderma 78:93–111. https://doi.org/10.1016/S0016-7061(97)00029-3
Suomen Metsäkeskus (2019) Maastotarkastusohje. 1–64Toivio J, Helmisaari H-S, Palviainen M et al (2017) Impacts of timber
forwarding on physical properties of forest soils in southern Finland.For Ecol Manag 405. https://doi.org/10.1016/j.foreco.2017.09.022
Turnage GW (1984) Prediction of in-sand tire and wheeled vehicle draw-bar performance. In: Proceedings of the 8th International ISTVSConference, 6_10. July 1984, Cambridge, UK
Uusitalo J, Ala-Ilomäki J (2013) The significance of above-ground bio-mass, moisture content and mechanical properties of peat layer onthe bearing capacity of ditched pine bogs. Silva Fenn 47. https://doi.org/10.14214/sf.993
Uusitalo J, Salomäki M, Ala-Illomäki J (2015) The effect of wider log-ging trails on rut formations in the harvesting of peatland forests
Uusitalo J, Ala-Ilomäki J, LindemanH et al (2019)Modelling soil moisture– soil strength relationship of fine-grained upland forest soils. SilvaFenn 53:article id 10050. 16 p. https://doi.org/10.14214/sf.10050
Vega-Nieva DJD, Murphy PNC, Castonguay M et al (2009) A modularterrain model for daily variations in machine-specific forest soiltrafficability. Can J Soil Sci 89:93–109. https://doi.org/10.4141/CJSS06033
Vossbrink J, Horn R (2004) Modern forestry vehicles and their impact onsoil physical properties. Eur J For Res 123:259–267. https://doi.org/10.1007/s10342-004-0040-8
Westman CJ (1990) Metsämaan fysikaaliset ja fysikaalis-kemiallisetominaisuudet CT-OMaT kasvupaikkasarjassa [soil physical andphysico-chemical properties of Finnish upland forest sites]. SilvaFenn 24:41–158. https://doi.org/10.14214/sf.a15568
Publisher’s note Springer Nature remains neutral with regard to jurisdic-tional claims in published maps and institutional affiliations.
42 Page 10 of 10 Annals of Forest Science (2020) 77: 42