PREDICTING OUTCOMES IN VASCULAR SURGERY · PREDICTING OUTCOMES IN VASCULAR SURGERY -when not to...
28
PREDICTING OUTCOMES IN VASCULAR SURGERY -when not to operate South Australian Audit of Perioperative Mortality Seminar Rob Fitridge Professor of Vascular Surgery University of Adelaide
-
Upload
phamnguyet -
Category
Documents
-
view
214 -
download
0
Transcript of PREDICTING OUTCOMES IN VASCULAR SURGERY · PREDICTING OUTCOMES IN VASCULAR SURGERY -when not to...

PREDICTING OUTCOMES IN VASCULAR SURGERY
-when not to operate
South Australian Audit of Perioperative Mortality Seminar
Rob Fitridge Professor of Vascular Surgery
University of Adelaide

VASCULAR SURGERY
• Rapid changes in interventional options • Changes in patient profile • Changes in patient / family expectations

VASCULAR SURGERY IN THE ELDERLY
• Discuss two patient groups – Aortic interventions – All vascular admissions
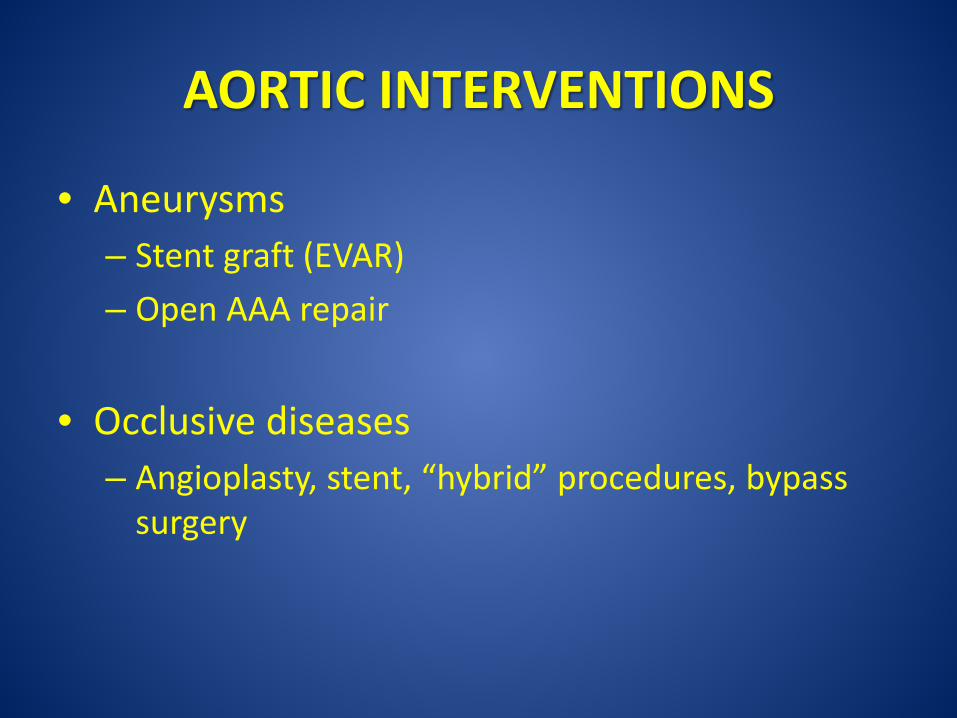
AORTIC INTERVENTIONS
• Aneurysms – Stent graft (EVAR) – Open AAA repair
• Occlusive diseases – Angioplasty, stent, “hybrid” procedures, bypass
surgery

PREDICTION OF OUTCOMES FOLLOWING AORTIC SURGERY - SOURCES
• ASERNIP-S audit of endovascular AAA repair – 961 cases performed from 1999-2001 – followed up for eight years
• Australasian Vascular Audit (AVA) – 13, 995 aortic procedures in five years

AORTIC MORTALITY IN AUSTRALIA AND NEW ZEALAND (AVA)
• Open elective 3.5% • Open ruptured 34% • EVAR elective 0.7% • EVAR ruptured 18%

OPEN AORTIC SURGERY
VARIABLES ODDS RATIO P-VALUE
PREOPERATIVE
Ischaemic heart disease 1.6 0.0002
Age >80 years 2.5 <0.0001
Female 1.5 0.0049
(Rupture) 8.8 <0.0001
PERIOPERATIVE
>4 litre blood loss 5.5 <0.0001
Suprarenal clamp 1.9 <0.0001
Suprarenal AAA 2.2 0.0002
Factors affecting perioperative mortality (AVA)

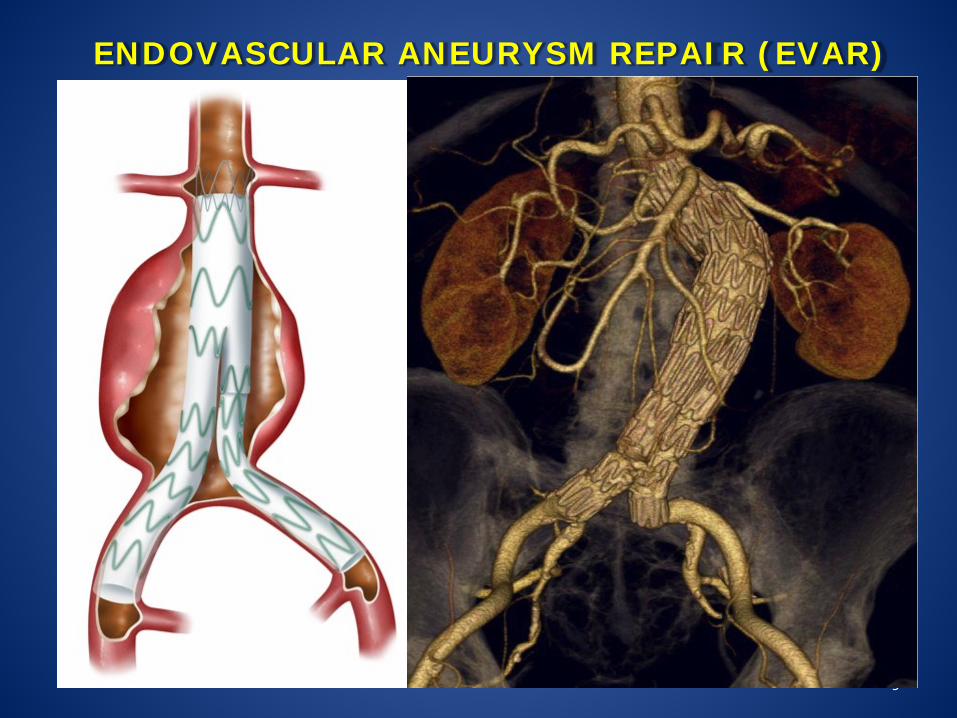
ENDOVASCULAR AAA REPAIR
• Requires anatomic suitability • Procedural mortality varies • (<1% to 10% for elective procedures)
9
ENDOVASCULAR ANEURYSM REPAIR (EVAR)

10
INFRARENAL ABDOMINAL AORTIC ANEURYSM
University of Adelaide 10
Infrarenal neck
Aneurysm
Iliac arteries

BEST MULTIVARIATE MODEL FOR ONE YEAR SURVIVAL (EVAR TRIAL DATA)
11
Variable P-value Hazard ratio
Unit change* From To
ASA 0.006 3.31 2 4
Aneurysm diameter
<0.001 1.52 51 62
Creatinine 0.001 1.44 81 120
Respiratory assessment
0.047 1.63 2 4
Calcification grade
0.026 2.08 2 4
* 25 & 75 percentiles were contrasted in the Hazard Ratios
Cox proportional hazard
Overall 89-93% in literature

EVAR - FACTORS AFFECTING SURVIVAL
3 year: • Age • Aneurysm diameter • ASA
5 year: • Age • ASA • Aneurysm diameter • Creatinine

ASA-3
• Severe systemic disease • >60% of AAA patients and vascular patients in
general • Highly variable exercise tolerance

METHODS
14
• Patients were enrolled in the EVAR outcomes modelling trial between 2009 and 2013
• In addition to asking for the ASA status, we also included the following questions:
• Mortality data was obtained from the National Death Index in August 2014
• Survival for each fitness group was assessed using Cox Proportional Hazards models.

KAPLAN MEIER SURVIVAL CURVES
15
P = 0.0002
ASA3B
ASA 3A = FIT ASA 3B = UNFIT
P = 0.0002 (log rank
test)
3A
3B

SURVIVAL POST PROCEDURE UNADJUSTED AND ADJUSTED ANALYSIS
16
Unadjusted (univariate)
Parameter Level Hazard Ratio
Lower CL
Upper CL P
Fitness group FIT 1.00
UNFIT 3.55 1.93 6.54 <0.0001
Adjusted (multivariate)
Fitness group FIT 1.00
UNFIT 3.03 1.56 5.89 0.0011

AVERAGE RISK PATIENT

ELDERLY CO-MORBID MALE

19
ERA Model (EVAR) The app for iPad looks like this
• Patient details are entered into the left hand column
• The predicted outcomes are displayed in the right hand column
• By selecting an outcome, additional information is provided at the base of the right hand column
• This information can be enlarged

SHORT AND MID-TERM OUTCOMES IN VASCULAR SURGICAL PATIENTS
(Ambler et al, Addenbrooke’s Hospital, Cambridge)
• All patients admitted to vascular unit (413 patients) – > 65 years of age – LOS >2 days

FACTORS ASSOCIATED WITH INCREASED 12 MONTH MORTALITY
(Overall 13.8%) P-VALUE
Anaemia on admission (<119 g/L) 0.01
Not independently mobile 0.06
Polypharmacy (>8meds) or high co-morbidity index 0.002
Malnutrition 0.016
History of falls 0.01
Depression 0.04
Emergency admission <0.001

PREDICTORS OF DISCHARGE TO A CARE FACILITY
• Age • (emergency admission) • High co-morbidity index • Polypharmacy • Poor mobility • Malnutrition • Memory problems • History of falls

FRAILTY CHARACTERISTICS • Co-morbidity
– Polypharmacy – Co-morbidities
• Physical function – Anaemia – Mobility
• Nutrition • Cognition • Geriatric syndrome – falls, visual impairment • Social vulnerability – lives alone Strong predictors of 12 month mortality, discharge to a care institution, prolonged length of stay, likelihood of readmission
Will modification of these features help improve outcomes?

ADENBROOKE’S VASCULAR FRAILITY SCORE (AVFS)
• Not independently mobile on admission • Depression • Polypharmacy on admission (>8 medications) • Anaemia (Hb <119g/L) • Waterlow score >13 on admission • Emergency admission

AVFS SCORE – PREDICTION OF OUTCOMES
ADDERBROOKES VASCULAR FRAILTY SCORE
12 MONTH MORTALITY (AUC 0.83)
READMISSION FREE SURVIVAL (AUC 0.7)
0 0 68
1 2 60
2 12 50
3 22 38
4 39 30
5 58 17
6 0

COPART STUDY (COHORT OF PATIENTS WITH ARTERIAL DISEASE)
• 640 patients in France • Factors associated with 12 month mortality OR non-
fatal stroke OR non-fatal myocardial infarction
• Age 75-84 (+2) >85 (+3) • Previous MI (+1) • Creat clearance <30mb/min (+1.5) • ABI <0.5 or >1.3 (+2) • CRP >70mg/L (+2) • Statin, antiplatelet, ACE/ARB (-1.5)

COPART STUDY
POINTS RISK
≤0 2% (low)
0.5 – 2 13% (medium)
2.5 – 4 23% (high)
≥4.5 42% (very high)
(externally validated)

WHY USE DECISION SUPPORT TOOLS?
• They may help surgeons achieve better outcomes by providing more personally relevant information to patients
• A recent survey of 59 Australian vascular surgeons showed they were largely (95%) in favour of tools to support information exchange between themselves and their patients
• Decision support tools can identify high-risk patients / individuals likely to have poor outcomes
• They may be useful for auditing, policy making and research
• If patients are to have greater autonomy and ownership over medical decisions they must be provided with enough information for them to assess their options and understand potential gains or losses.