
Predicting Obesity Using Facial Pictures during COVID- 19 ...
7
Research Article Predicting Obesity Using Facial Pictures during COVID- 19 Pandemic Arnab Chanda 1,2 and Subhodip Chatterjee 2 1 Centre for Biomedical Engineering, IIT, Delhi, India 2 Department of Biomedical Engineering, AIIMS, Delhi, India Correspondence should be addressed to Arnab Chanda; [email protected] Received 18 October 2020; Revised 18 January 2021; Accepted 28 February 2021; Published 12 March 2021 Academic Editor: Paulo Henrique Braz-Silva Copyright © 2021 Arnab Chanda and Subhodip Chatterjee. This is an open access article distributed under the Creative Commons Attribution License, which permits unrestricted use, distribution, and reproduction in any medium, provided the original work is properly cited. Background. Sedentary lifestyle and work from home schedules due to the ongoing COVID-19 pandemic in 2020 have caused a significant rise in obesity across adults. With limited visits to the doctors during this period to avoid possible infections, there is currently no way to measure or track obesity. Methods. We reviewed the literature on relationships between obesity and facial features, in white, black, hispanic-latino, and Korean populations and validated them against a cohort of Indian participants (n = 106). The body mass index (BMI) and waist-to-hip ratio (WHR) were obtained using anthropometric measurements, and body fat mass (BFM), percentage body fat (PBF), and visceral fat area (VFA) were measured using body composition analysis. Facial pictures were also collected and processed to characterize facial geometry. Regression analysis was conducted to determine correlations between body fat parameters and facial model parameters. Results. Lower facial geometry was highly correlated with BMI (R 2 =0:77) followed by PBF (R 2 =0:72), VFA (R 2 =0:65), WHR (R 2 =0:60), BFM (R 2 =0:59), and weight (R 2 =0:54). Conclusions. The ability to predict obesity using facial images through mobile application or telemedicine can help with early diagnosis and timely medical intervention for people with obesity during the pandemic. 1. Introduction The COVID-19 outbreak has caused over 38 million infec- tions and one million deaths worldwide as of Oct 15, 2020 [1]. Besides a significant burden on the healthcare system, with lockdowns enforced across different countries, millions of adults have been forced into unemployment [2] or pro- longed work from home schedules [3]. Stress, anxiety, and sedentary lifestyle have caused the development of serious mental [4] and physical health issues [5]. Cumulatively, a high incidence of obesity has been reported in developed and developing countries during the ongoing pandemic [6]. Obesity alternatively poses a serious risk towards COVID- 19 severity and mortality [7]. With the increasing risk of infection, there have been limited hospital visits, cancella- tions of inperson appointments, and shift of patient prefer- ences to telemedicine [8]. Due to such challenges, there is currently no way to experimentally measure obesity during the pandemic. Lack of management of obesity can lead to a series of health disorders which can range from diabetes, hypertension, cardiovascular disorders, and some form of cancers [9], which may further add to COVID-19 comorbidity. Measurement of obesity is traditionally conducted through collection of anthropometric data of an individual, such as height, weight, body mass index (BMI), and waist- to-hip ratio (WHR). More advanced body composition analysis-based measurements such as body fat mass (BFM), percentage body fat (PBF), and visceral fat area (VFA) are used for more accurate estimations of body fat. Anthropo- metric measurements can be obtained using a weighing and height measuring scale and a measuring tape, whereas body composition analysis requires sophisticated imaging tech- niques (i.e., dual-energy X-ray absorptiometry or DXA) or electric impedance-based scanning devices. While all such techniques are able to predict the amount of body fat on a Hindawi BioMed Research International Volume 2021, Article ID 6696357, 7 pages https://doi.org/10.1155/2021/6696357
Transcript of Predicting Obesity Using Facial Pictures during COVID- 19 ...

Research ArticlePredicting Obesity Using Facial Pictures during COVID-19 Pandemic
Arnab Chanda 1,2 and Subhodip Chatterjee2
1Centre for Biomedical Engineering, IIT, Delhi, India2Department of Biomedical Engineering, AIIMS, Delhi, India
Correspondence should be addressed to Arnab Chanda; [email protected]
Received 18 October 2020; Revised 18 January 2021; Accepted 28 February 2021; Published 12 March 2021
Academic Editor: Paulo Henrique Braz-Silva
Copyright © 2021 Arnab Chanda and Subhodip Chatterjee. This is an open access article distributed under the Creative CommonsAttribution License, which permits unrestricted use, distribution, and reproduction in any medium, provided the original work isproperly cited.
Background. Sedentary lifestyle and work from home schedules due to the ongoing COVID-19 pandemic in 2020 have caused asignificant rise in obesity across adults. With limited visits to the doctors during this period to avoid possible infections, there iscurrently no way to measure or track obesity. Methods. We reviewed the literature on relationships between obesity and facialfeatures, in white, black, hispanic-latino, and Korean populations and validated them against a cohort of Indian participants(n = 106). The body mass index (BMI) and waist-to-hip ratio (WHR) were obtained using anthropometric measurements, andbody fat mass (BFM), percentage body fat (PBF), and visceral fat area (VFA) were measured using body composition analysis.Facial pictures were also collected and processed to characterize facial geometry. Regression analysis was conducted todetermine correlations between body fat parameters and facial model parameters. Results. Lower facial geometry was highlycorrelated with BMI (R2 = 0:77) followed by PBF (R2 = 0:72), VFA (R2 = 0:65), WHR (R2 = 0:60), BFM (R2 = 0:59), and weight(R2 = 0:54). Conclusions. The ability to predict obesity using facial images through mobile application or telemedicine can helpwith early diagnosis and timely medical intervention for people with obesity during the pandemic.
1. Introduction
The COVID-19 outbreak has caused over 38 million infec-tions and one million deaths worldwide as of Oct 15, 2020[1]. Besides a significant burden on the healthcare system,with lockdowns enforced across different countries, millionsof adults have been forced into unemployment [2] or pro-longed work from home schedules [3]. Stress, anxiety, andsedentary lifestyle have caused the development of seriousmental [4] and physical health issues [5]. Cumulatively, ahigh incidence of obesity has been reported in developedand developing countries during the ongoing pandemic [6].Obesity alternatively poses a serious risk towards COVID-19 severity and mortality [7]. With the increasing risk ofinfection, there have been limited hospital visits, cancella-tions of inperson appointments, and shift of patient prefer-ences to telemedicine [8]. Due to such challenges, there iscurrently no way to experimentally measure obesity during
the pandemic. Lack of management of obesity can lead to aseries of health disorders which can range from diabetes,hypertension, cardiovascular disorders, and some form ofcancers [9], which may further add to COVID-19comorbidity.
Measurement of obesity is traditionally conductedthrough collection of anthropometric data of an individual,such as height, weight, body mass index (BMI), and waist-to-hip ratio (WHR). More advanced body compositionanalysis-based measurements such as body fat mass (BFM),percentage body fat (PBF), and visceral fat area (VFA) areused for more accurate estimations of body fat. Anthropo-metric measurements can be obtained using a weighing andheight measuring scale and a measuring tape, whereas bodycomposition analysis requires sophisticated imaging tech-niques (i.e., dual-energy X-ray absorptiometry or DXA) orelectric impedance-based scanning devices. While all suchtechniques are able to predict the amount of body fat on a
HindawiBioMed Research InternationalVolume 2021, Article ID 6696357, 7 pageshttps://doi.org/10.1155/2021/6696357
clinical visit, they do not allow dynamic measurements,which could be indispensable at a personal level for trackingbody fat and to readily diagnose obesity.
Recently, facial feature analysis has been identified as away to predict body fat [10]. One of the earliest models devel-oped by Coetzee et al. [11] studied the relationship of facialfeatures with body weight. Participants with a range of BMIswere recruited from Caucasian and African ethnicities, andtheir 2D facial images were obtained to quantify width-to-height ratio, perimeter-to-area ratio (PAR), and cheek-to-jaw-width ratio (CJWR). Across subjects, all three attributeswere observed to be related to weight. Wen et al. [12] studiedthe correlations between facial features and BMI. A computa-tional method of predicting the BMI from facial images wasdeveloped. The computational method was applied to a largedatabase of face images of white and African ethnicities [13].Multiple points were placed on the face images using facedetection algorithms, and seven facial features measurementswere obtained, such as CJWR, PAR, width to upper facialheight ratio (WHR), eye size (ES), lower face-to-face heightratio (LF/FH), face width to lower face height ratio(FW/LFH), and mean eyebrow height (MEH). Significantcorrelations with BMI were observed for CJWR, PAR,WHR, and FW/LFH. Lowest correlations with BMI wereexhibited by ES, LF/FH, and MEH. The results indicated thatthe facial curvature was a strong predictor of BMI.
Pascali et al. [14] studied the relationship of facial fea-tures in 30 volunteers in Pisa, Italy, with their weight, BMI,waist circumference (WC), hip circumference (HC), andneck circumference (NC), respectively. Facial image segmen-tation was conducted using a low-cost depth scanner, and thecurvature of layers were correlated with anthropometricmeasurements. The weight, BMI/WC/HC, and NC were allhighly correlated with lower facial curvature. Christine et al.[15] assessed the relationship between BMI and WHR withfacial shape and texture (color pattern) in a sample of youngmiddle European women by a combination of geometricmorphometric and image analysis. Their sample consistedof 49 standardized photographs of human participants aged18-30 years. The range of BMIs and WHRs studied was 17-35.4 and 0.66-0.82, respectively. WHR was found to exhibitlow correlation with face shape and no relation with lip,eye, and eyebrow sizes. BMI correlated moderately withwhole face shape and significantly with lower face curvature.
In the current work, we aim to validate the literature-based findings of the relationship between obesity and thefacial curvature, especially the lower facial geometry, throughextensive anthropometric characterization and body compo-sition experiments on the Indian population. Also, the goalwas to determine a suitable facial model parameter whichcould be employed to predict body fat measurement andpotentially translated to telemedicine.
2. Materials and Methods
2.1. Subjects and Anthropometric Measurements. Participantsrecruited for the study included 85 males and 21 females inan age group of 18 to 65 years. The study was approved bythe Ethical Committee of Indian Institute of Technology,
Delhi; all subjects provided a signed informed consent beforeenrolment in the study. The heights and weights were mea-sured for every participant prior to testing. The bodyweights were in a range of 40.2-87.5Kg with a mean of69.206Kg. The height range recorded was 154-182.9 cmwith a mean of 168.77 cm. BMI was calculated based onthe height and weight measurements, which ranged from17 to 32.7Kg/m2, with a mean of 24.267Kg/m2. Using stan-dard BMI-based categorization, 12 were underweight(BMI < 18:5), 47 normal weight (18:5 < BMI < 25), 29 over-weight (25 < BMI < 30), and 18 obese (BMI > 30). WHRwas estimated using WC and HC measurements for eachsubject, which ranged between 0.75 and 1.03.
2.2. Body Fat Characterization. A body composition analyzer(InBody 720, Cerritos, CA, USA) was used to quantify bodyfat. This device uses the bioelectrical impedance analysis(BIA) method [16], which is based on the fact that the humanbody consists of conductors (i.e., water constituting 50~70%of the human body) and nonconductors (i.e., body fat). Theimpedance measurements are obtained by applying a smallalternating current on the body and quantifying the electricresistivity changes, which depends on the amount of waterin the body. The value of fat free mass is obtained from therecorded volume of body water. Body fat mass is determinedby deducting the fat free mass from the measured bodyweight [16].
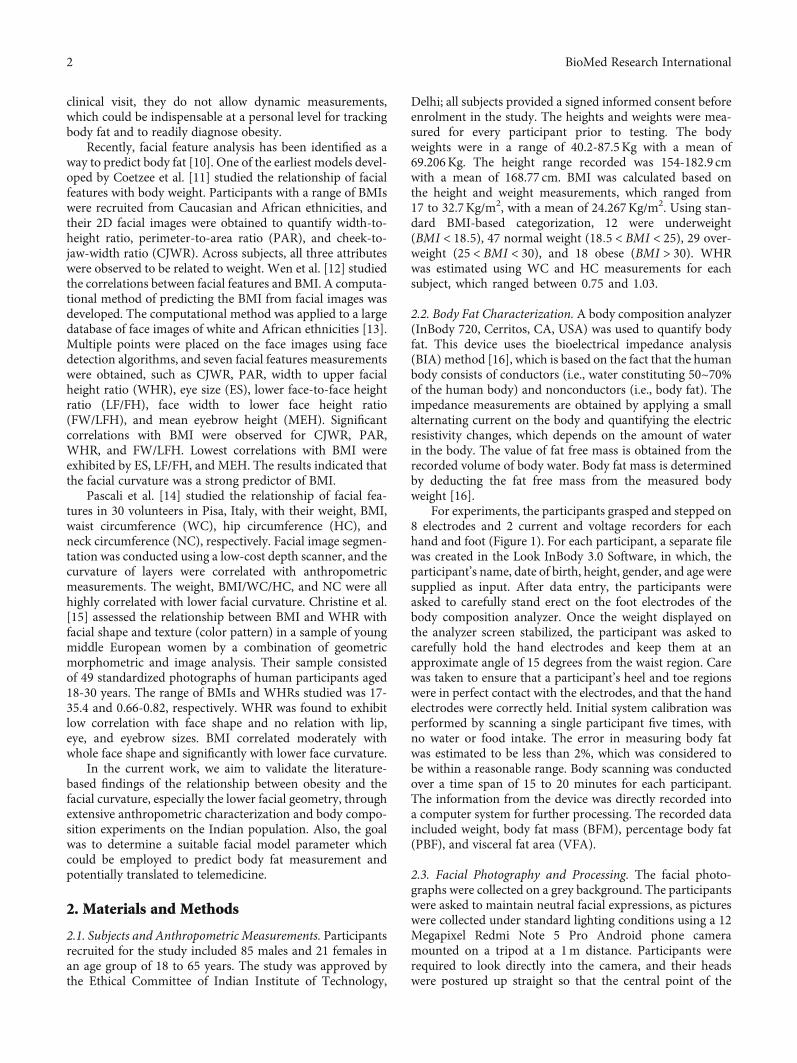
For experiments, the participants grasped and stepped on8 electrodes and 2 current and voltage recorders for eachhand and foot (Figure 1). For each participant, a separate filewas created in the Look InBody 3.0 Software, in which, theparticipant’s name, date of birth, height, gender, and age weresupplied as input. After data entry, the participants wereasked to carefully stand erect on the foot electrodes of thebody composition analyzer. Once the weight displayed onthe analyzer screen stabilized, the participant was asked tocarefully hold the hand electrodes and keep them at anapproximate angle of 15 degrees from the waist region. Carewas taken to ensure that a participant’s heel and toe regionswere in perfect contact with the electrodes, and that the handelectrodes were correctly held. Initial system calibration wasperformed by scanning a single participant five times, withno water or food intake. The error in measuring body fatwas estimated to be less than 2%, which was considered tobe within a reasonable range. Body scanning was conductedover a time span of 15 to 20 minutes for each participant.The information from the device was directly recorded intoa computer system for further processing. The recorded dataincluded weight, body fat mass (BFM), percentage body fat(PBF), and visceral fat area (VFA).
2.3. Facial Photography and Processing. The facial photo-graphs were collected on a grey background. The participantswere asked to maintain neutral facial expressions, as pictureswere collected under standard lighting conditions using a 12Megapixel Redmi Note 5 Pro Android phone cameramounted on a tripod at a 1m distance. Participants wererequired to look directly into the camera, and their headswere postured up straight so that the central point of the
2 BioMed Research International
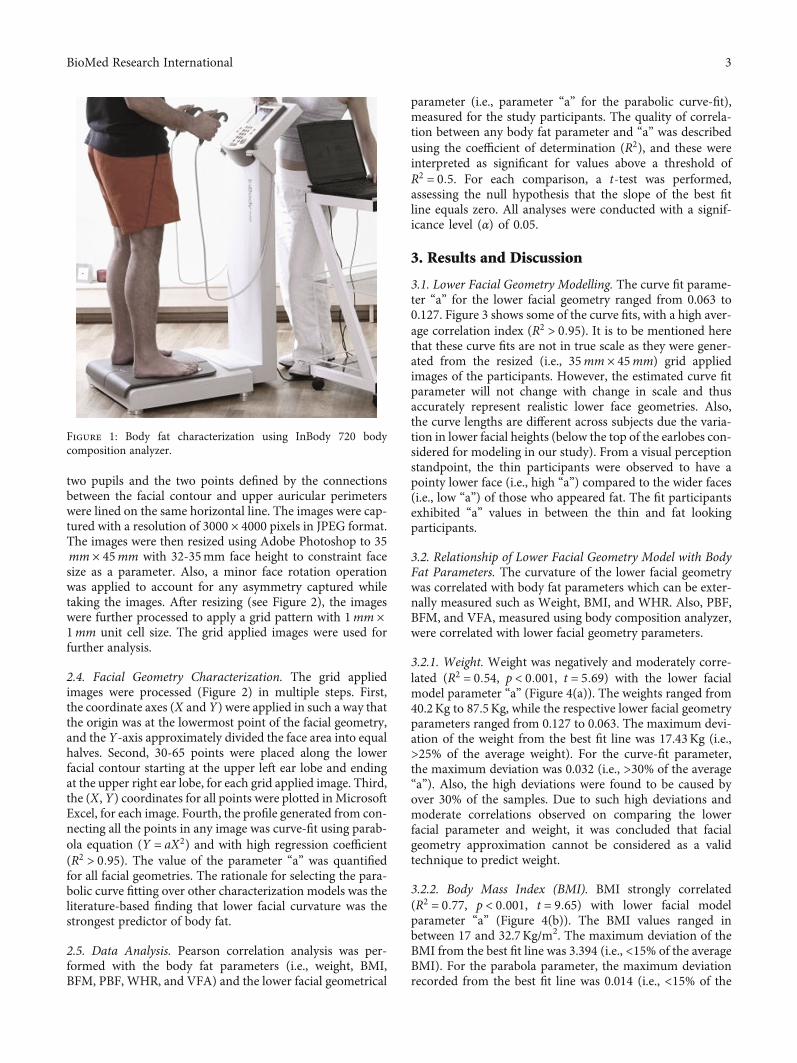
two pupils and the two points defined by the connectionsbetween the facial contour and upper auricular perimeterswere lined on the same horizontal line. The images were cap-tured with a resolution of 3000 × 4000 pixels in JPEG format.The images were then resized using Adobe Photoshop to 35mm × 45mm with 32-35mm face height to constraint facesize as a parameter. Also, a minor face rotation operationwas applied to account for any asymmetry captured whiletaking the images. After resizing (see Figure 2), the imageswere further processed to apply a grid pattern with 1mm ×1mm unit cell size. The grid applied images were used forfurther analysis.
2.4. Facial Geometry Characterization. The grid appliedimages were processed (Figure 2) in multiple steps. First,the coordinate axes (X and Y) were applied in such a way thatthe origin was at the lowermost point of the facial geometry,and the Y-axis approximately divided the face area into equalhalves. Second, 30-65 points were placed along the lowerfacial contour starting at the upper left ear lobe and endingat the upper right ear lobe, for each grid applied image. Third,the (X, Y) coordinates for all points were plotted inMicrosoftExcel, for each image. Fourth, the profile generated from con-necting all the points in any image was curve-fit using parab-ola equation (Y = aX2) and with high regression coefficient(R2 > 0:95). The value of the parameter “a” was quantifiedfor all facial geometries. The rationale for selecting the para-bolic curve fitting over other characterization models was theliterature-based finding that lower facial curvature was thestrongest predictor of body fat.
2.5. Data Analysis. Pearson correlation analysis was per-formed with the body fat parameters (i.e., weight, BMI,BFM, PBF, WHR, and VFA) and the lower facial geometrical
parameter (i.e., parameter “a” for the parabolic curve-fit),measured for the study participants. The quality of correla-tion between any body fat parameter and “a” was describedusing the coefficient of determination (R2), and these wereinterpreted as significant for values above a threshold ofR2 = 0:5. For each comparison, a t-test was performed,assessing the null hypothesis that the slope of the best fitline equals zero. All analyses were conducted with a signif-icance level (α) of 0.05.
3. Results and Discussion
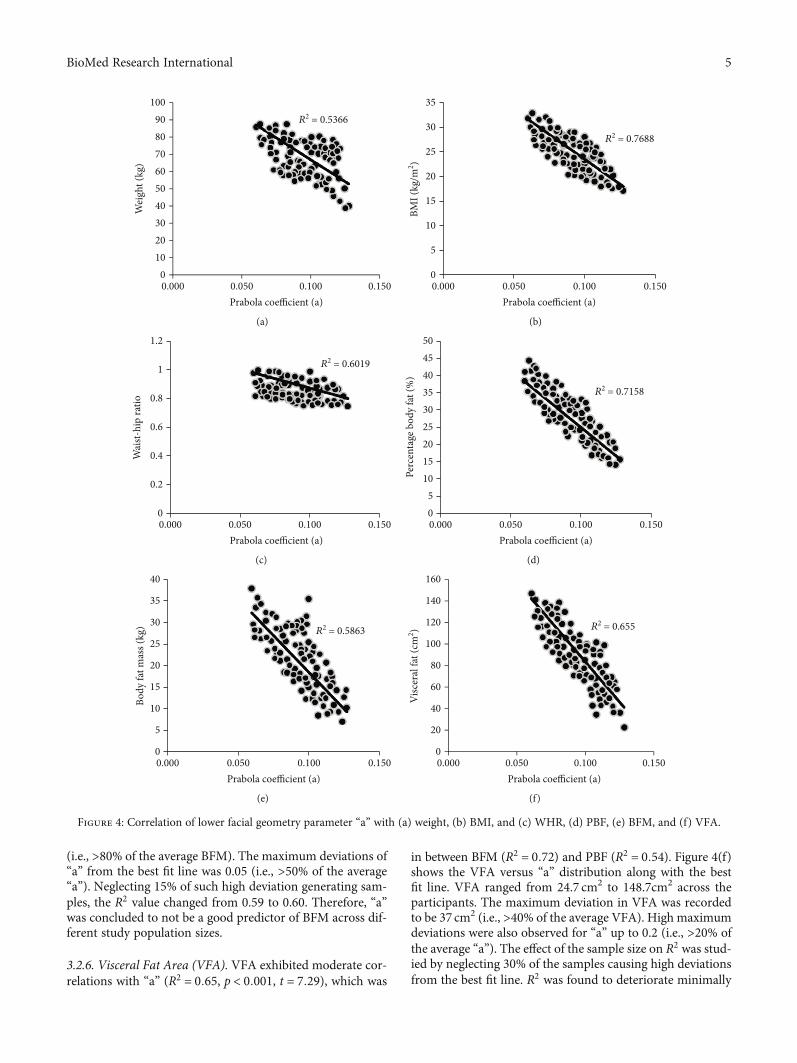
3.1. Lower Facial Geometry Modelling. The curve fit parame-ter “a” for the lower facial geometry ranged from 0.063 to0.127. Figure 3 shows some of the curve fits, with a high aver-age correlation index (R2 > 0:95). It is to be mentioned herethat these curve fits are not in true scale as they were gener-ated from the resized (i.e., 35mm × 45mm) grid appliedimages of the participants. However, the estimated curve fitparameter will not change with change in scale and thusaccurately represent realistic lower face geometries. Also,the curve lengths are different across subjects due the varia-tion in lower facial heights (below the top of the earlobes con-sidered for modeling in our study). From a visual perceptionstandpoint, the thin participants were observed to have apointy lower face (i.e., high “a”) compared to the wider faces(i.e., low “a”) of those who appeared fat. The fit participantsexhibited “a” values in between the thin and fat lookingparticipants.
3.2. Relationship of Lower Facial Geometry Model with BodyFat Parameters. The curvature of the lower facial geometrywas correlated with body fat parameters which can be exter-nally measured such as Weight, BMI, and WHR. Also, PBF,BFM, and VFA, measured using body composition analyzer,were correlated with lower facial geometry parameters.
3.2.1. Weight. Weight was negatively and moderately corre-lated (R2 = 0:54, p < 0:001, t = 5:69) with the lower facialmodel parameter “a” (Figure 4(a)). The weights ranged from40.2Kg to 87.5Kg, while the respective lower facial geometryparameters ranged from 0.127 to 0.063. The maximum devi-ation of the weight from the best fit line was 17.43Kg (i.e.,>25% of the average weight). For the curve-fit parameter,the maximum deviation was 0.032 (i.e., >30% of the average“a”). Also, the high deviations were found to be caused byover 30% of the samples. Due to such high deviations andmoderate correlations observed on comparing the lowerfacial parameter and weight, it was concluded that facialgeometry approximation cannot be considered as a validtechnique to predict weight.
3.2.2. Body Mass Index (BMI). BMI strongly correlated(R2 = 0:77, p < 0:001, t = 9:65) with lower facial modelparameter “a” (Figure 4(b)). The BMI values ranged inbetween 17 and 32.7Kg/m2. The maximum deviation of theBMI from the best fit line was 3.394 (i.e., <15% of the averageBMI). For the parabola parameter, the maximum deviationrecorded from the best fit line was 0.014 (i.e., <15% of the
Figure 1: Body fat characterization using InBody 720 bodycomposition analyzer.
3BioMed Research International

average “a”). On neglecting 10% samples with the highestdeviations from the best fit line, the correlation value wasobserved to increase to R2 = 0:81 from R2 = 0:77. Given suchstrong correlations and low deviations, lower facial geometryparameter was considered as a strong predictor of BMI.Employing a larger test sample in future studies may signifi-cantly improve such results.
3.2.3. Waist-Hip Ratio (WHR).WHRwas observed to exhibitmoderate correlation (R2 = 0:60, p < 0:001, t = 6:5) withlower facial geometry (i.e., “a”). This correlation quantity liedin between weight and BMI. Figure 4(c) shows the distribu-tion of WHR which ranged from 0.75 to 1. The maximumdeviations of WHR and parabola coefficient “a” from the bestfit line were 0.113 (i.e., <15% of the average WHR) and 0.042(i.e., >45% of the average WHR), respectively. On neglecting10% samples with the highest deviations from the best fit line,the correlation value was observed to increase to R2 = 0:60from R2 = 0:65. Therefore, with a larger population sample,lower facial geometry may serve as a good study metric topredict WHR.
3.2.4. Percentage Body Fat (PBF). PBF correlated well(R2 = 0:72, p < 0:001, t = 8:39) with “a” and much better thanexternally measurable predictors such as weight (R2 = 0:54)and WHR (R2 = 0:60). However, BMI was still the best mea-sure predicted (R2 = 0:77) using lower facial geometry assess-ment. Figure 4(d) shows the PBF versus “a” distribution andthe best fit line. PBF ranged from 14.1% to 44.3%. The max-imum deviations of PBF from the best fit line were 7.09 (i.e.,>25% of the average PBF), which for the lower facial param-eter “a” was 0.015 (i.e., <15% of the average “a”). On neglect-ing 25% samples with highest deviations, the R2 moderatelyincreased from 0.72 to 0.73. Therefore, it was concluded thatincreasing the sample size may not have a strong effect on thePBF versus “a” correlation. Therefore, “a” was considered tobe a good predictor of PBF, however inferior to BMI.
3.2.5. Body Fat Mass (BFM). BFM was found to be moder-ately correlated with lower facial geometry parameter “a”(R2 = 0:59, p < 0:001, t = 6:29), slightly better than weight(R2 = 0:54). Figure 4(e) shows the results, where the maxi-mum deviations of BFM from the best fit line were 16.91
Sized image Grid application Lower facial geometry points
X
Y
–X
Figure 2: Lower facial geometry characterization.
–15 –10 –5 00
2
4
6
8
10
12
X axis (m)
Y ax
is (m
)
5 10 15
Y = (0
.063)X2
Y =
(0.12
7)X
2
Figure 3: Curve fits for lower facial geometries of participants.
4 BioMed Research International
(i.e., >80% of the average BFM). The maximum deviations of“a” from the best fit line was 0.05 (i.e., >50% of the average“a”). Neglecting 15% of such high deviation generating sam-ples, the R2 value changed from 0.59 to 0.60. Therefore, “a”was concluded to not be a good predictor of BFM across dif-ferent study population sizes.
3.2.6. Visceral Fat Area (VFA). VFA exhibited moderate cor-relations with “a” (R2 = 0:65, p < 0:001, t = 7:29), which was
in between BFM (R2 = 0:72) and PBF (R2 = 0:54). Figure 4(f)shows the VFA versus “a” distribution along with the bestfit line. VFA ranged from 24.7 cm2 to 148.7cm2 across theparticipants. The maximum deviation in VFA was recordedto be 37 cm2 (i.e., >40% of the average VFA). High maximumdeviations were also observed for “a” up to 0.2 (i.e., >20% ofthe average “a”). The effect of the sample size on R2 was stud-ied by neglecting 30% of the samples causing high deviationsfrom the best fit line. R2 was found to deteriorate minimally
0.0000
1020304050607080
Wei
ght (
kg)
90100
0.050 0.100Prabola coefficient (a)
0.150
R2 = 0.5366
(a)
0.0000
5
10
15
20
25
30
BMI (
kg/m
2 )
35
0.050 0.100Prabola coefficient (a)
0.150
R2 = 0.7688
(b)
0.0000
0.2
0.4
0.6
0.8
1
Wai
st-hi
p ra
tio
1.2
0.050 0.100Prabola coefficient (a)
0.150
R2 = 0.6019
(c)
0.00005
10152025303540
Perc
enta
ge b
ody
fat (
%)
4550
0.050 0.100Prabola coefficient (a)
0.150
R2 = 0.7158
(d)
0.0000
5
10
15
20
25
30
Body
fat m
ass (
kg)
40
35
0.050 0.100Prabola coefficient (a)
0.150
R2 = 0.5863
(e)
0.0000
20
40
60
80
100
120
140
Visc
eral
fat (
cm2 )
160
0.050 0.100Prabola coefficient (a)
0.150
R2 = 0.655
(f)
Figure 4: Correlation of lower facial geometry parameter “a” with (a) weight, (b) BMI, and (c) WHR, (d) PBF, (e) BFM, and (f) VFA.
5BioMed Research International

from 0.65 to 0.64, indicating that increasing the sample sizemay slightly improve the correlation results of VFA versus“a,” and “a” could be potentially used as a predictor of VFA.
4. Discussion
This work studied the relationship of facial geometry withbody fat parameters, to understand its potential applicationin virtual obesity tracking during the COVID-19 pandemic.Anthropometric measurements such as the weight, bodymass index (BMI), and waist-to-hip ratio (WHR) were con-ducted, along with estimation of body fat in terms of bodyfat mass (BFM), percentage body fat (PBF), and visceral fatarea (VFA) using a body composition analyzer. 106 Indiansubjects were recruited in the age group of 18-65, includingboth males and females, and with different body types. Facialphotographs were taken and were post processed and nor-malized for size and percentage head coverage. Lower facialgeometry curve-fitting was performed, and the fitting param-eter set was correlated with the body fat parameters. Thelowest correlations were with weight and BFM (R2 < 0:59).The highest correlations were observed for BMI and PBF(R2 > 0:72). Moderate correlations were observed for WHRand VFA (0:60 < R2 < 0:65). The facial model parameter “a”was concluded to be a good predictor of BMI and PBF, whichare the key body fat parameters experimentally measuredduring clinical visits.
There are several limitations of this study which needs tobe acknowledged. First, a small sample size (n = 106) wasconsidered in this study. Due to limited availability of partic-ipants during the pandemic, an optimal cohort size couldonly be studied. The study is currently being extended to asample size of 1200 which is anticipated to be completedwithin a year. In this work, we also studied the effect of thesample size on correlation of facial model parameter “a”and body fat parameters. It was observed that on changingthe sample size, “a” versus BMI or WHR may vary to someextent, while the correlation of other body fat parameterswith “a” exhibited minimal variations. Since “a” was con-cluded to be the strongest predictor of BMI, considering alarger cohort size may improve the accuracy of the results.Second, diversity in participants was not extensively studiedin this work. The ratio of underweight, normal weight, over-weight, and obese participants was not balanced due to lim-ited choices available during the lockdown. In the extendedstudy, we plan on having 300 participants in each of theseweight categories. Age groups were also not compared inthe current study. In the extended study, there will be over200 participants in different age groups (i.e., 18-30 years,30-40 years, 40-50 years, 50-60 years, and 60 years above,respectively). Also, gender-based differences were not studiedin this work. Inclusion of a higher number of female subjectsmay lead to the finding of possible gender-based variations inthe study results. Third, other facial geometrical approxima-tion techniques (i.e., width-to-height ratio, perimeter-to-arearatio (PAR), and cheek-to-jaw-width ratio (CJWR)) may alsobe used to compare with our results. In future, we anticipateto overcome all such limitations with the extended study hav-ing a larger and more diverse cohort. Additionally, the results
of this study have not been implemented yet. Development ofa mobile application is anticipated in the near future to trans-fer the study results into a real time obesity monitoringproduct.
The current work lays the foundation of face-to-fat char-acterization. Strong associations between facial geometricalfeatures and measured body fat (both BMI externally andPBF internally) will allow the possible use of facial picturesor selfies to determine a person’s degree of obesity duringthe COVID-19 pandemic. To implement our study results,a mobile application will be developed using an open sourceapplication programing interface (API) such as from Beta-face (Munich, Germany). This API will be able to detect thelower facial landmarks from a selfie in the presence of vary-ing facial expressions, head poses, and occlusion and extractthe coordinates of these facial points accurately. These coor-dinates will be curve fit using a parabola equation, similar tothat used in our study. The curve-fit parameter will be used toreadily estimate BMI and PBF using our results. On comple-tion of our extended study on the larger participant group,more accurate results will be used to precisely estimate thebody fat parameters using this App. Accurate obesity estima-tion using an app or telemedicine technology would be indis-pensable for dynamic tracking of personal health and also theincidence of obesity related diseases such as diabetes, hyper-tension, coronary artery disease (CAD), and cancer.
Data Availability
Data is available on request.
Conflicts of Interest
The authors declare no conflict of interest.
References
[1] Webmeter, “Coronavirus Age, Sex, Demographics (COVID-19) - Worldometer,” (2020, http://www.Worldometers.Info).
[2] W. Kawohl and C. Nordt, “COVID-19, unemployment, andsuicide,” In The Lancet Psychiatry., vol. 7, no. 5, pp. 389-390,2020.
[3] E. Brynjolfsson, J. J. Horton, A. Ozimek, D. Rock, G. Sharma,and H. TuYe, “Covid-19 and remote work: an early look atUS data,” in Climate Change 2013- The Physical Science Basis,National Bureau of Economic Research, Cambridge, MA,USA, 2020.
[4] J. Torales, M. O’Higgins, J. M. Castaldelli-Maia, andA. Ventriglio, “The outbreak of COVID-19 coronavirus andits impact on global mental health,” The International Journalof Social Psychiatry, vol. 66, no. 4, pp. 317–320, 2020.
[5] J. A. Woods, N. T. Hutchinson, S. K. Powers et al., “TheCOVID-19 pandemic and physical activity,” Sports Medicineand Health Science., vol. 2, no. 2, pp. 55–64, 2020.
[6] L. Di Renzo, P. Gualtieri, F. Pivari et al., “Eating habits and life-style changes during COVID-19 lockdown: an Italian survey,”Journal of Translational Medicine, vol. 18, no. 1, p. 229, 2020.
[7] W. Dietz and C. Santos-Burgoa, “Obesity and its implicationsfor COVID-19 mortality,” In Obesity., vol. 28, no. 6, p. 1005,2020.
6 BioMed Research International

[8] A. Prasad, R. Brewster, J. G. Newman, and K. Rajasekaran,“Optimizing your telemedicine visit during the COVID-19pandemic: practice guidelines for patients with head and neckcancer,” Head & Neck, vol. 42, no. 6, pp. 1317–1321, 2020.
[9] S. Djalalinia, M. Qorbani, N. Peykari, and R. Kelishadi,“Health impacts of obesity,” Pakistan Journal of Medical Sci-ences., vol. 31, no. 1, pp. 239–242, 2015.
[10] M. Barr, G. Guo, S. Colby, and M. Olfert, “Detecting bodymass index from a facial photograph in lifestyle intervention,”Technologies., vol. 6, no. 3, p. 83, 2018.
[11] V. Coetzee, J. Chen, D. I. Perrett, and I. D. Stephen, “Decipher-ing faces: quantifiable visual cues to weight,” Perception,vol. 39, no. 1, pp. 51–61, 2010.
[12] L. Wen and G. Guo, “A computational approach to body massindex prediction from face images,” Image and Vision Com-puting, vol. 31, no. 5, pp. 392–400, 2013.
[13] M. Jiang and G. Guo, “Body weight analysis from human bodyimages,” IEEE Transactions on Information Forensics andSecurity, vol. 14, no. 10, pp. 2676–2688, 2019.
[14] M. A. Pascali, D. Giorgi, L. Bastiani et al., “Face morphology:can it tell us something about body weight and fat?,” Com-puters in Biology and Medicine, vol. 76, pp. 238–249, 2016.
[15] C. Mayer, S. Windhager, K. Schaefer, and P. Mitteroecker,“BMI and WHR are reflected in female facial shape and tex-ture: a geometric morphometric image analysis,” PLoS One,vol. 12, no. 1, pp. 1–13, 2017.
[16] R. F. Kushner, “Bioelectrical Impedance Analysis: A Review ofPrinciples and Applications,” Journal of the American Collegeof Nutrition, vol. 11, no. 2, pp. 199–209, 1992.
7BioMed Research International


![MicroRNA biomarkers predicting risk, initiation and ... · cancer and inherited genetic risk[3]. Modifiable risk factors include diet, physical activity, obesity, cigarette smoking](https://static.fdocuments.net/doc/165x107/5fa0a9102fb69967ca30ad38/microrna-biomarkers-predicting-risk-initiation-and-cancer-and-inherited-genetic.jpg)