PREDICTING DEFAULT RISK OF SMEs IN … · PREDICTING DEFAULT RISK OF SMEs IN DEVELOPING ECONOMIES:...
15
Journal of WEI Business and Economics-December 2017 Volume 6 Number 3 The West East Institute 1 PREDICTING DEFAULT RISK OF SMEs IN DEVELOPING ECONOMIES: EVIDENCE FROM MOROCCO Dr. Selma Haj Khlifa Phd in Management Science, Institut Superieur De Commerce Et D'administration Des Entreprises, Casablanca, Morocco, Groupe ISCAE Abstract SMEs are a significant component of the global economy. However, the problem of access to financing called for the study of criteria that may influence the granting of bank loans, on which these businesses depend heavily. Despite their vital role in the economy, this population still struggles to obtain bank financing. The issue of the prediction of business default has been the subject of numerous works in the accounting and financial research field, which discussed in particular the difficulties facing SMEs. Despite the lack of research on SMEs, the prediction of the phenomenon of default sparked more interest among banks, after the new Basel agreements, which require them to develop internal rating systems to rate their counterparties” Internal Ratings Based Approach”. Nowadays, the banking landscape is experiencing a deep evolution of regulatory systems, that will certainly impact the relations between companies and banks. In this context, this paper aims to propose an econometric model of default risk prediction, which will consist of quantitative and qualitative ratios for Moroccan companies, namely SMEs, for pricing purposes. Keywords: Small and Medium Enterprise (SME), default prediction, scoring model, logistic regression, pricing policy’s loans. Introduction For around forty years, default prediction has been the subject of numerous theoretical and empirical works. A series of research papers exists in literature, particularly Anglo-Saxon, with the principal conclusion that the process of default differs from one company to another. However, few works are really focused on struggling SMEs, even if literature shows that the default risk of this type of company is very high. During the last few years, we have witnessed important structural changes in credit risk management for companies 1 . Following these evolutions, the quality of the signature has become an unavoidable criterion in the management of the relationship between banks and companies. Thus, the changes resulting from the Basel II reform had important consequences for the companies, SMEs in particular. Nowadays, the banking environment is evolving towards a style of credit risk management which is more rigorous and differentiated. With the new Basel prudential model, the banks will have to be more and more prompted to examine in a detailed way the future capacity of each borrower, by applying for this reason internal rating systems. Within the credit distribution process, the internal rating systems represent nowadays a structuring and complete way of piloting the bank. According to this reform, banks and investment companies can resort, in order to evaluate the quality of credit of their counterparts, either to the “standard” method, which is based on the evaluations emitted by “external credit assessment institutions”, or “ECAI 2 ”, or to the internal ratings-based approach, or “IRB 3 ”. 1 These structural changes can be explained by the growing competition, and the quick rise in doubtful debt due to economic downturn in certain regions. 2 The external credit assessment institutions are composed of the four international rating agencies, Standard and Poor's, Moody's, Fitch Ratings and DBRS “Dominion Bond Rating Service”. 3 The internal ratings-based approaches (IRB) allow to evaluate credit risk on the basis of banks’ internal ratings. These approaches are reserved for banking institutions which have acquired an expertise on risk management tools which is recognized by their regulatory bodies.
Transcript of PREDICTING DEFAULT RISK OF SMEs IN … · PREDICTING DEFAULT RISK OF SMEs IN DEVELOPING ECONOMIES:...

Journal of WEI Business and Economics-December 2017 Volume 6 Number 3
The West East Institute 1
PREDICTING DEFAULT RISK OF SMEs IN DEVELOPING
ECONOMIES: EVIDENCE FROM MOROCCO
Dr. Selma Haj Khlifa
Phd in Management Science, Institut Superieur De Commerce Et D'administration Des Entreprises,
Casablanca, Morocco, Groupe ISCAE
Abstract
SMEs are a significant component of the global economy. However, the problem of access to financing
called for the study of criteria that may influence the granting of bank loans, on which these businesses depend
heavily. Despite their vital role in the economy, this population still struggles to obtain bank financing.
The issue of the prediction of business default has been the subject of numerous works in the accounting
and financial research field, which discussed in particular the difficulties facing SMEs. Despite the lack of research
on SMEs, the prediction of the phenomenon of default sparked more interest among banks, after the new Basel
agreements, which require them to develop internal rating systems to rate their counterparties” Internal Ratings
Based Approach”.
Nowadays, the banking landscape is experiencing a deep evolution of regulatory systems, that will certainly
impact the relations between companies and banks. In this context, this paper aims to propose an econometric model
of default risk prediction, which will consist of quantitative and qualitative ratios for Moroccan companies, namely
SMEs, for pricing purposes.
Keywords: Small and Medium Enterprise (SME), default prediction, scoring model, logistic regression, pricing
policy’s loans.
Introduction
For around forty years, default prediction has been the subject of numerous theoretical and empirical works.
A series of research papers exists in literature, particularly Anglo-Saxon, with the principal conclusion that the
process of default differs from one company to another. However, few works are really focused on struggling SMEs,
even if literature shows that the default risk of this type of company is very high.
During the last few years, we have witnessed important structural changes in credit risk management for
companies1. Following these evolutions, the quality of the signature has become an unavoidable criterion in the
management of the relationship between banks and companies. Thus, the changes resulting from the Basel II reform
had important consequences for the companies, SMEs in particular. Nowadays, the banking environment is evolving
towards a style of credit risk management which is more rigorous and differentiated. With the new Basel prudential
model, the banks will have to be more and more prompted to examine in a detailed way the future capacity of each
borrower, by applying for this reason internal rating systems.
Within the credit distribution process, the internal rating systems represent nowadays a structuring and
complete way of piloting the bank. According to this reform, banks and investment companies can resort, in order to
evaluate the quality of credit of their counterparts, either to the “standard” method, which is based on the evaluations
emitted by “external credit assessment institutions”, or “ECAI2”, or to the internal ratings-based approach, or
“IRB3 ”.
1 These structural changes can be explained by the growing competition, and the quick rise in doubtful debt due to economic downturn in certain regions. 2 The external credit assessment institutions are composed of the four international rating agencies, Standard and Poor's, Moody's, Fitch Ratings
and DBRS “Dominion Bond Rating Service”. 3 The internal ratings-based approaches (IRB) allow to evaluate credit risk on the basis of banks’ internal ratings. These approaches are reserved
for banking institutions which have acquired an expertise on risk management tools which is recognized by their regulatory bodies.

Journal of WEI Business and Economics-December 2017 Volume 6 Number 3
The West East Institute 2
Concretely, under the effect of the implementation of Basel II in Europe, the lawful use of ratings extended
to an institutionalization of the rating agencies4. Thus, recourse to internal ratings by the banks has become
impossible to circumvent, particularly regarding the assessment of the loss risk inherent to the default of a
counterpart.
As part of the “Internal Ratings-Based (IRB)” approach under Basel II, the rating system allows at the same
time to determine the unexpected losses and the average anticipated losses, on the basis of the quantitative as well as
qualitative aspects describing the quality of the counterpart.
Moreover, the internal ratings system constitutes for the bank a rich source of information, not only for the
decision-making process, but also for pricing purposes (interest rate) and credit follow-up. On the other hand, the
companies consider it is a sanction, which is sometimes unjustified5.
For SMEs, banks resorting more and more to these rating systems is likely to induce two main
consequences. Initially, the banks will be more vigilant regarding the rating of credit applications6. Then, their
resorting to these systems is likely to cause a great differentiation in the cost of credit. Therefore, if the use of
banking scoring will have relatively few consequences on large companies, since they are used to be rated, many
SMEs will be more constrained, in the short run for cash credit, as well as on the long term for investment loans7.
Given these deficiencies, we will figure out an econometric predictive model of default probability, as a precondition
to the construction of a rating matrix for companies, similar to what is used by banks for pricing. Within our model
of internal rating, the determination of the risk premium will be calculated based on a risk indicator called the
“score”. This indicator is computed on the basis of accounting and financial data, collected as part of our sample
from large local banks.
I. Choosing quantitative methods to predict companies default
1. Credit scoring: A model initiated by the Basel II directives
“Credit scoring” uses quantitative measures of the performance and characteristics of past loans to predict the
future performance of loans with similar characteristics (Caire & Kossmann, 2003)
The Basel Committee strived to reform and harmonize the framework of banking supervision and the
provisions of the prudential control of the international banking system 8
. For its part, the prudential regulation has
evolved since the first recommendations of the Basel Committee, which were adopted in 1988, detailing existing
weightings in order to take into account the external ratings of the banks by the various rating agencies. The ambition
of the Basel II directive is to encourage the credit institutions to adopt the best practices regarding internal
management of economic risks in general, and credit exposure in particular. After the subprime financial crisis
(2007), management of credit risks became a key issue amongst the orientations of the Basel Committee.
According to the Basel provisions, a bank which adopts an internal ratings-based approach (IRB) must
deploy a system of notation specific to each segment (State, private individuals, banks, companies), relying on
discriminative criteria, including the main quantitative and qualitative factors (accounting data, qualitative data,
macroeconomics…), which enables it to evaluate the counterpart risk for each borrower.
1.1. Credit scoring: The ambition of a predictive tool for credit default
Formerly, the analysis of the lending and borrowing phenomenon was for a very long time related to
human behavior (Thomas and Al 2002)9. Indeed, credit history goes back to around 2000 BC, a phenomenon as old
as trading. Furthermore, credit scoring history appeared only six decades ago. Recently, credit scoring techniques
were broadened to integrate more applications for various spheres of activity. Beside these techniques’ ability to
4 Altman, E. I., & Rijken, H. A. (2004). How rating agencies achieve rating stability. Journal of Banking & Finance, 28, 2679–2714.
5 Patrick Sénicourt. (mai 2013), "Notation des PME : du glaive du score bancaire à la balance de l'auto-notation", Revue Française de Comptabilité. 6 Moody’s Investors Service. (2014). Rating methodology: Global manufacturing companies (Technical report). New York, NY: Author. 7 Patrick Sénicourt. (décembre 2012), "Notation des PME : vertus et limites"), la Revue Banque. 8 See the article "Bâle II : genèse et enjeux", Revue d’économie financière, n°73, 3-2003. On the origin of banking capital stock regulation, D.
Lacoue-Labarthe, "L’évolution de la supervision bancaire et de la réglementation prudentielle (1945-1996)"ibid. ; on the developments which led to the 2004 agreement, Armand Pujal, "De Cooke à Bâle II", ibid. A synthetic presentation of the agreements is available on the European Central
Bank’s website, http://www.banque-france.fr/fr/eurosys/europe/bce/2.htm, "Nouvel accord de Bâle sur les fonds propres: principales
caractéristiques et implications", Bulletin mensuel, janvier 2005 9 Thomas, L. C., Edelman, D. B., Crook, L. N. (2002). «Credit Scoring and Its Applications». Philadelphia: Society for Industrial and Applied
Mathematics.

Journal of WEI Business and Economics-December 2017 Volume 6 Number 3
The West East Institute 3
reduce the probability of customer risk default, they make it possible for credit agencies to support and maximize the
profits expected on their exposures10
.
The method of credit scoring is a rather young discipline, which only appeared during the sixties in the
United States. It is a technique which was born from the works of Durand in 1941, a pioneer of the techniques of
scoring to distinguish the good borrowers from the bad.
These techniques have really begun to evolve from the 20th century onwards, mainly after John Moody’s release of
the first rating grid of his trade bonds. With the evolution of the lawful requirements and banking supervision, the
rating techniques were constantly evolving during the nineties, particularly from Altman’s main studies (1968),
which allowed a better comprehension of these techniques, and Eisenbeis’, which applied these methods to business
portfolio.
To define credit scoring, Anderson (2007)11
suggests dividing the expression into two components, credit
and scoring. The first one is derived from the Latin word “credo”, which means “I believe” or “I have confidence”.
The second one refers to the use of a numerical tool to classify things in the correct order, according to a perceived or
real quality, and to differentiate them so as to make objective and coherent decisions.
In their near entirety, financial institutions and banks use scoring models because of the undeniable
advantages that they offer. In this respect, the usefulness of the methods of credit scoring can be justified by the
following points:
Standardization and stabilization of the rating processes for loan applications;
Improvement of the coherence and the traceability of the decision-making process for loans;
Reduction of the necessary cost and time for the evaluation of loan applications;
Reduction of human judgement related skews.
1.2. Principles and basis of credit scoring:
In many studies, the debate between human judgement and credit scoring has been evoked since the
implementation of these methods. In both cases, the decision logic is the same, it is a question of comparing the
characteristics between new credit applications, those having already been refunded, and those having defaulted. For
Bailey (2004)12
, human judgement is based on the expertise and the competences of credit analysts (see Al Amari,
200213
). Nevertheless, this method suffers from clear limits in subjectivity and result inconsistency.
In the method of credit scoring, the analysts use their lived experience for the evaluation of the already
treated files. The goal of this analysis being to derive from quantitative models, in order to discriminate the good
customers from the bad, on the basis of a set of variables with strong predictive capacity. In spite of the limits
inherent to this approach, the method of credit scoring offers enormous advantages, in particular regarding to
automation and consistency of results, which justifies the exponential use of these models in the banking and
financial fields (Bailey14
, 2004).
As part of the process of credit granting, data collection is a crucial phase in the construction of the model to
predict default. In general, it is through the credit application form that the bank collects information related to the
bank account of the customer, the industry sector, the history of granted credit lines. On the basis of this data, the
bank can build a robust model of default prediction. For developed countries, the systems of credit scoring are well
developed, and the recourse to these techniques is widespread, because of the abundance and the availability of
information, contrary to developing countries, where access to information remains low and difficult.
10 Altman, E. I. (2011). Default recovery rates and LGD credit risk modelling and practice. In A. Lipton & A. Rennie (Eds.), The Oxford
handbook of credit derivatives. Oxford: Oxford University Press. 11 Anderson, R. (2007). “The Credit Scoring Toolkit: Theory and Practice for Retail Credit Risk Management and Decision Automation”. New
York: Oxford University Press. 12 Bailey, M. (2004). “Consumer credit quality: underwriting, scoring” fraud prevention and collections. Kingswood, Bristol: White Box Publishing. 13 Al Amari, A.(2002). “The credit evaluation process and the role of credit scoring: A case study of Qatar.” Ph.D. Thesis, University College
Dublin. 14 Bailey, M. (2004). “Consumer credit quality: underwriting, scoring”, fraud prevention and collections. Kingswood, Bristol: White Box
Publishing.

Journal of WEI Business and Economics-December 2017 Volume 6 Number 3
The West East Institute 4
In spite of the advantages these credit scoring techniques offer, this approach is somewhat limited15
. Firstly,
from a technical point of view, the method requires complex statistical techniques, which dehumanizes the process of
credit management. Secondly, the implementation of credit scoring can only be carried out by major financial
institutions having a clear process, formalized management tools and exhaustive and relevant databases (of
customers, incidents and losses). Moreover, credit scoring is based on the past to predict the future, which constitutes
a limit in itself. As soon as there is a change in the market trends, this method does not satisfy the conditions which
were fixed before. Also, the fact that the determinants of a borrower and the related risk are not quantifiable limits
the implementation of this method.
Ultimately, despite the advantages which the various methods of credit scoring offer, the scoring system
asserted itself as the privileged method of international financial institutions. Moreover, the new Basel agreements,
as well as the evolution of the IT systems, have anchored their preference for this method even more.
2. Credit scoring applications & determining factors:
2.1. Main applications of credit scoring
Credit scoring application has made considerable strides in the banking and financial fields for the last two
decades. Mainly in the fields of default prediction (Tsai & Wu16,
2008; Etemadi et al17
, 2009; Min & Lee, 2008;
Nanni & Lumini18
, 2009), classification of credit (Min & Jeong, 2009); loan application management (Min &
Jeong19
, 2009); and other financial decisions and output analyzes (Yu et al20
, 2009).
The expansion of these applications can also be explained by the multiplication of banking products and the
increase of demand by private individuals (consumer credit and real estate loans), SMEs and large companies
(Sustersic et al., 2009). Moreover, the emergence of derived products, in the form of investment vehicles or risk
management tools supported the recourse to scoring techniques.
For SMEs and large corporations, scoring is used as a decision-making help tool for credit granting and risk
pricing needs. Scoring is also used in hindsight for the classification of portfolio risk for granted loans and equity
budgeting. For this segment of companies, scoring is supplemented by other decision-making help tools (financial
analysis, judgement of experts, neuronal network)21
.
More precisely, the aim of any scoring system is to assign a kind of label to credit files (Lee et al, 2002)22
through the categorization of good or bad credit on the basis of a set of explanatory variables23
. Nevertheless, there is
no universal scientific consensus on either the number of variables or on their restrictive list. Following our readings,
we can conclude that these variables, which are often used for the construction of the scoring model for consumer
credit, include age, status, loan amount, lending period, monthly income, lending purpose, possession of a house or a
car, recruitment date (quoted by: Sustersic et al., 2009).
For loans granted to large companies and small businesses, research referring to the retained variables for
the construction of the scoring model emphasize the recurrence of the age of the company and some financial ratios
like solvency, profitability, and leverage ratios… (quoted by Min and Lee, 2008; Min and Jeong, 2009).
2.2 Pertinence of the application of a credit scoring model:
From a statistical point of view, the pertinence of the categorization rests on the modelling technique used.
Even then, there is no consensus on either the best statistical technique or scoring formula to adopt. Practically, one
finds a wide spread of techniques, from conventional methods such as multiple linear regression, probit analysis,
logistic regression, discriminative analysis, to more advanced techniques like algorithmic, neuronal network, or
15 Bauer, J., & Agarwal, V. (2014). Are hazard models superior to traditional bankruptcy prediction approaches? A comprehensive test. Journal of
Banking & Finance, 40, 432–442. 16 Tsai, C., Wu, J. (2008). “Using neural networks ensembles for bankruptcy prediction and credit scoring”. Expert Systems with Applications 34
(4): 2639-2649. 17 Etemadi, H., Rostamy, A., Dehkordi, H. (2009). “A genetic programming model for bankruptcy prediction: Empirical evidence from Iran‟, Expert Systems with Applications 36 (2/2): 3199-3207. 18 Nanni, L., Lumini, A. (2009). “An experimental comparison of ensemble of classifiers for bankruptcy prediction and credit scoring. Expert”
Systems with Applications 36 (2/2): 3028-3033. 19 Min, J. H., Jeong, C. (2009). « A binary classification method for bankruptcy prediction”. Expert Systems with Applications 36(3): 5256-5263. 20 Yu, L., Wang S., Lai, K. (2009). « An intelligent-agent-based fuzzy group decision-making model for financial multicriteria decision support:
the case of credit scoring”. European Journal of Operational Research, Volume 195, Issue 3, 16 June 2009, Pages 942–959. 21 Agarwal, V., & Taffler, R. (2008). Comparing the performance of market-based and accounting-based bankruptcy prediction models. Journal of
Banking & Finance, 32, 1541–1551. 22 Lee, T., Chiu, C. Lu, C., Chen, I. (2002). “Credit Scoring Using the Hybrid Neural Discriminant Technique. Expert Systems with Applications” 23 (3): 245-254. 23 Lim, M. K., Sohn, S. Y. (2007). “Cluster-Based Dynamic Scoring Model. Expert Systems with Applications” 32 (2): 427-431.

Journal of WEI Business and Economics-December 2017 Volume 6 Number 3
The West East Institute 5
expert systems. In Finance, certain authors, having worked on the scoring models, retained only three variables
(Pendharkar, 2005), whereas others used about twenty variables for the construction of a scoring/notation model (Jo
et al, 1997).
The majority of authors agree on the importance of the methodology selected and the predictive capacity of
a credit scoring model. There too, there is not joint position between the authors regarding the grading scale and the
optimal release threshold retained for a scoring model. For a predetermined score, a new customer can be classified
as either accepted or rejected by the system. In addition, the measurement of the score as well as the release
threshold must be founded on the basis of technical factors. Several scientific techniques were used for the
evaluation of consumer credit, such as discriminative analysis, logistic regression, neuronal networks, as well as
other statistical models (Al Amari, 2002)24
.
In the end, there is no scientific consensus on a grading scale and an optimal release threshold. The latter
varies from a bank to another within the same country, and depends in fact mainly on the risk profile and the loan
policy adopted by the bank. If the bank has a high tolerance to risk, it will be satisfied with a release threshold lower
than a more risk-adverse one.
Moreover, the optimal sample size for the construction of a scoring model is a much-discussed topic among
researchers. It is considered that the more representative the sample is, the more relevant is the predictive model.
This determinant depends largely on the availability of data, the nature of the market and the predictive capacity of
the population. In finance, certain authors were satisfied with a few dozen observations (Dutta et al., 1994; Fletcher
& Goss, 1993), while others chose several thousands of them (Bellotti & Crook, 2009). In addition, whatever the
sample size, it is appropriate to mitigate the skew of the population used as a basis (for example: collecting
observations only among the credit applications having been accepted).
Lastly, the categorization of the sample or validation technique was largely discussed by researchers on
techniques of credit scoring. Certain researchers like Landajo et al., 2007, chose a simple technique of validation, by
dividing the sample into two subsamples of identical size (test and validation). Others chose different proportions,
by limiting the initial sample to 30% of the core sample (Lee et al., 2002).
I. Consumption of the model: empirical validation on a sample of Moroccan companies
1. Study data: technical notice
1.1 Definition of the representative sample of SMEs
In this empirical part, we will propose an econometric scoring model of default for SMEs and large
companies, composed of several quantitative and qualitative ratios. The constitution of a predictive model of default
risk requires a rather significant database as a preliminary. We worked on a sample of 2032 customers of a large
Moroccan bank, composed of SMEs and large companies.
Thus, our initial sample appears as follows in the table below:
Table 01: Initial Sample
Category Total sample Default % Healthy %
GE 368 23% 77%
PME 1664 18% 82%
Total 2032 19% 81%
Source: Author
After cleaning our database, we have a final sample of 1163 observations over two years.
1.2 Presentation of the model’s explanatory variables
The choice of the financial ratios expected to predict companies’ default, rested on a great number of
ratios which cover seven categories related to the risk of default: liquidity, debt, activity, solvency, size, coverage
and funding. We retained a list of 24 financial ratios as explanatory variables for the prediction of default for our
sample. The choice of these ratios is explained by their broad use by researchers and the financial community
(financial investors, analysts, rating agencies or online brokers). Thus, the explanatory variables retained for our
study are showcased in the following table:
Table 02: Financial ratios used as part of the study
24 Al Amari, A. (2002). “The credit evaluation process and the role of credit scoring: A case study of Qatar”. Ph.D. Thesis, University College
Dublin.

Journal of WEI Business and Economics-December 2017 Volume 6 Number 3
The West East Institute 6
Size ratios:
Variables Financial ratios Formula
R1 Age Year of Rating – Year of
establishment
R2 Capital Asset Log (Total fixed assets)
R3 Total balance sheet Log (current assets, fixed assets,
cash on hand)
R4 Turnover (sales) Log (turnover)
Liquidity ratios:
Variables Financial ratios Formula
R1 Inventory turnover (Inventory/ turnover)*365
R2 Turnover of accounts receivable (Accounts receivables/
turnover)*365
R3 Working capital turnover Working capital / Turnover
R4 Current Ratio Current assets / current liabilities
R5 Quick Ratio (Accounts receivable+ cash)/
current liabilities
R6 Cash Ratio Cash / current liabilities
Operating ratios:
Variables Financial ratios Formula
R1 Assets turnover Turnover/ assets
R2 Capital turnover Turnover/Equity + Debt
Profitability ratios :
Variables Financial ratios Formula
R1 Asset profitability Net result /(fixed assets+ current
assets)
Solvency ratios:
Variables Financial ratios Formula
R1 Gearing Long term Debt/Equity
R2 Interest Covrage Ratio EBITDA/Interest
R3 Total leverage Total Assets/Equity
R4 % Equity in Structure Equity/ Debt + Equity
Source : Author
1.2 Selection of the explanatory variables
Initially, we carried out the calculation of a set of financial ratios, depending on the available data, in
order to identify the most significant variables for the prediction of the risk of default for our sample. Then, we
selected explanatory variables on the basis of financial literature and the correlations between these variables, in
order to eliminate redundancies.
Then, we tested the variables, so as to keep those having a significant effect on the prediction of
default of the bank’s portfolio. For this purpose, the selection of the financial variables is a decisive stage in the
modeling of the risk of default. After several iterations on SPSS, the prediction of default is influenced by several
ratios. At last, we are retaining the following explanatory variables:
Presentation of the model’s variables:
- The explained variable: the prediction of SMEs’ risk of default;
- The explanatory variables:
Age of the company
Inventory turnover
Turnover of accounts receivable
Asset turnover
Total balance sheet
Total leverage

Journal of WEI Business and Economics-December 2017 Volume 6 Number 3
The West East Institute 7
Taking into account the correlated ratios, we tested several scenarios under SPSS, eliminating the
redundancies. We retained for our model of prediction the variables having the best explanatory capacity. The table
below details each of the explanatory variables:
Table 03: Explanatory variables
Explanatory
variables Categories Explanations / Standards
Age of the
company Size
Measures the age of the company in its sector of activity, the higher the
age the less the company is exposed to default risks. (Bonfim25
, 2009,
Found a strong negative correlation between the age of firms and their
probability of default)
Inventory
turnover Liquidity
Measures the company's ability to meet its short-term commitments,
using a dynamic business policy coupled with effective inventory
management. There is no universal standard. The shorter the inventory
turnover time, the lower the associated costs.
Turnover of
accounts
receivable
Liquidity
The average payment delay granted by the company to its customers is
fixed in advance according to the internal policy of the company. For
good working capital management, the standard is that the turnover of
trade payables should be higher than that of trade receivables.
Asset
Turnover Activity
Measures the "productivity" of assets in terms of how many currency
units of turnover are generated by one currency unit of fixed assets and
current assets
Total Balance
Sheet Size
Measured by the logarithm of the balance sheet total, controls the effect
of size on risk and the level of capital and profitability
Total leverage Solvability
An important level of leverage reflects a situation of financial fragility.
The larger the asset in relation to the owner's equity, the greater the level
of indebtedness. Although debt can increase returns on equity, it may
increase the risk of bankruptcy (magnifying effect). The objective of
monitoring this ratio is to prevent the systemic risk according to Basel
Committee, by improving the level of individual and global capital.
Source: Author
2. Modeling of the risk of default of Moroccan SMEs: Implementation of the method of Logistic Regression
under SPSS
2.1 Selection of the explanatory variables
The aim of this work is to determine the most significant ratios that examine the health of each
customer of the bank. In other words, we will try to analyze the most discriminative ratios in the prediction of the
risk of default of our sample, which is composed of small, medium-sized, and large companies.
For the construction of our model of company rating, we endeavored to respect the following stages:
In the construction of our model, we carried out a simple random sampling without rebates, drawn 420
observations from the total sample, and divided it into two parts: a sample for modeling and a sample for
validation.
Our modeling sample is sufficiently important to be representative of the overall population. The remainder
is set aside for the validation tests of the model.
The adopted method for the construction of our model of prediction is the binary logistic regression one. It
makes it possible to test a model of regression with a dichotomic variable (0,1) in our “probability of
default” model (predicted variable) and the independent variables (predictors), either continuous or
qualitative.
We used a progressive method, in particular the top-down step by step method. In the top-down method,
SPSS introduces into the initial model all the variables step by step, and gradually withdraws the least
significant variables, until selecting only those which contribute to the improvement of the prediction
model. Contrary to the bottom-up method, which introduces the variable with the highest score through a
25 Bonfim, D., (2009), «Credit Risk Drivers: Evaluating the Contribution of Firm Level Information and Macroeconomic Dynamics», Journal of
Banking and Finance, Vol. 33, No. 2.

Journal of WEI Business and Economics-December 2017 Volume 6 Number 3
The West East Institute 8
step by step selection, so as not to keep any variable with a significant score (under 0,05), in addition to the
tests of entry which are based on the significance of the score26
.
After several iterations with the method of logistic regression under SPSS, the default prediction model
retained 6 financial ratios in addition to one constant. The method used in the econometric construction of
the model is the top-down step by step method with the test of Wald.
2.2 Evaluation of the adjustment of the estimated coefficients:
This step aims to evaluate the statistical significance of the coefficients of the independent variables
selected, in order to make sure that each estimated variable contributes to better predicting P(y) compared to a model
which does not integrate them. The analysis of the statistics of Wald illustrates the difference in the model before and
after the integration of the last variable. According to the table below, the direction of the coefficients mirrors the
direction of the relation.
We notice that the relation is positive for the inventory, accounts receivables and total leverage variables,
meaning that the increase in these variables increases the probability of default. On the other hand, the relation is
negative for the age of the company, asset turnover and total balance sheet variables. This means that the better are
the experience of the contractor, the level of debt and the asset turnover, the less defaulting occurs.
We can notice that at the final step, all the coefficients are significant. Thus, we can conclude that each of these
independent variables contributes to the improvement of the model.
Table 04: Variables with high predicting power
A E.S. Wald ddl Sig. Exp(B)
Etape
4a
Age of the company -,031 ,017 3,377 1 ,066* ,970
Inventory turnover ,005 ,002 9,731 1 ,002 1,005
Turnover of accounts
receivable
,007 ,002 12,447 1 ,000 1,007
Asset Turnover -,857 ,274 9,743 1 ,002 ,425
Total Balance Sheet -5,125 ,682 56,507 1 ,000 ,006
Total leverage ,158 ,060 6,867 1 ,009 1,171
Constant 35,343 4,867 52,738 1 ,000 2234642772566680,000
a. Variable(s) introduced during step 1 : Age of the company, Inventory turnover, Turnover of accounts
receivable, Quick ratio, Asset Turnover, Interest coverage ratio, Cash ratio, Total Balance Sheet, Total
leverage.
*This variable is significant at the 90% treshold.
Source : Author
The table of variables which aren’t in the equation, shows that for each stage, SPSS introduces the variable
having the highest score. Therefore, we note, as for the initial model, that the global statistics line is significant for
the three steps.
26ftp://public.dhe.ibm.com/software/analytics/spss/documentation/statistics/22.0/fr/client/Manuals/IBM_SPSS_Regression.pdf
Journal of WEI Business and Economics-December 2017 Volume 6 Number 3
The West East Institute 9
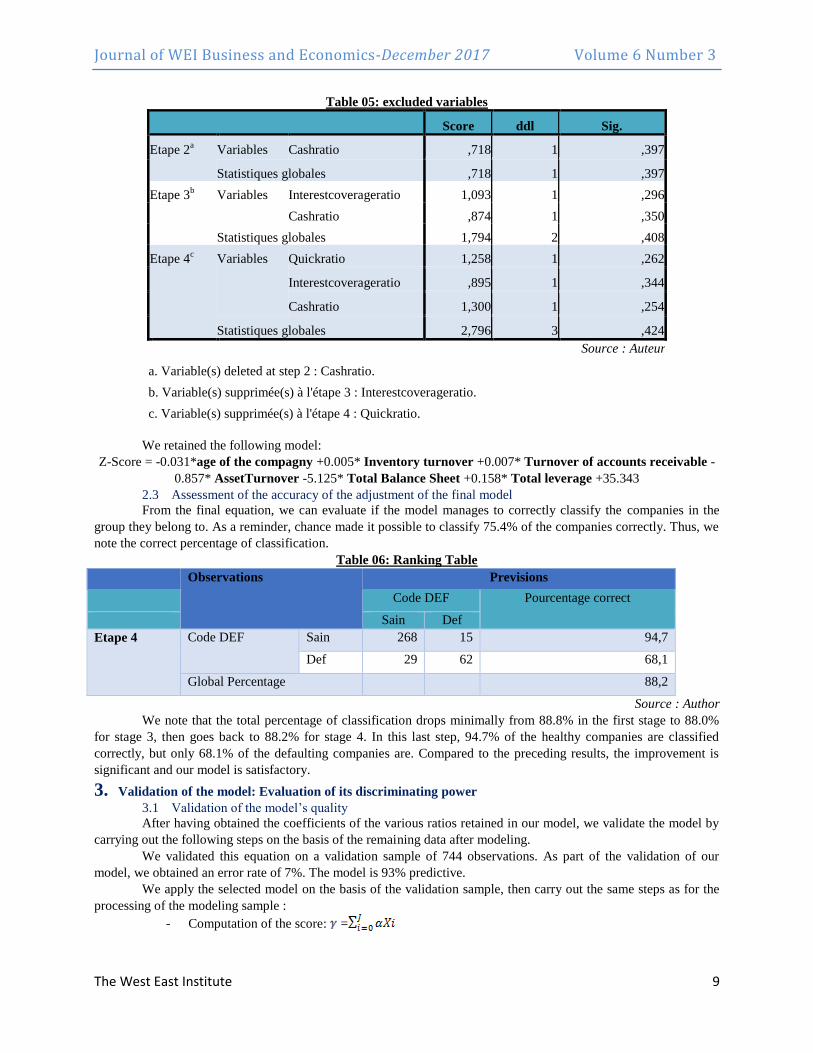
Table 05: excluded variables
Score ddl Sig.
Etape 2a Variables Cashratio ,718 1 ,397
Statistiques globales ,718 1 ,397
Etape 3b Variables Interestcoverageratio 1,093 1 ,296
Cashratio ,874 1 ,350
Statistiques globales 1,794 2 ,408
Etape 4c Variables Quickratio 1,258 1 ,262
Interestcoverageratio ,895 1 ,344
Cashratio 1,300 1 ,254
Statistiques globales 2,796 3 ,424
Source : Auteur
a. Variable(s) deleted at step 2 : Cashratio.
b. Variable(s) supprimée(s) à l'étape 3 : Interestcoverageratio.
c. Variable(s) supprimée(s) à l'étape 4 : Quickratio.
We retained the following model:
Z-Score = -0.031*age of the compagny +0.005* Inventory turnover +0.007* Turnover of accounts receivable -
0.857* AssetTurnover -5.125* Total Balance Sheet +0.158* Total leverage +35.343
2.3 Assessment of the accuracy of the adjustment of the final model
From the final equation, we can evaluate if the model manages to correctly classify the companies in the
group they belong to. As a reminder, chance made it possible to classify 75.4% of the companies correctly. Thus, we
note the correct percentage of classification.
Table 06: Ranking Table
Observations Previsions
Code DEF Pourcentage correct
Sain Def
Etape 4 Code DEF Sain 268 15 94,7
Def 29 62 68,1
Global Percentage 88,2
Source : Author
We note that the total percentage of classification drops minimally from 88.8% in the first stage to 88.0%
for stage 3, then goes back to 88.2% for stage 4. In this last step, 94.7% of the healthy companies are classified
correctly, but only 68.1% of the defaulting companies are. Compared to the preceding results, the improvement is
significant and our model is satisfactory.
3. Validation of the model: Evaluation of its discriminating power
3.1 Validation of the model’s quality
After having obtained the coefficients of the various ratios retained in our model, we validate the model by
carrying out the following steps on the basis of the remaining data after modeling.
We validated this equation on a validation sample of 744 observations. As part of the validation of our
model, we obtained an error rate of 7%. The model is 93% predictive.
We apply the selected model on the basis of the validation sample, then carry out the same steps as for the
processing of the modeling sample :
- Computation of the score: =

Journal of WEI Business and Economics-December 2017 Volume 6 Number 3
The West East Institute 10
- Computation of the probability of default:
- We predict the state of default thanks to the condition: π>0,5, i.e Def =1
We compute the confusion matrix from the validation data:
Table 07 : Confusion matrix
Matrice de confusion estimation
Correct 93%
Incorrect 7%
Total 100%
Source : Author
The ROC curve is presented below:
Figure 01 : ROC curve obtained from validation data
Area under the curve
Variable(s) of test results: Y
Area
0,852 Source: Author
From these indicators, we can validate the model since the error rate is low and the surface under the ROC
curve, AUC = 0.852, is excellent (see ref., table of model efficiency according to the AUC value).
3.2 Interpretation of the results:

Journal of WEI Business and Economics-December 2017 Volume 6 Number 3
The West East Institute 11
There is a particularly interesting property specific to the logit model, which facilitates in particular the
interpretation of the parameters β associated to the explanatory variables Xi. The numerical values of the estimates
do not offer a direct interpretation, because of the problem of the standardization of the residual variance. Thus, it
should be retained that the only direct information which is really usable is the sign of the parameters, indicating if
the associated variable influences the increase or decrease of the probability of default. However, we can also
calculate the marginal effects, which measure the sensitivity of the probability of the Yi = 1 event, compared to
variations in the explanatory variables Xi. And it is precisely in this context, that the use of a logit model can
facilitate the analysis of these marginal effects.
The variables whose estimated coefficient is positive influence positively the probability of default, whereas
the negative coefficients indicate that the variables to which they refer affect this probability negatively.
Next, we focused on the Odd Ratio (OR) to measure the association of the variables to the probability of suffering
from monetary insecurity. In the case of the logistic model, the exponential of the coefficient of an explanatory
variable is interpreted as its OR. During the estimation, OR are given by the last column of the table.
Indeed, we determine, from the carried-out tests, that the majority of the explanatory variables have a significant
predictive capacity and the expected sign.
Age has a negative effect on the prediction of default. SMEs having sufficient history easily obtain funding
because of their low risk profile. Moreover, the SME statute is only one stage in the cycle of life of the
company. The existence of a negative relation between the age and the prediction of default, means that mature
SMEs have a low chance to default.
Inventory turnover and the probability of default are positively dependent. A weak inventory turnover is often
associated to difficulties in the flow of goods and bad planning, which implies problems of liquidity and a
worsening of the working capital, which are generally perceived as bad by the banks.
Accounts receivables turnover has a positive effect on the probability of default, which suggests that the longer
the average duration of credit granted by the company to its customers is, the less liquid the company is.
Asset turnover is correlated negatively to the probability of default; it emphasizes the capacity of the company to
generate sales revenue for each dirham invested.
The Total Balance Sheet has a negative effect on the probability of default. The link between the size of the
company and its risk is increasing for SMEs, but decreasing beyond a certain size. The largest the company is,
the less risky it is. The two economists Bun and Redwood (2003) proved that small-sized companies have a
strong probability of default.
The Total leverage is correlated positively to the prediction of the risk of default. A level of leverage is a source
of financial weakness for the company. In other words, the state of the company in question is unbearable on the
average to long term, and it should imperatively raise funds to honor its engagements. This variable has a crucial
importance; the increase in the proportion of the company assets compared to its own capital stocks raises the
probability of the firm defaulting, and in fact exposes the bank to risk.
3.3 Construction of the rating scales:
On the basis of the equation default prediction model, built under SPSS, we built a rating grid on the basis
of the companies’ score. The technique of the rating scales definition can be described as follows:
Definition of the key parameter for classification: We retained the Z-Score, which was calculated for each
company using the Logit model. This parameter was adopted because of the possibility of deducing the
probabilities from them on the one hand, and of its continuous distribution, which enables it to be used as a
basis for the definition of the classes, on the other hand;
Computation of the probability of default 27
for each company: On the basis of the Z-scores of our model
and according to the following equation: : .
Computation of the rate of default for the validation of the model: The principal problem met at this stage
was the decision rule to consider a company in a situation of default, because the application of the circular
of BAM was going to simply result in a too high rate of default, including many of the companies which are
not necessarily in final suspension of payment. On the basis of the statistics of the rating agencies, we
retained as a threshold of classification the rate of default observed by the main international rating agencies
for the “Default” classes, i.e. approximately 77%;
27 The probability of default is the percentage expressing the probability of loss on current receivables over a given timeframe.

Journal of WEI Business and Economics-December 2017 Volume 6 Number 3
The West East Institute 12
Definition of the target number of classes: This definition was based primarily on the practices of large
Moroccan banks 28
and international rating agencies29
. The analysis of these practices showed that the
systems of notation adopt an odd number of classes with a minimum of seven classes, according to the
quality and the quantity of available data. On the basis of these reports, we tested several configurations
before retaining a system based on seven classes. The principal criteria used to evaluate the configurations
and to approve the final grid were as follows: normal distribution with a concentration of the observations
around the median classes, significant difference between the classes in terms of risk profile, and finally
increasing average rates of default (cf. default profile and sample distribution in the graph below);
Assignment of the companies to the suitable classes: in order to better address this stage, an initial
breakdown in a higher number of classes, before carrying out regroupings of the classes considered to be
redundant in terms of contributions in information, while supervising the normal distribution (few
observations in the very first and last classes with a gradual increase in the number of observations per class
until the median class, followed by a gradual decrease). On this basis, the intervals of Z-score were retained
to define the linkage of the observations to their respective classes;
Application of the rating grid to the sample
The rating matrix is presented bellow:
Table 08: Rating matrix
Source : Author
The distribution of our sample follows a normal distribution also called Gaussian. This law is one of the
laws of probabilities best adapted to model the risk of default coming from several random events. The normal law
has a null average and a unitary standard deviation. The graphical display of our observations follows a normal
distribution with a concentration of the observations around the median classes and a smoothing of few observations
between the beginning and the end, at increasing average rates of default. The graph below illustrates the profile of
default and the distribution of the sample.
28 The concerned banks are mainly Banque Centrale Populaire, Attijariwafa Bank, BMCE Bank of Africa, BMCI. 29 We relied on the international rating scales which are used by « The Big Three », for the construction of companies’ rating grids. These
agencies amount to 94% of the field’s revenue : Moody's and Standard & Poor's both hold a 40% market share, and Fitch Ratings 14 %.
Note Z-score Lower
Bound
Z-score
Upper bound
% Of the sample Default rate
(observed)
A - -10 4% 0%
B -10 -7 10% 0,4%
C -7 -4 20% 1,5%
D -4 -1,5 35% 10%
E -1,5 0 19% 14%
F 0 0,8 8% 28%
G 0,8 - 5% 54%

Journal of WEI Business and Economics-December 2017 Volume 6 Number 3
The West East Institute 13
Figure 02 : Distribution of the default profile
Source: Author
Conclusion
Our research first focused on the analysis of scoring techniques as decision-making help tools for loan
granting and risk pricing needs. These techniques retrospectively allow a classification of the portfolio risk of the
granted appropriations, and a budgeting of equity capital. In spite of the limits of the credit-scoring techniques, we
conclude that the majority of the authors agree on the importance of methodology and the predictive capacity of a
credit scoring model for the prediction of companies’ credit default within the framework of internal ratings-based
approaches (IRB) of Basel agreements.
Moreover, these methods make it possible to answer several key questions which arise as part of of the
process of credit risk modeling, particularly: Which is the best customer evaluation method? Which are the relevant
variables to integrate in the model? What type of information improves and facilitates the decision-making process?
What is the best measurement to predict customer behavior (healthy or defaulting)?
To answer this issue, we built a predictive model of default risk for Moroccan SMEs using the method
of the logistic regression (Logit). Thus, it stands out from the construction of our model of prediction of default, that
failing Moroccan SMEs are characterized by weak inventory turnovers, which implies problems of liquidity and
worsening of the working capital, which are generally badly perceived by the banks, a long customers receivables
turnover, a negative causality with asset turnover, which emphasizes the capacity of the companies to generate sales
revenue for each dirham invested, a weak total balance sheet and finally, a large percentage of medium and long-
term debt (MLT) compared to capital stocks, which increases the probability of the firm to default, and in fact
exposes the bank to counterpart risk.
At last, the obtained results are satisfactory, since the rate of good classification reaches 88,2%, and
the area under the ROC curve built from the modeling data is large, at AUC =0,915. These results, which were
obtained over a two-year period, are satisfactory compared to those obtained by comparable studies which were
carried out in this field. For this reason, the choice of the method of logistic regression as part of our research work is
justified, compared to the other methods, because of the nature of the issues, the type of data and finally, the nature
of the variable of interest “Probability of default”, which is a qualitative binary variable, on the one hand, and on the
other hand, regarding the good classification rates which this method offers, compared to the other probabilistic
models and intelligent techniques.
Ultimately, through this empirical research, we ascertain that there is no optimal model of credit
scoring, and no procedure which specifies the number of significant variables to retain, the grading scale and the
threshold of optimal release, the sample size and the effective validation technique of the credit scoring model, which

Journal of WEI Business and Economics-December 2017 Volume 6 Number 3
The West East Institute 14
all differ from a bank to another and a field to another. After deepened research, certain researchers such as Al Amari
(2002) reached the same conclusions. It seems justified to conclude that a good scoring model scoring must reflect
the culture of the financial institution regarding risk and credit policy.
References
Adizes L. (1991), « Les cycles de vie de l’entreprise », Les Editions d’Organisation.
Agarwal, V., & Taffler, R. (2008). Comparing the performance of market-based and accounting-based bankruptcy
prediction models. Journal of Banking & Finance, 32, 1541–1551.
Al Amari, A. (2002). “The credit evaluation process and the role of credit scoring: A case study of Qatar. Ph.D.
Thesis, University College Dublin.
Altman E.I.(2002). « Corporate distress prediction models in a turbulent economic and Basel II environment”,
Document de travail.
Altman, E. I. (2011). Default recovery rates and LGD credit risk modelling and practice. In A. Lipton & A. Rennie
(Eds.), The Oxford handbook of credit derivatives. Oxford: Oxford University Press.
Altman, E. I., & Rijken, H. A. (2004). How rating agencies achieve rating stability. Journal of Banking & Finance,
28, 2679–2714.
Anderson, R. (2007). “The Credit Scoring Toolkit: Theory and Practice for Retail Credit Risk Management and
Decision Automation”. New York: Oxford University Press.
Atiya, A. F. (2001). “Bankruptcy prediction for credit risk using neural networks: a survey and new results”. IEEE
Transactions on Neural Networks 12 (4): 929-935.
Baesens, B., Gestel, T. V., Viaene, S., Stepanova, M., Suykens, J., Vanthienen, J. (2003). “Benchmarking State-of-
the-Art Classification Algorithms for Credit Scoring”. Journal of the Operational Research Society 54 (6):627-635
Bailey, M. (2001). “Credit scoring: the principles and practicalities”. Kingswood, Bristol: White Box Publishing.
Bailey, M. (2004). “Consumer credit quality: underwriting, scoring” fraud prevention and collections. Kingswood,
Bristol: White Box Publishing.
Bauer, J., & Agarwal, V. (2014). Are hazard models superior to traditional bankruptcy prediction approaches? A
comprehensive test. Journal of Banking & Finance, 40, 432–442.
Beaver, W. H., McNichols, M. F., & Rhie, J.-W. (2005). Have financial statements become less informative?
Evidence from the ability of financial ratios to predict bankruptcy. Review of Accounting Studies, 10, 93–122.
Bensic, M., Sarlija, N., Zekic-Susac, M. (2005). “Modelling small-business credit scoring by using logistic
regression, neural networks and decision trees”. Intelligent Systems in Accounting, Finance and Management 13(3):
133-150.
Casta J.F, Zerbib J.P. (1979), Prévoir la défaillance des entreprises ?, Revue française de comptabilité, 97, 506 - 526.
Casta J.F, Zerbib J.P. Prévoir la défaillance des entreprises ?, Revue française de comptabilité, 97, 506, 1979.
Chandler, G. G., Coffman, J. Y. (1979). “A comparative analysis of empirical vs. judgemental credit evaluation”.
The Journal of Retail Banking 1 (2): 15-26.
Cramer, J. S. (2004). “Scoring bank loans that may go wrong: A case study”. Statistica Neerlandica, 58 (3): 365-380.
Cristophe, H,(2003), « Econométrie des Variables Qualitatives », Université d’Orléans.

Journal of WEI Business and Economics-December 2017 Volume 6 Number 3
The West East Institute 15
Emel, A., Oral, M., Reisman, A., Yolalan, R. (2003). “A credit scoring approach for the commercial banking sector”.
Socio-Economic Planning Sciences 37 (2): 103-123.
Etemadi, H., Rostamy, A., Dehkordi, H. (2009). “A genetic programming model for bankruptcy prediction:
Empirical evidence from Iran‟, Expert Systems with Applications 36 (2/2): 3199-3207.
Hand, D. J., Henley, W. E. (1997) “Statistical Classification Methods in Consumer Credit Scoring: A Review”.
Journal of the Royal Statistical Society: Series A (Statistics in Society) 160 (3): 523-541.
Katsuda, H., & Tanaka, K. (2008). Neural network method as a new corporate rating method for Basel II. Osaka
Economic Papers, 57, 32–45. [in Japanese].
Leahy, M., S. Schich, G. Wehinger, F. Pelgrin et T. Thorgeirsson. (2001), « Contributions of Financial Systems to
Growth in OECD countries », Document de travail du Département des affaires économiques, n° 280.
Luoma, M et Laitinen, E.K. « Survival analysis as a tool for company failure prediction”, Omega International
Journal of Management Science, Vol. 19, n°6, 1991, pp.673-678.
Malécot, J-F. « les défaillances : Un essai d’explication », Revue Française de Gestion, 1981, pp. 10-19.
Moody’s Investors Service. (2014). Rating methodology: Global manufacturing companies (Technical report). New
York, NY: Author.
Ohlson, J. A. (1980). Financial ratios and the probabilistic prediction of bankruptcy. Journal of Accounting Research,
18, 109–131.
Research reports and government publications :
Bank Al Maghreb, (2016), « Annual Report on Banking Supervision », Exercice 2016.
Bank Al Maghreb, (2015), « Annual Report on Banking Supervision », Exercice 2015.
Bank Al Maghreb, (2014), « Annual Report on Banking Supervision», Exercice 2014.
Bank Al Maghreb, (2013), « Annual report on the control, activity and results of credit institutions », Exercice 2013.
Bank Al Maghreb, (2012), « Annual report on the control, activity and results of credit institutions », Exercice 2012.
Bank Al Maghreb, (2009), « Annual report on the control, activity and results of credit institutions », Exercice 2009.
Bank Al Maghreb, (2008), « Annual report on the control, activity and results of credit institutions », Exercice 2008.
Bank Al Maghreb, (2007), « Annual report on the control, activity and results of credit institutions », Exercice 2007.
Bank Al Maghrib, (2004), « Annual report on the control, activity and results of credit institutions », Exercice 2004