Predicting 'Attention Deficit Hyperactive Disorder' using ...
51
San Jose State University San Jose State University SJSU ScholarWorks SJSU ScholarWorks Master's Projects Master's Theses and Graduate Research Fall 2015 Predicting 'Attention Deficit Hyperactive Disorder' using large Predicting 'Attention Deficit Hyperactive Disorder' using large scale child data set scale child data set Arpi Shah San Jose State University Follow this and additional works at: https://scholarworks.sjsu.edu/etd_projects Part of the Computer Sciences Commons Recommended Citation Recommended Citation Shah, Arpi, "Predicting 'Attention Deficit Hyperactive Disorder' using large scale child data set" (2015). Master's Projects. 450. DOI: https://doi.org/10.31979/etd.z57f-a75m https://scholarworks.sjsu.edu/etd_projects/450 This Master's Project is brought to you for free and open access by the Master's Theses and Graduate Research at SJSU ScholarWorks. It has been accepted for inclusion in Master's Projects by an authorized administrator of SJSU ScholarWorks. For more information, please contact [email protected].
Transcript of Predicting 'Attention Deficit Hyperactive Disorder' using ...
San Jose State University San Jose State University
SJSU ScholarWorks SJSU ScholarWorks
Master's Projects Master's Theses and Graduate Research
Fall 2015
Predicting 'Attention Deficit Hyperactive Disorder' using large Predicting 'Attention Deficit Hyperactive Disorder' using large
scale child data set scale child data set
Arpi Shah San Jose State University
Follow this and additional works at: https://scholarworks.sjsu.edu/etd_projects
Part of the Computer Sciences Commons
Recommended Citation Recommended Citation Shah, Arpi, "Predicting 'Attention Deficit Hyperactive Disorder' using large scale child data set" (2015). Master's Projects. 450. DOI: https://doi.org/10.31979/etd.z57f-a75m https://scholarworks.sjsu.edu/etd_projects/450
This Master's Project is brought to you for free and open access by the Master's Theses and Graduate Research at SJSU ScholarWorks. It has been accepted for inclusion in Master's Projects by an authorized administrator of SJSU ScholarWorks. For more information, please contact [email protected].
Predicting 'Attention Deficit Hyperactive Disorder' using large scale child
data set
A Writing Project Report
Presented to
The Faculty of the Department of Computer Science
San Jose State University
In Partial Fulfillment
Of the Requirements for the Degree
Master of Science
By
Arpi Shah
Dec 2015

© 2015
Arpi Shah
ALL RIGHTS RESERVED

The Designated Project Committee Approves the Project Titled
Predicting 'Attention Deficit Hyperactivity Disorder' using large scale child data
set
By
Arpi Shah
APPROVED FOR THE DEPARTMENTS OF COMPUTER SCIENCE
SAN JOSE STATE UNIVERSITY
DEC 2015
Dr. Duc Thanh Tran (Department of Computer Science)
Dr. Thomas Austin (Department of Computer Science)
Ms. Saranya Venkateswaran (IT Security Consultant, Coalfire Systems Inc.)
ABSTRACT
Attention deficit hyperactivity disorder (ADHD) is a disorder found in children
affecting about 9.5% of American children aged 13 years or more. Every year,
the number of children diagnosed with ADHD is increasing. There is no single
test that can diagnose ADHD. In fact, a health practitioner has to analyze the
behavior of the child to determine if the child has ADHD. He has to gather
information about the child, and his/her behavior and environment. Because of all
these problems in diagnosis, I propose to use Machine Learning techniques to
predict ADHD by using large scale child data set. Machine learning offers a
principled approach for developing sophisticated, automatic, and objective
algorithms for analysis of disease. Lot of new approaches have immerged which
allows to develop understanding and provides opportunity to do advanced
analysis. Use of classification model in detection has made significant impacts in
the detection and diagnosis of diseases.
I propose to use binary classification techniques for detection and diagnosis of
ADHD.

ACKNOWLEDGEMENTS
I am grateful to my project advisor Dr. Duc Thanh Tran for devoting time and
knowledge in guiding me in my Master’s project on “Predicting Attention Deficit
Hyperactivity Disorder using large scale child data set”. The project could not be
completed without his expertise and guidance. I feel indebted to have learned
numerous things under his technical as well as non-technical expertise and
support in the implementation.
I am also sincerely thankful to my committee members Dr. Thomas Austin and
Ms. Saranya Venkateswaran for their aspiring guidance, invaluably constructive
criticism and friendly advice during the project work. Without their cooperation
and encouragement, project would not complete.
Last but not the least, I would like to express my gratitude to my family and
friends for being very kind, keen, supportive and encouraging throughout the
journey which helped me in completion of this project.
1
TABLE OF CONTENTS
CHAPTER
1 Introduction................................................................................................. 5
2 Background................................................................................................ 7
3 Problem...................................................................................................... 9
3.1 Dataset................................................................................................. 10
4 Proposed Solution...................................................................................... 12
4.1 Architecture for Proposed Solution....................................................... 12
4.2 Data Acquisition................................................................................... 13
4.3 Data Cleaning...................................................................................... 14
4.4 Training Data and Test Data................................................................ 15
4.5 Model Building...................................................................................... 16
4.6 Model Testing....................................................................................... 19
4.7 Model.................................................................................................... 20
5 Implementation........................................................................................... 21
5.1 Data Cleaning....................................................................................... 21
5.2 Training Data and Test Data................................................................ 27
5.3 Model Building and Testing.................................................................. 28
5.3.1 Weka.......................................................................................... 29
5.3.2 Apache Spark............................................................................. 35

2
6 Conclusion and Future work...................................................................... 43
References................................................................................................. 44
3
LIST OF FIGURES
Figure 1: Sample of Dataset.............................................................................
Figure 2: Architecture of the proposed solution................................................
Figure 3: Model Building...................................................................................
Figure 4: Typical steps in machine learning.....................................................
Figure 5: Dataset with label..............................................................................
Figure 6: Machine learning with label...............................................................
Figure 7: Concatenating negative and positive ADHD records separately.......
Figure 8: Concatenated data............................................................................
Figure 9: Removing redundant information......................................................
Figure 10: Removing header information.........................................................
Figure 11: Adding Label to the data..................................................................
Figure 12: Model building and predicting responses........................................
Figure 13: Parameter values............................................................................
Figure 14: Data after parameter tuning in Weka...............................................
Figure 15: Apache Spark's cluster architecture................................................
Figure 16: Data flow in Amazon Elastic Map Reduce.......................................
Figure 17: Logging in master node of cluster...................................................
Figure 18: Generating prediction in Apache Spark...........................................
Figure 19: Prediction in Apache Spark.............................................................
11
12
16
17
17
18
19
23
24
25
26
28
33
34
36
37
38
41
41
4
Figure 20: Evaluation of model.........................................................................
Figure 21: Accuracy of test set.........................................................................
42
42
5
1
INTRODUCTION
Attention deficit hyperactivity disorder (ADHD) is one of the most common mental
disorders diagnosed in the children. It affects around 9% of American children
every year. It has been diagnosed in 5.9 million children till date. The cause of
ADHD is not known. Some say that heredity, chemical imbalance; change in
brain, poor nutrition or toxins cause it.
Symptoms of ADHD can be grouped into three categories, namely Inattention,
Hyperactivity and Impulsivity. If a child is careless, cannot concentrate, doesn't
listen and is easily distracted, or if the child easily loses things and forgets about
tasks and daily activities, then he likely has ADHD. If the child shows the sign of
hyperactivity such as not being able to sit at one place, talking excessively or
squirming, then he might have ADHD. If the child is having trouble waiting for his
turn, answers abruptly or interrupts others or shows impulsivity, then he has
ADHD.
Many symptoms of ADHD can be managed with stimulants or by imparting
special education and training

6
Diagnosis of ADHD is one major challenge facing the country today. There is no
single test that can diagnose ADHD. A patient's healthcare team might include a
doctor, a psychoanalyst and a social worker. The doctor may want to interview
parents, relatives, teachers and family members, observe personality trends in
child’s behavior, and administer questionnaires or rating scales to measure
symptoms of ADHD. He might also conduct psychological tests if needed. This
gives the doctor insight into how symptoms of ADHD affect daily moods,
behavior, productivity, and lifestyle habits. Doctors may also ask for CT scan and
MRI for brain abnormalities, blood test for lead levels and thyroid disease
detection, hearing and eyesight test. This might consume lot of time and the
situation of child may worsen over time.
I propose to detect ADHD by using machine learning binary classification
technique. This will speed up diagnosis of ADHD.
7
2
BACKGROUND
ADHD is a neurobehavioral disorder commonly found among children. Children
with ADHD show symptoms of impulsivity, inattention, distractibility and
hyperactivity. There is no single laboratory test to detect ADHD which makes it
difficult to diagnose it. For a child to be diagnosed by ADHD, he must meet the
official symptom guidelines. The child is also analyzed over his behavior and
reactions in different situations. Doctors also obtain information about the child’s
behavior from teachers and parents. The child might also have to undergo
several tests as guided by the doctor. Even after doing all this, doctors believe
that defect is either over diagnosed or under diagnosed in several children. All
these problems led me to use machine learning techniques to detect if a child
has ADHD or not.
Machine learning is a process of analyzing data to generate a model. This model
represents known patterns and knowledge which is applied to new data for
detection of a disease. In the project, data is labeled according to the positively
diagnosed ADHD records and negatively diagnosed ADHD records. Data is
present in the form of text. It is divided into training and test sets. Training set
consists of training examples which is used to learn the classification model and
test set consist of test examples which is used to test the trained model.

8
The trained, tested and evaluated model is then used to predict if a child has
ADHD or not. This type of learning is called supervised machine learning and I
am going to employ the same in my project. I have used two machine learning
algorithms in project.
Naive Bayes is a generative model as it estimates joint probability for the
features and label from the training data. It works well when there is no
correlation between the data.
Logistic regression, on the other hand is discriminative model which computes
individual probability for the features and label from the training data overcoming
the drawback of dependence in features.
Models are built on Weka and Apache Spark. Weka provides a framework with a
collection of machine learning algorithms which can be applied conveniently to
the dataset. Apache Spark is a fast and general engine for big data processing,
with built-in modules for machine learning. Machine learning has been performed
on Amazon Web Services - Elastic Map Reduce which provides convenient way
to create and manage clusters and develop and run Spark applications over it.
9
3
PROBLEM
The problem is to predict if a child will have ADHD or not. To detect whether the
patient has ADHD or not is a challenging task. Diagnosing ADHD is difficult
during the initial stages because many of the early symptoms can be caused by
other more common health conditions. There's no single test for ADHD, and
diagnosis is done by observing person’s symptoms and behavior. There can be
delays in diagnosis as sometimes the doctors themselves need some time and
observation to be sure of the situation, particularly in cases where the condition
progresses very slowly. Thus, there is a need for mechanism that can accurately
detect ADHD.
It is a Machine Learning problem, chosen to be solved using Supervised
Learning techniques. The problem of detection of whether or not a child has
ADHD belongs to binary classification domain where the result is either yes or
no.
Dataset used in the project is obtained from Vaccine Adverse Event Reporting
System (VAERS) which is a nation vaccine surveillance program which collects
and shares information about adverse events following immunization. Dataset
contains patient's symptom stories. The problem is the presence of random
10
textual data and phrases, which makes the task of prediction very challenging.
Moreover, the dataset requires being cleaned, filtered and restructured to make it
useful. Special characters, language specifics and repetitions in data need to be
dealt with carefully. There are some columns in the dataset which does not
contribute to the purpose of detection and hence needs to be removed.
3.1 Dataset
Dataset is in the form of CSV files over the year range 1991 - 2015.
Dataset consists of attributes out of which attributes having primary importance
are following:
Vaers_id:
The VAERS identification number is a sequentially assigned number used for
identification purposes. It serves as a link between the data files.
Type - Numeric
Example - 66341
Symptoms:
Symptom text is recorded here. MedDRA Terms are derived from this text and
placed in the VAERS Symptoms.
11
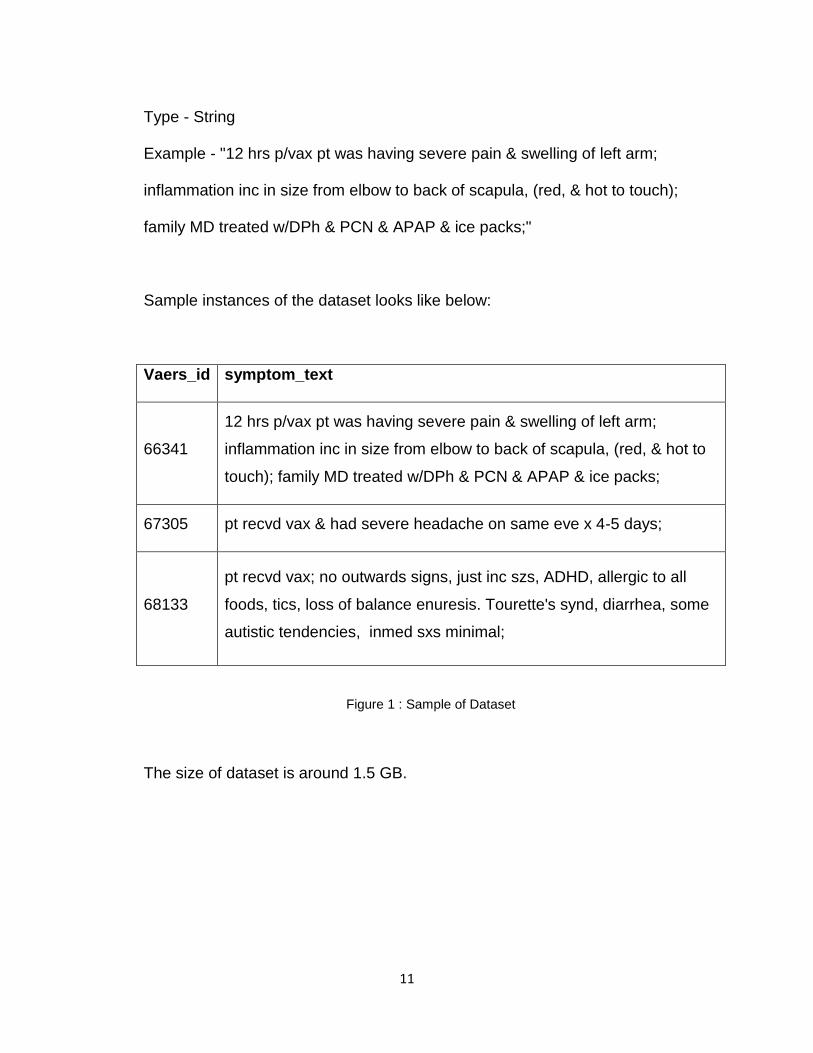
Type - String
Example - "12 hrs p/vax pt was having severe pain & swelling of left arm;
inflammation inc in size from elbow to back of scapula, (red, & hot to touch);
family MD treated w/DPh & PCN & APAP & ice packs;"
Sample instances of the dataset looks like below:
Vaers_id symptom_text
66341
12 hrs p/vax pt was having severe pain & swelling of left arm;
inflammation inc in size from elbow to back of scapula, (red, & hot to
touch); family MD treated w/DPh & PCN & APAP & ice packs;
67305 pt recvd vax & had severe headache on same eve x 4-5 days;
68133
pt recvd vax; no outwards signs, just inc szs, ADHD, allergic to all
foods, tics, loss of balance enuresis. Tourette's synd, diarrhea, some
autistic tendencies, inmed sxs minimal;
Figure 1 : Sample of Dataset
The size of dataset is around 1.5 GB.
12
4
PROPOSED SOLUTION
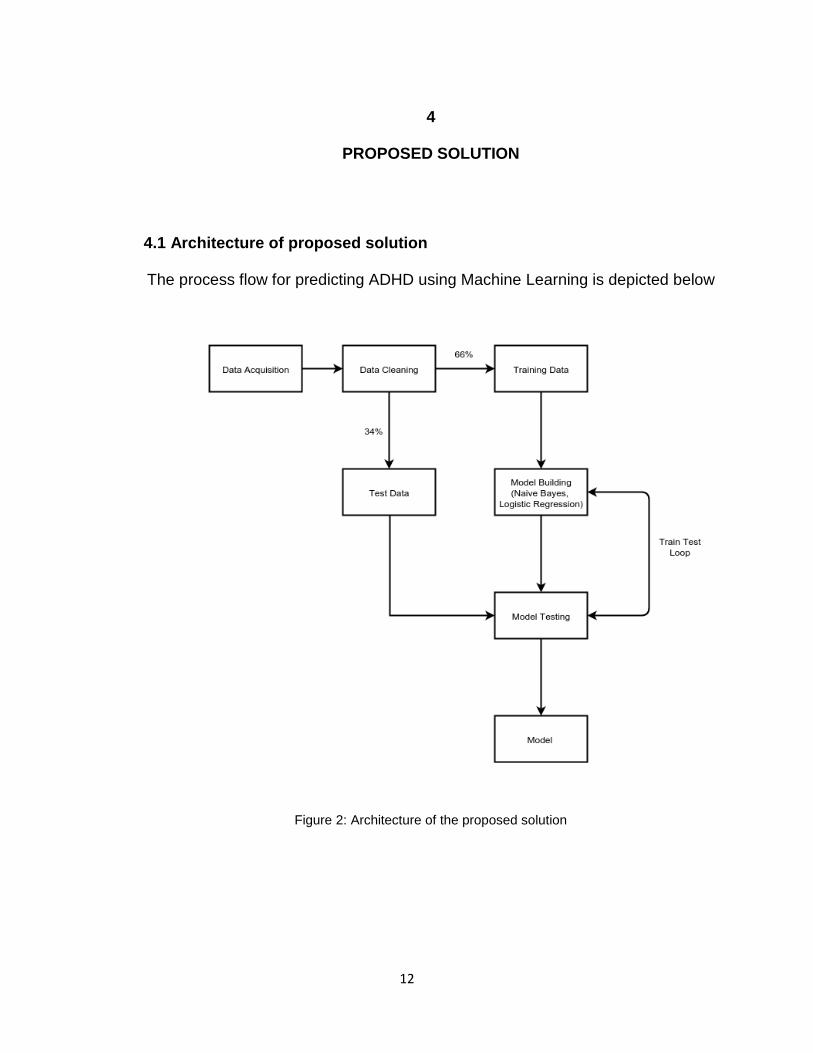
4.1 Architecture of proposed solution
The process flow for predicting ADHD using Machine Learning is depicted below
Figure 2: Architecture of the proposed solution

13
Initially, the dataset is collected from VAERS in the Data Acquisition phase.
Dataset is in CSV format which can be easily used in Apache Spark. It is
converted into text format to be used in Weka. During Data Cleansing phase,
redundant and unnecessary information and noise is removed. Column for
label/class is added according to be used in the machine learning algorithm. In
all, dataset is cleansed and amended so that it can be easily consumed by
different machine learning algorithms and framework. After data cleansing,
cleaned dataset is divided into 2 parts, namely training data and test data.
Training data contains the training instances which are used to train the model.
Testing data contains data which is used to test the model after it has been
trained. Testing data does not contain the resultant column. Training set contains
66% of dataset instances whereas testing dataset contains 34% of dataset
instances. Once train set is obtained, features are extracted and the model is
trained over training set. After training the model, it is tested using test set. If the
model does not produce satisfactory results, it is trained again by tuning the
parameters. The process of model testing is continued until a satisfactory model
is generated. After the model is tested over several iterations, it is delivered.
4.2 Data Acquisition
To satisfy the goal of predicting ADHD using machine learning techniques, it was
important to find a data source which had data lying over a wide date range.
14
VAERS has data ranging over span of approximately 25 years specifically from
1990 to 2015. Dataset obtained from VAERS was available in the form of CSV
files, spreadsheets and text files. To load data into the machine learning
framework for processing, it was necessary to integrate and transform the data.
This is the next phase in the process.
4.3 Data Cleaning
Data cleaning is a process of converting messy data into tidy data. About 60% of
time is spent in cleaning the data. It might seem to come earlier in the process
but it is actually an iterative approach. Even after applying model, there might be
a need to cleanse the data again. In that case, dataset need to be restructured
again in the middle of machine learning process. Data cleansing is one of the
crucial steps in the process. It involves 3 steps: selecting the data, preprocessing
the data and transforming the data. Once the data has been selected, it needs to
be formatted, cleaned and sampled. Final step in cleansing data is transforming
data. The knowledge of problem domain and the algorithm choice will influence
in transforming data. There might be a need to revisit and re cleanse the data if
need arises in between machine learning processing. Scaling and aggregation is
performed to cleanse the data.
15
4.4 Training Data and Test Data
The cleansed data obtained from above step is divided into 2 sets namely
Training set and Test set. Training set is implemented to build a model and test
set is used to validate the trained model. Data points of training set are excluded
from the test set. It is important to create training and test set with care so that
one type of data points do not go in one set. To avoid that, the data points should
be randomly added to the two sets.
For the purpose of making strong training and test set, sorting of records in the
CSV file is done followed by selection of records randomly for sampling.
N-fold cross validation is also used to randomize the data set and create N folds
equally sized. N-1 folds are used for training and 1 fold is used for testing. This
also avoids the problem of over fitting by disregarding noise.
The fields in training and test data are different. Training data will have field
‘Label’ or will be organized in directory ‘negative’ or ‘positive’. Test set will not
have any recognition for the class it belongs to as that is to be evaluated.
cut -d testData_Label01.csv > testData_Label02.csv
16
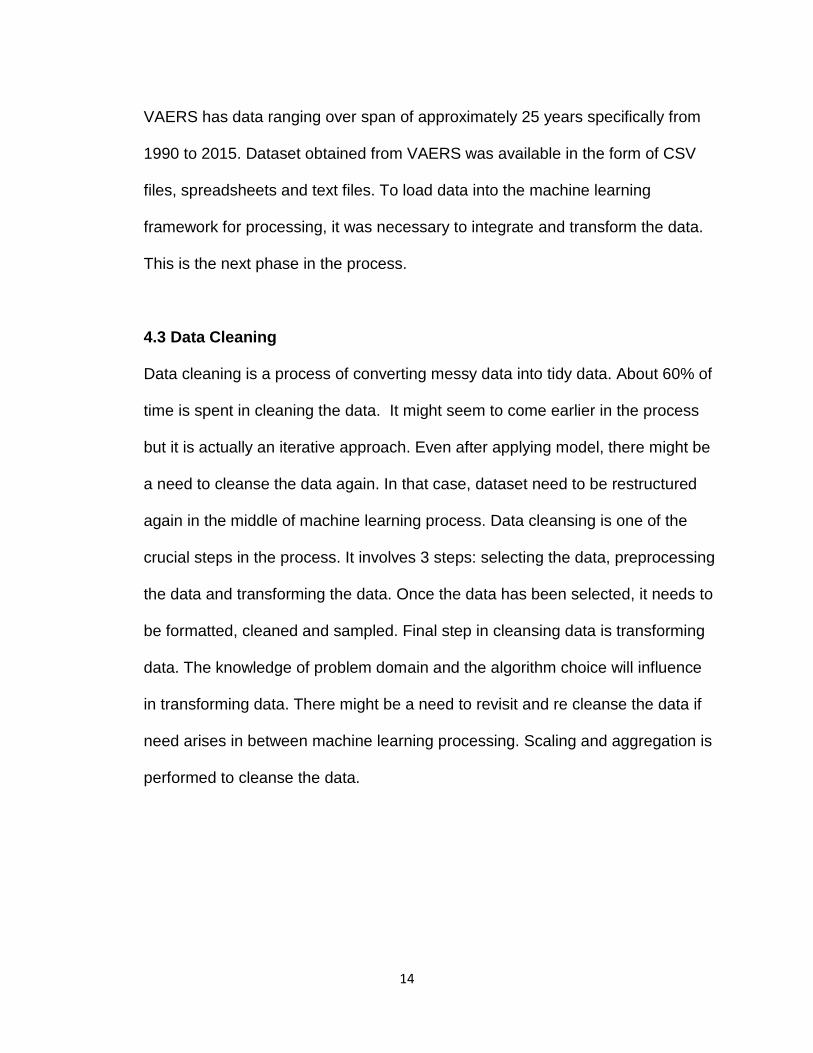
4.5 Model Building
To build the model, supervised learning algorithms are used. As described
before, training sets consist of a set of attributes including the ‘class’ or the ‘label’
attribute. The prediction algorithm learns about the connectivity of predictor
variable and the resultant variable from the training data. This will result in a
classification/prediction model. New data is fed to this model to make
predictions.
Figure 3: Model Building
Typical steps in Machine Learning are Featurization, Training and Model
Evaluation. Feature vectors are created from training data. These vectors are

17
then used for training the model. Model is generated which is then evaluated in
the next phase to get the best model.
Figure 4: Typical steps in machine learning
The ‘class’ label is very important to be present in the training model for learning
purposes. The ‘class’ or ‘label’ field tells if a patient has ADHD or not. In the
project, it has values in the form of 0 and 1.
Figure 5: Dataset with label
18
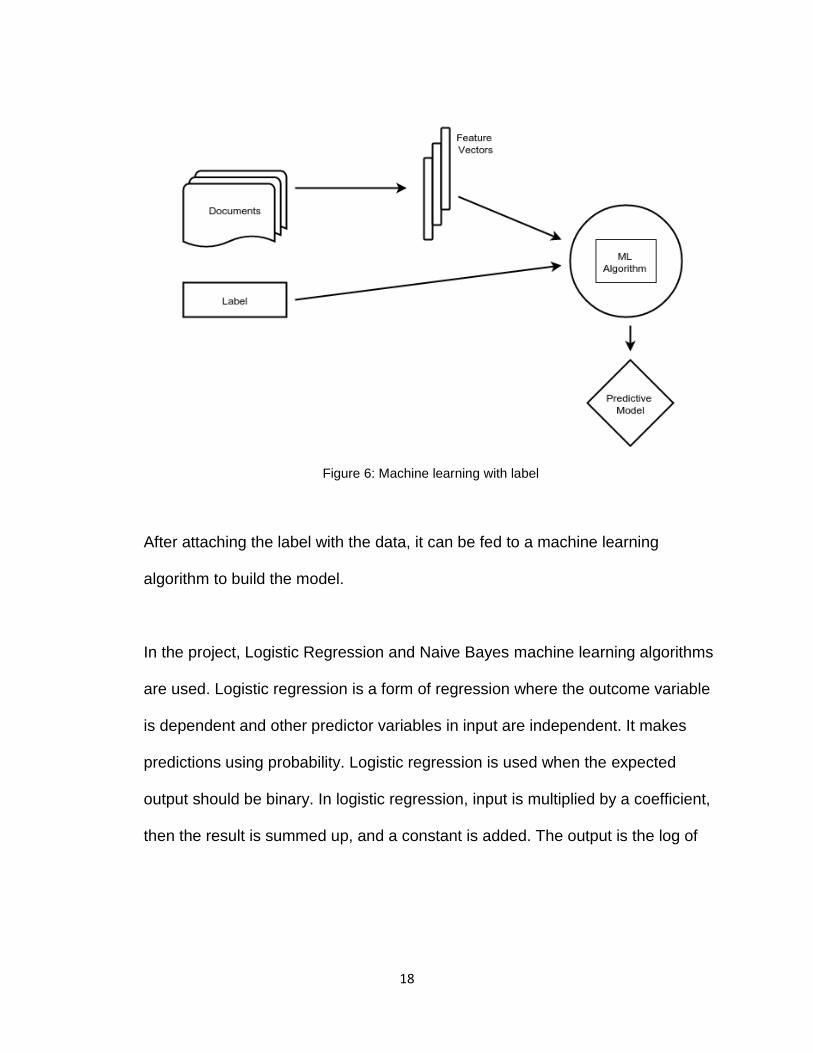
Figure 6: Machine learning with label
After attaching the label with the data, it can be fed to a machine learning
algorithm to build the model.
In the project, Logistic Regression and Naive Bayes machine learning algorithms
are used. Logistic regression is a form of regression where the outcome variable
is dependent and other predictor variables in input are independent. It makes
predictions using probability. Logistic regression is used when the expected
output should be binary. In logistic regression, input is multiplied by a coefficient,
then the result is summed up, and a constant is added. The output is the log of

19
the odds ratio. Odds ratio is the odds that person has ADHD divided by odds that
person does not have ADHD.
Area under ROC curve is the measure of the quality of the classification model.
AUC for a perfect classifier is 1 and AUC for most classification models lay
between 0.5 and 1.
Naive Bayes classifier is based on Bayes' theorem and categorized as a
probabilistic classifier. It assumes that variables are independent even if they are
actually not. That is why it is also termed as naive as it assumes variable
independence but might not necessarily have it.
4.6 Model Testing
After training a model using training set and checking its error on training set, it is
important to see how effective the model reacts on test set. Because data points
present in validation set is not present in test set, that is why it is an unseen
world for the model and hence it is important to record the performance of model
on test set. If model testing does not yield sound results, then entire process of
training, parameter tuning and testing should be redone until a sound model is
developed.

20
Measurement of accuracy and performance of a model varies from algorithm to
algorithm.
4.7 Model
Once the model is trained and tested, then it can be delivered.
21
5
IMPLEMENTATION
5.1 Data Cleaning
Data cleaning is one of the most crucial steps in machine learning. To clean the
data, the removal or fixing of missing information is crucial. Some instances
having no or incomplete information might also need to be removed. Moreover,
there are lots of fields in the dataset which is of no use to us and hence needs to
be removed. The fields that are of primary importance: Vaers_id and
symptom_text. Data cleaning involves 3 steps: selecting the data, preprocessing
the data and transforming the data. Once the data has been selected, it needs to
be formatted, cleaned and sampled.
In formatting, the data needs to be formatted according to the algorithmic and
framework requirement.
Therefore, for the data to be used in Weka, it was necessary to convert the
dataset into directories containing text files. For processing in Weka, the directory
was organized in the following form:-
Data -> positive -> Files containing symptoms of patients having ADHD -
22
pos_[VAERS ID].txt
Data -> negative -> Files containing stories of patients not having ADHD -
neg_[VAERS ID].txt
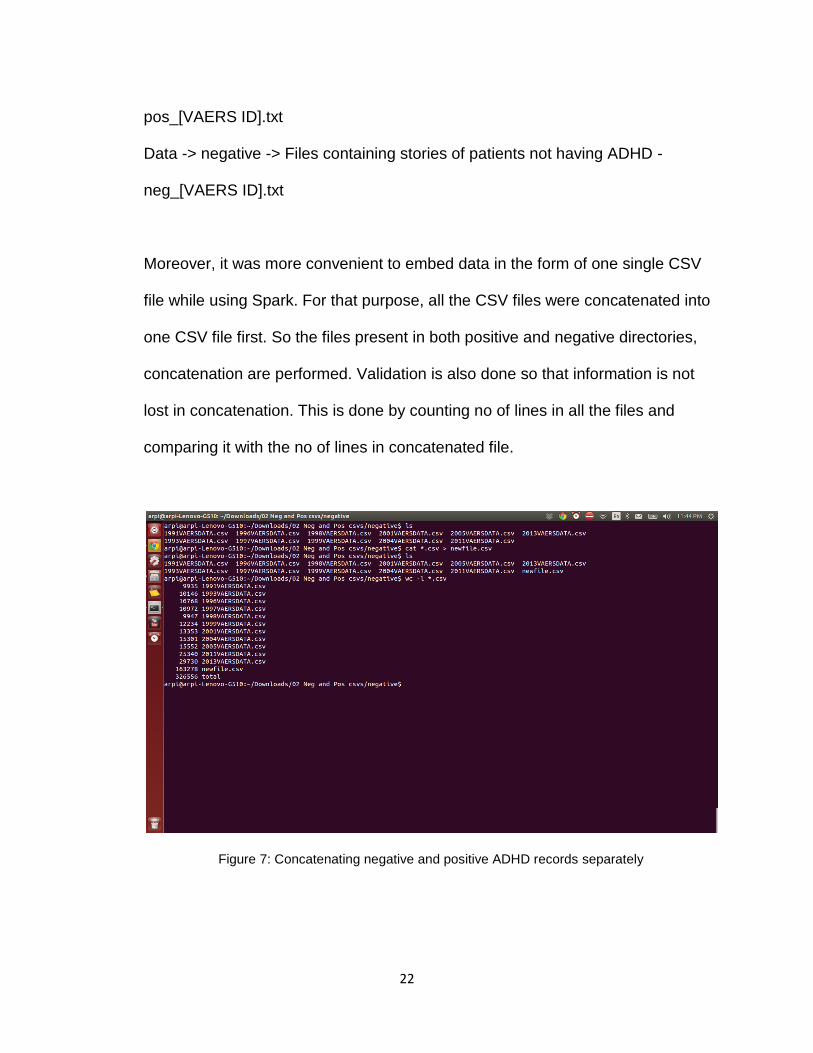
Moreover, it was more convenient to embed data in the form of one single CSV
file while using Spark. For that purpose, all the CSV files were concatenated into
one CSV file first. So the files present in both positive and negative directories,
concatenation are performed. Validation is also done so that information is not
lost in concatenation. This is done by counting no of lines in all the files and
comparing it with the no of lines in concatenated file.
Figure 7: Concatenating negative and positive ADHD records separately
23
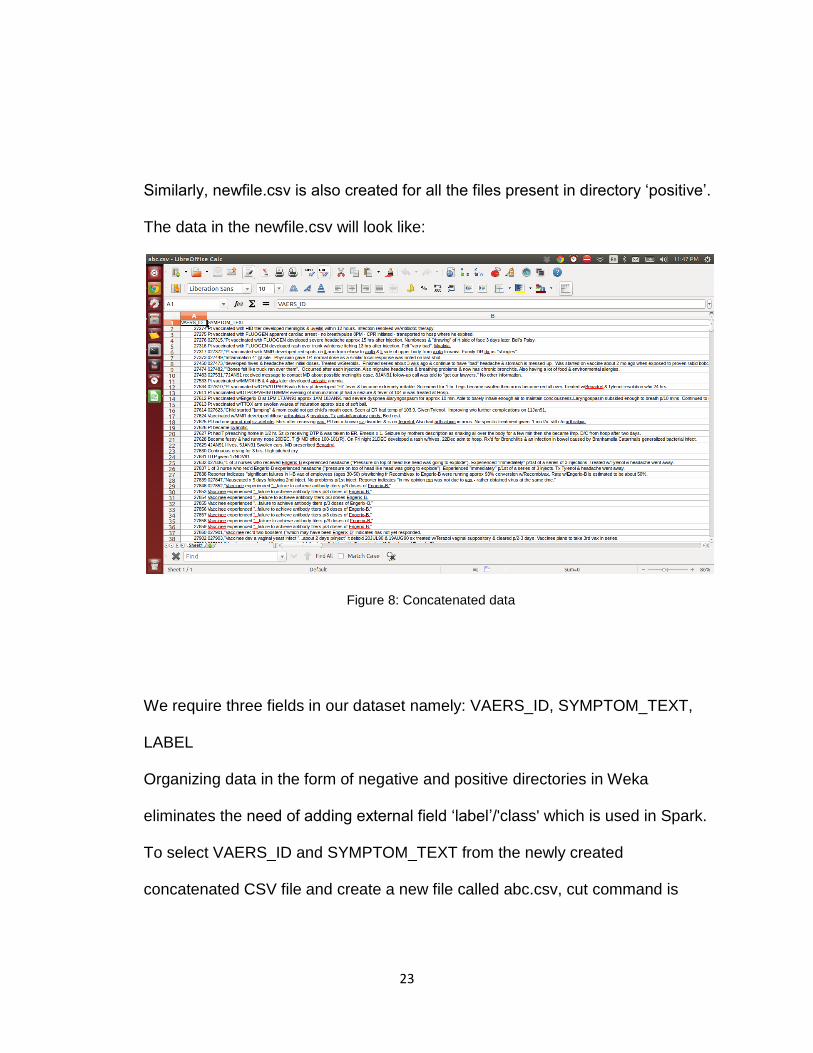
Similarly, newfile.csv is also created for all the files present in directory ‘positive’.
The data in the newfile.csv will look like:
Figure 8: Concatenated data
We require three fields in our dataset namely: VAERS_ID, SYMPTOM_TEXT,
LABEL
Organizing data in the form of negative and positive directories in Weka
eliminates the need of adding external field ‘label’/'class' which is used in Spark.
To select VAERS_ID and SYMPTOM_TEXT from the newly created
concatenated CSV file and create a new file called abc.csv, cut command is
24
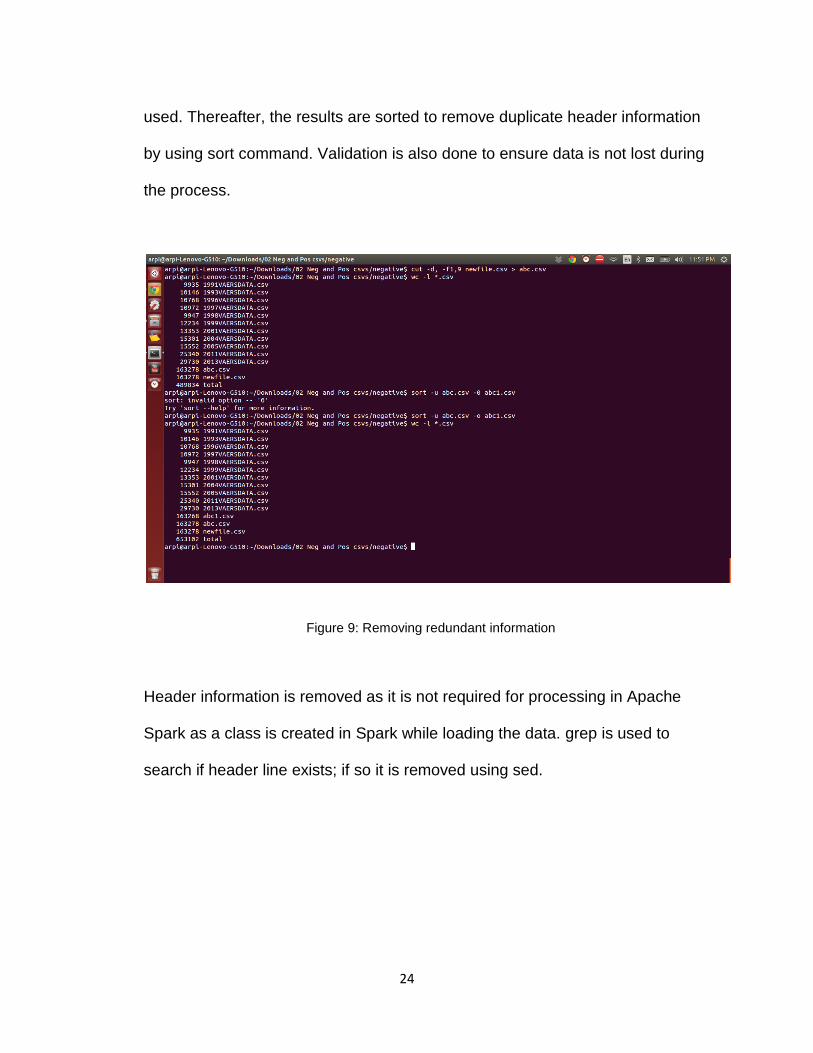
used. Thereafter, the results are sorted to remove duplicate header information
by using sort command. Validation is also done to ensure data is not lost during
the process.
Figure 9: Removing redundant information
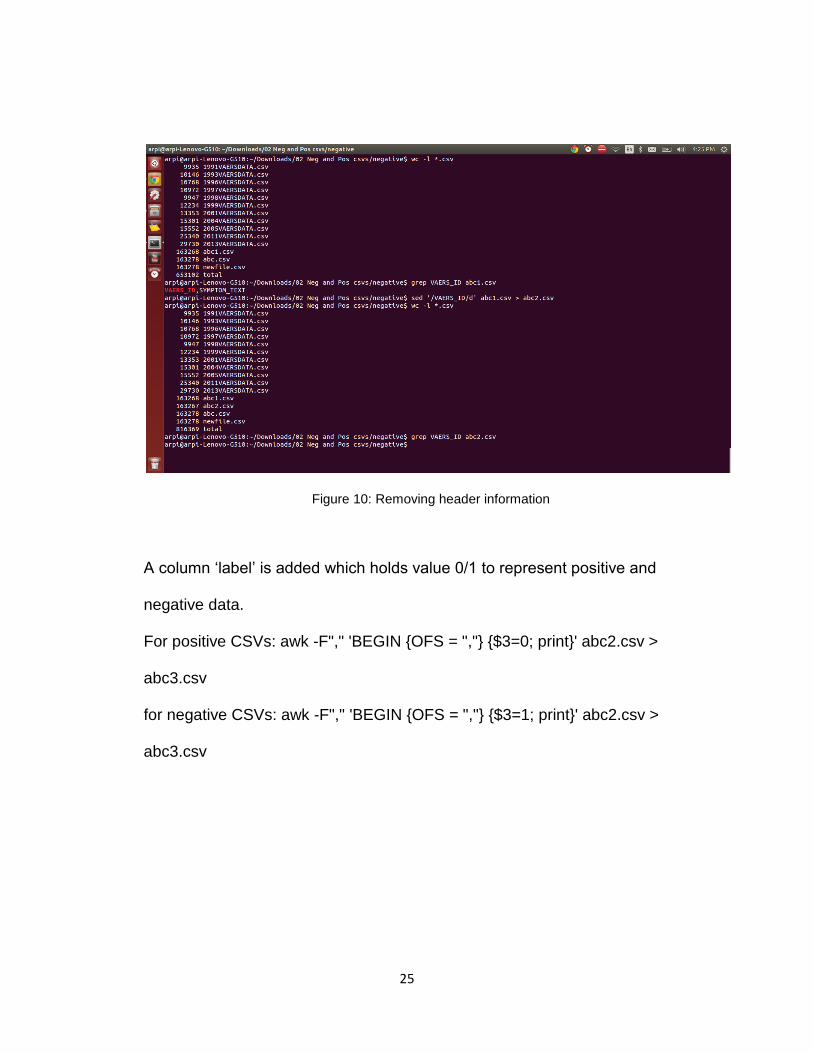
Header information is removed as it is not required for processing in Apache
Spark as a class is created in Spark while loading the data. grep is used to
search if header line exists; if so it is removed using sed.
25
Figure 10: Removing header information
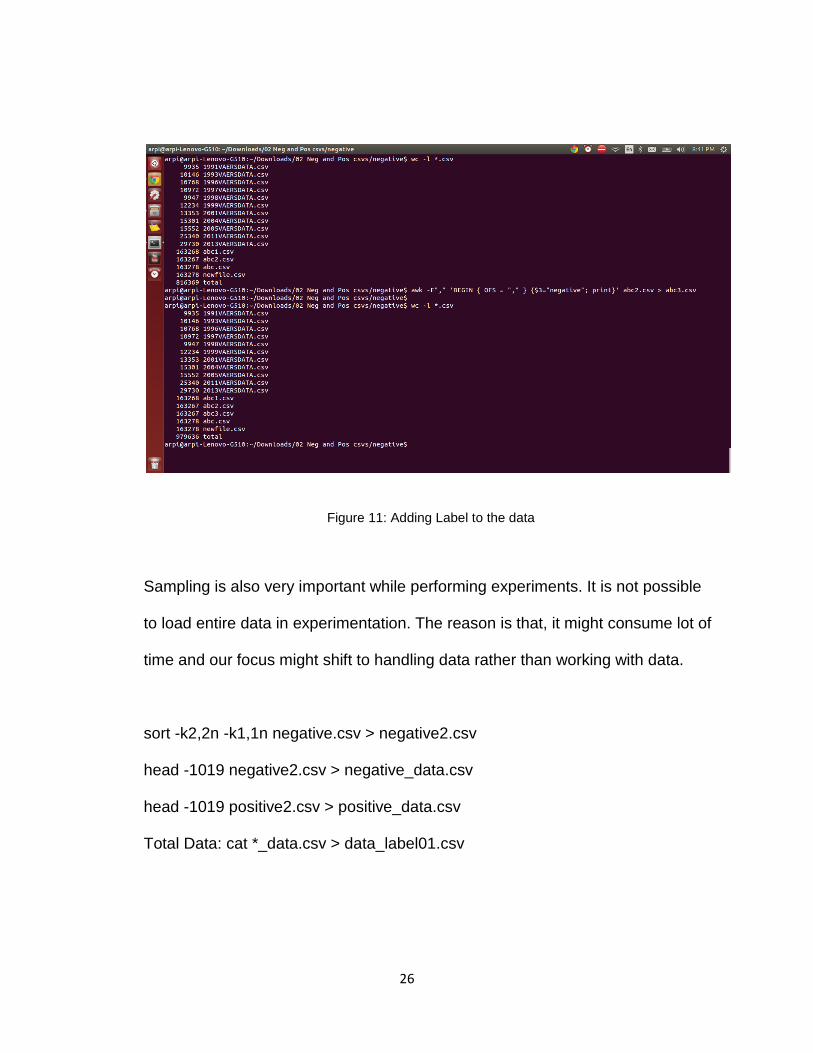
A column ‘label’ is added which holds value 0/1 to represent positive and
negative data.
For positive CSVs: awk -F"," 'BEGIN {OFS = ","} {$3=0; print}' abc2.csv >
abc3.csv
for negative CSVs: awk -F"," 'BEGIN {OFS = ","} {$3=1; print}' abc2.csv >
abc3.csv
26
Figure 11: Adding Label to the data
Sampling is also very important while performing experiments. It is not possible
to load entire data in experimentation. The reason is that, it might consume lot of
time and our focus might shift to handling data rather than working with data.
sort -k2,2n -k1,1n negative.csv > negative2.csv
head -1019 negative2.csv > negative_data.csv
head -1019 positive2.csv > positive_data.csv
Total Data: cat *_data.csv > data_label01.csv
27
5.2 Training Set and Test Set
Training and test set can be created from the dataset obtained after data
cleaning. In the project 66% of data is training data and 34% of data is test data.
For example for the above created sample of data, training and test set can be
created by selecting random records from the data. The CSV file can be sorted
so there is no need to randomly pick record.
sort -k2,2n -k1,1n positive.csv > positive_data.csv
sort -k2,2n -k1,1n negative.csv > negative_data.csv
Training and test set for the sample can be created as follows:
head -673positive_data.csv > training_positive.csv
head -673 negative_data.csv > training_negative.csv
tail -346 negative_data.csv > test_negative.csv
tail -346 positive_data.csv > test_positive.csv
wc -l training_*.csv test_*.csv
cat test_*.csv > testData_Label01.csv
cat training_*.csv > trainingData_Label01.csv
Thus, we have 2 sets, one called training set and the other is test set.
28
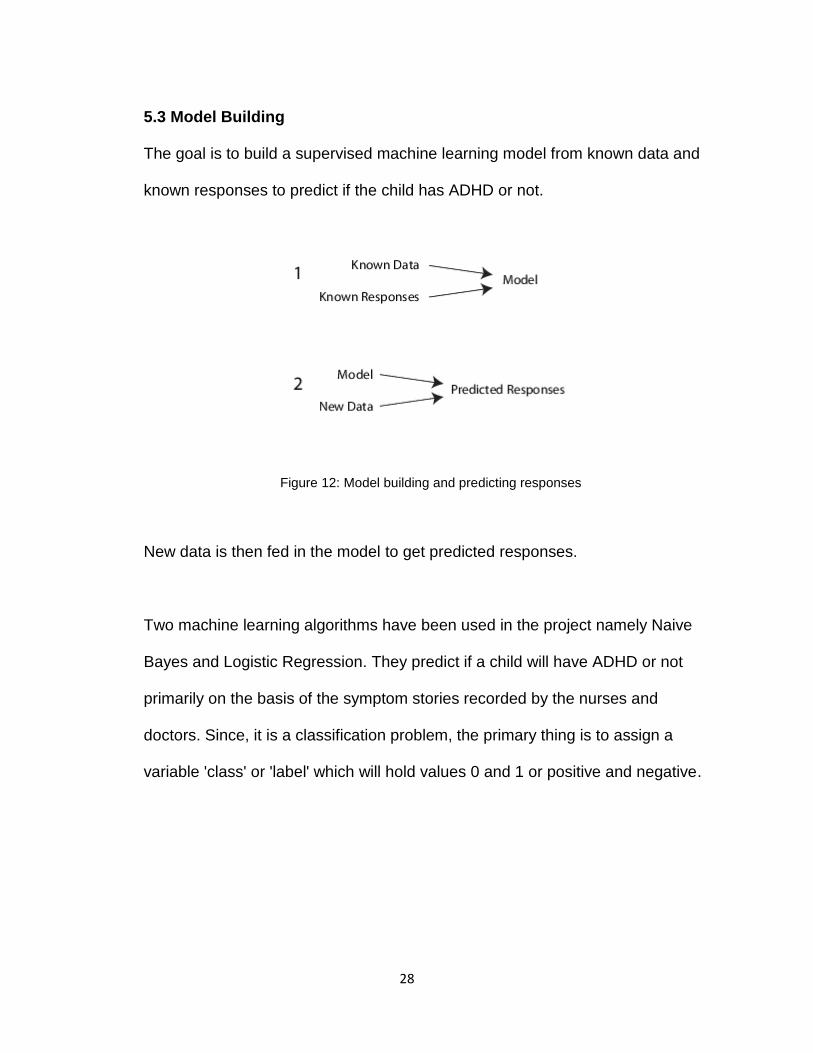
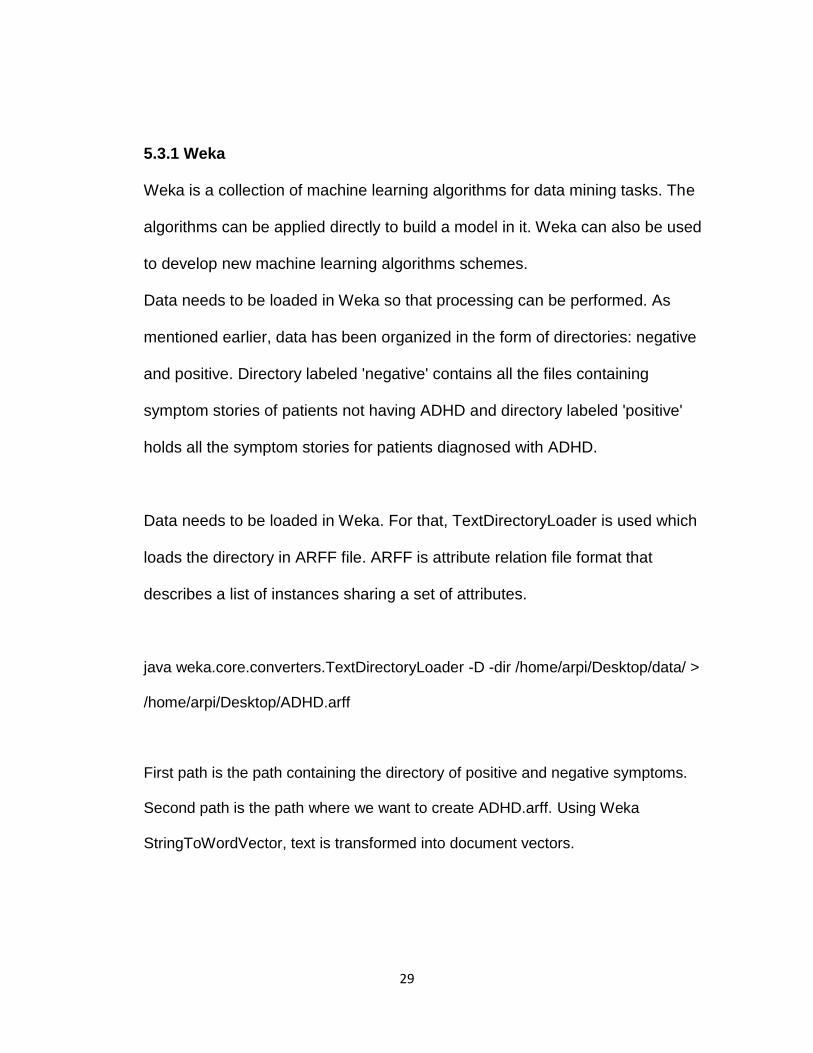
5.3 Model Building
The goal is to build a supervised machine learning model from known data and
known responses to predict if the child has ADHD or not.
Figure 12: Model building and predicting responses
New data is then fed in the model to get predicted responses.
Two machine learning algorithms have been used in the project namely Naive
Bayes and Logistic Regression. They predict if a child will have ADHD or not
primarily on the basis of the symptom stories recorded by the nurses and
doctors. Since, it is a classification problem, the primary thing is to assign a
variable 'class' or 'label' which will hold values 0 and 1 or positive and negative.
29
5.3.1 Weka
Weka is a collection of machine learning algorithms for data mining tasks. The
algorithms can be applied directly to build a model in it. Weka can also be used
to develop new machine learning algorithms schemes.
Data needs to be loaded in Weka so that processing can be performed. As
mentioned earlier, data has been organized in the form of directories: negative
and positive. Directory labeled 'negative' contains all the files containing
symptom stories of patients not having ADHD and directory labeled 'positive'
holds all the symptom stories for patients diagnosed with ADHD.
Data needs to be loaded in Weka. For that, TextDirectoryLoader is used which
loads the directory in ARFF file. ARFF is attribute relation file format that
describes a list of instances sharing a set of attributes.
java weka.core.converters.TextDirectoryLoader -D -dir /home/arpi/Desktop/data/ >
/home/arpi/Desktop/ADHD.arff
First path is the path containing the directory of positive and negative symptoms.
Second path is the path where we want to create ADHD.arff. Using Weka
StringToWordVector, text is transformed into document vectors.
30
It is important to consider following parameters while building Naive Bayes Classifier
in Weka.
1. WordsToKeep
This is the total number of words that is to be kept for building the model. It has
huge impact while building a good machine learning model. It can be a 6 digit
number as well.
2. outputWordCounts
If this is set to true, then the output is in the form of number of times a word
occurs in the document
3. DoNotOperateOnPerClassBasis
If this is set to true, then the number of words are calculated irrespective of the
class or label of the document.
4. TF - IDF
If TF-IDF computation is necessary to build the model, then it can be set to true.
TF - IDF is "Term Frequency - Inverse Document Frequency" is a way to score a
word in the text. The computation is based on the frequency of words appearing
across multiple documents. It can be said that, if a word appears frequently in a
31
document, it is important. That word will have high score. But if the term appears
in many documents, it is not a unique identifier. In that case, word will have low
score.
5. normalizeDocLength
Normalization refers to measurements taken on different scales and re-
measuring them on a common scale. For example two documents contain 100
and 150 words each and the word "experiment" appears 5 times in both the
documents. But the normalization value of “experiment” for doc1 will be more
than in doc2 because doc1 has less words and effect of “experiment” is more in
doc1.
6. Stemming
Stemming uses word by breaking them down into smaller words called stem. In
some cases, this enhances the result.
7. Stopwords
There are some words in document collection that appear most-as-is and are
irrelevant for classification. Such words are called stopwords. Sometimes
excluding them yields better result.
32
8. Tokenizer
Tokenizer splits up text into tokens which helps in further processing and feature
extraction. There are lots of tokenizer available that can be utilized while training
the model.
9. minTermFrequency
It specifies that word should appear at least minimum number of times specified
to be considered for further processing. For example, if it is set to 3, then word
would have to appear at least three times to be considered as an attribute.
10. lowerCaseTokens
If it is set to off, then the words will be case sensitive. If it is turned-on, then the
attributes with different cases are considered same.
On setting the following parameter values,
IDF Transform -> True
TFTransform -> True
doNotOperateOnPerClassBasis -> True
InvertSelection -> False
lowerCaseTokens -> False
minTermFreq -> 1
normalizeDocLength -> Normalize all data
33
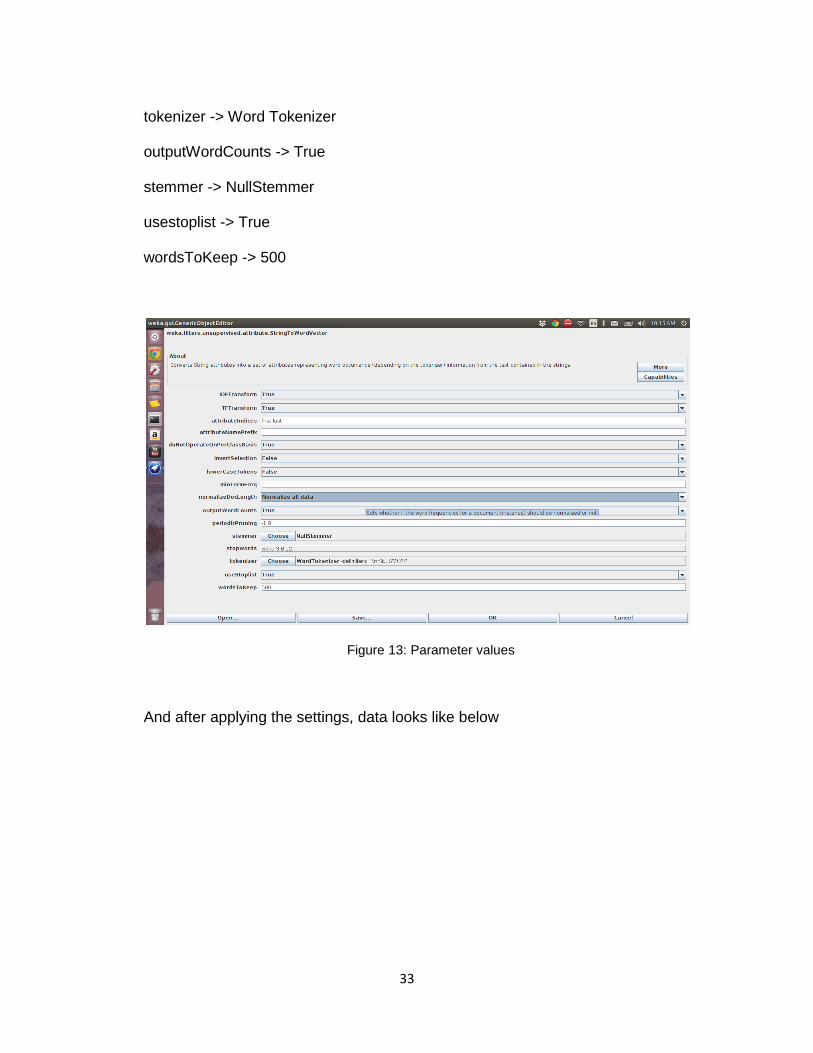
tokenizer -> Word Tokenizer
outputWordCounts -> True
stemmer -> NullStemmer
usestoplist -> True
wordsToKeep -> 500
Figure 13: Parameter values
And after applying the settings, data looks like below
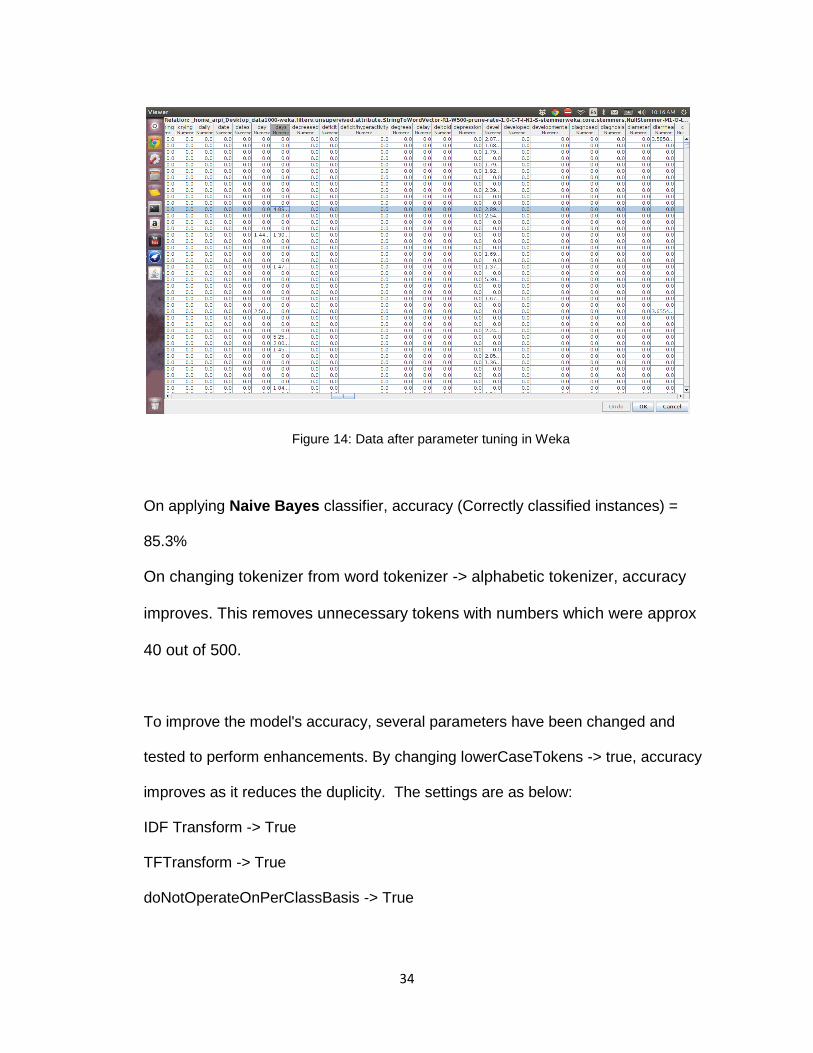
34
Figure 14: Data after parameter tuning in Weka
On applying Naive Bayes classifier, accuracy (Correctly classified instances) =
85.3%
On changing tokenizer from word tokenizer -> alphabetic tokenizer, accuracy
improves. This removes unnecessary tokens with numbers which were approx
40 out of 500.
To improve the model's accuracy, several parameters have been changed and
tested to perform enhancements. By changing lowerCaseTokens -> true, accuracy
improves as it reduces the duplicity. The settings are as below:
IDF Transform -> True
TFTransform -> True
doNotOperateOnPerClassBasis -> True

35
InvertSelection -> False
lowerCaseTokens -> True
minTermFreq -> 1
normalizeDocLength -> Normalize all data
outputWordCounts -> True
stemmer -> NullStemmer
tokenizer -> Word Tokenizer
usestoplist -> True
wordsToKeep -> 500
On applying Naive Bayes classifier, accuracy (Correctly classified instances) =
86.9%
There were 121156 instances. Confusion matrix for the result is as below
neg pos
neg 120187 969
Pos 30774 90382
This explains that True negative is 120187, True positive is 90382, False
negative is 969 and False positive is 30774.
5.3.2 Apache Spark Apache Spark is a fast engine for big data processing with built in module for
machine learning. It provides in memory caching abstraction and stores datasets
in memory so they do not need to be read from disk for each operation.
36
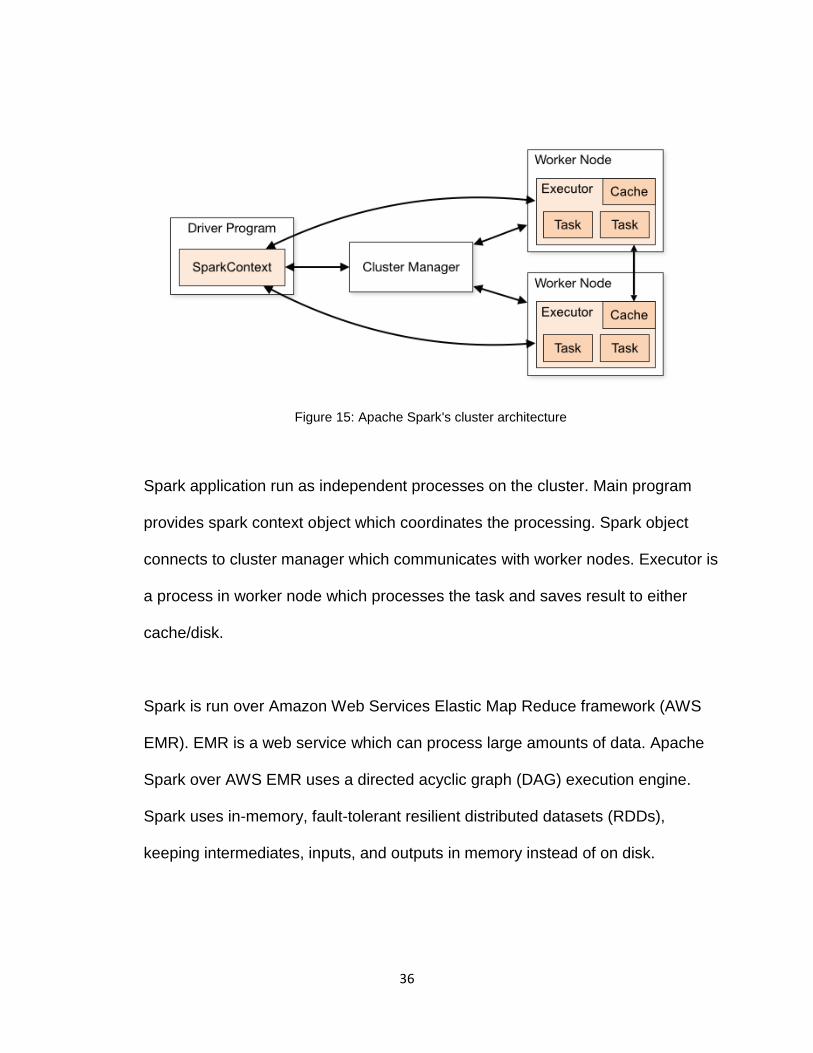
Figure 15: Apache Spark's cluster architecture
Spark application run as independent processes on the cluster. Main program
provides spark context object which coordinates the processing. Spark object
connects to cluster manager which communicates with worker nodes. Executor is
a process in worker node which processes the task and saves result to either
cache/disk.
Spark is run over Amazon Web Services Elastic Map Reduce framework (AWS
EMR). EMR is a web service which can process large amounts of data. Apache
Spark over AWS EMR uses a directed acyclic graph (DAG) execution engine.
Spark uses in-memory, fault-tolerant resilient distributed datasets (RDDs),
keeping intermediates, inputs, and outputs in memory instead of on disk.

37
Figure 16: Data flow in Amazon Elastic Map Reduce
On the master node in Amazon EC2 instances, Apache Spark is installed. These
instances belong to special Amazon EMR Clusters designed for big data
processing. Data is accessed in and out from Amazon Simple Storage Service
(S3).
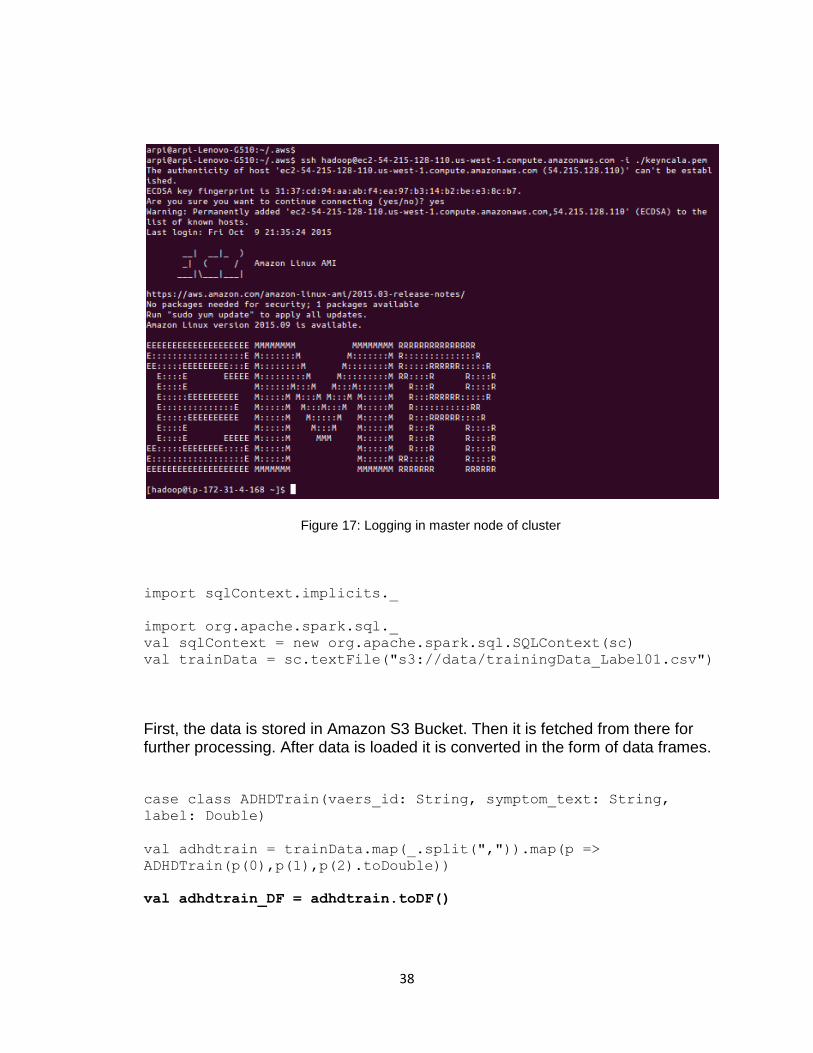
First, connection to cluster's master node is established. SparkContext variable
'sc' is provided by the driver program running on master node.
38
Figure 17: Logging in master node of cluster
import sqlContext.implicits._
import org.apache.spark.sql._
val sqlContext = new org.apache.spark.sql.SQLContext(sc)
val trainData = sc.textFile("s3://data/trainingData_Label01.csv")
First, the data is stored in Amazon S3 Bucket. Then it is fetched from there for further processing. After data is loaded it is converted in the form of data frames.
case class ADHDTrain(vaers_id: String, symptom_text: String,
label: Double)
val adhdtrain = trainData.map(_.split(",")).map(p =>
ADHDTrain(p(0),p(1),p(2).toDouble))
val adhdtrain_DF = adhdtrain.toDF()
39
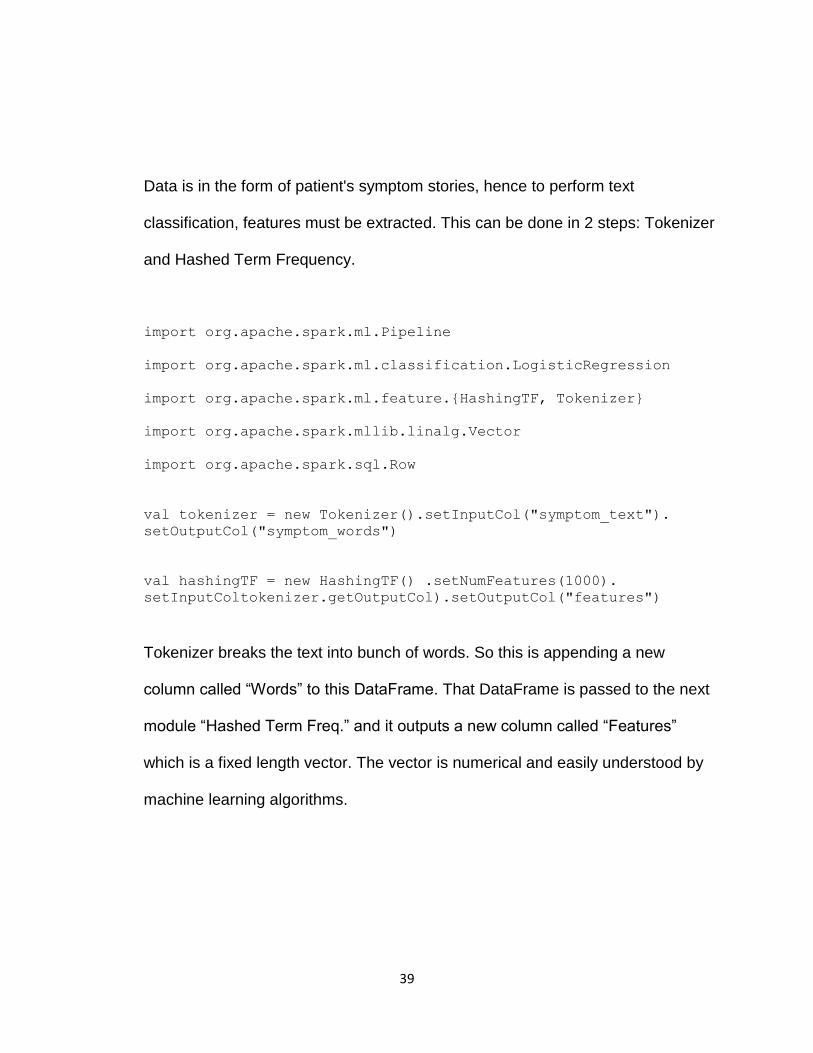
Data is in the form of patient's symptom stories, hence to perform text
classification, features must be extracted. This can be done in 2 steps: Tokenizer
and Hashed Term Frequency.
import org.apache.spark.ml.Pipeline
import org.apache.spark.ml.classification.LogisticRegression
import org.apache.spark.ml.feature.{HashingTF, Tokenizer}
import org.apache.spark.mllib.linalg.Vector
import org.apache.spark.sql.Row
val tokenizer = new Tokenizer().setInputCol("symptom_text").
setOutputCol("symptom_words")
val hashingTF = new HashingTF() .setNumFeatures(1000).
setInputColtokenizer.getOutputCol).setOutputCol("features")
Tokenizer breaks the text into bunch of words. So this is appending a new
column called “Words” to this DataFrame. That DataFrame is passed to the next
module “Hashed Term Freq.” and it outputs a new column called “Features”
which is a fixed length vector. The vector is numerical and easily understood by
machine learning algorithms.
40
import org.apache.spark.ml.Pipeline
import org.apache.spark.ml.classification.LogisticRegression
import org.apache.spark.ml.feature.{HashingTF, Tokenizer}
import org.apache.spark.mllib.linalg.Vector
import org.apache.spark.sql.Row
val tokenizer = new
Tokenizer().setInputCol("symptom_text").setOutputCol("symptom_wor
ds")
val hashingTF = new
HashingTF().setNumFeatures(1000).setInputCol(tokenizer.getOutputC
ol).setOutputCol("features")
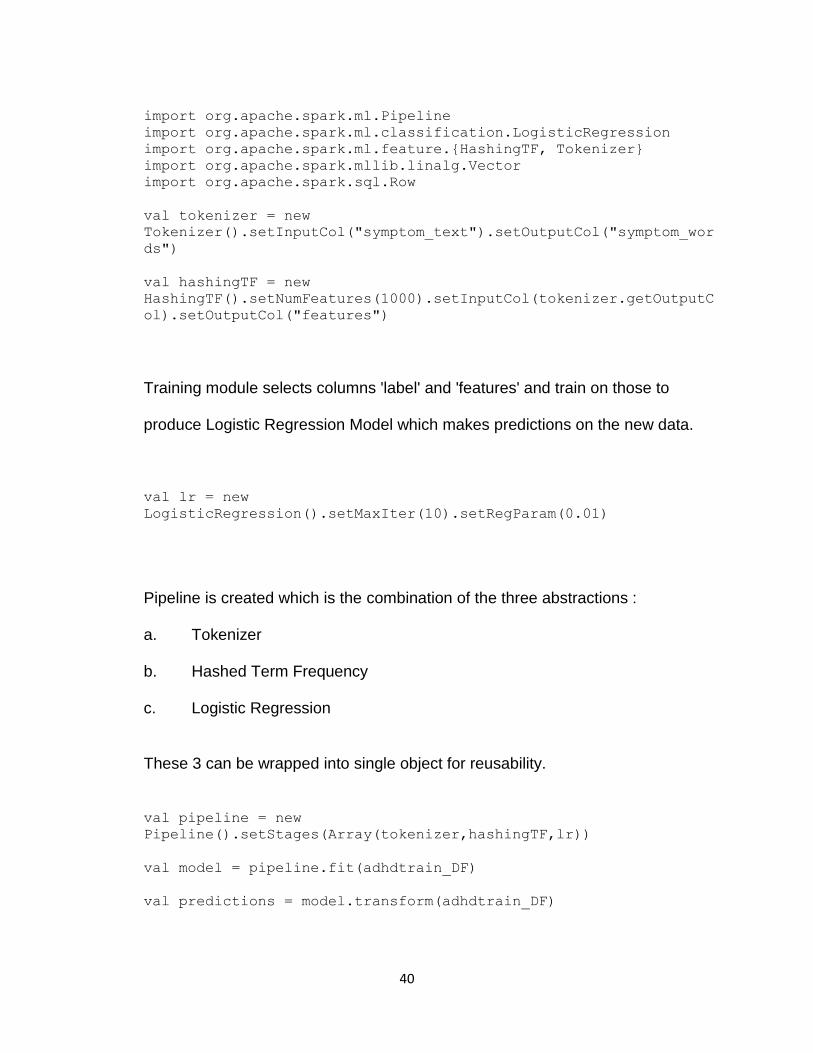
Training module selects columns 'label' and 'features' and train on those to
produce Logistic Regression Model which makes predictions on the new data.
val lr = new
LogisticRegression().setMaxIter(10).setRegParam(0.01)
Pipeline is created which is the combination of the three abstractions :
a. Tokenizer
b. Hashed Term Frequency
c. Logistic Regression
These 3 can be wrapped into single object for reusability.
val pipeline = new
Pipeline().setStages(Array(tokenizer,hashingTF,lr))
val model = pipeline.fit(adhdtrain_DF)
val predictions = model.transform(adhdtrain_DF)

41
Figure 18: Generating prediction in Apache Spark
Predictions look like below:
Figure 19: Prediction in Apache Spark
Logistic regression takes the regularization parameter, Hashed term frequency
takes various parameters such as length of the representation of feature vector.
CrossValidatior, provided by ML API is used to manage all the different
parameters.
It takes an estimator (the pipeline), Parameter Grid and an Evaluator (to
compare models). It then automatically finds the best parameters.
import org.apache.spark.ml.evaluation.RegressionEvaluator import org.apache.spark.ml.regression.LinearRegression import org.apache.spark.mllib.util.MLUtils import org.apache.spark.ml.tuning.ParamGridBuilder import org.apache.spark.ml.tuning.CrossValidator import
org.apache.spark.ml.evaluation.BinaryClassificationEvaluator
42
val paramGrid = new
ParamGridBuilder().addGrid(hashingTF.numFeatures,
Array(1000,10000)).addGrid(lr.regParam, Array(0.05,0.2)).build()
val crossval = new
CrossValidator().setEstimator(pipeline).setEvaluator(new
BinaryClassificationEvaluator).setEstimatorParamMaps(paramGrid).s
etNumFolds(2)
val cvModel = crossval.fit(adhdtrain_DF)
val evaluator = new
BinaryClassificationEvaluator().setMetricName(“areaUnderROC”)
evaluator.evaluate(cvModel.transform(adhdtrain_DF))
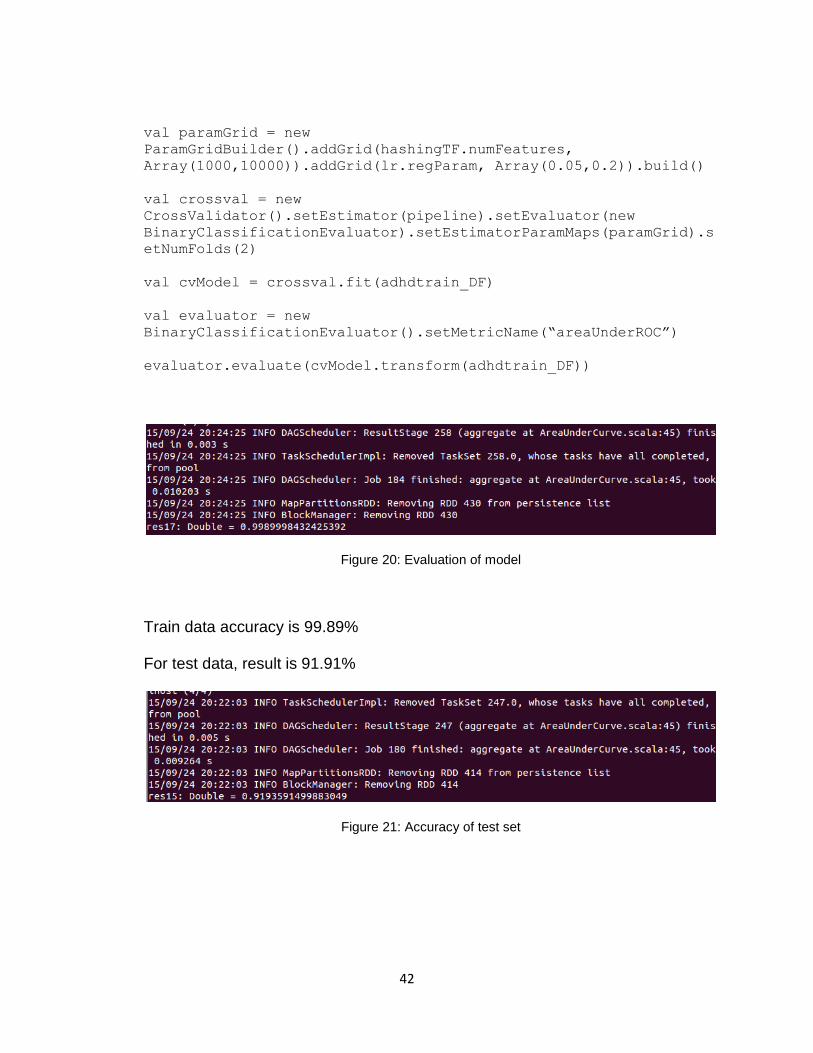
Figure 20: Evaluation of model
Train data accuracy is 99.89%
For test data, result is 91.91%
Figure 21: Accuracy of test set
43
6
CONCLUSION AND FUTURE WORK
Naive Bayes and Logistic Regression models have been built in Weka and
Apache Spark. Model based on logistic regression performs better than model
built using Naive Bayes classifier. Hence, if the model is used in real world
scenario then it can prove to solve some diagnostic problems of ADHD.
Any model built using classification techniques can be deployed over Amazon
web services EMR as it can handle more load and requests.
The data set used in project contains textual information. Other types of datasets
including numeric observation, images and videos can be used to develop other
models which can be integrated with the model created in this project to produce
better results.
44
References
[1] Sajda P.(2006) 'Machine Learning for detection and diagnosis of disease',
'PubMed, National Institute of Health'
[2] Mitchel T(1997) 'Machine Learning', 'McGraw Hill'
[3] Kenneth R Foster*, Robert Koprowski and Joseph D Skufca (2014), 'Machine
learning, medical diagnosis and biomedical engineering research', 'Biomedical
Engineering Online'
[4] 'National Institute of Mental Health', Available:
http://www.nimh.nih.gov/health/topics/attention-deficit-hyperactivity-disorder-
adhd/index.shtml (accessed Sept 1, 2015)
[5] 'Vaccine Adverse Event Reporting System (VAERS)', Available:
https://vaers.hhs.gov/data/data (accessed Sept 1, 2015)
[6] 'Weka - Data mining software', Available:
http://www.cs.waikato.ac.nz/ml/weka/ (accessed October 2015)
[7] 'Apache Spark - Documentation', Available:
http://spark.apache.org/docs/latest/ (accessed October 2015)
[8] 'Apache Spark on Amazon EMR', Available:
https://aws.amazon.com/blogs/aws/new-apache-spark-on-amazon-emr/
(accessed October 2015)
[9] 'ADHD Diagnosis Tests', Available: http://www.webmd.com/add-
adhd/guide/adhd-diagnosis-tests (accessed Oct 1, 2015)

45
[10] 'Machine learning Algorithms', Available:
http://www.slideshare.net/GirishKhanzode/supervised-learning52218215?
qid=155d2ed1-b112-419e-80cb- 1a285d11aca0&v=default&b=&from_search=5
(accessed Oct 2015)