Pion, Kaon, Proton and Antiproton Production in Proton-Proton

Precision Measurement of the Proton Flux with AMS Experiment
AMS Days at CERN
Geneva, April 16th 2015
V. Choutko/M.I.T.

2 V. Choutko Proton Flux AMS Days CERN
Introduc>on
Protons are the most abundant charged particles in cosmic rays. Knowledge of the precise behavior of the proton spectrum is
important in understanding the origin, acceleration, and propagation of cosmic rays.
Recent important measurements of the proton flux in cosmic rays
have reported different variations of the flux with energy. In particular, the ATIC–2, CREAM, and PAMELA experiments showed deviations of the proton flux from a single power law.
Here we report on the precise measurement of the proton flux in
primary cosmic rays in the rigidity range from 1 GV to 1.8 TV based on 300 million events collected by the AMS.

TRD
TOFTracker
TOFRICH
ECAL
L1
L2
L7-L8
L3-L4
L9
L5-L6 ToF (4 Layers) Velocity and Direc>on Δβ/β2 (Z=1) ≈ 4%
TRD, Tracker, RICH ,TOF, ECAL Charge Magnitude Along Par>cle Trajectory ΔZ (Z=1) ≈ 0.05-0.2
Tracker (9 Layers) + Magnet Rigidity and Charge Sign Bending Coordinate Resolu>on (Z=1) ≈ 10 µm MDR (Z=1) ≈ 2 TV
3 V. Choutko Proton Flux AMS Days CERN
AMS Cosmic Ray Protons Measurement

4 V. Choutko Proton Flux AMS Days CERN
Charge0.5 1 1.5 2 2.5
Events
510
610
710
810
910Data P910×11.4
He Nuclei
AMS Data Sample

Proton Selec>on
(I) Downgoing Par>cle β > 0.3
(II) Rigidity (R) Above Geomagne>c Cutoff (RC ) R > 1.2RC [IGRF Magne>c Field]
(III) Charge |Z|~1 along Par>cle Trajectory: For instance, for Inner Tracker 0.7 <|Z| <1.5
(IV) Full Tracker Level arm (L1 to L9), Z>0 (V) χ2/NDF of the Par>cle Trajectory Fit < 10 Efficiency 98-‐99 %, Removes Bulk of Events with Large Scaiering and Wrongly Measured Rigidity
(VI) Reconstructed Mass > 0.5 GeV/c2 Removes low rigidity π’s
5 V. Choutko Proton Flux AMS Days CERN

Residual Background
(I) Protons from He and other Nuclei interacted on
very top of AMS: 0.5% @ 1GV and negligible (<0.1%) above 10 GV
(ΙΙ) π’s from protons interacted on top of AMS:
Less than 0.1% in all rigidity range
(III) Positrons and Electrons:
Less than 0.1% in all rigidity range
6 V. Choutko Proton Flux AMS Days CERN
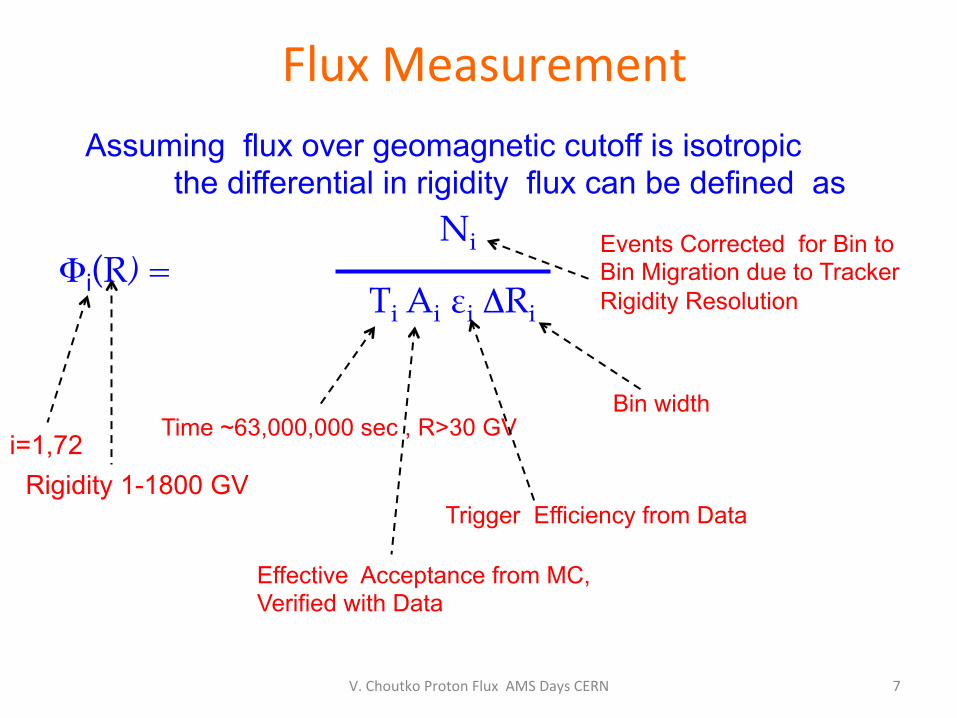
Flux Measurement Assuming flux over geomagnetic cutoff is isotropic the differential in rigidity flux can be defined as
Rigidity 1-1800 GV
Effective Acceptance from MC, Verified with Data
Time ~63,000,000 sec , R>30 GV
Φi(R) = Ni
Ti Ai εi ΔRi
Trigger Efficiency from Data
Bin width
7 V. Choutko Proton Flux AMS Days CERN
Events Corrected for Bin to Bin Migration due to Tracker Rigidity Resolution
i=1,72

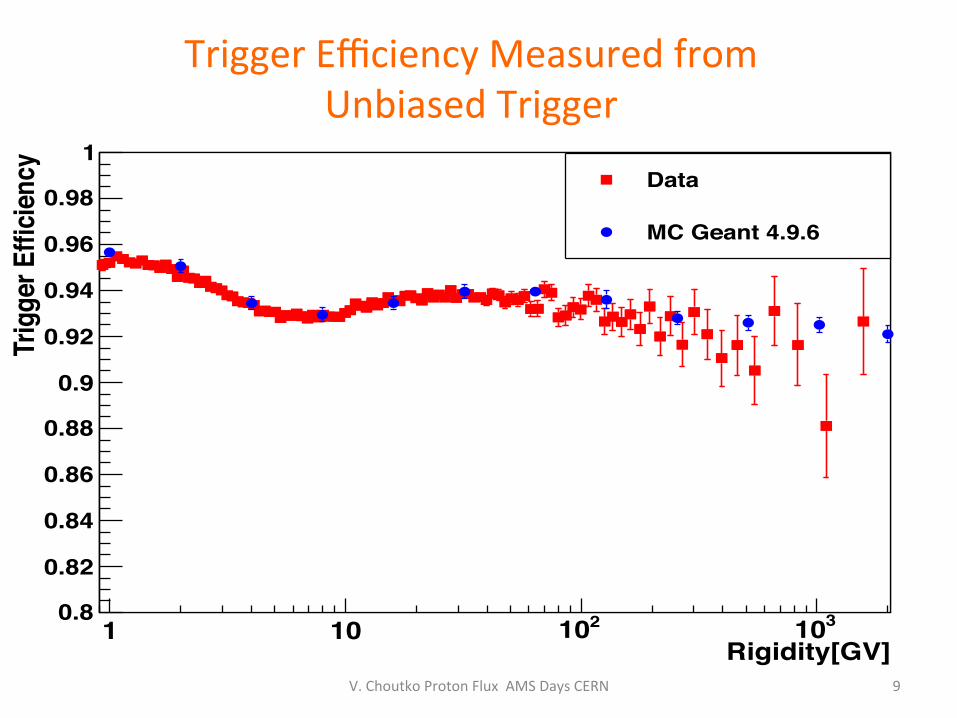
Proton flux: (i) systematic errors on trigger efficiency Trigger efficiency [4/4 TOF + VETO ] was measured using 1% prescaled
event sample obtained with unbiased 3 out of 4 ToF coincidence trigger. The error is dominated by the sta>s>cs available from the
unbiased trigger.
LowerTOF (layers 3 and 4)
UpperTOF (layers 1 and 2)
8
This systema>c error is negligible (less than 0.1%) below 100GV and reaches 1.5% at 1.8TV.
VETO
V. Choutko Proton Flux AMS Days CERN
9 V. Choutko Proton Flux AMS Days CERN
Rigidity[GV]1 10 210 310
Trig
ger E
fficie
ncy
0.8
0.82
0.84
0.86
0.88
0.9
0.92
0.94
0.96
0.98
1Data
MC Geant 4.9.6
Trigger Efficiency Measured from Unbiased Trigger
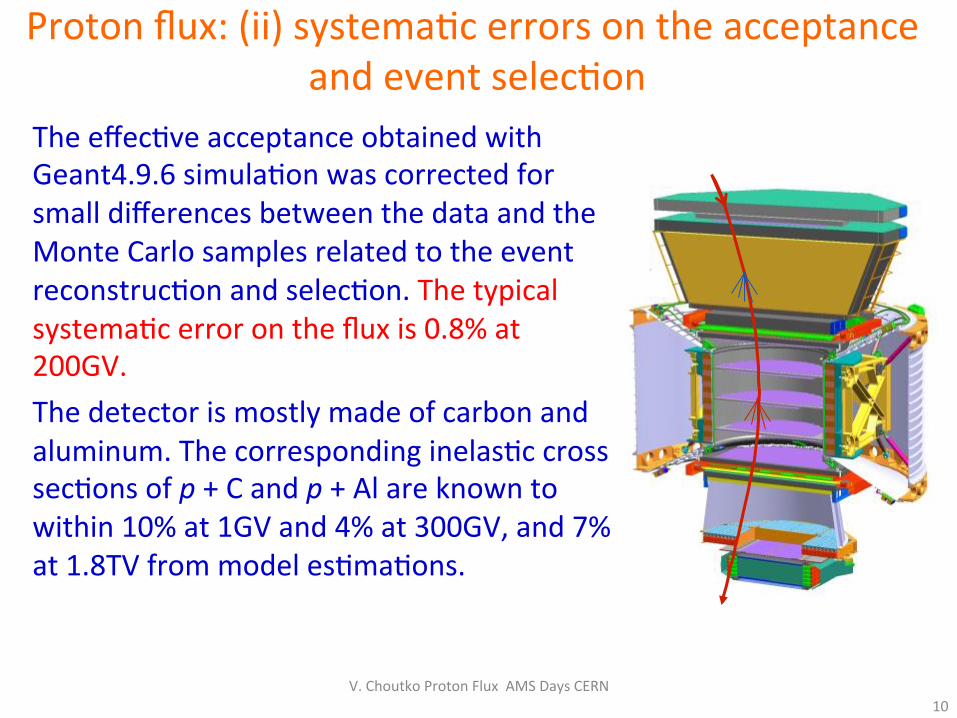
Proton flux: (ii) systema>c errors on the acceptance and event selec>on
The effec>ve acceptance obtained with Geant4.9.6 simula>on was corrected for small differences between the data and the Monte Carlo samples related to the event reconstruc>on and selec>on. The typical systema>c error on the flux is 0.8% at 200GV. The detector is mostly made of carbon and aluminum. The corresponding inelas>c cross sec>ons of p + C and p + Al are known to within 10% at 1GV and 4% at 300GV, and 7% at 1.8TV from model es>ma>ons.
10 V. Choutko Proton Flux AMS Days CERN

11 V. Choutko Proton Flux AMS Days CERN
Acceptance Error due to Interac>ons
Knowledge of p+C(Al) inelastic σ is important to assess error on acceptance due to proton interactions. p+C(Al) inelas>c σ is known 4 to 10 % accuracy.
Rigidity [GV]1 10 210 310
p+C
inelas
tic cr
oss s
ectio
n [mb
]
200
220
240
260
280
GEANT 4-09-06GEANT 4-09-06 UncertaintyNA61 (2012)Denisov (1973)Bellettini (1965)
qeσCarroll (1979) + Bowen (1958)Letaw (1983)

12 V. Choutko Proton Flux AMS Days CERN
Using scaled by ±10% cross sections MC samples allowed to evaluate acceptance error. The corresponding systematic error is 1% at 1GV, 0.6% from 10 to 300GV, and 0.8% at 1.8TV.
Rigidity [GV]1 10 210 310
p+Al
inelas
tic cr
oss s
ectio
n [mb
]
380
400
420
440
460
480
500
520
540 GEANT 4-09-06GEANT 4-09-06 UncertaintyDenisov (1973)Bellettini (1965)Carroll (1979)Letaw (1983)MiniBoone (2009)
Acceptance Error due to Interac>ons

Proton Flux: (iii) systema>c errors on background contamina>on
The background contribu>ons from protons which originated in the interac>ons of nuclei at the top of AMS, no>ceable only below 2GV, are subtracted from the flux and the uncertain>es are accounted for in the systema>c errors.
nuclei
proton
13 V. Choutko Proton Flux AMS Days CERN

Proton flux: (iv) systema>c errors on geomagne>c cutoff
The cutoff was calculated by backtracing par>cles from the top of AMS out to 50 Earth’s radii. A safety factor of 1.2 is then applied. It was varied from 1.0 to 1.4 and the resul>ng proton fluxes showed a systema>c uncertainty of 2% at 1GV and negligible above 2GV.
14
We have also verified that using the most recent IGRF model and the IGRF model with external non-‐symmetric magne>c fields does not introduce observable changes in the flux values nor in the systema>c errors.
V. Choutko Proton Flux AMS Days CERN

Proton flux: (v) systema>c errors on unfolding
Among many unfolding procedures, we selected two. The small differences between the two procedures (< 0.5%) are accounted as a systema>c error. We have checked the sensi>vity of the results to the binning by:
1. increasing the bin width by factors of 2 and 4
2. reducing the bin width by factors of 2 and 4. The resul>ng uncertainty is well within the assigned systema>c errors.
15 V. Choutko Proton Flux AMS Days CERN

Proton flux: (vi) systema>c errors on the rigidity resolu>on func>on
The rigidity resolu>on func>on was verified with data from both the ISS and the 400 GeV proton beam. For this the residuals between the hit coordinates measured in tracker layers L1 and L9 and those obtained from the track fit from only the inner tracker L2 to L8 were compared between data and simula>on. In order to addi>onally validate the alignment of the external layers the difference between the rigidity measured using the informa>on from L1 to L8 and from L2 to L9 was compared between data and the simula>on.
L1
L5 L6
L3 L4
L7 L8
L9
L2
MA
GN
ET
16 V. Choutko Proton Flux AMS Days CERN

17
]-1 [ GV4001 - Rigidity
1
-0.02 -0.01 0 0.01 0.02
Even
ts
10
210
310
410
510
610a)
400 GeV/c TestBeam Data
400 GeV/c Simulation
The resolution function for 400 GeV/c protons measured in the test beam compared with Monte Carlo simulated events.
The corresponding unfolding errors were obtained by varying the width of the Gaussian core of the resolu>on func>on by 5% and the amplitude of the non-‐Gaussian tails by ∼20% and found to be 1% below 200GV and 3% at 1.8TV.
Proton flux: (vi) systema>c errors on the rigidity resolu>on func>on (cont’d)
V. Choutko Proton Flux AMS Days CERN
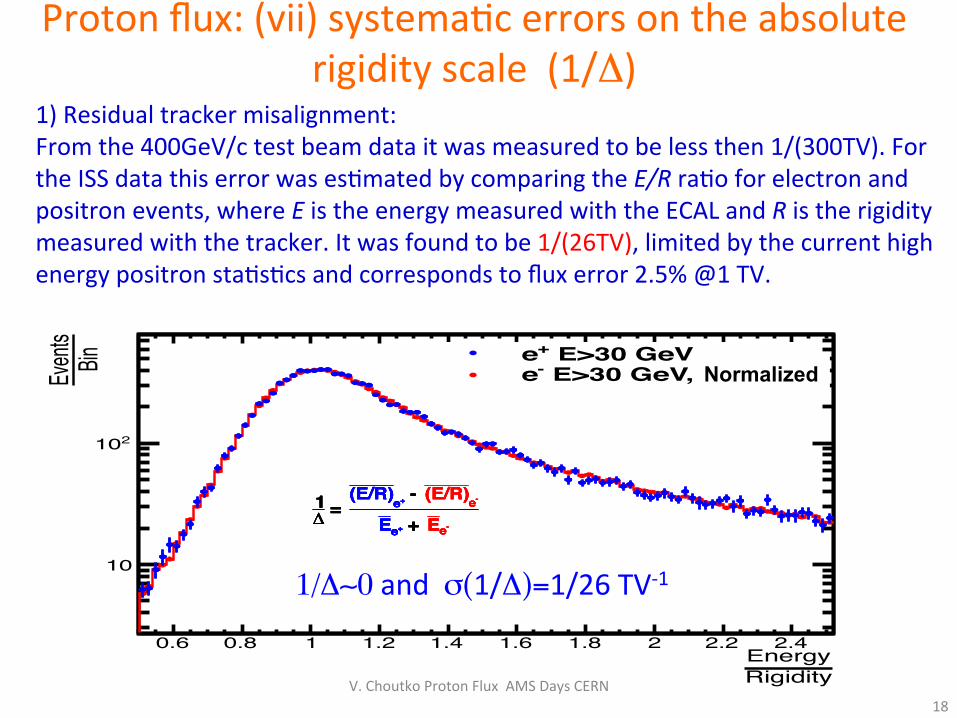
Proton flux: (vii) systema>c errors on the absolute rigidity scale (1/Δ)
1) Residual tracker misalignment: From the 400GeV/c test beam data it was measured to be less then 1/(300TV). For the ISS data this error was es>mated by comparing the E/R ra>o for electron and positron events, where E is the energy measured with the ECAL and R is the rigidity measured with the tracker. It was found to be 1/(26TV), limited by the current high energy positron sta>s>cs and corresponds to flux error 2.5% @1 TV.
18
RigidityEnergy
0.6 0.8 1 1.2 1.4 1.6 1.8 2 2.2 2.4
BinEvent
s
10
210
E>30 GeV+e E>30 GeV, Scaled-e
-eE + +eE-e(E/R) - +e(E/R)
= ∆1
-eE + +eE-e(E/R) - +e(E/R)
= ∆1
-eE + +eE-e(E/R) - +e(E/R)
= ∆1
-eE + +eE-e(E/R) - +e(E/R)
= ∆1
1/Δ∼0 and σ(1/Δ)=1/26 TV-‐1
Normalized
V. Choutko Proton Flux AMS Days CERN
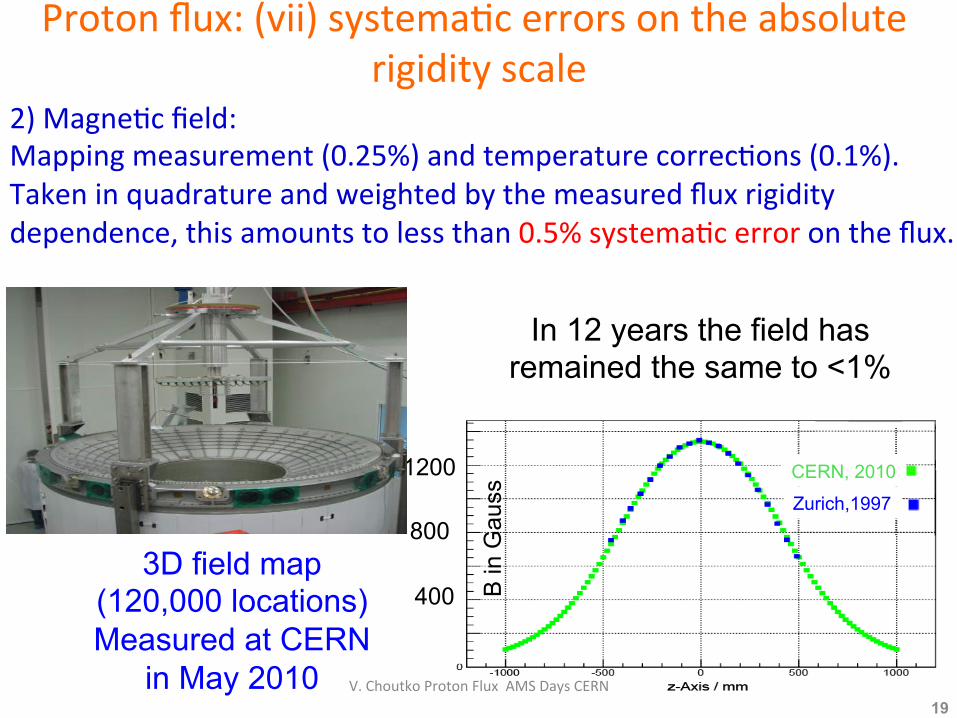
Proton flux: (vii) systema>c errors on the absolute rigidity scale
2) Magne>c field: Mapping measurement (0.25%) and temperature correc>ons (0.1%). Taken in quadrature and weighted by the measured flux rigidity dependence, this amounts to less than 0.5% systema>c error on the flux.
Zurich,1997
CERN, 2010 B
in G
auss
1200
800
400
In 12 years the field has remained the same to <1%
3D field map (120,000 locations) Measured at CERN
in May 2010 19
V. Choutko Proton Flux AMS Days CERN
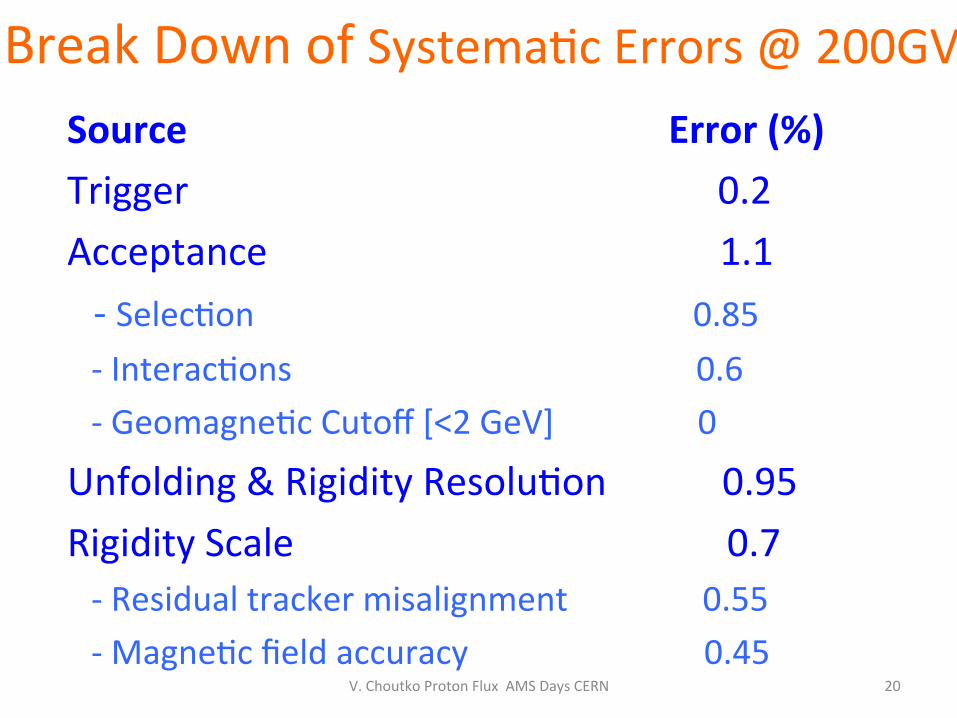
Break Down of Systema>c Errors @ 200GV Source Error (%) Trigger 0.2 Acceptance 1.1 -‐ Selec>on 0.85
-‐ Interac>ons 0.6 -‐ Geomagne>c Cutoff [<2 GeV] 0
Unfolding & Rigidity Resolu>on 0.95 Rigidity Scale 0.7 -‐ Residual tracker misalignment 0.55 -‐ Magne>c field accuracy 0.45
20 V. Choutko Proton Flux AMS Days CERN

Four Examples of Independent Verifica>on of Systema>c Errors on
• Acceptance
• Time Stability
• Rigidity Scale
• Unfolding V. Choutko Proton Flux AMS Days CERN 21

Verifica>on of the Systema>c Error Assigned to Acceptance
22 V. Choutko Proton Flux AMS Days CERN
°θ
6 8 10 12 14 16 18 20
Flu
x R
ati
o
0.96
0.97
0.98
0.99
1
1.01
1.02
1.03
1.04
Data
Systematic Uncertainty Range
The variation of the flux ratio above 30 GV [Max GeoMag Cutoff] versus the angle θ to the AMS Z axis.
1.01
0.99

Verifica>on of the Stability of Detector Performance
23 V. Choutko Proton Flux AMS Days CERN
Date
Flu
x R
atio
0.97
0.98
0.99
1
1.01
1.02
1.03 b)
Data
Systematic Uncertainty Range
09/11 01/12 05/12 09/12 01/13 05/13 09/13
The variation of the (monthly) flux ratio above 45GV [Above Solar modulation Time Dependent Effects] vs time.
1.01
0.99

Verifica>on of the Systema>c Error Assigned to the Rigidity Scale
24 V. Choutko Proton Flux AMS Days CERN
Rigidity [GV]
100 200 300 400 500 600 1000
Flu
x R
ati
o
0.85
0.9
0.95
1
1.05
1.1
1.15 c)
Data
Systematic Uncertainty Range
The variation of the flux ratio vs the rigidity for different Tracker Layer 1 (L1) entry regions
0.98
1.02

Flux obtained using the rigidity measured by only the inner tracker (2-8) is in good agreement with the flux measured using the full lever arm (1-9), specifically at -High rigidities (100 to 300GV) where the unfolding effects and resolution functions of the inner tracker (300 GV MDR) and the full lever arm one (2 TV MDR) are very different. -Low rigidities (1 to 10GV) where the unfolding effects and the tails in the resolution functions of the inner tracker and full lever arm are also very different due to multiple and nuclear scattering.
25
1
2
3-4
5-6
7-8
9
1.01
0.99
Verifica>on of the Systema>c Error of Unfolding, Acceptance and Rigidity Resolu>on
1.00
1.02
0.98
V. Choutko Proton Flux AMS Days CERN

26 V. Choutko Proton Flux AMS Days CERN
Rigidity [GV]1 10 210 310
Erro
r [%
]
1
2
3
4
5
6
7
AV_Error StatAV_Error TrigAV_Error AccAV_Error UnfAV_Error ScaleAV_Error Full
Sta>s>cal Trigger Acceptance
Unfolding
Rigidity Scale
Total
2 1.5
4
1.3
Flux Errors Breakdown

27 V. Choutko Proton Flux AMS Days CERN
Rigidity [GV]
1 10 210 310
]1.7
GV
-1se
c-1
sr-2
[m
2.7 R~ ×Fl
ux
0
2
4
6
8
10
12
14
310×
AMS-02a)
Proton Flux
300 Million Events

28 V. Choutko Proton Flux AMS Days CERN
) [GeV]K
Kinetic Energy (E
1 10 210 310 410
]1.7
GeV
-1se
c-1
sr-2
[m
2.7 K E×
Flux
0
2
4
6
8
10
12
14
310×
AMS-02ATIC-2BESS-PolarCREAMPAMELA
b)
Proton Flux Comparison with Earlier Measurements

Proton Flux Fit with the Model
29 V. Choutko Proton Flux AMS Days CERN
]1.7
GV
-1se
c-1
sr-2 [m2.7 R~ ×
Flux
8
9
1011
12
13
14310×
AMS-02Fit to Eq. (3) Eq. (3) with Δγ=0
Rigidity [GV] 10 210 310
\\\ Fit to Model χ2 /NDF=25/26 Fit to Model with Δγ=0
(sys)-0.003+0.004(fit)
-0.002+0.002 = -2.849γ
(sys)-0.030+0.046(fit)
-0.021+0.032 = 0.133γ∆
(sys) [GV]-28+66(fit)-44
+68 = 3360R
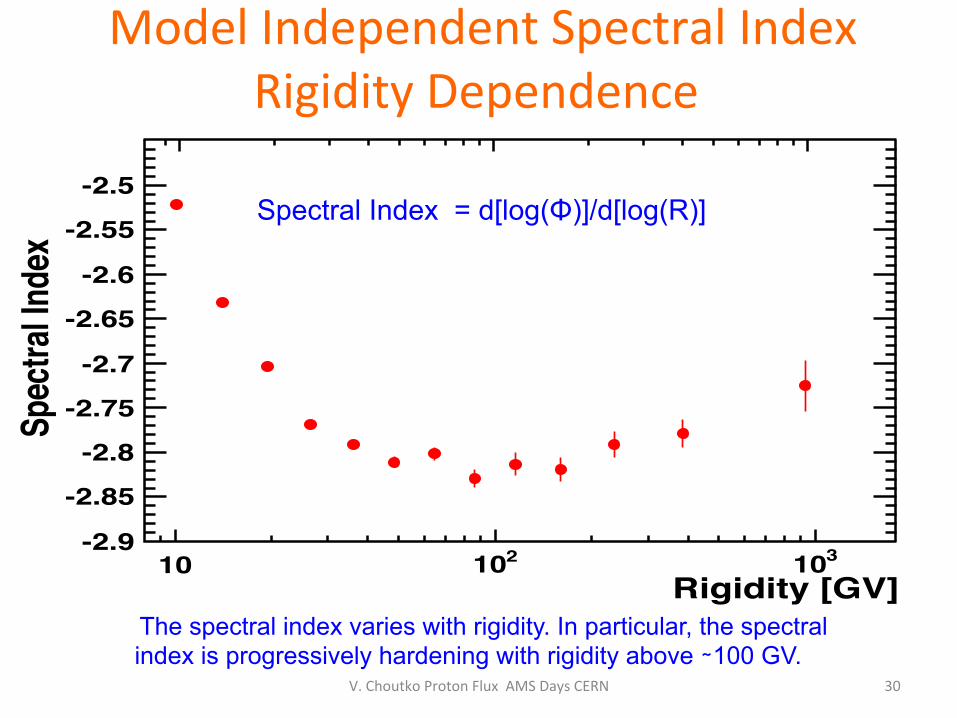
Model Independent Spectral Index Rigidity Dependence
30 V. Choutko Proton Flux AMS Days CERN
Rigidity [GV] 10 210 310
Spec
tral In
dex
-2.9-2.85-2.8
-2.75-2.7
-2.65-2.6
-2.55-2.5 b)
310×
The spectral index varies with rigidity. In particular, the spectral index is progressively hardening with rigidity above ∼100 GV.
Spectral Index = d[log(Φ)]/d[log(R)]
Conclusion • Precision measurement of proton flux with AMS is done from 1 GV to 1.8 TV based on 300 million events
• The detailed varia>on of the flux spectral index is presented
• The spectral index is progressively hardening at high rigidi>es
31 V. Choutko Proton Flux AMS Days CERN