Precision Ag News - Oklahoma State...
24
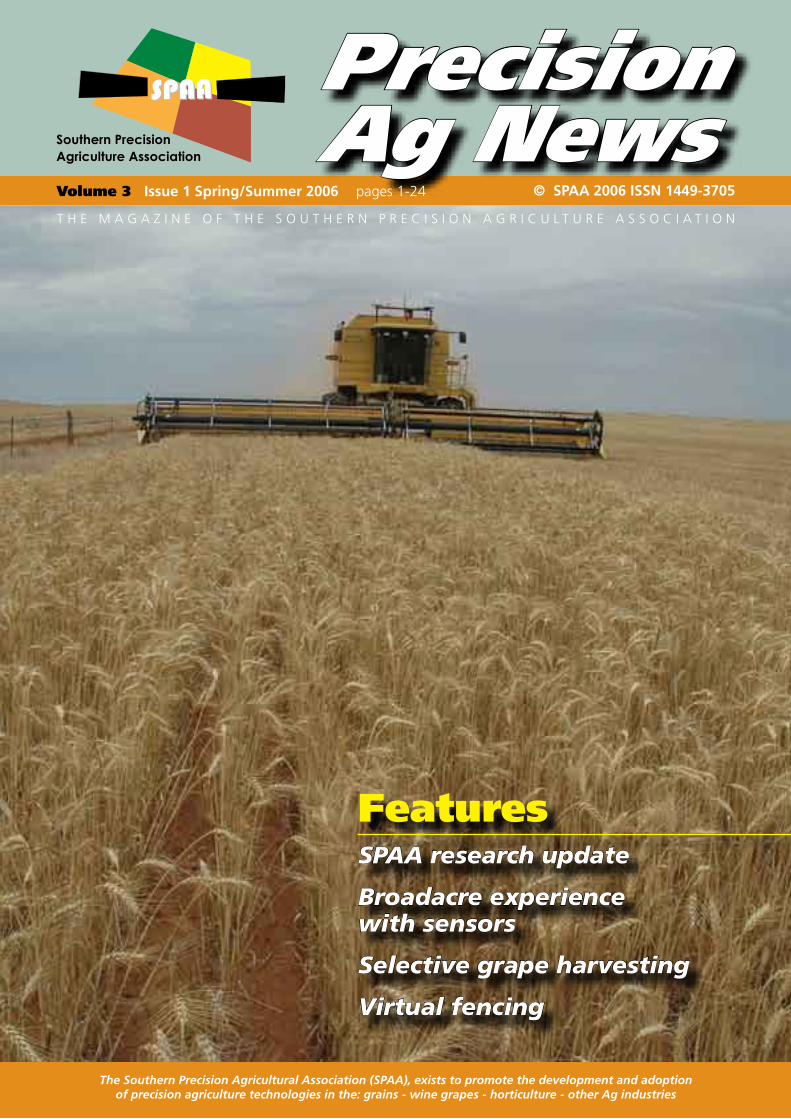
The Southern Precision Agricultural Association (SPAA), exists to promote the development and adoption of precision agriculture technologies in the: grains - wine grapes - horticulture - other Ag industries Precision Ag News Features SPAA research update Broadacre experience with sensors Selective grape harvesting Virtual fencing Volume 3 Issue 1 Spring/Summer 2006 pages 1-24 © SPAA 2006 ISSN 1449-3705 THE MAGAZINE OF THE SOUTHERN PRECISION AGRICULTURE ASSOCIATION
Transcript of Precision Ag News - Oklahoma State...
The Southern Precision Agricultural Association (SPAA), exists to promote the development and adoption of precision agriculture technologies in the: grains - wine grapes - horticulture - other Ag industries
Precision Ag News
FeaturesSPAA research update
Broadacre experience with sensors
Selective grape harvesting
Virtual fencing
Volume 3 Issue 1 Spring/Summer 2006 pages 1-24 © SPAA 2006 ISSN 1449-3705
T H E M A G A Z I N E O F T H E S O U T H E R N P R E C I S I O N A G R I C U L T U R E A S S O C I A T I O N

� Precision Ag News
SPAA supporting growers, advisors and researchers in the development and adoption of PA technologies.
Annual membership FULL $55, Associate (for those who trade under the same business name as a full member) $27.50
To join SPAA please contact Pam Pilkington [email protected] or visit the website www.spaa.com.au
Learning from shared experience
“I believe PA is the way forward. Joining SPAA is helping me to make sense of the yield data and to use PA resources to manage highly variable
soil types,” Randall Wilksch, Yeelana SA.

ContentsLooking back and forward . . . . . 4
Research program expands . . . . 6
In-crop sensing . . . . . . . . . . . . . . . 7
Guided by the crop . . . . . . . . . . . 8
Spot spraying in broadacre cropping systems . . . . . . . . . . . . 11
Virtual grazing systems . . . . . . . 13
Mapping actual fertiliser distribution . . . . . . . . . 15
Data layers for soilborne disease . . . . . . . . . . . . 16
Practical applications of precision viticulture . . . . . . . . . . 18
Precision Ag News �
Precision Ag News is published by Southern Precision Agricultural AssociationSPAA,PO Box 31, CRYSTAL BROOK SA 5523Ph 08 86362649, Fax 08 [email protected]
Precision Ag News is written and produced for SPAA by AgriKnowHow with design by Lightening Designs.
SPAA DISCLAIMERSPAA have prepared this publication, on the basis of information available at the time of publication without any independent verification. Neither the Corporation and its editors nor any contributor to this publication represent that the contents of this publication are accurate or complete; nor do we accept any omissions in the contents, however they may arise. Readers who act on the information in this publication do so at their risk. The contributors may identify particular types of products. We do not endorse or recommend the products of any manufacturer referred to. Other products may perform as well or better than those specifically referred to.
Newsletter and Magazine copy deadlines 2006/07
Publication Copy deadline Advertising bookings DistributionPrecision Ag News 12th February 5th February March 28th September 20th September OctoberSPAA Newsletter 11th December No advertising December
22nd January February 30th April May 1st July July
– SPAA Sponsors –
� Precision Ag News
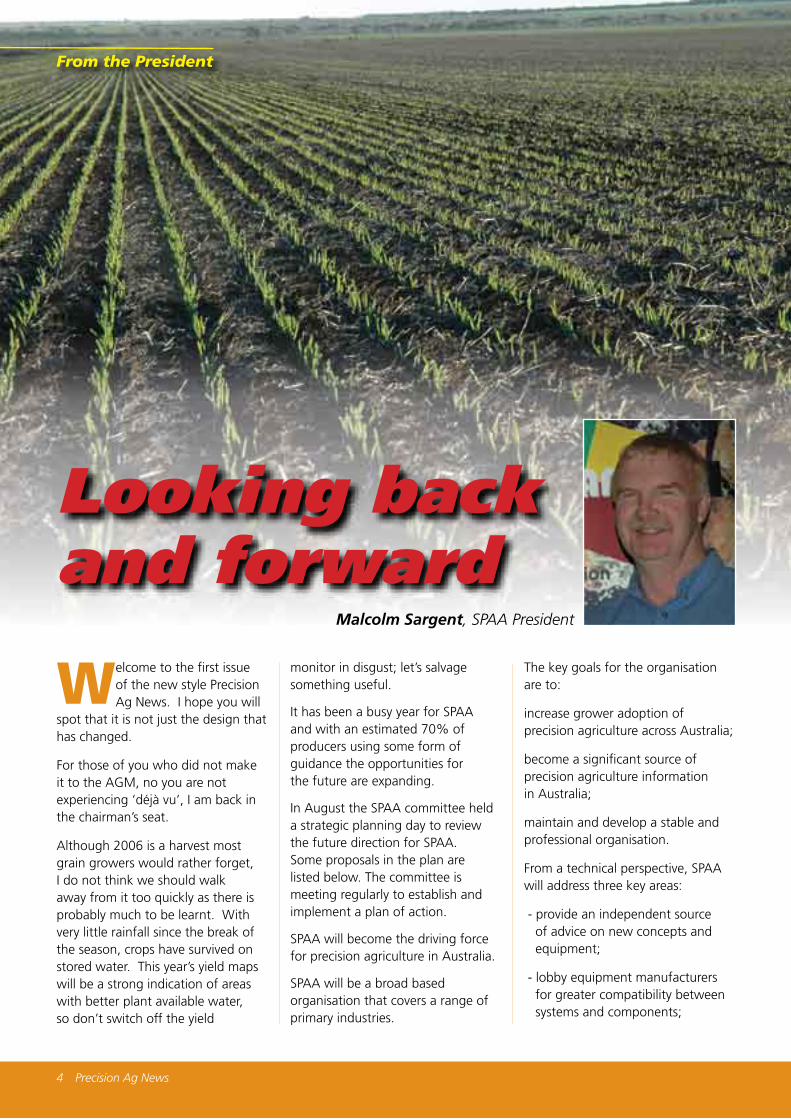
Welcome to the first issue of the new style Precision Ag News. I hope you will
spot that it is not just the design that has changed.
For those of you who did not make it to the AGM, no you are not experiencing ‘déjà vu’, I am back in the chairman’s seat.
Although 2006 is a harvest most grain growers would rather forget, I do not think we should walk away from it too quickly as there is probably much to be learnt. With very little rainfall since the break of the season, crops have survived on stored water. This year’s yield maps will be a strong indication of areas with better plant available water, so don’t switch off the yield
monitor in disgust; let’s salvage something useful.
It has been a busy year for SPAA and with an estimated 70% of producers using some form of guidance the opportunities for the future are expanding.
In August the SPAA committee held a strategic planning day to review the future direction for SPAA. Some proposals in the plan are listed below. The committee is meeting regularly to establish and implement a plan of action.
SPAA will become the driving force for precision agriculture in Australia.
SPAA will be a broad based organisation that covers a range of primary industries.
The key goals for the organisation are to:
increase grower adoption of precision agriculture across Australia;
become a significant source of precision agriculture information in Australia;
maintain and develop a stable and professional organisation.
From a technical perspective, SPAA will address three key areas:
- provide an independent source of advice on new concepts and equipment;
- lobby equipment manufacturers for greater compatibility between systems and components;
Looking back and forward
From the President
Malcolm Sargent, SPAA President

ExecutiveMalcolm Sargent, SPAA President Farmer, Crystal Brook SA. E [email protected] P 08 8636 2565, M 0407 395 075
Mark Branson, SPAA Vice President Farmer, Stockport SA. E [email protected] P 08 8528 2412, M 0417 832 776
Brian Tiller, SPAA Immediate Past President Farmer, Warnertown SA. E [email protected] P 08 8634 3053, M 0408 810 068
Peter Cousins, SPAA Treasurer Agricultural Consultant, Crystal Brook SA. E [email protected] P 08 8636 2649, M 0408 210 893
Allan Mayfield, SPAA Research Coordinator Agricultural Consultant, Clare SA. E [email protected] P 08 8842 3230, M 0418 818 569
Committee members:Rob Bramley, Principal Research Scientist - CSIRO, Adelaide SA. E [email protected] P 08 8303 8594, M 0417 875 803
Randall Wilksch, Farmer, Yeelanna SA. E [email protected] P 08 8676 5050, M 0427 86 5051
Craig Humphris, Farmer, Jamestown SA. E [email protected] P 08 8665 3264, M 0407 586 640
John Heap, Senior Research Scientist - SARDI, Adelaide SA. E [email protected] P 08 8303 9444, M 0428 833 119
Matt McCallum, Agricultural Consultant, Ardrossan SA. E [email protected] P 0438 895 167
Richard Turner, Farmer, Snowtown SA. E [email protected] P 08 8865 2167, M 0428 652 167
Ashley Wakefield, Farmer, Urania SA. E [email protected] P 08 8834 1219, M 0408 606 177
Colin Hinze, Viticulturist, Taylors Wines, Auburn SA. E [email protected] P 08 8849 1171, M 0404 819 330
Precision Ag News �
- facilitate research in innovative areas such as variable rate technologies.
None of this will be achieved without a capable and dedicated committee and executive team.
Many thanks to Brian Tiller for his great contribution as SPAA chairman over the past two years. Brian and I have agreed that we don’t intend to rotate as chair and are delighted to welcome some new faces to this year’s committee.
A complete list of the committee, their positions and contacts is found below. Many thanks to retiring committee members: Allen Buckley, Brendon Frischke, SARDI and viticulturist Grant Yates, for their contribution to SPAA.
Following four and half years of dedicated service to SPAA, Rohan Rainbow’s resignation left SPAA with
a big role to fill. The position of Executive Officer will be advertised in the near future (for more details please contact the SPAA office). One of the tasks of the new Executive Officer will be to expand the work of SPAA into other industry sectors for example potato and cane industries.
this year’s yield maps will be a strong indication of areas with better plant available water
Thanks must go to our Treasure Peter Cousins and Administration Officer Pam Pilkington for taking on many of the tasks previously managed by Rohan.
Training and research are a central part of SPAA activities. During 2006 SPAA organised the second successful autosteer demonstration
day, a PA training day at Birchip and an owner training day for those using variable rate with Kee Technology equipment. SPAA also supported the 10th Annual Symposium on Precision Agricultural Research and Application in Australasia.
SPAA is currently involved with four research trials (See page 6) and has made submissions to National Landcare Program and GRDC for two projects that relate to the implementation of variable rate technologies in broadacre cropping. Many thanks to Allan Mayfield for all his work on these submissions.
As a membership based organisation we want to hear from you. If you have any suggestions regarding research or training needs or are willing to share your PA experiences we would be delighted to hear from you.
SPAA Committee 2006/07

� Precision Ag News
SPAA is currently involved with four research projects; two finish in 2007 and two finish
in 2009. The following information gives a brief summary of the trial objectives and activities during 2006. It hardly needs to be said, that as with farming, 2006 has been a challenging year for research.
PA 1/04 - finishes 30/6/07
Project Aims• To increase the effective use of
precision agriculture systems by grain growers in South Australia.
• To test the economic value of using variable rate inputs to grain crops to manage both stable and unstable variables.
• To broaden the application of precision agriculture to include lower rainfall areas.
SPAA00003 finishes 30/6/07
Project Aims & OutputsTo increase returns to growers by improved understanding and management of within-paddock variability, and validation of PA systems under southern Australian conditions using large-scale trials.• Workshops, field days and printed
newsletters for farmers and advisors to improve skills in PA and to identify key PA technologies for their businesses.
• Results of large scale field experiments to assess the economic value of variable rate inputs.
• Assess the practical application of the N-Sensor for variable rate N application in cereal and canola crops.
Outcomes in 2006
Results for the first two years of both of these trials have been reported in previous issues of Precision Ag News (www.spaa.com.au/publicaitons)
Treatment assessments completed under the first two projects during 2006 include:Research crops were scanned with five different sensing systems: N-Sensor, GreenSeeker Crop Circle, a hyperspectral camera and a simple ground cover imaging system. The value of each system to asses crop biomass and N status between zones and treatments was compared. Crops were located at Hart, SA and Rupanyup, Vic. Zones were monitored using the Yield Prophet program. This data is being compared to establish whether one data source is more robust than another.Leaf tissue was sampled from treated areas. Leaf tissue nutrient analysis was done to compare a range of nutrient concentrations between zones and treatment blocks, to assess crop nutrient status across the range of fertiliser treatments. At St Arnaud Vic, the value of different ryegrass control options to target the areas of high ryegrass density, were tested again in 2006. The crops were scanned in October and results should be available for the next magazine in March. In addition the N-sensor was used to map ryegrass in canola crops. Grain samples are being collected from each treatment area and at fixed points across the nutrition trial paddocks. These samples will be analysed for nutrient content, including protein and for harvest index. This data will be used to assess if increased nutrient inputs, such as phosphorus (P), flow through to grain nutrient levels. Results will also be used in calculating P fertiliser rates for next year based on P removal in the grain.
Conservations Agriculture project with SANTFA, finishes 30/6/09. Project Aims• Release a proven, commercially viable,
variable rate, direct chemical injection system and application protocol in
partnership with KEE Technologies, Nufarm and Croplands.
• SPAA’s role is to establish five variable rate pesticide application experiments/year for three years, using precision agriculture and crop sensor technologies.
Outcomes in 2006In 2006 two mapping and variable rate trials looking at pasture desiccation and barley leaf disease control were established on Mark Branson’s, property at Tarlee, SA.
The N-sensor and GreenSeeker were used to map ryegrass in peas. This information will be used in establishing variable rate herbicide treatments at sowing (wheat) next year.
Actions for 2007We will continue to use different scanners to assess variations in crop biomass and weeds, and to test variable rate herbicide and fungicide treatments.
A further aspect of this research is to map and manage higher weed levels that may arise from paddock heaps dumped by chaff carts at harvest.
PA project in Mallee & Southeast with Advisory Board of Agriculture finishes 28/2/09
Project AimsSeven objectives on increasing the uptake of PA technologies to improve land and resource management.
Outcomes in 2006Two paddocks were scanned with the N-Sensor to map the variation in crop biomass and nitrogen status.
In October Allan Mayfield presented outcomes from SPAA research at a yield mapping field day at Coomandook, SA.
Actions for 2007SPAA will assist with trial design and assessment as well as assist with field days.
Research program expands
SPAA Research
Dr Allan Mayfield, Allan Mayfield ConsultingResearch Coordinator for SPAA
Precision Ag News �
Research program expands
SPAA Research
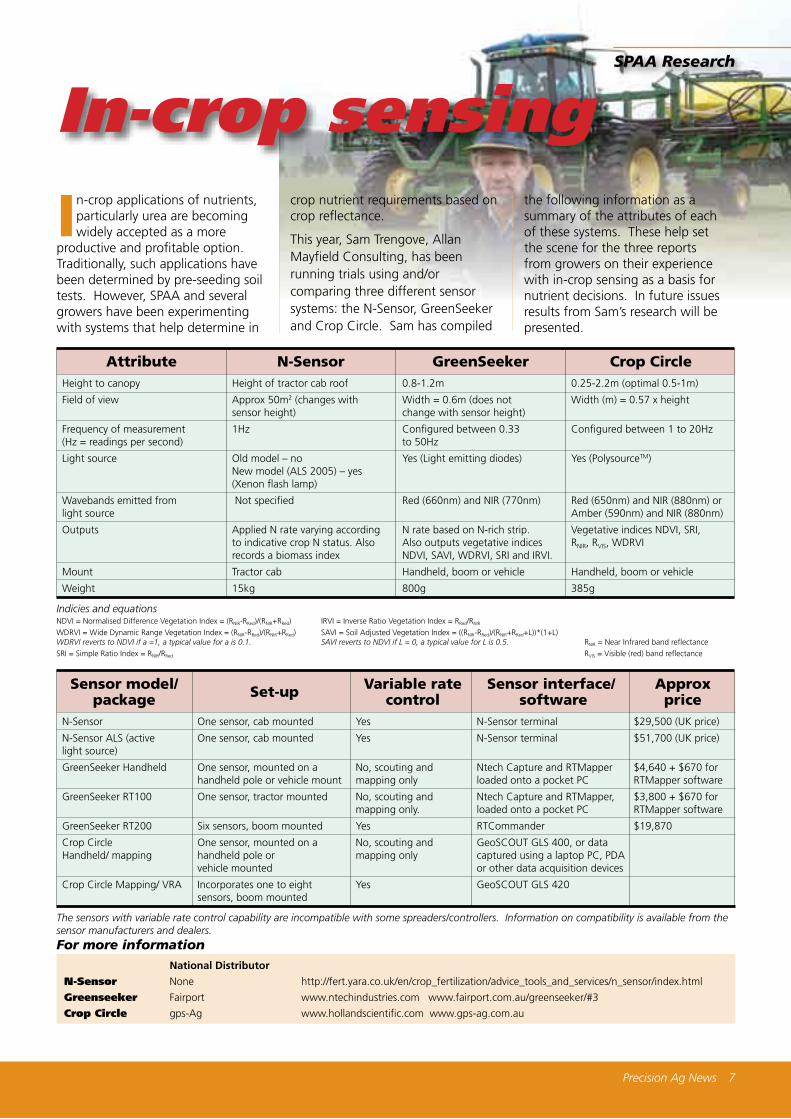
In-crop applications of nutrients, particularly urea are becoming widely accepted as a more
productive and profitable option. Traditionally, such applications have been determined by pre-seeding soil tests. However, SPAA and several growers have been experimenting with systems that help determine in
crop nutrient requirements based on crop reflectance.
This year, Sam Trengove, Allan Mayfield Consulting, has been running trials using and/or comparing three different sensor systems: the N-Sensor, GreenSeeker and Crop Circle. Sam has compiled
the following information as a summary of the attributes of each of these systems. These help set the scene for the three reports from growers on their experience with in-crop sensing as a basis for nutrient decisions. In future issues results from Sam’s research will be presented.
In-crop sensing
Attribute N-Sensor GreenSeeker Crop CircleHeight to canopy Height of tractor cab roof 0.8-1.2m 0.25-2.2m (optimal 0.5-1m)
Field of view Approx 50m2 (changes with Width = 0.6m (does not Width (m) = 0.57 x height sensor height) change with sensor height)
Frequency of measurement 1Hz Configured between 0.33 Configured between 1 to 20Hz (Hz = readings per second) to 50Hz
Light source Old model – no Yes (Light emitting diodes) Yes (PolysourceTM) New model (ALS 2005) – yes (Xenon flash lamp)
Wavebands emitted from Not specified Red (660nm) and NIR (770nm) Red (650nm) and NIR (880nm) or light source Amber (590nm) and NIR (880nm)
Outputs Applied N rate varying according N rate based on N-rich strip. Vegetative indices NDVI, SRI, to indicative crop N status. Also Also outputs vegetative indices RNIR, RVIS, WDRVI records a biomass index NDVI, SAVI, WDRVI, SRI and IRVI.
Mount Tractor cab Handheld, boom or vehicle Handheld, boom or vehicle
Weight 15kg 800g 385g
Indicies and equationsNDVI = Normalised Difference Vegetation Index = (RNIR-RRed)/(RNIR+RRed) IRVI = Inverse Ratio Vegetation Index = RRed/RNIR WDRVI = Wide Dynamic Range Vegetation Index = (RNIR-RRed)/(RNIR+RRed) SAVI = Soil Adjusted Vegetation Index = ((RNIR-RRed)/(RNIR+RRed+L))*(1+L) WDRVI reverts to NDVI if a =1, a typical value for a is 0.1. SAVI reverts to NDVI if L = 0, a typical value for L is 0.�. RNIR = Near Infrared band reflectance SRI = Simple Ratio Index = RNIR/RRed RVIS = Visible (red) band reflectance
Sensor model/ Variable rate Sensor interface/ Approx Set-up package control software priceN-Sensor One sensor, cab mounted Yes N-Sensor terminal $29,500 (UK price)
N-Sensor ALS (active One sensor, cab mounted Yes N-Sensor terminal $51,700 (UK price) light source)
GreenSeeker Handheld One sensor, mounted on a No, scouting and Ntech Capture and RTMapper $4,640 + $670 for handheld pole or vehicle mount mapping only loaded onto a pocket PC RTMapper software
GreenSeeker RT100 One sensor, tractor mounted No, scouting and Ntech Capture and RTMapper, $3,800 + $670 for mapping only. loaded onto a pocket PC RTMapper software
GreenSeeker RT200 Six sensors, boom mounted Yes RTCommander $19,870
Crop Circle One sensor, mounted on a No, scouting and GeoSCOUT GLS 400, or data Handheld/ mapping handheld pole or mapping only captured using a laptop PC, PDA vehicle mounted or other data acquisition devices
Crop Circle Mapping/ VRA Incorporates one to eight Yes GeoSCOUT GLS 420 sensors, boom mounted
The sensors with variable rate control capability are incompatible with some spreaders/controllers. Information on compatibility is available from the sensor manufacturers and dealers.For more information
National Distributor
N-Sensor None http://fert.yara.co.uk/en/crop_fertilization/advice_tools_and_services/n_sensor/index.html
Greenseeker Fairport www.ntechindustries.com www.fairport.com.au/greenseeker/#3
Crop Circle gps-Ag www.hollandscientific.com www.gps-ag.com.au

� Precision Ag News
Guided by the crop
Grower Experience
Mark Branson – Stockport, SAMark and Nola Branson together with parents Deane and Jennifer farm 1200 hectares near Stockport, in the mid North of SA. Each year approximately 80% of the land is cropped to canola, wheat, faba beans, peas, durum wheat and malting barley. The remainder is sown to pasture for the self-replacing Merino and prime lamb flocks. Average growing season rainfall is 350mm and the average wheat yield is 4t/ha. But Mark tries to avoid talking about averages as soils range from red brown earths to heavy cracking clays, topography is undulating and rainfall across the farm can vary significantly.
My first on farm experience with GreenSeeker was this year, 2006, when I used a
hand held GreenSeeker RT100.
During my Nuffield Scholarship in 2005, I looked at several different scanning options but GreenSeeker was the most commercially advanced; I was keen to experiment with it on my own crops.
My interest in understanding the real rather than predicted relationship between soil available nitrogen (N) and crop nitrogen status was triggered by my frustration with nitrogen calculators. The nitrogen mineralisation calculations used in these tend to over or underestimate my nitrogen fertiliser requirement.
In August this year, I sponsored Brenda Tubana from Oklahoma State University to run a GreenSeeker workshop at my farm. The hand held GreenSeeker was provided as part of that package. The workshop was a great opportunity for other growers to gain first hand experience of GreenSeeker.
I used GreenSeeker to indicate the crop’s nitrogen status, and to calculate its nitrogen requirement.
PerformanceBefore the workshop I scanned all my wheat, barley and canola crops. I wanted to see what differences in soil nitrogen uptake existed between a 30m by 100m nitrogen rich area, created in each paddock by applying 200kg N/ha on the 9th of July, and the rest of the paddock.
I used GreenSeeker to indicate the crop’s nitrogen status, and to calculate its nitrogen requirement.
The GreenSeeker calculates the crops NDVI and infers that low values are due to N deficiency and high values due to sufficiency.
I am very pleased with the results from the sensor. Clear differences were recorded between the N-rich strip and the 30m by 100m area of crop scanned adjacent to the N-rich strip (See Table 1). These differences where not obvious when I visually inspected the crop at late tillering, except in Jumbo’s where the crop was showing early signs of nitrogen deficiency, when compared to the nitrogen rich strip.
The N recommendations generated by the GreenSeeker software were generally small and due to the dry season no nitrogen applications were made.
Hitches and glitchesInitially, I had problems trying to use the sensor and its software as the
Table 1 Mark Branson’s wheat crops scanned on the 3rd August, only the crop in Jumbo’s showed any visual signs of N deficiency.
Days from N Rich Standard Max yield N ratePaddock sowing NVDI NVDI (kg/ha) rec.
Jumbos 65 0.474 0.377 4200 42
Barr 75 0.76 0.65 4800 35
Barn 73 0.637 0.592 4000 14
TamFm 72 0.68 0.66 4100 5
Precision Ag News �
Guided by the crop
manual was not written very well; after a few brief phone calls these problems were overcome. There was a problem at the start with the handheld computer not reading the software but after rebooting the handheld computer this has not been a problem.
I am using the software that comes with the GreenSeeker and have not had any problems, so far. Next year I will attempt to use it with the ZYNX computer for variable rate work and will see if there are any compatibility problems. At the moment I am using NTech Capture for collecting basic NVDI data and RT Mapper for Geo-referenced NVDI mapping. This data is able to be transferred into Fairport’s Farmstar software.
Where to from here?I am keen to use crop sensing to identify areas of high biomass, to map these and then carryout paddock checks to see if areas of high biomass are in reality high density pockets of ryegrass. If this works, this information would provide the basis for variable rate herbicide application and sowing rates.
I believe the collection of NDVI data could be of great benefit in the paddock choice for and nutrient management of malting barley, and for early post nitrogen applications according to how the canopy is developing during tillering.
I am definitely in the market for this type of sensor and am looking for the one with the best optics and that will work with my fertiliser boom. From my experience, the Crop Circle sensor seems to be a better sensor than the GreenSeeker but at this stage does not have the agronomic development of the GreenSeeker.
I am investigating the use of satellite and aerial NVDI collection across a whole paddock. My aim is to see if there is potential to use these relatively cheap sources of NVDI data as a basis for calculating variable rate nitrogen. I will use the handheld sensor to verify the data. To use these other sources of NDVI data with the GreenSeeker software I will need to create baseline nitrogen data for the soils and environments on my farm.
For more informationhttp://nue.okstate.edu/CCA_2005/Australia_Workshop2006.htm
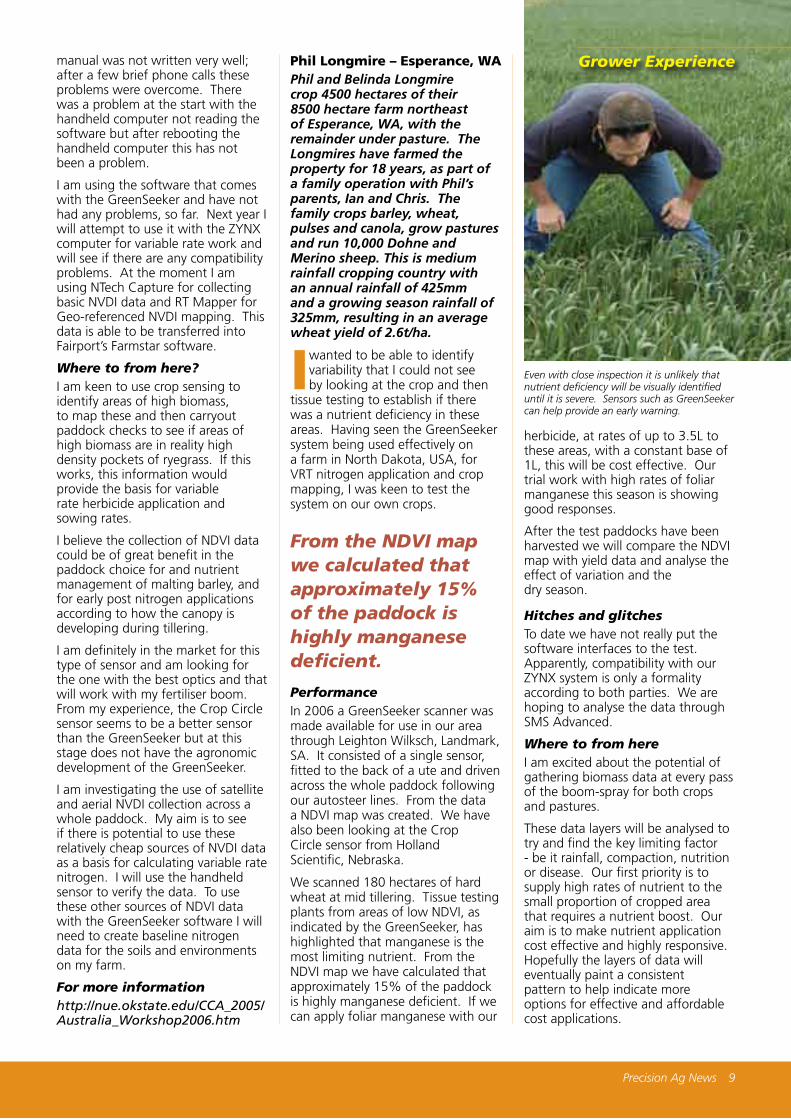
Phil Longmire – Esperance, WAPhil and Belinda Longmire crop 4500 hectares of their 8500 hectare farm northeast of Esperance, WA, with the remainder under pasture. The Longmires have farmed the property for 18 years, as part of a family operation with Phil’s parents, Ian and Chris. The family crops barley, wheat, pulses and canola, grow pastures and run 10,000 Dohne and Merino sheep. This is medium rainfall cropping country with an annual rainfall of 425mm and a growing season rainfall of 325mm, resulting in an average wheat yield of 2.6t/ha.
I wanted to be able to identify variability that I could not see by looking at the crop and then
tissue testing to establish if there was a nutrient deficiency in these areas. Having seen the GreenSeeker system being used effectively on a farm in North Dakota, USA, for VRT nitrogen application and crop mapping, I was keen to test the system on our own crops.
From the NDVI map we calculated that approximately 15% of the paddock is highly manganese deficient.
PerformanceIn 2006 a GreenSeeker scanner was made available for use in our area through Leighton Wilksch, Landmark, SA. It consisted of a single sensor, fitted to the back of a ute and driven across the whole paddock following our autosteer lines. From the data a NDVI map was created. We have also been looking at the Crop Circle sensor from Holland Scientific, Nebraska.
We scanned 180 hectares of hard wheat at mid tillering. Tissue testing plants from areas of low NDVI, as indicated by the GreenSeeker, has highlighted that manganese is the most limiting nutrient. From the NDVI map we have calculated that approximately 15% of the paddock is highly manganese deficient. If we can apply foliar manganese with our
Even with close inspection it is unlikely that nutrient deficiency will be visually identified until it is severe. Sensors such as GreenSeeker can help provide an early warning.
herbicide, at rates of up to 3.5L to these areas, with a constant base of 1L, this will be cost effective. Our trial work with high rates of foliar manganese this season is showing good responses.
After the test paddocks have been harvested we will compare the NDVI map with yield data and analyse the effect of variation and the dry season.
Hitches and glitchesTo date we have not really put the software interfaces to the test. Apparently, compatibility with our ZYNX system is only a formality according to both parties. We are hoping to analyse the data through SMS Advanced.
Where to from hereI am excited about the potential of gathering biomass data at every pass of the boom-spray for both crops and pastures.
These data layers will be analysed to try and find the key limiting factor - be it rainfall, compaction, nutrition or disease. Our first priority is to supply high rates of nutrient to the small proportion of cropped area that requires a nutrient boost. Our aim is to make nutrient application cost effective and highly responsive. Hopefully the layers of data will eventually paint a consistent pattern to help indicate more options for effective and affordable cost applications.
Grower Experience

10 Precision Ag News
Currently we are looking at purchasing two Crop Circle sensors (from our experience this system has given us a more accurate footprint) and locating them across our 36m boom-spray. This will give us an average NDVI across the width of the boom, based on two 18m passes. As we can only vary inputs in the direction of travel and not across the width of the boom, we feel two sensors will be sufficient.
To apply the liquid nutrients we will use an additional tank, controller and pumping system and plumb the boom into our second spray line. This will enable us to apply nutrients at the same time as broadleaf herbicides.
NSW cropper Richard Heath has been using N-rich strips as a method of judging crop nitrogen requirement for the past four years. In �00� he started using a GreenSeeker to calculate in-crop N requirements.
Richard Heath – Gunnedah, NSWPine Cliff is a mixed cropping and grazing property on the Liverpool Plains. Richard with his father and three brothers crop 3300 hectares of winter and summer crops including wheat, corn and sorghum. Annual rainfall is 636mm (summer dominant) and average wheat yields are 4.5t/ha. In this area the predominant method of nitrogen fertilisation is incorporation of anhydrous ammonia or urea either in the months before seeding or during a one-pass seeding operation. Top dressing is uncommon.
Since 2003 we have used high nitrogen (N) strips in-crop and found these to be
much more accurate than soil tests for determining the need for top dressed nitrogen.
In 2003 and 2004 the rate of nitrogen recommended from soil tests for a 5t/ha crop was 100kgN/ha. N-rich strips were created and visually compared to the crop; these indicated no fertiliser was required. Comparisons were also made using tiller counts, tissue tests, an N-Sensor, aerial and satellite imagery. All methods indicated that the crop did not require nitrogen fertiliser.
Despite all this data we lacked confidence and applied fertiliser to a proportion of the crop, leaving enough strips without fertiliser to allow us to measure a range of treatments. While there was a yield benefit from applying N it was not enough to cover the cost of the in-crop N and its application.
In winter 2005, a net benefit of $20/ha, over normal practice, was achieved by top dressing nitrogen at rates determined by visual observation of nitrogen rich strips. The benefit was gained mainly from savings in fertiliser rather than extra yield.
PerformanceIn October 2005 we had our first on-farm use of GreenSeeker RT200, although we had tested a hand held RT100 in 2004. We opted for the GreenSeeker as unlike the N-Sensor it has its own light source, allowing it to be used anytime of day or night. We also liked GreenSeeker because it is supported by software based on a robust agronomy package. The GreenSeeker software gives a recommendation based on the crop data not by varying a predetermined nitrogen rate.
In the first year we used the GreenSeeker to map and recommend rates for side dressing urea on corn and sorghum.
In the corn paddock soil tests recommended a rate of 50kgN/ha. N-rich strips were established by applying 60kgN/ha pre sowing and these strips where visually evident by side dressing, six-weeks after planting. The GreenSeeker recommendations for the block averaged 25kgN/ha (64kg/ha urea), with the recommended rate in the
areas of high potential being 50kgN/ha, the same as the soil test.
We used the GreenSeeker data to create a variable rate application map and urea was side dressed in alternate strips at 40, 60 and 80 kg/ha.
No economic response to N was recorded at any rate. However, if we had used the GreenSeeker recommendation rather than N requirement generated by the soil test we would have saved 40kg/ha of urea across the paddock.
This year all our winter crop nitrogen applications were applied as UAN, on-the- go by the GreenSeeker using a Hardi controlled on Hardi Commander boomspray fitted with fertiliser nozzles. There were no compatibility problems between the programs and the rate response was generally very good.
I like the fact that the GreenSeeker software logs the recommended N and the actual N rate applied. This is important as the actual rate depends on rate of flow response by the control applicator.
‘benefit was gained mainly from savings in fertiliser‘
Hitches and glitchesWe have been happy with the system. Data is imported from the GreenSeeker software into FarmWorks, Farmsite and this works well.
The biggest challenge is to know where to locate the N-rich strips. Our aim is to place them in a part of the paddock where N is anticipated to be the only limiting factor. We use a combination of knowledge and information from PA data to help locate the strips. In a paddock over 100 hectares we use two N-rich strips.
Where to from here?As the GreenSeeker is permanently on the boom-spray it is used to record NDVI every time a spray application occurs. This data is mapped giving us a picture of how biomass is changing across a paddock during the year. In future we may use this information for planning variable rate use of plant growth regulants and possibly fungicides.
Grower Experience
Phot
o G
rain
Bus
ines
s
Precision Ag News 11
Crop and weed sensing technology has existed as a research tool in Australia
since 1984. The concept was originally developed by researcher Warwick Felton at the DPI Tamworth. However, the reliable application of automated spot spraying in broadacre agriculture has only recently been possible with the
commercial release of WeedSeeker selective application equipment by US based company N-Tech Industries.
Selective spot spraying technology was commercialised in the USA seven years ago and has found wide commercial application around the globe in all types of agricultural environments. Sensors can be used to selectively apply
herbicides, insecticides, fertilizers and fungicides to plants in a wide range of agricultural situations including cotton, broadacre, horticulture and viticulture.
Anywhere a product can be targeted to the plant and not bare soil, the WeedsSeeker can provide large savings and big environmental benefits.
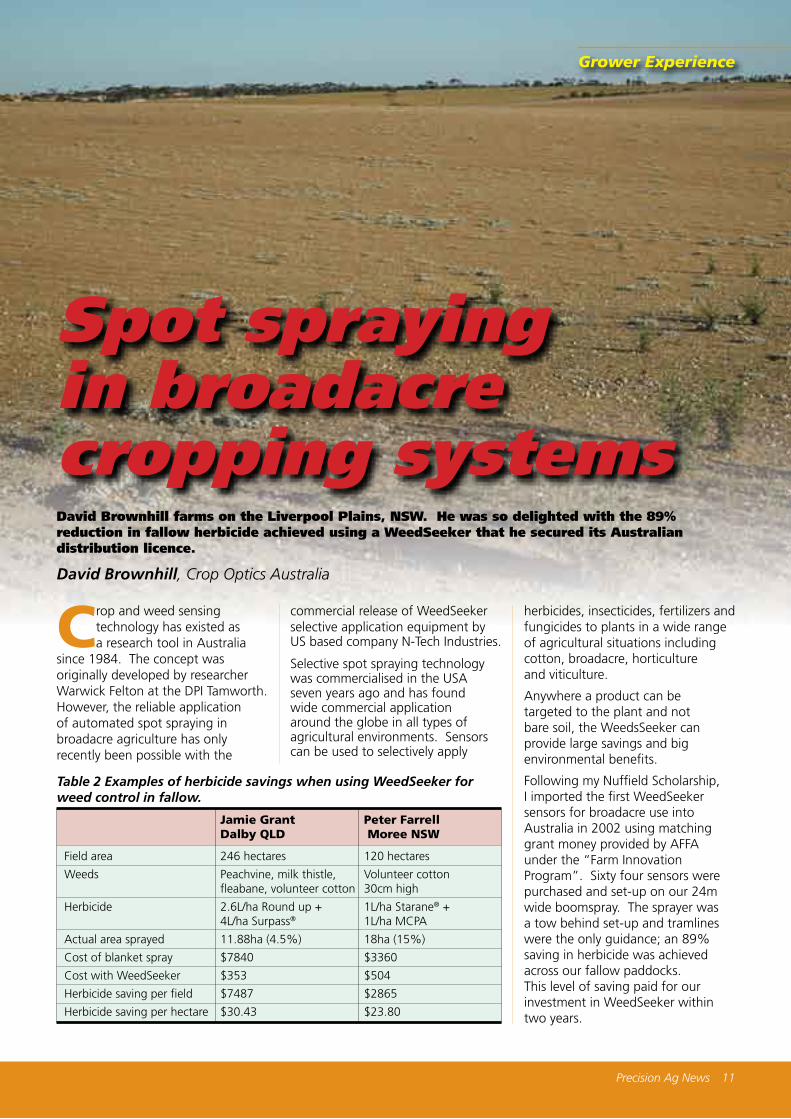
Following my Nuffield Scholarship, I imported the first WeedSeeker sensors for broadacre use into Australia in 2002 using matching grant money provided by AFFA under the “Farm Innovation Program”. Sixty four sensors were purchased and set-up on our 24m wide boomspray. The sprayer was a tow behind set-up and tramlines were the only guidance; an 89% saving in herbicide was achieved across our fallow paddocks. This level of saving paid for our investment in WeedSeeker within two years.
Spot spraying in broadacre cropping systemsDavid Brownhill farms on the Liverpool Plains, NSW. He was so delighted with the 89% reduction in fallow herbicide achieved using a WeedSeeker that he secured its Australian distribution licence.
David Brownhill, Crop Optics Australia
Grower Experience
Table 2 Examples of herbicide savings when using WeedSeeker for weed control in fallow.
Jamie Grant Peter Farrell Dalby QLD Moree NSW
Field area 246 hectares 120 hectares
Weeds Peachvine, milk thistle, Volunteer cotton fleabane, volunteer cotton 30cm high
Herbicide 2.6L/ha Round up + 1L/ha Starane® + 4L/ha Surpass® 1L/ha MCPA
Actual area sprayed 11.88ha (4.5%) 18ha (15%)
Cost of blanket spray $7840 $3360
Cost with WeedSeeker $353 $504
Herbicide saving per field $7487 $2865
Herbicide saving per hectare $30.43 $23.80

1� Precision Ag News
We now run WeedSeeker sensors across a 27m, self propelled spray-rig with 2cm accuracy GPS guidance; with this we achieve the same savings in herbicide.
DPI research in Northern NSW has shown that average weed cover in fallow paddocks is as low as 20% of the paddock area. Therefore, 80% of the herbicide applied falls on bare soil and is wasted. This is inefficient,
expensive and environmentally unstainable.
There are now 13 commercial spray-rigs across NSW and Qld operated by farmers and contractors using WeedSeeker. These are achieving large reductions in fallow herbicide use with savings of 80% and better. Cost examples of the possible savings using WeedSeeker for fallow weed control are found in Table 2.
average weed cover in fallow paddocks is as low as 20%
I believe there is a range of applications for WeedSeeker.
1) Broadacre fallow spraying
2) Shielded spraying in row crops
3) Application of fungicides, insecticides and fertiliser in horticultural crops
4) Spot spraying on irrigation channels
5) Viticulture and tree crops
6) Industrial uses including weeds on roads, railways, airports etc
WeedSeeker benefitsThe reduction in herbicide cost due to target spot spraying is just one of the benefits gained
from only applying herbicide to the weed targets. Others relate to management of herbicide resistance and reduced herbicide inputs with no-till, not to mention the environmental benefits of less spray drift and reduced potential for off-target impacts from drift and herbicide leaching.
For example, in relation to managing herbicide resistance WeedSeeker allows us to use mixtures of different herbicide groups eg Select® to control ryegrass in the fallow, Garlon® for melons etc, which may be currently too expensive to apply in a blanket application. This will help reduce resistance in weed populations and prolong the life of existing herbicides, greatly improving sustainability of cropping systems.
For more information David Brownhill 0427 473725, [email protected]
Anywhere a product can be targeted to the plant and not bare soil, the WeedsSeeker can provide large savings and big environmental benefits.
How WeedSeeker worksWeedSeeker consists of an integrated light emitting diodes (LED), light detector and a spray nozzle controlled by a fast-fire solenoid valve.
1. The LED produces a combination of invisible infrared and visible red light, this is projected into the target weeds, approximately 60cm below the sensor.
2. The light reflected from the target is captured by the detector at the front of each WeedSeeker sensor. For 100% ground coverage sensors are spaced at 38cm across the boom.
3. Sophisticated circuits inside the sensor analyse the reflected light and determine when it matches the light reflected by green plants. The WeedSeeker circuitry is not able to differentiate between the intensity of green nor estimate biomass as is done by the GreenSeeker sensor.
4. When reflectance from green plants is identified, the sensor waits until the plant is under the spray nozzle and then triggers a fast-fire solenoid valve that sprays the plant.
In the cab WeedSeeker is controlled by a simple analogue control box. Controls include on/off, adjustment for weed size and calibration for herbicide rate and speed of travel.
Consisting of a sensor and spray nozzle with fast-fire solenoid valve the WeedSeeker can accurately spot spray weeds reducing herbicide use and environmental impact.

Precision Ag News 1�
Intensive rotational grazing is widely accepted as a system that increases pasture productivity and
herd performance. However, this system can be expensive to establish and time consuming to manage. Dr Dean Anderson, has developed a system of virtual boundaries that is able to manage animal movement in both intensive and extensive livestock operations.Dr Anderson is a Research Animal Scientist with the US Department of Agriculture based at the Journada Experimental Range in New Mexico. The mission at Jourdana is to develop new knowledge of ecosystem processes as a basis for management and remediation of desert rangelands. These rangelands, like those in Australia, are fragile areas carrying large numbers of stock at low stocking rates, where grazing conditions can change considerably depending on patterns of rainfall. Research and practice has shown that grazing management can yield improved productivity and be less damaging to these fragile environments. Dr Anderson has focused nearly 30 years of research on developing animal management systems to control the movement of grazing animals by using their innate behaviour, and precision guidance software. Earlier this year Dr Anderson presented his Directional Virtual Fencing™ system to livestock producers in SA and WA.From his research Dr Anderson has established that applying audio or electric shock cues to an animal’s right or left side controls animal location and direction of movement; the stronger the cue the greater the response.
By combining physics, electronics, biology and ecology Dr Anderson has developed a locator/controller collar that produces the audio and electric signals. But how does the collar know when to emit the signals?
Global Positioning Satellites (GPS) are used to determine an animal’s location. This location data is transmitted from the collar to a Geographic Information System (GIS) that determines whether the animal is in the correct location range. If not or if too close to the boundary sends cues to the collar to emit signals to the right or left side of the animal.
The virtual line or fence is determined by the manager submitting coordinates into the GIS system. Audio cues are the least severe cue while a combination of audio and electric shock are the most severe. Even at the more sever levels the system causes the animal minimum stress. The cues are applied either to the right or left side of the animal depending on the angle of the animals head with respect to a virtual line.
The virtual line or fence is determined by the manager submitting coordinates into the GIS system. The coordinates can relate to a single boundary that joins physical fences or can consist of multiple virtual boundaries producing a virtual enclosure. When
the GPS identifies an animal is too close to the virtual line the cues will be triggered until the animal has responded appropriately.
Animals have been found to condition rapidly to these cues and the process is consistent with low stress animal handling procedures.
Using Dr Anderson’s system farmers will be able to program stock movement from their computer. This could be moving fences hourly in intensive grazing situations to droving cattle across range lands by regularly moving a virtual back fence.
The introduction of stock to graze stubbles in unfenced paddocks could also be possible with this system.
Dr Anderson believes that farmers need to change their current thinking about fencing and embrace the opportunities that new technologies offer; he suggest many have yet to be imagined.
“By 2050 internal conventional fences will be obsolete with conventional fences only being required around the boundary of the property,” said Dean Anderson.
Research has proved that virtual fences work and have a range of practical applications but the product has yet to be commercialised. Dr Anderson anticipates this will occur in the foreseeable future.
He is continuing to work on the concept and is currently investigating the identification and use of collars only on lead animals in a herd or flock.
For more information Dean Anderson [email protected]
Virtual grazing systemsThe summation of 30 years of research on animal behaviour and the greater availability and affordability of satellite based navigation systems has enabled Dr Dean Anderson to develop the ultimate fencing solution – Directional Virtual Fencing (DVF™). During a three month sabbatical with CSIRO Dr Anderson explained his system to Australian livestock managers.
Emma Leonard
Research -Pasture

1� Precision Ag News
An exciting new reference to all aspects of PA is available on disc from GRDC, and what is more
it’s free.
The GRDC Precision Agriculture Manual is a step by step guide to the background and
implementation of PA. With contributions from many leading researchers, agronomists
and farmers involved in the GRDC PA research initiative, the Manual provides a unique resource
for anyone who wants to learn, research or implement PA.
The Manual has been produced on CD and the documents have numerous active links so they can be jointly searched, and are referenced to
websites with additional information.This is the first time all this information has been collated one place. It is hoped that the PA Manual will
be used by many audiences:
• educators • researchers • advisers & growers
The CD can be ordered online through the GRDC website ‘Grainzone’
http://www.grdc.com.au/bookshop/free.htm#new or by contacting Canprint on
freecall 1800 11 00 44 Free Fax: 1800 00 99 98
PA on disc
An introduction to, and discussion of, the various tools and technologies associated with Precision Viticulture. How does someone interested in using these tools make a start in adopting Precision Viticulture practices? Learn how spatial information should be acquired, delivered and used and arm yourself with the questions that need to be asked of a service provider. The practical application of Precision Viticulture is a central theme to this book and a number of commercial case studies are presented.
Phone Winetitles on (08) 8292 0888 or visit our website www.winebiz.com.au

Precision Ag News 1�
Over four million tonnes of fertiliser are spread in New Zealand each year.
In pastoral production, covering 38% NZ, the majority is applied as granular fertiliser distributed by on-ground or aerial spreading without GPS guidance. The recent introduction of environmental legislation in relation to fertiliser application has increased the need for a better understanding of current application performance levels and the economic benefit that may be achieved by changing these levels.
Internationally recognised testing methods (transverse tests) for fertiliser spreaders report that the expected coefficient of variation (CV) for products containing nitrogen is at least 15% and 25% for products without nitrogen.
Using Geographic Information Systems (GIS) and the positional information from the spreading operation, the actual CV achieved was calculated for ground spreading operations on 102 paddocks on four dairy farms.
Fifty nine of the paddocks were uniform in shape and 43 non-uniform; paddock size ranged from 0.48 hectares to 7.45 hectares. A target rate of 80kg/ha of fertiliser was set for each paddock. The work assumes a mechanical drive is used for the spinners, so spread rate is linked to speed and that application variation due to speed fluctuations
was perfectly controlled by the on-board computer.
Actual average application rates varied from 51.8 to 106.7kg/ha of urea (46%N) spread on individual paddocks. The typical field CV was found to be 37.9% across the four farms.
Variation due to driving accuracy and driving method was calculated to be 22.9%, considerably greater than the 15% calculated from the transverse test. The CV is likely to increase travelling across a slope.
Paddock shape was found to have an impact on performance with irregular shaped paddocks having a high application variation, up to 40.8%. The highest calculated paddock variation was 62.3% on a 0.8 hectare, irregular shaped paddock.
Our research has shown, that by improving driving accuracy considerable improvements in field CV could be achieved. For dairy farmers using small paddocks (1-2ha) it is estimated that an achievable field CV for fertiliser distribution is 25-30%, if GPS guidance is used. Within the study the typical cost of lost production due to inaccurate spreading for the dairy farmers was between $50/ha and $70/ha over the full year.
Similar methods were used for testing the accuracy of fertiliser applied by aircraft over a 20 hectare
paddock. Without the use of GPS guidance a field CV of 90% was recorded. The use of GPS guidance reduced this to 60%, still considerably higher than from ground spreading without GPS guidance. Further tests on a 2,200 hectare property produced a CV of 72%. The main reason for the high CV with aerial spreading was due to the lack of a flow control system to adjust for fluctuations in aircraft speed.
Estimates of economic loss found that poor spreading from aircraft was typically costing $10/ha mainly due to changes in aircraft speed and uneven swath matching, resulting in overlaps or missed strips. Reducing fertiliser use by not spreading on unproductive areas provided a further cost saving of $9/ha per annum. Assuming perfect spreading where achieved the adoption of variable rate application technology has the potential to produce a financial benefit of $85/ha; raising the financial performance of these areas from around $320/ha to $405/ha.
It is hoped that these results will help encourage producers to invest in guidance and systems of fertiliser delivery that accurately deliver the desired fertiliser rate.
For more information Dr Ian Yule 00 11 64 (0)6 3504340, [email protected]
Mapping actual fertiliser distributionDr Ian Yule and Haden Lawrence, Massey University, Palmerston North
Research -Pasture

1� Precision Ag News
Soilborne diseases continue to cause substantial losses in broadacre field crops. The
spatial distribution of diseases such as take-all, rhizoctonia and crown rot is often variable within a paddock and is correlated with variation in soil attributes, topography and patterns of plant growth (eg yield, biomass).
Earlier research supported by SARDI/GRDC showed that disease inoculum levels frequently differed between Precision Agriculture (PA) zones. Knowledge of which zones are at risk from diseases is valuable for designing management strategies, so testing soil from different zones was encouraged. However, further work was required to identify which data sources provided the most valuable information on inoculum levels.
Many data layers (eg yield, elevation, biomass etc) can be mapped, using a range of proximally- and remotely-sensed data collection systems.
Our recent research assessed the usefulness of the many data layers available for mapping soilborne disease inoculum (Table 3).
root disease inoculum sampling zones can be derived from the cheapest available data
Spatial data layers (approximately 30 layers per paddock) were collected over five paddocks to determine which combinations of layers are most suitable for defining zones for disease inoculum measurement. We compared zone maps based on a single data layer through to maps based on combinations of many layers. The results suggest new guidelines for the best method to identify differences in inoculum level between PA zones.
Six zone models were generated, using different combinations of data layers (Table 3). Inoculum was measured for points on a grid over the whole paddock, and subsets of this grid were used to calculate the level within each zone. All zone models (except (f); Table 3) combined multiple data layers using a clustering technique in JMP (“Jump”) computer software. Zone models a) and b) were also compared over an additional eight paddocks.
A “Partition Index” (PI) was devised to compare the relative ability of each zone model to partition paddocks into zones with different inoculum levels. This index takes into account differences between zone inoculum means and the whole paddock mean, as well as the size of each zone.
Averaged over the five paddocks proximal (a), satellite (b) and custom
Research - cropping
Data layers for soilborne diseaseDr John Heap and Dr Alan McKay, SARDI

Precision Ag News 1�
MLR (c) zone models were found to be equally robust, consistently producing zones with different levels of inoculum. “Biological” (d) and “Geological” (e) models were equal but less useful than a), b) and c), while ECa alone was least useful. Use of custom MLR zones (c) is probably unwarranted, because it is less practical for growers.
When proximal (a) and satellite (b) models were compared over 13 sites (Figure 1) the results suggested that they were equally useful in the identification of zones with different inoculum levels for the major diseases take-all, rhizoctonia and CCN.
Satellite NDVI data appeared to be better at predicting crown rot distribution, while the proximal model was better for common root rot, Pratylenchus neglectus, and Pratylenchus thornei.
Given the complexity of the interactions involved it appears difficult to predict in advance the usefulness of specific models for specific diseases. However, broad suggestions can be made.
Based on our work to date it is considered that proximal and satellite models are similarly useful when testing for the full range of diseases. Therefore, it is suggested that root disease inoculum sampling zones be derived from the cheapest available proximal or satellite data.
Research - croppingTable 3 Six zone models were generated for each paddock, and inoculum levels were measured from points within each zone.
Model Data layers used for zone map
a) Proximally-sensed data (yield, ECa, elevation)
b) Satellite NDVI biomass data.
c) Custom disease zones (using correlation matrices and Forward Stepwise Multiple Linear Regression to choose layers - “Custom MLR” - selected from all available data layers).
d) “Biological” layers (yield, NDVI biomass, aerial photography, N-Sensor).
e) “Geological layers” (ECa, elevation, slope, gamma-radiometric and magnetic susceptibility).
f) ECa (eg EM38) alone.
Figure 1. Comparison of usefulness (Partition Index) for zones based on proximally-sensed (Prox) and Satellite NDVI (Sat) data for a range of soilborne diseases over 13 sites. (n= observations)
Abbreviations for diseases: CCN = cereal cyst nematode; CRp = crownrot: Fusarium psuedograminearum; CRR = common root rot; Pn = Pratylenchus neglectus; Pt = Pratylenchus thornei; Rs = rhizoctonia; TA = take-all.
For more information Dr John Heap (08) 8303 9444 [email protected]
n=9
n=3
n=5 n=4n=4
n=6
n=2
n=33
1.4
1.2
1
0.8
0.6
0.4
0.2
0-0.2
Part
itio
n In
dex
(m
ean
)
Rs TA CCN CRp Pn Pt CCR Total
Prox Sat
Comparison of mean Partition Index for zones based on proximally-sensed (Prox) and Satellite NDVI (Sat) data for arange of soilborne diseases over 13 sites. (n=observations
Proximal data sources such as yield and ECa or remotely sensed satellitebiomass data
where all found to be useful data sources for identifying cereal root disease.
1� Precision Ag News
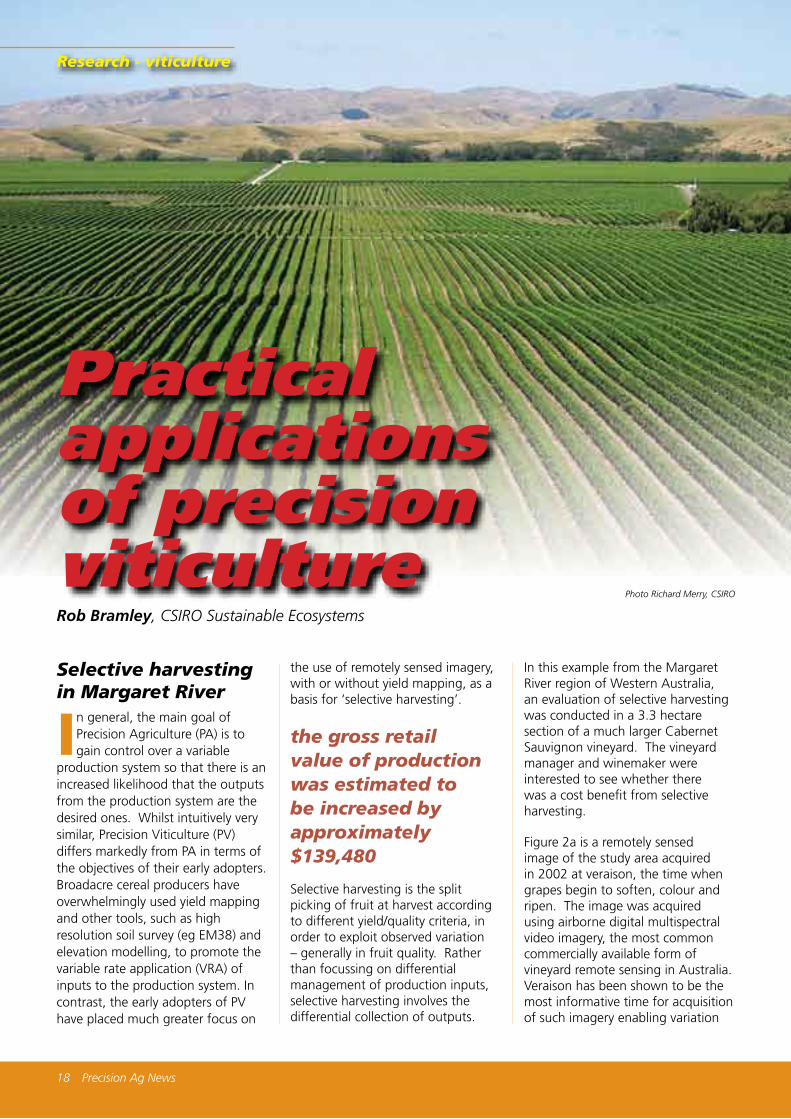
Selective harvesting in Margaret River
In general, the main goal of Precision Agriculture (PA) is to gain control over a variable
production system so that there is an increased likelihood that the outputs from the production system are the desired ones. Whilst intuitively very similar, Precision Viticulture (PV) differs markedly from PA in terms of the objectives of their early adopters. Broadacre cereal producers have overwhelmingly used yield mapping and other tools, such as high resolution soil survey (eg EM38) and elevation modelling, to promote the variable rate application (VRA) of inputs to the production system. In contrast, the early adopters of PV have placed much greater focus on
the use of remotely sensed imagery, with or without yield mapping, as a basis for ‘selective harvesting’.
the gross retail value of production was estimated to be increased by approximately $139,480
Selective harvesting is the split picking of fruit at harvest according to different yield/quality criteria, in order to exploit observed variation – generally in fruit quality. Rather than focussing on differential management of production inputs, selective harvesting involves the differential collection of outputs.
In this example from the Margaret River region of Western Australia, an evaluation of selective harvesting was conducted in a 3.3 hectare section of a much larger Cabernet Sauvignon vineyard. The vineyard manager and winemaker were interested to see whether there was a cost benefit from selective harvesting.
Figure 2a is a remotely sensed image of the study area acquired in 2002 at veraison, the time when grapes begin to soften, colour and ripen. The image was acquired using airborne digital multispectral video imagery, the most common commercially available form of vineyard remote sensing in Australia. Veraison has been shown to be the most informative time for acquisition of such imagery enabling variation
Research - viticulture
Practical applications of precision viticultureRob Bramley, CSIRO Sustainable Ecosystems
Photo Richard Merry, CSIRO

Precision Ag News 1�
in photosynthetically active biomass (PAB) to be identified. Remote sensing provides a surrogate estimate of PAB – in this case through the so-called ‘plant cell density’ index (PCD), which is calculated as the ratio of reflected infrared to red light. A large PAB (ie higher values of PCD) is a reflection of a large, healthy (ie vigorous) canopy, whereas a low PAB reflects either that the canopy is small and/or that it is under stress (low vigour). As Figure 2a indicates, this particular vineyard has a more vigorous (high PCD) northern section and a less vigorous (low PCD) southern section. Note that the rows run north-south, which means that a single row may express the full range of vigour seen in the whole block.
Two weeks prior to the expected harvest date, vines in areas of low and high PCD were assessed for canopy vigour, and samples of fruit were analysed for sugar (baumé), pH and titratable acidity (TA). Sensory assessment of the fruit by the winemaker was also carried out. The results confirmed that differences in PCD translated into real differences on the ground.
Accordingly, the block was divided into northern (high PCD/high
vigour) and southern (low PCD/low vigour) zones. It was subsequently selectively harvested using a mechanical harvester fitted with a grape yield monitor and differential GPS. Two chaser bins ran alongside for the separate collection of fruit from the two zones. The yield map produced (Figure 2b) showed that whilst the average yield for the whole block was 13t/ha, the higher vigour northern zone had an average yield of 16t/ha whereas the southern zone yielded 8t/ha. The variation in yield across the block was found to resemble closely variation in PCD.
The two parcels of fruit were processed separately in the winery. After vinification, differences in wine quality between the wines from the two zones were deemed large enough to justify allocation of the wines to different end products.
Wine made from fruit harvested from the northern zone was allocated to the ‘Classic Dry Red’ brand (retail price approximately $19/bottle), while wine made from fruit harvested from the southern zone was allocated to a varietal Cabernet Sauvignon brand (retail price approximately $30/bottle).
If the block had been harvested as a single unit, the resulting wine
would have been allocated to the lower end-use product. Based on these wine prices, the tonnage of fruit harvested from each zone, and the assumption that one tonne of fruit produces 750 litres of wine, the gross retail value of production was estimated to be increased by approximately $139,480 over the 3.3 hectares using selective, as opposed to uniform harvesting. This is equivalent to $3,653/t fruit harvested or $42,267/ha. The additional costs involved in selective harvesting were confined to the costs of running the second chaser bin/tractor. Winemaking costs associated with the two products were the same.
In 2003, this block was again split into the two zones and harvested differentially. However, instead of picking each zone on the same day, the more vigorous northern zone was harvested nine days later in order to enable the fruit to become more physiologically ripe. This strategy had the additional benefit of removing the requirement for the second chaser bin during harvest, reducing the cost of selective harvesting. While wine made from the less vigorous southern zone was again allocated to the varietal Cabernet Sauvignon brand, wine made from fruit harvested from the northern zone was allocated to a higher end product than in 2002 (a Cabernet Merlot blend with a retail value of approximately $22.50/bottle), because of the enhanced fruit ripeness.
In 2004 and 2005, the block was again selectively harvested. As in 2002, each zone was picked on the same day but fruit was separated during harvest using one tonne capacity bins mounted on a four bin trailer (4t total). Individual bins were used to separate the low and high PCD fruit by simply changing the filling position on the picking trailer. This strategy, as in 2003, removed the requirement/cost of running a second chaser bin/tractor, but still allowed selective harvesting to be carried out in a single harvest event.
Research - viticulture
Figure 2 a&b. Performance of a �.�ha area of Cabernet Sauvignon in Margaret River in terms of (a) PCD at veraison �00�, and (b) vintage the same year. In (a), blue indicates relatively higher vigour and red indicates low vigour. The horizontal line in both figures delineates the lower and higher yielding zones, the fruit from which was selectively harvested into separate bins.

�0 Precision Ag News
Research conducted over several years in other vineyards by Richard Hamilton and I, along with colleagues from CSIRO, CRCV and Foster’s has shown that patterns of spatial variation in vineyard productivity (yield, vigour) tend to be fairly stable in time – as was the case in this example. The research also strongly suggests that patterns of variation in fruit quality follow patterns of variation in yield. So, until on-the-go fruit quality sensing technologies are available, the use of remotely sensed imagery and yield monitor data appears to be an appropriate basis for delineation of zones for pre-vintage fruit quality assessment and subsequent selective harvesting.
Of course, whether inter-zone quality differences are large enough to move the resultant wines from one price point to another, as in this Margaret River example, is something that will need to be
determined each year. Nevertheless, selective harvesting offers both grapegrowers and winemakers the opportunity to take advantage of variability within their production systems.
Improved natural resource management in the Clare Valley
The Clare Valley has limited supplies of good quality water; much of the groundwater is
salty and annual average rainfall is only 650mm, with most falling in winter when vines are dormant. In order to secure a supply of irrigation water for the growing season, many vineyards have installed surface water dams. However, this strategy increases the risk of soil salinisation as a consequence of the raised saline water table in the vicinity of the dam. The manager of the 24 hectare vineyard in which this
study was conducted wanted to know whether, and to what extent, such salinisation was impacting on vineyard performance.
An EM38 soil survey was carried out at the site in December 2000 and the following vintage the block was yield monitored (Figure 3). An elevation model of the site was also produced following survey with a real time kinematic GPS (RTK) (normally done with the EM38 survey). While the differential GPS, as used for yield mapping and EM38 survey, is accurate to about ± 50 cm in the horizontal planes, its accuracy in the vertical plane is several metres. In contrast, RTK is accurate to 2-3cm in both the horizontal and vertical planes.
Soil samples collected from positions chosen to cover the full range of variation in the EM38 signal (Figure 3a) were analysed for a range of soil properties, including electrical conductivity (EC), clay content and exchangeable cations. Note
Research - viticulture
Figure 3. Variation in (a) bulk electrical soil conductivity and (b) yield (vintage �001) in a �� ha vineyard in the Clare Valley, South Australia. The triangles in (a) indicate the location of soil sampling sites used for ground-truthing the EM signal. Different varieties are grown in each of the sub-blocks making up this vineyard. To account for between-variety differences in yield potential, the data were normalised (mean = 0, standard deviation = 1) on a per variety basis prior to mapping. There is a large surface water dam on the north-western side of this vineyard.

Precision Ag News �1
that conductivity arises in soil as a consequence of the presence of salt, the type and amount of clay, and the amount of water and organic matter. Calibration of the EM38 signal (bulk electrical conductivity in the soil, against soil analytical data) demonstrated that the EM38 signal was dominated by soil salinity. Therefore, for all practical purposes, Figure 3a can be regarded a soil salinity map. This conclusion is strongly supported by the fact that when the EM38 map is draped over the digital elevation model derived from the RTK survey, the areas of highest apparent salinity occur in the lowest lying areas (Figure 4) – the expected result in a salt-affected landscape.
As Figure 3 shows, both yield and electrical conductivity varied markedly within the 24 hectare study area, with most of the apparently saline areas corresponding to areas of lower yields. This is especially apparent when the yield and EM38 data are clustered into zones using a statistical procedure known as k-means clustering (Figure 4).
• Cluster 1 is made up of areas which are characterised by both low yields and high soil conductivities (ie high salinity),
• Cluster 2 separates out above-average yielding areas characterised by moderate soil salinity,
• Cluster 3 is made up of lower yielding areas in which salinity, as measured by EM38, is not expected to be yield limiting.
The latter suggests that Cluster 3 areas may be subject to a yield limiting factor not reflected by the EM38 signal. Cluster 1 occurs mainly in the lower lying areas, especially in the western part of the block close to the dam, where the groundwater table may be expected to be closest to the soil surface.
salinity in this vineyard is reducing yield by 5-27%
Further analysis of the data underlying Figures 3 and 4 suggests that salinity in this vineyard is reducing yield by 5-27%. Accordingly, it was suggested to the vineyard manager that a re-design of the irrigation system and re-location of the surface-water dams to higher parts of the landscape may deliver substantial
benefits in terms of the productivity and long term sustainability of this vineyard.
In addition to providing quantitative evidence that soil salinity has a detrimental impact on vineyard productivity, this case study demonstrates that the application of PV does not have to be confined to optimising production outcomes. These results strongly support the view that a PV approach to assessment of vineyard constraints offers a means of providing growers with knowledge of the precise location and extent of the constraints, and the basis for targeted ameliorative management.
Whole-of-vineyard experimentation in Langhorne Creek
When conducting experiments, researchers have traditionally used
random location of treatments in small plot trials to overcome the effects of spatial variation. However, as the two previous examples illustrate, spatial variation in paddocks tends not to be random. So is there a better way of designing agricultural trials? Might there be an advantage in doing the experiment over the whole management unit? At CSIRO/CRCV we have been addressing this question as a part of our Precision Viticulture research. The following example is based on work carried out at Langhorne Creek, SA by Dean Lanyon. It demonstrates the management related benefits gained by using whole-of-block rather than plot designs.
The manager of this Langhorne Creek vineyard was concerned that production was being limited by poor soil conditions. On ground sampling had identified that the soil volume explored by vine roots was constrained by the combined effects of wheel track compaction in the inter-row, and in an inhospitable sodic subsoil containing toxic concentrations of boron. Since the soils at this site vary in clay
Research - viticulture
Figure 4. Results of clustering salinity (EM��) and yield (vintage �001) data in a ��ha Clare Valley vineyard. For each cluster, the first value in the legend represents the mean bulk electrical soil conductivity (dS/m) in the cluster, whilst the second value is the mean cluster yield. For this analysis, the yield data were normalised to account for differences in yield potential between the six varieties grown in block. The range in elevation from the lowest to highest point in the block is approximately 1�m.
�� Precision Ag News
content and depth to the B horizon, the response to soil amelioration treatments was expected to be variable.
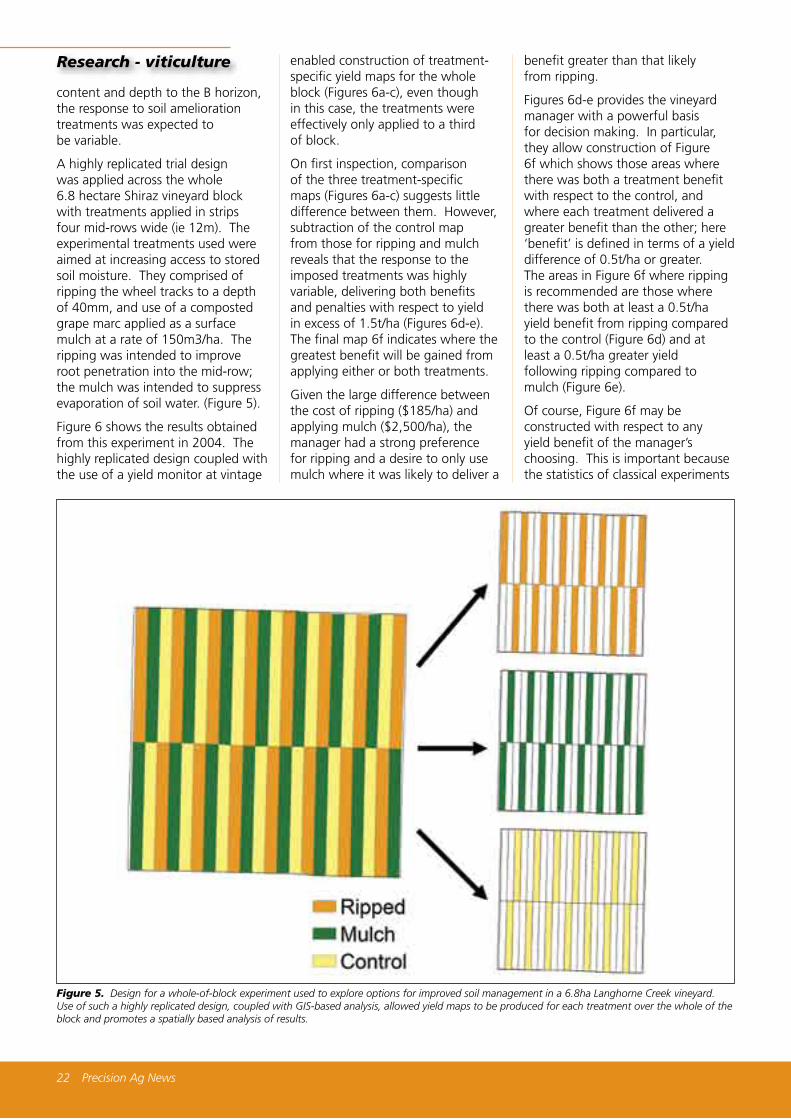
A highly replicated trial design was applied across the whole 6.8 hectare Shiraz vineyard block with treatments applied in strips four mid-rows wide (ie 12m). The experimental treatments used were aimed at increasing access to stored soil moisture. They comprised of ripping the wheel tracks to a depth of 40mm, and use of a composted grape marc applied as a surface mulch at a rate of 150m3/ha. The ripping was intended to improve root penetration into the mid-row; the mulch was intended to suppress evaporation of soil water. (Figure 5).
Figure 6 shows the results obtained from this experiment in 2004. The highly replicated design coupled with the use of a yield monitor at vintage
enabled construction of treatment-specific yield maps for the whole block (Figures 6a-c), even though in this case, the treatments were effectively only applied to a third of block.
On first inspection, comparison of the three treatment-specific maps (Figures 6a-c) suggests little difference between them. However, subtraction of the control map from those for ripping and mulch reveals that the response to the imposed treatments was highly variable, delivering both benefits and penalties with respect to yield in excess of 1.5t/ha (Figures 6d-e). The final map 6f indicates where the greatest benefit will be gained from applying either or both treatments.
Given the large difference between the cost of ripping ($185/ha) and applying mulch ($2,500/ha), the manager had a strong preference for ripping and a desire to only use mulch where it was likely to deliver a
benefit greater than that likely from ripping.
Figures 6d-e provides the vineyard manager with a powerful basis for decision making. In particular, they allow construction of Figure 6f which shows those areas where there was both a treatment benefit with respect to the control, and where each treatment delivered a greater benefit than the other; here ‘benefit’ is defined in terms of a yield difference of 0.5t/ha or greater. The areas in Figure 6f where ripping is recommended are those where there was both at least a 0.5t/ha yield benefit from ripping compared to the control (Figure 6d) and at least a 0.5t/ha greater yield following ripping compared to mulch (Figure 6e).
Of course, Figure 6f may be constructed with respect to any yield benefit of the manager’s choosing. This is important because the statistics of classical experiments
Research - viticulture
Figure 5. Design for a whole-of-block experiment used to explore options for improved soil management in a �.�ha Langhorne Creek vineyard. Use of such a highly replicated design, coupled with GIS-based analysis, allowed yield maps to be produced for each treatment over the whole of the block and promotes a spatially based analysis of results.

Precision Ag News ��
determine whether or not a treatment delivers a benefit on the basis of the statistical significance of the difference between the treatment and the control. Whilst this is mathematically robust, I have yet to meet a vineyard manager (or any other kind of farmer) who makes their decisions on the basis of statistical significance. More typically, the decision as to whether a new practice should be adopted is made on the basis of considerations such as the magnitude of the response (eg t/ha), the benefit:cost trade-off, or whether the benefit is large enough to justify the additional effort required in doing something new, among a whole raft of other possible considerations.
Another benefit of note in this approach is that through the use of an indicator variable, in this case clay content, the results can be more robustly translated to similar areas
than is possible in the case of more traditional experimental approaches.
However, arguably the most important thing to emerge from this research is the fact that the vineyard manager had no problem either with the idea of giving the whole block over to experimentation or with the pragmatics of implementing the treatments. The managers of several other blocks in which whole-of-block designs have been used for experimentation have been similarly comfortable with the idea. In other words, even in the absence of variable rate application, these managers have not seen the complex nature of the experimental design as an impediment to its implementation. Further work being done by Kerstin Panten seeks to explore improved designs for such experiments. Kerstin will be reporting on this work in a future issue of Precision Agriculture news
Acknowledgments
This work was funded by CSIRO, Vasse Felix Wines, Southcorp Wines (now Foster’s Wines) and Australia’s grapegrowers and winemakers, through their investment body, the Grape and Wine Research and Development Corporation. The invaluable input of colleagues at CSIRO, Vasse Felix and Foster’s is gratefully acknowledged.
Note: This article is based on a paper presented at the 11th Romeo Bragato Conference, held in Gisborne, New Zealand, ��-�� August, �00�.
For more information Dr Rob Bramley (08) 8303 8594, [email protected] or visit www.csiro.au/csiro/content/standard/ps1xy,,.html
Research - viticulture
Figure 6. Variable yield response of �.�ha of Shiraz to two soil amelioration treatments.

We’re as precise as this!
1800 062 221www.omnistar.com.au
10cmAccuracy
OMNI239126-FP-Precise.indd 3 3/11/06 4:10:46 PM