Precision ag back to basics
59
Ben Rosser and Ian McDonald OMAFRA Field Crop Unit University of Guelph Guelph, On.
-
Upload
easternontariocropconference -
Category
Food
-
view
46 -
download
0
Transcript of Precision ag back to basics
Ben Rosser and Ian McDonald OMAFRA Field Crop Unit
University of Guelph Guelph, On.
1. Why are you here? A. I am heavy into PAg and ready to take
the next step. B. I am interested in PAg and ready to go! C. I am interested in PAg but still “sitting
on the fence”! D. Just getting a first look at what it is. E. Bored and no where else to go!
Basics of Precision Ag
Precision Ag Defined! The definition is elusive! PAg can be anything in ag that uses
technology and data, ie milking robots, precision feeding via data feedback, etc
Traditional Cropping
Farming by the average! Every acre gets the same input levels
What is Precision Ag in a Cropping Context? Precision agriculture is the ability to manage
by the square meter instead of the square mi/km using gps positioning and guidance
In some ways its going back to Granpa’s day when he knew every nuance of his 100 acres.
Today, PAg uses data and technology to supply that knowledge on much larger landscapes and at high resolutions
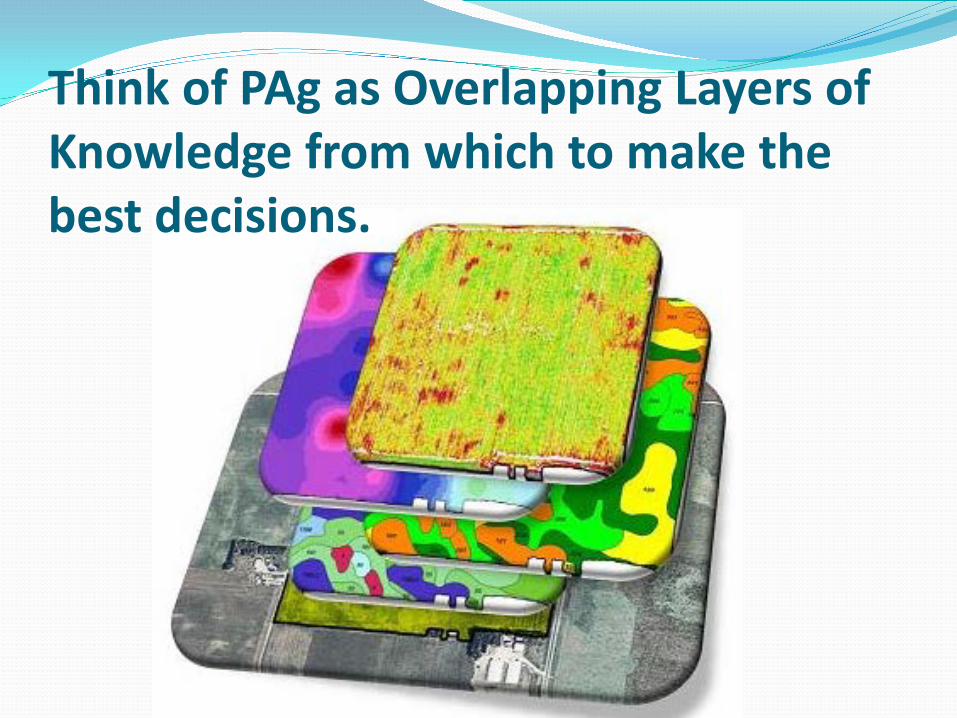
Think of PAg as Overlapping Layers of Knowledge from which to make the best decisions.
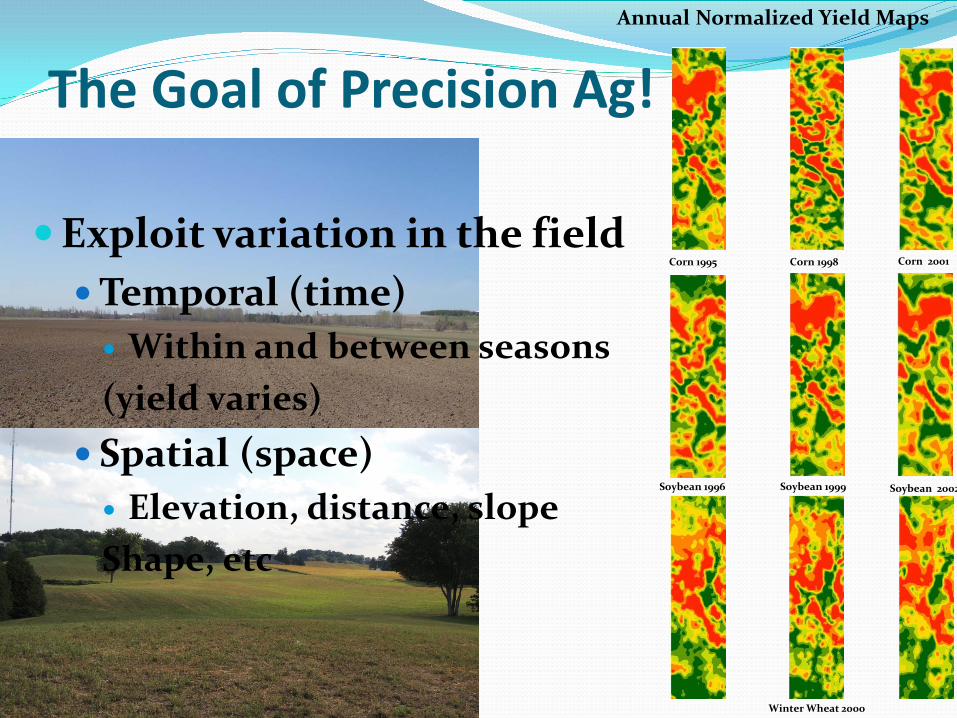
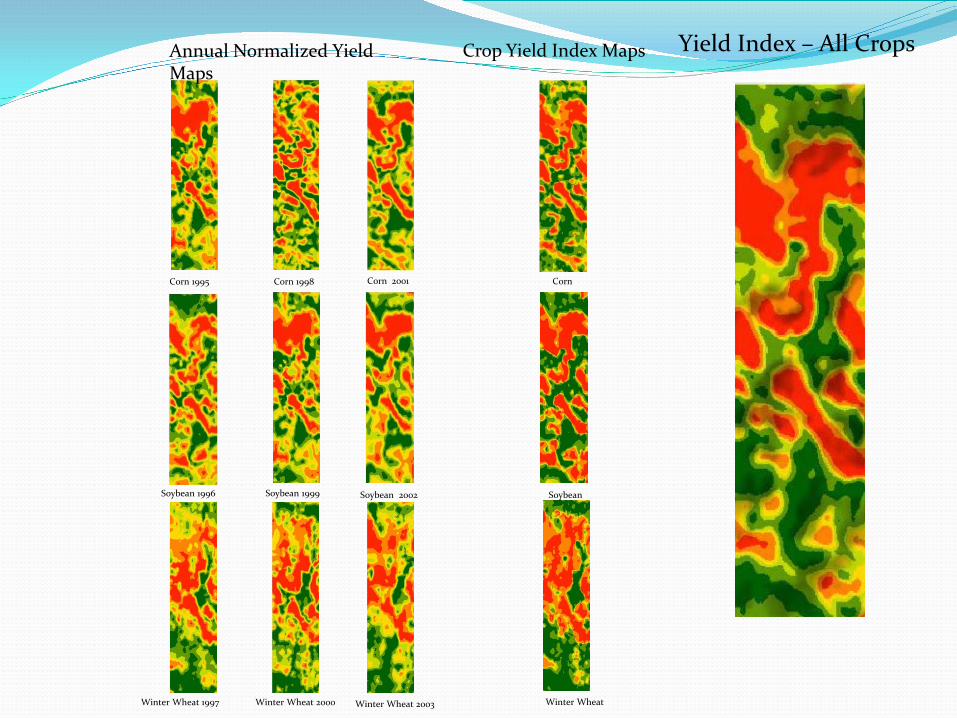
Corn 1995 Corn 1998 Corn 2001
Soybean 1996
Winter Wheat 2000
Soybean 1999 Soybean 2002
Annual Normalized Yield Maps
The Goal of Precision Ag! Exploit variation in the field Temporal (time) Within and between seasons (yield varies)
Spatial (space) Elevation, distance, slope Shape, etc
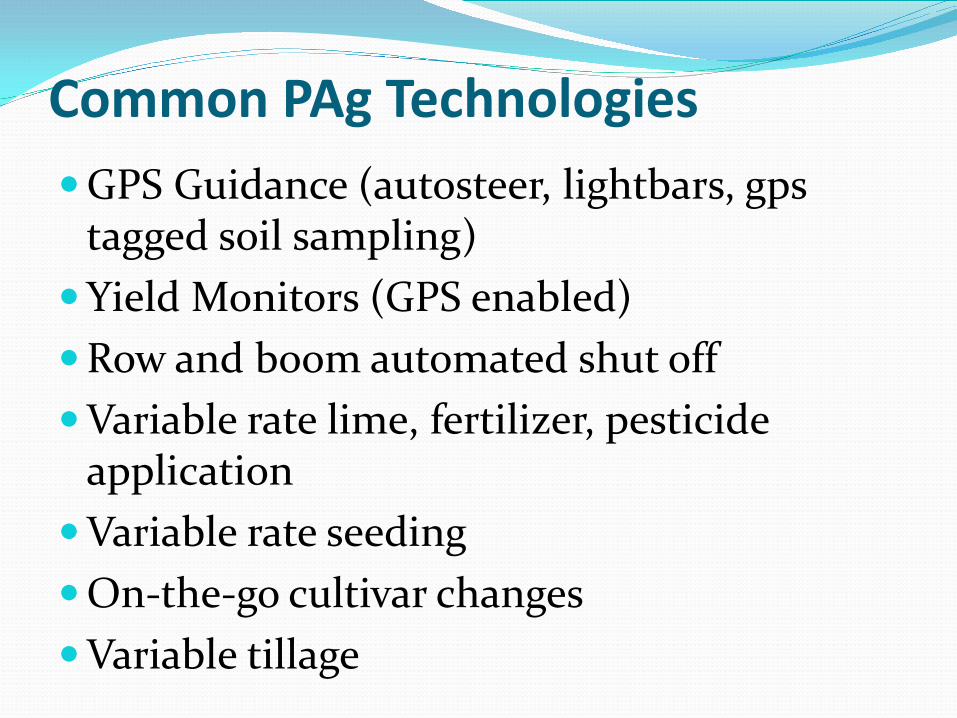
Common PAg Technologies GPS Guidance (autosteer, lightbars, gps
tagged soil sampling) Yield Monitors (GPS enabled) Row and boom automated shut off Variable rate lime, fertilizer, pesticide
application Variable rate seeding On-the-go cultivar changes Variable tillage
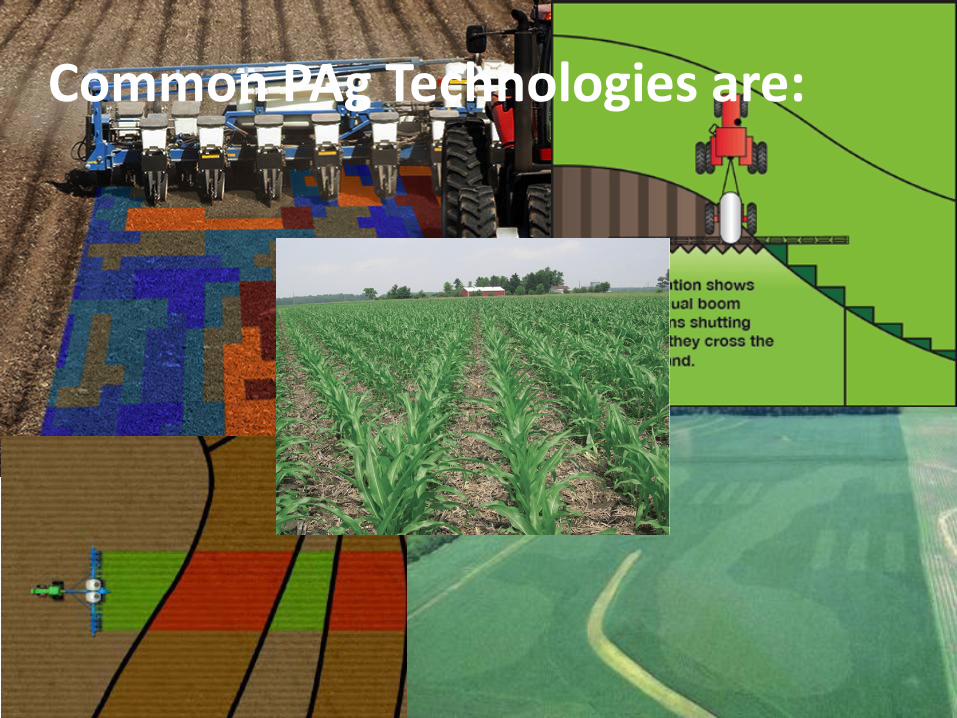
Common PAg Technologies are:
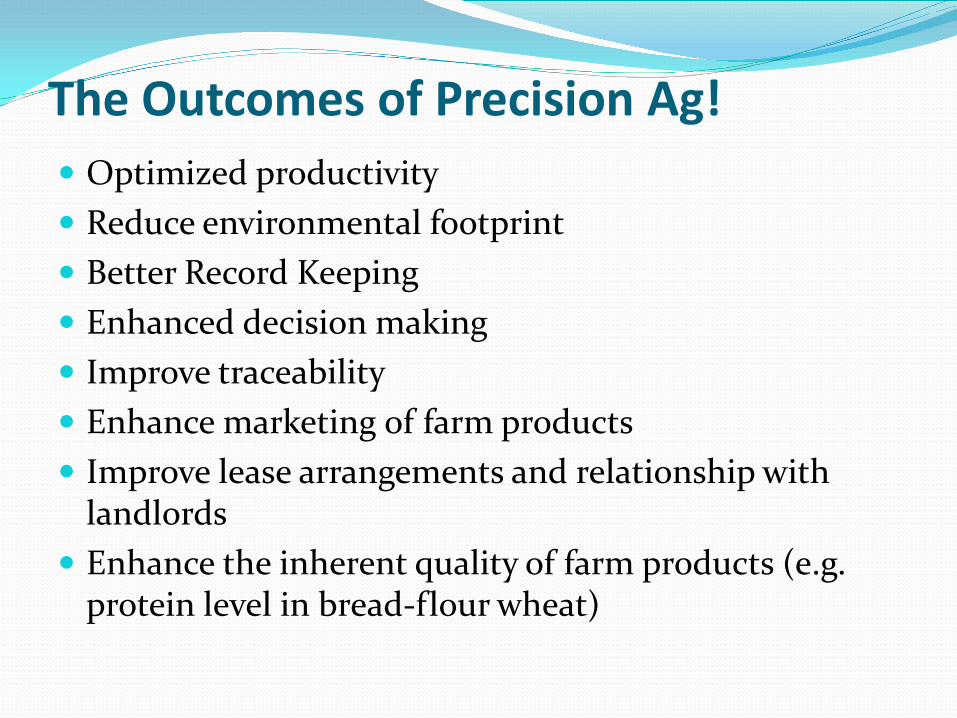
The Outcomes of Precision Ag! Optimized productivity Reduce environmental footprint Better Record Keeping Enhanced decision making Improve traceability Enhance marketing of farm products Improve lease arrangements and relationship with
landlords Enhance the inherent quality of farm products (e.g.
protein level in bread-flour wheat)
2. How are you making decisions today? A. Yield goal B. Know my fields inside out C. Advisors advice D. Data layer available E. Don’t think about it, just do it!
3. Why do you want to implement Precision Ag? A. Save money B. Better record keeping C. Optimize production D. Reduce environmental footprint E. All of the above, or at least 3 of them
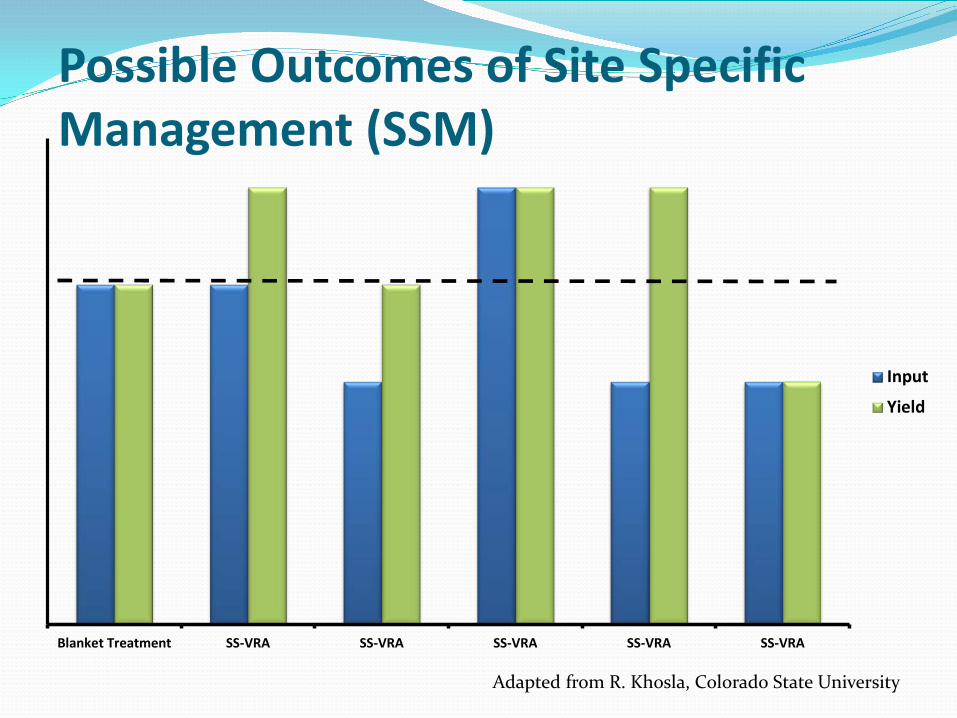
Blanket Treatment SS-VRA SS-VRA SS-VRA SS-VRA SS-VRA
Input
Yield
Possible Outcomes of Site Specific Management (SSM)
Adapted from R. Khosla, Colorado State University
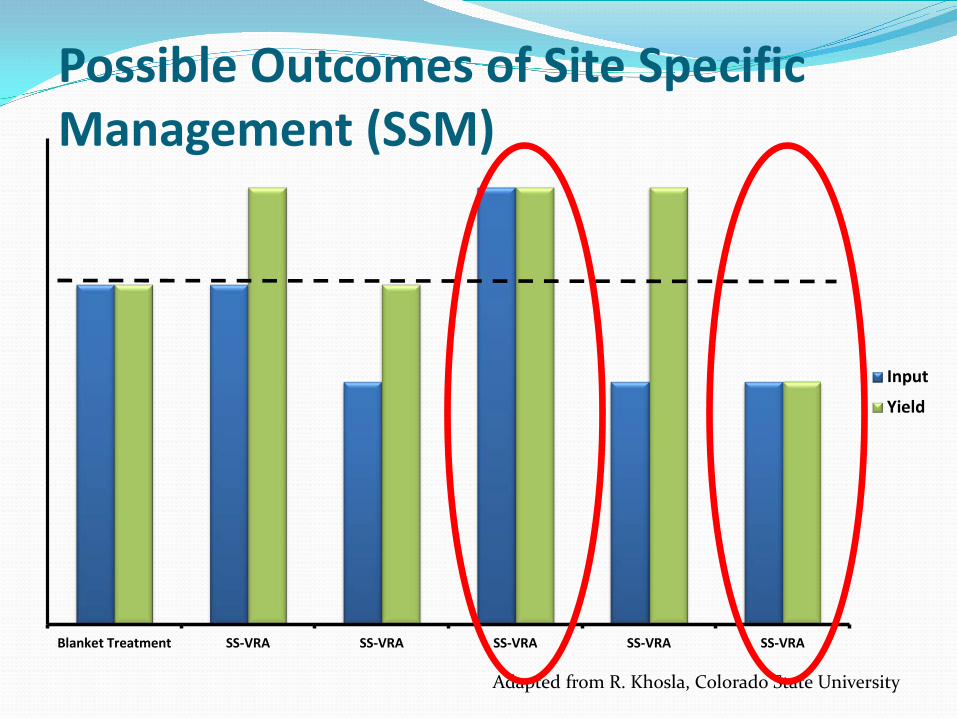
Blanket Treatment SS-VRA SS-VRA SS-VRA SS-VRA SS-VRA
Input
Yield
Possible Outcomes of Site Specific Management (SSM)
Adapted from R. Khosla, Colorado State University
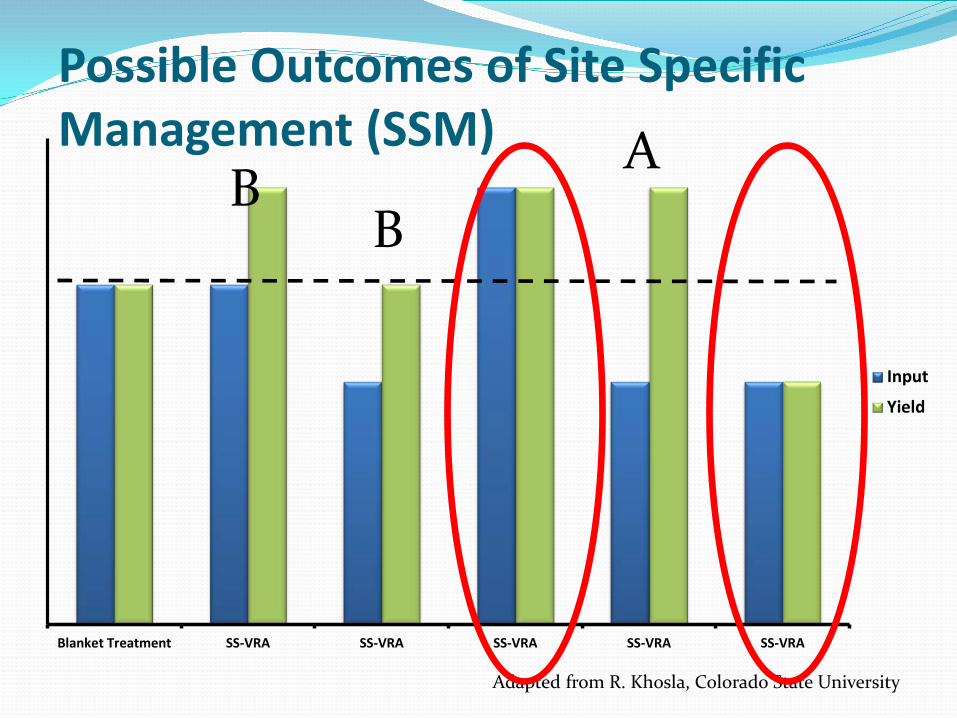
Blanket Treatment SS-VRA SS-VRA SS-VRA SS-VRA SS-VRA
Input
Yield
Possible Outcomes of Site Specific Management (SSM)
Adapted from R. Khosla, Colorado State University
A B
B
Getting Into Precision Ag
Precision Ag: Where Should You Start?
4. Precision Ag: What’s First? A. Drainage B. Compaction C. Good planter D. Crop Rotation E. All of the above and more
Precision Ag: What’s First? Get the basic whole field agronomic “stuff”
addressed before investing in PAg! PAg is the an additional “tool”, not the
“solution”!
5. What is your first target? A. Commercial fertilizer/lime mgmt B. Variable Seeding Rate C. On-the-go cultivar changes D. Variable rate manure application E. Still trying to decide
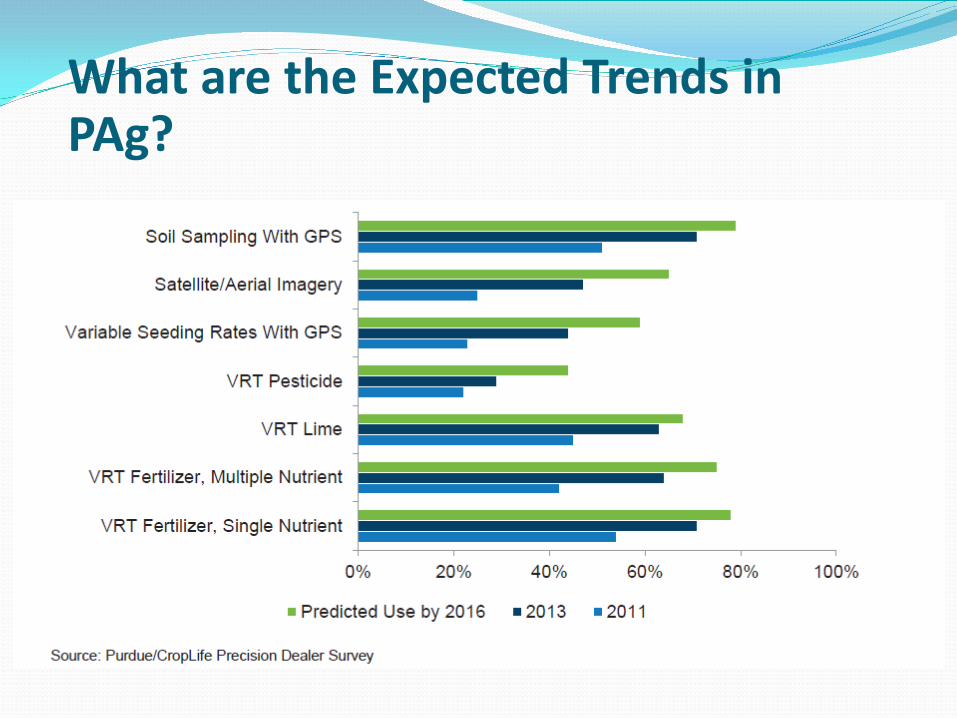
What are the Expected Trends in PAg?
http://agribusiness.purdue.edu/files/resources/2015-crop-life-purdue-precision-dealer-survey.pdf
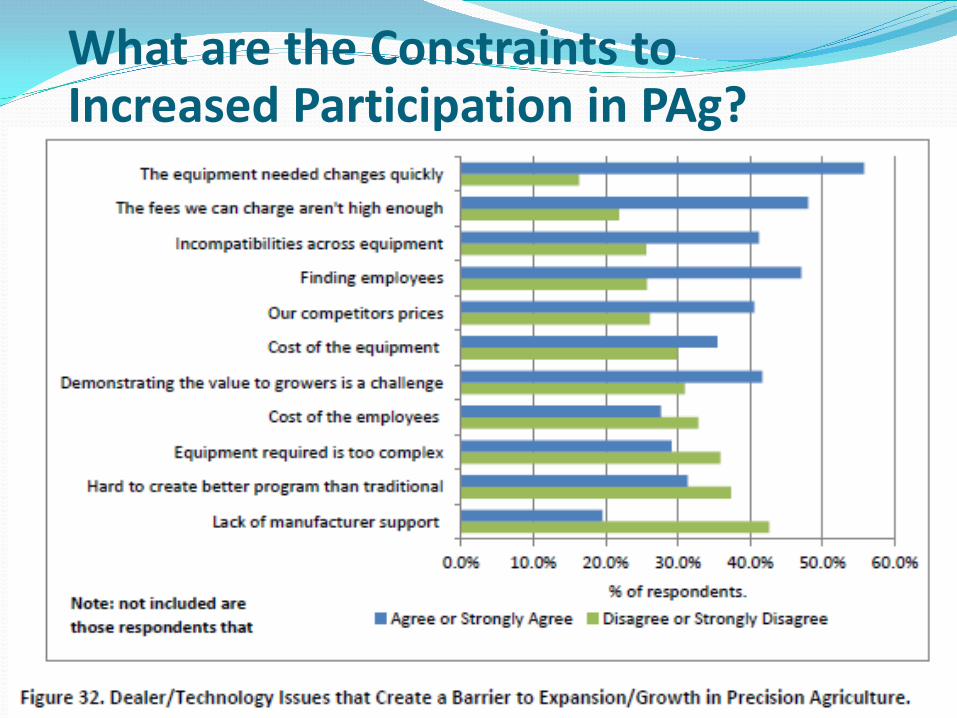
What are the Constraints to Increased Participation in PAg?
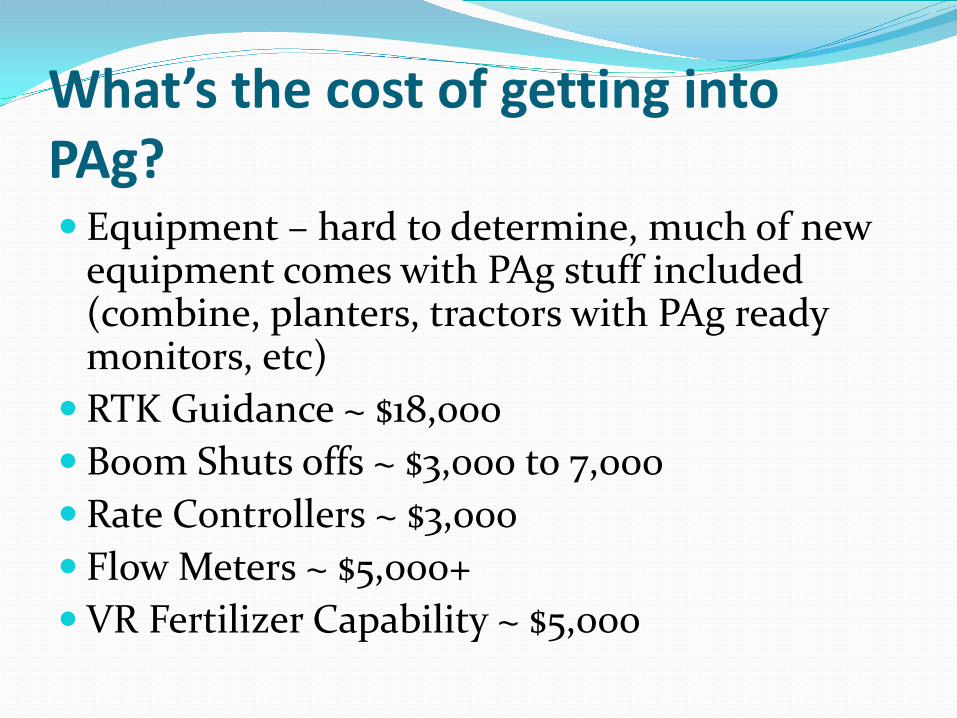
What’s the cost of getting into PAg? Equipment – hard to determine, much of new
equipment comes with PAg stuff included (combine, planters, tractors with PAg ready monitors, etc)
RTK Guidance ~ $18,000 Boom Shuts offs ~ $3,000 to 7,000 Rate Controllers ~ $3,000 Flow Meters ~ $5,000+ VR Fertilizer Capability ~ $5,000
6. Are you using guidance on your farm? A. RTK autosteer B. WAAS corrected autosteer C. Lightbar D. No guidance
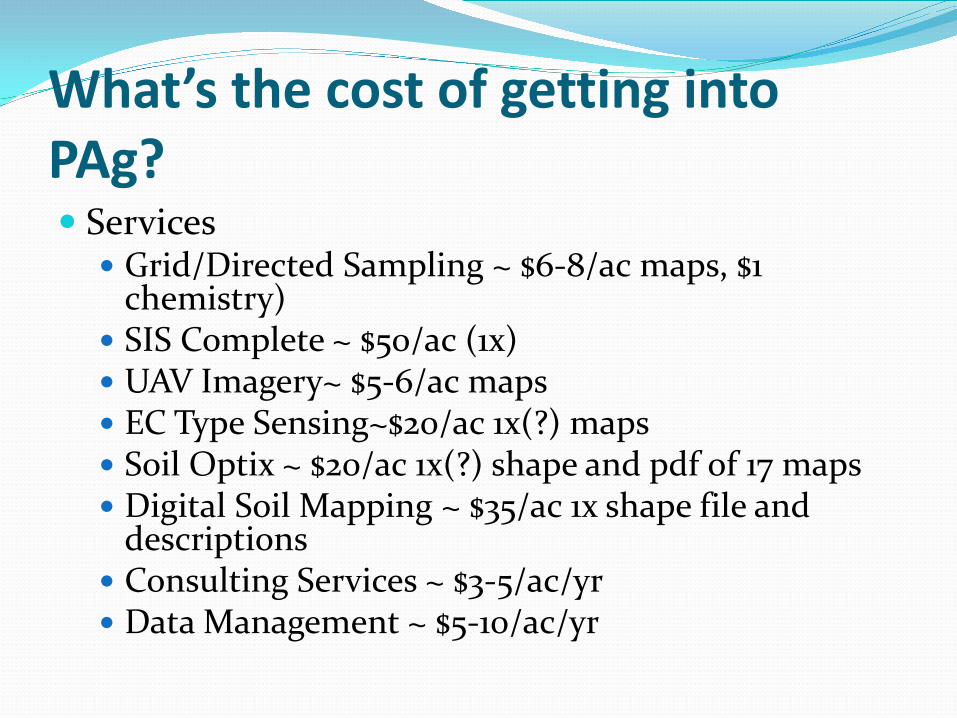
What’s the cost of getting into PAg? Services
Grid/Directed Sampling ~ $6-8/ac maps, $1 chemistry)
SIS Complete ~ $50/ac (1x) UAV Imagery~ $5-6/ac maps EC Type Sensing~$20/ac 1x(?) maps Soil Optix ~ $20/ac 1x(?) shape and pdf of 17 maps Digital Soil Mapping ~ $35/ac 1x shape file and
descriptions Consulting Services ~ $3-5/ac/yr Data Management ~ $5-10/ac/yr
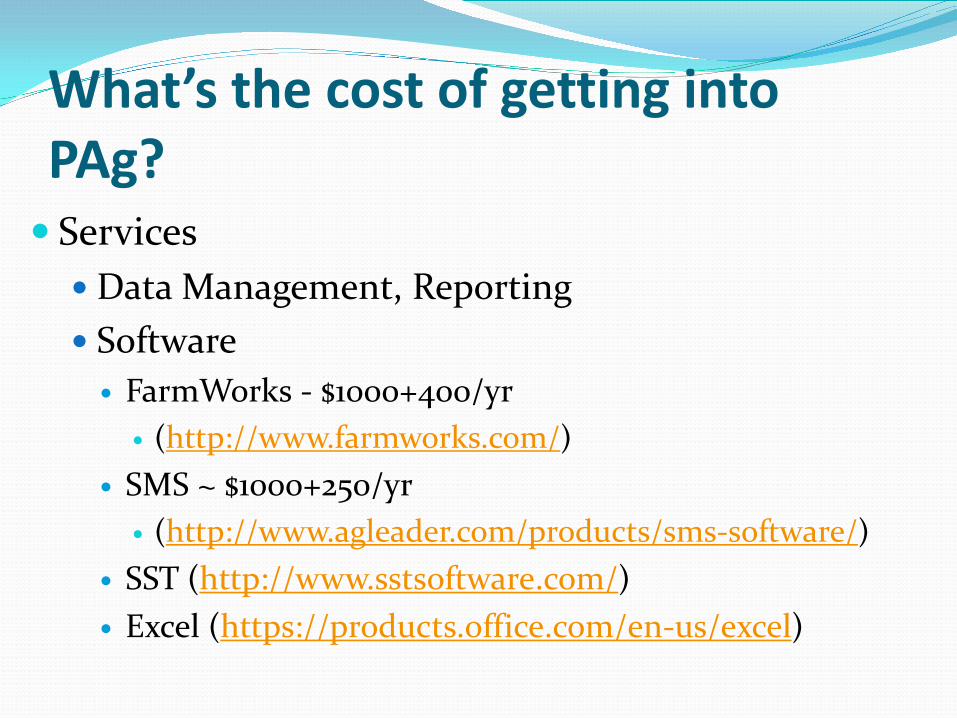
What’s the cost of getting into PAg? Services Data Management, Reporting Software FarmWorks - $1000+400/yr
(http://www.farmworks.com/) SMS ~ $1000+250/yr
(http://www.agleader.com/products/sms-software/) SST (http://www.sstsoftware.com/) Excel (https://products.office.com/en-us/excel)
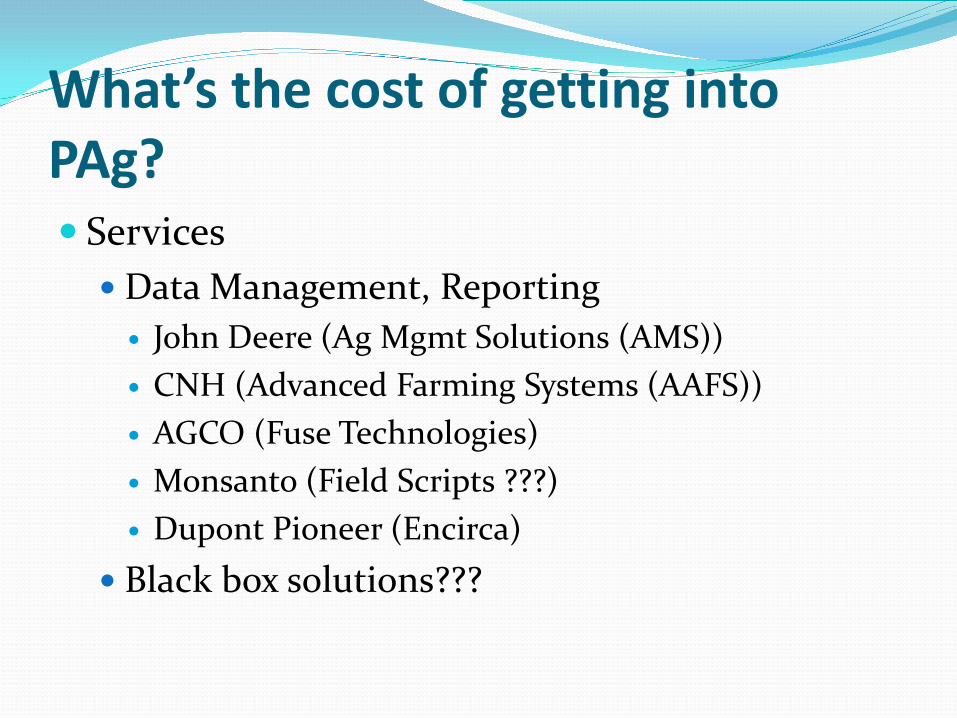
What’s the cost of getting into PAg? Services Data Management, Reporting John Deere (Ag Mgmt Solutions (AMS)) CNH (Advanced Farming Systems (AAFS)) AGCO (Fuse Technologies) Monsanto (Field Scripts ???) Dupont Pioneer (Encirca)
Black box solutions???
7. What PAg Services do you have Available? GPS Enabled Grid/Directed Sampling
A. In house B. Consultant or retailer C. Not Available
8. What PAg Services do you have Available? GPS Enabled Elevation Data Collection
A. Owned RTK Guidance B. Consultant or retailer C. Not Available
9. What PAg Services do you have Available? GPS Enabled Yield Monitor Equipped
Combine A. Owned Combine B. Custom Combine willingly gives data C. Custom Combine reluctantly gives data D. Not Available
10. What PAg Services do you have Available? Variable Rate Fertilizer Application
Equipment A. Owned Equipment B. Custom Equipment C. Not Available
11. What PAg Services do you have Available? Variable Seeding Rate Planting
Equipment A. Owned B. Custom Available C. Not Available
12. What PAg Services do you have Available? Multiple Cultivar Planting Equipment
A. Owned B. Custom Available C. Not Available
13. What PAg Services do you have Available? Data Mgmt, Map Creation, Prescription
Services A. In-House B. Retailer or Consultant C. Not Available
The Basic Steps of PAg and
Management Zones
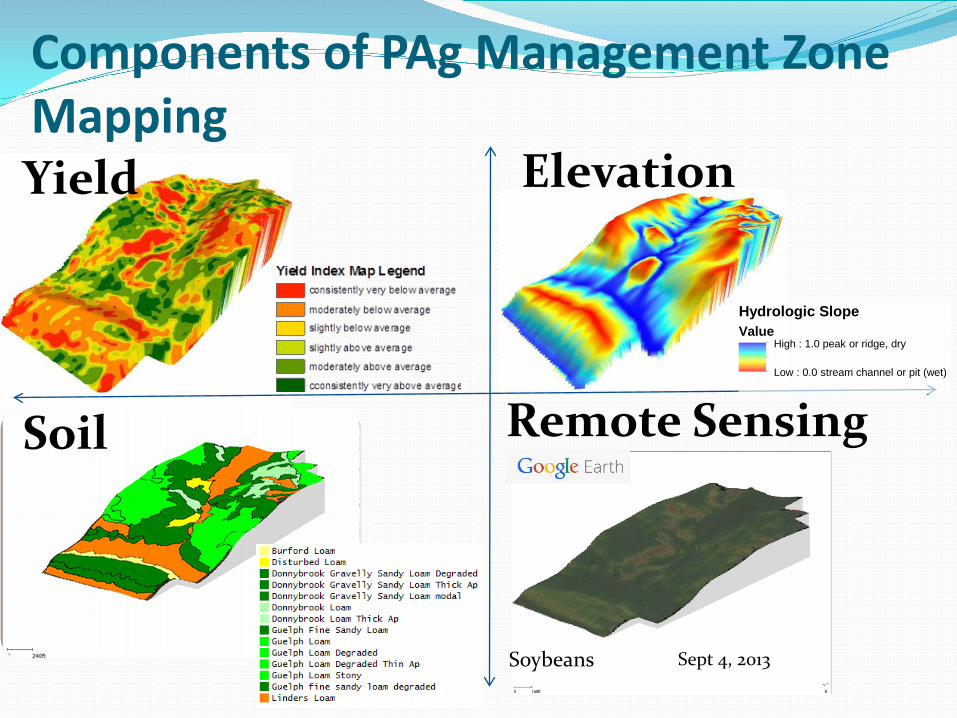
Components of PAg Management Zone Mapping
Hydrologic Slope Value
High : 1.0 peak or ridge, dry
Low : 0.0 stream channel or pit (wet)
Yield Elevation
Soil
Sept 4, 2013 Soybeans
Remote Sensing
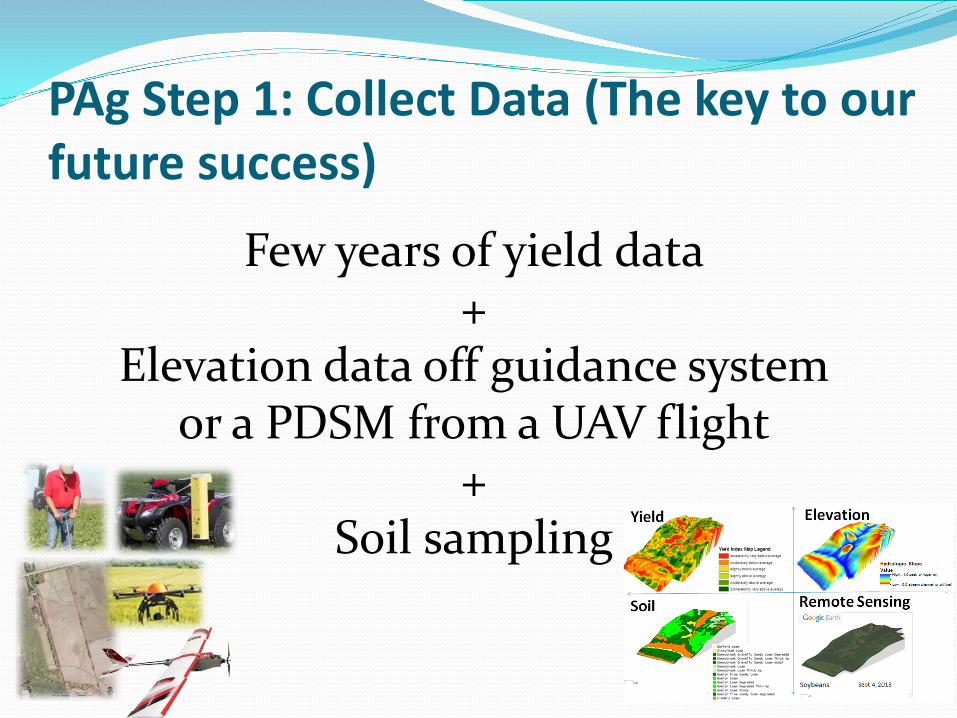
PAg Step 1: Collect Data (The key to our future success)
Few years of yield data +
Elevation data off guidance system or a PDSM from a UAV flight
+ Soil sampling

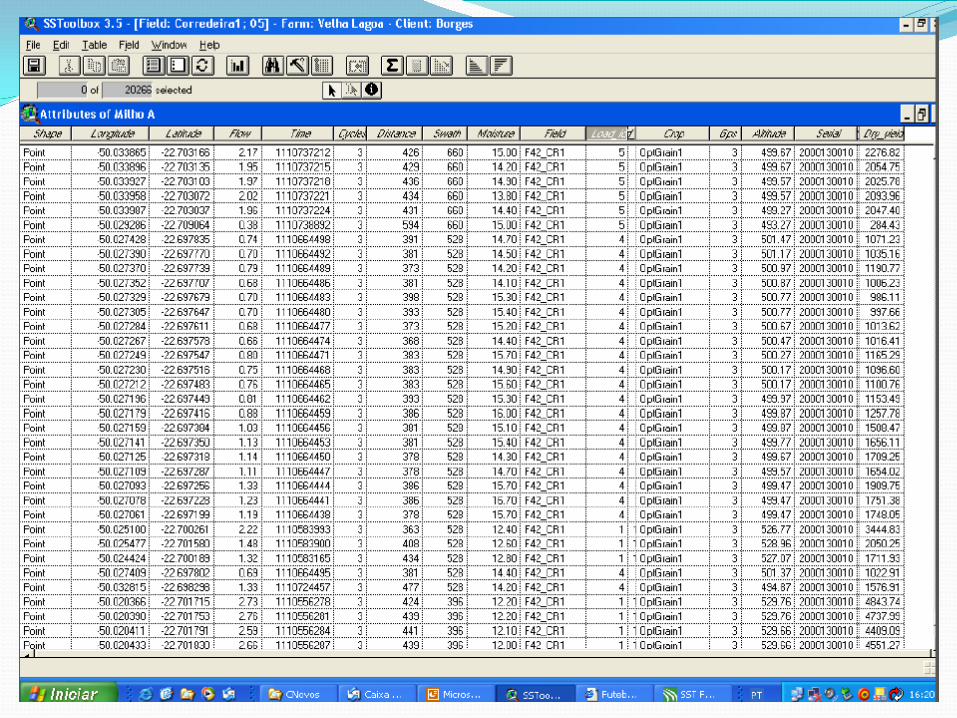
Yield
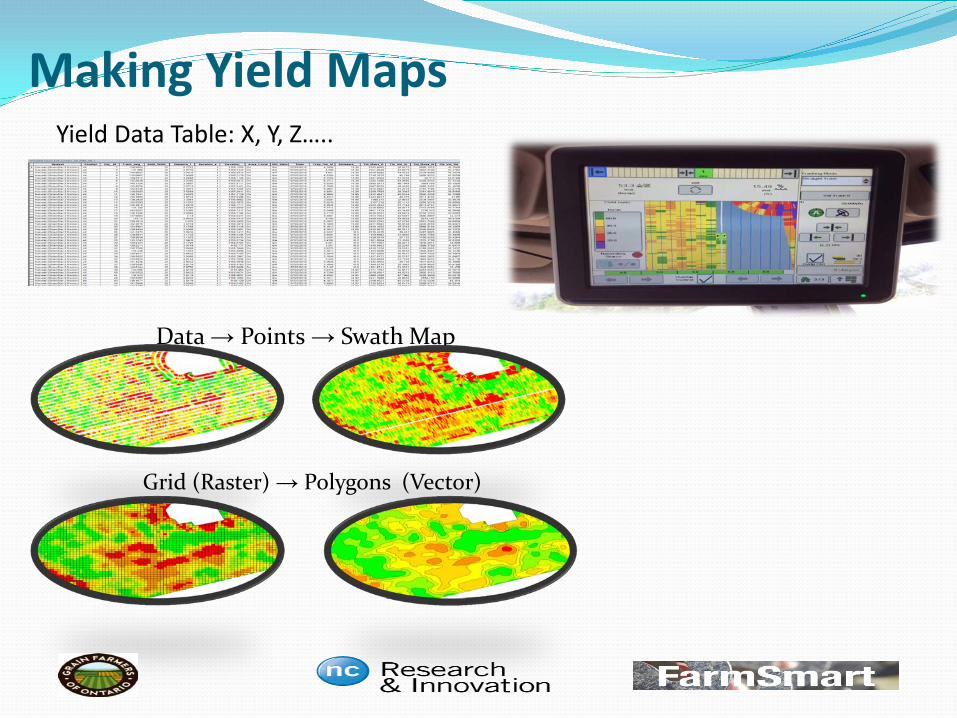
Making Yield Maps Yield Data Table: X, Y, Z…..
Data → Points → Swath Map
Grid (Raster) → Polygons (Vector)
Corn 1995 Corn 1998 Corn 2001
Soybean 1996
Winter Wheat 1997 Winter Wheat 2000 Winter Wheat 2003
Corn
Winter Wheat
Soybean Soybean 1999 Soybean 2002
Yield Index – All Crops Annual Normalized Yield Maps
Crop Yield Index Maps

Elevation
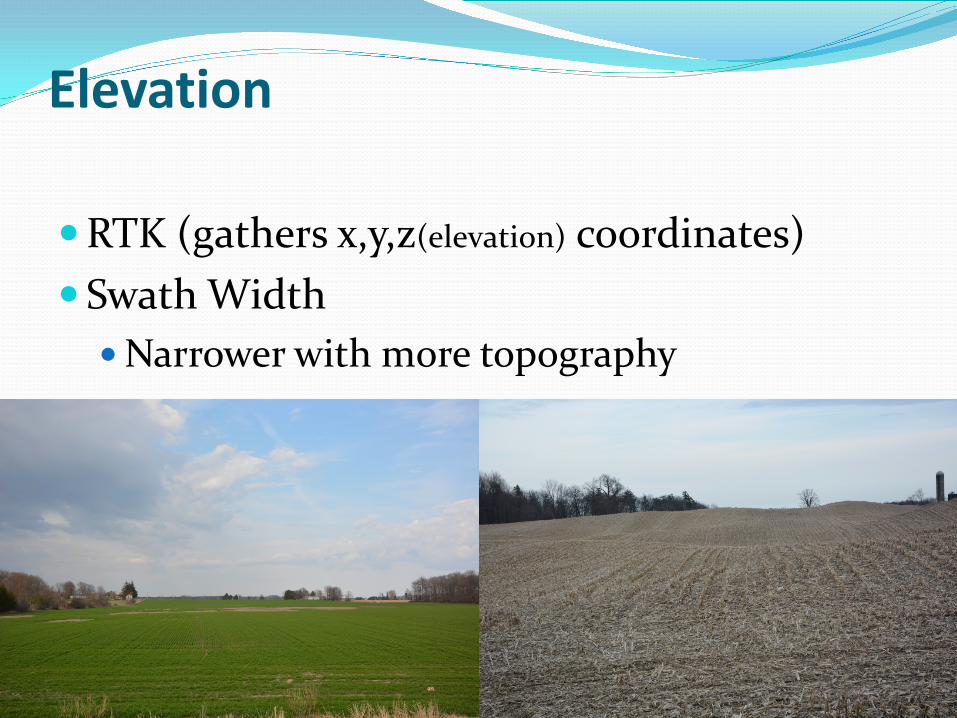
Elevation RTK (gathers x,y,z(elevation) coordinates) Swath Width Narrower with more topography
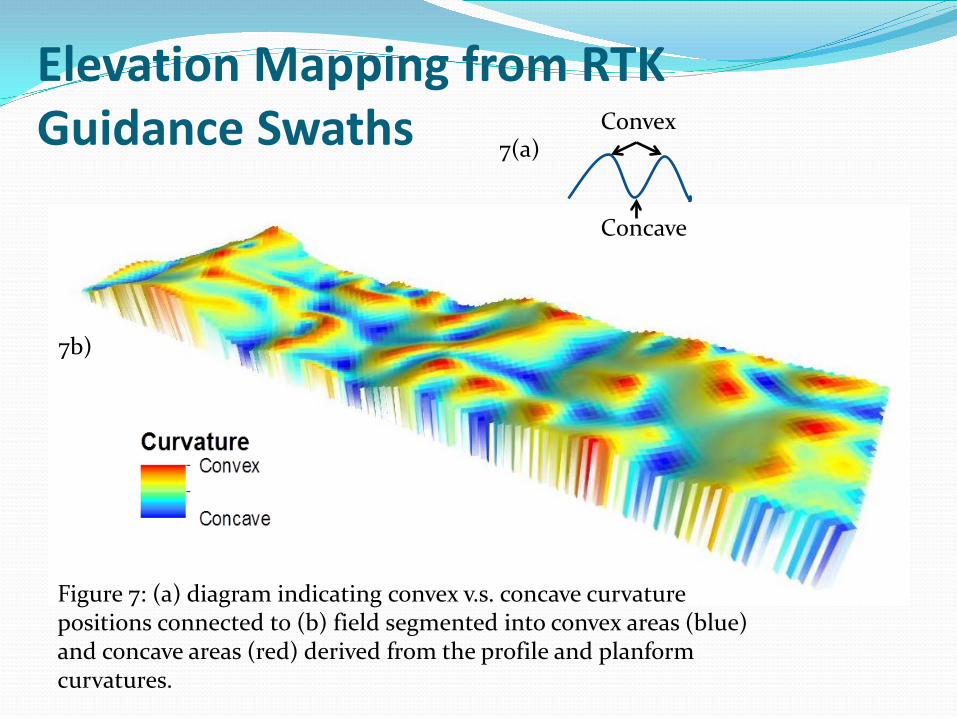
Figure 7: (a) diagram indicating convex v.s. concave curvature positions connected to (b) field segmented into convex areas (blue) and concave areas (red) derived from the profile and planform curvatures.
Convex
Concave
7(a)
7b)
Elevation Mapping from RTK Guidance Swaths
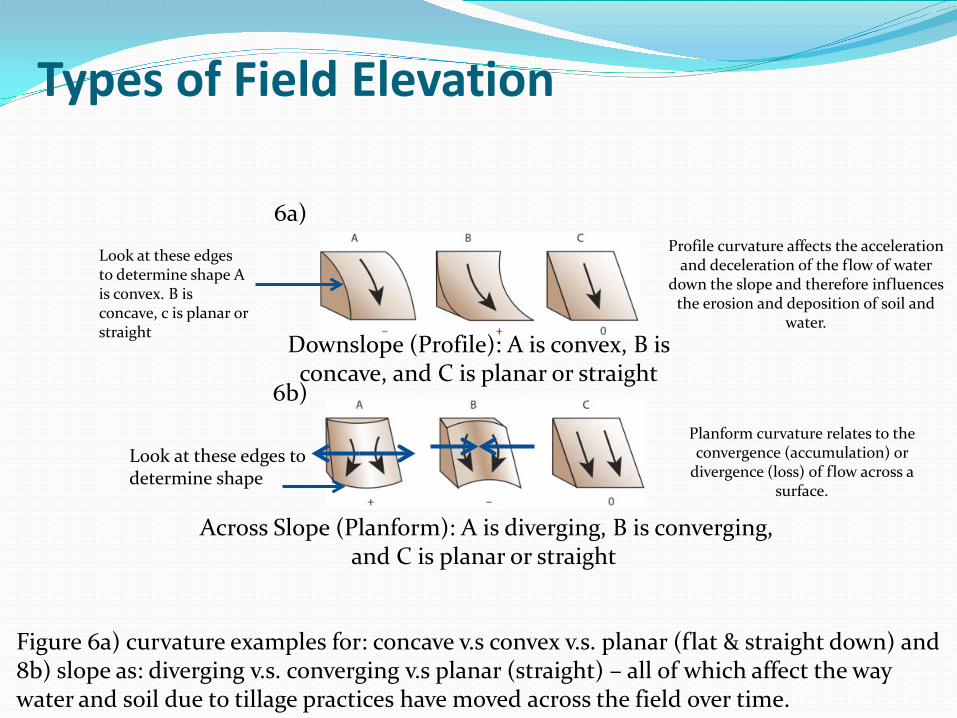
Profile curvature affects the acceleration and deceleration of the flow of water
down the slope and therefore influences the erosion and deposition of soil and
water.
Look at these edges to determine shape A is convex. B is concave, c is planar or straight
Across Slope (Planform): A is diverging, B is converging, and C is planar or straight
Figure 6a) curvature examples for: concave v.s convex v.s. planar (flat & straight down) and 8b) slope as: diverging v.s. converging v.s planar (straight) – all of which affect the way water and soil due to tillage practices have moved across the field over time.
Look at these edges to determine shape
Downslope (Profile): A is convex, B is concave, and C is planar or straight
Planform curvature relates to the convergence (accumulation) or
divergence (loss) of flow across a surface.
6a)
6b)
Types of Field Elevation
Soils Soil texture and properties (1x) Soil chemistry (~ 3yrs)
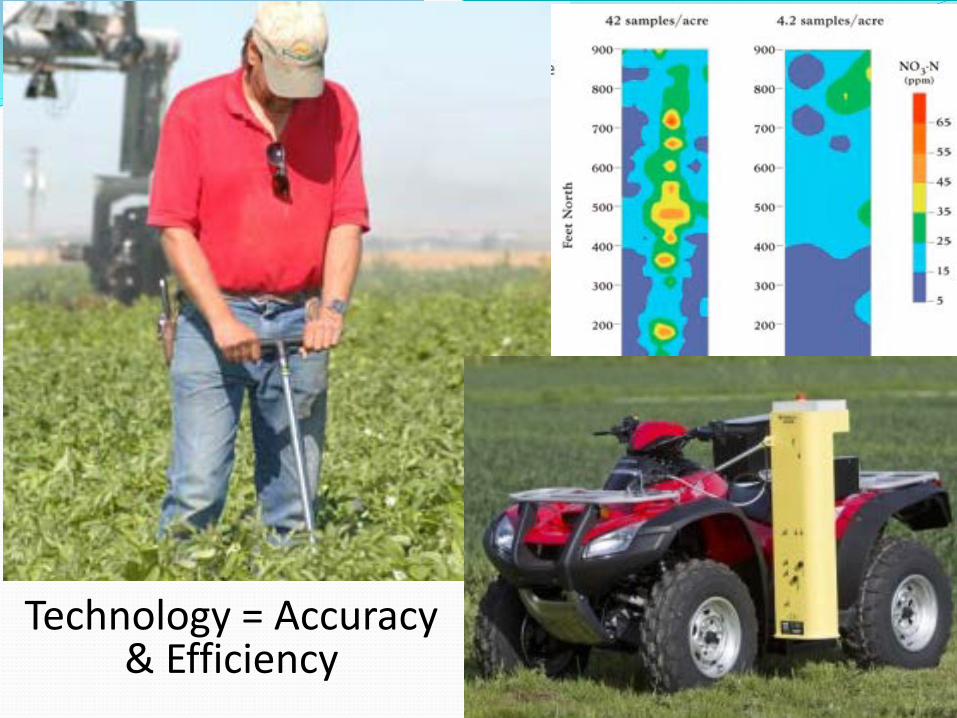
Technology = Accuracy & Efficiency

Topography, soil and where to sample?
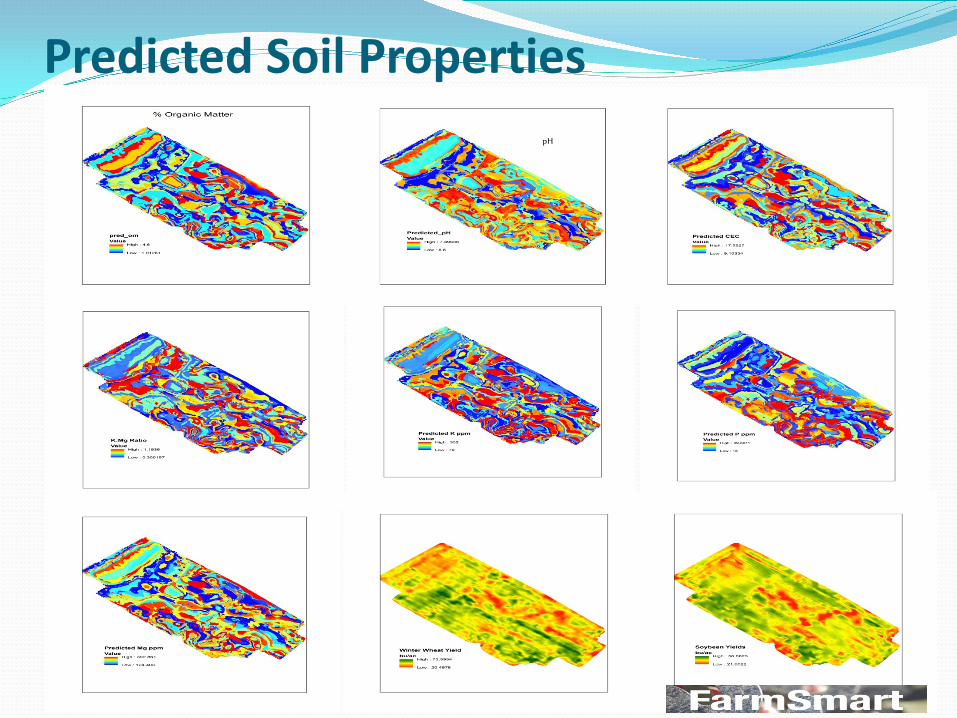
Predicted Soil Properties pH
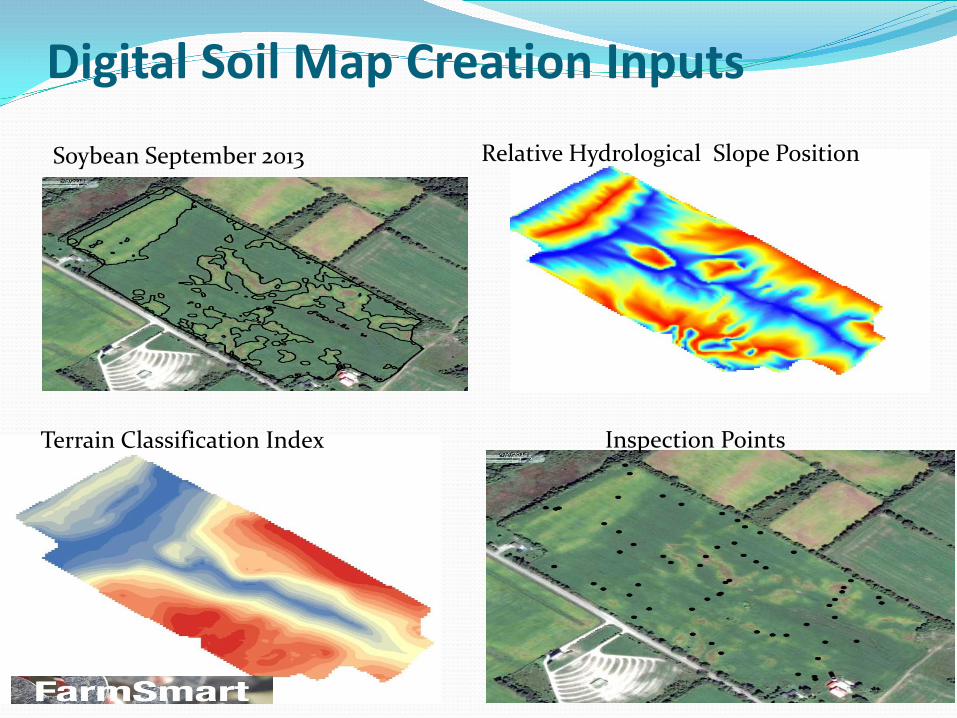
Digital Soil Map Creation Inputs
Soybean September 2013 Relative Hydrological Slope Position
Terrain Classification Index Inspection Points
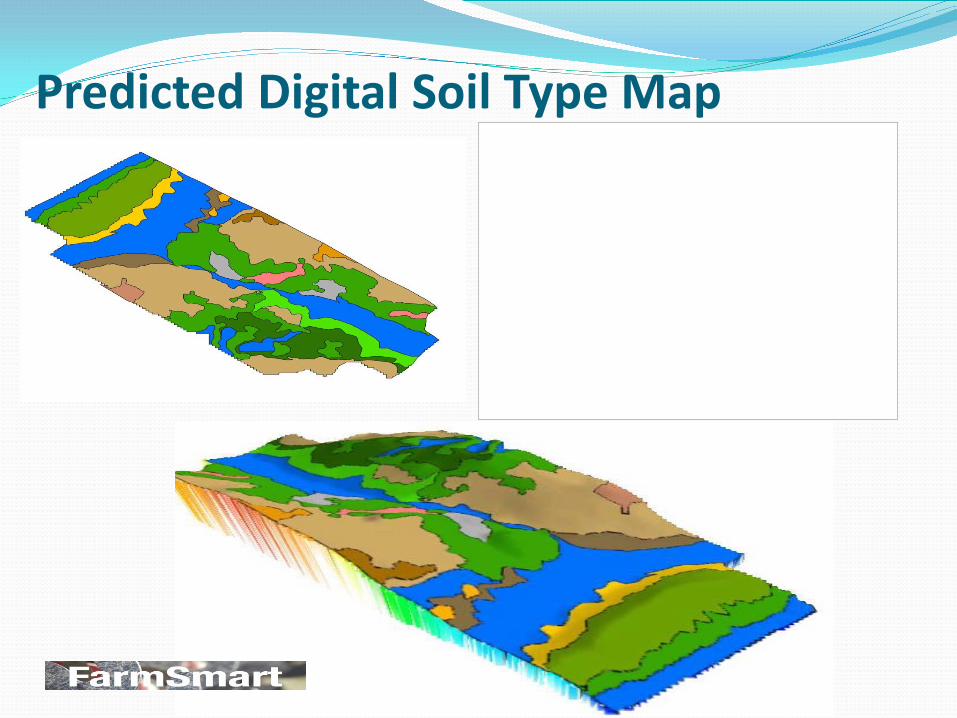
Predicted Digital Soil Type Map
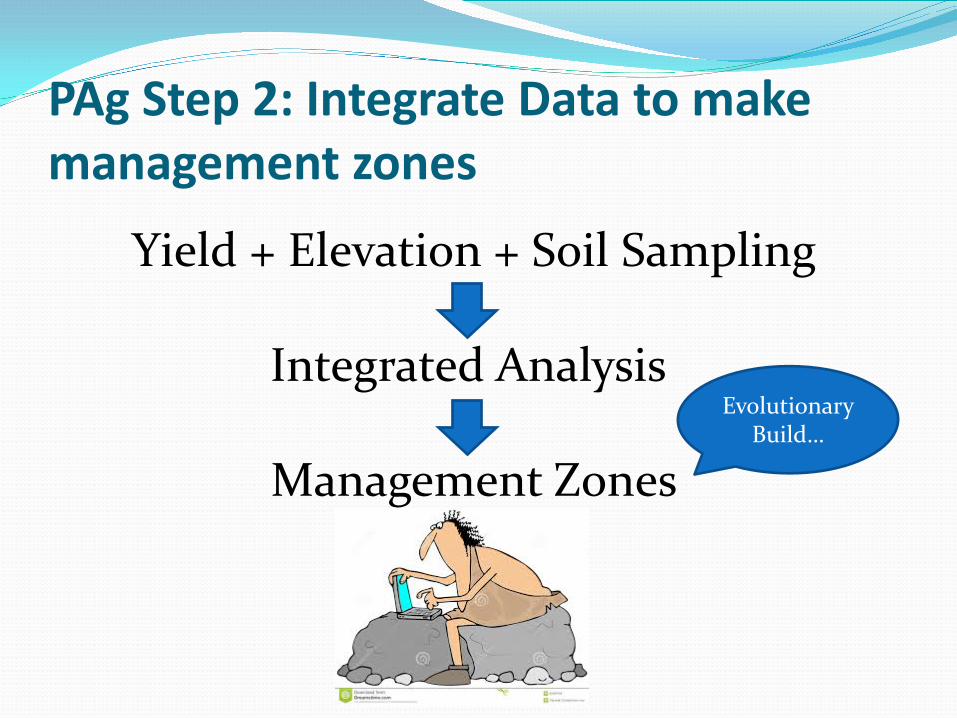
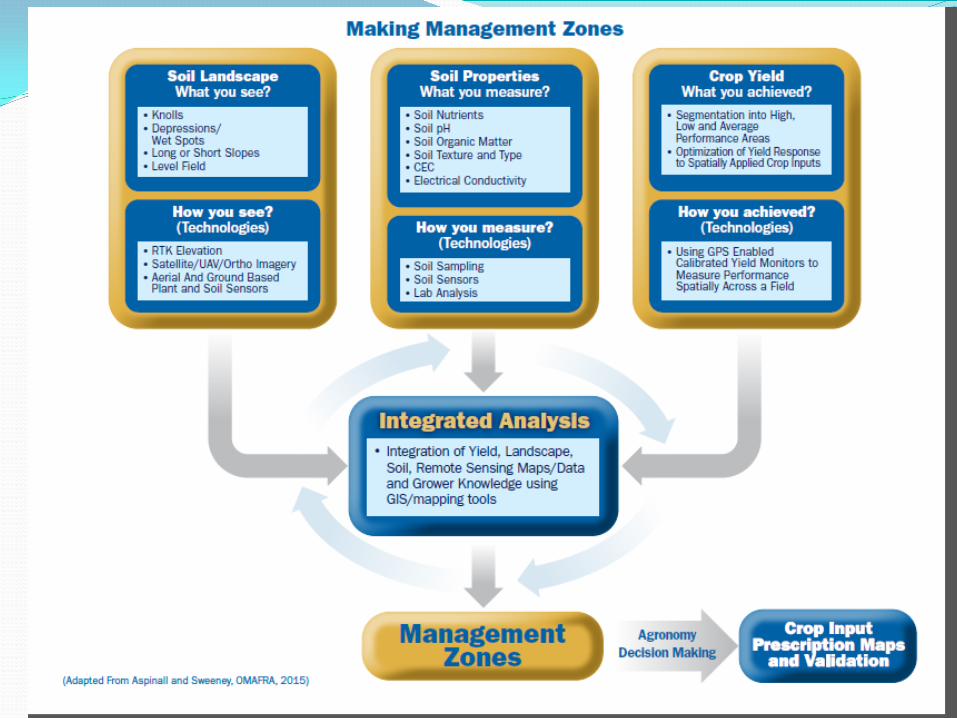
PAg Step 2: Integrate Data to make management zones
Yield + Elevation + Soil Sampling
Integrated Analysis
Management Zones
Evolutionary Build…
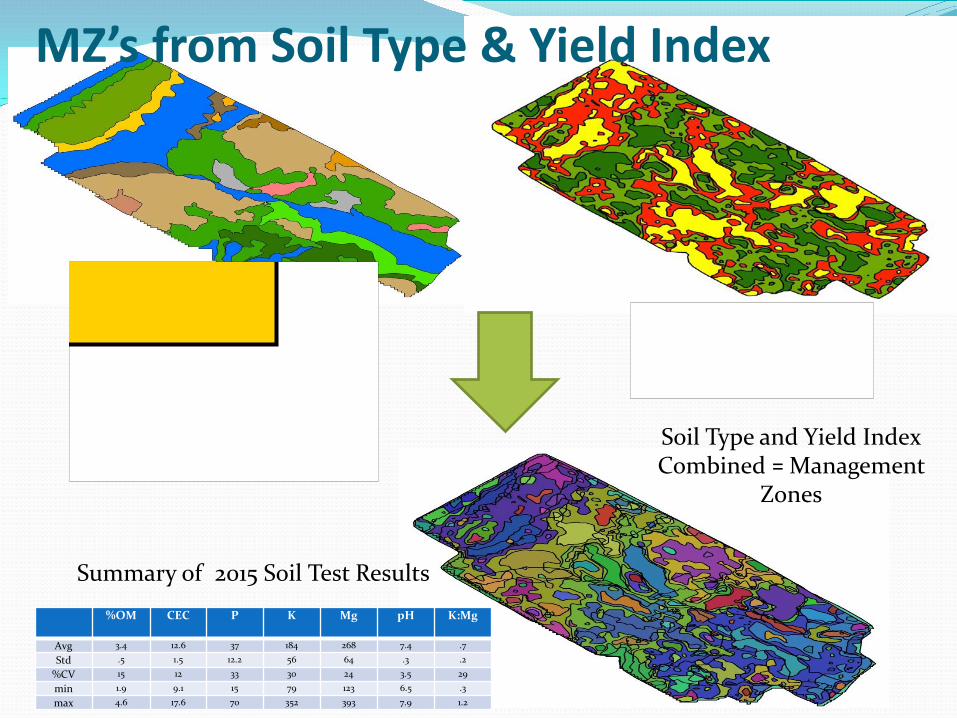
Soil Type and Yield Index Combined = Management
Zones
MZ’s from Soil Type & Yield Index
Summary of 2015 Soil Test Results
%OM CEC P K Mg pH K:Mg
Avg 3.4 12.6 37 184 268 7.4 .7
Std .5 1.5 12.2 56 64 .3 .2
%CV 15 12 33 30 24 3.5 29
min 1.9 9.1 15 79 123 6.5 .3
max 4.6 17.6 70 352 393 7.9 1.2
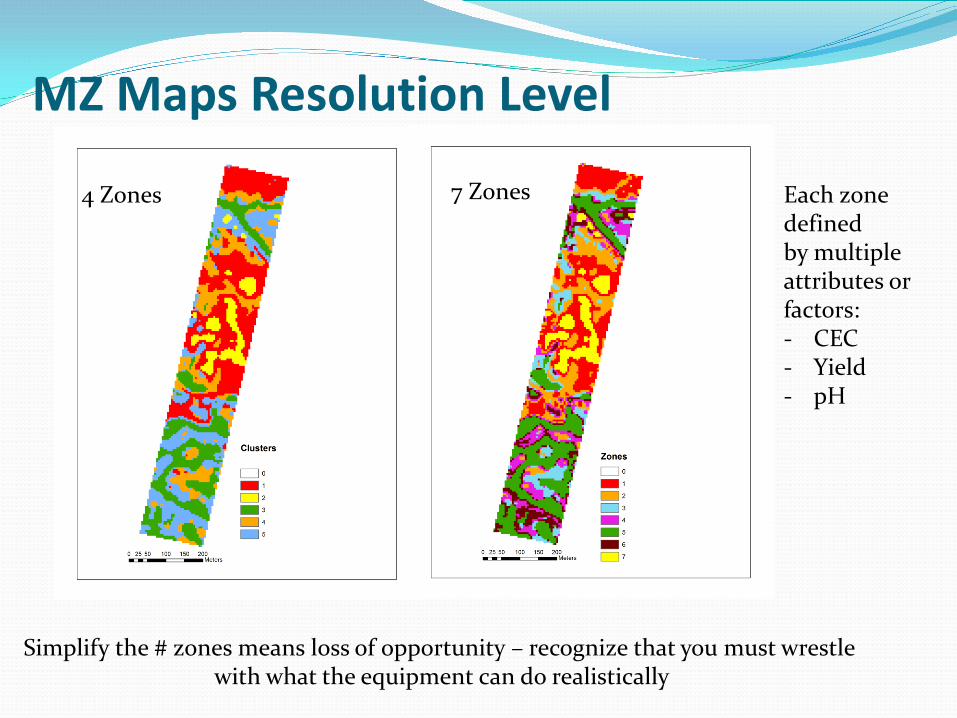
Simplify the # zones means loss of opportunity – recognize that you must wrestle with what the equipment can do realistically
Each zone defined by multiple attributes or factors: - CEC - Yield - pH
4 Zones 7 Zones
MZ Maps Resolution Level
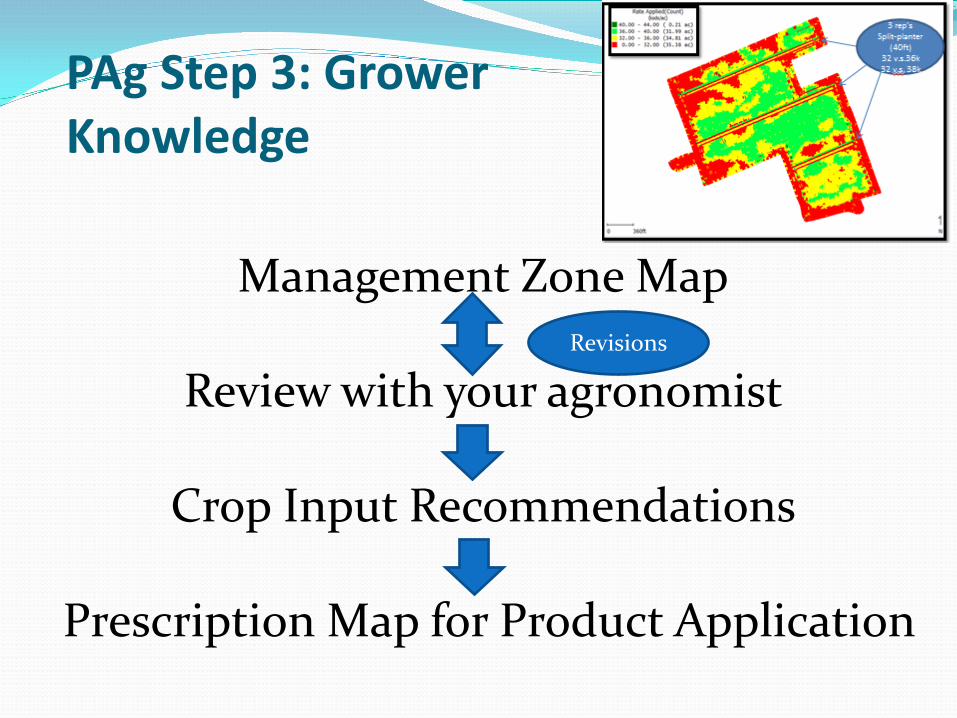
PAg Step 3: Grower Knowledge
Management Zone Map
Review with your agronomist
Crop Input Recommendations
Prescription Map for Product Application
Revisions
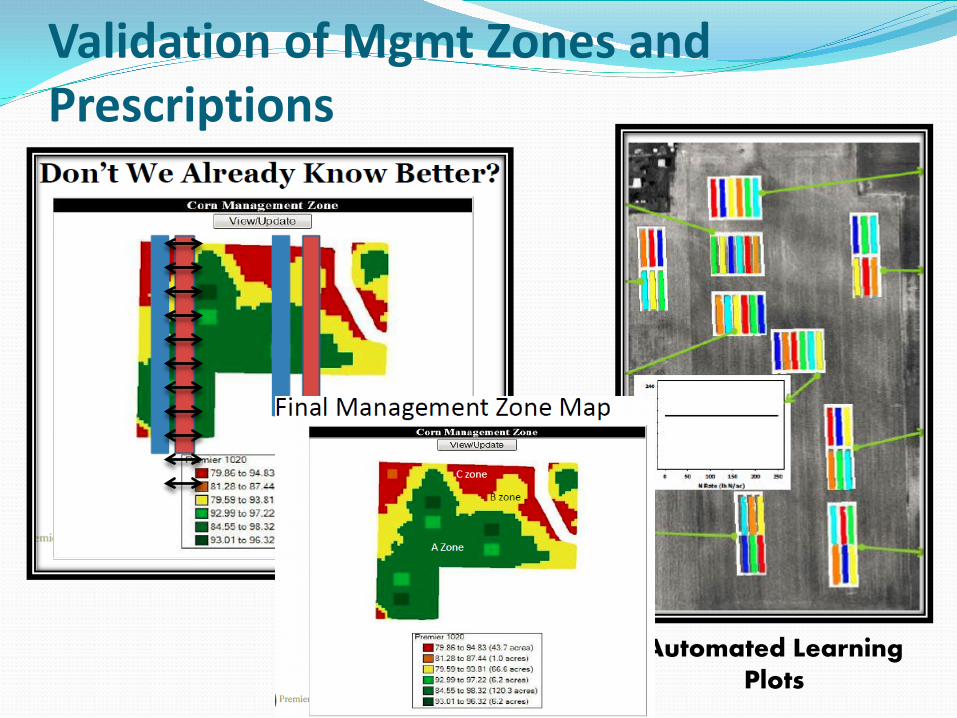
Automated Learning Plots
Validation of Mgmt Zones and Prescriptions
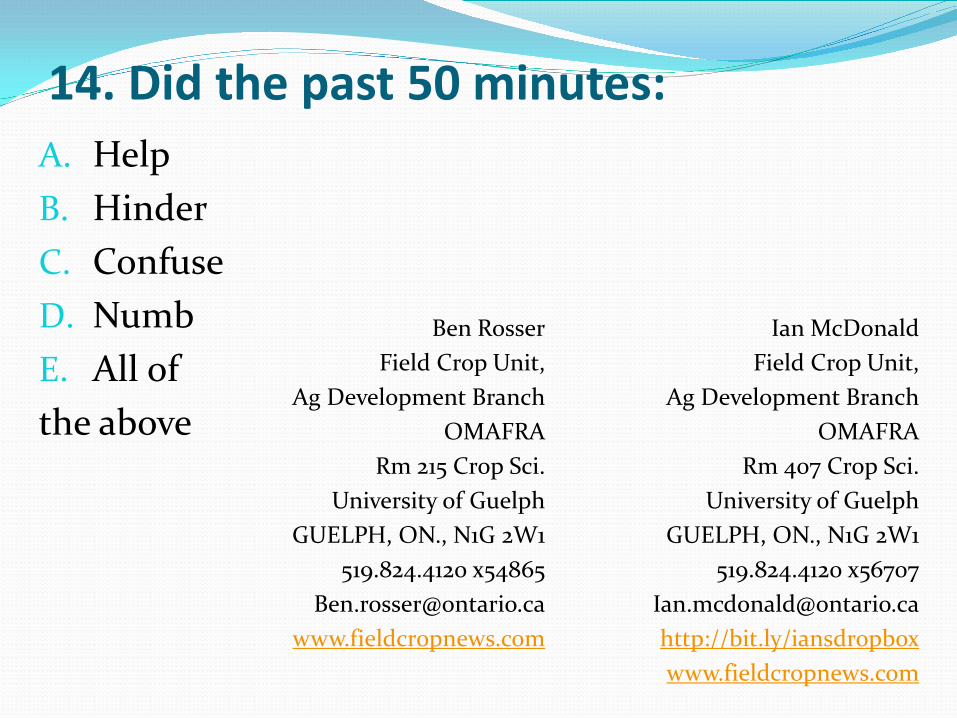
14. Did the past 50 minutes:
Ian McDonald Field Crop Unit,
Ag Development Branch OMAFRA
Rm 407 Crop Sci. University of Guelph
GUELPH, ON., N1G 2W1 519.824.4120 x56707
[email protected] http://bit.ly/iansdropbox www.fieldcropnews.com
Ben Rosser Field Crop Unit,
Ag Development Branch OMAFRA
Rm 215 Crop Sci. University of Guelph
GUELPH, ON., N1G 2W1 519.824.4120 x54865
[email protected] www.fieldcropnews.com
A. Help B. Hinder C. Confuse D. Numb E. All of the above