
Precipitation, Runoff and Water Loss in the Lower … · WATER RESOURCES OF LOWER COLORADO...
22
Precipitation, Runoff and Water Loss in the Lower Colorado River Salton Sea Area GEOLOGICAL SURVEY PROFESSIONAL PAPER 486-B Prepared in collaboration with the U.S. Weather Bureau
-
Upload
nguyendang -
Category
Documents
-
view
225 -
download
0
Transcript of Precipitation, Runoff and Water Loss in the Lower … · WATER RESOURCES OF LOWER COLORADO...

Precipitation, Runoff
and Water Loss in the
Lower Colorado River
Salton Sea Area
GEOLOGICAL SURVEY PROFESSIONAL PAPER 486-B
Prepared in collaboration with the
U.S. Weather Bureau


Precipitation, Runoff
and Water Loss in the
Lower Colorado River
Salton Sea AreaBy ALLEN G. HELY and EUGENE L. PECK
WATER RESOURCES OF LOWER COLORADO RIVER-SALTON SEA AREA
GEOLOGICAL SURVEY PROFESSIONAL PAPER 486-B
Prepared in collaboration with the
U.S. Weather Bureau
UNITED STATES GOVERNMENT PRINTING OFFICE, WASHINGTON : 1964

UNITED STATES DEPARTMENT OF THE INTERIOR
STEWART L. UDALL, Secretary
GEOLOGICAL SURVEY
Thomas B. Nolan, Director
The U.S. Geological Survey Library has cataloged this publication as follows:
Hely, Alien Grant, 1908-Precipitation, runoff and water loss in the lower Colorado
Biver-Salton Sea area, by Alien G. Hely and Eugene L. Peck. Washington, U.S. Govt. Print. Off., 1964.
iii, 17 p. maps (7 fold., 4 col., in pocket) diagrs., table. 30 cm. (U.S. Geological Survey. Professional Paper 486-B)
Water resources of lower Colorado River-Salton Sea area. Prepared in collaboration with the U.S. Weather Bureau. Bibliography: p. 16.
(Continued on next card)
Hely, Alien Grant, 1908- Precipitation, runoff and water loss in the lower Colorado Kiver-Salton Sea area. 1964. (Card 2)
1. Water-supply The West. I. Peck, Eugene Lincoln, 1922- joint author. II. U.S. Weather Bureau. III. Title. IV. Title: Lower Colorado River-Salton Sea area. (Series)
For sale by the Superintendent of Documents, U.S. Government Printing Office Washington, D.C. 20402

CONTENTS
Abstract______________.Introduction ______________.General description of the area.Precipitation_______________
Isohyetal maps_________Variations in time________
Temperature______________
Pag* Bl Runoff.
1 Methods used in estimating runoflf.1 Reliability.___ _ __.2 Water loss __.3 Evaporation________________.__.4 E vapotranspir ation ______________6 References__________________----__.
Page B6 111415151616
ILLUSTRATIONS
[Plates are in pocket]
PLATES 1-3. Maps showing mean precipitation, 1931-60, lower Colorado River-Salton Sea area:1. Winter (October-April).2. Summer (May-September).3. Annual.
4. Map showing mean annual temperature, 1931-60, lower Colorado River-Salton Sea area.5. Map showing estimated mean annual runoff from small tracts, lower Colorado River-Salton Sea area.6. Map showing mean annual lake evaporation, 1946-55, lower Colorado River-Salton Sea area.7. Map showing estimated mean annual evapotranspiration, 1931-60, lower Colorado River-Salton Sea area.
Page FIGURE 1. Map showing location of area discussed in this report-____-_-___-_------____---------_---_ _________ B2
2. Map showing zones used in analysis of precipitation data___________-_--__--_-------_-__-_- ________ 43. Seasonal and water-year totals of precipitation.___ ___________________________ __________________ 54. Cumulative departures from 30-year mean precipitation._______________________________________________ 75. Normals and extremes of monthly precipitation_____________________________________________________ 86. Map showing total precipitation during September 1939__________________________________________ 97. Monthly normals, normal ranges, and extremes of temperature,----___________________________________ 108. Graph showing relations between direct runoff and storm rainfall._________ _______ _____ ____ 129. Graph showing relation between runoff-curve number and mean annual runoff for the precipitation distribution
indicated in table !___________________________________________ __ ______ 1310. Graph showing relations between initial infiltration and runoff-curve numbers __________ _ ________________ 14
TABLE
TABLE 1. Summary of daily precipitation data for seven desert stations.Page B12
m

WATER RESOURCES OF LOWER COLORADO RIVER-SALTON SEA AREA
PRECIPITATION, RUNOFF, AND WATER LOSS IN THE LOWER COLORADO RIVER-SALTON SEA AREA
By ALLEN G. HELY and EUGENE L. PECK
ABSTRACT
The economy of the 25,000-square-mile area discussed in this report, which includes the western part of the region tributary to Colorado River below Davis Dam, Ariz.-Nev., and the ad joining Salton Sea basin, depends primarily on irrigation with water from the Colorado River. Nevertheless, an adequate ap praisal of the water resources of the area must include informa tion on the precipitation, runoff, and natural water loss within the area because these quantities affect water supplies of local origin and also the use of Colorado River water.
Mean annual precipitation ranges from less than 3 inches near the Salton Sea to more than 40 inches on Mount San Gorgonio, the highest peak on the western divide. In most of the area, including virtually all of the irrigable lands, the mean precipitation is less than 8 inches. Precipitation is strongly influenced by season and topography. Summer precipitation is almost insignificant in comparison with winter precipitation in the western part of the area, but in the southeastern part, summer and winter precipitation means are almost the same. Isohyetal maps of both seasonal and annual means are adjusted for the effects of topography.
A map showing mean annual temperature is included because of the dominant effect of temperature on natural water loss and on use of water by man. The mean generally decreases about 3.2° F for each 1,000 feet of increase in altitude, but it does not change significantly with change in latitude.
A large part of the runoff generated by precipitation within the area is absorbed in the alluvium of the valleys and plains. Available streamflow records provide very little information regarding the local runoff, which, consequently, was estimated on the basis of precipitation data, rainfall-runoff relations, and observed characteristics of the terrain. The runoff map indi cates mean annual amounts generated by rainfall on tracts of 10-20 square miles. As no adjustment for the effects of absorp tion in the alluvium is included, the runoff from larger tracts cannot be determined from the map, except for tracts that con tain no large deposits of alluvium.
Natural water loss includes evaporation from water surfaces and evapotranspiration from land areas and is relatively high in this area. Evaporation from reservoirs on the lower Colorado River, including Lake Mead, is estimated as about 1.2 million acre-feet nearly 10 percent of the mean annual streamflow in the lower Colorado River for 1931-60. Evapotranspiration from many unirrigated tracts exceeds the precipitation because of the absorption of runoff from nearby mountains. Evapotrans1- piration from irrigated tracts greatly exceeds the precipitation and varies with the type of crop and irrigation practices. It has no relation to local precipitation or runoff because the water is supplied chiefly by the Colorado River.
INTRODUCTION
The data and maps in this report are part of an appraisal of the total water resources of the area in which the lower Colorado River is the principal source of water supply. In such an appraisal the precipita tion, runoff, and water loss within the area are impor tant not only because they affect the Colorado River but also because they determine the magnitude of local water supplies that are relatively independent of the river.
Adequate descriptions of precipitation and runoff generally include the areal distribution of normal an nual values and also the variability of annual values at specific localities. However, because of a lack of infor mation on runoff in the study area, the description of runoff is limited to normal annual values.
The 30-year period 1931-60, which the U.S. Weather Bureau and the World Meterological Organization use as the current basis for normals (means) of meteorolog ical data, is the standard period used for computation of means in this report when such a period is applicable.
The text and illustrations relating to precipitation and temperatures were prepared by E. L. Peck, hydrol- ogist-in-charge, assisted by E. G. Christensen and E. S. McDonough, Water Supply Forecast Unit, U.S. Weather Bureau, Salt Lake City, Utah. The text and illustrations relating to runoff and water loss were pre pared by A. G. Hely under the general supervison of C. C. McDonald, project hydrologist, U.S. Geological Survey. The assistance of many colleagues who re viewed the manuscript and offered helpful suggestions is gratefully acknowledged.
GENERAL DESCRIPTION OF THE AREA
The area discussed in this report, as defined by natural drainage boundaries, comprises the Salton Sea basin and the drainage area of Colorado River below Davis Dam, Ariz.-Nev., excluding the Bill Williams River basin above the gaging station near Alamo, Ariz., the Gila River basin above the Wellton-Mohawk Irri gation and Drainage District, and the drainage area of
Bl

B2 WATER RESOURCES OF LOWER COLORADO RIVER-SALTON SEA AREA
San Cristobal Wash. Although this wash enters the Gila Kiver from the south within the irrigation district, its drainage area is omitted to keep the map of the study area within convenient limits. The southern part of the Colorado Kiver delta in Mexico also is excluded from the study. The location of the area and its rela tion to the Upper and Lower Basins of the Colorado Kiver as defined in the Colorado River Compact of 1922, are indicated in figure 1.
Mountain ranges that are roughly parallel to the Pacific coast form the drainage divide between the southern coastal basins in California and the southern part of the Great Basin, of which the Salton Sea basin is a part. The mountain ranges are also the chief cause of the difference between the mild, Mediterranean-type climate of southwestern California and the hot dry climate of the deserts in the Great Basin and the lower Colorado River basin. These ranges are highest and steepest at the northwestern end of the Salton Sea basin, where they reach altitudes of more than 10,000 feet. Farther south, in the vicinity of the international boundary, their altitude is about 4,000 feet.
IDAHOj / / *-. WYOMING
EXPLANATION! ~ ! > \ < -
Denver
FIGTJEB 1. Map showing location of area discussed in this report.
The elongate depression that contains the Gulf of California and the Salton Sea lies east of these moun tains. The Colorado River enters the depression near the international boundary, and its delta forms a bar rier more than 100 miles wide between the gulf and the Salton Sea. The lowest point on the divide is about 35 feet above sea level, and the lowest part of the Salton Sea basin is about 278 feet below mean sea level (revised on the basis of soundings made by Shawn Biehler of California Institute of Technology in August 1962).
The desert area north and east of the depression con tains numerous ranges of hills and mountains, which are somewhat lower than those on the western edge of the Salton Sea basin. The Hualpai Mountains in Ari zona in the northeastern part of the area reach an alti tude of more than 8,000 feet, but few peaks in the vicinity of the international boundary are more than 3,000 feet above sea level. Many of the ranges are ex tremely rugged and barren, although of only moderate height. The mountain masses generally consist of dense rocks having very thin mantles of weathered rock or soil. The intermontane valleys and plains are under lain by thick deposits of alluvium eroded from the mountains or transported into the region by the Colo rado and Gila Rivers.
The Colorado River has cut canyons through some low mountains that lie across its path and has built wide flood plains in the intervening valleys. Just above its delta, the Colorado River is joined by the Gila River, which also is bordered by wide flood plains except where it passes between the Gila and Laguna Mountains about 10 miles above the junction of the two rivers.
The delta and the flood plains, together with some smaller tracts, support an extensive agriculture that depends entirely on irrigation and is the mainstay of the economy of the area. Some low-lying tracts that are not cultivated support a dense growth of native bottom-land vegetation which draws its water supply from the shallow ground water.
The study area includes about 25,000 square miles in the States of Arizona, California, and Nevada, and in Baja California and Sonora, Mexico. About two dozen cities and towns had populations of more than 1,000 in 1960. Mexicali, Baja Calif., the largest city in the area, and Yuma, Ariz., the largest city north of the international boundary, had populations of about 65,000 and 24,000, respectively. Some of the larger cities and some new communities in recreational areas are growing very rapidly.
PRECIPITATION
Mean annual precipitation is less than 8 inches in most of the study area and ranges from less than 3 inches

PRECIPITATION, RUNOFF, AND WATER LOSS B3
in the Colorado River delta and lower Coachella Valley areas to more than 40 inches on Mount San Gorgonio, the highest peak. These areal variations are closely related to topography and to exposure to moist air from the Pacific Ocean in winter and from the Gulf of Mexico in summer.
In places, many consecutive months may pass with no precipitation, but rainfall greater than the normal an nual amount may occur during a single brief storm. These variations at specific localities are due to erratic changes in weather (common to all localities) super imposed on periodic variations associated with the seasons.
The maps and charts on plates 1-3 and in figures 3-6 provide a general description of the precipitation and its variations by years, seasons, and months.
ISOHYETAL MAPS
During the 7-month period October-April, the pre vailing weather patterns and associated precipitation differ markedly from those for the 5-month period May- September. Because of these differences, the separate analysis of precipitation data for each season is prefer able to analysis of annual data. Furthermore, maps of seasonal precipitation are useful in many hydrologic studies. Hence, isohyetal maps have been compiled for the winter season October-April (pi. 1) and for the summer season May-September (pi. 2). The annual map (pi. 3) was drawn by combining the two seasonal maps.
The network of precipitation stations in areas of low relief is fairly adequate, but in areas of high relief, where effects of topography are greatest, there are very few stations. Methods of mapping precipitation in areas of high relief have been greatly improved during the past 15 years. The method used in this report was described by Peck and Brown (1962).
The study area and its immediate surroundings were divided into eight zones (fig. 2) to facilitate computa tion of 30-year means for short-term records (as explained below) and the development of altitude- precipitation relations.
Nearly 300 records from files and publications of the Weather Bureau and other Federal and State agencies were used to help define the seasonal maps. Several other records were examined but were found to be in consistent, too fragmentary, or too short to be useful. The minimum lengths of record used are 5 years for winter and 10 years for summer. All winter records were checked for consistency by the double-mass analy sis technique described by Linsley, Kohler, and Paulhus (1949). Summer records were assumed to have the same discontinuities as those determined for the winter period.
Normals (30-year means) for each season were determined separately. For each incomplete record, the normal winter precipitation was determined by extrapolation of the relation line defined by double- mass plotting of the incomplete record against a base. The base for a specific zone is the average of all com plete records of acceptable quality from that zone. Normal summer precipitation for stations that have incomplete records was extrapolated by the ratio method. The record for a full-term station that has as nearly as possible the same altitude and exposure as those of the station having an incomplete record was used for comparison. The ratio of cumulative precipi tation at the short-term station to that at the full-term station, as defined for the concurrent period, was assumed to apply to the 30-year period also.
Relations between altitude and seasonal normals of precipitation for each of the eight zones are fairly well defined. These relations and the normals for each station could be used to draw isohyets for each zone, but discontinuities would exist at the borders, where differences between the relations for adjacent zones may be large. This difficulty was avoided by preparation of anomaly maps, as described below.
The altitude-precipitation relations for zones A, B, C, E, G, and H (fig. 2) are practically parallel. Con sequently, these individual relations were combined in a mean curve for the six zones, and anomalies (depart ures) from the mean curve were computed for each precipitation station within or adjacent to these zones. The relations for zones D and F, also, are practically parallel but have a slope that differs from the slope for other zones. Anomalies from a mean curve for zones D and F were computed for each station within or adjacent to these zones. Analysis of the anomalies showed that they were closely related to physiographic features and that lines of equal anomaly could be drawn with considerable confidence except in areas where precipitation data are most deficient. The over lap of anomaly patterns facilitated the smooth transi tion between groups of zones when the isohyetal maps were drawn.
In preparing the seasonal isohyetal maps, the nor mals for each station were plotted, and normals for additional points were computed from the anomaly maps. Values were determined for each intersection of a grid that has lines spaced 20 minutes apart and for other points in certain critical areas. The isohyets are based on the plotted values and on the topography.
Although the accuracy of the final maps cannot be determined, the reliability of the maps is greatly im proved by the systematic adjustments for the effects of topography. Any map of a large area must be gen-

B4 WATER RESOURCES OF LOWER COLORADO RIVER-SALTON SEA AREA
eralized somewhat. Consequently, the maps indicate Other aspects of this variation are illustrated in figures the normal precipitation for an appreciable area more 3-6.accurately than the normal for a point. The charts in figure 3 illustrate the variations from
season to season and from year to year at four locations (which are indicated in fig. 6). Means for different
The isohyetal maps described above show how the short periods vary quite erratically, but the means for normal precipitation varies areally, and they also illus- long periods of record are almost the same as those for trate one aspect of how the precipitation varies in time, the 30-year period 1931-60.
VARIATIONS IN TIME
115' 114'
35'
34'
CALIF.. -
CB. CALIF
117 116° 115°
FIGURE 2. -Map showing zones used in analysis of precipitation data.

PRECIPITATION, RUNOFF, AND WATER LOSS B5
COUl
o 10z Indio (U.S. Date Garden), Calif
10
Yuma, Ariz
o g
25 - ^
20 - \ \
Ul \
o \.z - llJ
z " j ^ r~ 15 - ^ ^ a ?Z i '/ ?'/° ~ i i iH- - ^ ^ MH ~ I ^ . '' ''''/OL. _ ^ ^'i^^
LJ 10 -J^ J \ ^
£L -^| ^ \ ''fa
ill~ ? ^M ^^
Boulevard, Calif
^
? /7-1 ' '
Ii ,1«? ^# ? 7/s.mi 111 1 1 1H H i i i ii i ii II ii
_
^
~
EXPLANATION
Summer (May-September) precipitation
Winter (October-April) precipitation
Wide bars indicate long-term means
20
UlX 15 OZ
10
Kingman, Ariz
S o <0
FIGUEB 3. Seasonal and water-year totals of precipitation.

B6 WATER RESOURCES OF LOWER COLORADO RIVER-SALTON SEA AREA
No long-term record is available for the most humid part of the area, but the record for Boulevard, Calif., is sufficient to indicate the variations.
The absolute variation indicated by the range tends to be greatest where the mean precipitation is greatest, but the relative variation indicated by the range expressed as a percentage of the mean tends to be greatest where the mean precipitation is least. For example, the range in annual precipitation for 1931-60 at Boulevard is 19.6 inches, or 135 percent of the mean. For the same period the range at Indio is 12.1 inches, or 360 percent of the mean.
Both figure 3 and the seasonal isohyetal maps (pis. 1, 2) demonstrate that summer precipitation accounts for a very small proportion of the annual precipitation at the western edge of the study area and a much larger proportion toward the east.
Graphs showing accumulated departures from the mean (fig. 4) help to identify wet and dry periods and indicate the severity of drought or the excess of rain fall. All departures were computed from the mean for 1931-60, the longest period common to all four records. The lines start at zero at the beginning of the 1931 water year (Oct. 1,1930) and extend in both directions if records prior to 1931 are available. The trend of the line, rather than its position above or below the base line, is the significant aspect because the position de pends on the starting point. Downward trends indi cate below-normal precipitation, and upward trends indicate above-normal precipitation.
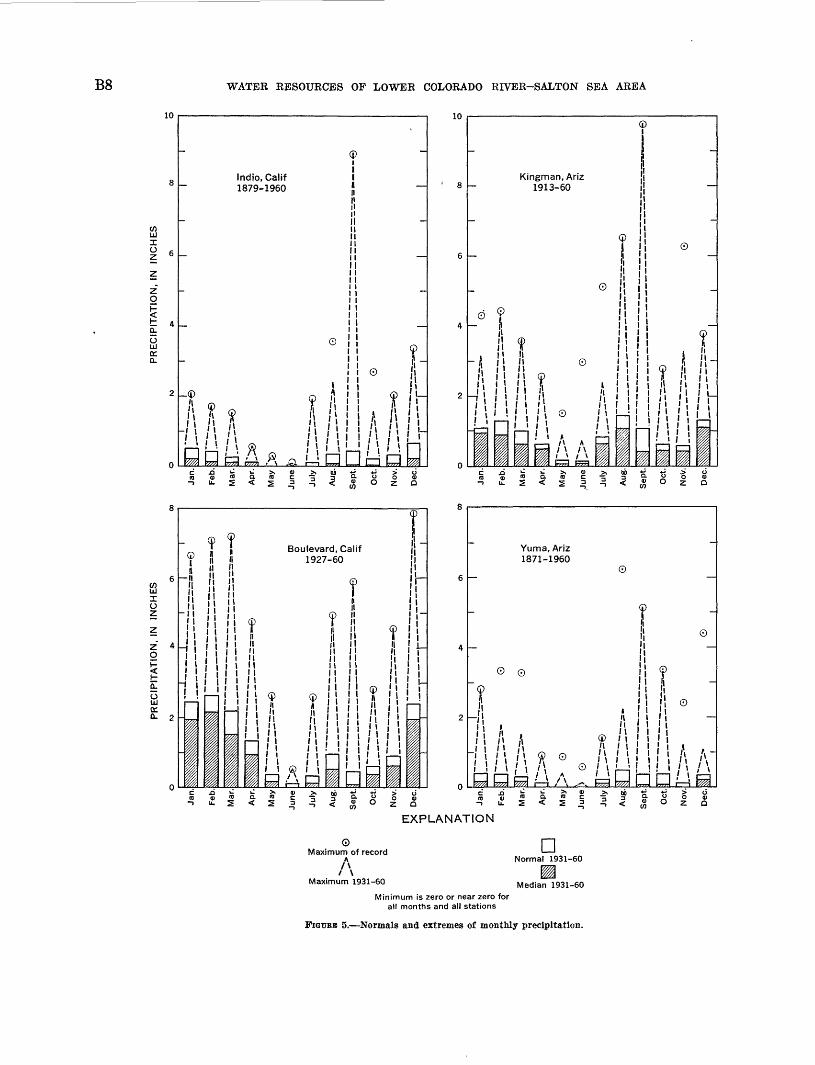
The charts of monthly precipitation in figure 5 indi cate the nature of the seasonal cycle in more detail and also emphasize the extreme variability. Median values (the amounts equalled or exceeded 50 percent of the time) as well as normals (means for 1931-60) are indi cated because they are particularly significant in arid climates. In the study area the median generally is only a small fraction of the mean and may be zero if the mean is small. On the other hand, in humid regions the mean and median are nearly the same.
The maximum monthly precipitation indicated in fig ure 5 often is the result of an intense storm that covers only a small area, particularly in the summer. On rare occasions, however, a general summer storm produces heavy rain over a large area. The isohyetal map in figure 6 (not adjusted for effects of topography) shows the total monthly precipitation for September 1939, when the precipitation exceeded the normal annual total in most of the desert area. Most of the rainfall occurred in two general storms following tropical dis turbances that moved into the Baja California region.
TEMPERATURE
Although air temperature is not a primary topic of hydrology, it is significant because of its dominant influ ence on natural water loss and on the use of water by man. A description of the variations is provided by the map on plate 4 and by the charts in figure 7.
For the most part, temperatures correlate well with altitude, changing approximately 3.2° F. for each 1,000 feet of altitude. Drainage of cool air from uplands to adjacent valleys causes many anomalies from this general pattern. An outstanding example of this occurs in the valleys of the lower Colorado and Gila Rivers near Yuma, Ariz., where the mean annual tem perature is slightly lower than that of the surrounding area, and daily minimum temperatures often are mark edly lower. Latitude has no significant effect upon temperature within the study area.
The map of mean annual temperature (pi. 4) is based on all available temperature records of more than 5 years. Means for incomplete records were adjusted to the 30-year period by the departure method. The departure from the established normal for a nearby sta tion was determined for the short period and applied to the incomplete record.
Mean daily maximum and minimum temperatures for January and July were analyzed and mapped in the course of the study. The general pattern of the isotherms on these maps is very similar to that on the annual map and tends to confirm it.
The extreme variability and the seasonal pattern of variations at specific localities is demonstrated by the charts in figure 7. The seasonal patterns are rather uniform, but the range in temperature for each month is large. Such ranges are characteristic of the desert, where low humidity and general absence of cloud cover favor rapid radiation of heat.
RUNOFF
Streamflow in arid regions differs markedly from that in humid regions, for which most runoff maps have been prepared. Consequently, the proper interpreta tion of a runoff map of an arid region depends on an understanding of the basis for the map.
In humid regions drained by perennial streams, con ventional streamflow records often are an adequate basis for a runoff map. The flow is composed partly of direct (storm) runoff and partly of ground-water runoff, both of which tend to increase as the drainage area increases. Although local differences in terrain or geology may cause large differences in the proportions of direct run off and ground-water runoff, they usually have rela tively little effect on the total long-term runoff.

PRECIPITATION, RUNOFF, AND WATER LOSS B7
-20 -
WATER YEARS
WATER YEARS
FIGURE 4. Cumulative departures from 30-year mean precipitation, 1931-60. Plot starts at beginning of 1931 water year. Upward trends indicate wet periods; downward trends, dry periods.
B8 WATER RESOURCES OF LOWER COLORADO RIVER-SALTON SEA AREA
10
z o
1 4E oLJcr CL
Indio, Calif 1879-1960
<P
10
Kingman, Ariz 1913-60
0
I- ^ ^ i-| j Boulevard, Calif i t II II 1927-60 1n M '!
' !! ii-II-
ij
Ii
;
1
II II
1
i
? 1II 1II II1 1
II 1
® ©'! A
1 II'< '
11 ,'
~ 1 1 r-n ' » r1 y ̂ ^_ j i
©in nI ' I
il n i> MM ii
j1 V
1 1©n" rii,'i I
/' i ' i ^
~
__F
6
4
2
Yuma, Ariz1871-1960
0
fi| ©
i© 0
: AV.ASU l 1 1 __ - 1 \ A 1 \ r-
I _ I r~~i \ / \ r i 1,1 te73 K^l 1 1 / \ ^^ P773 K73 U
I
J^Ji UJ i i ^
4 1 1 4 I 1 1 I I S I IEXPLANATION
Maximum of recordA
AMaximum 1931-60
Normal 1931-60
Median 1931-60Minimum is zero or near zero for
all months and all stations
FIGURE 5. Normals and extremes of monthly precipitation.

PRECIPITATION, RUNOFF, AND WATER LOSS
-8
B9
IsohyetShows equal monthly precip
itation. Interval 2 inches
.CALIF-
CB. CALIF
117 116° 115°
FIGURE 6. Map showing total precipitation during September 1939.
114 C
Arid regions, on the other hand, generally are drained by ephemeral streams, which flow only briefly during and after some storms. The water table is far below most of the local stream channels and contributes no flow to them but it may contribute small amounts to a perennial stream, such as the Colorado Eiver, that flows through the region. Many of the ephemeral stream channels traverse deposits of alluvium that ab
sorb part or all the flow that originates in relatively impermeable areas or areas of intense local precipitation.
Thus, in the study area, most local streams head in mountain ranges where there are no extensive alluvial deposits, and the average flow in a channel of this type tends to increase as the drainage area increases. Where a flow reaches permeable alluvium in the valleys,

BIO WATER RESOURCES OP LOWER COLORADO RIVER-SALTON SEA AREA
EXPLANATION
Maximum of record
Average daily maximum
Mean monthly
Average daily minimum
Minimum of record
1931-60
Mean annual, 1931-60
120
uX
u 100orx
UJ 80DCC5uQ
- 60
o:tu 40Q.2 uI-
20
Kingman, Ariz, 1911-60
S i I i 1 I I I I S I I
Indio (U.S. Date Garden), Calif, 1877-1960
120
100
80
60
40
20
120
100
80
60
40
20
Yuma (Citrus Station), Arir, 1919-60
60 r! t!-3 Q U< « O
FIGURE 7. Monthly normals, normal ranges, and extremes of temperature.

PRECIPITATION, RUNOFF, AND WATER LOSS Bll
absorption of streamflow generally causes a change in the rate of increase of flow or a decrease in average flow as the drainage area or stream length increases. Consequently, the residual flow in the channel below the point where absorption of flow begins does not rep resent the total runoff.
Conventional records of desert streamflow are ex tremely expensive relative to the small quantities of water involved, are difficult to obtain, and are often difficult to evaluate because of the absorption of stream- flow. As a result, few records have been obtained, and it is not likely that an adequate network of conven tional gaging stations will be operated in the foresee able future. A network of partial-record stations (chiefly for determination of peak discharge) in con junction with a few conventional stations eventually may make it possible to determine desert runoff from streamflow data; but because of the extreme variability of desert runoff, this will require many years of record.
Water resources originating within the study area cannot be ignored in an evaluation of total water resources; consequently, runoff from the desert has been estimated as described below.
Most runoff maps that have been drawn for large re gions, such as the Western United States, are based on streamflow records for major streams and are useful in the studies of the major streams rather than of the hydrology of small arid areas. The runoff map of the study area (pi. 5) shows the areal variations in mean annual runoff from small tracts (10-20 sq mi). In desert areas, as defined below, the isograms indicate the amount of direct runoff that is generated locally. As no allowance is made for depletion of streamflow by absorption in the alluvium, the isograms do not neces sarily represent the runoff that reaches a major stream.
The map as a whole may be more representative of long-term runoff than of the mean for any specific pe riod because the method used to estimate runoff from most of the area involves several generalizations and approximations.
The estimated runoff varies from nearly zero in much of the Colorado River delta and many smaller areas to more than 20 inches on Mount San Gorgonio.
In some parts of the area the pattern of equal-runoff lines is very similar to the pattern of isohyets (pi. 3). but in other parts the patterns have no relation because geology and soils are dominant influences on the runoff.
It may seem anomalous that the estimated runoff from parts of the Castle Dome and Kofa Mountains, northeast of Yuma, Ariz., exceeds 2.5 inches but that runoff from mountains farther north, where precipita tion is much greater, does not reach 2.5 inches. This difference is readily accounted for by differences in soil
depth and permeability and in vegetative cover. The top of the Hualpai Mountain range, south of Kingman, Ariz., is forested; the Castle Dome and Kofa Mountains are extremely barren, rocky, and steep.
METHODS USED IN ESTIMATING BUNOFF
The only streamflow records that are usable for esti mating runoff from the study area are those obtained from eight stations on small streams in the San Ber- nardino and San Jacinto Mountains, near Palm Springs, Calif. None of the records covers the full period 1931-60; one covers 24 of the 30 years, five cover 10 to 13 years, one covers only 4: years within the period but extends back an additional 9 years, and one covers 7 years prior to 1931. The records are adjusted approximately to the period 1931-60 by the double-mass analysis technique, but the adjustments may not always be reliable because records for adjacent streams in this region do not correlate well.
For the area covered by streamflow records, the iso grams of runoff on plate 5 are drawn on the basis of the shapes of the isohyetal lines (pi. 3) and the adjusted average runoff from the gaged areas. In drawing the isograms, due consideration was given to the resulting differences between precipitation and runoff and to a runoff map for the Pacific slopes of the San Bernardino and San Jacinto Mountains, which was prepared by Stafford and Troxell (1953). However, Stafford and Troxell's map is based on a different period and a dif ferent isohyetal map. Consequently, the two runoff maps should not be expected to match closely at the divide.
For other mountain areas where there are perennial streams but no usable streamflow records, the runoff is estimated primarily on the basis of runoff from simi lar gaged areas elsewhere in the Southwest.
About 95 percent of the study area is desert on which the mean annual precipitation is less than 12 inches. As runoff from the desert normally includes no ground- water discharge, its magnitude is determined by rain fall intensity and duration and by the capacity of the soil to absorb water. Detailed information on these factors also is lacking. However, the U.S. Soil Con servation Service has developed an empirical method for estimating direct runoff from total storm rainfall and from information on soils. The method, described in publications of the Soil Conservation Service [no dates] and the U.S. Bureau of Reclamation (1960), has been adapted to the problem of estimating mean annual runoff from the available precipitation data and from the infiltration characteristics of soils in the study area.
A priricipal element of the method is a family of curves, defined by data from many gaged watersheds in

B12 WATER RESOURCES OF LOWER COLORADO RIVER-SALTON SEA AREA
many parts of the country, showing average relations between direct runoff and total storm rainfall. Al though the relations indicated by these curves are greatly simplified, attempts to refine them by inclusion of additional variables have generally been unsuccessful. Figure 8 illustrates selected curves of the family for the range of storm rainfall required in this study.
1234
STORM RAINFALL, IN INCHES
FIGURE 8. Graph showing relations between direct runoff and storm rainfall. After U.S. Soil Conservation Service.
The curves are numbered from 0 to 100, in order of increasing runoff. Curve 0 would apply to a sand or gravel so permeable that no runoff would occur for any rainfall. Curve 100 represents the the unattainable condition of 100 percent runoff. The curve numbers between 0 and 100 are determined by a formula and are not percentages.
Much of the information needed for application of the method as described in the literature is lacking. Con sequently, modifications of the method, as described be low, are necessary for application of the method to the present problem.
Weather Bureau records of daily precipitation (which is practically all rainfall) for 1931-60 for seven desert stations (Kingman, Parker, Salome, and Yuma, Ariz., and Brawley, Indio, and Needles, Calif.) were analyzed to provide an index to the magnitude of storm rainfall. Daily values were separated into seven classes according to magnitude, and the percentage of the total that fell within the range of each class was computed. The variation in these percentages is not excessive and does not follow any areal pattern. Consequently, the means for the seven stations are considered more nearly representative of the typical distribution of storm rail- fall than the percentages for any one station would be. Eesults of this analysis are summarized in table 1.
Column 1 indicates the range of daily precipitation in each class except the last one; column 2 indicates a representative value (selected as explained below) of storm rainfall for each class; columns 3 and 4 indicate the range in percentages of the total precipitation for each class; and column 5 indicates the rounded mean percentage for the seven stations.
TABLE 1. Summary of daily precipitation data for seven desertstations
Class limits ofdaily precipitation
(inches)
0. 01-0. 10. 11- . 30. 31- . 60. 61-1. 00
1. 01-1. 501. 51-2. 00
>2. 00
Representative
stormrainfall
(inches)
0.08.25.53.9
1.41.92.9
Percentages of total precipitation
Maximum
13.125.826.825.414.26.7
13.0
Minimum
7.521.324.312.47.22.51.0
Roundedmean
1024261811
56
In tables of this type, each class normally is repre sented by its midvalue. However, storm rainfall gen erally tends to be greater than daily precipitation because many storms occur in more than one observa tional day. Consequently, the average of the mean and maximum daily values for each class (rather than the mean) was selected to represent the storm rainfall for the class. Thus, the third line of the table indicates that 26 percent of the total precipitation occurred in daily amounts of 0.31-0.60 inch, which is considered equivalent to 26 percent of the total occurring in storms of about 0.53 inch.
The last class in table 1 is an open-end class contain ing all daily values over 2.0 inches. The maximum daily precipitation observed at any of the seven stations is 6.4 inches. However, at some other desert stations the maximum is as low as 2.0 inches. Use of 6.4 inches as a class limit in computing the representative storm rain fall would give excessive weight to an unusual occur rence at a single station. Therefore, the maximum se lected for this purpose is the average maximum for 25 desert stations in or near the study area (U.S. Weather Bureau, 1952). This average maximum is 3.2 inches, and the corresponding representative storm rainfall, computed as above, is 2.9 inches.
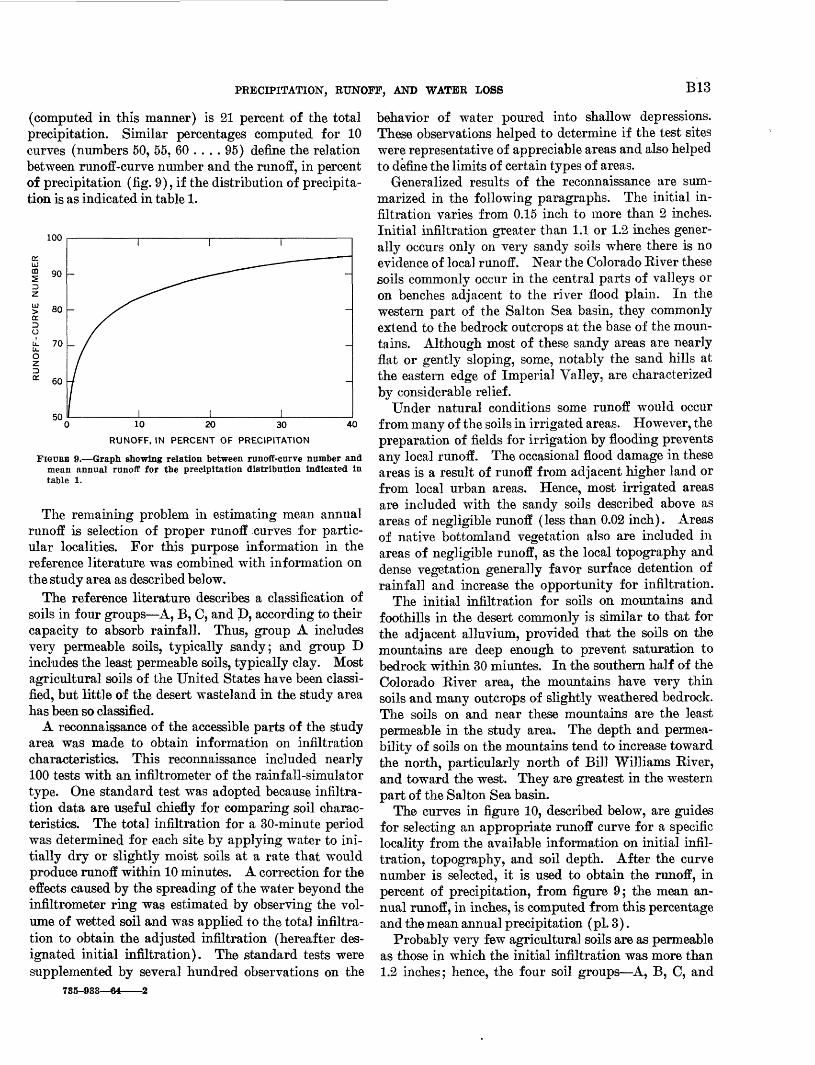
The mean annual runoff corresponding to any of the runoff curves (fig. 8) can be computed by using the values in columns 2 and 5 of table 1. For example, for curve 90, the runoff corresponding to a storm of 2.9 inches is 1.9 inches, and table 1 indicates that about 6 percent of the total precipitation occurs in storms of this magnitude. Therefore, 6(1.9/2.9) or 3.9 percent of the total precipitation is accounted for as runoff caused by storms in this class. The runoff for all classes of storms
PRECIPITATION, RUNOFF, AND WATER LOSS B13
(computed in this manner) is 21 percent of the total precipitation. Similar percentages computed for 10 curves (numbers 50, 55, 60 .... 95) define the relation between runoff-curve number and the runoff, in percent of precipitation (fig. 9), if the distribution of precipita tion is as indicated in table 1.
100
90
80
70
60
5010 20 30
RUNOFF, IN PERCENT OF PRECIPITATION
40
FIGURE 9. Graph showing relation between runoff-curve number and mean annual runoff for the precipitation distribution Indicated in table 1.
The remaining problem in estimating mean annual runoff is selection of proper runoff curves for partic ular localities. For this purpose information in the reference literature was combined with information on the study area as described below.
The reference literature describes a classification of soils in four groups A, B, C, and D, according to their capacity to absorb rainfall. Thus, group A includes very permeable soils, typically sandy; and group D includes the least permeable soils, typically clay. Most agricultural soils of the United States have been classi fied, but little of the desert wasteland in the study area has been so classified.
A reconnaissance of the accessible parts of the study area was made to obtain information on infiltration characteristics. This reconnaissance included nearly 100 tests with an infiltrometer of the rainfall-simulator type. One standard test was adopted because infiltra tion data are useful chiefly for comparing soil charac teristics. The total infiltration for a 30-minute period was determined for each site by applying water to ini tially dry or slightly moist soils at a rate that would produce runoff within 10 minutes. A correction for the effects caused by the spreading of the water beyond the infiltrometer ring was estimated by observing the vol ume of wetted soil and was applied to the total infiltra tion to obtain the adjusted infiltration (hereafter des ignated initial infiltration). The standard tests were supplemented by several hundred observations on the
785-933 64 2
behavior of water poured into shallow depressions. These observations helped to determine if the test sites were representative of appreciable areas and also helped to define the limits of certain types of areas.
Generalized results of the reconnaissance are sum marized in the following paragraphs. The initial in filtration varies from 0.15 inch to more than 2 inches. Initial infiltration greater than 1.1 or 1.2 inches gener ally occurs only on very sandy soils where there is no evidence of local runoff. Near the Colorado Eiver these soils commonly occur in the central parts of valleys or on benches adjacent to the river flood plain. In the western part of the Salton Sea basin, they commonly extend to the bedrock outcrops at the base of the moun tains. Although most of these sandy areas are nearly flat or gently sloping, some, notably the sand hills at the eastern edge of Imperial Valley, are characterized by considerable relief.
Under natural conditions some runoff would occur from many of the soils in irrigated areas. However, the preparation of fields for irrigation by flooding prevents any local runoff. The occasional flood damage in these areas is a result of runoff from adjacent higher land or from local urban areas. Hence, most irrigated areas are included with the sandy soils described above as areas of negligible runoff (less than 0.02 inch). Areas of native bottomland vegetation also are included in areas of negligible runoff, as the local topography and dense vegetation generally favor surface detention of rainfall and increase the opportunity for infiltration.
The initial infiltration for soils on mountains and foothills in the desert commonly is similar to that for the adjacent alluvium, provided that the soils on the mountains are deep enough to prevent saturation to bedrock within 30 miuntes. In the southern half of the Colorado Eiver area, the mountains have very thin soils and many outcrops of slightly weathered bedrock. The soils on and near these mountains are the least permeable in the study area. The depth and permea bility of soils on the mountains tend to increase toward the north, particularly north of Bill Williams River, and toward the west. They are greatest in the western part of the Salton Sea basin.
The curves in figure 10, described below, are guides for selecting an appropriate runoff curve for a specific locality from the available information on initial infil tration, topography, and soil depth. After the curve number is selected, it is used to obtain the runoff, in percent of precipitation, from figure 9; the mean an nual runoff, in inches, is computed from this percentage and the mean annual precipitation (pi. 3).
Probably very few agricultural soils are as permeable as those in which the initial infiltration was more than 1.2 inches; hence, the four soil groups A, B, C, and

B14 WATER RESOURCES OF LOWER COLORADO RIVER-SALTON SEA AREA
S 0.2 -
40 50 60 70 80
RUNOFF-CURVE NUMBER
FIGUEB 10. Graph showing relations between Initial Infiltration and runoff-curve numbers.
D probably correspond to the range in initial infiltra tion of 0 to 1.2 inches. Soil group A covers about 18.2 percent of this range; group B, 43.6 percent; group C, 27.8 percent; and group D, 10.4 percent (U.S. Bureau of Reclamation, 1960, fig. A-l). The relation of the soil groups to the initial infiltration is indicated by the vertical scales in figure 10.
Published data on curve numbers for each of these groups are assumed to correspond to the middle values of initial infiltration for that group. On this basis, the published data define the three dashed curves. That labelled "Fallow (dry)" represents soils that are de void of vegetation and that have soil moisture near the wilting point. That labelled "Range (dry)" represents poor range that has about 50 percent vegetative cover. The curve labelled "Fallow (wet)" represents fallow soils that are saturated at the beginning of a storm and is included to illustrate the variation in infiltration that can occur in the same soil.
The solid curve labelled "Alluvium flat slopes" is an average of the first two curves and is considered rep resentative of some of the alluvium in the study area, which usually is very dry at the beginning of a storm and generally has considerably less than 50 percent vegetative cover. At zero infiltration this curve indi cates a relatively low runoff-curve number, or a large abstraction from precipitation, which in turn indicates a large volume of retention in surface depressions. The indicated retention is reasonable for flat slopes but not for steep ones; consequently, the modified curve marked "Steep slopes" is considered applicable to the steeply sloping alluvium.
Although soil group D contains some soils that are described as thin, these soils are not as thin as the soil cover on most of the mountains and hills in the desert area. These soils can absorb only a small amount of water before becoming saturated, so that nearly all ad ditional rain, regardless of intensity, runs off. Accord ingly, the curve labelled "Mountains" is drawn so that the runoff-curve number at zero infiltration is about 99 and at high values of infiltration does not become less than 90, which corresponds to a maximum abstraction from precipitation of about 1 inch. This "Mountain" curve is considered appropriate for some of the most rugged areas, where vegetation is extremely sparse and much bedrock is exposed.
The curve labeled "Hills" is an intermediate curve representing gentler slopes, deeper soils, or denser cover than does the "Mountain" curve, and it in cludes some foothill areas and plateaus.
The selection of a runoff curve for a point is based on the topography, as indicated by the series of 71/£- and 15-minute quadrangles and by aerial photographs as well as by the reconnaissance described above. The "Mountain" curve is regarded as an upper limit and the "Alluvium" curve as near a lower limit for the runoff- curve numbers that are applicable to the study area.
RELIABILITY
The empirical relations described above are not in tended to have any significance beyond that of provid ing a systematic method of estimating mean annual runoff from the desert part of the study area. Use of the method does not remove the element of personal judgment from the resulting estimates, but it does help in the utilization of available information and in the maintenance of areal consistency.
Although there are virtually no checks on the ac curacy of the map, except in the San Gorgonio and San Jacinto Mountain areas, it is appropriate to compare the indicated runoff with some fragments of information on runoff within the area and with runoff from other arid regions.
Floods from the 41.5-square-mile drainage area of Picacho Wash sometimes cause damage to structures and irrigated lands in the valley north of Yuma, Ariz. Consequently, the Bureau of Reclamation has estimated the magnitude of several outstanding floods. The esti mated peak discharges of five outstanding floods during 1920-39 range from 4,400 to 37,000 cfs (cubic feet per second), and the volume of water in the largest flood was estimated to be 6,950 acre-feet (Bureau of Recla mation, oral commun.). If the relation of volume to peak discharge for other floods is the same as for the largest flood, the five floods represent a total runoff of

PRECIPITATION, RUNOFF, AND WATER LOSS B15
8.7 inches or an average annual runoff of 0.44 inch for 20 years. Only three of these floods, including the largest, occurred during 1931-60, but many smaller floods occurred before and after 1931. The runoff map (pi. 5) shows that most of the area is between the 0.02- inch and 0.5-inch lines, but maximum values of about 1.0 inch are indicated at headwater areas in the Cargo Muchacho and Chocolate Mountains.
The average annual measured flow of Bill Williams River near Alamo, Ariz., represents 0.3 inch of runoff. However, this figure is affected by diversion for irriga tion and by depletion of streamflow in the alluvium. If allowance is made for these depletions, the runoff is fairly consistent with the values for local runoff from small areas below Alamo as indicated by the map. Other gaging stations in desert areas of Arizona in dicate average annual runoff ranging from less than 0.1 inch to 0.6 inch. Many of these records are affected by diversion, and all are affected by depletion of flow in alluvial channels.
A program of determining runoff from small areas in California provides data that vividly illustrate the ex treme variability of runoff from the desert, but the program has not been in operation long enough to be very helpful in making estimates of mean annual runoff. At some stations, even in mountainous areas, there is no flow for two or more consecutive years (Young and Click, 1962). On the other hand, peak discharges greater than 100 cfs per sq mi are not uncommon. A peak of 2,280 cfs per sq mi has been computed for an area of 0.043 square mile near Needles, Calif. A peak of greater significance, however, is one of 918 cfs per sq mi from an area of 20.9 square miles near Borre- go, Calif.; it is comparable to the largest peak (890 cfs per sq mi) from the 41.5-square-mile area of Picacho Wash.
Data published by the Agricultural Research Service [no date] of the U.S. Department of Agriculture for seven small agricultural watersheds near Albuquerque and Mexican Springs, N. Mex., show that runoff ranged from 0.8 to 9.3 percent of precipitation for periods of 5 to 15 years. The average percentage was 4.3 and corresponds approximately to that for runoff- curve 75 (fig. 9). Figure 10 indicates that this runoff curve is applicable for alluvium that has an initial infil tration of about 0.5 inch. Thus, the data are in reason able agreement with the estimates in this report.
WATER LOSS
In this report the term "water loss" refers to water returned to the atmosphere by evaporation from free water surfaces and by evapotranspiration from land areas. This definition is in general agreement with
common usage, but a slightly different meaning is at tached to the term in some circumstances. For exam ple, in humid regions the difference between mean annual precipitation and mean annual runoff for a period of several years often is designated "water loss." This difference is usually a good estimate of the loss to the atmosphere, but it may include other losses, such as groundwater that discharges directly to the ocean (rather than to streams), or it may be affected by appreciable changes in storage within the area considered.
EVAPORATION
Evaporation from free water surfaces tends to be greatest where precipitation and runoff are least and, consequently, is a major item in the hydrologic cycle for arid regions. Meyers (1962) estimated that the mean annual evaporation from reservoirs on the lower Colorado River (including Lake Mead) is about 1.2 million acre-feet nearly 10 percent of the average annual flow of Colorado River below Hoover Dam during 1931-60.
The map of average annual evaporation (pi. 6) is adapted from a small-scale map of the United States (U.S. Weather Bureau, 1959) and is more generalized than other maps in this report. The available data on evaporation do not warrant mapping it in the same detail as precipitation. The rate of evaporation for the 30-year period 1931-60 probably is not significantly different from the rates shown for the 10-year period 1946-55.
Rates of evaporation are affected by storage of heat in a water body and advection of heat by inflowing or outflowing water as well as by climatic and other en vironmental factors. The effects of storage and advec tion on monthly rates of evaporation may be large; however, these often but not always tend to cancel each other in the course of 1 or more years.
During recent years the evaporation from several lakes has been determined by means of energy-budget studies (U.S. Geological Survey, 1954: Harbeck and others, 1958). Preliminary results of both energy- budget and water-budget studies of Salton Sea, con ducted during 1961-62, indicate that average annual evaporation from the sea is about 69 niches.
The Weather Bureau report also includes maps which show the variation in the coefficient required to convert Class A pan data to lake evaporation and which show the variation in the percentage of annual evapora tion that occurs during the summer.
The coefficient, which for many years was generally considered to be about 0.7 for all parts of the United States, varies from 0.60, or slightly less, in the south-

B16 WATER RESOURCES OF LOWER COLORADO RIVER-SALTON SEA AREA
western desert, to 0.81 in eastern Maine and to 0.79 on the Pacific coast. In the study area, values of 0.60, or less, to 0.65 apply to all the desert; values higher than 0.65 apply to the mountains at the western edge of the area.
Evaporation from May through October accounts for about 68 percent of the annual evaporation. There is little variation in this percentage within the study area, except in the higher mountains, where evaporation from May through October is probably near 75 or 80 percent of the annual evaporation.
EVAPOTBAHSPIBATIOIT
The conventional method of estimating evapotran- spiration in humid regions (subtracting mean annual runoff from mean annual precipitation) generally is applicable to the mountains in the study area. How ever, where alluvial deposits absorb appreciable quan tities of runoff from adjacent areas, the method does not apply without modification, because part of the absorbed runoff in addition to the absorbed precipita tion may be available for evapotranspiration. In some places evapotranspiration exceeds precipitation.
The areal variation in mean annual evapotranspi ration is indicated on plate 7. For mountainous areas the estimated evapotranspiration is the difference be tween precipitation and runoff, but for alluvial areas this difference is adjusted for the effects of absorbed runoff. As a result of this adjustment, the isograms for alluvial areas are displaced in the direction of lower precipitation from the position they would have as sumed if the conventional method had been applicable.
In areas that are irrigated or are occupied by native bottom-land vegetation, evapotranspiration has no relation to either precipitation or local runoff. Most of the water evaporated and transpired from these areas is from the Colorado Eiver. Eates of evapotranspira tion vary considerably, depending on type of vegetation and irrigation practices. Results of experiments on consumptive use of water and records of diversion to, and return flows from, irrigation units indicate that annual evapotranspiration from such areas generally
exceeds 36 inches and, in some areas, may exceed 60 inches.
The accuracy of the map is affected by the accuracy of both the precipitation and runoff maps and also by the estimated adjustments for absorbed runoff. How ever, the accuracy of the estimated evapotranspiration is most comparable to that of the isohyetal map, be cause precipitation is the dominant influence. For this reason, the evapotranspiration map is considered ap plicable to the standard period 1931-60.
REFERENCES
Harbeck, G. E., Jr., Kohler, M. A., Koberg, G. E., and others, 1958, Water-loss investigations Lake Meade studies: U.S. Geol. Survey Prof. Paper 298,97 p.
Linsley, R. K., Jr., Kohler, M. A., and Paulhus, J. L., 1949, Applied Hyrdology: New York, McGraw-Hill Book Co., 689 p.
Meyers, J. S., 1962, Evaporation from the 17 Western States: U.S. Geol. Survey Prof. Paper 272-D, p. 71-100.
Peck, E. L., and Brown, M. J., 1962, An approach to the develop ment of isohyetal maps for mountainous areas: Geophys. Research Jour., v. 67, Feb. 1962, p. 681-694.
Stafford, H. M., and Troxell, H. O., 1953, Coastal basins near Los Angeles, Calif., in U.S. Congress, House of Representa tives Committee on Interior and Insular Affairs, Physical and economic foundations of natural resources, v. 4: p. 21-50.
U.S. Bureau of Reclamation, 1960, Design of small dams, app. A: 609 p.
U.S. Dept. of Agriculture, Agricultural Research Service [no date], Monthly precipitation and runoff for small agricul tural watersheds in the United States.
U.S. Geological Survey, 1954, Water-loss investigations Lake Hefner studies, technical report: U.S. Geol. Survey Prof. Paper 269,156 p.
U.S. Soil Conservation Service [no date], Hydrology guide for use in watershed planning, in National Engineering Hand book, sec. 4, supp. A.
U.S. Weather Bureau, 1952, Maximum 24-hour precipitation in the United States: Tech. Paper 16, 284 p.
1959, Evaporation maps for the United States: Tech. Paper 37,13 p.
(issued monthly), Climatological data for the UnitedStates by sections.
Young, L. E., and Click, D. E., 1962, Floods from small drainage areas in California, October 1958 to September 1961: U.S. Geol. Survey open-file report, 150 p.
U.S. GOVERNMENT PRINTIN6 OFFICE. 1t«4


![The history of investigation of salt water inflows into ...€¦ · runoff (428 km3 ) + precipitation (237 km3) – evaporation (184 km3)] is dominated by runoff because precipitation](https://static.fdocuments.net/doc/165x107/5f7cf0ff5aeed811df507c76/the-history-of-investigation-of-salt-water-inflows-into-runoff-428-km3-.jpg)


