Pre-Salt Oil: Developing The Frontier - …thaiembassybrazil.com/pdf/Pre-Salt.pdf · 1 Pre-Salt...
19
1 Pre-Salt Oil: Developing The Frontier José Sergio Gabrielli de Azevedo CEO November, 16th 2011 JP Morgan
Transcript of Pre-Salt Oil: Developing The Frontier - …thaiembassybrazil.com/pdf/Pre-Salt.pdf · 1 Pre-Salt...

1
Pre-Salt Oil: Developing The Frontier
José Sergio Gabrielli de Azevedo CEO
November, 16th 2011 JP Morgan

2
This presentation may contain forward-looking statements. Such statements reflect only the expectations of the Company's management regarding the future conditions of the economy, the industry, the performance and financial results of the Company, among other factors. Such terms as "anticipate", "believe", "expect", "forecast", "intend", "plan", "project", "seek", "should", along with similar expressions, are used to identify such statements. These predictions evidently involve risks and uncertainties, whether foreseen or not by the Company. Consequently, these statements do not represent assurance of future results of the Company. Therefore, the Company's future results of operations may differ from current expectations, and readers must not base their expectations solely on the information presented herein. The Company is not obliged to update the presentation and forward-looking statements in light of new information or future developments. Amounts informed for the year 2011 and upcoming years are either estimates or targets.
The United States Securities and Exchange Commission permits oil and gas companies, in their filings with the SEC, to disclose proved reserves that a company has demonstrated by actual production or conclusive formation tests to be economically and legally viable under existing economic and operating conditions. We use certain terms in this presentation, such as discoveries, that the SEC’s guidelines strictly prohibit us from including in filings with the SEC.
Cautionary statement for U.S. investors:
DISCLAIMER

3
1 3 5 7 9 11 13 15 17 19 21 23 25 27 29 31 33 35 37 39 41 43 45 47 49 51 53 55 57 59 61 63
Oil
Pro
du
ctio
n
Pre-Salt GoM (USA) North Sea Campos Basin
Discovery: SS032 (1947) First oil: SS032 (1947)
Discovery: Q/13ª (1963) First Oil: Dan (1972)
Discovery: Garoupa (1974) First oil: Enchova (1977)
Discovery: Parati (2006) First oil: Tupi (2009)
Years after Discovery
PRE-SALT’S SHORT LAG BETWEEN DISCOVERY AND FIRST-OIL, AND FAST PROJECTED RAMP-UP

4
Ne
w R
igs
FPSO
s/
Def
init
ive
Syst
ems
Lula Pilot (AR)
FPSO
s/EW
Ts
SANTOS PRE-SALT MASTER PLAN’S HIGHLIGHTS FROM 2006 TO 2010 ...
2006 2008 2009 2010 ...
2007
Pre-Salt/Parati
Tupi (Lula)
Dis
cove
rie
s
Carioca
Bem-Te-Vi Guará
Iara
Caramba
Júpiter
Franco
Tupi (CSV) Guará (DP)
Infr
aest
ruct
ure
Iracema (cernambi)
2 2 1 3 6
5
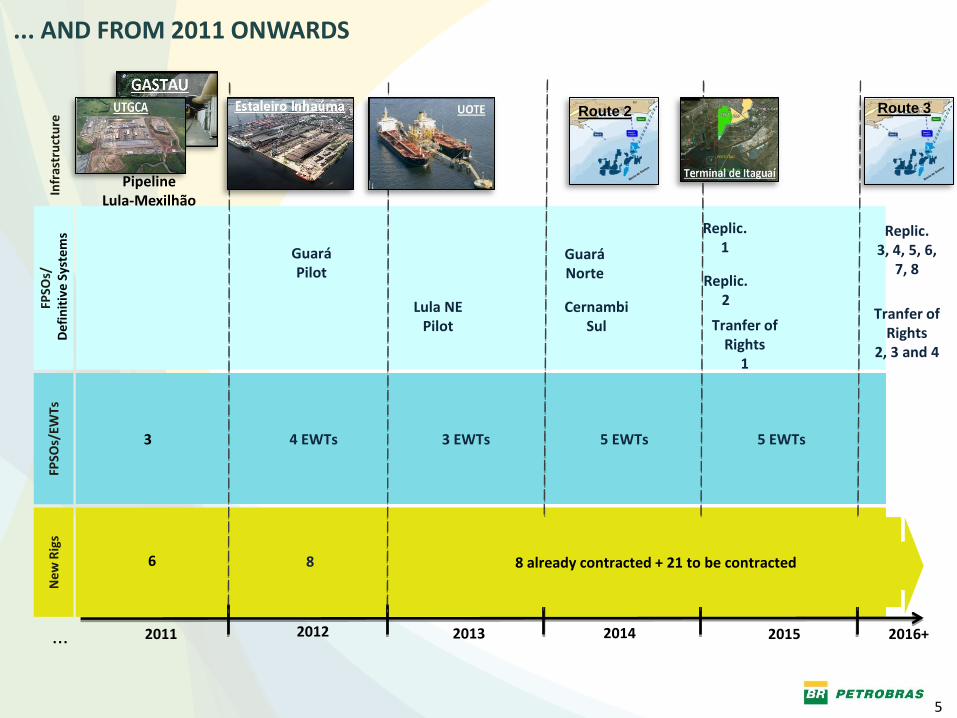
... AND FROM 2011 ONWARDS N
ew R
igs
FPSO
s/
Def
init
ive
Syst
ems
FPSO
s/EW
Ts
2011 2013 2014 2015 ... 2012
Guará Pilot
Lula NE Pilot
Guará Norte
Cernambi Sul
Replic. 3, 4, 5, 6,
7, 8
Infr
astr
uct
ure
4 EWTs 3 EWTs 5 EWTs 5 EWTs
Replic. 1
Replic. 2
Tranfer of Rights
1
8 6 8 already contracted + 21 to be contracted
Route 2
2016+
Route 3
3
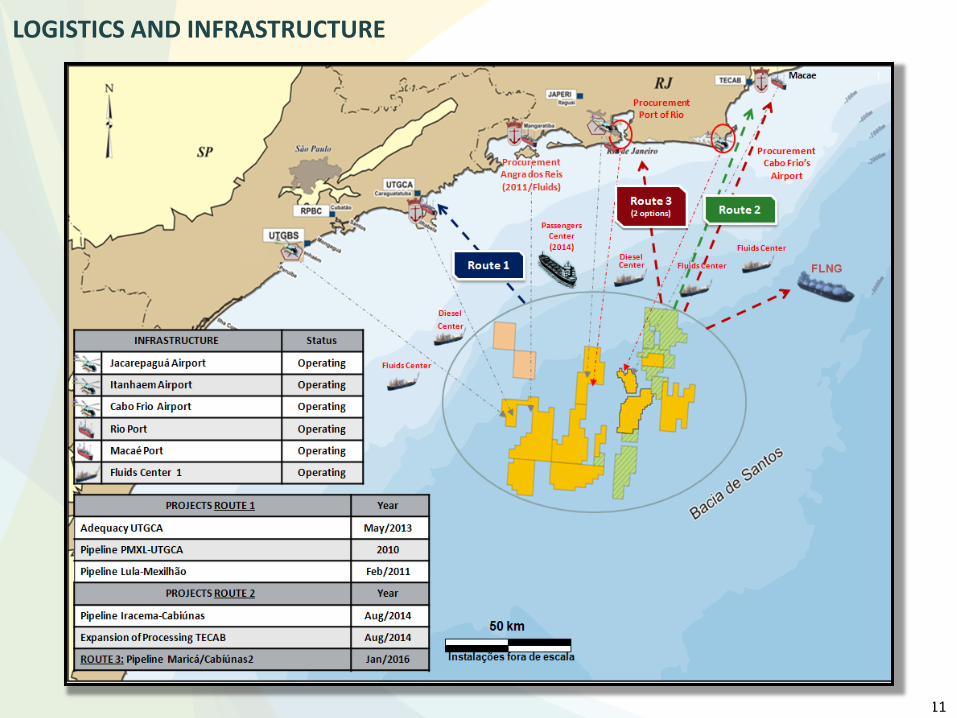
Pipeline Lula-Mexilhão
Tranfer of Rights
2, 3 and 4

6
MORE DRILLING RIGS WILL ENABLE A FASTER RAMP-UP OF THE NEW PLATFORMS
0
4
8
12
16
20
P-43 P-48 P-50 P-52 P-54 P-53 P-51 FPSO CAPIXABA
P-57
Mo
nth
s
To reach 50% of capacity
To reach 75% of capacity
2004 2006 2005 2007 2007 2008 2009 2010 2010
Forecast
Water Depth 2006 2008 2010 2011 2012 2013
Up to 1,000 meters 6 11 11
1,000 to 2,000 meters 19 19 21 +2 +1 +1
Over 2,000 meters 2 3 15 +10 +13 +1

7
33,3%
33,3%
33,3%
Gathering Completion + Drilling Units
20%
53%
27%
Gathering Completion + Drilling Units
PRE-SALT CAPEX DISTRIBUTION
DEEPWATER PROJECTS IN CAMPOS BASIN* CAPEX DISTRIBUTION
* Generic example, considering that these rates can change among the different existing projects in Campos Basin
Additional drilling and completion cost in the pre-salt compared with an generic deepwater project in Campos basin can be partially or fully offset by higher quality and quantity of oil expected in the pre-salt area.
CAPITAL COSTS: PRE-SALT vs. CAMPOS Similar equipment and processes: main difference is drilling and completion

8
8
PRE-SALT’S ECONOMICS: PRODUCTIVITY GAINS ...
100%
85%
75% 66%
2006/2007 2008 2009 2010
Average drilling time of the wells completed during the year
PN 2010-2014 PN 2010-2015 N
um
ber
of
wel
ls (
ph
ase
1a)
Drilling needs
- 15%

9
100% 81%
55%
0%
50%
100%
150%
200%
PLANSAL 2008 (2008-2030) PLANSAL 2009 (2008-2030) PLANSAL 2010 (2008-2030)
100% 118% 152%
0%
50%
100%
150%
200%
PLANSAL 2008 (2008-2030) PLANSAL 2009 (2008-2030) PLANSAL 2010 (2008-2030)
- 45%
- 32%
… RESULTING IN A HIGHER EXPECTED NPV
Investment
Net Present Value

10
42
55
75
95
0
20
40
60
80
100
2010 2011 2015 2020
Mexilhão – 15MM m3/day
Uruguá-Tambaú – 10 MM m3/day
Juruá – 2 MM m3/day
2015-20 Associated Natural Gas
from the Pre-salt
2011-15 Non-Associated Natural Gas
Natural gas production from
Pre-salt in Santos Basin to
surpass 20 MM m3/day
Associated Natural Gas
Increasing production in the
Campos and Santos Basins
Urucu
Coari
Manaus
Jurua
Lula
Urugua
PMLZ-1
Mexilhão
UGN RPBC
UTGCA
Million m3
NATURAL GAS PRODUCTION Start-up of Plangas and Pre-salt projects will substantially increase capacity
11
LOGISTICS AND INFRASTRUCTURE

12
E&P INVESTMENTS IN BRAZIL Pre-salt now more than half of development spending over the next five years
Pre-Salt US$ 53.4 Billion
Post-Salt US$ 64.3 Billion
57%
22% 21%
54%
12% 2%
21%
13% Tranfer of
Rights
Development Exploration Infrastructure and support

13
PETROBRAS’ TOTAL RESERVES AND POTENTIAL RECOVERABLE VOLUMES Continuous growth from deeper discoveries
Million boe
Potential increase
0
5.000
10.000
15.000
20.000
25.000
30.000
Onshore 0-300 m 300-1500 m > 1500 m Pre-salt's Recoverable Volume Transfer of Rights

14
1.855 1.971 2.004 2.100
321 317 334 435
618
1.120
111 132 144 141
180
246
99 96 93
96
125
142
2008 2009 2010 2011 2015 2020
Oil Production - Brazil Natural Gas Production - Brazil Oil Production - International Natural Gas Production - International
2,386 2,516
6,418
3,993
1,148 543
Pre-Salt
’00
0 b
oe
/day
2,772
845 Transfer of Rights
13
+10 Post-Salt Projects
+8 Pre-Salt Projects
+1 Transfer of Rights
+ 35 Systems
Added Capacity
Oil: 2,300,000 bpd
2,575
3,070
4,910
PRODUCTION TARGETS With broad access to new reserves, Petrobras can more than double its production in the next decade

15
2.004 2.100
3.070
0
500
1000
1500
2000
2500
3000
2010 2011 2012 2013 2014 2015
Th bpd
Lula Pilot FPSO BW Cidade Angra dos Reis
100.000 bpd
Cachalote and Baleia Franca
FPSO Capixaba 100.000 bpd
Marlim Sul module 3
SS P-56 100.000 bpd
Jubarte FPSO P-57
180.000 bpd
Baleia Azul FPSO Cidade de
Anchieta 100.000 bpd
(FPSO Espadarte reallocation)
Roncador Módule 4 FPSO P-62
180.000 bpd
Roncador module 3
SS P-55 180.000 bpd
Papa-Terra TLWP P-61 &
FPSO P-63 150.000 bpd
Guará (North) FPSO
150.000 bpd
Parque das Baleias
FPSO P-58 180.000 bpd
Tiro/Sidon FPSO Cidade de
Itajaí 80.000 bpd
Tiro Pilot SS-11
Atlantic Zephir 30.000 bpd
Mexilhão Jaqueta
HG
EWT Guará FPSO Dynamic
Producer 30.000 bpd
ESP/Marimbá FPSO
40.000 bpd
Uruguá FPSO Cidade de
Santos 35.000 bpd
Aruanã FPSO
100.000 bpd
Guará Pilot 2 FPSO Cidade de
São Paulo 120.000 bpd
Lula NE FPSO Cidade de
Paraty 120.000 bpd
Maromba FPSO
100.000 bpd Siri
Jaqueta e FPSO 50.000 bpd
Cernambi South FPSO
150.000 bpd
FPSO P-67 Replicant 2 150.000 bpd BMS-9 our11
4 EWTs Pre-salt
FPSO P-66 Replicant 1 150.000 bpd BMS-9 or 11
Baleia Azul FPSO
60.000 bpd
Juruá GNA
Tambaú FPSO Cidade de
Santos NG
EWTs Lula NE e Cernambi
FPSO BW Cidade São Vicente 30.000 bpd
EWT Carioca FPSO Dynamic
Producer 30.000 bpd
Franco 1 Transfer of
Rights FPSO
150.000 bpd
3 EWTs Pre-salt
5 EWTs Pre-salt
5 EWTs Pre-salt
MAIN E&P PROJECTS Large projects sustain production increases
EWTs
Pre-Salt and Transfer of Rights
Natural Gas
Post-Salt

16
VARREDURA PROJECT
Technological development and exploratory optimization in existing concessions
Descobertas do Pr é - sal na Bacia de Campos 2009/10 (VARREDURA)
Discoveries in Pre-salt Campos Basin 2009/10 (Varredura)
Recoverable volumes discovered:
Post-salt: 1,105 MM boe (Marimbá, Marlim Sul and Pampo)
Pre-salt: 1,130 MM boe* (Barracuda, Caratinga, Marlim, Marlim Leste, Albacora and Albacora Leste)
*No volumes have been announced for the Marlim Leste and Albacora Leste discoveries
Wells productivity close to 15,000 bpd
67 exploratory wells will be drilled between 2011 and 2015 in production
areas in Campos basin

17
OIL/WATER SUBSEA SEPARATION
- Resolves limitations from growing water production
- Separates water and oil under the sea, reinjecting water and relieving the size of the surface equipment on the platform
- Field: Marlim (Nov/2011)
RAW WATER INJECTION
- Increases production in existing systems
- 3 subsea systems for pumping raw water (with little treatment) to pressurize the reservoir, increasing recovery factor without increasing surface systems. Pioneer in the world in such water depth
- Field: Albacora (Dec/2011)
CUTTING-EDGE TECHNOLOGIES

18
NEW VESSELS AND EQUIPMENTS Resources required for production growth
Critical Resources Current Situation
(Dec/10)
Delivery Plan (to be contracted) Accumulated Value
By 2013 By 2015 By 2020
Drilling Rigs Water Depth Above 2.000 m 15 39 37 (1) 65 (2)
Supply and Special Vessel 287 423 479 568
Production Platforms (SS and FPSO) 44 54 61 94
Others (Jacket and TLWP) 78 80 81 83
(1) The contracts for two rigs reallocated from international operations expire in 2015 (2) Long-term demand will be adjusted according to new assessments
Water Depth 2006 2008 2010
Up to 1,000 meters 6 11 11
1,000 to 2,000 meters 19 19 21
Over 2,000 meters 2 3 15
2011 2012 2013
+2 +1 +1
+10 +13 +1
Supply Vessel Drilling Rig FPSO
DRILLING RIGS UNDER CONTRACT
19
19