PRE & PRIMARY EDUCATION STATS BRIEF - 2014 Pre... · 4 PRE & PRIMARY EDUCATION STATS BRIEF -2014...
35
PRE & PRIMARY EDUCATION STATS BRIEF-2014 1 NO 2016/01 PRE & PRIMARY EDUCATION STATS BRIEF - STATISTICS BOTSWANA 2014
-
Upload
hoangnguyet -
Category
Documents
-
view
226 -
download
1
Transcript of PRE & PRIMARY EDUCATION STATS BRIEF - 2014 Pre... · 4 PRE & PRIMARY EDUCATION STATS BRIEF -2014...

PRE & PRIMARY EDUCATION STATS BRIEF-2014 1
NO 2016/01
PRE & PRIMARY EDUCATION STATS BRIEF -
STATISTICS BOTSWANA
2014

2 PRE & PRIMARY EDUCATION STATS BRIEF -2014
Published by
STATISTICS BOTSWANAPrivate Bag 0024, Gaborone
Fax: 3952201E-mail: [email protected]
December 2016
Copyright @ Statistics Botswana 2016
COPYRIGHT RESERVEDExtracts may be published if source is duly acknowledged

PRE & PRIMARY EDUCATION STATS BRIEF-2014 3
PRE & PRIMARY EDUCATION STATS BRIEF - 2014

4 PRE & PRIMARY EDUCATION STATS BRIEF -2014
PREFACE
This publication gives highlights on pre-primary and primary education statistics derived from the data collected from schools through the 2014 annual school census.
Education has become an indispensable tool for measuring human and societal development over the years. The production of timely and reliable education statistics is therefore important for monitoring and evaluating the impact of investment put into the development of education by government, the private sector, Non-Government Organizations and other stakeholders.
The statistics provided in this report will assist in monitoring the existing education policies, inform planning and decision making and serve as evidence on the country’s progress towards meeting national and international obligations on basic education.
We sincerely thank all the school heads and regional education officers who provided the required data for the production of this brief.
___________________Anna. N. MajelantleStatistician GeneralDecember 2016

PRE & PRIMARY EDUCATION STATS BRIEF-2014 5
1. INTRODUCTION
This chapter presents information on collection and publication of education statistics and levels of education.
The data used in this report is sourced from the 2014 annual school census conducted in educational institutions in Botswana. The annual school census is conducted by Education Management Information Systems (EMIS) unit in the Ministry of Education and Skills Development (MoESD). The data is collected from Government and privately owned pre-primary and primary schools.
It should be noted that this publication mainly covers data for 2014. However, some data for previous years have been used for comparative analysis.
The statistics provided is on school ownership and number of schools, enrolments, drop outs, re-entrants, teachers and their qualifications. Indicators reported include; Enrolment rates, pupil/teacher ratio, progression rates, among others.
2. PRE-PRIMARY EDUCATION
Provision of Early Childhood Care and Education (ECCE) program to all children is essential as a foundation for primary education. Its benefits to a child among others include helping to boost cognitive and motor development as well as enhancing social skills. A pre-school education helps build a foundation of learning that will follow the child into their school years.
Pre-primary education in Botswana is mainly coordinated by district councils and provided by individuals, communities, private sector, Non-Government Organizations and Councils. In 2012 Government introduced a pilot study of Pre Primary education in Government primary schools. Revised National Policy on Education (RNPE) of 1994 emphasized the need to provide enabling environment for pre-primary education and increasing access to all children before enrolling at primary.
The pre-primary also allows the child lots of interaction with peers which enhance their skills to share, negotiate and listening skills amongst others.

6 PRE & PRIMARY EDUCATION STATS BRIEF -2014
Table 2.1: Number of Pre-Primary Schools 2014Ownership No. of Schools Percentage
Council 18 2.8
Community 56 8.7
Church 49 7.6
Private 444 68.8
NGO 49 7.6
Staff Facility 3 0.5
Other 3 0.5
Government 23 3.6
Total 645 100
2.1. Number of Pre-Primary Schools and Pupils by School Ownership
The pre- primary data was collected from 645 pre-primary schools. Out of the total pre-schools, 444 (68.8%) are privately owned, 56 (8.9%) belongs to the community, 49 (7.6%) are owned by churches, 49 (7.6%) owned by NGOs, 18 (1.9%) belonged to council while three were owned by staff facilities. Figure 1: Percentage of Pre-Primary Schools by School Ownership-2014
The number of pre-primary schools fluctuates over the years as a result of closure of some schools especially those that operated without licenses. This contributed to discrepancy on the reported statistics for pre-primary education hence trend data tend to be inconsistent at times.
Table 2.2 shows that majority (87.6 percent) of the pre-primary schools operated full day. A further look at the urban and rural districts shows that there was no significant difference between the predominantly rural districts and the urban districts.
Council 2.8
Community8.7
Church 7.6
Private 68.8
NGO, 7.6
Staff Facility 0.5 Other 0.5 Govt 3.6

PRE & PRIMARY EDUCATION STATS BRIEF-2014 7
Table 2.2: Number of Pre-Primary Schools by District and Terms of Operation - 2014District Half Day Full Day Total
Gaborone 13 81 94
Francistown 6 50 56
Lobatse 4 14 18
Selebi Phikwe 4 21 25
Orapa 1 2 3
Jwaneng 1 12 13
Sowa 1 2 3
Southren 7 35 42
Borolong 3 13 16
South East 3 34 37
Kweneng 3 75 78
Kgatleng 4 30 34
Serowe/Palapye 2 38 40
Mahalapye 3 25 28
Bobirwa - 12 12
Boteti - 4 4
Tutume 4 25 29
North East 6 22 28
Maun East 5 27 32
Maun West 2 9 11
Chobe 3 5 8
Gantsi 1 13 14
Kgalagadi South - 4 4
Kgalagadi North 4 12 16
Total 80 565 645
Table 2.3: Number of Pre-Primary Schools and Pupils by sex and School Ownership – 2014
Ownership No. of Schools Male Female Total % Male % FemaleTotal
Percentage
Council 18 408 441 849 48.1 51.9 2.5
Community 56 1,131 1,239 2,370 47.7 52.3 7.1
Church 49 1,415 1,490 2,905 48.7 51.3 8.7
Private 444 11,834 11,779 23,613 50.1 49.9 70.6
NGO 49 1,189 1,171 2,360 50.4 49.6 7.1
Staff Facility 3 60 50 110 54.5 45.5 0.3
Other 3 54 55 109 49.5 50.5 0.3
Government 23 524 585 1,109 47.2 52.8 3.3
Total 645 16,615 16,810 33,425 49.7 50.3 100
Table 2.3 shows that enrolment of male pupils in pre-primary education in 2014 constituted 49.7 percent while female enrolment stood at 50.3 percent. The Gender Parity Index (GPI) for participation in pre-primary education is 1.01% indicating almost equal access to pre-primary education for both boys and girls.

8 PRE & PRIMARY EDUCATION STATS BRIEF -2014
Figure 2 shows the proportion of pre-primary enrolment by school ownership. Private schools accounted for 70.6 percent of total per-primary enrolment, community schools had 7.1 percent, 8.7 percent in schools owned by churches, 7.1 percent in NGO schools, and 2.5 percent in schools owned by councils while government enrolled 3.3 percent of the enrolment.
Table 2.4: Pre-Primary Enrolment by School Ownership, Age and Sex – 2014AGE
Ownership Sex < 1 1 2 3 4 5 6 6 < Total
Council Male - - 19 72 117 164 35 1 408Female - - 21 61 120 204 35 - 441
Community Male 3 1 18 267 344 411 83 4 1,131Female 1 5 35 267 411 439 74 7 1,239
Church Male 1 1 60 285 460 491 117 - 1,415Female - - 57 345 464 497 126 1 1,490
Private Male 17 115 1,073 2,711 3,456 3,654 764 44 11,834Female 23 79 1,050 2,855 3,461 3,565 654 92 11,779
NGO Male - 1 53 231 351 408 121 24 1,189Female 1 1 40 243 351 390 125 20 1,171
Institutional Male - - - 17 26 12 5 - 60Female - - 2 10 25 10 3 - 50
Other Male - - - 6 17 27 4 - 54Female - - 1 13 17 22 2 - 55
Govt Male - - 1 1 60 288 174 - 524Female - - - 3 58 313 210 1 585
Total Males 21 118 1,224 3,590 4,831 5,455 1,303 73 16,615Total Females 25 85 1,206 3,797 4,907 5,440 1,229 121 16,810Total 46 203 2,430 7,387 9,738 10,895 2,532 194 33,425
Figure 2: Percentage of Pre-Primary Enrolment by School Ownership-2014
Council, 2.5
Community, 7 .1
Church, 8.7
Private, 70.6
NGO, 7.1
Staff Facility, 0.3Other, 0.3 Govt, 3.3

PRE & PRIMARY EDUCATION STATS BRIEF-2014 9
Table 2.4 shows that the highest number (28,020 pupils) of pre-primary attendants was aged between three and five years with the highest enrolment found among children aged 5 years with an enrolment of 10,895 (32.6%) pupils followed by those age 4 years with 9,738 (29.1%) pupils. It should be noted that there were 2,726 pre-primary pupils aged six and above, accounting for 8.2 percent, indicating that a reasonable percentage of the official school going age delay starting primary school.
2.2 PRE-PRIMARY ATTENDANCE BY REGION
Majority of pre-primary school attendants were found in the South East with 9,268 followed by Central region with 7,745. An interesting feature is that majority of those who were more than six years were found in the Central region amounting to 84 followed by the North East with 72. In all regions most pupils were aged five.
Table 2.5: Pre-Primary Enrolment by Region, Sex and Age -2014
AGE
REGION SEX <1 1 2 3 4 5 6 6< Total
South East Male 4 57 604 1,135 1,262 1,299 229 38 4,628
Female 7 41 602 1,167 1,261 1,274 254 34 4,640
North East Male 1 5 74 343 525 570 117 17 1,652
Female - 2 66 367 496 556 90 8 1,585
South Male - 1 107 404 538 709 245 2 2,006
Female - - 117 401 568 795 262 2 2,145
kweneng Male - 15 208 476 663 658 202 3 2,225
Female - 9 175 427 625 656 156 1 2,049
Kgatleng Male - - 7 127 196 274 112 1 717
Female - - 10 170 214 283 112 1 790
North West Male 6 15 52 172 265 288 86 - 884
Female 9 10 51 215 287 291 80 1 944
Chobe Male - - 7 22 60 85 18 - 192
Female - - 3 21 57 66 3 - 150
Gantsi Male 2 5 15 50 87 88 31 - 278
Female 5 3 19 55 91 99 25 1 298
Kgalegadi Male - - 7 78 85 63 16 1 250
Female - - 12 63 87 71 14 - 247
Central Male 8 20 143 783 1,150 1,421 247 11 3,783
Female 4 20 151 911 1,221 1,349 233 73 3,962
Total Males 21 118 1,224 3,590 4,831 5,455 1,303 73 16,615
Total Females 25 85 1,206 3,797 4,907 5,440 1,229 121 16,810
Grand Total 46 203 2,430 7,387 9,738 10,895 2,532 194 33,425

10 PRE & PRIMARY EDUCATION STATS BRIEF -2014
2.3 PROVISION OF SPECIAL EDUCATION IN PRE-SCHOOL
Special education instruction is specifically designed to meet the educational and developmental needs of children with disabilities, or those who are experiencing developmental delays. The early detection of children’s special needs enables parents to contact the appropriate agency to have the child screened and evaluated to determine if there is an underlying problem or delay that might need to be addressed. Such screenings should cover a range of skill areas—vision and hearing, gross and fine motor skills, speech and language use, social and emotional behavior, and many more.
Table 2.6:Pre-Primary Enrolment with Special Education Needs by Region – 2014
Region Visual Physical Hearing SpeechMental
RetardationMultiple
Disability Intellectual Other Total
South East 1 5 - 25 - 3 1 10 45
North East 1 2 - 10 1 4 2 1 21
South 4 2 2 13 2 4 - 3 30
Kweneng - - - 14 - 3 2 1 20
Kgatleng 3 1 - 7 - 1 2 - 14
North West 1 3 - 3 - 1 - - 8
Chobe - - - - - - - - 0
Gantsi - - - 1 - 1 - - 2
Kgalagadi 1 - - 1 - - - - 2
Central 4 6 2 24 - 7 4 2 49
Total 15 19 4 98 3 24 11 17 191
Table 2.6 shows that there were 191 children with special education needs enrolled in pre-primary school across the country in 2014. Out of these, 49 were in Central region, followed by 45 in South East region. The number of pupils with speech impairment was highest at 98 followed by those with multiple disabilities, physical and other impairment with19 and 17 pupils respectively.
Figure 3: Pre-Primary Enrolment with Impairments as a Percentage of Total Enrolment with Special Education Needs– 2014
!
7.99.9
2.1
51.3
1.6
12.6
5.88.9
0.0
10.0
20.0
30.0
40.0
50.0
60.0
Visual Physical HearingS peechM ental R Multiple DI nterlectualO ther

PRE & PRIMARY EDUCATION STATS BRIEF-2014 11
Figure 3 shows that 51.3 percent of pre-primary pupils with special education needs had speech impairment, 12.6 percent had multiple disability while students with physical disability and other impairments not specified constituting 9.6 percent each. Children with mental retardation constituted the lowest percentage of pre-primary children with disability.
2.4. AGE SPECIFIC ENROLMENT RATIO
Table 2.7: Age Specific Enrolment Ratio (ASER) for Pre-Primary -2014Single Age 2013 Population Pre-Primary Enrolment ASER (%)
≤1 102,228 249 0.2
2 54,088 2,430 4.5
3 49,694 7,387 14.9
4 47,595 9,738 20.5
5 46,206 10,895 23.6
6 45,129 2,532 0.6
7 44,965 194 0.4
****2013 Population Estimates are proxies derived using the 2011 Housing and Population Census Data
Table 2.7 shows that Age Specific Enrolment Ratio (ASER) was highest for the 5 year olds at 23.6 percent, followed by the 4 year olds at 20.5 percent. ASER was less than one percent for pupils aged one year and below, and those aged 6 and 7 years, respectively. This shows that majority of pre-school pupils were aged between 4 and 5 years suggesting that parents prefer to enroll children a year or two before they are due for primary school enrolment.
Table 2.8: Pre-Primary Enrolment Ratios by Age and Year – 2012-2014Year Population
3-5 yearsTotal Enrolment Enrolment
3-5 Years3-5 Years
GER (%)3-5 Years
NER (%)
2012 119,239 23,650 19,847 19.8 16.6
2013 139,704 29,150 24,688 20.9 17.7
2014 143,495 33,425 28,020 23.3 19.5
2012 Population is drawn from CSO (2001). Population Projections for Botswana: 2001-2031 while the 2013 & 2014 Population Estimates are proxies derived using the 2011 Population Projections
Enrolment at pre-school continues to increase, perhaps suggesting that parents are increasingly acknowledging the value of pre-school. Table 2.8 shows that the national Gross Enrolment Rate (GER) for population 3-5 years in pre-primary schools was 20.9 percent in 2013 and 23.3 percent in 2014. There was an increase of 2.4 percentage points in GER between 2013 and 2014. On the other hand, national Net Enrolment Rate (NER) for population 3-5 years in pre-primary school was 17.7 percent in 2013 and 19.5 percent in 2014, showing an increase of 1.8 percentage points in NER (3-5) between the two years.
2.5. PRE- PRIMARY TEACHERS QUALIFICATION
Despite the increasing value attached to pre-school education and its recognition by the revised National Education Policy, a significant proportion of teachers at pre-school level remain untrained, which is likely to compromise the quality of education at that level.
Research has linked early learning and development to the educational qualifications of teachers. The most effective preschool teachers – those with at least a four-year college degree and specialized training in early childhood – have more responsive interactions with children, provide richer language and cognitive experiences, and are less authoritarian. High-quality preschool education depends on effective, high-quality teachers (W. Steven Barnett NIEER Policy Brief (Issue 2, revised December 2004).

12 PRE & PRIMARY EDUCATION STATS BRIEF -2014
Table 2.9: Number of Pre-primary School Teachers by Qualification, School ownership and Sex -20142013 Pre-Primary Teachers 2014 Pre-Primary Teachers
OwnershipTrained
Male Female Totaluntrained
Male Female TotalTrained
Male Female Total untrained Male Female Total
Council - 36 36 1 9 10 - 51 51 - 11 11
Community 17 1,022 1,039 13 850 863 3 68 71 4 86 90
Church 1 98 99 2 84 86 2 115 117 1 88 89
Private 4 86 90 1 80 81 16 1,162 1,178 17 1,037 1,054
NGO 1 103 104 - 76 76 3 90 93 5 83 88
Institutional - 4 4 1 3 4 - 7 7 1 1 2
Other 3 - 3 - 2 2 - 2 2 - 5 5
Govt - - 0 - - - 5 66 71 - 5 5
Total 26 1,349 1,375 18 1,104 1,122 29 1,561 1,590 28 1,316 1,344
Table 2.9 shows that majority of the teachers are females. It further shows that there were 44 male and 2,453 female pre-primary teachers in 2013 compared to 57 male and 2,905 female in 2014. Of all teachers in 2014, 1,590 were trained constituting 54.2 percent while 45.8 percent (1,344 teachers) were untrained.
2.6 NATIONALITY AND QUALIFICATION OF PRESCHOOL TEACHERSTable 2.10 shows that preschool teaching is dominated by females who constituted 98.1 percent of the teaching staff. An interesting feature is that majority of preschool teachers are Batswana. Out of a total 2,934 teachers, 2,552 or 87 percent were Batswana while the remainder were foreigners who were dominated by females.
Table 2.10: - Number of Pre-Primary School Teachers by Citizenship, District and Sex -2014Batswana Non - Batswana Total Teachers
District Male Female Total Male Female Total Male Female Total
Gaborone 11 578 589 2 108 110 13 686 699
Francistown 5 167 172 1 33 34 6 200 206
Lobatse 3 62 65 - 6 6 3 68 71
Selibe Phikwe - 141 141 - 11 11 - 152 152
Orapa - 51 51 - 4 4 - 55 55
Jwaneng - 75 75 - 6 6 - 81 81
Sowa - 10 10 1 - 1 1 10 11
Southren 4 136 140 1 19 20 5 155 160
Borolong 1 32 33 - 5 5 1 37 38
South East 7 170 177 1 33 34 8 203 211
Kweneng 1 298 299 1 48 49 2 346 348
Kgatleng 1 132 133 1 11 12 2 143 145
Serowe/Palapye - 147 147 - 11 11 - 158 158
Mahalapye 3 97 100 - 9 9 3 106 109
Bobirwa 2 36 38 - - 0 2 36 38
Boteti - 19 19 - - 0 - 19 19
Tutume 3 75 78 - 16 16 3 91 94
North East - 57 57 - 8 8 - 65 65
Maun East 3 108 111 2 24 26 5 132 137
Maun West - 25 25 1 3 4 1 28 29
Chobe 2 13 15 - 7 7 2 20 22
Gantsi - 36 36 - 5 5 - 41 41
Kgalagadi South - 11 11 - 3 3 - 14 14
Kgalagadi North - 30 30 - 1 1 - 31 31
Total 46 2,506 2,552 11 371 382 57 2,877 2,934

PRE & PRIMARY EDUCATION STATS BRIEF-2014 13
Table 2.11: Number of Pre-Primary Teachers by Qualification, Sex and Citizenship – 2014
Citizenship Sex Certificate Diploma Degree Master otherTotal
Qualified Unqualified Total
Citizens Male 10 3 5 0 1 19 27 46
Female 958 219 39 9 4 1,229 1,277 2,506
Total 968 222 44 9 5 1,248 1,304 2,552
Non-Citizens Male 1 4 2 2 1 10 1 11
Female 137 158 28 9 0 332 39 371
Total 138 162 30 11 1 342 40 382
All Teachers Male 11 7 7 2 2 29 28 57
Female 1,095 377 67 18 4 1,561 1,316 2,877
Total 1,106 384 74 20 6 1,590 1,344 2,934
Note: Cert-certificate, Dip- Diploma, Deg- Degree, Mas- Masters, Unq- Unqualified
Table 2.11 shows that a total of 2,552 teachers were citizens while 382 were non-citizens. Further, citizens constituted the bulk of the unqualified teachers. More than half or 51.1 percent of citizen teachers were unqualified compared to only 10.5 percent for foreign teachers. Most of the qualified teachers were certificate holders with a sizeable number holding a diploma certificate.
Figure 4: Percentage of Pre-Primary Teachers by Qualification – 2014
Figure 4 indicates that about 45 percent of pre-primary teachers are untrained, 39 percent are certificate holders, and only 13 percent had diploma. The degree holders constituted 2.5 percent while master’s degree and other unclassified qualifications constituted 0.4 and 0.1 percent respectively.
3. PRIMARY EDUCATION
The government of Botswana considers education as one of the priority areas for development. Education at primary is offered for free to all which has been in place over decades with minimal household contribution; basically through contribution towards Parents Teachers’ Association (PTA) levy. One of the objectives of free education amongst others is to increase access to primary education.
Certificate39%
Diploma13%
Degree2.5%Masters
0.4%
Other0.1%
unqualified 44.9%

14 PRE & PRIMARY EDUCATION STATS BRIEF -2014
This section gives a summary of the latest available statistics on primary education from the 2014 primary school annual census. The analysis among others includes number of schools by ownership, enrolment rates, school dropout rates and teacher qualifications and pupil/ teacher ratio to mention a few.
3.1. Primary Schools by School Ownership
Table 3.1: School Ownership by Region -2014Region Public % Private % Total %
South East 51 6.8 19 28.8 70 8.5
North East 63 8.3 6 9.1 69 8.4
South 123 16.3 6 9.1 129 15.7
Kweneng 91 0.1 11 16.7 102 12.4
Kgatleng 37 4.9 2 3 39 4.8
North West 67 8.9 5 7.6 72 8.8
Chobe 10 1.3 1 1.5 11 1.3
Gantsi 22 2.9 1 1.5 23 2.8
Kgalagadi 42 5.6 0 0 42 5.1
Central 249 33 15 22.7 264 32.2
Total 755 100 66 100 821 100
Table 3.1 shows that there were 821 registered primary schools country wide in 2014 of which 755 (92.0 percent) were government owned schools and 66 (8.0 percent) were privately owned. This is an indication that government is the main provider of primary education. There has been an increase of 0.9 percent on the number of schools from 814 schools in 2012 to 821 schools in 2013. The total number of schools remained unchanged, however there was an increase in number of government owned primary schools and a decrease of the same number of privately owned primary schools.
Figure 3.1: Proportion of Primary Schools by School Ownership per region-2014
Figure 3.1 shows that public schools constituted above 90 percent across all the regions except for South East and Kweneng where public schools constituted 72.9 and 89.2 percent respectively. South East region had the highest number of private schools constituting 24.2 percent of all private primary schools in the country. Kgalagadi region is the only region with no private schools.
0.010.020.030.040.050.060.070.080.090.0
100.0
72.9
91.3 95.389.2
94.9 93.1 90.995.7 100.0
94.3
% O
F SC
HOO
LS
Public % Private %

PRE & PRIMARY EDUCATION STATS BRIEF-2014 15
3.2 PRIMARY SCHOOL ENROLMENT
Table 3.2(a) Primary School Enrolment including SPED and Pre Primary per Region by School Ownership and Sex-2014
Region
GOVT GOVT AIDED PRIVATE Total
TotalBoys Girls Total Boys Girls Total Boys Girls Total Boys Girls
South East 14,273 13,981 28,254 668 624 1292 6054 6,057 12,111 20,995 20,662 41,657
North East 12,708 11,890 24,598 - - 0 828 840 1,668 13,536 12,730 26,266
Southren 21,046 19,935 40,981 318 316 634 946 992 1,938 22,310 21,243 43,553
Kweneng 23,083 22,025 45,108 - - 0 2,189 2,161 4,350 25,272 24,186 49,458
Kgatleng 7,281 6,929 14,210 - - 0 382 308 690 7,663 7,237 14,900
North West 15,289 14,476 29,765 - - 0 625 557 1,182 15,914 15,033 30,947
Chobe 1,865 1,836 3,701 - - 0 - - 0 1,865 1,836 3,701
Gantsi 3,997 3,878 7,875 - - 0 34 25 59 4,031 3,903 7,934
Kgalagadi 5,113 4,765 9,878 - - 0 - - 0 5,113 4,765 9,878
Central 57,989 54,390 112,379 1,249 1,201 2,450 2,197 2,341 4,538 61,435 57,932 119,367
TOTAL 162,644 154,105 316,749 2,235 2,141 4,376 13,255 13,281 26,536 178,134 169,527 347,661
***Includes Pre Primary Enrolment in primary schools establishments
Table 3.2(b): Enrolment including SPED per Region by School Ownership and Sex-2014
Region
Government Govt Aided Private TOTAL
Boys Girls Total Boys Girls Total Boys Girls Total Boys Girls Total
South East 13,967 13,633 27,600 654 608 1,262 ,5380 5,425 10,805 20,001 19,666 39,667
North East 12,572 11,747 24,319 - - 0 744 763 1,507 13,316 12,510 25,826
Southern 20,689 19,534 40,223 314 310 624 879 918 1,797 21,882 20,762 42,644
Kweneng 22,992 21,903 44,895 - - 0 2,015 1,960 3,975 25,007 23,863 48,870
Kgatleng 7,126 6,766 13,892 - - 0 373 302 675 7,499 7,068 14,567
North West 15,190 14,398 29,588 - - 0 590 522 1,112 15,780 14,920 30,700
Chobe 1,801 1,773 3,574 - - 0 - - 0 1,801 1,773 3,574
Gantsi 3,948 3,822 7,770 - - 0 34 25 59 3,982 3,847 7,829
Kgalagadi 4,800 4,443 9,243 - - 0 - - 0 4,800 4,443 9,243
Central 57,461 53,857 111,318 1,234 1,186 2420 1,952 2,090 4,042 60,647 57,133 117,780
TOTAL 160,546 151,876 312,422 2,202 2,104 4,306 11,967 12,005 23,972 174,715 165,985 340,700
*** Excludes Pre Primary Enrolment in primary schools establishments
Table 3.2 shows that the total enrolment in all primary schools stood at 340,700 in 2014. Government schools enrolled 91.7 percent, followed by private schools with an enrolment of 7.0 while government aided enrolment accounted for only 1.3 percent. There was an increase of 0.2 percent on enrolment between 2013 and 2014 from 340,065 to 340,700. Regions which enrolled high proportions of pupils were Central region accounting for 34.6 percent followed by Kweneng region with 14.3 percent and Southern region with 12.5 percent.

16 PRE & PRIMARY EDUCATION STATS BRIEF -2014
Table 3.3: Enrolment by Boarding Status, standard and Sex -2014 Sex Standard
1 2 3 4 5 6 7 SPED Total %
Boarders Boys 449 405 399 346 322 299 269 - 2,489
Girls 447 346 380 320 333 320 275 - 2,421
Total 896 751 779 666 655 619 544 - 4,910 1.4
Non boarders Boys 27,472 26,967 25,792 24,703 22,806 22,296 21,461 732 172,229
Girls 25,008 24,991 24,632 23,695 22,108 21,663 20,943 521 163,561
Total 52,480 51,958 50,424 48,398 44,914 43,959 42,404 1,253 335,790 98.6
All schools Boys 27,921 27,372 26,191 25,049 23,128 22,595 21,730 732 174,718
Girls 25,455 25,337 25,012 24,015 22,441 21,983 21,218 521 165,982
Total 53,376 52,709 51,203 49,064 45,569 44,578 42,948 1,253 340,700 100

PRE & PRIMARY EDUCATION STATS BRIEF-2014 17
Table 3.3 shows that most of primary school pupils are non-boarders constituting 98.6 percent of the total enrolment while boarders constituted only1.4 percent. Boarding school provides an opportunity for students to learn life skills while having access to a high-quality education. In Botswana, this dispensation at primary school is provided for learners in the remote areas where they have no or limited accommodation to access schooling.
Table 3.4(a): Enrolment by Citizen, Sex and Standard -2014Citizenship Sex Standard Total
Pre Primary 1 2 3 4 5 6 7 SPED
Citizens Boys 3161 27428 26849 25674 24576 22692 22154 21394 720 174648
Girls 3262 24965 24881 24555 23590 22037 21564 20845 516 166215
Total 6423 52393 51730 50229 48166 44729 43718 42239 1236 340863
Non-Citizens Boys 257 493 523 517 470 436 441 336 12 3485
Girls 281 490 456 457 428 404 419 373 5 3313
Total 538 983 979 974 898 840 860 709 17 6798
Total Boys 3418 27921 27372 26191 25046 23128 22595 21730 732 178133
Girls 3543 25455 25337 25012 24018 22441 21983 21218 521 169528
Total 6961 53376 52709 51203 49064 45569 44578 42948 1253 347661
*** Includes Pre Primary Enrolment in primary schools establishment Table 3.4(b): Enrolment by Citizen, Sex and Standard -2014
Table 3.4 shows that most of primary school pupils are citizens, accounting for 98.2 percent of the total enrolment.

18 PRE & PRIMARY EDUCATION STATS BRIEF -2014
Primary School enrolment has been increasing over the past eight years.The Enrolment increased from 328,330 in 2007 to 340,700 in 2014..
Table 3.5 : Enrolment Trends-2007-2014Year Sex STD 1 STD 2 STD3 STD 4 STD 5 STD 6 STD 7 SPED Total
2007 Boys 27,265 24,963 24,458 24,730 23,008 22,088 20,475 409 167,396
Girls 25,155 23,970 23,259 22,733 22,412 22,025 21,077 303 160,934
Total 52,420 48,933 47,717 47,463 45,420 44,113 41,552 712 328,330
2008 Boys 26,563 24,743 24,899 24,915 22,838 22,399 20,701 550 167,608
Girls 24,191 23,654 23,702 23,525 21,911 22,046 21,146 393 160,568
Total 50,754 48,397 48,601 48,440 44,749 44,445 41,847 943 328,176
2009 Boys 27,207 24,802 24,619 25,512 23,312 22,254 2,118 597 169,483
Girls 24,623 22,857 23,497 24,306 22,725 21,633 21,185 436 161,262
Total 51,830 47,659 48,116 49,818 46,037 43,887 23,303 1,033 330,745
2010 Boys 27,014 24,984 24,509 24,967 23,806 22,587 20,962 727 169,556
Girls 24,954 23,082 22,794 23,919 23,488 22,258 20,647 498 161,640
Total 51,968 48,066 47,303 48,886 47,294 44,845 41,609 1,225 331,196
2011 Boys 27,998 24,796 24,336 24,671 23,499 22,966 21,207 748 170,221
Girls 25,976 23,320 22,596 23,079 23,094 22,839 21,236 521 162,751
Total 53,974 48,116 46,932 47,750 46,593 45,805 42,443 1,269 332,972
2012 Boys 29,329 25,328 24,077 24,305 23,267 22,695 21,509 813 171,323
Girls 27,053 24,058 22,878 22,904 22,372 22,679 21,863 700 164,507
Total 56,382 49,386 46,955 47,209 45,639 45,374 43,372 1,513 335,830
2013 Boys 29,334 27,073 24,785 24,284 23,156 22,959 21,738 747 174,076
Girls 26,597 25,680 23,790 23,060 22,349 22,068 22,034 523 166,101
Total 55,931 52,753 48,575 47,344 45,505 45,027 43,772 1,270 340,177
2014 Boys 27921 27372 26191 25046 23128 22595 21730 732 174718
Girls 25455 25337 25012 24018 22441 21983 21218 521 165982
Total 53376 52709 51203 49064 45569 44578 42948 1253 340700
**The Data for 2009-2011 is derived from the Stats Briefs while 2007-2012 is derived from the annual School Census.Note that reception Students are excluded

PRE & PRIMARY EDUCATION STATS BRIEF-2014 19
Tabl
e 3.
6: P
rimar
y Sc
hool
Enr
olm
ent b
y Si
ngle
Age
, Sex
, Sta
ndar
d an
d Sc
hool
ow
ners
hip-
2014
G
over
nmen
t Ow
ned
Scho
ols
Age
in y
ears
STD1
STD2
STD3
STD4
STD5
STD6
STD7
TOTA
L
TOTA
LBo
ysG
irls
Boys
Girl
sBo
ysG
irls
Boys
Girl
sBo
ysG
irls
Boys
Girl
sBo
ysG
irls
Boys
Girl
s
<62,
328
2,57
1-
--
--
--
--
--
-2,
328
2,57
14,
899
610
,474
10,4
861,
338
1,47
1-
--
--
--
--
-11
,812
11,9
5723
,769
79,
609
8,09
68,
959
9,75
11,
136
1,51
6-
--
--
--
-19
,704
19,3
6339
,067
82,
273
1,45
610
,428
9,20
58,
019
9,22
31,
100
1,44
6-
--
--
-21
,820
21,3
3043
,150
941
322
83,
351
2,05
910
,011
9,31
46,
854
8,56
472
21,
072
--
--
21,3
5121
,237
42,5
88
1012
781
666
356
3,48
52,
164
9,23
48,
658
5,46
97,
171
619
967
--
19,6
0019
,397
38,9
97
1171
3817
212
882
043
54,
095
2,46
58,
571
8,38
54,
864
6,72
857
092
419
,163
19,1
0338
,266
1233
2679
4426
912
11,
155
589
4,43
02,
800
8,26
38,
170
4,32
96,
071
18,5
5817
,821
36,3
79
1315
942
1711
356
325
167
1,40
376
64,
774
3,07
27,
892
8,15
914
,564
12,2
4626
,810
148
622
960
2013
771
468
243
1,64
392
75,
033
3,34
87,
371
4,62
411
,995
157
11
215
953
2417
873
458
246
1,67
285
62,
384
1,21
13,
595
16-
12
35
230
551
2217
675
510
226
774
334
1,10
8
17-
--
-6
-8
423
781
2414
468
262
103
365
18-
--
-1
12
11
224
1155
1383
2811
1
19-
--
--
-2
--
-6
38
216
521
20-
--
--
--
-6
15
16
317
522
21-
--
--
--
--
--
13
-3
14
21+
--
--
--
--
--
--
1-
1-
1
TOTA
L25
,358
22,9
9925
,060
23,0
4523
,940
22,8
6122
,995
21,9
9421
,322
20,5
4220
,913
20,2
2520
,223
19,6
7015
9,81
115
1,33
631
1,14
7
**En
rolm
ent e
xclu
des
pupi
ls in
Spe
cial
Edu
catio
n Un
its (S
PED)

20 PRE & PRIMARY EDUCATION STATS BRIEF -2014
Table 3.6: Primary School Enrolment by Single Age, Sex, Standard and School ownership-2014(Cont.)Government Aided Schools
Age in years
STD1 STD2 STD3 STD4 STD5 STD6 STD7 TOTAL
TOTALBoys Girls Boys Girls Boys Girls Boys Girls Boys Girls Boys Girls Boys Girls Boys Girls
<6 36 35 - - - - - - - - - - - - 36 35 71
6 186 180 2 16 - - - - - - - - - - 188 196 384
7 158 137 176 176 9 14 - - - - - - - - 343 327 670
8 34 15 178 179 125 178 13 22 - - - - - - 350 394 744
9 4 7 40 22 182 179 131 163 3 13 - - - - 360 384 744
10 1 - 4 6 65 17 174 155 86 141 23 30 - - 353 349 702
11 - - - 1 14 9 59 30 151 163 94 139 25 37 343 379 722
12 - - 2 2 3 2 17 7 97 58 125 120 83 122 327 311 638
13 - - - - 3 2 6 3 24 13 69 42 113 117 215 177 392
14 - - - - 1 1 1 2 12 2 22 11 83 42 119 58 177
15 - - - - 1 - 0 1 2 - 5 - 24 13 32 14 46
16 - - - - 1 - 2 1 1 - 1 1 2 - 7 2 9
17 - - - - - - - - - - 1 - - 1 1 1 2
18 - - - - - - - - - - - - 2 - 2 - 2
19 - - - - - - - - - - - - 1 - 1 - 1
20 - - - - - - - - - - - - - - - - -
21 - - - - - - - - - - - - - - - - -
21+ - - - - - - - - - - - - - - - - -
TOTAL 419 374 402 402 404 402 403 384 376 390 340 343 333 332 2,677 2,627 5,304
**Enrolment excludes pupils in Special Education Units (SPED)

PRE & PRIMARY EDUCATION STATS BRIEF-2014 21
Tabl
e 3.
6: P
rimar
y Sc
hool
Enr
olm
ent b
y Si
ngle
Age
, Sex
, Sta
ndar
d an
d Sc
hool
ow
ners
hip-
2014
(Con
t.)
Age
in
year
s
STD1
STD2
STD3
STD4
STD5
STD6
STD7
TOTA
L
TOTA
LBo
ysG
irls
Boys
Girl
sBo
ysG
irls
Boys
Girl
sBo
ysG
irls
Boys
Girl
sBo
ysG
irls
Boys
Girl
s<
62,
848
3,18
4-
--
--
--
--
--
-2,
848
3,18
46,
032
611
,930
11,8
491,
729
1,98
2-
--
--
--
--
-13
,659
13,8
3127
,490
710
,127
8,53
210
,209
10,9
621,
481
1,94
0-
--
--
--
-21
,817
21,4
3443
,251
82,
335
1,48
811
,013
9,70
79,
091
10,3
491,
463
1,91
2-
--
--
-23
,902
23,4
5647
,358
941
923
93,
422
2,11
210
,691
9,84
67,
834
9,64
41,
005
1,45
8-
--
-23
,371
23,2
9946
,670
1012
882
675
366
3,60
72,
217
9,80
29,
066
6,26
98,
111
846
1,34
2-
-21
,327
21,1
8442
,511
1171
3817
513
184
244
64,
195
2,51
99,
082
8,84
65,
671
7,61
778
21,
276
20,8
1820
,873
41,6
9112
3326
8246
273
123
1,18
459
84,
577
2,89
08,
719
8,57
15,
008
6,84
119
,876
19,0
9538
,971
1315
942
1711
658
332
170
1,43
778
64,
921
3,14
78,
293
8,49
315
,156
12,6
8027
,836
148
622
961
2113
873
488
245
1,67
394
25,
181
3,42
07,
571
4,71
612
,287
157
11
216
953
2518
473
465
246
1,71
087
12,
436
1,22
73,
663
16-
12
36
233
656
2217
976
515
228
791
338
1,12
917
--
--
6-
84
237
8625
158
6928
110
538
618
--
--
11
21
12
2411
6113
8928
117
19-
--
--
-2
--
-6
312
220
525
20-
--
--
--
-6
15
16
317
522
21-
--
--
--
--
--
23
13
36
21+
--
--
--
--
--
--
11
11
2TO
TAL
27,9
2125
,455
27,3
7225
,337
26,1
9125
,012
25,0
4624
,018
23,1
2822
,441
22,5
9521
,983
21,7
3021
,218
173,
983
165,
464
339,
447
**En
rolm
ent e
xclu
des
pupi
ls in
Spe
cial
Edu
catio
n Un
its (S
PED)

22 PRE & PRIMARY EDUCATION STATS BRIEF -2014
Table 3.6: Primary School Enrolment by Single age,Sex and School ownership (cont)-2014Privately Owned Schools
Age in years STD1
Boys GirlsSTD2Boys Girls
STD3Boys Girls
STD4Boys Girls
STD5Boys Girls
STD6Boys Girls
STD7Boys Girls
TOTALBoys Girls TOTAL
< 6 484 578 - - - - - - - - - - - - 484 578 1062
6 1270 1183 389 495 - - - - - - - - - - 1659 1678 3337
7 360 299 1074 1035 336 410 - - - - - - - - 1770 1744 3514
8 28 17 407 323 947 948 350 444 - - - - - - 1732 1732 3464
9 2 4 31 31 498 353 849 917 280 373 - - - - 1660 1678 3338
10 - 1 5 4 57 36 394 253 714 799 204 345 - - 1374 1438 2812
11 - - 3 2 8 2 41 24 360 298 713 750 187 315 1312 1391 2703
12 - - 1 - 1 - 12 2 50 32 331 281 596 648 991 963 1954
13 - - - - - - 1 - 10 7 78 33 288 217 377 257 634
14 - - - - - - - - 8 - 8 4 65 30 81 34 115
15 - - - - - - - - 4 - 2 - 14 2 20 2 22
16 - - - - - - 1 - 4 - 2 - 3 2 10 2 12
17 - - - - - - - - - - 4 1 14 - 18 1 19
18 - - - - - - - - - - - - 4 - 4 - 4
19 - - - - - - - - - - - - 3 - 3 - 3
20 - - - - - - - - - - - - - - - - -
21 - - - - - - - - - - - 1 - 1 - 2 2
21+ - - - - - - - - - - - - - 1 - 1 1
TOTAL 2144 2082 1910 1890 1847 1749 1648 1640 1430 1509 1342 1415 1174 1216 11495 11501 22996
**Enrolment excludes pupils in Special Education Units(SPED)

PRE & PRIMARY EDUCATION STATS BRIEF-2014 23
Table 3.6: Primary School Enrolment by Single age,Sex and School ownership (cont)-2014ALL SCHOOLS
Age in years
STD1Boys Girls
STD2Boys Girls
STD3Boys Girls
STD4Boys Girls
STD5Boys Girls
STD6Boys Girls
STD7Boys Girls
TOTALBoys Girls TOTAL
< 6 2848 3184 - - - - - - - - - - - - 2848 3184 6032
6 11930 11849 1729 1982 - - - - - - - - - - 13659 13831 27490
7 10127 8532 10209 10962 1481 1940 - - - - - - - - 21817 21434 43251
8 2335 1488 11013 9707 9091 10349 1463 1912 - - - - - - 23902 23456 47358
9 419 239 3422 2112 10691 9846 7834 9644 1005 1458 - - - - 23371 23299 46670
10 128 82 675 366 3607 2217 9802 9066 6269 8111 846 1342 - - 21327 21184 42511
11 71 38 175 131 842 446 4195 2519 9082 8846 5671 7617 782 1276 20818 20873 41691
12 33 26 82 46 273 123 1184 598 4577 2890 8719 8571 5008 6841 19876 19095 38971
13 15 9 42 17 116 58 332 170 1437 786 4921 3147 8293 8493 15156 12680 27836
14 8 6 22 9 61 21 138 73 488 245 1673 942 5181 3420 7571 4716 12287
15 7 1 1 2 16 9 53 25 184 73 465 246 1710 871 2436 1227 3663
16 - 1 2 3 6 2 33 6 56 22 179 76 515 228 791 338 1129
17 - - - - 6 - 8 4 23 7 86 25 158 69 281 105 386
18 - - - - 1 1 2 1 1 2 24 11 61 13 89 28 117
19 - - - - - - 2 - - - 6 3 12 2 20 5 25
20 - - - - - - - - 6 1 5 1 6 3 17 5 22
21 - - - - - - - - - - - 2 3 1 3 3 6
21+ - - - - - - - - - - - - 1 1 1 1 2
TOTAL 27921 25455 27372 25337 26191 25012 25046 24018 23128 22441 22595 21983 21730 21218 173983 165464 339447
**Enrolment excludes pupils in Special Education Units(SPED)
Table 3.6 shows that primary enrolment is concentrated in the ages of 6 years to 13 years. When distributed by single age, pupils aged 8 years had the highest number with a total of 47,358 followed by those aged 9 years with a total of 46,670 pupils, the enrolment for pupils aged 13, 14 and 15 years were 27,836, 12,287 and 3,663 respectively. This indicates that a reasonable number of pupils still start primary school later than the official age

24 PRE & PRIMARY EDUCATION STATS BRIEF -2014
3.3. PRIMARY SCHOOL EDUCATION COVERAGE
Table 3.7: Primary School Age Specific Enrolment Ratio(ASER)-2014
Age2014 Population
Estimates Enrolment ASER
5 46,226 6,032 13
6 45,140 27,490 60.9
7 44,968 43,251 96.2
8 44,205 47,358 107.1
9 43,576 46,670 107.1
10 43,026 42,511 98.8
11 42,528 41,691 98
12 42,067 38,971 92.6
13 41,678 27,836 66.8
14 41,400 12,287 29.7
15 41,305 3,663 8.9
16 41,406 1,129 2.7
17 41,651 386 0.9
18 42,052 117 0.3
19 42,427 25 0.1
20 42,524 22 0.1
21 42,110 6 0
22 41,394 2 0
**2014 Population Estimates are proxies derived using the 2011 Housing and Population Census Data(Medium Scenario Projections)
Age specific enrolment ratio (ASER) for children aged six years is 60.9 percent indicating that about 39 percent of the same aged group does not start school at the official school going age. The Age Specific Enrolment Ratio for the seven year olds was 96.2 percent implying that almost all children aged 7 years are enrolled in primary schools irrespective the standard they are doing. The ASER decreases significantly with age after age 14 years.
3.3.1 PRIMARY SCHOOL ENROLMENT RATES 2003 -2014
Table3.8: Primary School GER and NER – 2003 –2014Year GER (6-12 Year) % NER (6-12 Years) % GER (7-13 Years) % NER (7-13 Years) %
2003 114.6 90 114.5 98.7
2004 113.8 89.5 114.1 98.5
2005 113.1 89.6 114.1 97.8
2006 112.2 89.2 113.6 96.8
2007 109.4 86.9 111.5 94.9
2008 107.7 85.4 109.8 92.9
2009 108.4 85.8 109.8 91.8
2010 109.5 87.1 108.8 90.8
2011 112.7 90.6 98.6 88.4
2012 111 93.1 98.7 86
2013 110.8 92.9 111.9 94.5
2014 111.1 94.2 98.8 87.5
The enrolment rates for the population 6-12 years showed a slight increase of 1.3 percentage points between 2013 and 2014. The gross enrolment rate (GER) also increased from 110.8 percent in 2013 to 111.1 percent in 2014. On the other hand, the rates for the population 7-13 years declined between 2013 and 2014. GER decreased from 111.9 percent to 98.8 percent while NER decreased from 94.5 percent to 87.5 percent during the same period.

PRE & PRIMARY EDUCATION STATS BRIEF-2014 25
3.3.2 PRIMARY SCHOOL DROPOUTS
Table 3.9: Dropout Rates by Region -2010 - 2014
Regions 2010
Enroll
2011 Drop
Out
2011 Drop
Out as % of 2010
Enroll2011
Enroll
2012 Drop
Out
2012 Drop
Out as % of 2011
Enroll2012
Enroll
2013 Drop
Out
2013 Drop Out as % of 2012 Enroll
2013 Enroll
2014 Drop
Out
2014 Drop
Out as % of 2013
Enroll
Central 116,804 1,017 0.9 117,480 1,028 0.9 117,729 567 0.5 118,530 685 0.6
Chobe 3,252 15 0.5 3,281 7 0.2 3,184 11 0.3 3,456 8 0.2
Gantsi 7,118 353 5 7,271 490 6.7 7,279 255 3.5 7,643 288 3.8
Kgalagadi 8,904 133 1.5 8,869 146 1.6 9,003 72 0.8 9,141 69 0.8
Kgatleng 14,283 49 0.3 14,444 63 0.4 14,586 37 0.3 14,587 47 0.3
Kweneng 46,786 501 1.1 47,576 475 1 48,067 305 0.6 48,518 365 0.8
North East 25,300 57 0.2 25,572 68 0.3 25,796 28 0.1 25,772 59 0.2
North West 28,674 443 1.5 29,041 461 1.6 29,597 323 1.1 30,368 314 1
South East 37,581 51 0.1 36,862 141 0.4 38,001 107 0.3 39,271 70 0.2
Southern 42,494 407 1 42,575 503 1.2 42,588 252 0.6 42,891 313 0.7
Total 331,196 3,026 0.9 332,971 3,382 1 335,830 1,957 0.6 340,177 2,218 0.7
Table 3.9 shows the extent at which the pupils abandon school at different regions before they could complete the full course of primary education. The total dropout rate across the years since 2011 was roughly 1 percent notably; 0.9 percent in 2011, 1 percent in 2012 and reduced to 0.6 percent in 2013 and up to 0.7 percent in 2014. Gantsi had the highest dropout rates since 2011 being; 5 percent in 2011, 6.7 percent in 2012, 3.5 percent in 2013 and 3.8 percent in 2014. North West and Kgalagadi regions each had dropout rates of 1.5 percent in 2011 and 1.6 percent in 2012 followed by 0.8 and 1.0 percent in 2014 respectively. In 2014 South East region, North East and Chobe had the lowest dropout rates of 0.2 percent each

26 PRE & PRIMARY EDUCATION STATS BRIEF -2014
Table 3.10 shows that male dropouts are higher than female drop outs across all regions. Standard 1 drop out constitute the highest number of drop outs for both male and female pupils. Of the 2.218 total drop outs, 536 were standard 1, constituting 24.2 percent followed by standard 5 with 315 drop outs, constituting 14.2 percent.
Table 3.10: Dropout by Region, Sex and Standard – 2014Boys
Region STD 1 STD 2 STD 3 STD 4 STD 5 STD 6 STD 7 SPED TOTAL
South East 4 6 6 11 4 3 9 1 44
North East 7 3 7 5 3 6 1 1 33
Southern 36 18 29 31 42 40 17 - 213
Kweneng 42 32 39 36 37 23 33 - 242
Kgatleng 8 5 2 6 3 7 5 - 36
North West 53 28 18 32 30 33 15 1 210
Chobe 1 - 1 1 1 - 2 - 6
Gantsi 66 24 28 27 16 21 9 - 191
Kgalagadi 9 6 9 15 6 4 4 - 53
Central 100 50 52 58 97 53 45 1 456
TOTAL 326 172 191 222 239 190 140 4 1,484Girls
Region STD 1 STD 2 STD 3 STD 4 STD 5 STD 6 STD 7 SPED TOTAL
South East 3 2 1 3 4 4 8 1 26
North East 5 4 3 - 7 5 2 - 26
Southren 24 7 7 14 9 18 19 2 100
Kweneng 33 10 17 17 7 25 13 1 123
Kgatleng 5 - - 1 1 2 2 - 11
North West 43 14 8 9 9 11 10 - 104
Chobe - - - - 1 - 1 - 2
Gantsi 32 13 9 12 10 13 8 - 97
Kgalagadi 7 - 1 4 2 1 1 - 16
Central 58 34 24 29 26 30 27 1 229
TOTAL 210 84 70 89 76 109 91 5 734
BOTH SEXES
Region STD 1 STD 2 STD 3 STD 4 STD 5 STD 6 STD 7 SPED TOTAL
South East 7 8 7 14 8 7 17 2 70
North East 12 7 10 5 10 11 3 1 59
Southren 60 25 36 45 51 58 36 2 313
Kweneng 75 42 56 53 44 48 46 1 365
Kgatleng 13 5 2 7 4 9 7 - 47
North West 96 42 26 41 39 44 25 1 314
Chobe 1 - 1 1 2 - 3 - 8
Gantsi 98 37 37 39 26 34 17 - 288
Kgalagadi 16 6 10 19 8 5 5 - 69
Central 158 84 76 87 123 83 72 2 685
TOTAL 536 256 261 311 315 299 231 9 2,218

PRE & PRIMARY EDUCATION STATS BRIEF-2014 27
Table 3.10.1 Primary Schools Drop-outs by Reason for droping out-2014BOYS
Reason STD 1 STD 2 STD 3 STD 4 STD 5 STD 6 STD 7 Sped Total
Fees 5 3 10 5 1 2 3 - 29
Expulsion - - 1 - - - - - 1
Illness 12 9 3 14 11 9 4 - 62
Marriage - - - - - - - - 1
Pregnancy - - - - - - - - 0
Bullying - - - 2 2 2 3 - 9
Trauncy 238 138 151 177 180 163 94 3 1143
Substance 0
Abuse - - 1 - 1 - 1 - 3
Poor 0
Performance 2 1 - - - - 3 - 6
Abuse by 0
Parent(s) 7 - - - 3 - 2 - 12
Corporal 0
Punishment - - - - - - - - 0
Abuse by 0
Teacher - - - - - - - - 0
Child Labor - - - - 2 - 3 - 5
Religion - - - - 2 1 1 - 4
Other 62 21 25 24 37 13 26 1 209
Total 326 172 191 222 239 190 140 4 1484
GIRLS
Reason STD 1 STD 2 STD 3 STD 4 STD 5 STD 6 STD 7 Sped Total
Fees 1 3 4 5 4 2 1 - 20
Expulsion - - - - - - - - 0
Illness 14 5 7 6 4 8 3 - 47
Marriage - - - - - - 2 - 2
Pregnancy - 1 - - 3 16 9 2 31
Bullying 1 - - 1 - 1 2 - 5
Trauncy 149 54 46 63 51 63 57 1 484
Substance 0
Abuse - - - - - 1 - - 1
Poor 0
Performance - 1 - - - - - - 1
Abuse by 0
Parent(s) 4 1 4 1 1 - - - 11
Corporal 0
Punishment - - - - - - - - 0
Abuse by 0
Teacher - - - - - - - - 0
Child Labor 2 1 1 - - - 2 - 6
Religion - - - - 2 - - - 2
Other 39 18 8 13 11 18 15 2 124
Total 210 84 70 89 76 109 91 5 734

28 PRE & PRIMARY EDUCATION STATS BRIEF -2014
Table 3.10.1 Primary Schools Drop-outs by Reason for droping out-2014(Cont’d)Both Sex
Reason STD 1 STD 2 STD 3 STD 4 STD 5 STD 6 STD 7 Sped Total
Fees 6 6 14 10 5 4 4 - 49
Expulsion - - 1 - - - - - 1
Illness 26 14 10 20 15 17 7 - 109
Marriage - - - - - - 2 - 3
Pregnancy - 1 - - 3 16 9 2 31
Bullying 1 - - 3 2 3 5 - 14
Trauncy 387 192 197 240 231 226 151 4 1627
Substance 0
Abuse - - 1 - 1 1 1 - 4
Poor 0
Performance 2 2 - - - - 3 - 7
Abuse by 0
Parent(s) 11 1 4 1 4 - 2 - 23
Corporal 0
Punishment - - - - - - - - 0
Abuse by 0
Teacher - - - - - - - - 0
Child Labor 2 1 1 - 2 - 5 - 11
Religion - - - - 4 1 1 - 6
Other 101 39 33 37 48 31 41 3 333
Total 536 256 261 311 315 299 231 9 2218

PRE & PRIMARY EDUCATION STATS BRIEF-2014 29
3.4. RE-ENTRANTS
Table 3.11 shows that more boys than girls across all the standards re-entered primary school accounting for 69.2 percent of the 1,380 pupils who re-entered the system.
Table 3.11: Re-Entrants by Region, Sex and Standard -2014Boys
Region STD 1 STD 2 STD 3 STD 4 STD 5 STD 6 STD 7 SPED TOTAL
South East 1 1 2 3 4 4 2 - 17
North East 3 2 2 3 4 4 2 - 20
Southren 22 17 19 21 16 11 10 1 117
Kweneng 35 27 24 33 25 18 9 - 171
Kgatleng 1 2 1 4 1 3 2 - 14
North West 44 31 25 19 15 12 16 1 163
Chobe - - - 1 - 1 - - 2
Gantsi 42 12 22 12 9 2 - - 99
Kgalagadi 6 4 7 10 6 3 4 - 40
Central 87 38 40 52 48 29 18 - 312
TOTAL 241 134 142 158 128 87 63 2 955Girls
Region STD 1 STD 2 STD 3 STD 4 STD 5 STD 6 STD 7 SPED TOTAL
South East 1 2 - 4 1 2 - - 10
North East 2 3 - 1 1 1 1 - 9
Southren 17 8 6 7 4 5 6 - 53
Kweneng 23 13 13 7 7 11 1 - 75
Kgatleng - - - - - 1 - - 1
North West 26 12 8 6 10 2 1 - 65
Chobe - 1 - - - - 1 - 2
Gantsi 23 8 3 5 3 - - - 42
Kgalagadi 6 3 2 4 1 2 - - 18
Central 43 22 23 22 15 13 11 1 150
TOTAL 141 72 55 56 42 37 21 1 425
BOTH SEXES
Region STD 1 STD 2 STD 3 STD 4 STD 5 STD 6 STD 7 SPED TOTAL
South East 2 3 2 7 5 6 2 - 27
North East 5 5 2 4 5 5 3 - 29
Southern 39 25 25 28 20 16 16 1 170
Kweneng 58 40 37 40 32 29 10 - 246
Kgatleng 1 2 1 4 1 4 2 - 15
North West 70 43 33 25 25 14 17 1 228
Chobe - 1 - 1 - 1 1 - 4
Gantsi 65 20 25 17 12 2 - - 141
Kgalagadi 12 7 9 14 7 5 4 - 58
Central 130 60 63 74 63 42 29 1 462
TOTAL 382 206 197 214 170 124 84 3 1,380

30 PRE & PRIMARY EDUCATION STATS BRIEF -2014
Table 3.12 shows cohort analysis for standard 1 pupil who reaches standard 7 inclusive of repeaters. Therefore, 84.6 percent of the cohort who started standard 1 in 2008 reached standard 7 in 2014 showing an increase of 1.1 percentage points on the cohort who started standard 1 in 2006 and completed standard 7 in 2012.
3.5. GROSS PROGRESSION RATE
3.6. PRIMARY SCHOOL LEAVING EXAMINATION
Between 2013 and 2014, the number of PSLE candidates decreased from 43,775 to 42,797. This was a decrease of 978 candidates or 2.2%.
Table 3;13: PSLE CANDIDATURE IN 2012, to 2014 BY SUBJECTSUBJECT 2012 2013 2014Setswana 42,863 43,086 42,160
English 43,583 43,775 42,797
Mathematics 43,583 43,775 42,797
Science 43,583 43,775 42,797
Social Studies 43,583 43,775 42,797
Agriculture 43,583 43,775 42,797
Religious and Moral Education
43,583 43,775 42,97
Total Candidature 43,583 43,775 42,797Data Source: Botswana Examinations Council (2016)
Table 3.12: Standard 1 to Standard Seven Progression Rates by Sex- 2014
Boys Year EnrollProgr Rate
(%) Year EnrollProgr Rate
(%) Year EnrollProgr Rate
(%) Year EnrollProgr
Rate (%)
STD 1 2005 27,203 100 2006 27,632 100 2007 27,265 100 2008 26,563 100
STD 2 2006 25,149 92.4 2007 24,963 90.3 2008 24,743 90.8 2009 24,802 93.4
STD 3 2007 24,458 89.9 2008 24,899 90.1 2009 24,619 90.3 2010 24,509 92.3
STD 4 2008 24,915 91.6 2009 25,512 92.3 2010 24,967 91.6 2011 24,671 92.9
STD 5 2009 23,312 85.7 2010 23,801 86.1 2011 23,499 86.2 2012 23,267 87.6
STD 6 2010 22,587 83 2011 22,966 83.1 2012 22,695 83.2 2013 22,949 86.4
STD 7 2011 21,199 77.9 2012 21,509 77.8 2013 21,738 79.7 2014 21,730 81.8
Girls
STD 1 2005 25,386 100 2006 25,851 100 2007 25,155 100 2008 24,191 100
STD 2 2006 23,812 93.8 2007 23,970 92.7 2008 23,654 94 2009 22,857 94.5
STD 3 2007 23,259 91.6 2008 23,702 91.7 2009 23,497 93.4 2010 22,794 94.2
STD 4 2008 23,525 92.7 2009 24,306 94 2010 23,919 95.1 2011 23,079 95.4
STD 5 2009 22,725 89.5 2010 23,488 90.9 2011 23,094 91.8 2012 22,372 92.5
STD 6 2010 22,258 87.7 2011 23,839 92.2 2012 22,679 90.2 2013 22,060 91.2
STD 7 2011 21,334 84 2012 21,863 84.6 2013 22,034 87.6 2014 21,218 87.7
Both Sex
STD 1 2005 52,589 100 2006 53,483 100 2007 52,420 100 2008 50,754 100
STD 2 2006 48,961 93.1 2007 48,933 91.5 2008 48,397 92.3 2009 47,659 93.9
STD 3 2007 47,717 90.7 2008 48,601 90.9 2009 48,116 91.8 2010 47,303 93.2
STD 4 2008 48,440 92.1 2009 49,818 93.1 2010 48,886 93.3 2011 47,750 94.1
STD 5 2009 46,037 87.5 2010 47,289 88.4 2011 46,593 88.9 2012 45,639 89.9
STD 6 2010 44,845 85.3 2011 46,805 87.5 2012 45,374 86.6 2013 45,009 88.7
STD 7 2011 42,533 80.9 2012 43,372 81.1 2013 43,772 83.5 2014 42,948 84.6

PRE & PRIMARY EDUCATION STATS BRIEF-2014 31
Figure 3.2: Percentage of PSLE Candidates who obtained Overall Grade A-C in PSLE-2010 – 2014
Data Source: Botswana Examination Council (2015)
Figure 3.2 reflex performance in primary leaving examination over the years. It can be observed that quality pass denoted by A-C in PSLE has been improving steadily since 2011,after the decline between 2010 and 2011, The percentage of PSLE candidates who obtained overall A-C declined from 69.4 percent in 2010 to 64 percent in 2011 and thereafter increased annually up to 69.1 percent in 2014.
Figure 3.3: Trends on percentage of Candidates obtaining overall grades A, B, C in PSLE between 2010 and 2014
Data Source: Botswana Examination Council (2015)
10
15
20
25
30
35
40
2010 2011 2012 2013 2014Perc
enta
ge (%
) of C
andi
date
s
Year
C
B
A
A B C D E2011 14.18 17.35 36.61 25.23 5.22
2012 12.77 17.57 37.28 26.08 5.81
2013 13.20 15.20 36.60 34.40 0.70
2014 12.90 15.90 35.20 32.70 3.20
0.005.0010.0015.0020.0025.0030.0035.0040.00
Percentage
AxisTitle
2011 2012 2013 2014

32 PRE & PRIMARY EDUCATION STATS BRIEF -2014
Further analysis of grades A to C separately shows that more (between 35% and 38%) PSLE candidates obtained grade C between 2010 and 2014 than grades A and B. Percentage of candidates obtaining grade B ranged between 15 and 19 percent, during this period while those obtaining grade A ranged between 12 and 15 percent (figure 3.3 refers). This is an indication that candidates with grade C contribute more to the quality pass than those with grades A and B.
Figure 3.4: Comparison of Subject Grades A to C from 2011 -2014
Data Source: BEC
Compared to 2014, there has been a slight improvement in performance in the following subjects English and Mathematics. Compare to 2014 Agriculture has shown a significant improvement of 5.03 percent. A slight decline is in Setswana, Science, Social Studies and Moral and Religious Education.
3.7. Transition RateFigure 3.4: Transition Rate from Primary (STD7) to Lower Secondary (Fotm1)-2005-2014
2005 2006 2007 2008 2009 2010 2011 2012 2013 2014Transition Rate 96.9 97.7 97.3 98.5 96.8 96.8 96.8 96.8 98.1 98.5
95.5
96
96.5
97
97.5
98
98.5
99
Tran
sitio
n Ra
te
Setswana English Mathematics Science SocialStudies AgricultureReligiousand
MoralEducation
2011 86.30 61.90 53.50 49.40 52.00 24.10 64.00
2012 97.20 61.80 55.10 51.90 55.70 24.00 66.30
2013 83.71 61.11 58.43 52.02 55.95 39.39 67.49
2014 84.18 61.75 60.48 50.67 56.28 42.35 70.29
0.00
20.00
40.00
60.00
80.00
100.00
120.00
Percentage
2011 2012 2013 2014
PRE & PRIMARY EDUCATION STATS BRIEF-2014 33
Figure 3.4 shows that since 2005 to date transition rates from primary school (Standard 7) to lower secondary level (Form 1) had been above 96 percent. This is an indication that although the education policy outlines that each eligible child should go through 10 year basic education there are still a small proportion (about 2 percent) of children who only go up to Standard 7 and never reach Form 1. Although the transition rate was very high, the desired 100 percent transition rate from primary to lower secondary has never been achieved over the years.
Figure 3.5: Primary School Teachers Distributed by Sex and Age Group -2014
Figure 3.5 shows distribution of teachers by age and sex. Most female teachers (2,018) were in the age group 45-49 while the highest number of male teachers (734) was in the age group 30-34, followed by age group 35-39 with 611 male teachers. Overall 370 teachers, constituting 3.2 percent of total teachers were below 25 years while 260 (2.5% teachers were aged 60 years and above.
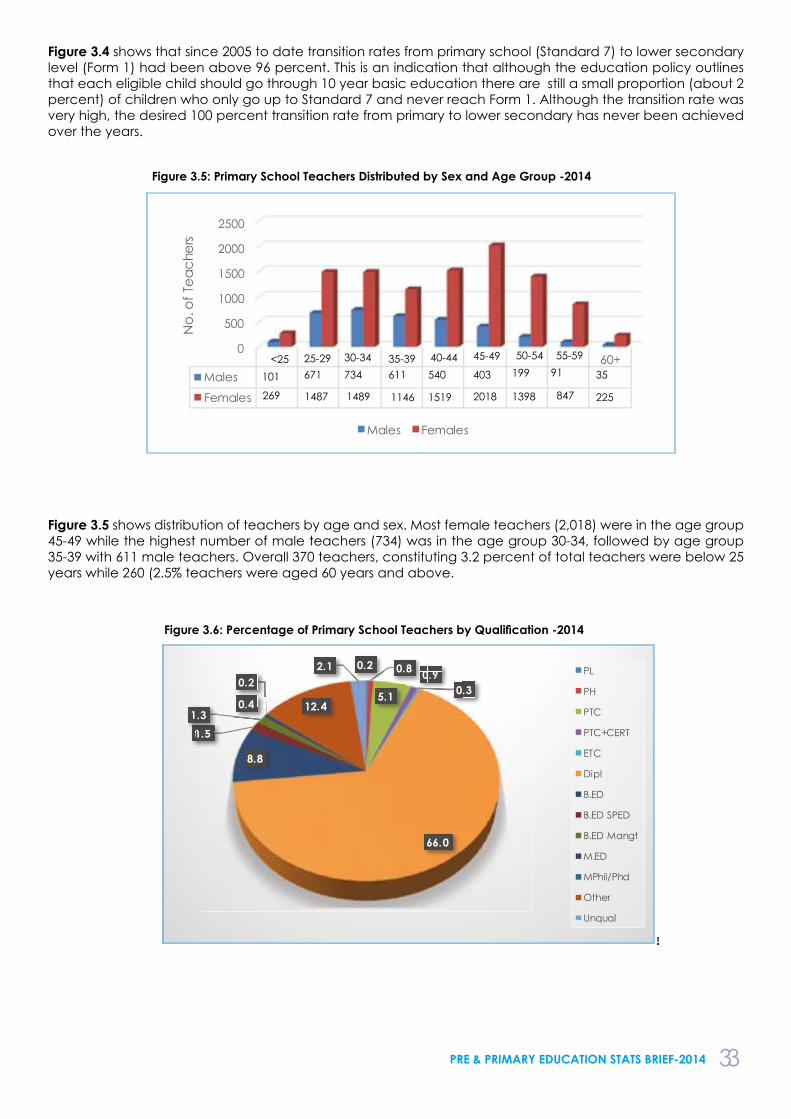
Figure 3.6: Percentage of Primary School Teachers by Qualification -2014
0
500
1000
1500
2000
2500
60+Males
Females
No.
of T
each
ers
Males Females
<25 25-29 30-34
!
0.2 0.8
5.1
0.90.3
66.0
8.8
1.51.3
0.4
0.2
12.4
2.1 PL
PH
PTC
PTC+CERT
ETC
Dipl
B.ED
B.ED SPED
B.ED Mangt
M.ED
MPhil/Phd
Other
Unqual
35-39 40-44 45-49 50-54 55-59
101 671 734 611 540 403 199 91 35
269 1487 1489 1146 1519 2018 1398 847 225

34 PRE & PRIMARY EDUCATION STATS BRIEF -2014
Figure 3.6 show that in 2014; 66 percent of primary school teachers had Diploma as their highest teaching qualification, followed by those who had other teaching qualification not specified at 12.4 percent. Those with Bachelor of Education were 8.8 percent (B.Ed) while 5.1 percent had Primary Teaching Certificate (PTC). The percentage of teachers without teaching qualification, PTC and Certificate, Bachelor of Education in Special Education, and Bachelor of Education Management ranged from 0.2, 1.5 and 0.4 percent, respectively. Other qualifications; Primary Lower (PL), Primary Higher (PH), and Master in Education each had percentage less than 1 percent.
Table 3.14: Primary School Teachers by Qualification and Education region-2014
Region PL PH PTCPTC+CERT ETC Diploma B.ED
B.ED SPED
B.ED Mangt M.ED
MPhil/Phd Other
Subtotal
Un-qual Total
South East 3 8 83 41 9 1,142 268 51 29 34 9 160 1,837 42 1,879North East 1 1 65 2 1 804 112 26 20 5 5 170 1,212 20 1,232Southren 5 2 237 6 4 1,196 164 36 30 4 6 291 1,981 40 2,021Kweneng 16 66 78 30 6 1,249 196 29 17 4 - 315 2,006 36 2,042Kgatleng - 3 53 2 8 396 66 16 14 11 - 101 670 8 678North West - 3 18 14 6 958 68 6 14 1 1 163 1,252 64 1,316Chobe - 2 5 - - 116 22 1 - 1 - 20 167 17 184Gantsi - 9 3 2 - 237 20 3 5 - - 50 329 19 348Kgalagadi - 21 7 5 - 339 33 6 6 - 1 85 503 22 525Central 6 3 224 36 10 3,647 396 60 63 5 10 542 5,002 51 5,053TOTAL 31 118 773 138 44 10,084 1,345 234 198 65 32 1,897 14,959 319 15,278
In 2014, there were 15,278 primary school teachers of which 14,959 teachers had a teaching qualification and 319 had no teaching qualification. North West region had the highest number (64) of teachers without teaching qualification accounting to 4.9 percent of the total teachers in the region. Kgatleng only had 8 unqualified teachers which was the lowest among the all regions.
Table 3.15: Time Series on Primary School Teachers 2008 -20142008 2009 2010 2011 2012 2013 2014
Trained TeachersMale 3,075 3,132 3,083 3,125 3,610 3,806 3,777
Female 9,914 9,832 9,615 9,675 10,752 11.011 11,182
Total 12,989 12,964 12,698 12,800 14,362 14.817 14,959Untrained TeachersMale 10 6 7 1 11 63 105
Female 70 44 44 27 54 162 214
Total 80 50 51 28 65 225 319All TeachersMale 3,085 3,138 3,090 3,126 3,621 3,869 3,882
Female 9,984 9,876 9,659 9,702 10,806 11,173 11,396
Total 13,069 13,014 12,749 12,828 14,427 15,042 15,278% Female Teachers 76.4 75.9 75.8 75.6 74.9 74.3 74.6
% Untrained Teachers 0.6 0.4 0.4 0.2 0.5 1.5 2.1
Pupil-Teacher RatioTrained Teachers 26 25 26 26 23.4 23 23
Total Teachers 25 25 25 25 23.3 22.6 22
Table 3.15 shows that the percentage of untrained primary school teachers increased from 0.5 percent in 2012 to 2.1 percent in 2014. The pupil teacher ratio for the trained teachers decreased from 23.4 pupils per trained teacher in 2012 to around 23.0 pupils per trained teacher in 2013 and 2014 respectively.

PRE & PRIMARY EDUCATION STATS BRIEF-2014 35
4. CONCEPTS AND DEFINITIONS
Access
Total Enrolment: Total number of learners in the system.
Age Specific Enrolment Ratio (ASER): Enrolment of the population of a specific age / Population of that specific age)*100.Age Specific Enrolment Ratio is percentage of the population of a specific age enrolled. It shows the extent of the population of a specific age cohort in educational activity.
Gross Enrolment Ratio (GER): Number of pupils enrolled in a given level of education, regardless of age, expressed as a percentage of the population in the theoretical age group for the same level of education; Total enrolment in primary / Population of that specific age group 6-12yrs) *100.
Net Enrolment Ratio (NER):Number of pupils in the theoretical age group for a given level of education enrolled in that level expressed as a percentage of the total population in that age group.; Enrolment of specific age group 6-12 years/ Population of that specific age group 6-12yrs) *100
Net Intake Rate (NIR): Number of new entrants in the first grade of primary education who are of the theoretical primary school entrance age, expressed as a percentage of the population of the same age.
Gross Intake Rate (GIR): Total number of new entrants in the first grade of primary education regardless of age, expressed as a percentage of the population of the theoretical entrance age to primary education.
Quality
Pupil Teacher Ratio: Average number of pupil per teacher at the level of education specified in a given school year, based on headcounts for both pupils and teachers; Total enrolment / Total number of teachers.
Student Classroom Ratio: Average number of pupil per classroom at the level of education specified in a given school year, based on headcounts for both pupils and classrooms; Total enrolment / Total number of classrooms.
Percentage of Trained Teachers: Number of teachers who have received the minimum organised teacher- training (pre-serviced or in service) required for teaching at the relevant level of education in the given country, expressed as a percentage of the total number of teachers at the given level of education.
Pass Rate: Percentage of candidates with Grade C or better as an overall percentage.
Efficiency
Transition Rate from Primary to secondary: Number of new entrants to the first grade of secondary education in a given year, expressed as a percentage of the number of pupils enrolled in the final grade of primary education in the previous year.
Dropout Rate: Is the proportion of pupils who leave the system without completing a given grade in a given year
Percentage of Repeaters: Number of pupils who are enrolled in the same grade (or level) as the previous year, expressed as a percentage of the total enrolment in the given grade or level of education. Survival Rates: Survival rates are calculated on the basis of the reconstructed cohort method, which uses data on enrolment and repeaters for two consecutive years. It is to be interpreted as the percentage of children who start primary education who will reach a given grade.
Equity
Gender Parity Index (GPI): Ratio of the female to male values of a given indicator. AGPI 1 indicates parity between sexes