
Pre-Lab – Spectral Lines and Spectroscopy
40
Pre-Lab – Spectral Lines and Spectroscopy
-
Upload
salvador-morin -
Category
Documents
-
view
62 -
download
1
description
Pre-Lab – Spectral Lines and Spectroscopy. Pre-Lab – Spectral Lines and Spectroscopy. When a beam of white light is shone through a prism, a rainbow of colors spread out to the right of the prism. The band of colors you see is called a visible spectrum . - PowerPoint PPT Presentation
Transcript of Pre-Lab – Spectral Lines and Spectroscopy

Pre-Lab – Spectral Lines and Spectroscopy

Pre-Lab – Spectral Lines and Spectroscopy
When a beam of white light is shone through a prism, a rainbow of colors spread out to the right of the prism. The band of colors you see is called a visible spectrum. The ability of a prism to separate white light into a spectrum is called dispersion.

Pre-Lab – Spectral Lines and Spectroscopy
Use the diagram below to Answer Questions 1 and 2 on your Pre-Lab Questions.

Pre-Lab – Spectral Lines and Spectroscopy
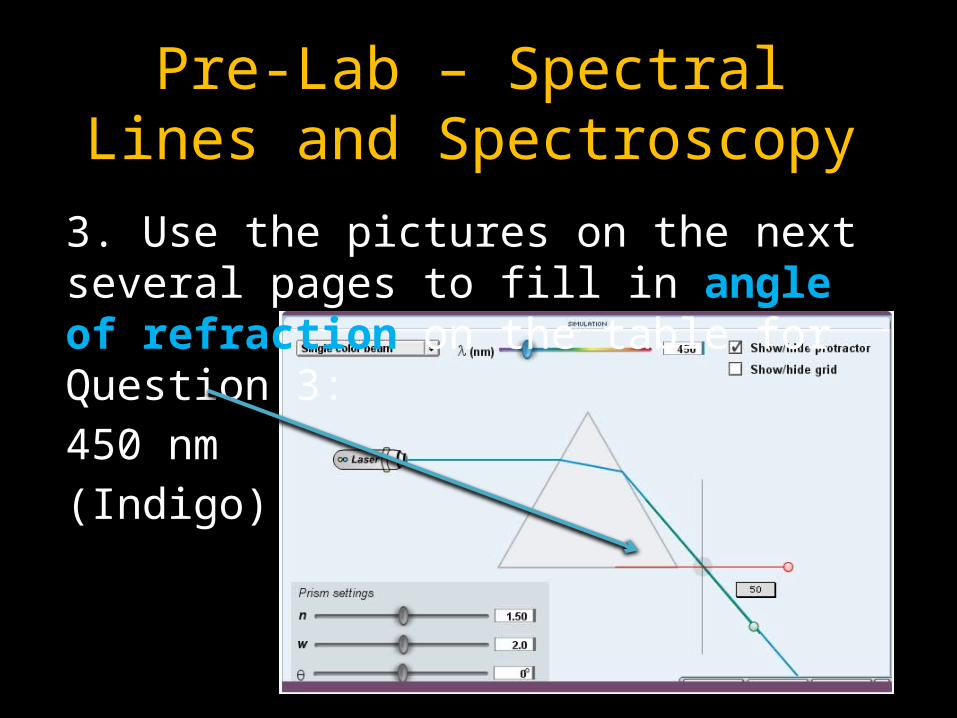
3. Single color beam has been selected. The color bar slider is moved from 400 nm to 700 nm, stopping every 50 nm to measure the angle of refraction.

Pre-Lab – Spectral Lines and Spectroscopy
3. Use the pictures on the next several pages to fill in angle of refraction on the table for Question 3:400 nm(Violet)
Pre-Lab – Spectral Lines and Spectroscopy
3. Use the pictures on the next several pages to fill in angle of refraction on the table for Question 3:450 nm(Indigo)

Pre-Lab – Spectral Lines and Spectroscopy
3. Use the pictures on the next several pages to fill in angle of refraction on the table for Question 3:500 nm(Blue)

Pre-Lab – Spectral Lines and Spectroscopy
3. Use the pictures on the next several pages to fill in angle of refraction on the table for Question 3:550 nm(Green)

Pre-Lab – Spectral Lines and Spectroscopy
3. Use the pictures on the next several pages to fill in angle of refraction on the table for Question 3:600 nm(Yellow)

Pre-Lab – Spectral Lines and Spectroscopy
3. Use the pictures on the next several pages to fill in angle of refraction on the table for Question 3:650 nm(Orange)

Pre-Lab – Spectral Lines and Spectroscopy
3. Use the pictures on the next several pages to fill in angle of refraction on the table for Question 3:700 nm(Red)

Pre-Lab – Spectral Lines and Spectroscopy
4. Quickly flip from slide 11 (700 nm/red) to slide 5 (400nm/violet) and back again. Answer Question 4 on your Pre-Lab Questions:

Lab – Gas Tube Bright Line (Emission) Spectra - Demo
5. Look at a continuous spectrum by pointing your spectroscope at an incandescent light bulb or a brightly sunlit cloud. (Do not look directly at the sun!)

Lab – Gas Tube Bright Line (Emission) Spectra - Demo
6. Now point your spectroscope at the fluorescent lights overhead. You will see a continuous spectrum, but you will also see 3 or 4 brightly colored stripes superimposed on the continuous spectrum.
400 500 600 700

Lab – Gas Tube Bright Line (Emission) Spectra - Demo
7. The Mercury vapor gas tube will show those same stripes on a black background. This is the emission or bright line spectrum for Mercury vapor.
436 503 546 577/579
615/623*
408*
*=may be hard to see

Lab – Gas Tube Bright Line (Emission) Spectra
Q 5 – 6: Use colored pencils to draw in the 4 or 5 brightest spectral lines for Mercury vapor in the spectrum bar on your answer sheet:
Mercury vapor gas tube

Lab – Gas Tube Bright Line (Emission) Spectra
8. Use your spectroscope to observe the bright line spectra for Hydrogen, Helium and Argon.
Q 7 – 12: Use colored pencils to draw 3 – 6spectral lines for each gas on your lab answer sheet:


Pre-Lab, Part 2 – Emission Spectra of Hydrogen
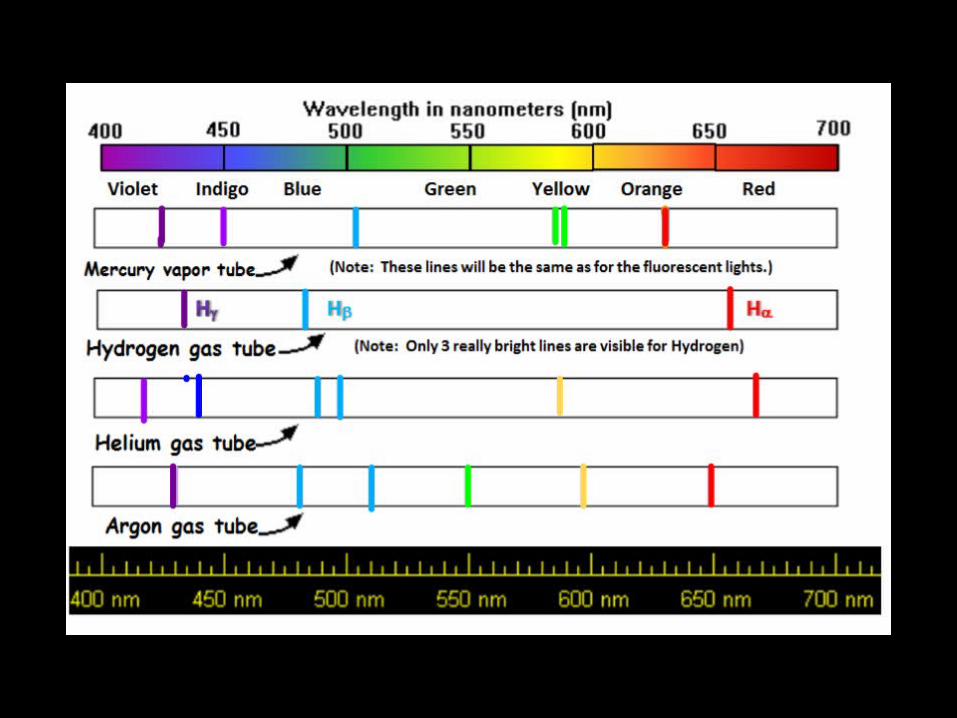
Each element has its own distinct group of spectral lines called its spectral signature. The table below shows the Balmer Series for the (Visible) Rest Wavelengths of Hydrogen:
Rest Wavelengths of Hydrogen - Balmer Series (Visible Colors)Name Color Rest Wavelength (l)
Alpha ( a ) Red 6563 Å ( = 656.3 nanometers)
Beta ( b ) Blue-green 4861 Å ( = 486.1 nanometers)
Gamma ( g ) Violet 4341 Å ( = 434.1 nanometers)
Delta ( d ) Deep Violet 4102 Å ( = 410.2 nanometers)
Pre-Lab, Part 2 – Emission Spectra of Hydrogen
Translating that into “English”:
The Balmer Series are the 4 visible wavelengths
of light given off by glowing Hydrogen gas.
We drew 3 of those 4 wavelengths during the
intro lab (we can’t see the deep violet).

Pre-Lab, Part 2 – Emission Spectra of Hydrogen
Translating that into “English”:Rest Wavelengths means the normal wavelengths of light are measured when the object/ galaxy is at rest (sitting still like those gas tubes on the lab counter.)Later on, we’ll be looking at light from distant galaxies that are really speeding along!!

Handout 1 – Hydrogen Absorption & Emission Lines

Handout 1 – Hydrogen Absorption & Emission LinesBackground Information – Visible Light Spectrum (“rainbow” pattern at top of page)The visible light spectrum ranges from 380 nm (violet) at left to 760 nm (red) at right.The “rainbow” is broken up by 4 distinct black stripes:

Handout 1 – Hydrogen Absorption & Emission LinesThe “rainbow” is broken up by 4 distinct black stripes:These stripes match up with 4 wavelengths of light that are absorbed by cool hydrogen gas as the light passes through a distant galaxy, star or planetary atmosphere. This type of spectrum is called an absorption or dark-line spectrum. * Answer Question 13 on your Pre-Lab
Questions.

Background Information – Bohr Model Diagram
(Energy Levels shown as Circles)When an electron is excited by light, heat or electrical energy, it absorbs that energy and bounces up to a higher energy level (called the excited state).

Handout 1 – Hydrogen Absorption & Emission Lines
Background Information – Bohr Model Diagram (Energy Levels shown as Circles)When the electron “calms down”, it gives off the energy and drops back down to a lower energy level (called the “rest” state). When it drops, it emits (gives off) the energy it absorbed as light energy.
Handout 1 – Hydrogen Absorption & Emission Lines
Background Information – Bohr Model Diagram (Energy Levels shown as Circles)When an electron drops a certain amount (Ex: Level n = 3 to level n = 2), it always gives off the same amount of energy, resulting in the same wavelength (color) of light being emitted.

Handout 1 – Hydrogen Absorption & Emission Lines
Background Information – Bohr Model Diagram (Energy Levels shown as Circles)(In our example, a drop from n = 3 n = 2 causes a photon of red light with a wavelength of 656.3 nm to be emitted.)These jumps of the electron from one energy level to another are called quantum leaps. [See Next Page.)

Handout 1 – Hydrogen Absorption & Emission Lines

Handout 1 – Hydrogen Absorption & Emission Lines
Background Information - Energy Level DiagramsThe quantum leaps that produce the 4 visible colors of light are called the Balmer Series:

Handout 1 – Hydrogen Absorption & Emission Lines
Background Information – Energy Level DiagramsLyman Series - The 2 1 quantum leap is huge, so all leaps down to level 1 (Ex: 3 1) cause much higher energy, shorter wavelength ultraviolet (UV) photons to be emitted.

Handout 1 – Hydrogen Absorption & Emission Lines
Background Information - Energy Level DiagramsPaschen Series - The jumps down to level 3 (Ex: 5 3) are much smaller, so they create longer wavelength, lower energy Infra-Red (IR) photons.
Answer Questions 14 - 16 on your Pre-Lab Questions.

Handout 2 – Emission Line Spectrum for Hydrogen
Emission spectra (and absorption spectra) can be converted into a line graph. It is not as colorful as the other spectra, but it has two advantages:• You can read the wavelength value of the
bright lines (peaks) much more precisely.• You can measure the relative strength of each
of the bright lines. For example:

Handout 2 – Emission Line Spectrum for Hydrogen
On the diagram below, there is a strong peak
(≈ 450) at 5000 angstroms (5000Å =500.0 nm)
The second highest peak
is at 4950 Å and is only
about ¼ of the strength
of the 5000 Å peak. 4600 4800 5000 5200 5400 5600

Handout 2 – Emission Line Spectrum for Hydrogen
The top diagram on Handout 2 shows an emission line spectrogram for Hydrogen superimposed on a continuous spectrum to emphasize the colors involved.
H a , Hb and Hg are labeled.
Answer Questions 17 – 20 on your Pre-Lab Questions.

Handout 2 – Emission Line Spectrum for Hydrogen

Handout 2 – Emission Line Spectrum for Hydrogen
The bottom diagram on Handout 2 shows an emission line spectrogram for Hydrogen as it will appear on the rest of the lab.
H a , Hb and Hg are labeled.
Answer Questions 21 - 24 on your Pre-Lab Questions.

Handout 2 – Emission Line Spectrum for Hydrogen


![3. Widths and Profiles of Spectral Lines - Hanyangoptics.hanyang.ac.kr/~choh/degree/[2013-2] spectroscopy... · Nonlinear Optics Lab. Hanyang Univ. 3. Widths and Profiles of Spectral](https://static.fdocuments.net/doc/165x107/5b15247b7f8b9a8f548de5c5/3-widths-and-profiles-of-spectral-lines-chohdegree2013-2-spectroscopy.jpg)

