PRE-IPO REPORT: VIETNAM MEAT INDUSTRIES LIMITED COMPANY ... tich cong ty/2016/T03... · PRE-IPO...
14
PRE-IPO REPORT: VIETNAM MEAT INDUSTRIES LIMITED COMPANY (VISSAN) IPO summary Vissan will offer to sell 11.33 million shares or 14% stake for public auction at an initial price of VND17,000 per share on March 7, 2016. Besides, the company will sell another 14% stake for strategic partners. There are three candidates applying for Vissan’s partner, including CJ CheilJadang Corporation (Korea), Proconco and Anco (both under Massan Group). Vissan has not declared of their listing date on the stock exchange after IPO. Until March 2, 2016 the number of auction investor was 142 investors with registered purchasing shares of 63.5 million, which is six times higher than the planned shares of Vissan to sell. Leading position in processed food in Vietnam Vissan’s strength comes from processed meat products such as sterilized sausage, jambon and fresh sausage, which are mainly consumed domestically with a high gross margin from 28% to 30%. Sterilized sausage products and fresh sausage products of Vissan accounts for 65% and 70% of nationwide market share respectively. According to Euromonitor’s statistics on processed meat and seafood in Vietnam (includes chilled and frozen processed meat) in Dec 2015, Vissan is the largest brand name with 23.6% market share. Extensive distribution network Besides the advantage of products, Vissan owns a system of distribution network all over the country, focusing in Hochiminh city (HCMC) with both General Trade (GT) and Modern Trade (MT) channels. The network consists of 120 distributors and more than 130,000 point-of-sale, 174 selling points at traditional markets in HCMC, 233 selling points at supermarkets and 703 convenience stores. High capital demand for investment Vissan currently has high cash surplus and low debt. In other words, bank loans comprise dominantly of short-term loans which are used for working capital needs. However, 2016 to 2020 will be the heavy investment period of Vissan with total capital expenditure of around VND1,900-2,000 billion. This will hit the company’s business and cash flow in the medium term, especially in 2019. Therefore, Vissan expects their partner will support them in terms of cheap capital financing for their projects. Valuation There is no Vietnamese listing company which operates in the same sector with Vissan to compare. Therefore, we use peers in Asian region which process food for valuation. We derive Vissan’s relative price of VND14,868 per share based on the target P/E of 10.8x, which is 12.5% lower than Vissan’s P/E of 12.5x. Our price is lower than initial price of VND17,000, implying that Vissan is relatively expensive than regional peers. However it worth noticing that in the long term Vissan has a great potential to grow and create synergy when strategic partner joins the company. March 4, 2016 www.vissan.com.vn COMPANY INFORMATION Industry Food Processing Establish 1970 Charter capital (VND bn) 809 Market capital @initial price (VND bn) 1,375.3 AUCTION INFORMATION Auction Time March 7, 2016 Number of offering shares 11,328,002 Initial price (VND/share) 17,000 PLANNED OWNERSHIP STRUCTURE State-owned (SATRA) 65% Labors 6.0% Labor Union 1.0% Public 14% Strategic partner 14% BUSINESS RESULTS CAGR 2011-2014 Net revenue 5.1% Net income 4.7% Planning numbers CAGR 2015-2020 Net revenue 6.8% Net income -13.8% Overview Vietnam Meat Industries Ltd Company (Vissan), a member of Saigon Trading Group (SATRA), has been established since 1970. Vissan is considered to be leader in manufacturing, processing and trading meat products of Vietnam. Operations: Vissan provides three main categories of product, including: Fresh meat, Processed food, Chilled & Frozen food. The proportions of three categories are 43%, 37% and 12% of net revenue respectively. Analyst Ngô Thu Ba Email [email protected]
Transcript of PRE-IPO REPORT: VIETNAM MEAT INDUSTRIES LIMITED COMPANY ... tich cong ty/2016/T03... · PRE-IPO...
PRE-IPO REPORT: VIETNAM MEAT INDUSTRIES LIMITED COMPANY (VISSAN)
IPO summary
Vissan will offer to sell 11.33 million shares or 14% stake for public auction at an initial price of VND17,000 per share on March 7, 2016. Besides, the company will sell another 14% stake for strategic partners. There are three candidates applying for Vissan’s partner, including CJ CheilJadang Corporation (Korea), Proconco and Anco (both under Massan Group). Vissan has not declared of their listing date on the stock exchange after IPO.
Until March 2, 2016 the number of auction investor was 142 investors with registered purchasing shares of 63.5 million, which is six times higher than the planned shares of Vissan to sell.
Leading position in processed food in Vietnam
Vissan’s strength comes from processed meat products such as sterilized sausage, jambon and fresh sausage, which are mainly consumed domestically with a high gross margin from 28% to 30%. Sterilized sausage products and fresh sausage products of Vissan accounts for 65% and 70% of nationwide market share respectively. According to Euromonitor’s statistics on processed meat and seafood in Vietnam (includes chilled and frozen processed meat) in Dec 2015, Vissan is the largest brand name with 23.6% market share.
Extensive distribution network
Besides the advantage of products, Vissan owns a system of distribution network all over the country, focusing in Hochiminh city (HCMC) with both General Trade (GT) and Modern Trade (MT) channels. The network consists of 120 distributors and more than 130,000 point-of-sale, 174 selling points at traditional markets in HCMC, 233 selling points at supermarkets and 703 convenience stores.
High capital demand for investment
Vissan currently has high cash surplus and low debt. In other words, bank loans comprise dominantly of short-term loans which are used for working capital needs. However, 2016 to 2020 will be the heavy investment period of Vissan with total capital expenditure of around VND1,900-2,000 billion. This will hit the company’s business and cash flow in the medium term, especially in 2019. Therefore, Vissan expects their partner will support them in terms of cheap capital financing for their projects.
Valuation
There is no Vietnamese listing company which operates in the same sector with Vissan to compare. Therefore, we use peers in Asian region which process food for valuation. We derive Vissan’s relative price of VND14,868 per share based on the target P/E of 10.8x, which is 12.5% lower than Vissan’s P/E of 12.5x. Our price is lower than initial price of VND17,000, implying that Vissan is relatively expensive than regional peers. However it worth noticing that in the long term Vissan has a great potential to grow and create synergy when strategic partner joins the company.
March 4, 2016
www.vissan.com.vn
COMPANY INFORMATION Industry Food Processing Establish 1970 Charter capital (VND bn) 809 Market capital @initial price (VND bn) 1,375.3
AUCTION INFORMATION Auction Time March 7, 2016 Number of offering shares 11,328,002 Initial price (VND/share) 17,000 PLANNED OWNERSHIP STRUCTURE State-owned (SATRA) 65% Labors 6.0% Labor Union 1.0% Public 14% Strategic partner 14% BUSINESS RESULTS CAGR 2011-2014 Net revenue 5.1% Net income 4.7% Planning numbers CAGR 2015-2020 Net revenue 6.8% Net income -13.8% Overview
Vietnam Meat Industries Ltd Company (Vissan), a member of Saigon Trading Group (SATRA), has been established since 1970. Vissan is considered to be leader in manufacturing, processing and trading meat products of Vietnam.
Operations: Vissan provides three main categories of product, including: Fresh meat, Processed food, Chilled & Frozen food. The proportions of three categories are 43%, 37% and 12% of net revenue respectively.
Analyst Ngô Thu Ba Email [email protected]
TVS RESEARCH DEPARTMENT
2
CONTENTS INITIAL PUBLIC OFFERING (IPO) PLAN ..................................................................................................................... 3
Operational Structure ............................................................................................................................................. 4
ONE OF THE LEADER IN FOOD PROCESSING IN VIETNAM ....................................................................................... 5
PRODUCTS STRUCTURE ........................................................................................................................................... 6
A. Fresh meat products........................................................................................................................................ 6
B. Processed meat products ................................................................................................................................ 6
C. Chilled-Frozen food ......................................................................................................................................... 7
Distribution Network .............................................................................................................................................. 8
PRODUCTION CAPACITY .......................................................................................................................................... 8
BUSINESS RESULTS .................................................................................................................................................. 9
DEVELOPING STRATEGY .......................................................................................................................................... 9
INVESTMENT PLAN ................................................................................................................................................. 9
COMPANY’S PROJECTION UNTIL 2020 .................................................................................................................. 10
VALUATION ........................................................................................................................................................... 11
APPENDIX 1: LIST OF VISSAN’S REAL ESTATES ....................................................................................................... 12
APPENDIX 2: BUSINESS RESULT SUMMARY .......................................................................................................... 13

TVS RESEARCH DEPARTMENT
3
INITIAL PUBLIC OFFERING (IPO) PLAN Until September 2015, Vissan’s charter capital was VND442 billion. Charter capital of the company after reevaluation for equitizing is VND809 billion (+83%) thanks to the reevaluation of fixed assets (+85%) and the appearance of goodwill & business advantage amount of VND177 billion. Vissan plans to sell 14% stake (11.3 million shares) to maximum 3 strategic partners and another 14% stake to the public. Regarding strategic partner criteria, the partner must operate at least 5 years in the industry which is similar to Vissan’s in order to cooperate with the company to build the F-F-F chain (Feed-Farm-Food) from farm to table. Charter capital of strategic partner must be at least VND1,000 billion and liabilities over equity is below 1.5x. Furthermore, the company did not record loss from 2012 to 2014 and no cumulative loss in the first 9M2015.
Planned ownership structure after IPO
Source: Vissan
Vissan shortlisted three investors to be their strategic partners, consisting of CJ CheilJadang Corporation, Proconco and Anco. All three investors are qualified of Vissan’s criteria and expect to purchase up to the limit of 14% stake. CJ CheilJadang Corporation (Korea): specializes in producing food and
biotechnology. The company has been experienced in food production, especially meat products in the USA and China.
Vietnamese-French Cattle Feed JSC (Proconco) and Agriculture International JSC (Anco): if combining these two companies, the total production capacity would reach 2.15 million tons per year, which shows that this is the largest facility in livestock production. It is interesting that Masan owns 54% of Proconco and 70% of Anco respectively.
Based on the criteria which Vissan set for their strategic partners, all these candidates are basically qualified. Accordingly, it is too soon to predict which company will win the auction to be Vissan’s partner. However we consider that Masan is more advantageous than the other foreign competitor thanks to same Vietnamese business culture and their aggressiveness history in previous deals.
State-owned (SATRA), 65%
Labors, 6.0%
Labor Union, 1.0%
Strategic partner, 14%

TVS RESEARCH DEPARTMENT
4
Operational Structure Vissan’s operation is organized as below structure. Due to state ownership, which is represented by SATRA, holds 100%. This leads to the fact that most of Vissan’s operation is under the control of Parent group. Vissan’s first AGM is likely to be held on April 29, 2016 and Vissan will vote for the new management board at that time.
Vissan’s operational chart
Source: Vissan

TVS RESEARCH DEPARTMENT
5
ONE OF THE LEADER IN FOOD PROCESSING IN VIETNAM Vissan has a long operating history in food processing with an average revenue of VND3,840 billion per year. Company’s core business is manufacturing fresh meat and processed food. Chilled and frozen food contribute modest portion as compared to the two first segments.
Vissan’s net revenue and net income (VND bn), 2011-9M2015
Vissan’s net revenue breakdown, 2012-9M2015
Source: Vissan
Vissan’s products can be classified as middle and middle-high range products. The two product segments, fresh meat and processed meat, support for each other. In details, the first one helps to earn Vissan’s brand name despite low margin. Meanwhile the later help balancing company’s profit margin.
Vissan’s gross margin of product segments, 2012-9M2015
Source: Vissan
3,876 3,666 3,809
4,013
3,0492,644
94 100 104 110 83.2 94.6 -
500
1,000
1,500
2,000
2,500
3,000
3,500
4,000
4,500
2011 2012 2013 2014 9M2014 9M2015
Net revenue (VND bn) Net income (VND bn)
0%10%20%30%40%50%60%70%80%90%
100%
2012 2013 2014 9M2015
45% 46% 47% 43%
35% 34% 33% 37%
11% 11% 11% 12%10% 9% 10% 8%
Fresh meat Processed food Chilled food-Frozen food Others
0%
5%
10%
15%
20%
25%
30%
35%
2012 2013 2014 9M2015
Fresh meat Processed food Chilled food-Frozen food
TVS RESEARCH DEPARTMENT
6
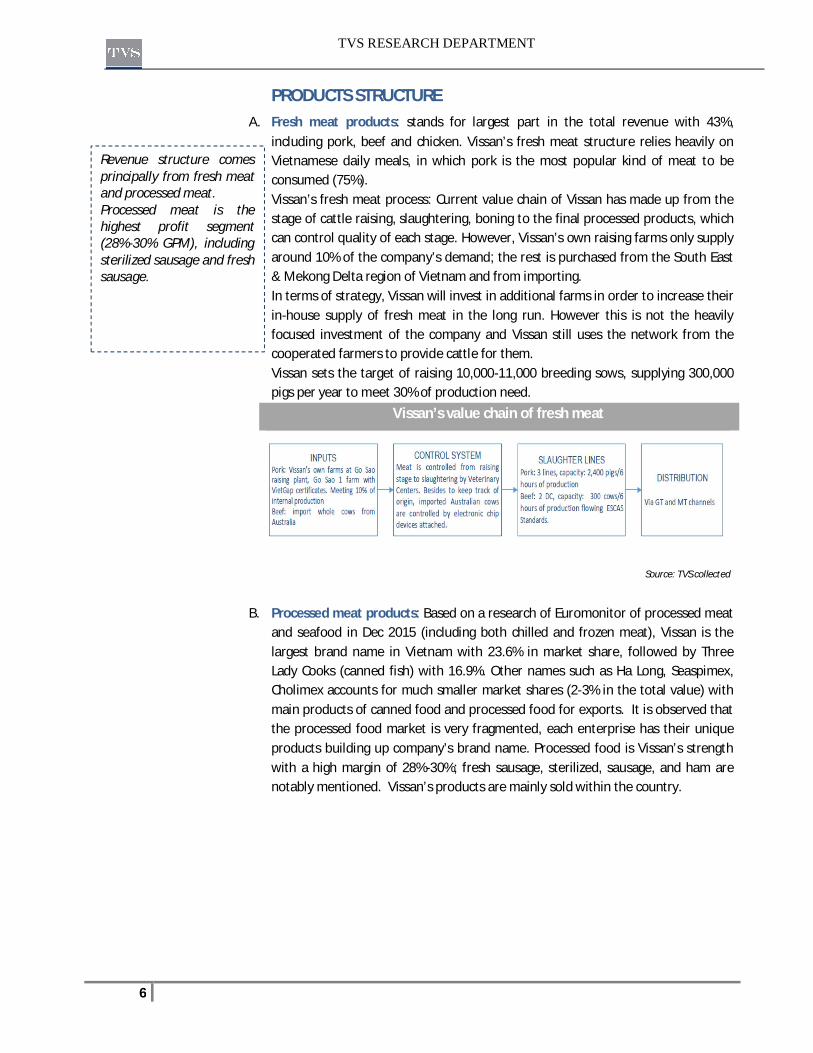
PRODUCTS STRUCTURE A. Fresh meat products: stands for largest part in the total revenue with 43%,
including pork, beef and chicken. Vissan’s fresh meat structure relies heavily on Vietnamese daily meals, in which pork is the most popular kind of meat to be consumed (75%). Vissan’s fresh meat process: Current value chain of Vissan has made up from the stage of cattle raising, slaughtering, boning to the final processed products, which can control quality of each stage. However, Vissan’s own raising farms only supply around 10% of the company’s demand; the rest is purchased from the South East & Mekong Delta region of Vietnam and from importing. In terms of strategy, Vissan will invest in additional farms in order to increase their in-house supply of fresh meat in the long run. However this is not the heavily focused investment of the company and Vissan still uses the network from the cooperated farmers to provide cattle for them. Vissan sets the target of raising 10,000-11,000 breeding sows, supplying 300,000 pigs per year to meet 30% of production need.
Vissan’s value chain of fresh meat
Source: TVS collected
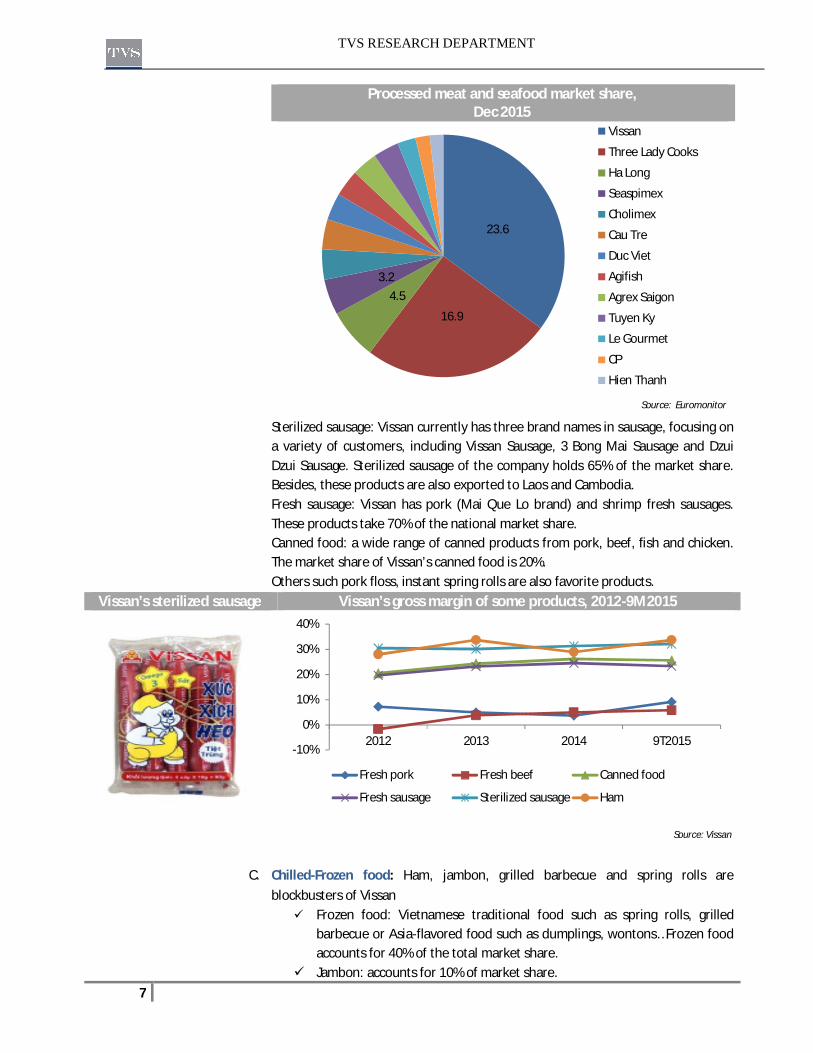
B. Processed meat products: Based on a research of Euromonitor of processed meat
and seafood in Dec 2015 (including both chilled and frozen meat), Vissan is the largest brand name in Vietnam with 23.6% in market share, followed by Three Lady Cooks (canned fish) with 16.9%. Other names such as Ha Long, Seaspimex, Cholimex accounts for much smaller market shares (2-3% in the total value) with main products of canned food and processed food for exports. It is observed that the processed food market is very fragmented, each enterprise has their unique products building up company’s brand name. Processed food is Vissan’s strength with a high margin of 28%-30%; fresh sausage, sterilized, sausage, and ham are notably mentioned. Vissan’s products are mainly sold within the country.
Revenue structure comes principally from fresh meat and processed meat. Processed meat is the highest profit segment (28%-30% GPM), including sterilized sausage and fresh sausage.
TVS RESEARCH DEPARTMENT
7
Processed meat and seafood market share, Dec 2015
Source: Euromonitor
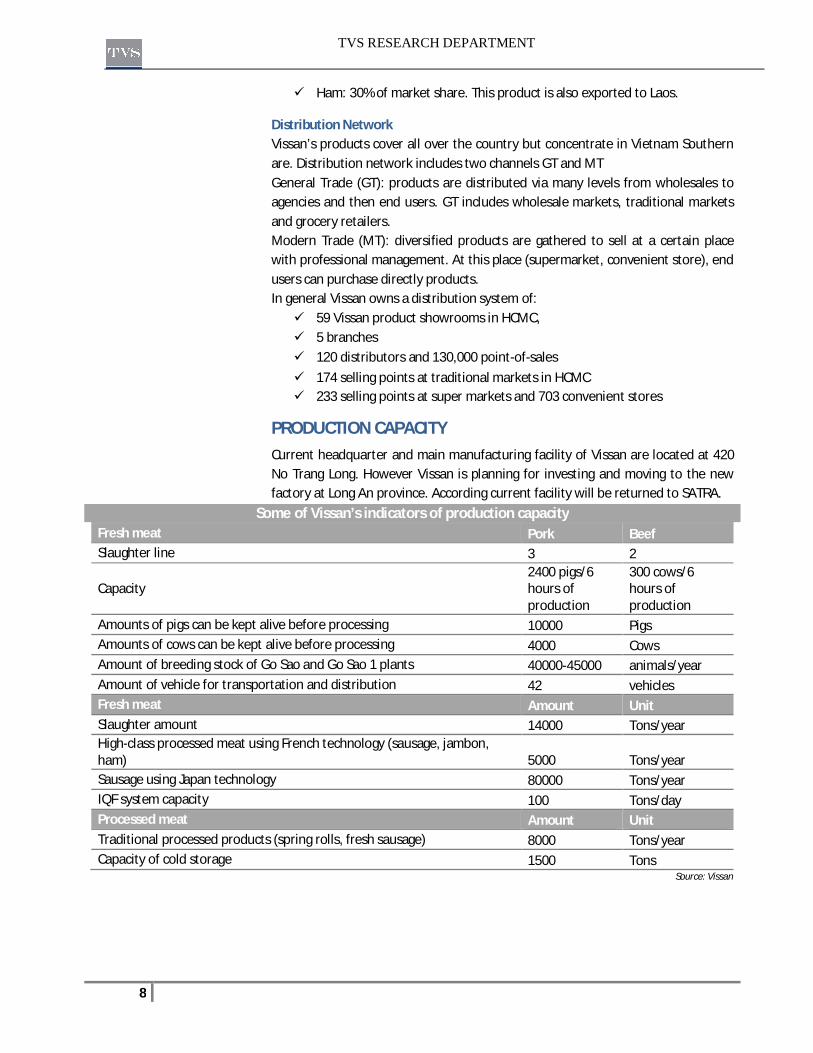
Sterilized sausage: Vissan currently has three brand names in sausage, focusing on a variety of customers, including Vissan Sausage, 3 Bong Mai Sausage and Dzui Dzui Sausage. Sterilized sausage of the company holds 65% of the market share. Besides, these products are also exported to Laos and Cambodia. Fresh sausage: Vissan has pork (Mai Que Lo brand) and shrimp fresh sausages. These products take 70% of the national market share. Canned food: a wide range of canned products from pork, beef, fish and chicken. The market share of Vissan’s canned food is 20%. Others such pork floss, instant spring rolls are also favorite products.
Vissan’s sterilized sausage Vissan’s gross margin of some products, 2012-9M2015
Source: Vissan
C. Chilled-Frozen food: Ham, jambon, grilled barbecue and spring rolls are
blockbusters of Vissan Frozen food: Vietnamese traditional food such as spring rolls, grilled
barbecue or Asia-flavored food such as dumplings, wontons…Frozen food accounts for 40% of the total market share.
Jambon: accounts for 10% of market share.
23.6
16.9
4.53.2
Vissan
Three Lady Cooks
Ha Long
Seaspimex
Cholimex
Cau Tre
Duc Viet
Agifish
Agrex Saigon
Tuyen Ky
Le Gourmet
CP
Hien Thanh
-10%
0%
10%
20%
30%
40%
2012 2013 2014 9T2015
Fresh pork Fresh beef Canned food
Fresh sausage Sterilized sausage Ham
TVS RESEARCH DEPARTMENT
8
Ham: 30% of market share. This product is also exported to Laos.
Distribution Network Vissan’s products cover all over the country but concentrate in Vietnam Southern are. Distribution network includes two channels GT and MT General Trade (GT): products are distributed via many levels from wholesales to agencies and then end users. GT includes wholesale markets, traditional markets and grocery retailers. Modern Trade (MT): diversified products are gathered to sell at a certain place with professional management. At this place (supermarket, convenient store), end users can purchase directly products. In general Vissan owns a distribution system of: 59 Vissan product showrooms in HCMC, 5 branches 120 distributors and 130,000 point-of-sales 174 selling points at traditional markets in HCMC 233 selling points at super markets and 703 convenient stores
PRODUCTION CAPACITY Current headquarter and main manufacturing facility of Vissan are located at 420 No Trang Long. However Vissan is planning for investing and moving to the new factory at Long An province. According current facility will be returned to SATRA.
Some of Vissan’s indicators of production capacity Fresh meat Pork Beef Slaughter line 3 2
Capacity 2400 pigs/6 hours of production
300 cows/6 hours of production
Amounts of pigs can be kept alive before processing 10000 Pigs Amounts of cows can be kept alive before processing 4000 Cows Amount of breeding stock of Go Sao and Go Sao 1 plants 40000-45000 animals/year Amount of vehicle for transportation and distribution 42 vehicles Fresh meat Amount Unit Slaughter amount 14000 Tons/year High-class processed meat using French technology (sausage, jambon, ham) 5000 Tons/year Sausage using Japan technology 80000 Tons/year IQF system capacity 100 Tons/day Processed meat Amount Unit Traditional processed products (spring rolls, fresh sausage) 8000 Tons/year Capacity of cold storage 1500 Tons
Source: Vissan

TVS RESEARCH DEPARTMENT
9
BUSINESS RESULTS From 2011 to 2014, Vissan’s business rose gradually with net revenue’s CAGR of 5.1%. The product mix has been restructured towards reducing COGS/Net revenue, improving gross margin from 16% in 2011 to 18%-19% in the following years. Due to the nature of retail sales, SG&A expenses over net revenue has been high with 12%-14% per year. Meanwhile, given the rich cash balance and low debt ratio, Vissan guarantee a net margin of 3%/year and CAGR of net income of 4.7%. 9M2015 result: Until Sep 30,2015 net revenue reached VND3,049 billion, -13% yoy while COGS reduced at higher rate (-18%), leading to 10% increase in gross profit or VND593.5 billion. In combined with tripled financial income and stabilizing expenses, net income of Vissan rose 17% yoy and reached VND96.6 billion in the first 9M2015. For the whole year, Vissan estimates their net revenue can reach VND3.775 billion and net income of VND109 billion, slightly down 6% and 1% yoy respectively. At the end of Sep 2015, cash & equivalents of Vissan was VND545 billion, equaling 41% of total assets. Bank loan balance of Vissan was VND374 billion, of which short-term bank loan was dominant (VND343 billion) to finance for working capital need. The ratio of total bank loan/equities was 67%.
DEVELOPING STRATEGY Vissan’s strategy after equitization is enhancing production capacity, synchronizing all machines following HACCP standards and investing in production plants at regions. For business plan, Vissan uses franchise method to exploit Vissan’s brand name and applies e-commerce. Domestic market is still the pillar market of Vissan. On the other hand, the company will introduce their products oversea like the USA, Australia and Japan.
INVESTMENT PLAN The next cycle of Vissan if investment period, which means that most of the company’s profit will be retained for capital expenditure. It is likely that the company still pay the dividend in cash but at a low ratio or using share dividends instead. The largest investment project is building the processing plant in Long An in 2016. The plant is expected to commence operating in 2019, plunging the company’s profit in the year.
INVESTMENT PLAN (Unit: VND bn) Inv. Period Operation year Investment (VND bn)
Relocation & Renew Techonology of Slaughtering and Food Processing Plants 2015-2018 1,440
Building plants in Long An Province 2016 2019 1,264 The rest (offices, warehouses @ Tan Tao Industrial zone) 176 Go Sao Pig raising factory (2500 pigs) 2016-2018 153 Purchasing additional farms (6000 pigs) 2016-2018 200 Import breeding stock 2016-2019 20 Machines 2016-2020 75 Maintenance expense 2016-2020 31
Net revenue and net income rose at stable CAGR of 5%/year. Gross profit margin has ranged from 16% to19% but high SG&A expense dragged net margin down to 3%/year.
TVS RESEARCH DEPARTMENT
10
Total 1,919 Source: Vissan
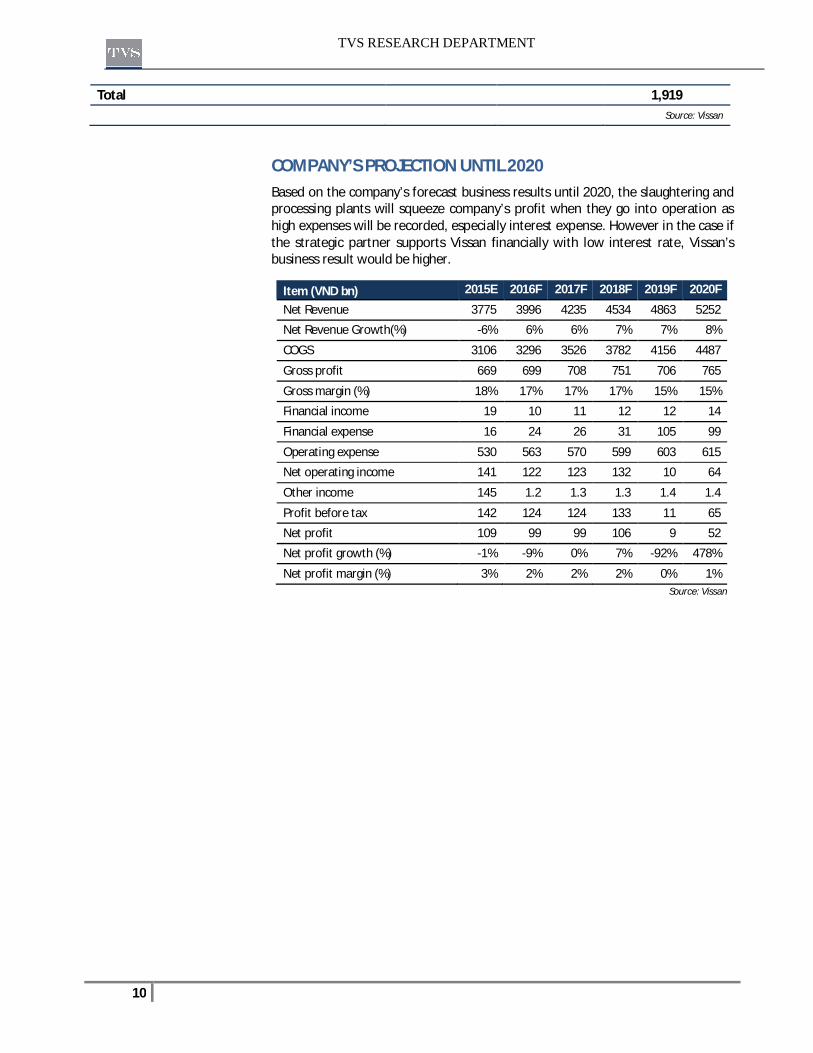
COMPANY’S PROJECTION UNTIL 2020 Based on the company’s forecast business results until 2020, the slaughtering and processing plants will squeeze company’s profit when they go into operation as high expenses will be recorded, especially interest expense. However in the case if the strategic partner supports Vissan financially with low interest rate, Vissan’s business result would be higher.
Item (VND bn) 2015E 2016F 2017F 2018F 2019F 2020F
Net Revenue 3775 3996 4235 4534 4863 5252
Net Revenue Growth(%) -6% 6% 6% 7% 7% 8%
COGS 3106 3296 3526 3782 4156 4487
Gross profit 669 699 708 751 706 765
Gross margin (%) 18% 17% 17% 17% 15% 15%
Financial income 19 10 11 12 12 14
Financial expense 16 24 26 31 105 99
Operating expense 530 563 570 599 603 615
Net operating income 141 122 123 132 10 64
Other income 145 1.2 1.3 1.3 1.4 1.4
Profit before tax 142 124 124 133 11 65
Net profit 109 99 99 106 9 52
Net profit growth (%) -1% -9% 0% 7% -92% 478%
Net profit margin (%) 3% 2% 2% 2% 0% 1%
Source: Vissan
TVS RESEARCH DEPARTMENT
11
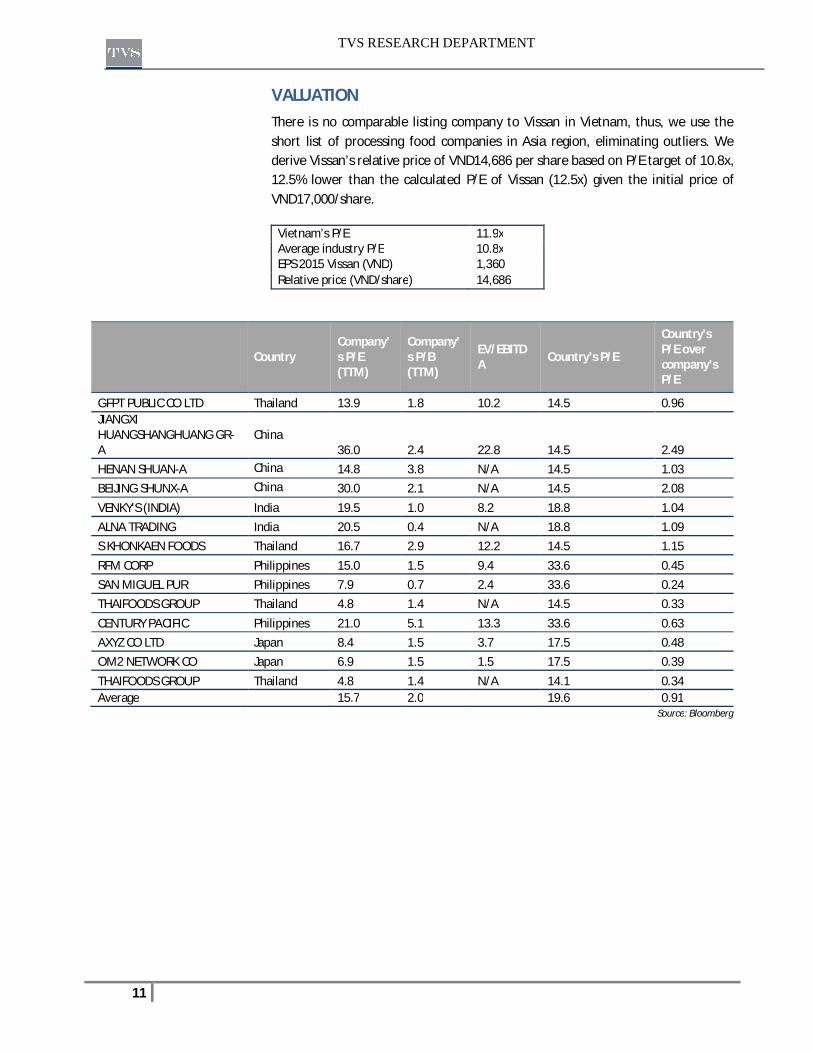
VALUATION There is no comparable listing company to Vissan in Vietnam, thus, we use the short list of processing food companies in Asia region, eliminating outliers. We derive Vissan’s relative price of VND14,686 per share based on P/E target of 10.8x, 12.5% lower than the calculated P/E of Vissan (12.5x) given the initial price of VND17,000/share.
Vietnam’s P/E 11.9x Average industry P/E 10.8x EPS 2015 Vissan (VND) 1,360 Relative price (VND/share) 14,686
Country Company’s P/E (TTM)
Company’s P/B (TTM)
EV/EBITDA Country’s P/E
Country’s P/E over company’s P/E
GFPT PUBLIC CO LTD Thailand 13.9 1.8 10.2 14.5 0.96 JIANGXI HUANGSHANGHUANG GR-A
China 36.0 2.4 22.8 14.5 2.49
HENAN SHUAN-A China 14.8 3.8 N/A 14.5 1.03 BEIJING SHUNX-A China 30.0 2.1 N/A 14.5 2.08 VENKY'S (INDIA) India 19.5 1.0 8.2 18.8 1.04 ALNA TRADING India 20.5 0.4 N/A 18.8 1.09 S KHONKAEN FOODS Thailand 16.7 2.9 12.2 14.5 1.15 RFM CORP Philippines 15.0 1.5 9.4 33.6 0.45 SAN MIGUEL PUR Philippines 7.9 0.7 2.4 33.6 0.24 THAIFOODS GROUP Thailand 4.8 1.4 N/A 14.5 0.33 CENTURY PACIFIC Philippines 21.0 5.1 13.3 33.6 0.63 AXYZ CO LTD Japan 8.4 1.5 3.7 17.5 0.48 OM2 NETWORK CO Japan 6.9 1.5 1.5 17.5 0.39 THAIFOODS GROUP Thailand 4.8 1.4 N/A 14.1 0.34 Average 15.7 2.0 19.6 0.91
Source: Bloomberg

TVS RESEARCH DEPARTMENT
12
APPENDIX 1: LIST OF VISSAN’S REAL ESTATES Hugh resource of real estates: Vissan is granted to exploit many real estates with good location. For the 420 No Trang Long area, Vissan will return to it to SATRA. Then SATRA will continue to hold auction and transfer the land use right there.
Land plot Total area (m2) GFA (m2) Rental land and allocated assets by the State 21-23 Phan Chu Trinh, Dist 1 202 568 251 Le Thanh Ton, Dist 1 80 231 42 Nguyen Thai Hoc, Dist 1 111 334 50-52 Nguyen Thai Hoc, Dist 1 157 410 19 Le Thach, Dist 4 58 121 23 Le Thach, Dist 4 95 232 30A Phan Van Khoe, Dist 5 150 217 645 Hong Bang, Dist 6 267 384 610A Hau Giang. Dist 6 95 212 320 Bach Dang, Binh Thanh 185 304 420 No Trang Long, Binh Thanh 148,465 44,141 290A No Trang Long, Binh Thanh 321 321 308 No Trang Long, Binh Thanh 259 523 675A Nguyen Kiem, Phu Nhuan 241 418 189 Hoang Van Thu, Phu Nhuan 263 467 240 Phan Dinh Phung, Phu Nhuan 59 87 21 Huynh Khuong An, Go Vap 1,013 1,870 114/4A Thong Nhat, Go Vap 991 571 1/1 Thong Nhat 41 41 318/13 Pham Van Hai, Tan Binh 171 227 31 Phu Hoa, Tan Binh 100 3111 Tien Son Industrial zone, Bac Ninh 12,640 5,379 140 + 473 Tran Hung Dao, dist 5 112 171 179 Hai Thuong Lan Ong,dist 5 99 204 342 Nguyen Trai dist 5 141 318 1156 Vo Van Kiet dist 5 223 386 146 Thap Muoi, Dist 6 81 107 42 Dinh Hoa , Dist 8 65 196 38B Nguyen Duy, , Dist 8 1245 1072 1438F Pham The Hien, , Dist 8 214 231 207 Tung Thien Vuong , Dist 8 532 532 972-974 3/2 Street , Dist 11 165 231 322-24 Nguyen Chi Thanh , Dist 10 163 303 340-342-344 Bui Huu Nghia, Binh Thanh 191 479 Hamlet 3, Bau Bang, Binh Duong 308 The land and assets on the land allocated by the State 464 Nguyen Huu Tho, Da Nang 524 1,422 Hamlet 5 Tan Hiep, Binh Duong 139,190 130,807 Purchased land area Tan Tao Industrial Park, Binh Tan District, HCMC 35,029 Hamlet 5, Luong Binh Ward, Ben Luc District, Long An Kiosks Go Vap Market, Ward 5, Go Vap District, HCMC 36 kiosks Tan Son Nhat Market, Ward 5, Go Vap District, HCMC 20 kiosks
Source: Vissan
TVS RESEARCH DEPARTMENT
13
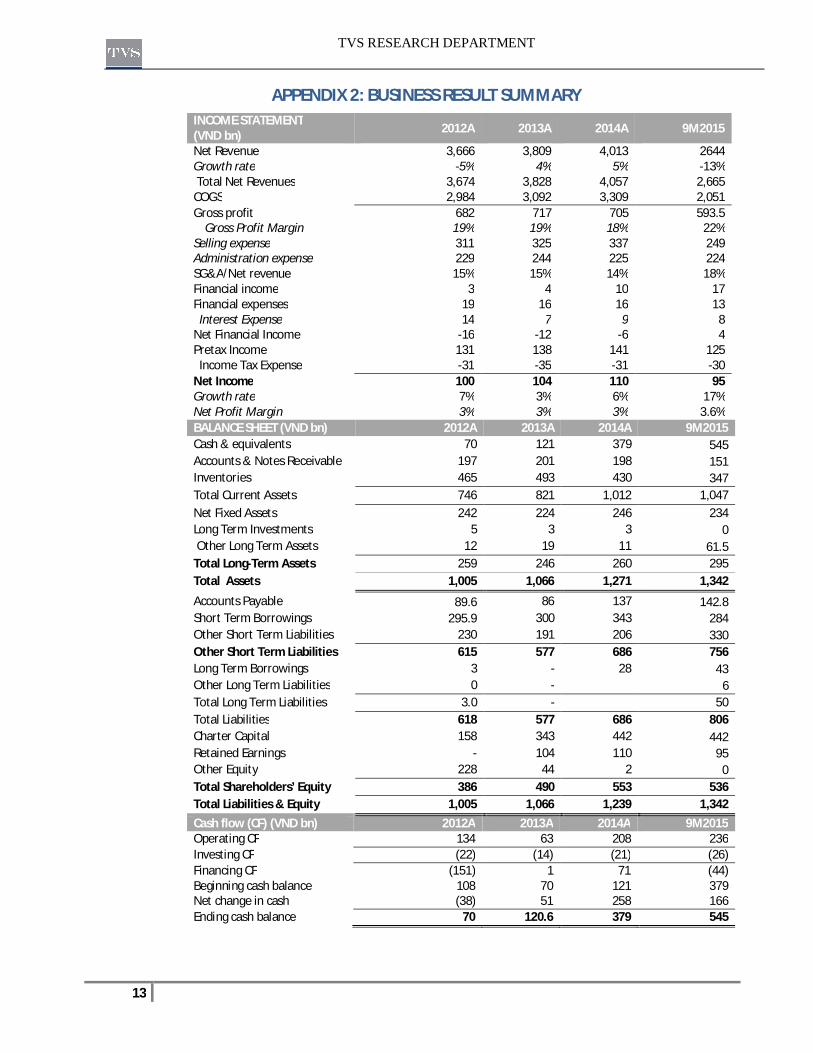
APPENDIX 2: BUSINESS RESULT SUMMARY INCOME STATEMENT (VND bn) 2012A 2013A 2014A 9M2015
Net Revenue 3,666 3,809 4,013 2644 Growth rate -5% 4% 5% -13% Total Net Revenues 3,674 3,828 4,057 2,665 COGS 2,984 3,092 3,309 2,051 Gross profit 682 717 705 593.5 Gross Profit Margin 19% 19% 18% 22% Selling expense 311 325 337 249 Administration expense 229 244 225 224 SG&A/Net revenue 15% 15% 14% 18% Financial income 3 4 10 17 Financial expenses 19 16 16 13 Interest Expense 14 7 9 8 Net Financial Income -16 -12 -6 4 Pretax Income 131 138 141 125 Income Tax Expense -31 -35 -31 -30 Net Income 100 104 110 95 Growth rate 7% 3% 6% 17% Net Profit Margin 3% 3% 3% 3.6% BALANCE SHEET (VND bn) 2012A 2013A 2014A 9M2015 Cash & equivalents 70 121 379 545 Accounts & Notes Receivable 197 201 198 151 Inventories 465 493 430 347 Total Current Assets 746 821 1,012 1,047 Net Fixed Assets 242 224 246 234 Long Term Investments 5 3 3 0 Other Long Term Assets 12 19 11 61.5 Total Long-Term Assets 259 246 260 295 Total Assets 1,005 1,066 1,271 1,342
Accounts Payable 89.6 86 137 142.8 Short Term Borrowings 295.9 300 343 284 Other Short Term Liabilities 230 191 206 330 Other Short Term Liabilities 615 577 686 756 Long Term Borrowings 3 - 28 43 Other Long Term Liabilities 0 - 6 Total Long Term Liabilities 3.0 - 50 Total Liabilities 618 577 686 806 Charter Capital 158 343 442 442 Retained Earnings - 104 110 95 Other Equity 228 44 2 0 Total Shareholders’ Equity 386 490 553 536 Total Liabilities & Equity 1,005 1,066 1,239 1,342 Cash flow (CF) (VND bn) 2012A 2013A 2014A 9M2015 Operating CF 134 63 208 236 Investing CF (22) (14) (21) (26) Financing CF (151) 1 71 (44) Beginning cash balance 108 70 121 379 Net change in cash (38) 51 258 166 Ending cash balance 70 120.6 379 545
TVS RESEARCH DEPARTMENT
14
ANALYST CERTIFICATION
We, Research Department of Thien Viet Securities Company (TVS), hereby certify that the views expressed in this research report accurately reflect our personal views about the subject securities or issuers. We will not compensate, directly or indirectly, for any specific recommendations or views expressed in this report.
THIEN VIET SECURITIES COMPANY
HO CHI MINH
63A Vo Van Tan St, District 3
Floor 9, Bitexco Nam Long Building
Tel: +84 (8) 299 2099
Fax: +84 (8) 299 2088
HA NOI
22 Lang Ha, Dong Da
TDL Building
Tel: +84 (4) 220 3228
Fax: +84 (4) 220 3227
RESEARCH DEPARTMENT INVESTMENT BANKING BROKERAGE DEPARTMENT
[email protected] [email protected]
DISCLAIMER
@Copyright by Thien Viet Securities Company. All rights reserved. This publication may not be redistributed, retransmitted or disclosed as a whole or partially in any form or manner without the prior written consent of Thien Viet Securities Company (TVS). The information herein is obtained from various sources and TVS does not guarantee its accuracy. Neither the information nor any opinions expressed in this publication constitutes a buy or sell recommendation on any securities or investment. TVS therefore does not take any responsibilities for any investor’s decisions.