Pre-Course Study Material Topography - NWCG · 1 Pre-Course Study Material Topography Topographic...
30
1 Pre-Course Study Material Topography Topographic Relief A topographic map is printed on a flat piece of paper. Therefore, it is necessary to use symbols to represent the variation in elevation (relief) of geographic features, such as ridges and valleys, hills, and streams. These ground forms are measured vertically as well as horizontally. Contour lines, colors, and raised areas are symbols that show changes in elevation. Maps with relief show the general shape of the land. Contour Lines A contour line is a line on a map or chart connecting all points of the same elevation. Any point on a contour line is the same elevation as all the other points on the same line. In other words, contour lines connect points of equal elevation.
-
Upload
truongdung -
Category
Documents
-
view
224 -
download
0
Transcript of Pre-Course Study Material Topography - NWCG · 1 Pre-Course Study Material Topography Topographic...
1
Pre-Course Study Material Topography
Topographic Relief A topographic map is printed on a flat piece of paper. Therefore, it is necessary to use symbols to represent the variation in elevation (relief) of geographic features, such as ridges and valleys, hills, and streams. These ground forms are measured vertically as well as horizontally. Contour lines, colors, and raised areas are symbols that show changes in elevation. Maps with relief show the general shape of the land. Contour Lines A contour line is a line on a map or chart connecting all points of the same elevation. Any point on a contour line is the same elevation as all the other points on the same line. In other words, contour lines connect points of equal elevation.
2
Contour interval is the difference in elevation between two adjacent contour lines. On U.S.G.S. maps they could be drawn at any elevation, but in practice they are drawn at intervals of 1, 5, 10, 20, 40, and 80 feet. Occasionally you will find a map with a 25 foot contour interval or metric units. To make the contours easier to read, every fifth one is printed darker and has the elevation marked every so often in the line (every fifth contour on 40' interval maps). This is called the index contour. The thinner or lighter colored contour lines are called intermediate contours. To find the contour interval on a map, check the legend or find two index contours adjacent to each other. Read their elevations and find the difference. If the number of spaces between them is 5, divide the difference by 5 to find the contour interval. If the number of spaces between them is 4, divide the difference by 4 to find the contour interval. For example: • Two adjacent index contour lines indicate 250 feet and 300 feet. • Find the difference by subtracting 250 feet from 300 feet = 50 feet. • Count the spaces between the dark index contour lines; there are 5. • Divide 50 feet by 5. • 50 divided by 5 = 10 foot contour interval. Contours have certain general characteristics. Below are characteristics which are not rules but guidelines that are helpful in many cases. Contours: • Usually have smooth curves. Exceptions are large outcrops of rocks, cliffs,
and fractured areas of the earth's surface. • Are "V" shaped in stream beds and narrow valleys. The point of the "V"
always points uphill or upstream. • Are usually "U" shaped on ridges with the "U" bottom pointing down the
ridge. • Are usually "M" or "W" shaped just upstream from stream junctions.
3
• Tend to run perpendicular to streams. • Tend to parallel each other, each approximately the shape of the one above it
and the one below it. • Do not cross or touch. Exception is overhanging cliffs. • Do not fork. • Never end on the map, only at the map edges and sometimes at overhanging
cliffs. • Indicate steep terrain by being closely spaced. • Indicate a uniform slope by being equally spaced. • Indicate depressions or pit by a contour line joined forming a circle having
hachures (short lines extending from the contour line at right angles). • Indicate elevation in feet above mean sea level in index contours. Contour Characteristic Terminology Depression: A low place in the ground having no outlet for surface drainage. Hill: A naturally occurring mass of earth whose crest or summit is at a lower elevation than a mountain. Mesa: A flat-topped mountain bounded on all sides by steep terrain. Ridge: Long narrow elevation of land, often located on a mountainside. Saddle: Ridge between two hills or summits. Valley: Stretch of low land lying between hills or mountains and sometimes occupied by a stream.

4
5
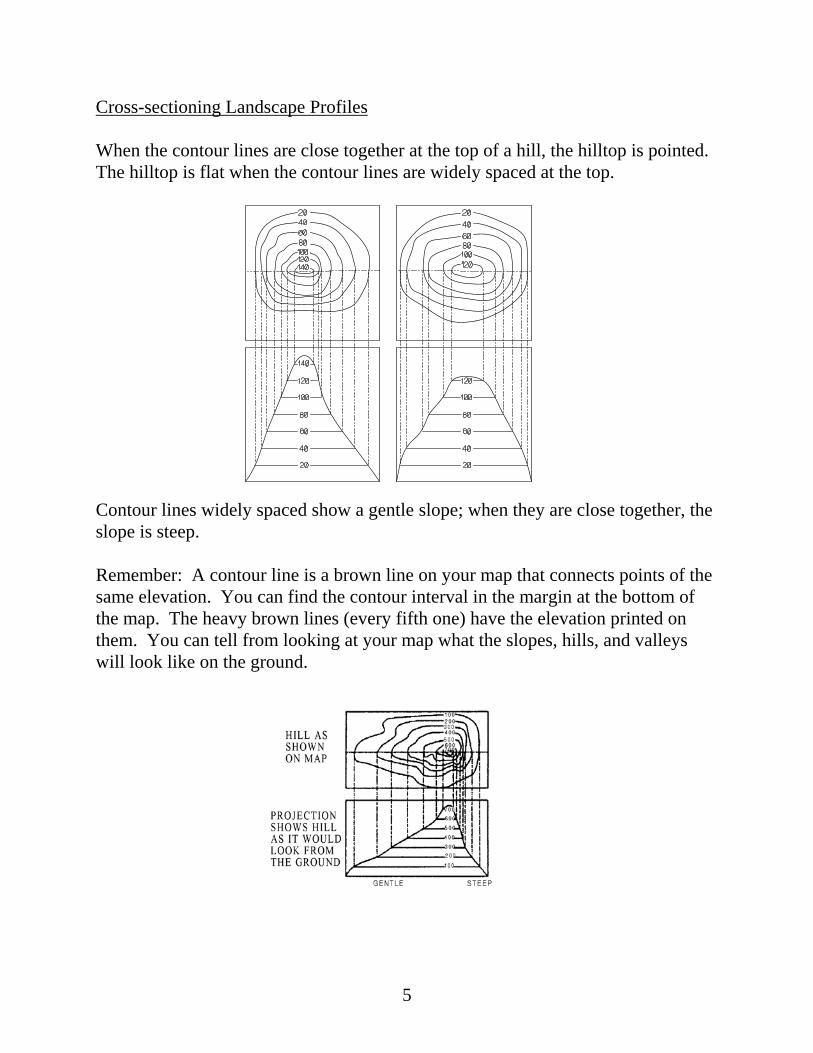
Cross-sectioning Landscape Profiles When the contour lines are close together at the top of a hill, the hilltop is pointed. The hilltop is flat when the contour lines are widely spaced at the top. Contour lines widely spaced show a gentle slope; when they are close together, the slope is steep. Remember: A contour line is a brown line on your map that connects points of the same elevation. You can find the contour interval in the margin at the bottom of the map. The heavy brown lines (every fifth one) have the elevation printed on them. You can tell from looking at your map what the slopes, hills, and valleys will look like on the ground.
6
Topography Questions 1. What is the definition of a contour line? 2. What is the definition of a contour interval? 3. Two adjacent index contour lines on a map are 500 feet and 700 feet, and
there are 5 spaces between them. What is the contour interval? 4. Do contour lines ever cross or touch? 5. What do contour lines that are closely spaced indicate? 6. What do hachures on contour lines indicate?
7
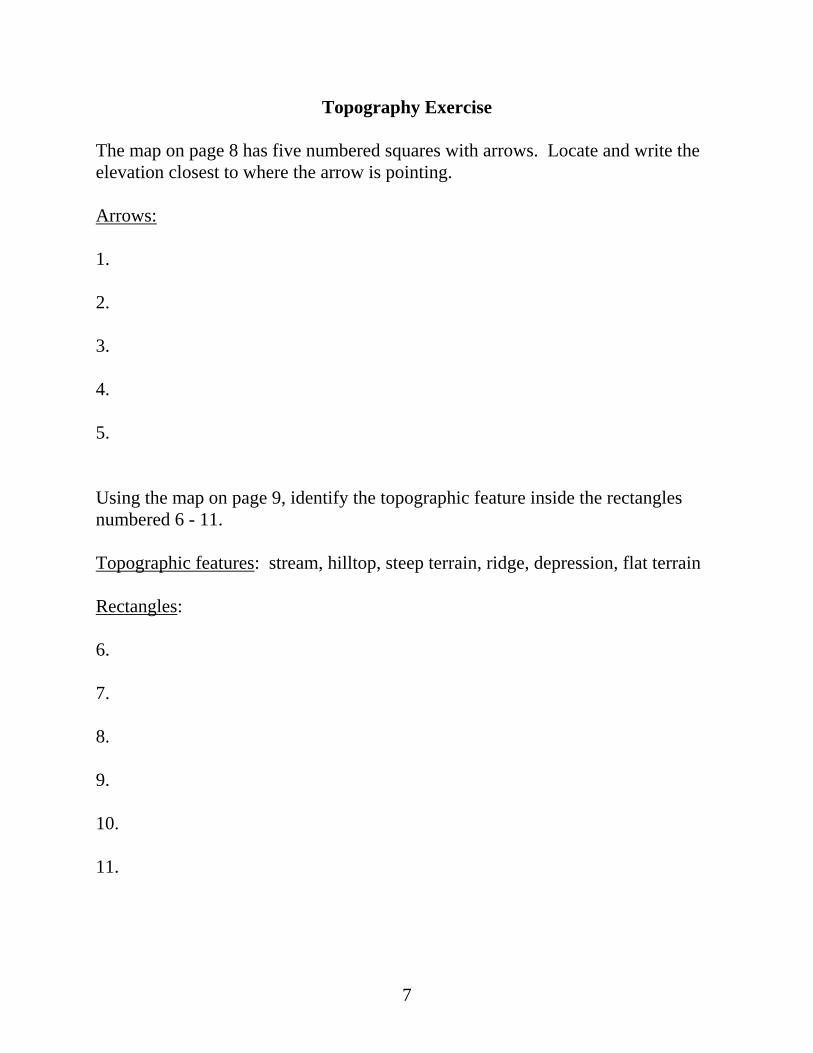
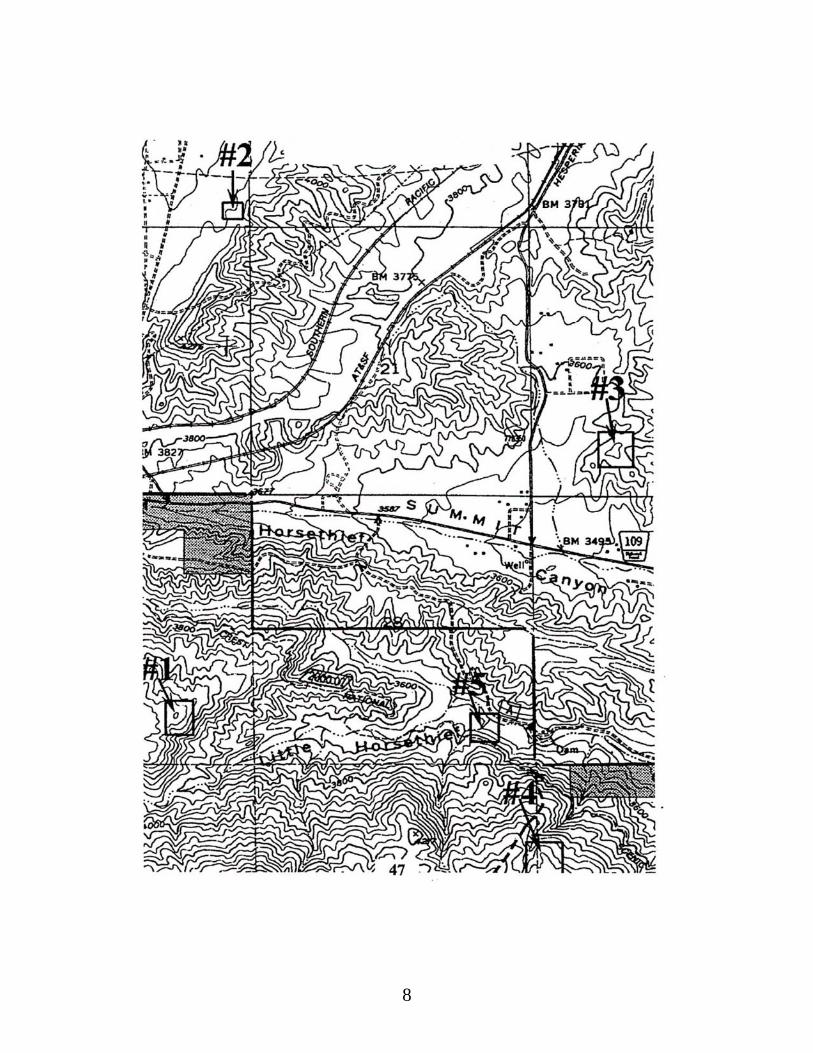
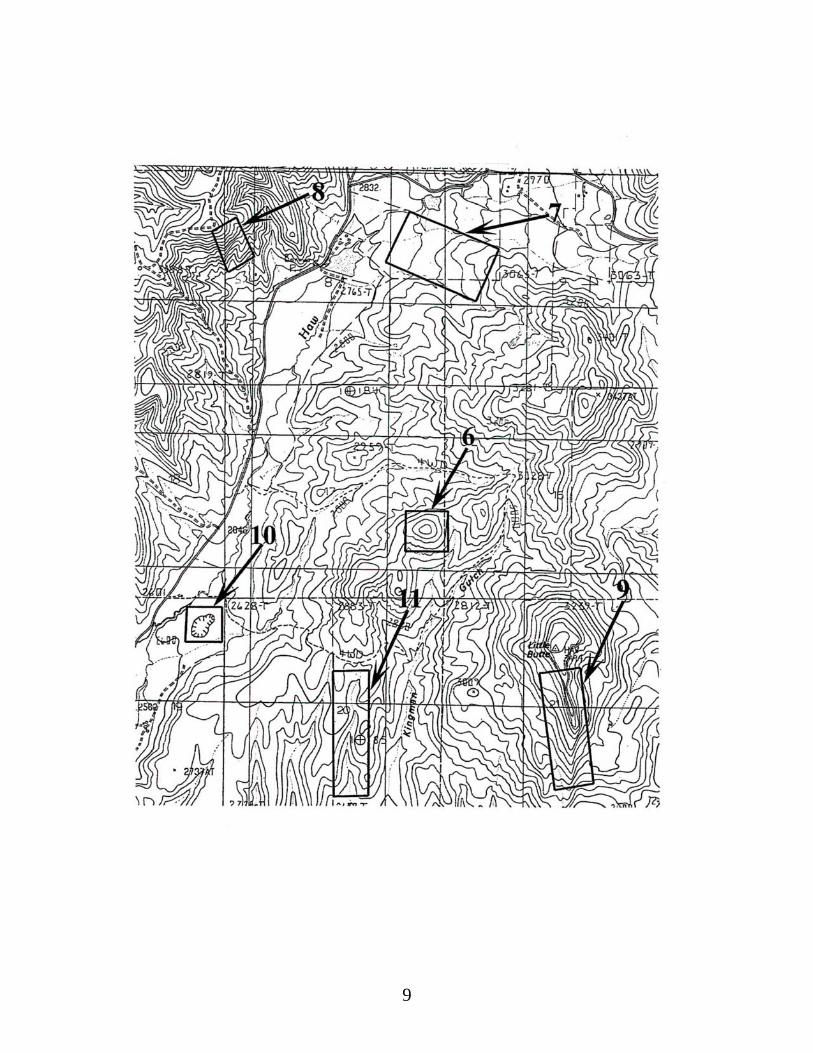
Topography Exercise The map on page 8 has five numbered squares with arrows. Locate and write the elevation closest to where the arrow is pointing. Arrows: 1. 2. 3. 4. 5. Using the map on page 9, identify the topographic feature inside the rectangles numbered 6 - 11. Topographic features: stream, hilltop, steep terrain, ridge, depression, flat terrain Rectangles: 6. 7. 8. 9. 10. 11.
8
9

10
Slope and Aspect A slope is an inclined ground surface that forms an angle with the horizontal plane (flat ground). The degree of inclination, steepness, is also called slope. Aspect is the compass direction that the slope is facing.
Percent Slope Slope is usually expressed in percent. It is useful in estimating the amount of time it takes to construct a piece of fireline. The estimation of percent slope can help determine whether or not a dozer, engine, or hand crew can work the topographic area. It is also used as an input for making fire behavior calculations. A one percent slope indicates a rise or drop of one unit over a distance of 100 horizontal units. Usually the mapper will be working with feet; therefore, a one percent slope rise would indicate a one foot rise over a 100 foot horizontal distance. Elevation/Vertical Difference Slope can be determined in several different ways in the field, or it can be calculated from a topographic map. A number of slope calculation aids are available in the form of tables that show the relationship between map scale and contour interval; contour overlays; and slope indicator overlays or templates. Use of slope calculation aids is limited by map scale and contour intervals, and most are designed to be used with USGS 7-1/2 minute quadrangle maps.

11
In order to obtain a slope percent from a topographic map, determine the difference in elevation between two different points in the area of concern. First determine the elevation of each location. To find the elevation of a point, locate the index contour nearest the point, and then count contour lines up or down to the point. Some computer software, like BEHAVE, will do the arithmetic automatically. Next, subtract one elevation from the other, and the difference is the vertical difference (rise). Estimating slope is a simple mathematical process. The formula is:
PERCENT SLOPE= VD x 100 or RISE x 100 HD RUN
VD or RISE = Vertical Distance (difference in elevation between two points; subtract one point in elevation from the other point). HD or RUN = Horizontal Distance measured with ruler on a map, from one point to the other). Given: RISE is (500'- 100') = 400'
RUN is 1600'
400 ÷ 1600 = .25 .25 x 100 = 25%
12
Slope Questions
1. What can the estimated percent slope help you determine? 2. How is slope expressed? 3. A one foot rise over 100 foot horizontal distance indicates what? 4. What is the percent slope formula? 5. What is the definition of slope?

13
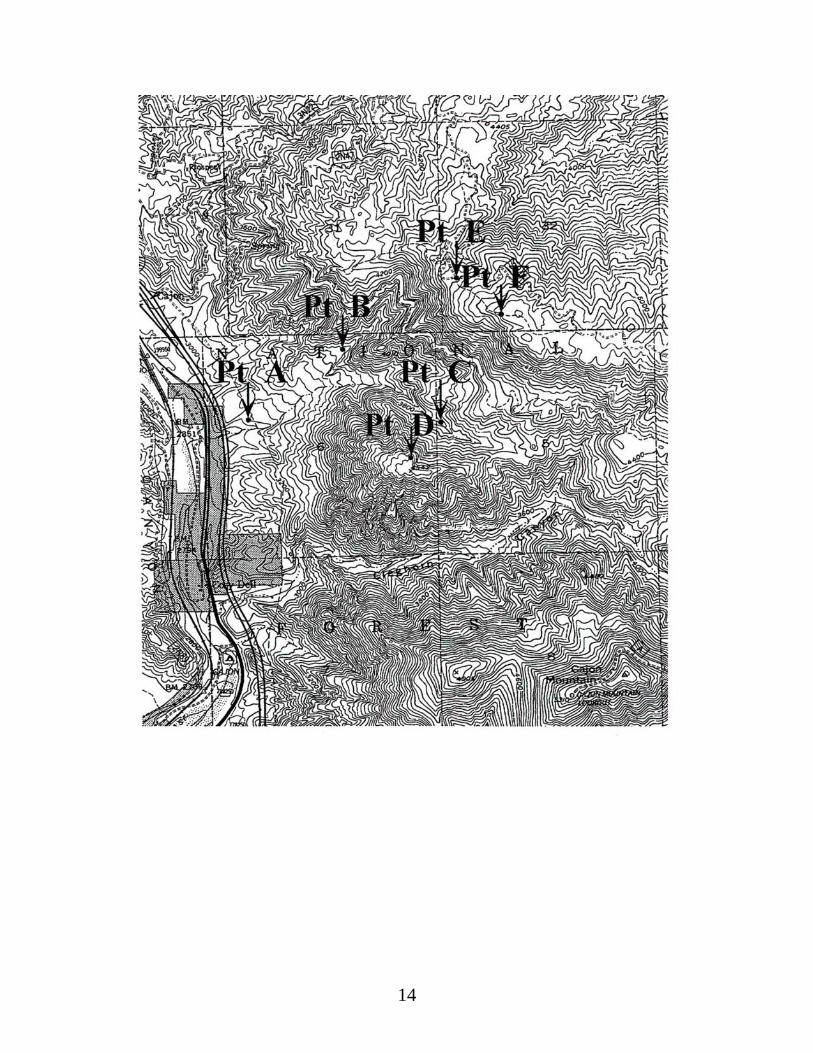
Slope Exercise
Solve the following slope problems using the map on the next page. The map scale is 1:24,000. 1. What is the contour interval on the map? 2. Calculate slopes between the following points:
A to B: C to D: E to F:
3. Traveling from Point F to Point E, is the direction of travel upslope or
downslope?
14

15
Topography Answers 1. A contour line is a line on a map or chart connecting all points of the same
elevation. 2. Contour interval is the difference in elevation between two adjacent contour
lines. 3. 700 feet - 500 feet = 200 feet
200 feet divided by 5 = 40 feet 40 foot interval
4. Yes, but only when indicating sheer or overhanging cliffs. 5. Steep terrain. 6. Depressions or pits. Topography Exercise Answers
1. 4160' 2. 4120' 3. 3640' 4. 4160' 5. 3520' 6. Hilltop 7. Flat terrain 8. Steep terrain 9. Ridge 10. Depression 11. Stream or drainage

16
Slope Answers 1. Whether or not a dozer, engine, or hand crew can work in the area. 2. Slope is usually expressed in percent. 3. One percent slope rise. 4. PERCENT SLOPE = (RISE divided by RUN) x 100 5. Slope is an inclined ground surface that forms an angle with the horizontal
plane (flat ground). Slope Exercise Answers 1. 40' 2. Vertical distance = 400'
Horizontal distance = 3000' 400 ÷3000 = .13, or 13%
Vertical distance = 640'
Horizontal distance = 1200' 640 ÷ 1200 = .53, or 53%
Vertical distance = 330'
Horizontal distance = 1400' 330 ÷ 1400 = .24, or 24%
3. Downslope
1
Pre-Course Study Material Weather
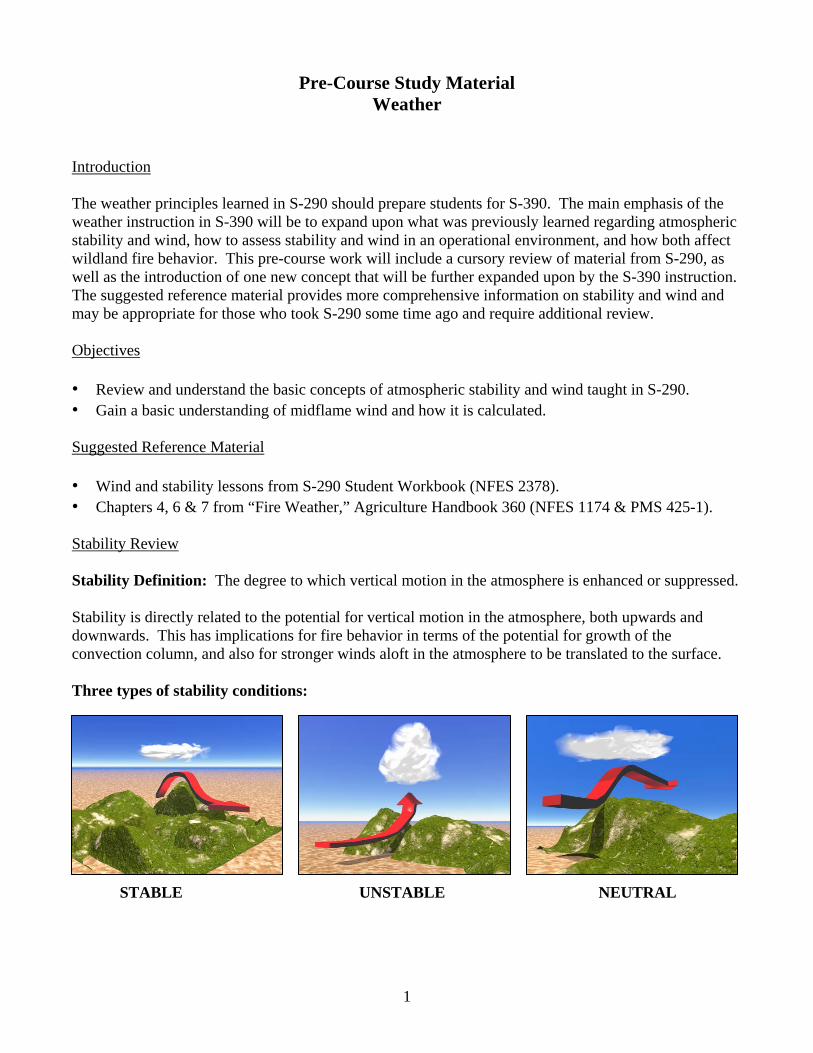
Introduction The weather principles learned in S-290 should prepare students for S-390. The main emphasis of the weather instruction in S-390 will be to expand upon what was previously learned regarding atmospheric stability and wind, how to assess stability and wind in an operational environment, and how both affect wildland fire behavior. This pre-course work will include a cursory review of material from S-290, as well as the introduction of one new concept that will be further expanded upon by the S-390 instruction. The suggested reference material provides more comprehensive information on stability and wind and may be appropriate for those who took S-290 some time ago and require additional review. Objectives • Review and understand the basic concepts of atmospheric stability and wind taught in S-290. • Gain a basic understanding of midflame wind and how it is calculated. Suggested Reference Material • Wind and stability lessons from S-290 Student Workbook (NFES 2378). • Chapters 4, 6 & 7 from “Fire Weather,” Agriculture Handbook 360 (NFES 1174 & PMS 425-1). Stability Review Stability Definition: The degree to which vertical motion in the atmosphere is enhanced or suppressed. Stability is directly related to the potential for vertical motion in the atmosphere, both upwards and downwards. This has implications for fire behavior in terms of the potential for growth of the convection column, and also for stronger winds aloft in the atmosphere to be translated to the surface. Three types of stability conditions:
STABLE UNSTABLE NEUTRAL
2
Stable: A stable atmosphere resists vertical motion. Air forced to move vertically will want to return to its original level.
Unstable: An unstable atmosphere promotes vertical motion. Air forced to move vertically will
continue to accelerate until it encounters air that is at the same temperature. Neutral: A neutral atmosphere neither promotes nor resists vertical motion. Air forced to move
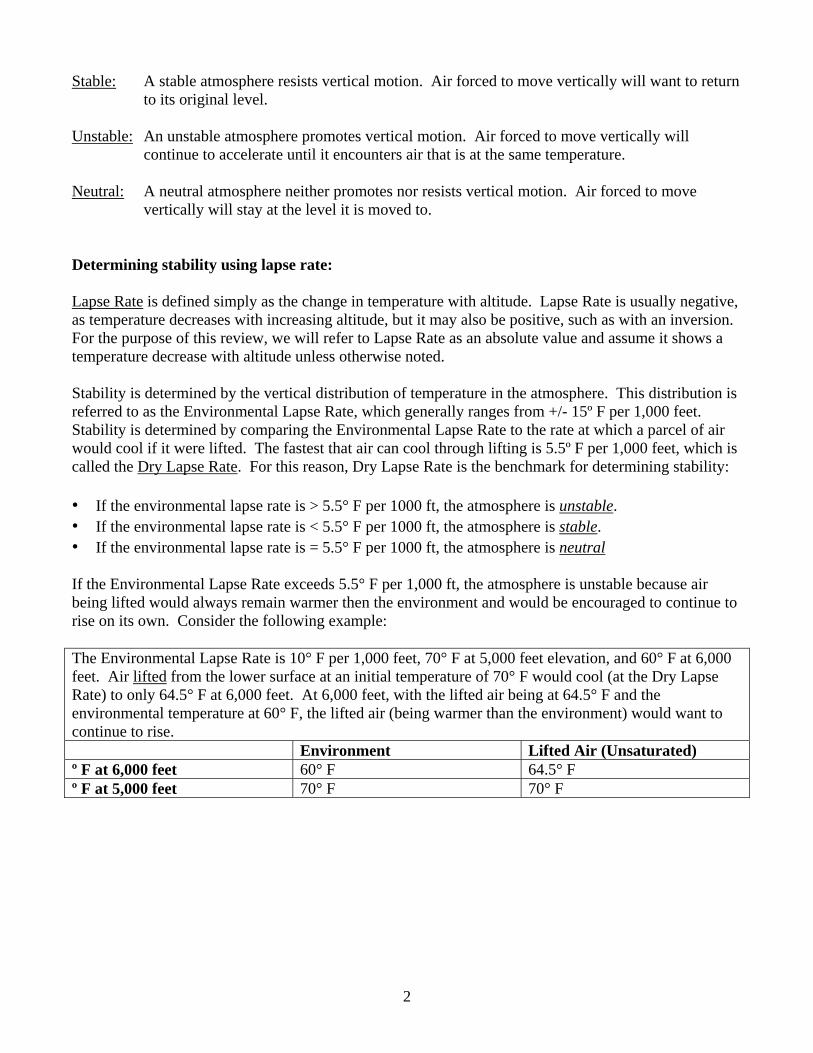
vertically will stay at the level it is moved to. Determining stability using lapse rate: Lapse Rate is defined simply as the change in temperature with altitude. Lapse Rate is usually negative, as temperature decreases with increasing altitude, but it may also be positive, such as with an inversion. For the purpose of this review, we will refer to Lapse Rate as an absolute value and assume it shows a temperature decrease with altitude unless otherwise noted. Stability is determined by the vertical distribution of temperature in the atmosphere. This distribution is referred to as the Environmental Lapse Rate, which generally ranges from +/- 15º F per 1,000 feet. Stability is determined by comparing the Environmental Lapse Rate to the rate at which a parcel of air would cool if it were lifted. The fastest that air can cool through lifting is 5.5º F per 1,000 feet, which is called the Dry Lapse Rate. For this reason, Dry Lapse Rate is the benchmark for determining stability: • If the environmental lapse rate is > 5.5° F per 1000 ft, the atmosphere is unstable. • If the environmental lapse rate is < 5.5° F per 1000 ft, the atmosphere is stable. • If the environmental lapse rate is = 5.5° F per 1000 ft, the atmosphere is neutral If the Environmental Lapse Rate exceeds 5.5° F per 1,000 ft, the atmosphere is unstable because air being lifted would always remain warmer then the environment and would be encouraged to continue to rise on its own. Consider the following example: The Environmental Lapse Rate is 10° F per 1,000 feet, 70° F at 5,000 feet elevation, and 60° F at 6,000 feet. Air lifted from the lower surface at an initial temperature of 70° F would cool (at the Dry Lapse Rate) to only 64.5° F at 6,000 feet. At 6,000 feet, with the lifted air being at 64.5° F and the environmental temperature at 60° F, the lifted air (being warmer than the environment) would want to continue to rise. Environment Lifted Air (Unsaturated) º F at 6,000 feet 60° F 64.5° F º F at 5,000 feet 70° F 70° F
3
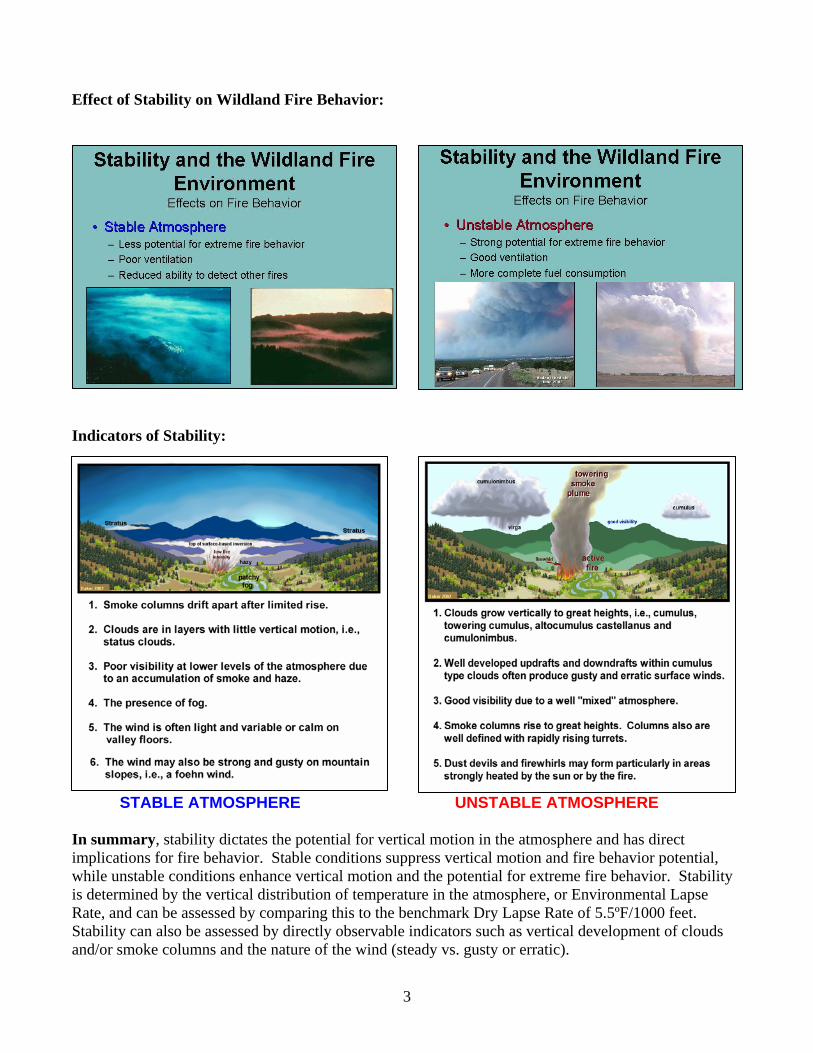
Effect of Stability on Wildland Fire Behavior:
Indicators of Stability:
STABLE ATMOSPHERE UNSTABLE ATMOSPHERE
In summary, stability dictates the potential for vertical motion in the atmosphere and has direct implications for fire behavior. Stable conditions suppress vertical motion and fire behavior potential, while unstable conditions enhance vertical motion and the potential for extreme fire behavior. Stability is determined by the vertical distribution of temperature in the atmosphere, or Environmental Lapse Rate, and can be assessed by comparing this to the benchmark Dry Lapse Rate of 5.5ºF/1000 feet. Stability can also be assessed by directly observable indicators such as vertical development of clouds and/or smoke columns and the nature of the wind (steady vs. gusty or erratic).
4
Wind Review Wind Definition: The horizontal movement of air caused by differences in pressure. Wind has some rather obvious impacts on wildland fire behavior, including the following: • Wind carries away moisture and hastens the drying of wildland fuels. • Once a fire ignites, wind aids combustion by increasing the supply of
oxygen. • Wind increases fire spread by carrying heat and burning embers to new
fuels – spotting. • Wind bends the flames closer to the unburned fuels, thus preheating the
fuels ahead of the fire front. • Finally, the DIRECTION of the fire spread is determined mostly by
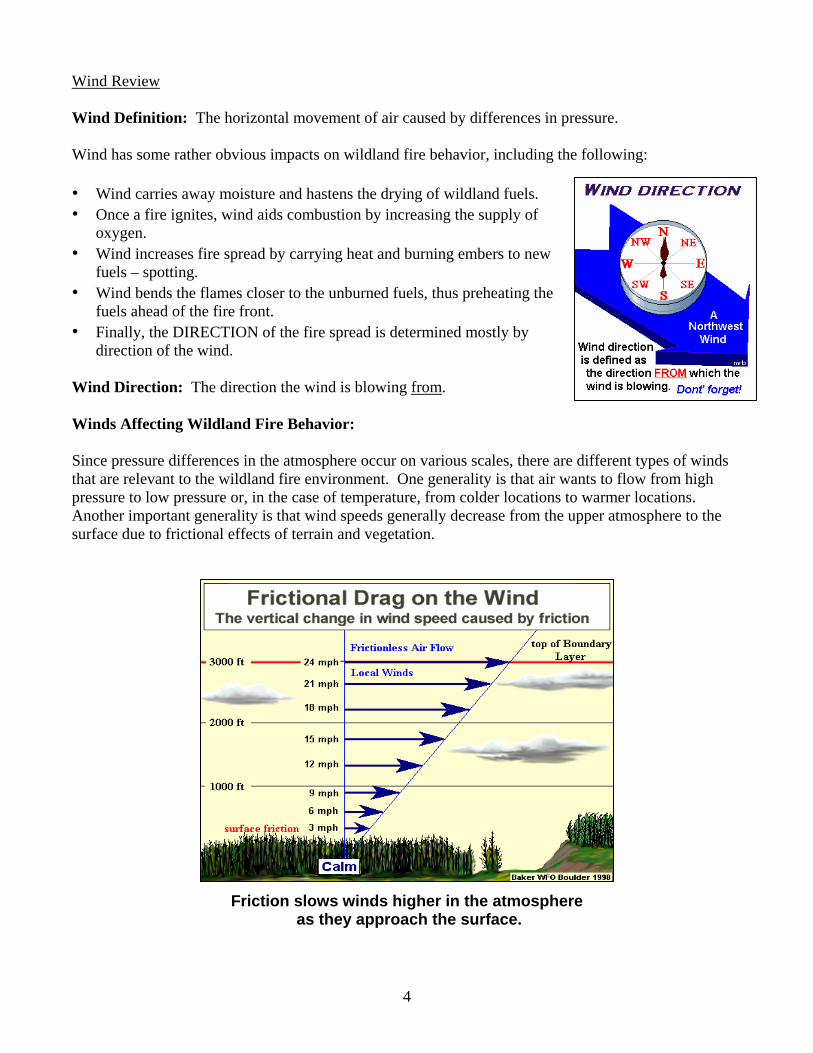
direction of the wind. Wind Direction: The direction the wind is blowing from. Winds Affecting Wildland Fire Behavior: Since pressure differences in the atmosphere occur on various scales, there are different types of winds that are relevant to the wildland fire environment. One generality is that air wants to flow from high pressure to low pressure or, in the case of temperature, from colder locations to warmer locations. Another important generality is that wind speeds generally decrease from the upper atmosphere to the surface due to frictional effects of terrain and vegetation.
Friction slows winds higher in the atmosphere as they approach the surface.
5
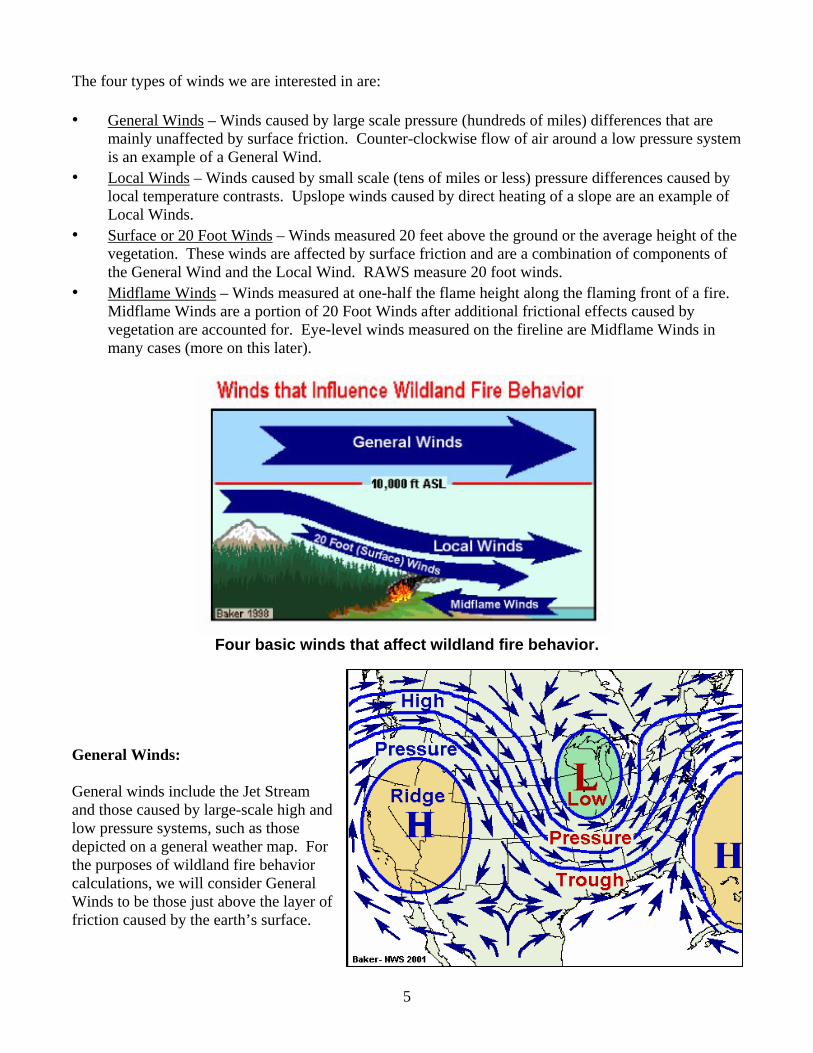
The four types of winds we are interested in are: • General Winds – Winds caused by large scale pressure (hundreds of miles) differences that are
mainly unaffected by surface friction. Counter-clockwise flow of air around a low pressure system is an example of a General Wind.
• Local Winds – Winds caused by small scale (tens of miles or less) pressure differences caused by local temperature contrasts. Upslope winds caused by direct heating of a slope are an example of Local Winds.
• Surface or 20 Foot Winds – Winds measured 20 feet above the ground or the average height of the vegetation. These winds are affected by surface friction and are a combination of components of the General Wind and the Local Wind. RAWS measure 20 foot winds.
• Midflame Winds – Winds measured at one-half the flame height along the flaming front of a fire. Midflame Winds are a portion of 20 Foot Winds after additional frictional effects caused by vegetation are accounted for. Eye-level winds measured on the fireline are Midflame Winds in many cases (more on this later).
Four basic winds that affect wildland fire behavior.
General Winds: General winds include the Jet Stream and those caused by large-scale high and low pressure systems, such as those depicted on a general weather map. For the purposes of wildland fire behavior calculations, we will consider General Winds to be those just above the layer of friction caused by the earth’s surface.

6
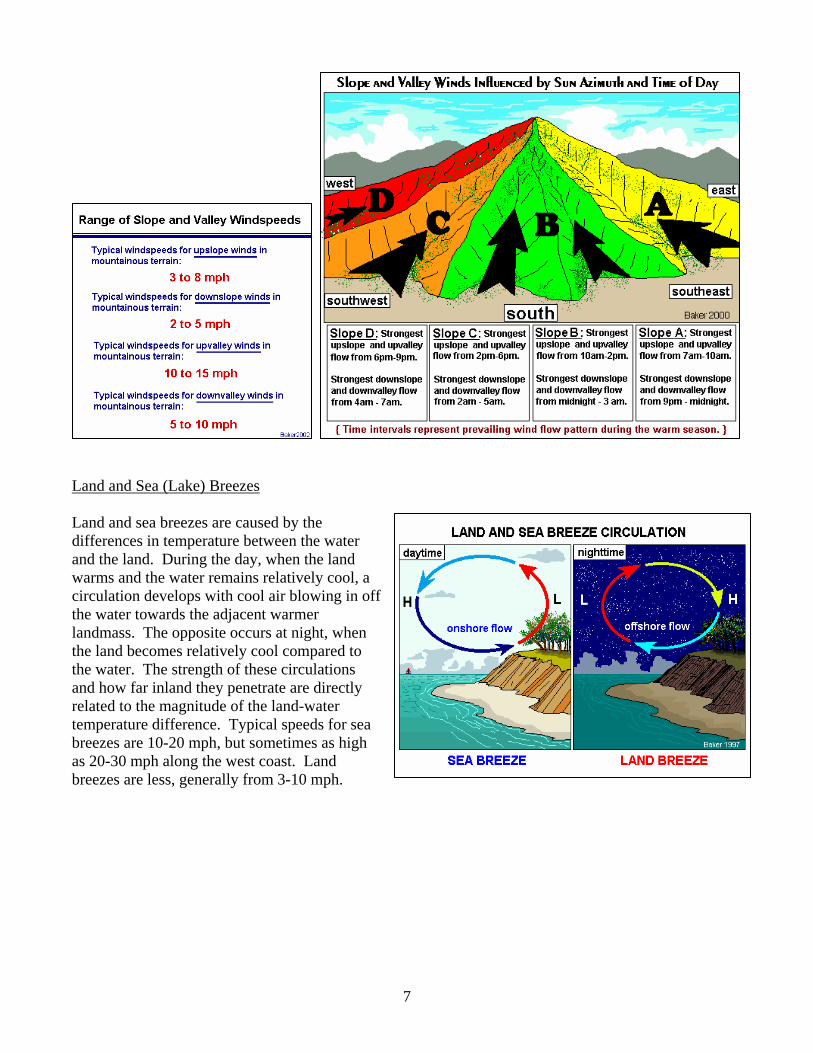
Local Winds: As previously stated, Local Winds are caused by small scale pressure differences caused by local temperature contrasts. In the context of wildland fire behavior, the main Local Winds to be considered are the slope and valley wind systems caused by temperature contrasts in complex terrain, and land and sea breeze systems caused by the temperature differences between bodies of water and adjacent land masses. Slope and Valley Winds – Upslope and upvalley winds are caused by direct heating of the surface and by the resulting rising temperatures in valley locations respectively. Upslope winds are controlled by the amount of solar radiation received and thus are affected by time of year, time of day, aspect, slope and latitude. Upvalley winds are similar with regard to the need for solar radiation, but are dependent on the resulting surface temperatures within a valley. Upslope winds start earlier in the day and are relatively weak, while upvalley winds lag behind upslope winds by several hours and are relatively strong. Downslope and downvalley winds are caused by the exact opposite mechanism, namely radiational cooling at night. Anything which promotes rapid cooling, such as clear skies, aids the development of downslope/downvalley winds. There is a similar relationship to upslope/upvalley winds with regard to time of development and strength.
7
Land and Sea (Lake) Breezes Land and sea breezes are caused by the differences in temperature between the water and the land. During the day, when the land warms and the water remains relatively cool, a circulation develops with cool air blowing in off the water towards the adjacent warmer landmass. The opposite occurs at night, when the land becomes relatively cool compared to the water. The strength of these circulations and how far inland they penetrate are directly related to the magnitude of the land-water temperature difference. Typical speeds for sea breezes are 10-20 mph, but sometimes as high as 20-30 mph along the west coast. Land breezes are less, generally from 3-10 mph.

8
Surface or 20 Foot Winds: = General Wind Component + Local Wind Component
Simply stated, the 20 Foot Wind is the combined effect of the General and Local Winds measured 20 feet above the ground or average vegetation height. The Local Wind Component is essentially just whatever Local Wind is applicable for a given location. The General Wind Component is a portion of the General Wind after it has been altered and/or slowed by topography and surface friction. The frictional slowing of the General Wind will be quantified and covered in detail in S-390, but here are a few ways that terrain can alter the flow of the General Wind and impact the 20 Foot Wind:

9
There are special circumstances under which 20 Foot Winds are completed dominated by especially strong or erratic General or Local Winds. These winds which dominate the fire environment are known as Critical Winds. When Critical Winds exist, the 20 Foot Wind becomes the Critical Wind. Critical Winds most applicable to the wildland fire environment are as follows: • Cold Frontal Winds – Strong and
shifting General Winds associated with cold fronts. Strong southerly winds ahead of an approaching cold front rapidly shift to the west or northwest with the front’s passage.
• Foehn Winds – Strong downslope General Winds that occur on the lee side of mountain ranges when high pressure is building on the windward side of the range. These winds are warm, dry and can persist for up to a few days.
10
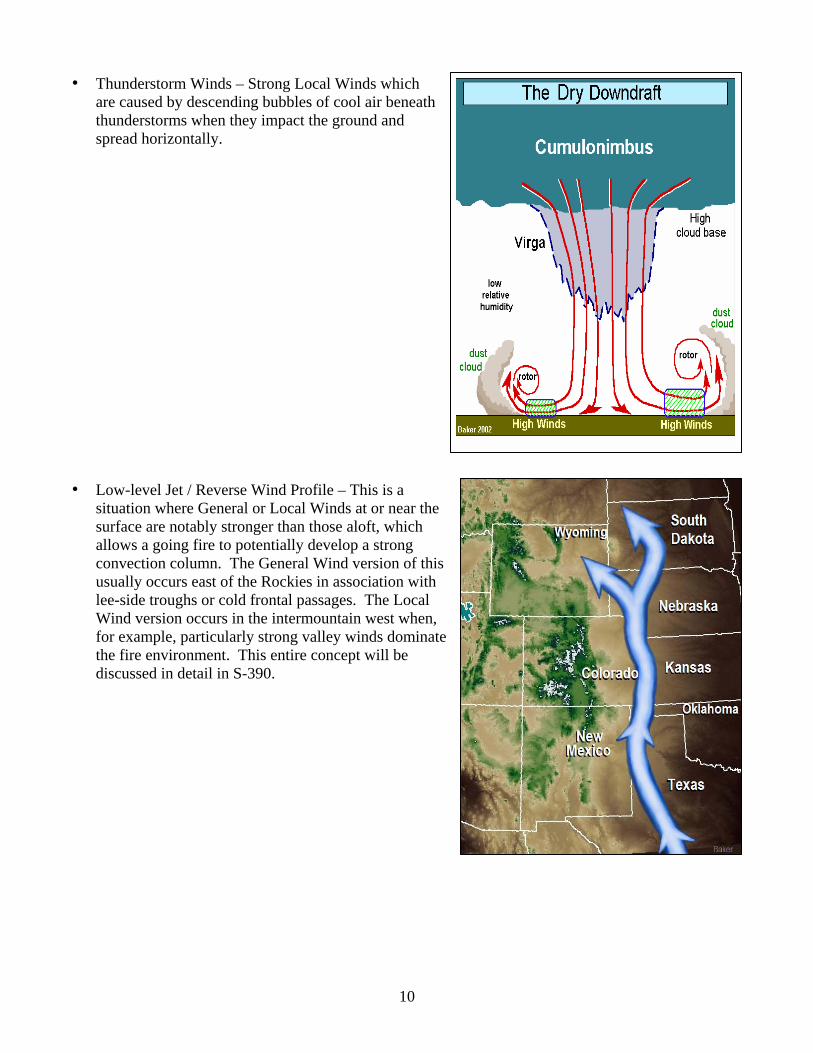
• Thunderstorm Winds – Strong Local Winds which are caused by descending bubbles of cool air beneath thunderstorms when they impact the ground and spread horizontally.
• Low-level Jet / Reverse Wind Profile – This is a situation where General or Local Winds at or near the surface are notably stronger than those aloft, which allows a going fire to potentially develop a strong convection column. The General Wind version of this usually occurs east of the Rockies in association with lee-side troughs or cold frontal passages. The Local Wind version occurs in the intermountain west when, for example, particularly strong valley winds dominate the fire environment. This entire concept will be discussed in detail in S-390.

11
• Whirlwinds – Including Dust Devils and Firewhirls, these Local Winds occur on hot, unstable days with light winds. They are the result of intense, localized convection currents that develop rotation. Burned areas are especially susceptible to whirlwinds due to the dark surface which maximizes absorption of solar radiation. Whirlwinds can extend to hundreds or even thousands of feet in the extreme and can cause prolific spotting and extreme and erratic fire behavior.
Critical Winds aside, below are a few examples of how the General and Local Wind components combine to produce the 20 Foot Wind. Note how the impact the General Wind has on 20 Foot Wind varies from day to night. This ultimately is related to atmospheric stability and will be discussed in detail in S-390.

12
Midflame Winds: Midflame Winds are measured at one-half the flame height along the flaming front of a fire, and are basically a portion of 20 Foot Winds after additional frictional effects caused by vegetation are accounted for. Eye-level winds measured on the fireline are similar in many cases to Midflame Winds, except when there is extreme fire behavior and overly large flame lengths.
Calculating the 20Calculating the 20--foot Windfoot Wind
13
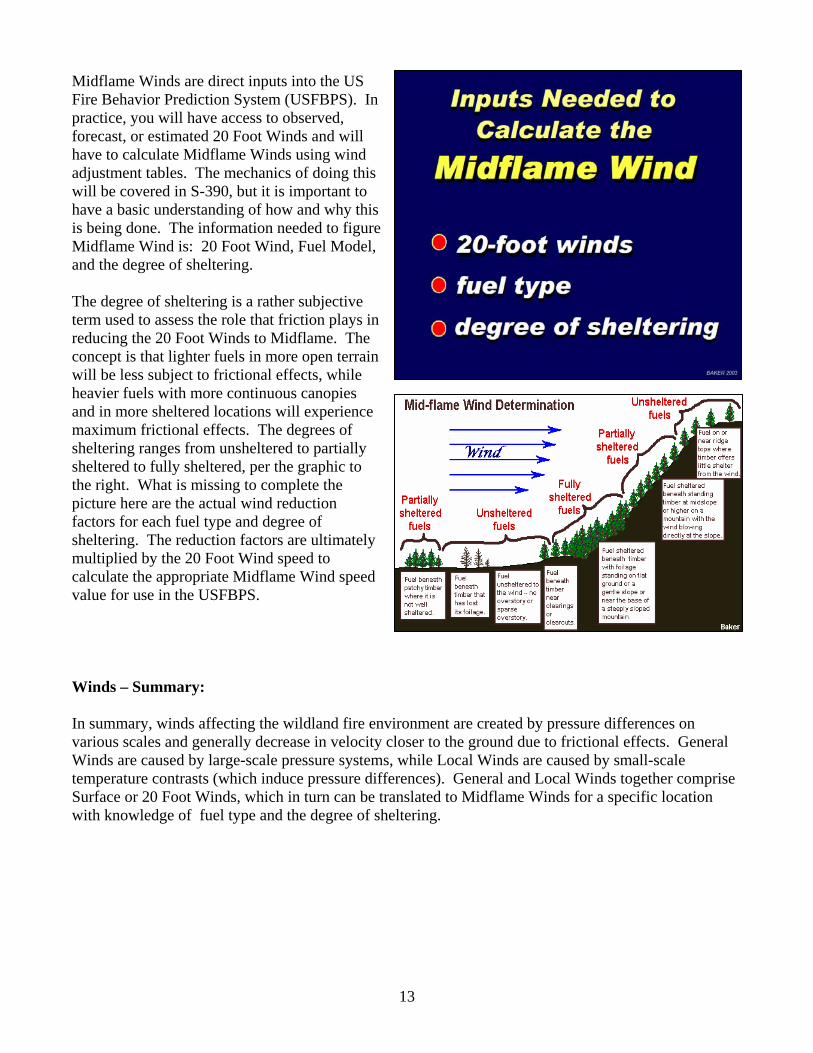
Midflame Winds are direct inputs into the US Fire Behavior Prediction System (USFBPS). In practice, you will have access to observed, forecast, or estimated 20 Foot Winds and will have to calculate Midflame Winds using wind adjustment tables. The mechanics of doing this will be covered in S-390, but it is important to have a basic understanding of how and why this is being done. The information needed to figure Midflame Wind is: 20 Foot Wind, Fuel Model, and the degree of sheltering. The degree of sheltering is a rather subjective term used to assess the role that friction plays in reducing the 20 Foot Winds to Midflame. The concept is that lighter fuels in more open terrain will be less subject to frictional effects, while heavier fuels with more continuous canopies and in more sheltered locations will experience maximum frictional effects. The degrees of sheltering ranges from unsheltered to partially sheltered to fully sheltered, per the graphic to the right. What is missing to complete the picture here are the actual wind reduction factors for each fuel type and degree of sheltering. The reduction factors are ultimately multiplied by the 20 Foot Wind speed to calculate the appropriate Midflame Wind speed value for use in the USFBPS. Winds – Summary: In summary, winds affecting the wildland fire environment are created by pressure differences on various scales and generally decrease in velocity closer to the ground due to frictional effects. General Winds are caused by large-scale pressure systems, while Local Winds are caused by small-scale temperature contrasts (which induce pressure differences). General and Local Winds together comprise Surface or 20 Foot Winds, which in turn can be translated to Midflame Winds for a specific location with knowledge of fuel type and the degree of sheltering.

14