
Pravartana - Runners Up Team
18
Team Numero Uno K. J. SOMAIYA INSTITUTE OF MANAGEMENT STUDIES AND RESEARCH Team Members : - • Trimurti Gupta • Vikas Sonwane • Pulkit Giria
-
Upload
vikas-sonwane -
Category
Economy & Finance
-
view
47 -
download
5
Transcript of Pravartana - Runners Up Team

Team
Numero Uno
K. J. SOMAIYA INSTITUTEOF MANAGEMENTSTUDIES AND RESEARCH
Team Members : -
• Trimurti Gupta• Vikas Sonwane• Pulkit Giria
0
20
40
60
80
100
120
140
1/1
/20
10
4/1
/20
10
7/1
/20
10
10
/1/2
01
0
1/1
/20
11
4/1
/20
11
7/1
/20
11
10
/1/2
01
1
1/1
/20
12
4/1
/20
12
7/1
/20
12
10
/1/2
01
2
1/1
/20
13
4/1
/20
13
7/1
/20
13
10
/1/2
01
3
1/1
/20
14
4/1
/20
14
7/1
/20
14
10
/1/2
01
4
1/1
/20
15
Do
llar
Pri
ce p
er
Bar
rel
Monthly
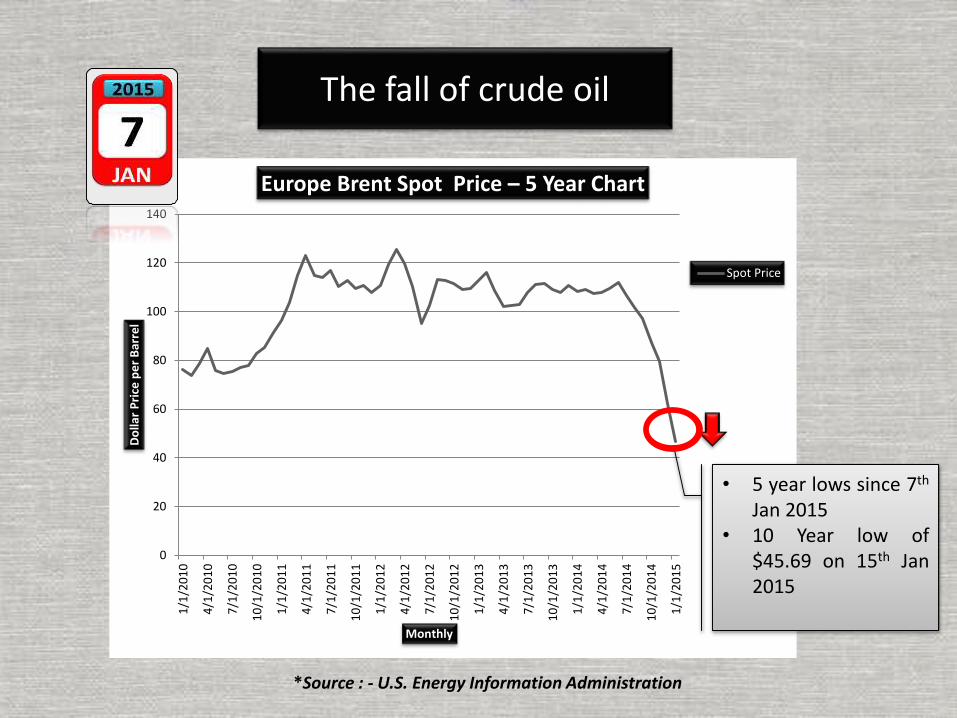
Europe Brent Spot Price – 5 Year Chart
Spot Price
The fall of crude oil
• 5 year lows since 7th
Jan 2015• 10 Year low of
$45.69 on 15th Jan2015
*Source : - U.S. Energy Information Administration

High Supply Demand Mismatch
• A Historical surplusproduction in excessof 2 million barrelsper day
*Source : - U.S. Energy Information Administration

Reasons for this fall
Supply
Shale Oil Boom
•10% and growing of Daily production of crude oil
OPEC excess supply
•Price war for hurting Shale gas producers
•Gain Market Share from Iran & Iraq
Alternative Sources of Energy
•Electric Vehicles
•Bio fuel supply
Demand
China Slowdown
•Chinese economy is slowing to a growth rate of 7.3%
Europe Debt Crisis
•Slow down in economies or Greece, Spain ,Portugal, Ireland and Cyprus
Global Weak Demand
•Weak Demand
•Drive towards alternative sources of energy

“Be Fearful When Others Are Greedy and Greedy When Others Are
Fearful”-Warren Buffett
The ‘Oracle of Omaha’

Why Oil prices will recover – Fundamentals
Shale Oil Economics not sustainable
• Majority of Oil producers have a breakeven in a wide range of $ 59-$80
• The profitability of shale gas is not uniform
• High Debt for some shale gas projects
• OPEC countries have a lot of war chest
Economic Fundamentals
• Demand from Indian Economy having a GDP growth rate of 7.7%
• Stronger European and North American economies
• OPEC strategy Outcome– Either shale market would
break
– OPEC would need to cut down production
– Either ways price will increase

Technical Indicators
0
20
40
60
80
100
120
140
May
-19
87
Jun
-19
88
Jul-
19
89
Au
g-1
99
0
Sep
-19
91
Oct
-19
92
No
v-1
99
3
De
c-1
99
4
Jan
-19
96
Feb
-19
97
Mar
-19
98
Ap
r-1
99
9
May
-20
00
Jun
-20
01
Jul-
20
02
Au
g-2
00
3
Sep
-20
04
Oct
-20
05
No
v-2
00
6
De
c-2
00
7
Jan
-20
09
Feb
-20
10
Mar
-20
11
Ap
r-2
01
2
May
-20
13
Jun
-20
14
Do
llar
Pri
ce p
er
Bar
rel
Monthly
25 Year Historical prices
Spot Price
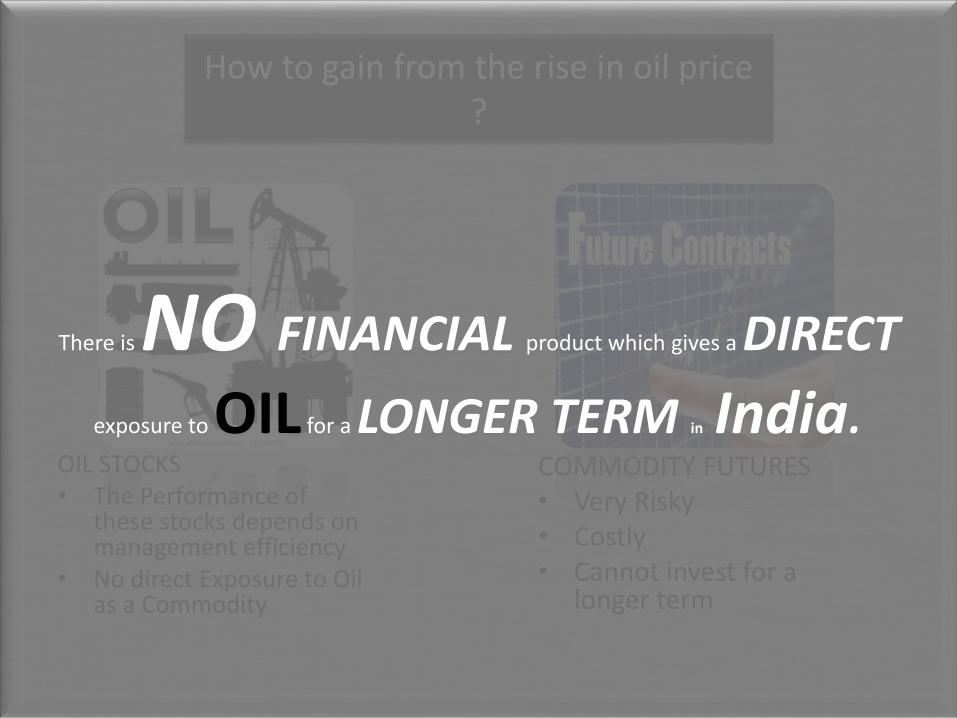
How to gain from the rise in oil price ?
OIL STOCKS• The Performance of
these stocks depends on management efficiency
• No direct Exposure to Oil as a Commodity
COMMODITY FUTURES• Very Risky • Costly• Cannot invest for a
longer term
There is NO FINANCIAL product which gives a DIRECT
exposure to OIL for a LONGER TERM in India.

The Emerging India Oil Exchange Traded Fund - OETF
OETF
Seller Buyer
What is OETF ?The Oil exchange tradefund will be a domesticexchange traded securitydesigned to track the dailyprices movements of MCXcrude oil index. The AssetManagement Company willissue shares that may bepurchased and sold on theNational Stock Exchange.
CashOETF
shares

Variable Cash Flow
Pri
mar
y M
arke
tSe
con
dar
y M
arke
t
Authorized Participants/
Financial Institutions
NSESeller Buyer
Fund
Cash
OETF shares Cash
OETF shares
Swap Counter-Party
Cash
Index Return
Swap Counter-Party
Index Return
Cash
Collateral Basket
Cash
ReturnOn
Collateral
Cash OETF shares
WORKING DIAGRAM

Type of Fund Non-Equity Exchange Traded fund Linked to Crude Oil
Investment Investment in Underlying Crude Oil
Country of Investment India
Taxation Treatment Capital Gains
Benchmark Index MCX Crude Oil Index
Fund Inception Launched around March 2015
Pricing per unit Approximately 10% price of 1 Barrel of Crude Oil
Minimum Lot(Exchange) One Unit/Share
Minimum Lot (Directly with fund
as per creation unit)
1000 units
Expense Ratio 1.5% Annualized
• Fact Sheet
Features and FACT Sheet

Holdings
• Commodity Futures
• Present Month
• Near Month futures
• Cash
• Indian Rupee
• U.S. Dollars
• Government Bonds
• Short term Maturity
• Long term Maturity
Portfolio Holdings
CRUDE OIL 19Feb2015
15%
CRUDE OIL 19Mar201
524%
8% Govt. of India Savings Bonds (2015)
14%
8% Govt. of India Savings Bonds (2017)
24%
Indian Rupee18%
US Dollars5% Percentage
breakup

Benefits
Equity like features
• Commodity traded as a stock on national stock exchange
Commodity exposure
• Commodity exposure without using the commodity trading account
Used as a Financial hedging instrument against rise in crude oil
Lower expenses as compared to mutual funds
• Fund is managed passively hence lower expense and fees
Low capital gains tax as compared to mutual funds

Returns
SCENARIO RANGE (LOW –HIGH) RETURN
Best Case $85 - $90 55 %
Base Case $72 - $76 31%
Worst Case $38 - $43 (25%)
Calculations based on oil price on 12-02-2015 - $58Time period of 15 – 24 months

Risks Involved
Investment Risk
• Investment not suitable for all kind of investors
• Economic, demand and supply conditions
• Commodity Trading is highly speculative
• Very Volatile and high degree of risk
• Concentration risk
• Can suffer from prolonged periods of decline in value
Operational Risks
• Tracking error risk as is the case of every index fund (Correlation risk
• Risks related to every ETF fund
• Natural forces of “Backwardation” and “Contango”
• Liquidity risk
• OTC credit risk

Market Size of Crude oilbased Financial Product in
India
Investor Response
Commodity ETF Gold Fund
₹1100 crore
MCX Crude Oil Market
2 OUT OF 10
investors
Highest open
Interest for the 19th
Feb 2015 Expiry
AUM Of ₹2365.11 crore
*Source : - www.mcxindia.com, www.nseindia.com
*Source : - Team survey from potential investors

Income generated for theasset management company
• Considering the corpus of ₹ 1100 crore
– Management fee as 1.5 % of AUM
Particulars Amount
Revenue for AMC ₹ 16.5 crore
Less : Management fees ₹ 7.05 crore
Less : Brokerage Commissions ₹ 3.12 crore
Less : Other expenses ₹ .83 crore
Net Profit ₹ 5.5 crore

THANK YOU
THE EMERGING INDIA OIL EXCHANGE TRADED FUND - OETF