Practices & People Skills for Productivity and Performance ... · Practices & People Skills for...
65
Practices & People Skills for Productivity and Performance: Owner & Contractor Perspectives Aminah Robinson Fayek, PhD, PEng Abraham Assefa Tsehayae, PhD © 2012-2016 NSERC Industrial Research Chair in Strategic Construction Modeling and Delivery
Transcript of Practices & People Skills for Productivity and Performance ... · Practices & People Skills for...
Practices & People Skills for Productivity and Performance:
Owner & Contractor Perspectives
Aminah Robinson Fayek, PhD, PEngAbraham Assefa Tsehayae, PhD
© 2012-2016 NSERC Industrial Research Chair in Strategic Construction Modeling and Delivery

2
NSERC Industrial Research Chair:A partnership between the university, NSERC, and industry
Industry University
Government
Industrial Research Chair in Strategic
Construction Modeling and Delivery
(IRC in SCMD)
Our focus is on delivering innovation that will benefit the construction industry at large and increase the international competitive advantage of our partners.

In this workshop we will discuss…
33
Competencies and Performance Improving Productivity
Why study organizational competencies and performance?
Key Findings:• Most significant practices
and people skills & relationship to performance
Organizational Competencies and Project Performance Tool©
(OCCPT ©)
Why study construction labour productivity (CLP) in Alberta projects?
Key Findings:• Critical factors and practices
impacting CLP• How to improve CLP
Productivity Tracker©

Improving Organizational Competencies & Construction Project Performance
Moataz Omar, PhDAminah Robinson Fayek, PhD, PEng
© 2012-2016 NSERC Industrial Research Chair in Strategic Construction Modeling and Delivery

15.9% 16.2%
31.2%
17.5%
-20%
-10%
0%
10%
20%
30%
40%
Average projectcost growth
Average projectschedule growth
Averageconstruction phase
cost growth
Averageconstruction
schedule growth
KPI
Var
ianc
e
KPI
Albertan Construction Projects Performance Assessment (COAA/CII Phase II: 2010 – 2014)
Desirable Variance
Undesirable Variance
Motivation Behind Research
5
Our objective is to identify leading (rather than lagging) factors that can improve project performance.

Value of Competencies & Project Performance Study to Industry
6
Provide data collection methodology and software tool for assessing competencies and performance
Quantify the relationship between project competencies and performance (KPIs)
Identify critical competencies and KPIs
Improve project performance
Improve organizational practices and team skills
Identify and evaluate project competencies
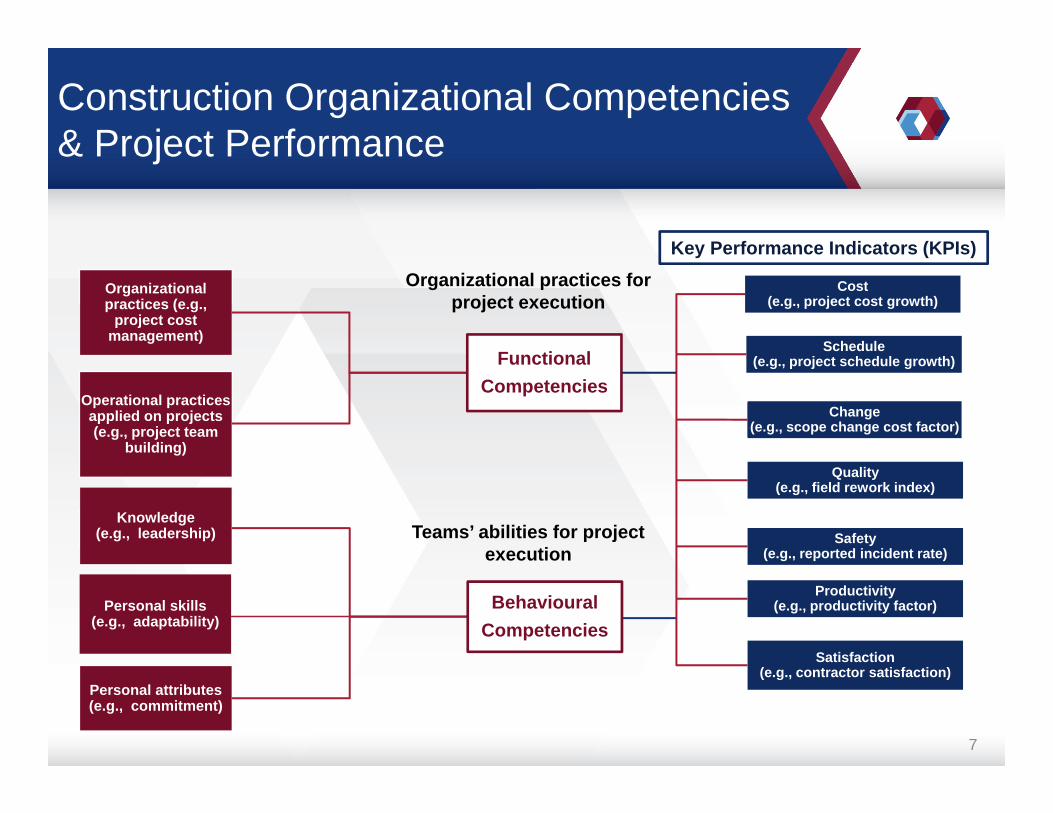
Construction Organizational Competencies & Project Performance
7
Key Performance Indicators (KPIs)
Organizational practices (e.g.,
project cost management)
Operational practices applied on projects (e.g., project team
building)
Knowledge(e.g., leadership)
Personal skills(e.g., adaptability)
Personal attributes(e.g., commitment)
Cost (e.g., project cost growth)
Schedule (e.g., project schedule growth)
Change (e.g., scope change cost factor)
Quality (e.g., field rework index)
FunctionalCompetencies
BehaviouralCompetencies
Safety (e.g., reported incident rate)
Productivity (e.g., productivity factor)
Satisfaction (e.g., contractor satisfaction)
Organizational practices for project execution
Teams’ abilities for project execution

Functional Competencies1. Project integration management 12. Project change management
2. Project scope management 13. Project stakeholders management
3. Project time management 14. Project environmental management
4. Project cost management 15. Project commissioning and startup
5. Project engineering and procurement management 16. Project innovation
6. Project resource management 17. Project workface planning
7. Project risk management 18. Project contract administration
8. Project communication management 19. Project team building
9. Project safety management 20. Project workforce development
10. Project human resource management 21. Project technology integration
11. Project quality management
Construction Project Functional Competencies
8

Sample Functional Competency Criteria by Project Phase for Evaluation: Project safety management
9
• Policies/procedures for project safety management are developed at the company level• Roles and responsibilities are clearly identified
• Safety preplanning meetings are held• A safety plan is established for the project
• Regular safety meetings and training sessions are conducted• Safety requirements are implemented
• Safety reporting is regularly conducted
• Project safety management performance is documented
Initiating Phase
Front-End Planning Phase
Construction Phase
Monitor and Control Phase
Closing Phase

Behavioural Competencies
1. Analytical ability 11. Self-control
2. Training 12. Reliability
3. Assessment ability 13. Problem solving
4. Decision making 14. Commitment
5. Leadership 15. Adaptability
6. Teamwork 16. Building trust
7. Consultation 17. Interpersonal skills
8. Motivation 18. Influence (assertiveness)
9. Negotiation and crisis resolution 19. Cultural competence
10. Ethics 20. Initiative
Construction Project Team Behavioural Competencies
10

Sample Behavioural Competency Criteria by Project Phase for Evaluation:Leadership
11
Team members find resources to support their team in executing work
Team members guide their team in accomplishing their work
Team members reward and recognize their team
Team members set high expectations for their team
Team members hold their team accountable for achieving results
1.
2.
3.
4.
5.

Maturity scale of functional competencies
Strongly Disagree Slightly Neither Disagree Slightly Agree Strongly
Agreement scale of behavioural competencies
Functional and Behavioural Competencies Evaluation
Extremely Unimportant Unimportant
Neither Unimportant nor
ImportantImportant Extremely
Important
Importance scale of competencies
Level 1 Use of the practice is not consistently applied on the project
Level 2 A disciplined process exists for the practice on the project
Level 3 A disciplined process exists for the practice across different projects within the same organization
Level 4 Quantitative process control is used across the organization to proactively manage the execution of the practice on the project
Level 5 Continuous process improvement is used across the organization to optimize the practice on the project

Functional and Behavioural Competencies Survey
Sample survey for functional competencies
Sample survey for behavioural competencies

Construction Project Competencies and Performance Data Collection
14
Data used in this study to derive findings
• Project 1• Commercial project• 90% project completion• Project budget > 50M
• Project 2• Commercial project• 80% completion• Project budget > 2M
• Project 3• Commercial project • 70% project completion• Project budget > 70M
Industrial partners:
• Project 4• Commercial project• 85% project completion• Project budget >27M
• Project 5• Heavy industrial project• 70% project completion• Project budget >67M
• Project 1• Heavy industrial project• 98.76% project completion• Project budget > 1B
• Project 2• Heavy industrial project• 21.4% completion• Project budget > 1B
Contractors Owners

Area 1 Findings: Critical functional and behavioural competencies criteria for project owners and contractors
15
Contractors
Owners
Result: Identified critical criteria related to project functional and behavioural competencies for owners and contractors
Functional and
Behavioural Competencies

Area 1 Findings: Ranking of owners’ project functional competencies criteriaTop five criteria for owners’ project cost management
Functional Competencies' Evaluation Criteria
Importance Ranking(Owners)
Importance Ranking
(Contractors)
Maturity Scale 1 to 5
(Owners)
Maturity Scale 1 to 5
(Contractors)Policies and procedures for project cost management are developed at the company level
1 3 3.73 3.71
All related project costs (e.g., invoices and payments) are submitted in a timely manner
1 1 3.27 3.42
At closing phase, a final project budget is documented and a report is generated with all changes to the cost baseline
1 2 4.00 3.14
An integration of the project budget and schedule is performed to generate the cash flow
2 4 4.00 2.71
A cash flow analysis is regularly carried out to monitor the financial status of the project
2 3 3.82 3.28

Area 1 Findings: Ranking of contractors’ project functional competencies criteriaTop five criteria for contractors’ project cost management
Functional Competencies' Evaluation Criteria
Importance Ranking
(Contractors)
Importance Ranking(Owners)
Maturity Scale 1 to 5
(Contractors)
Maturity Scale1 to 5
(Owners)All related project costs (e.g., invoices and payments) are submitted in a timely manner
1 1 3.42 3.27
A detailed budget for the project (associated with detailed expenses, risk, contingency, overheads, and profit) is defined at the early stages of the project
1 3 3.85 4.00
Estimates are developed based on a clear project scope 2 4 3.43 3.45
At closing phase, a final project budget is documented and a report is generated with all changes to the cost baseline
2 1 3.14 4.00
Policies and procedures for project cost management are developed at the company level
3 1 3.71 3.73
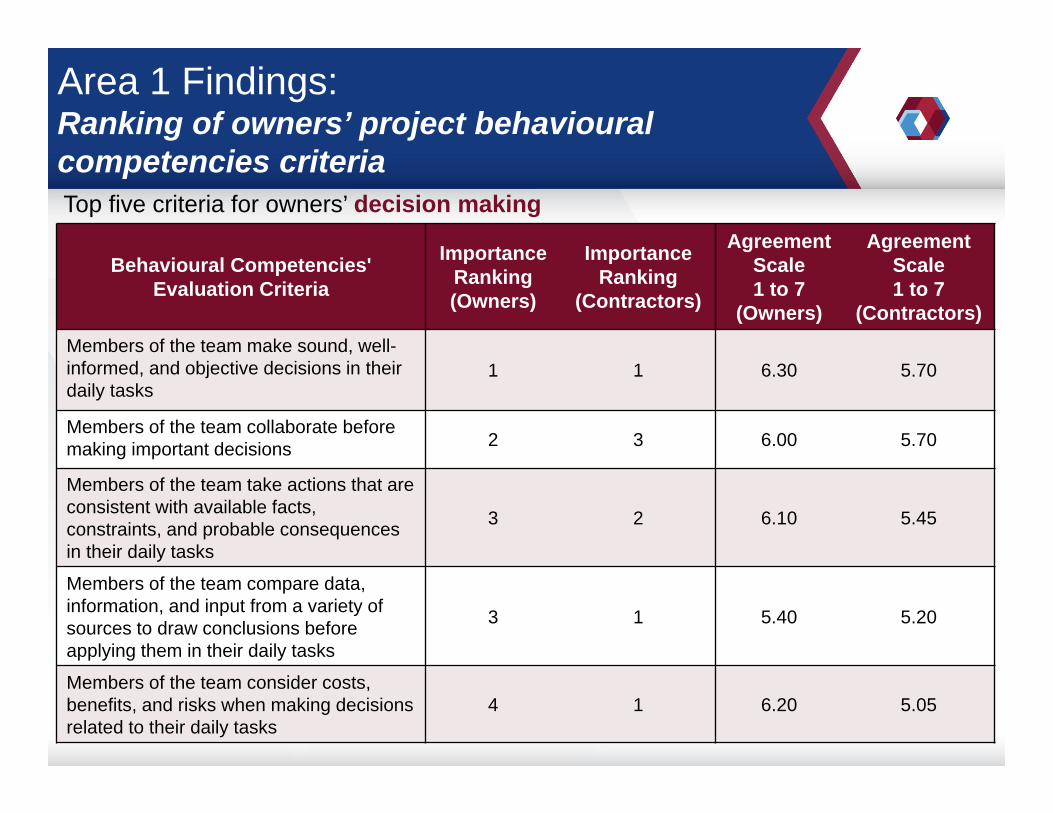
Behavioural Competencies' Evaluation Criteria
Importance Ranking(Owners)
Importance Ranking
(Contractors)
Agreement Scale 1 to 7
(Owners)
Agreement Scale 1 to 7
(Contractors)Members of the team make sound, well-informed, and objective decisions in their daily tasks
1 1 6.30 5.70
Members of the team collaborate before making important decisions 2 3 6.00 5.70
Members of the team take actions that are consistent with available facts, constraints, and probable consequences in their daily tasks
3 2 6.10 5.45
Members of the team compare data, information, and input from a variety of sources to draw conclusions before applying them in their daily tasks
3 1 5.40 5.20
Members of the team consider costs, benefits, and risks when making decisions related to their daily tasks
4 1 6.20 5.05
Area 1 Findings: Ranking of owners’ project behavioural competencies criteriaTop five criteria for owners’ decision making

Behavioural Competencies' Evaluation Criteria
Importance Ranking
(Contractors)
Importance Ranking(Owners)
Agreement Scale 1 to 7
(Contractors)
Agreement Scale1 to 7
(Owners)Members of the team make sound, well-informed, and objective decisions in their daily tasks
1 1 5.70 6.30
Members of the team compare data, information, and input from a variety of sources to draw conclusions before applying them in their daily tasks
1 3 5.20 5.40
Members of the team consider costs, benefits, and risks when making decisions related to their daily tasks
1 4 5.05 6.20
Members of the team take actions that are consistent with available facts, constraints, and probable consequences in their daily tasks
2 3 5.45 6.10
Members of the team collaborate before making important decisions 3 2 5.70 6.00
Area 1 Findings: Ranking of contractors’ project behavioural competencies criteriaTop five criteria for contractors’ decision making

Area 2 Findings: Evaluation and comparison of owners’ and contractors’ competencies by overall scores
20
Contractors
Owners
Result: 1. Evaluated competencies by overall maturity and agreement scores2. Compared owners’ and contractors’ competencies by overall scores

0%
10%
20%
30%
40%
50%
60%
70%
80%
90%
100%
Project SafetyManagement
Project CostManagement
Project TimeManagement
Project RiskManagement
Project ResourceManagement
Ove
rall
Mat
urity
Sco
re
Functional Competency
75th % = 76
Med = 49
Max = 98
25th % = 24
Min = 14
75th % = 66
Med = 43
Max = 96
25th % = 38
Min = 21
75th % = 60
Med = 43
Max = 94
25th % = 37
Min = 3
75th % = 65
Med = 45
Max = 95
25th % = 27
Min = 12
Area 2 Findings: Evaluation of functional competencies based on overall maturity score
21
75th % = 90
Med = 83
Max = 100
25th % = 67
Min = 36
Importance and maturity are used jointly to calculate the overall maturity score for functional competencies.

Area 2 Findings: Evaluation of behavioural competencies based on overall agreement score
22
0%
10%
20%
30%
40%
50%
60%
70%
80%
90%
100%
Training Decision Making Teamwork Leadership
Ove
rall
Agr
eem
ent S
core
Behavioural Competency
Max = 81
25th % = 57
Min = 31
75th % = 73
Med = 61
75th % = 84Med = 84
Max = 85
25th % = 80
Min = 77
Max = 75
25th % = 57
Min = 49%
75th % = 72
Med = 65
Max = 76
25th % = 59
Min = 40
75th % = 69Med = 67
Importance and agreement are used jointly to calculate the overall agreement score for behavioural competencies.

Area 2 Findings: Functional competencies comparison between owners and contractors
23
0%
20%
40%
60%
80%
Pro
ject
Saf
ety
Man
agem
ent
Pro
ject
Env
ironm
enta
lM
anag
emen
t
Pro
ject
Con
tract
Adm
inis
tratio
n
Pro
ject
Com
mis
sion
ing
and
Star
tup
Pro
ject
Wor
kfac
eP
lann
ing
Proj
ect S
take
hold
ers
Man
agem
ent
Pro
ject
Qua
lity
Man
agem
ent
Pro
ject
Cha
nge
Man
agem
ent
Proj
ect W
orkf
orce
Dev
elop
men
t
Proj
ect R
isk
Man
agem
ent
Pro
ject
Inte
grat
ion
Man
agem
ent
Pro
ject
Eng
inee
ring
and
Pro
curm
ent
Man
agem
entO
vera
ll M
atur
ity S
core
Functional Competency
Contractor
Owner
0%
20%
40%
60%
80%
Pro
ject
Com
mun
icat
ion
Man
agem
ent
Pro
ject
Tim
eM
anag
emen
t
Proj
ect T
eam
Bui
ldin
g
Proj
ect S
cope
Man
agem
ent
Pro
ject
Res
ourc
eM
anag
emen
t
Proj
ect C
ost
Man
agem
ent
Proj
ect T
echn
olog
yIn
tegr
atio
n
Pro
ject
Inno
vatio
n
Pro
ject
Hum
anR
esou
rce
Man
agem
ent
Ove
rall
Mat
urity
Sco
re
FunctionalCompetency
Contractor
Owner
Level 5
Level 4
Level 3
Level 2
Level 1
Level 5
Level 4
Level 3
Level 2
Level 1

Area 2 Findings: Behavioural competencies comparison between owners and contractors
24
0%20%40%60%80%
100%
Sel
f-Con
trol
Pro
blem
Sol
ving
Com
mitm
ent
Ethi
cs
Bui
ldin
g Tr
ust
Initi
ativ
e
Trai
ning
Con
sulta
tion
Cul
tura
lC
ompe
tenc
e
Rel
iabi
lity
Ove
rall
Agr
eem
ent S
core
TeamBehavioural Competency
ContractorOwner
0%
20%
40%
60%
80%
100%
Influ
ence
(Ass
ertiv
enes
s)
Ana
lytic
al A
bilit
y
Ass
essm
ent A
bilit
y
Mot
ivat
ion
Inte
rper
sona
l Ski
lls
Ada
ptab
ility
Neg
otia
tion
and
Cris
is R
esol
utio
n
Dec
isio
n M
akin
g
Team
wor
k
Lead
ersh
ip
Ove
rall
Agr
eem
ent S
core
Team Behavioural Competency
Contractor
Owner
Strongly Agree
Strongly Disagree
Strongly Agree
Strongly Disagree

Area 3 Findings: Relationship between project competenciesand project KPIs
25
Identify groups of project competencies affecting project performance using
advanced modeling1.
Schedule KPIsCost KPIs
Measure the effect of groups of project competencies on:2.
2.2.

Area 3 Findings: Relationship between project competenciesand project cost KPIs
26
Project Cost Growth
Project Budget Factor
Construction Phase Cost Growth
Total Change Cost Factor
Cost-For-Change-Demand
Ranked Critical Functional
Competencies
1. Project cost management 2. Project scope management3. Project integration management4. Project resource management 5. Project time management 6. Project workface planning 7. Project risk management 8. Project environmental management 9. Project safety management
10. Project commissioning and startup 11. Project quality management 12. Project contract administration
Ranked Critical Behavioural
Competencies
1. Training2. Decision Making3. Analytical ability 4. Problem solving
Project cost KPIs

Area 3 Findings: Formulae for project cost KPIs
27
Project Cost Growth
Project Budget Factor
Construction Phase Cost Growth
Total Change Cost Factor
Cost-For-Change-Demand
∗ 100

Area 3 Findings: Relationship between project competencies criteria and project cost KPIs
28
Project Competency
Ranked Evaluation Criteria
Cost KPIs Percentage of Improvement
Project Cost
Growth
Project Budget Factor
Construction Phase
Cost Growth
Total Change
Cost Factor
Cost-For-
Change-Demand
Project Cost Management
• Policies and procedures for project cost management are developed at the company level. Roles and responsibilities for applying practice on the project are clearly identified for the project responsible teams
3.80% 1.17% 2.19% 0.83% 0.83%
• A cash flow analysis is regularly carried out to monitor the financial status of the project
1.14% 0.39% 0.44% 0.00% 0.00%
Effect of improving top 2 criteria for project cost management (from “disciplined process” to “continuous improvement”) on improvement of cost KPIs

Area 3 Findings: Relationship between project competenciesand project schedule KPIs
29
Project ScheduleGrowth
Project Schedule Factor
Construction Phase Schedule Growth
Construction Phase Schedule Factor
Time Predictability (Construction)
Ranked Critical Functional
Competencies
1. Project engineering and procurement management
2. Project workforce development 3. Project risk management 4. Project workface planning
Ranked Critical Behavioural
Competencies
1. Training2. Decision Making3. Analytical ability4. Problem solving
Project schedule KPIs

Area 3 Findings: Formulae for project schedule KPIs
30
Project ScheduleGrowth
Project Schedule Factor
Construction Phase Schedule Growth
Construction Phase Schedule Factor
Time Predictability (Construction)
∗ 100

Area 3 Findings: Relationship between project competencies criteria and project schedule KPIs
31
Project Competency
Ranked Evaluation Criteria
Schedule KPIs Percentage of Improvement
Project ScheduleGrowth
Project Schedule
Factor
Construction Phase
Schedule Growth
Construction Phase
Schedule Factor
Time Predictability
(Construction)
Project Engineering
& Procurement Management
Warranties and operation manuals for procured material/equipment are documented for proper installation/use on site
2.29% 0.10% 0.14% 0.01% 0.00%
Periodic review of engineering and procurement activities through adequate administration is done to eliminate any backlog/delays
2.29% 0.10% 0.14% 0.01% 0.00%
Effect of improving top 2 criteria for project engineering & procurement management from maturity level 3 “disciplined process” to maturity level 4 “quantitative process control”

Area 3 Findings: Relationship between project competencies criteria and project schedule KPIs
32
Project Competency
Schedule KPIs Percentage of Improvement
Project ScheduleGrowth
Project Schedule
Factor
Construction Phase
Schedule Growth
Construction Phase
Schedule Factor
Time Predictability
(Construction)
Project Engineering & Procurement Management
3.20% 0.50% 0.30% 0.01% 0.00%Project Workforce
Development
Training
Decision Making
Simultaneously improving the following:1. Top 2 criteria for project engineering and procurement management and project
workforce development (from “disciplined process” to “continuous improvement”)2. Top 2 criteria for training and decision making (from “neither disagree nor agree” to
“strongly agree”)

33
Organizational Competencies and Project Performance Tool©:Overview
Result: Database for continued study and evaluation of competencies and performance for construction projects

Organizational Competencies and Project Performance Tool©:Evaluation module
34
Entering project competency data

Organizational Competencies and Project Performance Tool©:Evaluation module
35
Entering project KPI data

Organizational Competencies and Project Performance Tool©:Reporting module
36
Automatic report generation for behavioural competencies
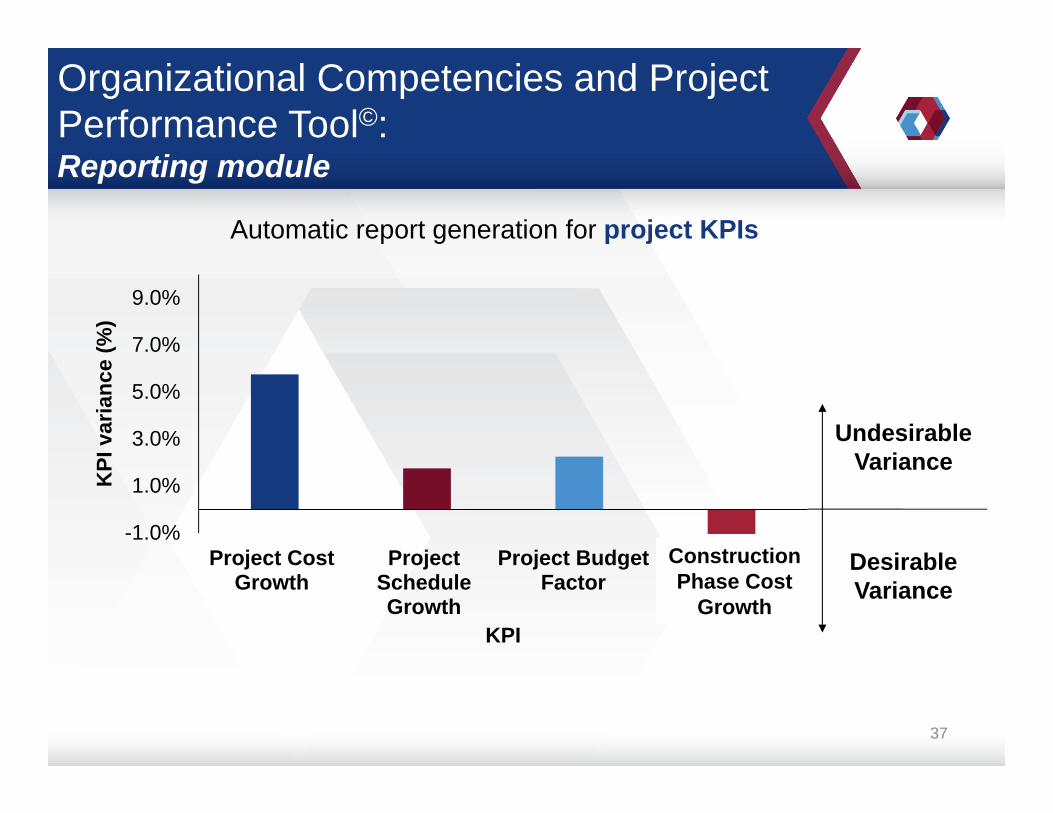
Organizational Competencies and Project Performance Tool©:Reporting module
37
Automatic report generation for project KPIs
-1.0%
1.0%
3.0%
5.0%
7.0%
9.0%
Project CostGrowth
ProjectScheduleGrowth
Project BudgetFactor
ConstructionPhase Cost
Growt
KPI
var
ianc
e (%
)
KPI
Undesirable Variance
Desirable Variance
Construction Phase Cost
Growth

Path Forward
38
Developed context-specific models suitable for different construction sectors (e.g., commercial, institutional, industrial)
Continue data collection on Alberta projects to expand dataset
DATA COLLECTION
CONTEXT-SPECIFIC MODELS
Consider organizations as units of measure rather than projects: develop organizational performance measures and competencies
ORGANIZATIONAL LEVEL COMPETENCIES & PERFORMANCE

Improving Construction Labour Productivity on Alberta Construction Projects
Abraham Assefa Tsehayae, PhDAminah Robinson Fayek, PhD, PEng
© 2011-2016 NSERC Industrial Research Chair in Strategic Construction Modeling and Delivery

Motivation Behind Research
There are many challenges towards improving Construction Labour Productivity (CLP):
40
Activity Project Company Industry
Measuring and tracking productivity at different levels
Understanding labour time utilization
Developing accurate and interpretable models

Value of Productivity Study to Industry
41
Critical factors and practices affecting productivity
Relationship of work sampling categories to productivity
Data collection methodology and software tool
Tools to predict and optimize labour productivity
Understanding of subjective factors affecting productivity
Improved project performance and working conditions

Construction Labour Productivity Data Collection
42
Activity Period
2012 2013 2014J J A S O N D J F M A M J J A S O N D J F M A M J J A S O N
CONCRETING Site 1 Site 2Site 3Site 4Site 5Site 6
ELECTRICAL Site 1Site 2 Site 3
SHUTDOWNSite 1Site 2Site 3
Industrial partners:
Extensive data were collected from 11 project across Alberta.

43
Area 1 Findings:Key parameters impacting CLP
Result: Identified significant factors & practices impacting construction labour productivity using expert knowledge
Factor Survey Results

Factor Survey Design
Evaluation scores combine the agreement/frequency and impact ratings.
44
• Agreement Type
• Frequency Type
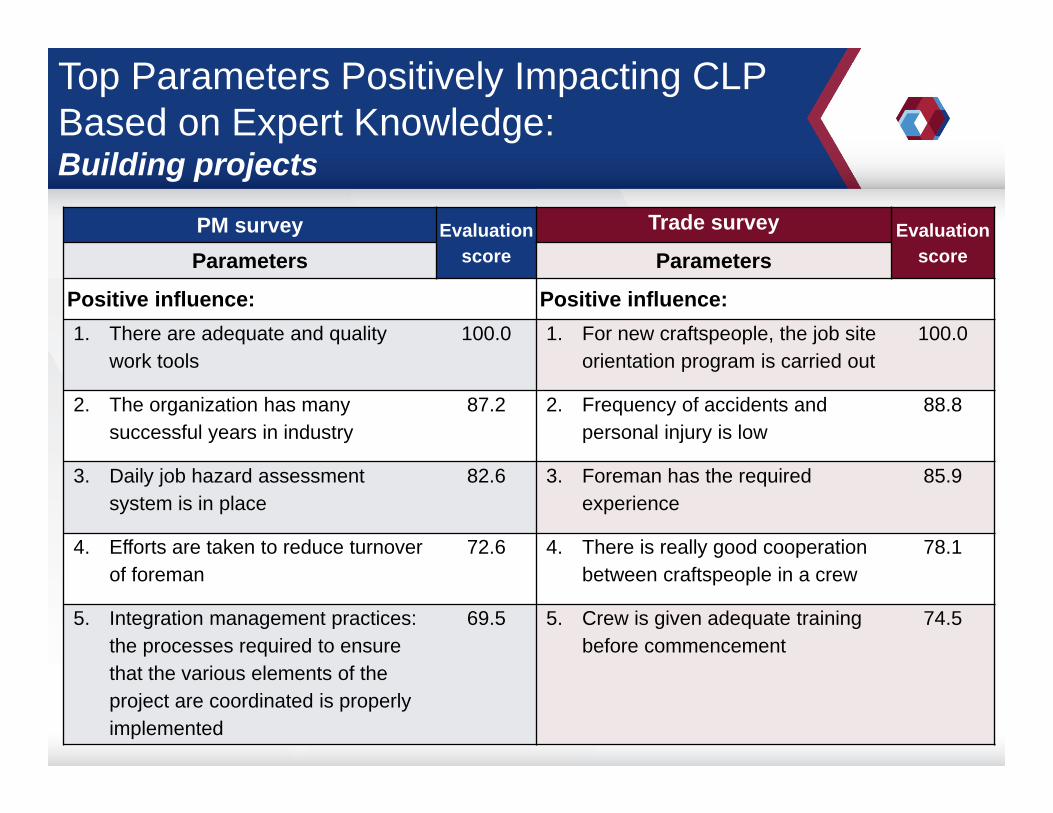
Top Parameters Positively Impacting CLP Based on Expert Knowledge: Building projects
45
PM survey Evaluation score
Trade survey Evaluation scoreParameters Parameters
Positive influence: Positive influence:1. There are adequate and quality
work tools100.0 1. For new craftspeople, the job site
orientation program is carried out100.0
2. The organization has many successful years in industry
87.2 2. Frequency of accidents and personal injury is low
88.8
3. Daily job hazard assessment system is in place
82.6 3. Foreman has the required experience
85.9
4. Efforts are taken to reduce turnover of foreman
72.6 4. There is really good cooperation between craftspeople in a crew
78.1
5. Integration management practices: the processes required to ensure that the various elements of the project are coordinated is properly implemented
69.5 5. Crew is given adequate training before commencement
74.5

Top Parameters Negatively Impacting CLP Based on Expert Knowledge: Building projects
46
PM survey Evaluation score
Trade survey Evaluation scoreParameters Parameters
Negative influence: Negative influence:1. Canada’s population is aging 100.0 1. The work area is not protected
from effects of weather100.0
2. Global economy faces uncertainty regarding another slow down
56.1 2. Materials are not delivered on time to task location
88.6
3. Drawings and specifications are often not complete and require updates
54.4 3. The materials delivered have quality problems
78.8
4. Natural gas prices (dollar/GJ) are currently low
47.8 4. Stringent safety rules are negatively affecting productivity
74.9
5. The available supervisors for construction projects in Alberta is not adequate
46.9 5. The work area is congested 65.0

47
Area 2 Findings:Process parameters (work sampling proportions) and their relationship to CLP
Work Sampling
Proportions and
Productivity
Analysis of Work
Sampling Proportions
47
Result: The relationship between work sampling proportions and CLP was tested and a predictive model was developed.
Tool Time and Productivity
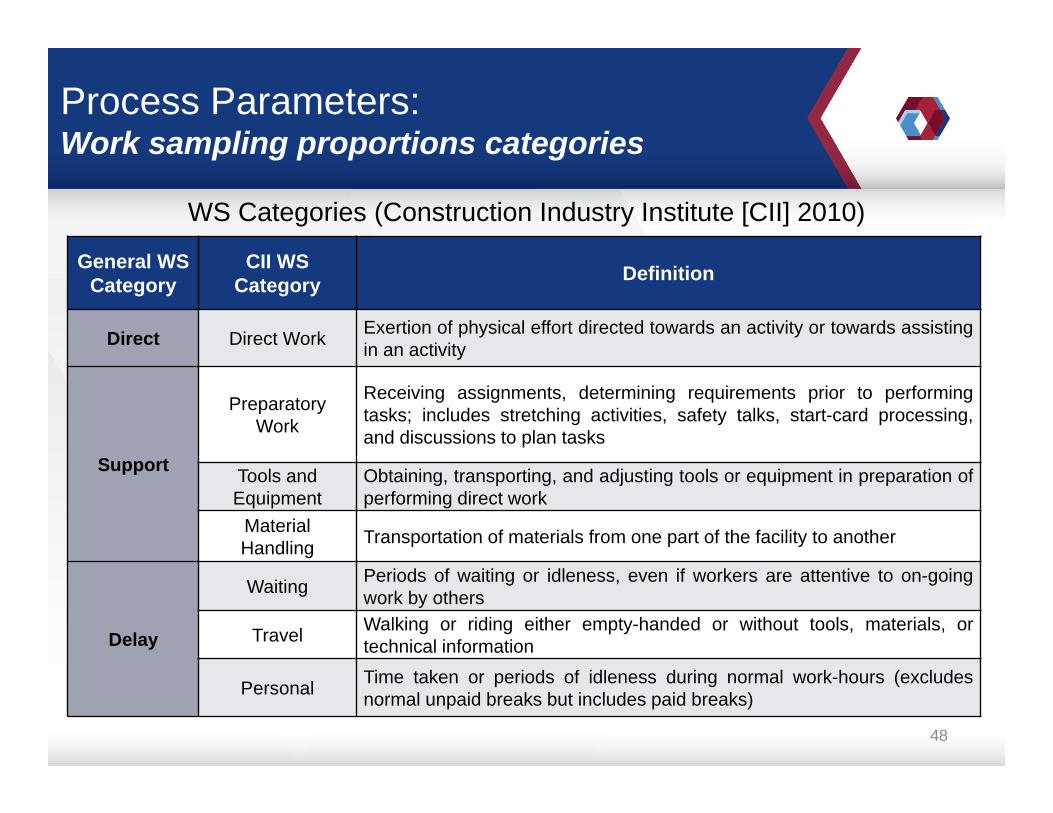
Process Parameters: Work sampling proportions categories
WS Categories (Construction Industry Institute [CII] 2010)
48
General WS Category
CII WS Category Definition
Direct Direct Work Exertion of physical effort directed towards an activity or towards assistingin an activity
Support
Preparatory Work
Receiving assignments, determining requirements prior to performingtasks; includes stretching activities, safety talks, start-card processing,and discussions to plan tasks
Tools and Equipment
Obtaining, transporting, and adjusting tools or equipment in preparation ofperforming direct work
Material Handling Transportation of materials from one part of the facility to another
Delay
Waiting Periods of waiting or idleness, even if workers are attentive to on-goingwork by others
Travel Walking or riding either empty-handed or without tools, materials, ortechnical information
Personal Time taken or periods of idleness during normal work-hours (excludesnormal unpaid breaks but includes paid breaks)

Direct Work Proportions: All buildings concreting activities
49
Wall concreting activity showed the highest median direct work (tool time) proportion.
0%
10%
20%
30%
40%
50%
60%
70%
80%
90%
100%
Column Concreting Slab Concreting Wall Concreting
Wor
k S
ampl
ing
Pro
porti
on
Direct Work (Tool Time) Proportions of Concreting Activities
Min = 15
25th % = 27Med = 31
75th % = 53
Max = 67
Min = 25
25th % = 37Med = 44
75th % = 57
Max = 76
Min = 23
25th % = 38
Med = 51
75th % = 61
Max = 76

0%
10%
20%
30%
40%
50%
60%
70%
80%
Column Concreting Slab Concreting Wall Concreting
Wor
k S
ampl
ing
Pro
porti
on
Support Work Proportions of Concreting Activities
Support Work Proportions: All buildings concreting activities
Column concreting activity showed the highest median support work proportion.
50
Min = 0
25th % = 20
Med = 31
75th % = 39
Max = 68
Min = 6
25th % = 9Med = 13
75th % = 18
Max = 30
Min = 2
25th % = 20Med = 25
75th % = 30
Max = 45

0%
10%
20%
30%
40%
50%
60%
70%
Column Concreting Slab Concreting Wall Concreting
Wor
k S
ampl
ing
Pro
porti
on
Delay Proportions of Concreting Activities
Delay Proportions: All buildings concreting activities
Slab concreting activity showed the highest median delay proportion.
51
Min = 0
25th % = 16
Med = 37
75th % = 47
Max = 57
Min = 14
25th % = 21
Med = 40
75th % = 49
Max = 59
Min = 5
25th % = 18
Med = 25
75th % = 32
Max = 52

Tool Time and Productivity: Correlation analysis of slab concreting activity
A very weak positive correlation between tool time (direct work proportion) and CLP was observed for slab concreting activity.
52
CLP as a function of direct work proportion for slab concreting activity
The strength of the correlation ( ) between tool time and CLP was 0.104 and the significance (p-value) of the relationship was 0.652, which is not significant at a 95% confidence interval (p < 0.05).

-1.00 -0.80 -0.60 -0.40 -0.20 0.00 0.20 0.40 0.60 0.80 1.00
Direct work
Preparatory work
Tools and equipment
Material handling
Waiting
Travel
Personal
Correlation coefficient ( -value)
Wor
k Sa
mpl
ing
Cat
egor
ies
Work Sampling and Productivity: Correlation analysis of slab concreting activity
Correlation analysis between the other six work sampling proportions and CLP for slab concreting activity did not show much improvement as compared to the correlation between direct work and CLP. In addition, the correlation results were not statistically significant.
Correlation between work sampling and CLP for slab concreting activityVery weak negative ( = - 0.12)
Very weak negative ( = - 0.06)
Moderate positive ( = 0.40)
Very weak negative ( = - 0.17)
Weak positive ( = 0.28)
Very weak positive ( = 0.10)
Very weak positive ( = 0.09)

54
Result: A system CLP model that integrates work sampling proportions with influencing factors and practices was
developed to predict and optimize CLP.
Area 3 Findings:Optimizing CLP using the developed models
CLP System Model
Optimizing CLP

CLP System Model Formulation:Moderated system model
55
1. Do factors and practices affect construction labour productivity?2. Do work sampling (WS) proportions affect the strength of this relationship?
RESEARCH QUESTIONS
Xi : Independent Variables Z : Dependent Variable
Yj: Moderator Variables
Factors and Practices
WS Categories
CLP
Direct Preparatory Personal
Crew Size Crew composition
Weather (temperature)
Work scope location
Labour Productivity
D : I and P OD : I and P O
MODERATED CLP MODELMODERATED CLP MODEL
Inputs (man-hours)
Conversion Technology
(work method)
Outputs(quantities)

Top Parameters Positively Impacting CLP Based on Field Data: All buildings
56
All concreting projects combined
Positive Impact: Changing the parameters as follows will lead to an increase in CLP
1. Increasing trust in foreman by craftspeople2. Increasing project work times using scheduled overtime 3. Structural element type (working on slabs and walls as compared to columns
and footings)4. Implementing a labour productivity measurement practice5. Increasing availability of tools6. Higher direct work proportion

Top Parameters Negatively Impacting CLP Based on Field Data: All buildings
57
All concreting projects combined
Negative Impact: Changing the parameters as follows will lead to a decrease in CLP
1. Increasing owner staff on site2. Higher personal time proportion3. Delaying approval of shop drawings and sample materials4. Increasing fatigue of craftspeople (increasing weekly work hours)5. Frequent change of foreman6. Concrete placement technique (using crane and bucket instead of pumps)7. Longer unemployment periods

Development of CLP Improvement: Strategies for optimizing CLP
To optimize the key parameters, the developed CLP models are run as follows:
58
Select one parameter ( ) and keep other parameters fixed at their average values.
Predict CLP by varying the parameter ( ) from its worst case scenario to its best case scenario using the developed CLP models
Compute productivity gain
,
,
,
,
CLP Gain

All Buildings Concreting Activity:CLP improvement strategies
59
Optimizing the following key CLP parameters for concreting activity in all buildings can lead to improved CLP.
Parameter Productivity Gain1. Structural element type (working on slabs and walls as compared to
columns and footings)141.6%
2. Higher direct work proportion 126.4%3. Decreasing owner staff on site 110.8%4. Decreasing length of unemployment period 85.3%5. Increasing project work times using scheduled overtime 84.7%6. Lower personal time proportion 76.7%7. Increasing availability of tools 75.7%8. Timely approval of shop drawings and sample materials 69.1%9. Implementing a labour productivity measurement practice 68.4%10. Concrete placement technique (using pumps instead of crane and
bucket)60.7%
11. Decreasing fatigue of craftspeople (decreased weekly work hours) 54.2%12. Increasing craftspeople trust in foreman 15.7%13. Minimizing change of foreman 4.4%

60
Result: Labour productivity database for continued study and improvement of CLP.
Productivity Tracker©:Overview

Productivity Tracker©:Data inventory module
61
Entering factors and practices field data

Productivity Tracker©:Report/analysis module
62
Work sampling trends

Path Forward
63
• Examining the impact of one or more key influencing parameters (e.g., concrete placement technique or site congestion) on CLP
ASSISTING STRUCTURED CLP-BASED SCENARIO ANALYSIS
• Evidence-based training manuals • Virtual representation of the construction conversion process
FACILITATING TRAINING OF PROJECT SUPERVISORS
• Establishing the relationship between motivation & crew performance
• Extending study to predict productivity at project & industry levels
FURTHER INVESTIGATION

Key Results and Recommendations Workshop
June 9, 2016
Donadeo Innovation Centre for Engineering (ICE),University of Alberta
8-207 Patrick D Daniel/ Enbridge Conference Room
$50/person for both sessions
All registrations include a catered lunch
12:00 pm – 1:00 pm
SESSION I: IMPROVING CONSTRUCTION LABOUR PRODUCTIVITYDr. Abraham Tsehayae and Dr. Aminah Robinson Fayek
9:00 am – 12:00 pm
Gain essential knowledge regarding critical parameters influencing labour productivity and how they can be utilized for enhanced project success.
SESSION II: CRITICAL PROJECT PRACTICES AND PEOPLE SKILLSDr. Moataz Omar and Dr. Aminah Robinson Fayek
1:00 pm – 4:00pm
Benefit from insight on the most vital project practices and people skills for enhancing the cost and schedule performance of construction projects.
Please send completed registration forms toCassandra Ommerli
[email protected] 780-492-1228

Thank You
Questions &
Discussion
Dr. Aminah Robinson Fayek
NSERC Industrial Research Chair in Strategic Construction Modeling and Delivery
www.strategic-construction.ualberta.ca
65