Practical Example IAS 29
21
T BALANCE SHEET A B C LIM ITED YEAR ENDED 31 DECEM BER 2000 BALANCE SHEET -HISTO R IC A L C O S T B A S IS 2000 1999 Z$000 Z$000 ASSETS N on C urrentA ssets P roperty,plantand equipm ent 188,952 103,562 Investm ents 10,251 4,196 D eferred asset 3,584 0 202,787 107,758 C urrentA ssets S tocks 89,122 63,439 D ebtors 98,533 105,925 D eferred asset 448 0 C ash and deposits 41,964 53,175 230,067 222,539 TO TAL ASSETS 432,854 330,297 EQ U ITY A N D LIA B ILITIES S hare capital 15,706 15,661 S hare prem ium 1,319 1,130 R evaluation and otherreserves 63,648 72,192 R evenue reserves 100,401 70,453 S hareholders' funds 181,074 159,436 N on C urrentLiabilities D eferred taxation 29,109 22,867 Long-term loan 0 2,588 R etirem entbenefitobligations 4,032 0 33,141 25,455 C urrentLiabilities C reditors 144,414 83,753 C urrenttaxation 18,611 840 D ividends 14,135 5,638 S hort-term borrow ings 41,031 55,175 R etirem entbenefitobligations 448 0 218,639 145,406 TO TAL EQ U ITY A N D LIA B ILITIES 432,854 330,297
-
Upload
john-kwashanai -
Category
Documents
-
view
296 -
download
9
Transcript of Practical Example IAS 29

T
BALANCE SHEETBALANCE SHEETABC LIMITEDYEAR ENDED 31 DECEMBER 2000BALANCE SHEET - HISTORICAL COST BASIS
2000 1999Z$000 Z$000
ASSETS
Non Current Assets
Property, plant and equipment 188,952 103,562Investments 10,251 4,196Deferred asset 3,584 0
202,787 107,758
Current Assets
Stocks 89,122 63,439Debtors 98,533 105,925Deferred asset 448 0Cash and deposits 41,964 53,175
230,067 222,539
TOTAL ASSETS 432,854 330,297
EQUITY AND LIABILITIES
Share capital 15,706 15,661Share premium 1,319 1,130Revaluation and other reserves 63,648 72,192Revenue reserves 100,401 70,453
Shareholders' funds 181,074 159,436
Non Current Liabilities
Deferred taxation 29,109 22,867Long-term loan 0 2,588Retirement benefit obligations 4,032 0
33,141 25,455
Current Liabilities
Creditors 144,414 83,753Current taxation 18,611 840Dividends 14,135 5,638Short-term borrowings 41,031 55,175Retirement benefit obligations 448 0
218,639 145,406
TOTAL EQUITY AND LIABILITIES 432,854 330,297

T
INCOME STATEMENTINCOME STATEMENTABC LIMITEDYEAR ENDED 31 DECEMBER 2000INCOME STATEMENT - HISTORICAL COST BASIS
Jan Feb Mar Apr May Jun Jul Aug Sep Oct Nov Dec TotalZ$000 Z$000 Z$000 Z$000 Z$000 Z$000 Z$000 Z$000 Z$000 Z$000 Z$000 Z$000 Z$000
Turnover 42,949 63,967 59,745 34,602 53,164 49,620 45,049 46,982 54,290 50,848 51,784 37,987 590,987
Cost of sales (25,986) (47,973) (49,054) (23,099) (37,640) (39,047) (36,237) (46,329) (32,634) (37,391) (32,616) (19,148) (427,154)
Increase in WIP and FG (8,121) (1,789) 4,227 (1,758) (1,517) 3,680 2,508 9,777 (7,613) (2,218) (7,061) (6,970) (16,855)
Depreciation expense (1,092) (1,092) (1,092) (1,092) (1,092) (1,092) (1,092) (1,092) (1,092) (1,128) (1,096) (1,108) (13,160)
GROSS PROFIT 7,750 13,113 13,826 8,653 12,915 13,161 10,228 9,338 12,951 10,111 11,011 10,761 133,818
Other operating income (571) 1,306 106 1,083 (158) 2,524 207 396 1,049 1,240 521 2,467 10,170
Distribution expenses (2,058) (2,885) (2,432) (2,195) (2,813) (4,196) (2,560) (2,214) (3,213) (3,067) (3,218) (3,142) (33,993)
Administration expenses (2,421) (2,894) (3,136) (2,567) (3,310) (4,279) (3,134) (3,138) (4,084) (3,892) (4,021) (6,924) (43,800)
Depreciation expense (235) (230) (229) (228) (227) (221) (219) (217) (187) (370) (286) (191) (2,840)
OPERATING PROFIT 2,465 8,410 8,135 4,746 6,407 6,989 4,522 4,165 6,516 4,022 4,007 2,971 63,355
Net finance costs (1,907) (1,050) (1,583) (1,040) (1,116) (447) (885) 1,366 5,775 284 1,219 1,973 2,589
PROFIT BEFORE TAXATION 558 7,360 6,552 3,706 5,291 6,542 3,637 5,531 12,291 4,306 5,226 4,944 65,944
Income tax (128) (1,704) (2,437) (858) (1,225) (2,501) (735) (1,365) (4,230) (1,277) (1,535) (1,456) (19,451)
Deferred taxation 2,302 2,302
PROFIT AFTER TAXATION 430 5,656 4,115 2,848 4,066 4,041 2,902 4,166 8,061 3,029 3,691 5,790 48,795

T
STATEMENT OF CHANGES IN EQUITY
STATEMENT OF CHANGES IN EQUITY
ABC LIMITEDYEAR ENDED 31 DECEMBER 2000STATEMENT OF CHANGES IN EQUITY- HISTORICAL COST BASIS
Share Share Revaluation and Retained TotalCapital Premium Other Reserves EarningsZ$000 Z$000 Z$000 Z$000 Z$000
Balance at 1 January 2000 15,661 1,130 72,192 70,453 159,436
Net profit for the year 48,795 48,795
Dividend for the year (18,847) (18,847)
Deferred taxation (8,544) (8,544)
Issue of share capital 45 189 234
Balance at 31 December 2000 15,706 1,319 63,648 100,401 181,074
T
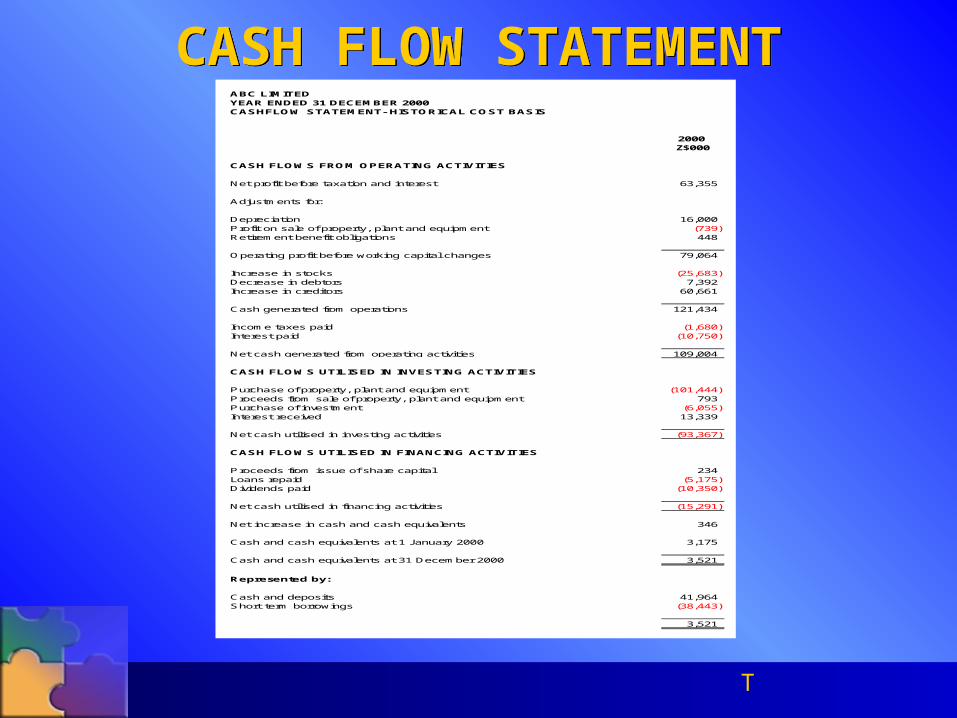
CASH FLOW STATEMENTCASH FLOW STATEMENTABC LIMITEDYEAR ENDED 31 DECEMBER 2000CASHFLOW STATEMENT- HISTORICAL COST BASIS
2000Z$000
CASH FLOWS FROM OPERATING ACTIVITIES
Net profit before taxation and interest 63,355
Adjustments for:
Depreciation 16,000Profit on sale of property, plant and equipment (739)Retirement benefit obligations 448
Operating profit before working capital changes 79,064
Increase in stocks (25,683)Decrease in debtors 7,392Increase in creditors 60,661
Cash generated from operations 121,434
Income taxes paid (1,680)Interest paid (10,750)
Net cash generated from operating activities 109,004
CASH FLOWS UTILISED IN INVESTING ACTIVITIES
Purchase of property, plant and equipment (101,444)Proceeds from sale of property, plant and equipment 793Purchase of investment (6,055)Interest received 13,339
Net cash utilised in investing activities (93,367)
CASH FLOWS UTILISED IN FINANCING ACTIVITIES
Proceeds from issue of share capital 234Loans repaid (5,175)Dividends paid (10,350)
Net cash utilised in financing activities (15,291)
Net increase in cash and cash equivalents 346
Cash and cash equivalents at 1 January 2000 3,175
Cash and cash equivalents at 31 December 2000 3,521
Represented by:
Cash and deposits 41,964Short term borrowings (38,443)
3,521

T
NON-MONETARY ASSETS AND LIABAILITIES IDENTIFICATIONNON-MONETARY ASSETS AND LIABAILITIES IDENTIFICATION
ABC LIMITEDYEAR ENDED 31 DECEMBER 2000BALANCE SHEET - CURRENT COST BASIS
Identification
ASSETS
Non Current Assets
Property, plant and equipment Non-monetaryInvestments Non-monetaryDeferred asset Monetary
Current Assets
Stocks Non-monetaryDebtors BothDeferred asset MonetaryCash and deposits Monetary
TOTAL ASSETS
EQUITY AND LIABILITIES
Share capital Non-monetaryShare premium Non-monetaryAdjustment to share capital Non-monetaryRevenue reserves Both
Shareholders' funds
Non Current Liabilities
Deferred taxation BothLong-term loan MonetaryRetirement benefit obligations Monetary
Current Liabilities
Creditors BothCurrent taxation MonetaryDividends MonetaryShort-term borrowings MonetaryRetirement benefit obligations Monetary

T
PROPERTY, PLANT & EQUIPMENTPROPERTY, PLANT & EQUIPMENTABC LIMITEDYEAR ENDED 31 DECEMBER 2000PROPERTY, PLANT AND EQUIPMENT- HISTORICAL COST BASIS
Land Buildings Office Plant and Motor Capital Revaluations Totalequipment machinery vehicles work--in-progress
Z$000 Z$000 Z$000 Z$000 Z$000 Z$000 Z$000 Z$000
Net book value at 1 January 2000 888 1,834 1,530 42,223 2,568 0 54,519 103,562
Additions 1,223 4,730 6,663 88,828 101,444
Disposals (54) (54)
Depreciation (71) (775) (5,349) (1,060) (8,745) (16,000)
Net book value 31 December 2000 888 1,763 1,924 41,604 8,171 88,828 45,774 188,952

T
PROPERTY, PLANT AND EQUIPMENT REGISTERPROPERTY, PLANT AND EQUIPMENT REGISTER
PROPERTY, PLANT AND EQUIPMENT- CURRENT COST BASIS
Land Buildings Office Plant and Motor Capital Revaluations Totalequipment machinery vehicles work--in-progress
Z$000 Z$000 Z$000 Z$000 Z$000 Z$000 Z$000 Z$000
Net book value at 1 January 2000 19,870 35,679 2,183 187,258 3,441 0 248,432
Additions 1,383 5,351 7,537 88,828 103,099
Disposals (287) (287)
Depreciation (1,592) (999) (29,519) (1,461) (33,571)
Net book value 31 December 2000 19,870 34,087 2,280 163,089 9,517 88,828 0 317,673

T
PROPERTY, PLANT AND EQUIPMENT REGISTERPROPERTY, PLANT AND EQUIPMENT REGISTER
ABC LIMITEDYEAR ENDED 31 DECEMBER 2000PROPERTY, PLANT AND EQUIPMENT REGISTER
HISTOICAL COST BASIS CURRENT COST BASIS
Category Depn Description Indexation Cost Depn Depn Net Book Indexation Cost Depn Depn Net BookRate Factor 2000 Total Value Factor 2000 Total Value
% $ $ $ $ $ $ $ $
LAND
Purchases 1945 888 0 888 180.030 159,867 0 159,867
888 0 0 888 159,867 0 0 159,867
Market value per Richard Ellis 19,870 19,870
BUILDINGS
Full Purchases 1945 454 454 0 180.030 81,734 81,734 (0)
2.5 Purchases 1975 347 9 234 113 60.933 21,144 529 13,744 7,400
2.5 Purchases 1980 277 7 147 130 39.344 10,898 272 5,722 5,176
2.5 Purchases 1987 892 22 308 584 15.864 14,151 354 4,953 9,198
2.5 Purchases 1989 1,078 27 324 754 13.487 14,539 363 4,362 10,177
2.5 Purchases 1990 248 6 66 182 11.882 2,947 74 810 2,137
3,296 71 1,533 1,763 145,412 1,592 111,325 34,087
Market value per Richard Ellis 45,000 45,000
OFFFICE EQUIPMENT
Full Purchases 1991 269 269 0 9.637 2,592 2,592 0
Full Purchases 1992 177 177 0 6.782 1,200 1,200 0
Full Purchases 1993 287 287 0 5.314 1,525 1,525 0
Full Purchases 1994 146 146 0 4.346 635 635 (0)
Full Purchases 1995 204 204 0 3.546 723 723 0
Full Purchases 1996 257 257 0 2.920 750 750 0
Full Purchases 1997 333 333 0 2.457 818 818 0
33 Purchases 1998 415 138 355 60 1.859 771 257 661 110
33 Purchases 1999 1,410 470 602 808 1.177 1,659 553 685 974
33 Purchases 2000 1,223 167 167 1,056 1.131 1,383 189 189 1,194
4,721 775 2,797 1,924 12,058 999 9,778 2,280

T
PROPERTY, PLANT AND EQUIPMENT REGISTERPROPERTY, PLANT AND EQUIPMENT REGISTER
ABC LIMITEDYEAR ENDED 31 DECEMBER 2000PROPERTY, PLANT AND EQUIPMENT REGISTER
HISTOICAL COST BASIS CURRENT COST BASIS
Category Depn Description Indexation Cost Depn Depn Net Book Indexation Cost Depn Depn Net BookRate Factor 2000 Total Value Factor 2000 Total Value
% $ $ $ $ $ $ $ $PLANT AND MACHINERY
7 Purchases 1980 1,929 1,929 0 39.344 75,895 75,896 (0)
5 Purchases 1984 2,112 107 1,827 285 22.127 46,731 2,368 40,425 6,306
6 Purchases 1985 2,003 118 1,884 119 20.139 40,338 2,376 37,942 2,396
5 Purchases 1987 11,094 597 8,357 2,737 15.864 175,993 9,471 132,574 43,419
9 Purchases 1991 759 71 705 54 9.637 7,314 684 6,842 472
6 Purchases 1992 2,936 187 1,682 1,254 6.782 19,912 1,268 11,414 8,498
7 Purchases 1993 11,397 794 6,349 5,048 5.314 60,563 4,219 33,754 26,809
8 Purchases 1994 6,177 490 3,428 2,749 4.346 26,845 2,130 14,907 11,938
5 Purchases 1995 353 19 112 241 3.546 1,252 67 404 847
Purchases 1996 0 0 2.920 0 0
8 Purchases 1997 32,522 2,669 10,675 21,847 2.457 79,906 6,558 26,231 53,675
6 Purchases 1998 702 44 131 571 1.859 1,305 82 245 1,059
10 Purchases 1999 2,231 223 232 1,999 1.177 2,626 262 273 2,352
Purchases 2000 4,730 30 30 4,700 1.131 5,351 34 34 5,317
78,945 5,349 37,341 41,604 544,032 29,519 380,942 163,089
MOTOR VEHICLES
Full Purchases 1992 469 469 0 6.782 3,181 3,181 (0)
Full Purchases 1993 423 423 0 5.314 2,248 2,248 (0)
Full Purchases 1994 125 125 0 4.346 543 543 0
Full Purchases 1995 430 430 0 3.546 1,525 1,525 (0)
Full Purchases 1996 1,716 1,716 0 2.920 5,011 5,011 (0)
25 Purchases 1997 620 155 504 116 2.457 1,523 381 1,239 284
25 Purchases 1998 162 41 95 67 1.859 301 75 176 125
25 Purchases 1999 2,428 607 846 1,582 1.177 2,858 714 995 1,863
25 Purchases 2000 6,663 257 257 6,406 1.131 7,537 291 291 7,246
13,036 1,060 4,865 8,171 24,726 1,461 15,209 9,517
CAPITAL WORK-IN-PROGRESS
None Building 27,919 0 27,919 1.000 27,919 0 27,919
None Plant and machinery 60,909 0 60,909 1.000 60,909 0 60,909
88,828 0 0 88,828 88,828 0 0 88,828

T
NON CURRENT ASSETSNON CURRENT ASSETSABC LIMITEDYEAR ENDED 31 DECEMBER 2000NON CURRENT ASSETS- CURRENT COST BASIS
Category Date of Description Historic Conversion Current MarketAcquisition Cost Factor Cost Value
Z$000 Z$000 Z$000
Investments - Non monetary
Associate Oct-94 Acquistion of XYZ Limited 4,196 4.346 18,236
Associate Mar-00 Acquistion of XYZ Limited 6,055 1.281 7,758
10,251 25,994 20,000
Deferred Asset - Monetary
Pension obligation Dec-99 Pension defecit 3,584 3,584 3,584
13,835 29,578 23,584
CPI - 31 December 2000 1,188.2
CPI - 31 October 1994 273.4
Conversion Factor 4.346
CPI - 31 December 2000 1,188.2
CPI - 31 March 2000 927.4
Conversion Factor 1.281

T
CURRENT ASSETSCURRENT ASSETSABC LIMITEDYEAR ENDED 31 DECEMBER 2000CURRENT ASSETS- HISTORICAL COST BASIS
Sep Oct Nov Dec TotalZ$000 Z$000 Z$000 Z$000 Z$000
Stocks - Non monetary
Raw materials and consumeables 4,001 21,618 25,619
Work-in-progress 17,633 17,633
Finished goods 11,921 13,559 4,772 13,698 43,950
Depreciation in wip and finished goods 435 495 174 816 1,920
12,356 14,054 8,947 53,765 89,122
CURRENT ASSETS- CURRENT COST BASIS
Stocks - Non monetary
Raw materials and consumeables 4,204 22,035 26,240
Work-in-progress 17,973 17,973
Finished goods 13,485 14,759 5,015 13,962 47,221
Depreciation in wip and finished goods 913 1,039 365 1,712 4,029
14,398 15,797 9,584 55,683 95,462
CPI - 31 December 2000 1,188.2 1,188.2 1,188.2 1,188.2 1,188.2
CPI - Relevant month 1,050.4 1,091.6 1,130.7 1,165.7 1,188.2
Conversion Factor 1.131 1.088 1.051 1.019 1.000

T
CURRENT ASSETSCURRENT ASSETSABC LIMITEDYEAR ENDED 31 DECEMBER 2000CURRENT ASSETS- HISTORICAL COST BASIS
1995 1996 1997 Jun Jul Aug Sep Oct Nov Dec TotalZ$000 Z$000 Z$000 Z$000 Z$000 Z$000 Z$000 Z$000 Z$000 Z$000 Z$000
Debtors - Monetary and Non monetary
Trade 1,887 5,661 11,322 8,308 13,521 16,561 34,280 91,540
Other 304 457 1,075 1,836
Prepaid expenses 260 75 620 955
Fellow subsidiaries 2,504 1,698 4,202
260 75 620 1,887 5,661 13,826 10,006 13,825 17,018 35,355 98,533
CURRENT ASSETS- CURRENT COST BASIS
Debtors - Monetary and Non monetary
Trade 1,887 5,661 11,322 8,308 13,521 16,561 34,280 91,540
Other 304 457 1,075 1,836
Prepaid expenses 922 219 1,523 2,664
Fellow subsidiaries 2,504 1,698 4,202
922 219 1,523 1,887 5,661 13,826 10,006 13,825 17,018 35,355 100,242
CPI - 31 December 2000 1,188.2 1,188.2 1,188.2 1,188.2
CPI - Relevant year 785.9 335.1 406.9 483.6
Conversion Factor 1.512 3.546 2.920 2.457

T
NON-CURRENT LIABILITIESNON-CURRENT LIABILITIESABC LIMITEDYEAR ENDED 31 DECEMBER 2000NON CURRENT LIABILITIES- CURRENT COST BASIS
DEFERRED TAXATION
At Charge to At1 January 2000 Income Statement 31 December 2000
Z$000 Z$000 Z$000
Deferred income tax liabilities
Accelerated tax depreciation 3,503 3,860 7,363
Investments 4,914 (1,399) 3,515
Asset indexation 67,337 (15,294) 52,042
Other temporary differences 8,316 (5,373) 2,943
84,070 (18,207) 65,863Deferred income tax assets
Tax loss carry forwards (7,103) 7,103 0
76,967 (11,104) 65,863

T
CURRENT LIABILITIESCURRENT LIABILITIESABC LIMITEDYEAR ENDED 31 DECEMBER 2000CURRENT LIABILITIES- HISTORICAL COST BASIS
Sep Oct Nov Dec TotalZ$000 Z$000 Z$000 Z$000 Z$000
Creditors - Monetary and Non Monetary
Trade 3,205 57,302 6,862 67,369
Other 3,580 26,851 30,431
Accrued income 537 1,074 1,611 2,148 5,370
Fellow subsidiaries 37,874 907 1,780 683 41,244
38,411 5,186 64,273 36,544 144,414
CURRENT LIABILITIES- CURRENT COST BASIS
Sep Oct Nov Dec TotalZ$000 Z$000 Z$000 Z$000 Z$000
Creditors
Trade 3,205 57,302 6,862 67,369
Other 3,580 26,851 30,431
Accrued income 607 1,169 1,693 2,189 5,659
Fellow subsidiaries 37,874 907 1,780 683 41,244
38,481 5,281 64,355 36,585 144,703
CPI - 31 December 2000 1,188.2 1,188.2 1,188.2 1,188.2 1,188.2
CPI - Relevant month 1,050.4 1,091.6 1,130.7 1,165.7 1,188.2
Conversion Factor 1.131 1.088 1.051 1.019 1.000

T
INCOME STATEMENTINCOME STATEMENTABC LIMITEDYEAR ENDED 31 DECEMBER 2000INCOME STATEMENT - CURRENT COST BASIS
Jan Feb Mar Apr May Jun Jul Aug Sep Oct Nov Dec TotalZ$000 Z$000 Z$000 Z$000 Z$000 Z$000 Z$000 Z$000 Z$000 Z$000 Z$000 Z$000 Z$000
Turnover 64,934 88,399 76,546 43,383 65,719 60,180 52,120 53,145 59,094 53,434 52,784 37,987 707,727
Cost of sales (39,288) (66,296) (62,849) (28,961) (46,529) (47,357) (41,925) (52,407) (35,522) (39,292) (33,246) (19,148) (512,820)
Increase in WIP and FG 4,100 4,100
Depreciation expense (27,612) (27,612)
GROSS PROFIT 25,646 22,103 13,697 14,422 19,190 12,823 10,195 739 23,572 14,141 19,538 (4,673) 171,394
Other operating income (863) 1,805 136 1,358 (195) 3,061 239 448 1,142 1,303 531 2,467 11,431
Distribution expenses (3,111) (3,987) (3,116) (2,752) (3,477) (5,089) (2,962) (2,504) (3,497) (3,223) (3,280) (3,142) (40,141)
Administration expenses (3,660) (3,999) (4,018) (3,218) (4,092) (5,190) (3,626) (3,550) (4,445) (4,090) (4,099) (6,924) (50,911)
Depreciation expense (5,959) (5,959)
OPERATING PROFIT 18,011 15,921 6,699 9,810 11,426 5,606 3,847 (4,868) 16,772 8,132 12,690 (18,231) 85,815
Net finance costs (2,883) (1,451) (2,028) (1,304) (1,380) (542) (1,024) 1,545 6,286 298 1,243 1,973 733
Diminution in value of investment (5,994) (5,994)
Monetary loss (66,745) (66,745)
PROFIT BEFORE TAXATION 15,128 14,470 4,671 8,506 10,046 5,064 2,823 (3,322) 23,058 8,430 13,933 (88,997) 13,810
Income taxation (194) (2,355) (3,122) (1,076) (1,514) (3,033) (850) (1,544) (4,604) (1,342) (1,565) (1,456) (22,655)
Deferred taxation 11,104 11,104
PROFIT AFTER TAXATION 14,935 12,116 1,549 7,430 8,532 2,030 1,973 (4,866) 18,453 7,088 12,368 (79,349) 2,258
CPI - 31 December 2000 1,188.2 1,188.2 1,188.2 1,188.2 1,188.2 1,188.2 1,188.2 1,188.2 1,188.2 1,188.2 1,188.2 1,188.2
CPI - Relevant month 785.9 859.8 927.4 947.7 961.2 979.7 1,027.0 1,050.4 1,091.6 1,130.7 1,165.7 1,188.2
Conversion Factor 1.512 1.382 1.281 1.254 1.236 1.213 1.157 1.131 1.088 1.051 1.019 1.000
T
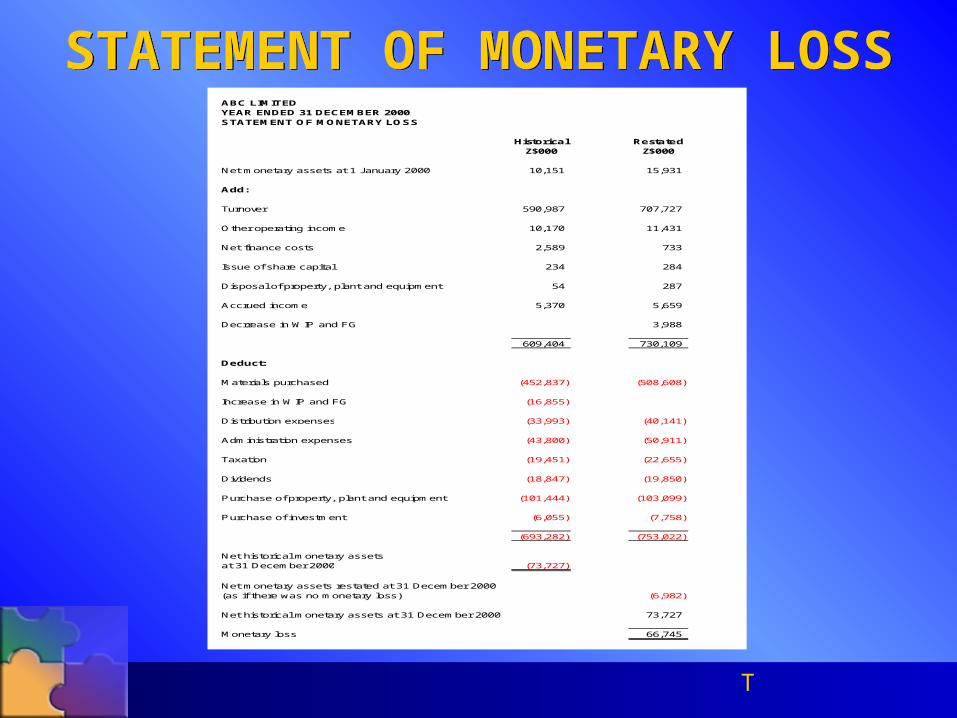
STATEMENT OF MONETARY LOSSSTATEMENT OF MONETARY LOSSABC LIMITEDYEAR ENDED 31 DECEMBER 2000STATEMENT OF MONETARY LOSS
Historical RestatedZ$000 Z$000
Net monetary assets at 1 January 2000 10,151 15,931
Add:
Turnover 590,987 707,727
Other operating income 10,170 11,431
Net finance costs 2,589 733
Issue of share capital 234 284
Disposal of property, plant and equipment 54 287
Accrued income 5,370 5,659
Decrrease in WIP and FG 3,988
609,404 730,109
Deduct:
Materials purchased (452,837) (508,608)
Increase in WIP and FG (16,855)
Distribution expenses (33,993) (40,141)
Administration expenses (43,800) (50,911)
Taxation (19,451) (22,655)
Dividends (18,847) (19,850)
Purchase of property, plant and equipment (101,444) (103,099)
Purchase of investment (6,055) (7,758)
(693,282) (753,022)
Net historical monetary assetsat 31 December 2000 (73,727)
Net monetary assets restated at 31 December 2000(as if there was no monetary loss) (6,982)
Net historical monetary assets at 31 December 2000 73,727
Monetary loss 66,745

T
STATEMENT OF MONETARY ASSETS AND LIABILITIES
STATEMENT OF MONETARY ASSETS AND LIABILITIES
ABC LIMITEDYEAR ENDED 31 DECEMBER 2000STATEMENT OF MONETARY ASSETS AND LIABILITIES
1999 2000Z$000 Z$000
HISTOICAL COST BASIS
MONETARY ASSETS
Deferred asset 0 3,584Debtors 104,970 97,578Deferred asset 0 448Cash and deposits 53,175 41,964
158,145 143,574
MONETARY LIABILITIES
Long-term loan 2,588 0Retirement benefit obligations 0 4,032Creditors 83,753 139,044Current taxation 840 18,611Dividends 5,638 14,135Short-term borrowings 55,175 41,031Retirement benefit obligations 0 448
147,994 217,301
NET MONETARY ASSETS/(LIABILITIES) 10,151 (73,727)
CURRENT COST BASIS
MONETARY ASSETS
Deferred asset 0 3,584Debtors 164,741 97,578Deferred asset 0 448Cash and deposits 83,453 41,964
248,194 143,574
MONETARY LIABILITIES
Long-term loan 4,062 0Retirement benefit obligations 0 4,032Creditors 131,443 139,044Current taxation 1,318 18,611Dividends 8,848 14,135Short-term borrowings 86,592 41,031Retirement benefit obligations 0 448
232,263 217,301
NET MONETARY ASSETS 15,931 (73,727)
INVENTORIES
Raw materials 26,352 26,240
Work-in-progress 27,979 17,973Finished goods 45,230 51,249
73,210 69,222
99,562 95,462

T
STATEMENT OF CHANGES IN EQUITY
STATEMENT OF CHANGES IN EQUITY
ABC LIMITEDYEAR ENDED 31 DECEMBER 2000STATEMENT OF CHANGES IN EQUITY- CURRENT COST BASIS
Share Share Adjustments to Retained TotalCapital Premium Share Capital EarningsZ$000 Z$000 Z$000 Z$000 Z$000
Balance at 1 January 2000 15,661 2,728 279,862 9,607 307,858
Net profit for the year 2,258 2,258
Dividend for the year (19,850) (19,850)
Deferred taxation 0
Issue of share capital 45 229 10 284
Balance at 31 December 2000 15,706 2,957 279,872 (7,985) 290,550
DIVIDENDSHistoric Convertion Current
Cost Factor CostZ$000 Z$000
Interim Jun-00 4,712 1.213 5,715
Final Dec-00 14,135 1.000 14,135
18,847 19,850
CPI - 31 December 2000 1,188.2
CPI - 30 June 2000 979.7
Conversion Factor 1.213
T
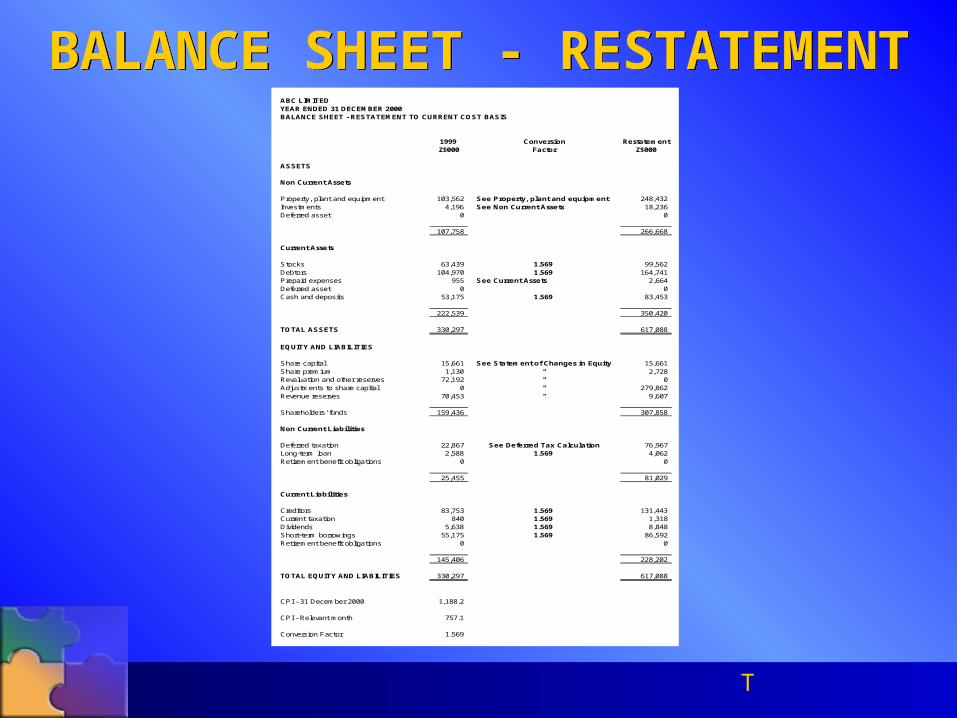
BALANCE SHEET - RESTATEMENTBALANCE SHEET - RESTATEMENTABC LIMITEDYEAR ENDED 31 DECEMBER 2000BALANCE SHEET - RESTATEMENT TO CURRENT COST BASIS
1999 Conversion RestatementZ$000 Factor Z$000
ASSETS
Non Current Assets
Property, plant and equipment 103,562 See Property, plant and equipment 248,432Investments 4,196 See Non Current Assets 18,236Deferred asset 0 0
107,758 266,668
Current Assets
Stocks 63,439 1.569 99,562Debtors 104,970 1.569 164,741Prepaid expenses 955 See Current Assets 2,664Deferred asset 0 0Cash and deposits 53,175 1.569 83,453
222,539 350,420
TOTAL ASSETS 330,297 617,088
EQUITY AND LIABILITIES
Share capital 15,661 See Statement of Changes in Equity 15,661Share premium 1,130 " 2,728Revaluation and other reserves 72,192 " 0Adjustments to share capital 0 " 279,862Revenue reserves 70,453 " 9,607
Shareholders' funds 159,436 307,858
Non Current Liabilities
Deferred taxation 22,867 See Deferred Tax Calculation 76,967Long-term loan 2,588 1.569 4,062Retirement benefit obligations 0 0
25,455 81,029
Current Liabilities
Creditors 83,753 1.569 131,443Current taxation 840 1.569 1,318Dividends 5,638 1.569 8,848Short-term borrowings 55,175 1.569 86,592Retirement benefit obligations 0 0
145,406 228,202
TOTAL EQUITY AND LIABILITIES 330,297 617,088
CPI - 31 December 2000 1,188.2
CPI - Relevant month 757.1
Conversion Factor 1.569

T
BALANCE SHEETBALANCE SHEETABC LIMITEDYEAR ENDED 31 DECEMBER 2000BALANCE SHEET - CURRENT COST BASIS
Identification 2000 1999Z$000 Z$000
ASSETS
Non Current Assets
Property, plant and equipment Non-monetary 317,673 248,432Investments Non-monetary 20,000 18,236Deferred asset Monetary 3,584 0
341,257 266,668
Current Assets
Stocks Non-monetary 95,462 99,562Debtors Both 100,242 167,405Deferred asset Monetary 448 0Cash and deposits Monetary 41,964 83,453
238,117 350,420
TOTAL ASSETS 579,373 617,088
EQUITY AND LIABILITIES
Share capital Non-monetary 15,706 15,661Share premium Non-monetary 2,957 2,728Adjustment to share capital Non-monetary 279,872 279,862Revenue reserves Both (7,985) 9,607
Shareholders' funds 290,550 307,858
Non Current Liabilities
Deferred taxation Both 65,863 76,967Long-term loan Monetary 0 4,062Retirement benefit obligations Monetary 4,032 0
69,895 81,029
Current Liabilities
Creditors Both 144,703 131,443Current taxation Monetary 18,611 1,318Dividends Monetary 14,135 8,848Short-term borrowings Monetary 41,031 86,592Retirement benefit obligations Monetary 448 0
218,928 228,202
TOTAL EQUITY AND LIABILITIES 579,373 617,088

T
CASH FLOW STATEMENTCASH FLOW STATEMENTABC LIMITEDYEAR ENDED 31 DECEMBER 2000CASHFLOW STATEMENT- CURRENT COST BASIS
2000Z$000
CASH FLOWS FROM OPERATING ACTIVITIES
Net profit before taxation and interest 19,071
Adjustments for:
Depreciation 33,571Profit on sale of property, plant and equipment (506)Retirement benefit obligations 448
Operating profit before working capital changes 52,584
Decrease in stocks 4,100Decrease in debtors 67,163Increase in creditors 13,260
Cash generated from operations 137,107
Income taxes paid (5,362)Interest paid
Net cash generated from operating activities 131,745
CASH FLOWS UTILISED IN INVESTING ACTIVITIES
Purchase of property, plant and equipment (103,099)Proceeds from sale of property, plant and equipment 793Purchase of investment (7,758)Net Interest received 733
Net cash utilised in investing activities (109,331)
CASH FLOWS UTILISED IN FINANCING ACTIVITIES
Proceeds from issue of share capital 284Loans repaid (9,595)Dividends paid (14,563)
Net cash utilised in financing activities (23,874)
Net increase in cash and cash equivalents (1,460)
Cash and cash equivalents at 1 January 2000 4,981
Cash and cash equivalents at 31 December 2000 3,521
Represented by:
Cash and deposits 41,964Short term borrowings (38,443)
3,521