Practical Contamination Management
45
Practical Contamination Management From Processing to Delivery HYDAC FILTER SYSTEMS GMBH Industriegebiet 66280 Sulzbach/Saar Germany Phone: +49 6897 509-01 Fax: +49 6897 509-846 Internet: www.hydac.com E-Mail: [email protected] E 7.604.1/05.09
Transcript of Practical Contamination Management

PracticalContaminationManagementFrom Processingto Delivery
HYDAC FILTER SYSTEMS GMBHIndustriegebiet66280 Sulzbach/SaarGermany
Phone: +49 6897 509-01Fax: +49 6897 509-846
Internet: www.hydac.comE-Mail: [email protected] E7.604.1/05.09

Page 25
Page 26
Page 27
Page 28
Page 28
Page 28
Page 29
Page 31
Page 32
Page 35
Page 35
Page 36
Page 36
Page 40
Page 42
Page 42
Page 43
Page 45
Page 47
Page 49
1
Definition ofContamination Management
Contamination ManagementBasics
2.1 Definition ofContamination Types
2.2 Consequences ofParticulate Contaminationin Power Fluid Systems
2.3 Classification ofParticulate Contaminationin Fluids
2.3.1 ISO 4405 —“Hydraulic Power Fluid —Fluid Contamination —Determining ParticulateContamination EmployingGravimetric Analysis Methods”
2.3.2 ISO 4406:1999
2.3.3 NAS 1638
2.3.4 SAE AS 4059
2.3.5 Procedure in EvaluatingFluid Samples According toISO 4406:1999, NAS 1638and SAE AS 4059
Determining theResidual Dirt Quantityof Components
3.1 Ultrasonic Method
3.2 Flushing Method
3.3 Shaking Method
3.4 Evaluation Methods
Analysis of the Cleanlinessof Systemson the Flushing/Test Stand
4.1 Turbulent Flow
4.2 Dispersion Effect
4.3 Flushing of All Ductsand Surfaces
4.4 Pulsating Flowduring Flushing
1
2
3
4
Page 3
Page 5
Page 5
Page 8
Page 12
Page 13
Page 14
Page 15
Page 16
Page 17
Page 19
Page 19
Page 20
Page 20
Page 21
Page 23
Page 23
Page 24
Page 25
Page 25
4.5 Performinga Cleanliness Checkon a Flushing Stand
4.5.1 Determining Overall SystemContamination
Contamination Monitoring
5.1 Planning and Design
5.2 How Sampling is Done
5.3 Inspection of theManufacturing and Assembly Line
5.4 Results
Draftinga Cleanliness Specification
6.1 EstablishingCleanliness Specifications
Sources of Contamination in theManufacturing and Assembly ofHydraulic Systems
7.1 Preventing the Ingressionof Contamination in theManufacturing and Assemblyof Hydraulic Systems
7.2 Removal ofParticulate Contaminationfrom Hydraulic Systems(Practical Experience)and Components
7.2.1 Cleaning System
7.2.2 Function Testing
7.3 Storage, Logisticsand Ambient Conditions
7.4 Supplier Parts and ComponentsManufactured In-house
Commissioning Flushing
Economic Efficiency Analysis
Contamination Managementin Practice
Reference List
5
6
7
8
9
10
E7.604.1/05.09

3
1 Definition ofContaminationManagement
Contamination managementpertains to the analysis andoptimization of processes withregard to the cleanliness ofcomponents, systems and the purityof the fluids employed. In today’shydraulic systems — in theautomotive industry and theirsuppliers, the hydraulics and mobilehydraulics industry — smaller,lighter and more powerfulcomponents are currently beingemployed as compared to say 10years ago. The use of thesecomponents also means that thedemands made of systemcleanliness are now much higher, ashas been shown by various studies.
Between 70-80 % of hydraulicsystem outages is due to increasedcontamination. This failure rate notonly applies to the classic hydraulicsindustry. ContaminationManagement is also a key issue inthe automotive industry, in which theuse of electrohydraulic systems ison the rise. In this context, hydraulicor fluid power systems are used in ageneral sense for all industries(automotive, hydraulics and mobilehydraulics industries). Cleanlinessspecifications are currently appliedin the automotive industry for thefollowing:
motors (fuel and oil supplysystems)
power steering
manual/automatic transmissions
electrohydraulic systems(suspension, clutch, brake, ABSand ESP systems)
central hydraulic systems
This list is by no means exhaustiveand is intended rather as a sampleof the areas in which contaminationmanagement plays a role.
In the past, power fluid systemswere equipped with systemfiltration which cleaned the systemduring commissioning and thenhad the task of maintaining systemfluid cleanliness at a constant level,e.g. by using commissioning filtersand initial brief maintenanceintervals followed by changing overto system filtration. This approachfrequently no longer suffices due tothe growing demands made oftoday’s hydraulic systems(extended maintenance intervalsand mounting cost pressure).Precommissioning flushing isperformed in large systems in thehydraulics industry to quickly bringthe contamination level down to anacceptable level.
However, in small, mass-producedhydraulic systems (e.g. in theautomotive and hydraulicsindustries) this is not alwayspossible. That is whycontamination management beginswith the manufacture of theindividual components and extendsthroughout the entire process chainup to and including the finishedcomponent. Ideally, the design anddevelopment departments are alsointegrated in this process so thatcomponent design facilitates thewashing of components in a cost-efficient manner. Suppliers alsohave to be involved incontamination management whenthe manufacturing process involvesa large portion of sourcedcomponents. By introducingcontamination management with aview to minimizing particulateconcentration in all areas,beginning with manufacturing andextending to the operation of theentire system, system malfunctionand failure caused by particulatecontamination can be preventedand, as a result, costs savingsachieved. Cutting the costs ofmachining tools, improving theutilization of test stations, andoptimizing the use of washingmachines can do this.
E7.604.1/05.09

4
This results in the followingcontamination management tasks:
development of systems which areoptimized so as to facilitatecleaning
optimizing and monitoring washingand flushing processes
training employees and raisingtheir awareness
detecting and eliminating sourcesof contamination
drafting analysis instructions
drafting cleanliness specificationsfor components and systems
An overall cost assessment isdone to gauge the success ofcontamination management.
The following factors areconsidered:
- warranty and non-warrantycourtesy work
- energy costs- reworking costs- machining tool costs- operating costs of washingmachines and test stations
- labor costs, etc.
The principles and applications ofcontamination management aredetailed below.
Definitions:
Contamination management monitoring/optimization of cleanliness in material flowsand system assembly
Power fluid system hydraulic systems, including automotive systems containingfluid fillings (e.g. motors, transmissions, power steering, ABS...)
Basic contamination quantity of contamination present subsequent to assembly
Ingress contamination particulate contamination caused by ingression
Initial damage damage to surfaces caused during functiontesting/commissioning or assembly of systems
Contamination monitoring analysis of processes with regard to the ingress of dirt causedby them
Online measurement measurement process in which the sample to be analyzed isprocess fed to a measurement device directly from the system, e.g.
automatic particle counter of a hydraulic system
Offline measurement measurement process in which the sample is taken from theprocess system and analyzed elsewhere, e.g. taking an oil sample
and sending it in to a laboratory
E7.604.1/05.09

5
ContaminationManagementBasics
2.1Definition ofContamination Types
Various types of contaminationoccur in power fluid systems:gaseous (e.g. air), liquid (e.g. water)and solid contaminants.An overview of the variouscontamination types is shown inthe following diagram:
Fig. 1: Contamination Types
2
As you can tell from examiningFigure 1, solid contamination issubdivided into three groups:extremely hard, hard and softparticles. Extremely hard particlescan cause substantial damage inpower fluid systems if they are notremoved as quickly as possible.Preventive measures can reducethe ingress of contaminants insystems.
E7.604.1/05.09
6
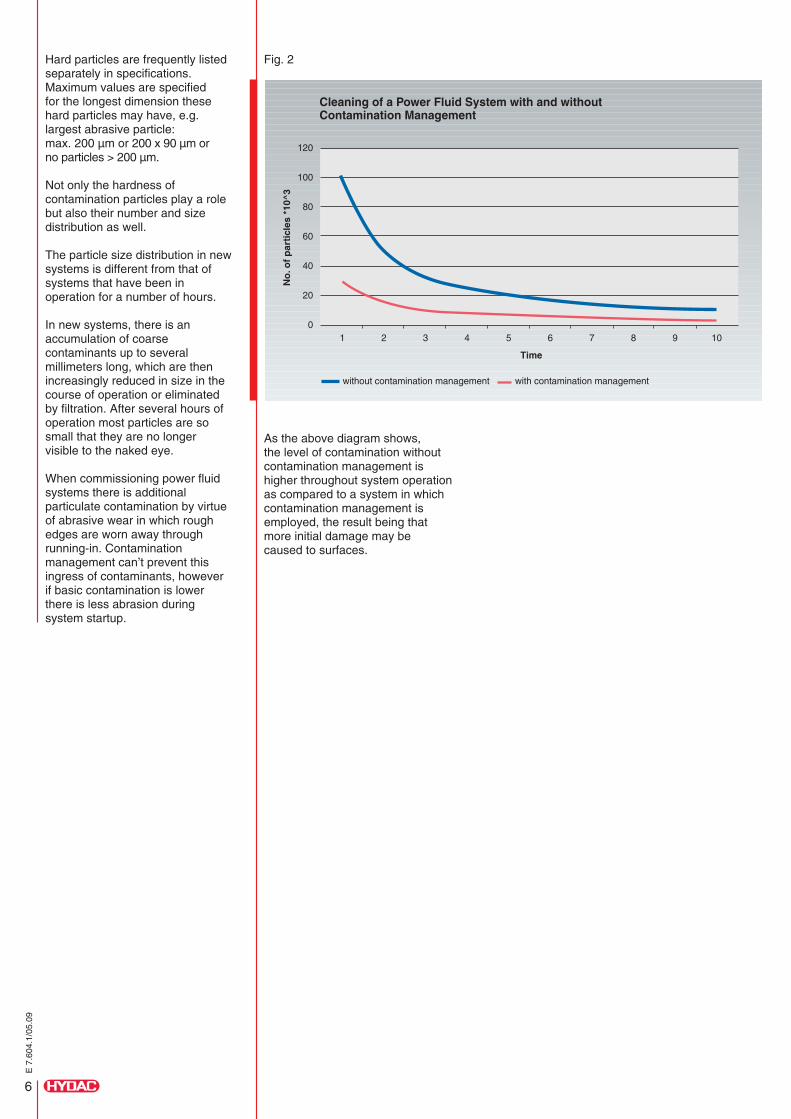
Hard particles are frequently listedseparately in specifications.Maximum values are specifiedfor the longest dimension thesehard particles may have, e.g.largest abrasive particle:max. 200 µm or 200 x 90 µm orno particles > 200 µm.
Not only the hardness ofcontamination particles play a rolebut also their number and sizedistribution as well.
The particle size distribution in newsystems is different from that ofsystems that have been inoperation for a number of hours.
In new systems, there is anaccumulation of coarsecontaminants up to severalmillimeters long, which are thenincreasingly reduced in size in thecourse of operation or eliminatedby filtration. After several hours ofoperation most particles are sosmall that they are no longervisible to the naked eye.
When commissioning power fluidsystems there is additionalparticulate contamination by virtueof abrasive wear in which roughedges are worn away throughrunning-in. Contaminationmanagement can’t prevent thisingress of contaminants, howeverif basic contamination is lowerthere is less abrasion duringsystem startup.
Fig. 2
As the above diagram shows,the level of contamination withoutcontamination management ishigher throughout system operationas compared to a system in whichcontamination management isemployed, the result being thatmore initial damage may becaused to surfaces.
E7.604.1/05.09

7
The following microscope imagesshow typical particle samples asoccur in power fluid systems.
Fig. 3
Sample containing coarse particles
Sample containing fine particles
An average healthy human eyecan see items down to ca. 40 µmin size. Particle analyses areconducted using a microscope or inpower fluid systems using particlecounters employing the lightextinction principle (cf. section2.3.5).
Fig. 4
E7.604.1/05.09

8
2.2Consequences ofParticulate Contaminationin Power Fluid Systems
Particulate contaminants circulatingin power fluid systems causesurface degradation throughgeneral mechanical wear(abrasion, erosion, and surfacefatigue).
This wear causes increasingnumbers of particles to be formed,the result being that wearincreases if the “chain reaction ofwear” is not properly contained(by reducing contamination).Gaps grow larger, leakage oil flowsincrease in size, and operatingefficiency (e.g. of pumps)decreases. Metering edges areworn away, thus resulting in controlinaccuracies. In some cases,blockage of control ducts or nozzlebores occurs.
The chain reaction of wear duringthe everyday operation of hydraulicsystems has to be interrupted byproperly designed anddimensioned filter systems.However, the measure of securityafforded the user is deceptive ashighly damaging contaminantsseep in during component andsystem assembly and systeminstallation. This ingress ofcontaminants not only can causepreliminary damage to systemcomponents but also prematurefailure as well.
Generally speaking, system filtrationconcepts are not designed toadequately deal with large quantitiesof dirt as occur in connection with:
component machining
system assembly
system filling
commissioning
system repair work
Fig. 5Examples of Wearto Movable Surfaces
E7.604.1/05.09

9
A study conducted by theUniversity of Hanover describesthe factors impacting the fatigue lifeof roller bearings as follows:
“The quantity of contamination inthe lubricant is described by theparticle quantity and size.Combining this with particlehardness and geometry results inthe type and extent of damage toraceways, with the extent alsobeing affected by the elasto-plasticbehavior of the material. Theamount of damage is determinedby the quantity of particles in thelubrication gap and the rolloverfrequency. Continued rollover leadsto cracking, which in the form offatigue damage (pitting) leads toroller bearing damage (bearingfailure).”
Fig. 6Factors AffectingRoller Bearing Life (1)
In practice ball bearings with theirpunctiform contact are shown inmost cases to be less sensitive toparticulate contamination thanroller bearings with their linearcontact. Friction bearings withtheir larger lubrication gaps arethe least sensitive to particulatecontamination.
E7.604.1/05.09

10
The following table provides anoverview of the most common gapsizes:
Fig. 7
Component Typical critical clearance[µm]
Gear pump (J1, J2) 0.5 – 5
Vane-cell pump (J1) 0.5 – 5
Piston pump (J2) 0.5 – 1
Control valve (J1) 5 - 25
Servo valve (J1) 5 – 8
Comprehensive studies of particledistributions on components and inhydraulic systems have shown thatat the beginning of a system’s life,i.e. during assembly andcommissioning, the particles arelarger than during subsequentoperation.
These large particles – up toseveral millimeters in size in part –can cause spontaneous outages:
valve blockages
substantial preliminary damage topumps
destruction of seals and gasketsfollowed by leakage
Active contamination managementenables this rate can be reducedand costs accordingly cut, i.e.
costs caused by production stops
costs caused by delays incommissioning systems
costs incurred by longer testingperiods since a flushing cycle isrequired to remove integralcontamination
warranty costs
reworking costs
E7.604.1/05.09

11
Fig. 8Destroyed Raceway ofa Ball Bearing Caused byParticulate Contamination
Fig. 9Chip Embedded in the Surfaceof a Friction Bearing
Contamination managementcounters the situation as follows:
In new systems the individualcomponents are brought to auniform cleanliness level, the fillingfluid is kept at a defined level, as isthe fluid during system operation(cf. Contamination Monitoring,section 5 ff.).
E7.604.1/05.09

12
2.3Classification ofParticulate Contaminationin Fluids
The objective of the proceduresdescribed below is to enable areproducible classification ofparticulate contaminants in fluids.
Currently there are 4 procedures forclassifying particulate contaminantsin fluids:
Standard
Application
Parameters
Analysis methods
Remarks
ISO 4405
Highly contaminatedmedia, e.g. washing media,machining fluids
[mg/liters of fluid]
In this lab method, 1 literof the fluid undergoinganalysis is filtered througha prepared membrane,which is then weighed
Very time-consumingmethod
ISO 4406:1999
Hydraulic fluidsLubrication oils
Number of particles> 4 µm (c)> 6 µm (c)> 14 µm (c)
NAS 1638
Hydraulic fluidsLubrication oils
Number of particles5 – 15 µm15 – 25 µm25 – 50 µm50 – 100 µm
> 100 µm
SAE AS 4059
Hydraulic fluidsLubrication oils
Number of particles> 4 µm (c)> 6 µm (c)> 14 µm (c)> 21 µm (c)> 38 µm (c)> 70 µm (c)
1. Manual evaluation:The fluid undergoing analysis is filtered through a prepared membraneand the cleanliness class (contamination rating) estimated or countedby hand using a microscope.
2. Automated particle counting:The fluid undergoing analysis is conducted through a particle counter,which tallies the particle fractions.
1. Manual evaluation:Very time-consuming,not very exact.
2. Automated particle counting:Result available almost immediately.
These standards are describedin detail below.
E7.604.1/05.09

Afterwards the membrane isweighed and this value recordedas m (T).
Now the membranes are fixed in themembrane retainer and the fluidundergoing analysis is filtered. Thisis followed by flushing off thecontaminant on the membrane usingfiltered solvent to completely removethe contaminant. When analyzingoil-laden fluids it is important that theremaining oil is completely flushedoff the membrane.
This is followed by drying themembrane, cooling and weighing it(as described above). The measuredvalue is now recorded as m (E).
Gravimetric contamination iscalculated as follows:
M (G) = m(E) – m(T)
13
2.3.1ISO 4405 – “HydraulicPower Fluid –Fluid Contamination –Determining ParticulateContamination EmployingGravimetric AnalysisMethods”
This international standarddescribes the gravimetric methodfor determining the particulatecontamination of hydraulic fluids.
Basic principle:
A known volume of fluid is filteredthrough one or two filter disks usingvacuum action and the weightdifferential of the filter disks(upstream and downstream offiltration) measured. The secondmembrane is used for evaluatingaccuracy.
In order to determine thegravimetric contamination of thefluid, a representative sample has tobe taken from the system. ISO 4405describes the cleaning procedurefor the equipment being used. Italso describes the preparatoryprocedures for the analysismembranes:
The membranes are flushed withisopropanol prior to use, dried in adrying oven until they achieve aconstant weight, and then cooled ina defined dry environment. It isimportant that cooling takes place ina defined dry environment,otherwise the membrane absorbsmoisture from the surroundings,thus skewing the final result.
Fig. 10
E7.604.1/05.09

14
2.3.2ISO 4406:1999
In ISO 4406, particle counts aredetermined cumulatively, i.e. >4 µm (c), > 6 µm (c) and >14 µm (c) (manually by filteringthe fluid through an analysismembrane or automatically usingparticle counters) and allocated tomeasurement references.
The goal of allocating particlecounts to references is to facilitatethe assessment of fluid cleanlinessratings.
In 1999 the “old” ISO 4406 wasrevised and the size ranges of theparticle sizes undergoing analysisredefined. The counting methodand calibration were also changed.
This is important for the user in hiseveryday work:
Even though the measurementreferences of the particlesundergoing analysis have changed,the cleanliness code will changeonly in individual cases. Whendrafting the “new” ISO 4406 it wasensured that not all the existingcleanliness provisions for systemshad to be changed (Lit. © HYDAC,“Filters – Power Fluid Technology,New Test Dust, New Calibration,New Filter Testing Methods — HowThis Impacts Everyday Work”).
Overview of the changes:
If the number of particles counted inthe sample is larger than 20, theresult has to be reported with ≥.
Note: increasing the measurementreference by 1 causes the particlecount to double.
Example:ISO class 18 / 15 / 11 says that thefollowing are found in 1 ml ofanalyzed sample:
1,300 – 2,500 particles > 4 µm (c)160 – 320 particles > 6 µm (c)10 – 20 particles > 14 µm (c)
Fig. 11Microscopic Examination of anOil Sample (100 ml)Magnification 100x (ISO 18 / 15 / 11)
Allocation of particle counts tocleanliness classes:
No. of particles/ml Cleanlinessclass
Over Up to
2,500,000 > 281,300,000 2,500,000 28640,000 1,300,000 27320,000 640,000 26160,000 320,000 2580,000 160,000 2440,000 80,000 2320,000 40,000 2210,000 20,000 215,000 10,000 202,500 5,000 191,300 2,500 18640 1,300 17320 640 16160 320 1580 160 1440 80 1320 40 1210 20 115 10 10
2.5 5 91.3 2.5 8
The reproducibility of the results incleanliness class 8 depends on theconcentration of particles in thesample undergoing analysis.
Size ranges
Dimensiondetermined
Test dust
Comparablesize ranges
“old” ISO 4406:1987
> 5 µm,> 15 µm
Longest dimensionof a particle
ACFTD dust
Old ACFTDcalibration
> 4 µm (c)> 6 µm (c)> 14 µm (c)
Diameter of thearea-equivalentcircleISO 11171:1999
ISO 12103-1A1
ISO 12103-1A2
ISO 12103-1A3
ISO 12103-1A4
New NISTcalibration
4 µm (c)6 µm (c)14 µm (c)
“new” ISO 4406:1999
1-10 µmUltrafine fraction
SAE Fine,AC Fine
SAE 5-80 µmISO MTDCalibration dustfor particle counters
SAE CoarseCoarse fraction
ComparableACFTD dusts
< 1 µm4.3 µm15.5 µm
1,300 – 2,500 particles > 4 µm (c)160 – 320 particles > 6 µm (c)10 – 20 particles > 14 µm (c)
E7.604.1/05.09

15
2.3.3NAS 1638
Like ISO 4406, NAS 1638 describesparticle concentrations in liquids. Theanalysis methods can be applied inthe same manner as ISO 4406:1987.
In contrast to ISO 4406, certainparticle ranges are counted inNAS 1638 and attributed tomeasurement references.
The following table shows thecleanliness classes in relation to theparticle concentration analyzed:
Increasing the class by 1 causes theparticle count to double on average.
The particle counts of class 10 arebold-faced in the above table.
Fig. 12Microscopic Examination of anOil Sample (100 ml)Magnification 100x (NAS 10)
Particle size [µm]
5-15 15-25 25-50 50-100 >100No. of particles in 100 ml sample
00 125 22 4 1 00 250 44 8 2 01 500 89 16 3 12 1,000 178 32 6 13 2,000 356 63 11 24 4,000 712 126 22 45 8,000 1,425 253 45 86 16,000 1,850 506 90 167 32,000 5,700 1,012 180 328 64,000 11,600 2,025 360 649 128,000 22,800 4,050 720 12810 256,000 45,600 8,100 1,440 25611 512,000 91,200 16,200 2,880 51212 1,024, 000 182,400 32,400 5,760 1,024
Cleanlinessclass
E7.604.1/05.09

16
2.3.4SAE AS 4059
Like ISO 4406 and NAS 1638, SAEAS 4059 describes particleconcentrations in liquids. Theanalysis methods can be appliedin the same manner as ISO4406:1999 and NAS 1638.
The SAE cleanliness classes arebased on particle size, numberand distribution. Just like for theISO classification, the differentparticle concentrations are assignednumerical codes (see table).Compared to the 3-digit ISO code,in which the particle size rangesare fixed (> 4 µm(c) / > 6 µm(c) />14µm(c)), the SAE cleanlinessclass assigns the capital lettersA-F to the particle size range beingconsidered.These letters correspond to> 4 µm(c) ... > 70 µm(c).
The following table shows thecleanliness classes in relation to theparticle concentration determined:
** Particle sizes determinedaccording to the diameter of theprojected area-equivalent circle.
* Particle sizes measured accordingto the longest dimension.
A B C D E F
000 195 76 14 3 1 000 390 152 27 5 1 00 780 304 54 10 2 01 1,560 609 109 20 4 12 3,120 1,220 217 39 7 13 6,250 2,430 432 76 13 24 12,500 4,860 864 152 26 45 25,000 9,730 1,730 306 53 86 50,000 19,500 3,460 612 106 167 100,000 38,900 6,920 1,220 212 328 200,000 77,900 13,900 2,450 424 649 400,000 156,000 27,700 4,900 848 12810 800,000 311,000 55,400 9,800 1,700 25611 1,600,000 623,000 111,000 19,600 3,390 1,02012 3,200,000 1,250,000 222,000 39,200 6,780
Maximum Particle Concentration [particles/100 ml]
> 1 µm > 5 µm > 15 µm > 25 µm > 50 µm > 100 µm
> 4 µm (c) > 6 µm (c) > 14 µm (c) > 21 µm (c) > 38 µm (c) > 70 µm (c)
Size ISO 4402Calibration or visualcounting*
Size ISO 11171,Calibration orelectron microscope**
Size coding
The SAE cleanliness classes canbe represented as follows:
1. Absolute particle count largerthan a defined particle size
Example:
Cleanliness class accordingto AS 4059:6
The maximum permissible particlecount in the individual size ranges isshown in the table in boldface.
Cleanliness class according toAS 4059:6 B
Size B particles may not exceed themaximum number indicated forclass 6.
6 B = max. 19,500 particles of asize of 5 µm or 6 µm (c)
2. Specifying a cleanliness classfor each particle size
Example:
Cleanliness class according to AS4059: 7 B / 6 C / 5 D
Size B (5 µm or 6 µm (c)):38,900 particles / 100 mlSize C (15 µm or 14 µm (c)):3,460 particles / 100 mlSize D (25 µm or 21 µm (c)):306 particles / 100 ml
3. Specifying the highestcleanliness class measured
Example:
Cleanliness class according to AS4059:6 B – F
The 6 B – F specification requires aparticle count in size ranges B – F.The respective particleconcentration of cleanliness class 6may not be exceeded in any ofthese ranges.
E7.604.1/05.09

17
2.3.5Procedure in EvaluatingFluid Samples Accordingto ISO 4406:1999,NAS 1638 andSAE AS 4059
A representative sample is taken ofthe fluid and analyzed as follows:
1. Manual procedure accordingto ISO 4407 (Hydraulic fluid power– Fluid contamination –Determination of particulatecontamination by the countingmethod using a microscope).
ISO 4407 contains a description ofa microscopic counting method formembranes. 100 ml of the sampleundergoing analysis is filteredthrough an analysis membranefeaturing an average pore size of< 1-µm and square markings.The standard also describes thecleaning procedure and maximumparticle count of the negativecontrol.
After the analysis membranes aredried, 10, 20 or 50 squares arecounted depending on the size ofthe particles, followed by addingthe values and extrapolating to themembrane diameter.
The manual count of the particlesis done in the “old” levels of > 5 µmand > 15 µm since the longestdimension of a particle is countedin ISO 4407 yet the diameter of thearea-equivalent circle is counted inthe “new” ISO 4406:1999. Asdescribed above, the referencevalues obtained for this countcorrespond to the reference valuesof the “new” evaluation.
Fig. 13
This counting method can only beused for very clean samples.Generally speaking, the cleanlinessclasses are estimated on the basisof reference photographs or thesamples automatically counted.
2. Automated particle counting
Below follows a description of howcommon particle countersemploying the light extinctionprinciple function.
The figure below shows asimplified rendering of themeasurement principle employedin the light extinction principle.The light source transmits themonochromatic light through the oilflow onto a photodetector, whichgenerates a specific electricalsignal. A shadow is created on thephotodetector if a particle (black)comes between the light sourceand the photodetector.This shadow causes the electricalsignal generated by the sensorto change. This change can beused to determine the size of theshadow cast by this particle andthus the particle size to bedetermined.
Fig. 14
This procedure enables thecleanliness classes accordingto ISO 4406:1987, ISO 4406:1999,NAS 1638 and SAE AS 4059to be determined.
The “noise” involved in thismeasurement principle isextraneous liquids and gaseswhich cause the light beam tobe interrupted and thus becounted as particles.
The particle counter should becalibrated according to ISO 11943(for ISO 4406:1999).
E7.604.1/05.09

The following types of automaticparticle counting are used:
Online processes in which thesample is taken directly from thesystem and conducted into theparticle counter, or the sensor isintegrated directly in the system.
Or offline processes in which thesample is filled into a samplecontainer from which the liquid isconveyed through a particlecounter.
Laboratory Particle Counter witha Bottle Sampling Unit
BSU 8000 with FCU 8000
Online Particle Counterof the FCU 2000 Series
Fig. 15
18
Fig. 16
E7.604.1/05.09

19
Determining theResidual Dirt Quantityof Components
Determining the residual dirtquantities present on componentscan be done employing quantitativeand qualitative factors.
Quantitative: • mg/component• mg/surface unit(oil-wetted surface)• mg/kg componentweightno. of particles >x µm/component• no. of particles >x µm/surface unit(oil-wetted surface)
Qualitative: length of the largestparticle (subdivisioninto hard/soft)
Components with easily accessiblesurfaces are components in whichonly the outer surface is of interestfor the most part when performingresidual dirt analyses. There areexceptions here, e.g. transmissionand pump housings, as the internalsurface is of interest. Thesecomponents belong to group 1 andtheir surfaces are not easilyaccessible in most cases.
Components in which the innersurfaces are examined orpreassembled assemblies belong togroup 2; for the analysis procedurefor this group, refer to section 4.
There are two methods that can beused to determine the residual dirtof group 1 components:
3.1Ultrasonic Method
The ultrasound method involvessubmitting the components to anultrasonic bath, exposing them fora defined period of time at adefined ultrasonic setting and bathtemperature. The particulatecontamination is loosened by theexposure and then flushed off thecomponent using a suitable liquid.
The particle dispersion in theflushing liquid obtained in thismanner is analyzed according tospecified evaluation methods(cf. section 3.4).
The ultrasonic energy setting andthe duration of exposure have to beindicated in reporting the result.The ultrasonic procedure isparticularly suitable for smallcomponents in which all surfaceshave to be examined. Castcomponents and elastomersshould not be subjected toultrasonic washing if possible as arisk is posed here of the carboninclusions in the cast piece beingdissolved, thus skewing the results.These effects have to beascertained prior to performing anultrasonic analysis.
3
E7.604.1/05.09

20
3.2Flushing Method
Components with easily accessiblesurfaces or components in whichonly surface parts have to beexamined are analyzed using theflushing method. This methodinvolves flushing the surfaceundergoing analysis in a definedclean environment using ananalysis fluid, which also has adefined cleanliness. A “negativecontrol” or basic contaminationcontrol is performed prior toanalysis in which all the surfaces ofthe environment, e.g. the collectingbasin, are flushed and the valueobtained reported as the basiccontamination of the analysisequipment. The flushing fluid isthen analyzed using the specifiedevaluation methods.
Fig. 17
3.3Shaking Method
This method is very rarely used, asit is very difficult to reproducemanually. However, results arereproducible when automaticshakers such as those used inchemical laboratories areemployed. The analyzedcomponents are componentssubject to wear whose innersurfaces are to be analyzed (e.g.pipes, tanks). The important thingis that the particles are flushed outof the inside of the componentsafter being shaken.
The following table shows acomparison of the various methodsfor analyzing components andassemblies.
The areas shown in red are theflushing areas; those shown inblue the designated analysis area.In reality these two circuits areconfigured using suitable valves insuch a manner that switchover canbe done between the two storagetanks. The figure represents asimplified circuit diagram.
The analysis fluid is subjected to apressure of ca. 4-6 bars and thusconveyed through the system filterand the spray gun into the analysischamber. The system filter ensuresthat the analysis fluid sprayed onthe surface being examined has adefined cleanliness. The particle-loaded fluid collects in thecollecting basin and is filteredthrough the analysis membrane viavacuum action. The membrane isthen evaluated according to theanalysis methods described below.
Flushing method
Components areflushed with theanalysis fluid in adefined cleanenvironment.
Components in whichonly surface partshave to be examinedand components inwhich ultrasoundmay damage thesurfaces.
Components with asimple design andwith easilyaccessible surfaces.
Analysis can beperformed quickly
Reproducibility
Standards arenot yet available(currently inpreparation)
Ultrasonic method
Components areexposed to anultrasonic bath andare then flushed withthe analysis fluid.
Small componentsand components inwhich all surfacesare to be analyzed(the component sizedepends on theultrasonic bath).
Reproducibility
Analysis takesa long time
The energy actson the surfaceundergoing analysis
The surface has tobe flushed
No valid standards
Applications
How
performed
Cons
Pros
E7.604.1/05.09

21
3.4Evaluation Methods
Evaluating particle-laden flushingfluids can be done according tovarious criteria. Gravimetric analysisis useful for heavily contaminatedcomponents, whereas particlecounts in various size ranges areuseful for very clean components.
The following table provides anoverview of the individual evaluationmethods:
* Alternative: also no. of particles / kg component weight
E7.604.1/05.09

22
The following table provides anoverview of applications of theanalysis and evaluation methods:
Evaluation
Analysis method
Simple components
Components
Complex components
Simple systems
Systems
Complex systems
easy-to-accesssurfaces
gears
internal surfaces
pipes, tanks
Components featuringvarious bore holes orducts
control plates
surface is to beanalyzed
immersed sensors
internal surfaces
rails of commonrail systems
valves, pumps
e.g.
e.g.
e.g.
e.g.
e.g.
e.g.
Flushing Ultrasonic Flushing Ultrasonic Function testing*method method
U U U U NU
U NU U NU CU**
CU** NU CU** NU U
U U U U NU
CU** NU CU** NU U
CU** NU CU** NU U
Gravimetry Particle counting
U = usableCU = conditionally usableNU = not usable* = section 4, Analysis of the Cleanliness of Systems on the Flushing/Test Stand.** = It has to be ensured that the particles dislodged from the component can be flushed away.
E7.604.1/05.09
23
Analysis of theCleanliness ofSystems on theFlushing/Test Stand
The cleanliness of components andsystems that pass through aflushing or test stand can bedetermined on the basis of thecleanliness of the test fluid in somecases. This indirect analysismethod is preceded by manualanalyses for validation purposes.
For example, hoses are flushed byhand and the results evaluated inaccordance with the methodsdiscussed in section 3. At the sametime, the cleanliness of the testfluid of the test stand is determinedin the return flow, i.e. downstreamof the component.
If a correlation is detected betweenthe manual and the automatic(indirect) value, this means thatindirect value analysis can beselected as a measure of quality.
The flushing stand used foranalyzing the residual dirt contentof systems has to feature thefollowing:
1. Flushing has to be done usingas turbulent a flow as possible.
2. The fluid used has to posses adispersion effect.
3. All channels and surfaces haveto be exposed to the flow.
4. The effectiveness of flushing canbe improved by pulsating theflushing.
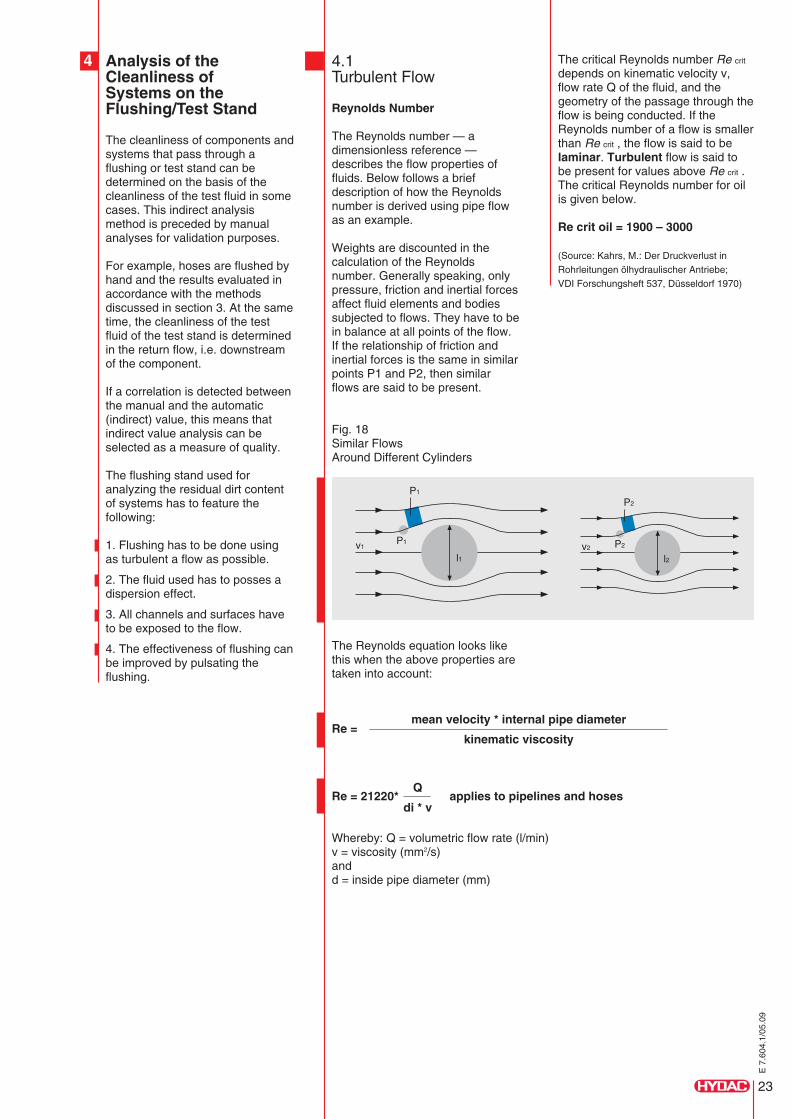
4.1Turbulent Flow
Reynolds Number
The Reynolds number — adimensionless reference —describes the flow properties offluids. Below follows a briefdescription of how the Reynoldsnumber is derived using pipe flowas an example.
Weights are discounted in thecalculation of the Reynoldsnumber. Generally speaking, onlypressure, friction and inertial forcesaffect fluid elements and bodiessubjected to flows. They have to bein balance at all points of the flow.If the relationship of friction andinertial forces is the same in similarpoints P1 and P2, then similarflows are said to be present.
Fig. 18Similar FlowsAround Different Cylinders
The Reynolds equation looks likethis when the above properties aretaken into account:
Whereby: Q = volumetric flow rate (l/min)v = viscosity (mm2/s)andd = inside pipe diameter (mm)
Re =mean velocity * internal pipe diameter
kinematic viscosity
Q
di * vRe = 21220*
The critical Reynolds number Re crit
depends on kinematic velocity v,flow rate Q of the fluid, and thegeometry of the passage through theflow is being conducted. If theReynolds number of a flow is smallerthan Re crit , the flow is said to belaminar. Turbulent flow is said tobe present for values above Re crit .The critical Reynolds number for oilis given below.
Re crit oil = 1900 – 3000
(Source: Kahrs, M.: Der Druckverlust inRohrleitungen ölhydraulischer Antriebe;VDI Forschungsheft 537, Düsseldorf 1970)
4
applies to pipelines and hoses
E7.604.1/05.09

24
The following diagrams show thedifference between laminar andturbulent flow.
Fig. 19
Laminar Flow
All particles move without mixing.
The path of a particle is described bya stream thread.
Parabola-shaped velocity distribution(applies to pipes).
Reynolds number smaller than Re crit
Turbulent Flow
All particles are continuously mixed.
The path of a particle cannot bepredicted.
Relatively even time-averagedvelocity distribution (flattenedparabola).
Reynolds number larger than Re crit
The above diagram shows aparabolic, laminar flow in a pipe.This shows that the flow velocity of alaminar current in the middle of thepipe (peak of the parabola) is largerthan along the pipe wall.
In a turbulent flow this parabolaflattens and spreads (when meanvalues are considered), astransversal currents are involved in aturbulent flow. They cause the flowvelocity to be increased in the vicinityof the pipe walls.This effect is utilized when flushingsystems as increasing the flow ratecauses particles that have beendeposited on the wall to be loosenedand swept away.
Source:University of WürzburgFluid Mechanics lecture
4.2Dispersion Effect
The oil used for flushing has tohave a dispersion effect so thatparticles are dislodged andtransported off. Special thin-bodiedmineral-oil-type flushing oils cancontribute instrumentally toimproving the flushing effect. Theylower the adhesion force betweenthe dirt particles and the pipe wall.By virtue of their excellent surfacewetting properties, they creep intobetween the dirt particles and thewall, thus causing the particles tobecome dislodged. Experimentshave shown that by changing theflushing fluid from an operatingfluid to a flushing oil,component/system cleanliness canbe increased by a factor of 4.Flushing oils of this type have tothen be closely matched to thehydraulic medium used as failure toproperly match the two may lead tothe following:
marked foaming
filter blockage
clogging of the system
E7.604.1/05.09

25
4.3Flushing of All Ductsand Surfaces
When setting up the inspection andtesting plan, it has to be ensuredthat all surfaces and ducts arewetted during flushing.
4.4Pulsating Flow duringFlushing
Pulsating flow or the reversal ofthe flow direction also results inimproved removal of adhesiveparticles. In so doing, the maineffect is achieved by virtue ofalternating forces being appliedto the particles to be dislodged.The same effect can be achievedvia ultrasonic equipment or othervibration-generating equipment.
Fig. 20
The flushing of pipework/hoses andhydraulic systems can be doneusing a HYDAC Flushing Unit.
The following is performed:
Pressure testing
Flushing
Documentation of the flushingresults
4.5Performing a CleanlinessCheck on a FlushingStand
The cleanliness of components andsystems which undergo functiontesting can be determined on aflushing or function test stand(= flushing stand).
This method is used for pumps,cylinders, transmissions, controlunits, power steering units, valveblocks, etc.
Once it is ensured that the flushingstand possesses the propertiesindicated above, an analysis isconducted as described below.
Prior to the analysis the flushingstand is cleaned to a defined highcleanliness level so that the basiccontamination of the test systemdoes not affect the measurementresults. Then this basic cleanlinessis computed and recorded.
E7.604.1/05.09

26
4.5.1Determining OverallSystem Contamination
The sampling site for an automaticparticle counter is defined as a siteupstream or downstream of the testitem, which is subjected to a directflow. The following is performed ifthe analysis result is to beadditionally subjected togravimetric analysis:
the entire test fluid is collected andfiltered through an analysismembrane
or an inline membrane retainerfeaturing the analysis membrane isintegrated in the return-flow line.
Now the test item is tested inaccordance with the inspection andtesting plan, during which thecleanliness classes are recorded.
Example 1:
The schematic below shows theanalysis performed on a pump teststand.
Fig.21
After 5 minutes of testing the pumpspeed is increased to the maximumspeed. This causes particulatecontamination to be dislodged. Thesystem becomes increasinglycleaner. Particulate contaminationis still being released after 1 hourof testing (standard test time: 10-15min.), consequently the cleanlinessof the return-line fluid (blue =downstream of the test item) neverachieves the same cleanliness asupstream of the test item.
This method is suitable forchecking the cleanliness of itemsbeing delivered quickly and simplyin series testing, documenting itand then concluding the flushingprocedure when the target value isachieved. By integrating themeasurement circuit in themanufacturing instrumentation andcontrol system it is also possible toquickly detect any deviations andinitiate suitable measures. The goalof continuous cleanlinessmonitoring is to monitor processreliability with regard to systemcleanliness upon delivery.
A specification like this alsoenables increased systemcontamination to be responded toquickly. If these measurements areonly conducted once a day, awhole day’s output might beaffected and have to be remedied.The result is unnecessary coststhat can be avoided by integratinga continuous measurementprocedure.
When conducting a referencemeasurement, the system isdisassembled after the test run, ifpossible, and the individualcomponents analyzed using theflushing method.
Example:
As-supplied condition: 17 / 15 / 12 according to ISO 4406:1999
1. Warning point: 18 / 16 / 13 for 3 successive measurements
2. Stop signal: When exceeding 18 / 16 / 13 limit cleanliness classin 2 successive measurements.
E7.604.1/05.09

27
ContaminationMonitoring
The reliability of hydraulic systemscan be impacted heavily byparticulate contamination duringthe running-in phase. The risk ofoutages during the first minutes orhours of operation is particularlyhigh as the foreign particlesintroduced or created during theassembly process are still relativelylarge and can thus cause suddenoutages. During continuedoperation, these large particles areground into smaller ones, the resultbeing that damage can be causedto the surfaces of systemcomponents during this crushingprocess. The consequences areleakage, degraded output andefficiency, or a shortening of thecomponent’s service life.
In many cases, microfiltering isused to quickly clean the systemfluid during commissioning.However, in the automotive sectorthis is not possible in systemsintegrated in cars (exceptions:transmissions and motors).
This is where contaminationmonitoring is key in themanufacture and assembly ofthese systems. By implementingcontamination management amajor portion of particulatecontamination introduced duringmanufacture and assembly can beremoved. The result is cost savingsby virtue of smaller performancedeviations on test stands causedby the sudden clogging of particlesin sensitive system componentsplus lower costs associated withwarranty and non-warrantycourtesy work. For moreinformation, refer to section 9.
Below follows a description of thegoal, design and performance of aprocess audit.
Contamination monitoring extendsto checking the cleanliness statusof all manufacturing and assemblyprocesses considered relevant inthis connection. (cf. analysismethods, described in section 4)Proper preparation and informingall those involved are key incontamination monitoring.
5
E7.604.1/05.09

28
5.1Planning and Design
First, the objective of contaminationmonitoring is specified, e.g.
Determining the current situation
Checking fluctuations betweenbatches
Checking washing processes
Comparing the target with the actualsituation
Determining the sampling point
During the planning and designphase, the sampling points forcomponents and taking liquidsamples are determined using aproduction plan or operation sheet.The employees to be involved incontamination monitoring areinformed of the objectives andprocedures.
NOTE:Manufacturing has to continue inthe same manner, meaning that noadditional cleanliness levels, etc.are to be integrated. The purpose ofcontamination monitoring is not tocheck the quality produced by theemployees but rather determiningthe causes and sources ofcontamination.
The following schematic is anexcerpt of a manufacturing line:
Fig. 22
The schematic above shows themanufacturing processes and thecorresponding sampling points.However, in actuality sampling ismore comprehensive, i.e. thedescription includes the number ofthe Minimess fittings at whichsampling is done, for example.
5.2How Sampling is Done
A representative sampling is takenof the fluids and components; thesamples are stored so as toprevent any further contamination.Special sampling bottles are usedfor the fluid samples; thecomponents are stored in definedclean packaging.
The analysis is performed inaccordance with the methodsspecified in sections 3 and 4 andthe findings recorded.
5.3Inspectionof the Manufacturingand Assembly Line
Properly trained or experiencedindividuals while inspecting themanufacturing and assembly linecan detect some sources ofcontamination. That is why such aninspection is conducted during theaudit. The findings made duringinspection are then compared withthe results in hand.
E7.604.1/05.09

29
5.4Results
The contamination monitoringresults describe the condition atthe time at when sampling is done.The findings might look like this:
Fig. 23
Micro-photographAnalysis membrane
Particulate contamination of acomponent prior to storage
This chart shows an excerpt of thehousing manufacturing process.The component samples are takenupstream and downstream of thewashing station. The findings showthat the washing station performswell and that it is well positionedhere. Subsequent storage is notbeing done properly as the portionof particulate contamination isalmost double.
Fig. 24 Fig. 25
Micro-photographAnalysis membrane
Particulate contamination of acomponent after being in storagefor 2 weeks
E7.604.1/05.09

31
Drafting a CleanlinessSpecification
By applying a cleanlinessspecification to components andthe system it can be ensured thatas-supplied quality is constant.
The following should be borne inmind when drafting a cleanlinessspecification:
State of the art
Benchmarking —what do others do?
Inclusion of previous experience— if available —
Defining and implementingcontamination management as an“official project”
Inclusion of all hierarchy levels
Accurate documentation of how thespecification was developed
Developing clear-cut definitions
Next, it has to be determined whichcomponents in the system are themost sensitive. Frequently it is notpossible to achieve the same levelof cleanliness throughout thesystem during assembly.
If suitable filtration takes placeupstream of the sensitivecomponents, an area of low-contamination-sensitivecomponents can be definedupstream of this filtration and anarea of highly contamination-sensitive components downstreamof the filter.
These individual components orsystem areas should be subdividedinto sensitivity areas.
A maximum particulatecontamination value is specified foreach of these cleanlinesscategories.
A car motor illustrates thissubdivision below:
In addition, the fluid cleanlinessratings of the individual system andprocess fluids are defined.
Category
A
B
C
Designation
low particle-sensitivity
particle-sensitive
high particle sensitivity
Category
A
B
C
Motor area
AirCoolant water circuit
Low-pressure oil circuit
Diesel direct injectionHigh-pressure oil circuit
Description
For the most part low-pressure systems withlarge gap tolerances
Low-pressure systems withsmall gap tolerances
High-pressure systemswith small gap tolerancesand with exacting demandsmade of safety and securitysystems
6
E7.604.1/05.09

32
6.1EstablishingCleanliness Specifications
The following parameters aredefined in the cleanlinessspecifications for the components:
1. Goal of the cleanlinessspecification
2. Applicability(system designation)
3. Extent of inspectionand testing; inspectionand testing cycles
4. Sampling
5. Analysis method
6. Evaluation method
7. Accuracy
8. Analysis fluids to be used
9. Documentation
10. Limit values
This specification has to be madefor each individual system;consequently a few things arediscussed which have to be bornein mind.
Work instructions concerningsampling, analysis and evaluationmethods should be described indetail so as to ensure that samplingis always done in a uniformmanner. In addition, the analysisresults depend on the analysis fluidand method, particularly when itcomes to component analysis.Documentation should be doneusing forms so that all the resultsare readily accessible. Example ofa form for entering findings:
E7.604.1/05.09

33
Example of a CleanlinessSpecification
1. Goal of thecleanliness specificationThe goal in implementing thiscleanliness specification is toachieve a constant level ofcleanliness for system X.
2. Applicability(system designation)This specification applies to systemX including its series A, B, and C. Itextends to all components whethersourced or manufactured in house.It also specifies the system fluids ofsystem X with regard to theircleanliness.
3. Extent of inspection andtesting; inspection and testingcycles5 samples/month of eachcomponent are to be taken andanalyzed. If the supplier partsachieve a constant cleanlinessvalue after 6 months, the samplingcycle can be extended to samplingevery 2 or 3 months. An analysis ofthe entire (assembled) system is tobe done at least once a week priorto delivery. Checking of the fluidcleanliness should optimally bedone on a continuous basis.
4. SamplingSampling of components is to bedone at goods receiving. Samplingof components is to berepresentative; samples are to bepacked in a dust-tight manner andsent in to the laboratory. The fluidsamples are to be taken at thesampling points indicated in theinspection and testing plan, or aninstrument to be connecteddirectly.
5. Analysis methodThe flushing method is to be usedfor component analysis. Thesurfaces of the component areflushed in a defined cleanenvironment using x ml of the testfluid (XY) — which possesses acleanliness of xx — under apressure of z bars as specified bythe inspection and testing plan.The flushed-off particulatecontamination is collected on ananalysis membrane and subjectedto gravimetric analysis.
Representative samples are takenof the system fluids at the specifiedsampling points. All testingparameters are specified, i.e. theduration of testing, what is tested,the pressures, speeds. Whenconducting static inspection andtesting, e.g. pressure testing inpipeline and hoses, make sure thata flushing effect is present so thatthe cleanliness of thesecomponents can be determined,i.e. the static pressure test has tobe followed by a dynamic flushingprocess in order to analyze theactual quantity of particles which isflushed out of the component.
6. Evaluation methodIn the component analyses theanalysis membrane is dried until itachieves a constant weight, andthen cooled in a defined dryenvironment and weighed. Thisprocedure is repeated subsequentto filtration. The weight differentialindicates the “gravimetriccontamination” of the component.This is followed by visuallyexamining the analysis membranesthrough a microscope andmeasuring the longest particles.
Evaluation of the fluid samples isdone in accordance with ISO 4405,ISO 4407, ISO 4406:1999 orNAS 1638.
7. AccuracyThe analysis equipment has to bebrought to a residual dirt content of0.2 mg prior to conducting theanalysis so that the measurementstaken of the component samplesare sufficiently accurate. This isdetermined by performing anegative control, i.e. flushing theequipment without testing. Whenthe result of the analysis dropsbelow 0.5 mg, the batch size is tobe increased and thus a meanvalue of the results computed.
8. Analysis fluids to be usedThe following analysis fluid shouldbe used for the componentanalyses: ABC-XX, with acleanliness class of 14 / 12 / 9and no particles > 40 µm.
E7.604.1/05.09
34
The following cleanlinessspecifications apply to each ofthese classes (fictitious example).
The transmission components aresubdivided into the individualcategories below:
Group A: crankcase sump
Group B: intermediate housing,transmission housing,coupling flange
Group C: valve plate,valve housing,centering plate
Fluid samples:
At the end of the test run,the transmission fluid may not fallshort a cleanliness rating of17 / 15 / 13 (c) according toISO 4406:1999. The system isto be operated using acleanliness rating of 18 / 16 / 14 (c)according to ISO 4406:1999.
11. Procedure to be followed inthe event that the specificationis not adhered toThe supplier components are to bereturned to the supplier in the eventthat the specification is not adheredto. If this procedure results inproduction delays, the componentswill be cleaned and analyzed by usat the supplier’s expense.
Particle sizes
Max. 4 particles > 500 µmMax. size: 400 µmNo fiber bundles
Max. 4 particles > 400 µmMax. size: 800 µmFibers up to 4 mm
Max. 4 particles > 200 µmMax. size: 1,000 µmFibers up to 2 mm
Gravimetry
20 mg / component
10 mg / component
5 mg / component
Category
A
B
C
Description
For the most part low-pressuresystems with large gap tolerances
Low-pressure systems with small gaptolerances
High-pressure systems with small gaptolerances and exacting demands
Designation
low particle-sensitivity
particle-sensitive
high particlesensitivity
Category
A
B
C
9. DocumentationThe documentation of the resultsis to done using a result sheet(cf. sample).
10. Limit valuesThe components are subdividedinto 3 cleanliness classes:
E7.604.1/05.09

Sources ofContamination inthe Manufacturingand Assembly ofHydraulic Systems
Particulate contamination can entera power fluid system in variousways. The main sources ofingression are shown in thefollowing diagram:
Fig. 26
Some of these sources ofcontamination can be eliminated ina simple, cost-effective manner.
The following applies inContamination Management:
What isn’t allowed to enter thesystem doesn’t have to beremoved.
wear special, lint-free clothing.The assembly equipment has to beproperly cleaned so as to preventthe ingress of dirt here, too.
Raising the Awareness ofEmployees
In order to achieve the objective of“defined cleanliness of componentsand systems” it is important thatemployees at all levels be involvedin this process. Frequently, aconsiderable savings potential iscontained in the employees’ wealthof ideas and experience —particularly those working atassembly lines and in fabrication.Experience has shown that whenemployees are able to identify withthe objective being striven for, theyare more able to help inimplementing it quickly andeffectively.
Environment — Air Cleanliness
In some cases it will be necessaryto set up a clean room for the finalassembly of very contamination-sensitive systems, e.g. fuelsystems, brakes shock absorbers,etc. This has to be decided on acase-by-case basis. However, inmany cases performing themeasures described here suffices.
7.1Preventing the Ingressionof Contamination in theManufacturing andAssembly of HydraulicSystems
The ingression of contamination inthe manufacturing and assembly ofhydraulic systems can beeliminated in a cost-effectivemanner in various process steps.
Storage and Logistics
When storing and transporting thecomponents and systems care hasto be exercised to make sure thatthey are properly sealed shut orwell packed. Transportation andstorage packing has to be inkeeping with the cleanliness statusof the individual components.
Assembly of Systems andSubassemblies
The assembly of these systems isto be done in accordance withsystem requirements. This meansthat the assembly and mechanicalfabrication areas have to beseparated if necessary in order toprevent the ingress ofcontamination. The assemblystations have to be kept clean to adefined cleanliness and thoseworking in these areas have to
7
35
E7.604.1/05.09

36
7.2Removal of ParticulateContamination fromHydraulic Systems(Practical Experience)and Components
Generally speaking, particulatecontamination is removed from ahydraulic system via filtration.Various types of filters are useddepending on the amount and typeof contamination.
Belt filter systems or bag filters areused when large quantities ofcontaminants are involved (e.g.washing machines, machine tools).These filters have the job ofremoving the major portion ofcontaminants (often in kg) from thesystem. These filter types are alsoused for prefiltration purposes.
In most cases, these coarse filtersdo their job of “removing a lot of dirtfrom the system” very well.However, microfiltering also has tobe done if a constant defined highlevel of cleanliness of the systemfluid is to be ensured.
Whereas microfiltration ensuresquality, the job of coarse filtrationis to control the quantity ofcontamination.
7.2.1Cleaning System
Individual components are freed ofclinging contamination in cleaningsystems (particles, remainder ofmachining or corrosion protectionfluids, etc.). Cleaning can be doneby employing various mechanicalmethods (e.g. spraying, flooding,ultrasonic methods) using variouscleaning fluids (aqueous solutionsor organic solvents). Thetemperature and duration ofcleaning also have a decisive effecton the cleaning effect. Thesefactors have to be carefullymatched and optimally tuned inorder for a favorable cleaning effectto be achieved in an economicalamount of time.
Fig. 27
Various studies of washingprocesses have shown that someof these for the most part cost-intensive processes aren’t worthyof the name. Some people refer towashing processes as “particledistribution processes”. This“property” was detected inexaminations of componentssampled upstream anddownstream of a washing process.
E7.604.1/05.09
37
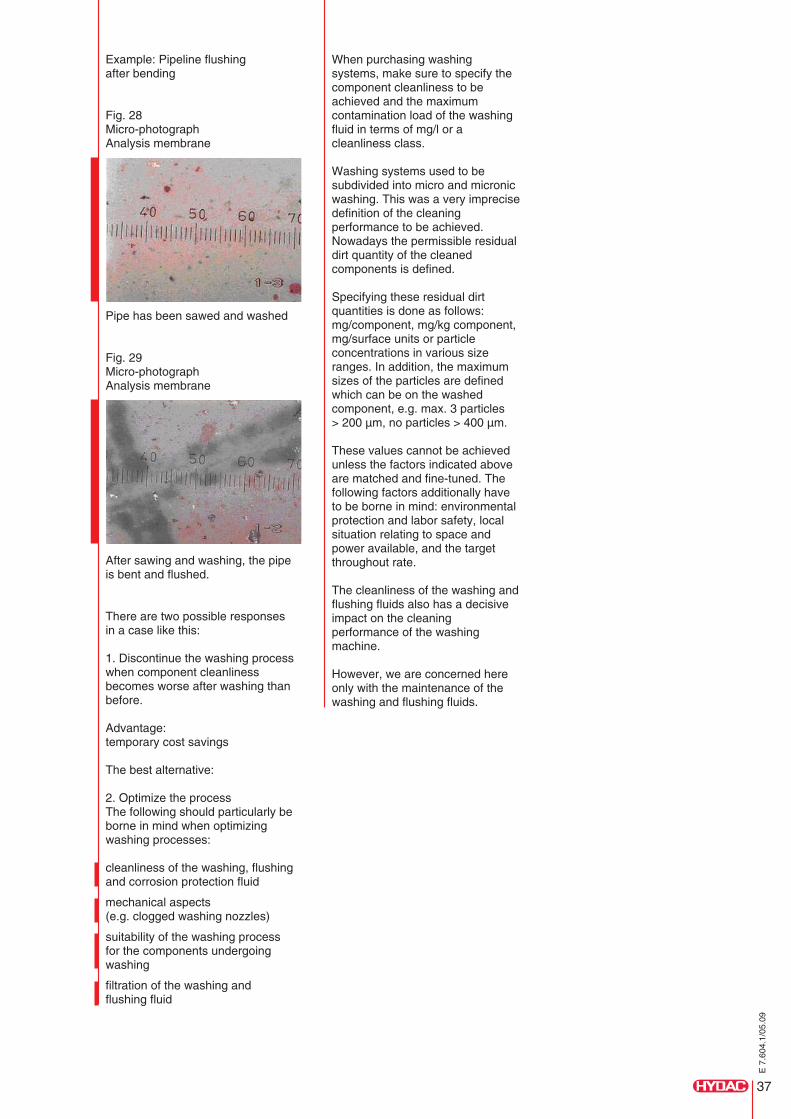
Example: Pipeline flushingafter bending
Fig. 28Micro-photographAnalysis membrane
When purchasing washingsystems, make sure to specify thecomponent cleanliness to beachieved and the maximumcontamination load of the washingfluid in terms of mg/l or acleanliness class.
Washing systems used to besubdivided into micro and micronicwashing. This was a very imprecisedefinition of the cleaningperformance to be achieved.Nowadays the permissible residualdirt quantity of the cleanedcomponents is defined.
Specifying these residual dirtquantities is done as follows:mg/component, mg/kg component,mg/surface units or particleconcentrations in various sizeranges. In addition, the maximumsizes of the particles are definedwhich can be on the washedcomponent, e.g. max. 3 particles> 200 µm, no particles > 400 µm.
These values cannot be achievedunless the factors indicated aboveare matched and fine-tuned. Thefollowing factors additionally haveto be borne in mind: environmentalprotection and labor safety, localsituation relating to space andpower available, and the targetthroughout rate.
The cleanliness of the washing andflushing fluids also has a decisiveimpact on the cleaningperformance of the washingmachine.
However, we are concerned hereonly with the maintenance of thewashing and flushing fluids.
Pipe has been sawed and washed
Fig. 29Micro-photographAnalysis membrane
After sawing and washing, the pipeis bent and flushed.
There are two possible responsesin a case like this:
1. Discontinue the washing processwhen component cleanlinessbecomes worse after washing thanbefore.
Advantage:temporary cost savings
The best alternative:
2. Optimize the processThe following should particularly beborne in mind when optimizingwashing processes:
cleanliness of the washing, flushingand corrosion protection fluid
mechanical aspects(e.g. clogged washing nozzles)
suitability of the washing processfor the components undergoingwashing
filtration of the washing andflushing fluid
E7.604.1/05.09

38
The following methods are used instandard maintenance:
The type and composition of thecleaning medium is to be taken intoaccount in selecting the fluidmaintenance options indicatedabove. When using ultrafiltration,it has to be borne in mind thatseparating out the cleaningsubstances cannot be avoided incertain cases. In addition,ultrafiltration can only be used forprecleaned washing media sincethe performance of the separatingmembranes is degraded when theyare loaded with particulatecontamination.
Using Filtration as FluidMaintenance for Separating outParticulate Contamination
Bag and backflush filters in variousmicrofilter ratings are the standardequipment used in themaintenance of the fluid of washingsystems. Although these filters aresuitable for removing largequantities of contamination from asystem, they are not suitable inmost cases for maintaining definedcleanliness classes. Owing to theirdesign, they do not offer muchresistance; i.e. the counterpressurebuilt up across the filter is very low,below 1 bar for the most part. Thatis why this filter type is frequentlyused in the main (full) flow whenfeeding cleaning fluid into thewashing or flushing chamber. Thefilter housings are equipped withpressure gauges for monitoring theproper functioning of the filter.
Bag filters pose the risk thatoverloading can cause the bag tobe destroyed and largecontaminant quantities released.
That is why it is advisable toadditionally define minimumchange intervals and to regularlymonitor the cleanliness of thewashing fluid in addition to thestandard parameters like pH valueor microbial count.
Residual dirt values of cleanedcomponents are increasingly beingdefined and specified as anacceptance criterion for thecleaning system. It is of paramountimportance that constantadherence be maintained to thesevalues. It is also imperative that thequality of the cleaning fluid bemaintained at a constant, highlevel.
This can be achieved by thetargeted use of microfiltersfeaturing a constant, absoluteseparation rate. For the most part,tube filters or disk filters are used.The advantage offered by thesefilter types as compared tostandard hydraulic filter elements istheir high contaminant retentionrate owing to their depth effect.
Thanks to the high contaminantseparation rate offered by thesefilter types, they remove a highamount of contamination from thewashing fluid; this causing thefilters to become quickly exhaustedand blocked.A sufficiently long service lifecoupled with high washing fluidcleanliness can be achieved bycombining filters for removing themain portion of contaminants fromthe system with absolutemicrofilters.
A typical example is describedbelow.
At a leading automotive supplier,the camshafts were to be cleanedto a defined cleanliness of9 mg/component. Point of departure:
Challenge:
Clogging of the tank
Quality no longer sufficientafter 2-3 days
Fluctuation in the contaminationcontent of the componentsupstream of the line: 30 – 50 mg
Cleaning costs per component notto be any higher than € 0.008
Cleaning costs could not beallowed to increase, althoughquality still had to be improved
Technical specifications of the washingmachine present on site:
Tank volume: 80 l
Pump delivery rate: 250 l/min (centrifugal pump)
Washing agent: Ardox 6478 – chemetall
Concentration: 2.3 – 3 %
Bath temperature: ca. 50 °C
Filtration: Backflush filter downstreamof pump, 50 µm filter rating
Process data:
Bath change frequency: 1 time/week
Throughput: 3,000 – 4,000components/day
Wash cycle: 15 s/component
Cleaning method
Filtration
Belt-type filter
Bag/backflush filter
Micronic filter(tube/disk filters)
Ultrafiltration
Distillation
Separator
Oil separator
Coalescer
Solid contamination
X
X
X
X
X
X
Liquid, non-dissolvedcontamination (emulsion)
X
X (for high boilingpoint differences)
X (density difference)
X
X
Liquid, dissolvedcontamination (emulsion)
X
E7.604.1/05.09

39
Goal of optimizing the cleaningline:
Achieve a residual contaminantvalue of a maximumof 9 mg/camshaft
Cleanliness of washing fluidof < 30 mg/liter
Extend the service life of washingfluid, i.e. save costs associatedwith changing the fluid
Prevent clogging of the tank,e.g. save cleaning time
For process reliability reasons, alow-maintenance cleaning systemwas to result which enabled thecamshafts to be cleaned to aresidual contaminant content of9 mg/component, this to be donecost-effectively.
Result of Optimization
The service life of the cleaning fluidwas extended from 1 week to8 weeks. There was no moreclogging of the tank. Changing thebath fluid was done on account ofthe increased chloride content, noton account of contamination.
The residual contaminant valuesof max. 9 mg/camshaft and max.30 mg/liter of bath fluid (whenusing a 5-µm membrane foranalysis) were achieved andmaintained at this level.
The service life of the economicalbag filters is 2 weeks. The servicelife of the HYDAC Dimicron®absolute filter is 8 weeks.
Economic Efficiency Analysis
Off-line filtration
Filtration costs
Extension of the servicelife of the bath
Lower reworking costs
Down time of thewashing machine forcleaning
Investment€
5,000.00
Recurring costs€
7,500.00
Savings/year€
10,000.00
These costs can’t bequoted.
These costs can’t bequoted.
By optimizing the fluid maintenanceof this washing line, animprovement in quality wasachieved at no added cost andwithout comprising processreliability; i.e. the washing costsremained at € 0.008/camshaft,as was specified at the beginningof the project.
This example shows that prior toany such optimization or in newfacilities the cleanliness of thecomponents upstream of thesystem, throughput, technicaldetails, targets have to be knownand defined, for only in this waycan the success of such anendeavor be ensured.
E7.604.1/05.09

40
7.2.2Function Testing
Most systems come into contactwith the hydraulic fluid during initialsystem filling or function testing.This process affords themanufacturer a substantialopportunity to decisively impact thefinal cleanliness of the entiresystem. By employing suitablefiltration of the filling and test fluids,system cleanliness can be quicklyoptimized upon delivery orcommissioning.
The cleanliness of the final productcan be controlled via functiontesting in the same way as by awashing machine.
Some companies have thefollowing motto:
“The test stand is our last washingmachine.”
This statement might be true,however it is an expensiveapproach in practice. Yet whenperforming process reliabilitymeasures for supplying systemswith a defined cleanliness, this isthe first approach.
The following schematic illustratesthe basic setup of most test stands.
Fig. 31
On a function test stand not onlyfunction testing is performed butthe components and systems arerun in as well. A frequent sideeffect of this is the flushing effect ofthe system undergoing testing.By employing targeted fluidmaintenance and cleanlinessmonitoring, this flushing effect canbe used to ensure that systemspossess a defined, constantcleanliness status upon delivery.
Cleanliness monitoring providesinformation on the process stabilityof the upstream fabrication andcleaning steps. Frequently,continuous monitoring of test fluidcleanliness results in thecleanliness of the entire system assupplied being documented.This approach is used in mobilehydraulics, turbines or papermachinery upon delivery or duringcommissioning in order todemonstrate to the final customerthat his system is being suppliedwith the specified cleanliness.
E7.604.1/05.09

41
1. Example:
The following study illustrates thecleaning process of a pump duringcommissioning*:
The cleanliness of the test fluidupstream of the test item ismaintained at a cleanliness ratingof 16 / 14 / 11 (c). After 5 minutesof testing the pump speed is brieflyincreased to the maximum speed.The test run is concluded after10 minutes.
In this case, the dirt content of thetest item amounted to 1 mg/kgcomponent weight upon theconclusion of the test run.
* Section 4, Analysis of theCleanliness of Systems on theFlushing/Test Stand.
Fig. 33Example: Valve test stand with5-µm filtration
Fig. 34Cleanliness class achieved by thetest fluid: NAS 3
Fig. 32
As the schematic above shows, theparticle concentration continuouslydrops during the first 4 minutes ofthe test run. The particleconcentration jumps when thepumps are turned up to full speedafter 5 minutes. The next 5 minutesare again used for cleaning thesystem.
Cf. also section 4.5 Performing aCleanliness Check on a FlushingStand. The flushing/test standdescribed there served as a testobject for determining the optimalflushing time in the function testingof pumps.
Now the following can be asked:“How clean are the valves thatleave this test stand?”
The flushing procedure can bemonitored by occasionallydisassembling the valves in adefined clean environment andevaluating the dirt content of theindividual components.
E7.604.1/05.09

42
7.3Storage, Logisticsand Ambient Conditions
Unfortunately, improper componentstorage is not uncommon. Sealsand gaskets which arrive at theassembly line clean and packed inbags are unpacked and filled intocontainers which are dirty for themost part as this involves less workand effort.In most cases, these factors arenot taken into consideration andsubstantial savings potential thatcould be easily utilized throughimproved packaging and storage isoverlooked.
7.4Supplier Partsand ComponentsManufactured In-house
Suitable cleanliness specificationsfor internally produced and sourcedparts enable the ingress ofcontamination into systems to beminimized right from the beginning.
E7.604.1/05.09

43
Commissioning Flushing
This method is most frequentlychosen for large systems in orderto minimize wear duringcommissioning.
The filtration of the flushing standhas to be designed so that duringsubsequent analysis thecontaminants flushed out of thesystem undergoing testing areremoved and other measurementsaren’t skewed. As an alternative,cleanliness can be measured andrecorded upstream anddownstream of the test item duringthe entire measurement sequence.
In the example below, the specifiedsampling point was located directlydownstream of the pump and anonline particle counter connected.
Examination of the HydraulicSystem of a Mobile Crane
Fig. 35
When a system’s characteristiccurve/behavior is known,cleanliness testing can beperformed at the end of functiontesting and, thus, systemcleanliness described subsequentto commissioning. This methodenables process control to beimplemented quickly and reliablyduring series testing/commissioning.The cleaning curve plotted overtime is an indication of the ingressof contaminants during assembly.
The crane jib was extended after6, 8 and 10 minutes. The graphclearly shows that every time anew area was brought on linecontaminant sediments wereflushed out.
8
E7.604.1/05.09
45
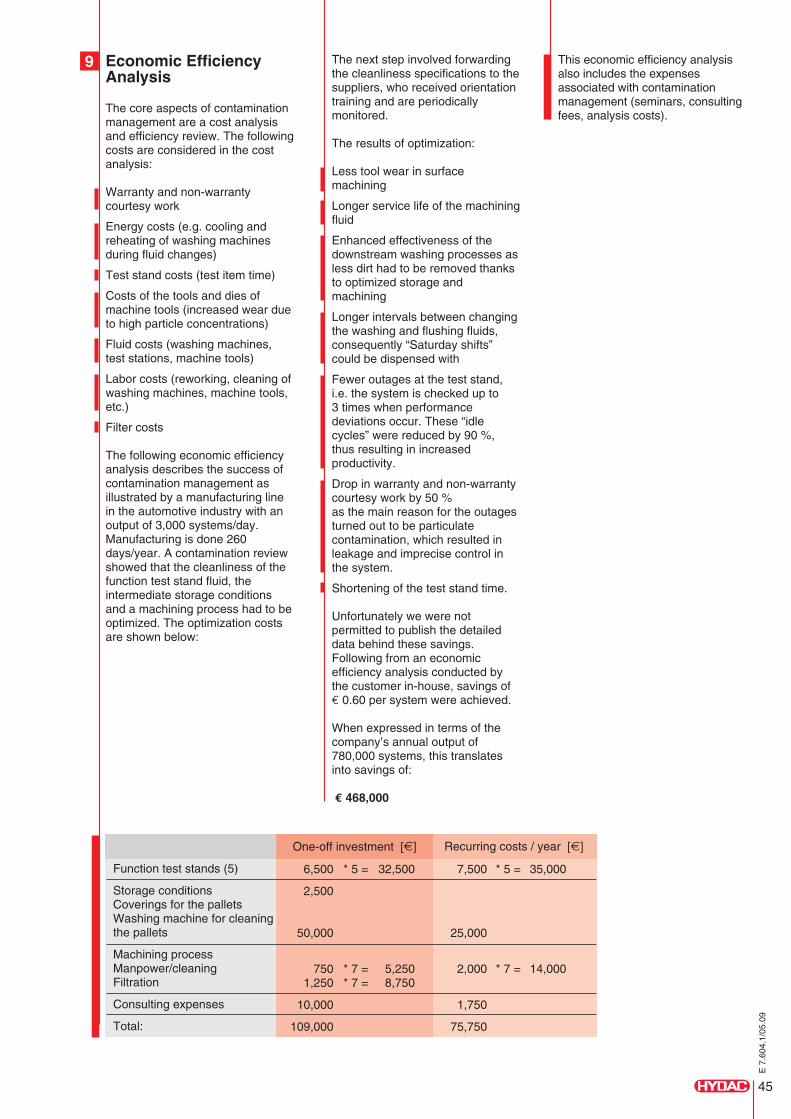
Economic EfficiencyAnalysis
The core aspects of contaminationmanagement are a cost analysisand efficiency review. The followingcosts are considered in the costanalysis:
Warranty and non-warrantycourtesy work
Energy costs (e.g. cooling andreheating of washing machinesduring fluid changes)
Test stand costs (test item time)
Costs of the tools and dies ofmachine tools (increased wear dueto high particle concentrations)
Fluid costs (washing machines,test stations, machine tools)
Labor costs (reworking, cleaning ofwashing machines, machine tools,etc.)
Filter costs
The following economic efficiencyanalysis describes the success ofcontamination management asillustrated by a manufacturing linein the automotive industry with anoutput of 3,000 systems/day.Manufacturing is done 260days/year. A contamination reviewshowed that the cleanliness of thefunction test stand fluid, theintermediate storage conditionsand a machining process had to beoptimized. The optimization costsare shown below:
The next step involved forwardingthe cleanliness specifications to thesuppliers, who received orientationtraining and are periodicallymonitored.
The results of optimization:
Less tool wear in surfacemachining
Longer service life of the machiningfluid
Enhanced effectiveness of thedownstream washing processes asless dirt had to be removed thanksto optimized storage andmachining
Longer intervals between changingthe washing and flushing fluids,consequently “Saturday shifts”could be dispensed with
Fewer outages at the test stand,i.e. the system is checked up to3 times when performancedeviations occur. These “idlecycles” were reduced by 90 %,thus resulting in increasedproductivity.
Drop in warranty and non-warrantycourtesy work by 50 %as the main reason for the outagesturned out to be particulatecontamination, which resulted inleakage and imprecise control inthe system.
Shortening of the test stand time.
Unfortunately we were notpermitted to publish the detaileddata behind these savings.Following from an economicefficiency analysis conducted bythe customer in-house, savings of€ 0.60 per system were achieved.
When expressed in terms of thecompany’s annual output of780,000 systems, this translatesinto savings of:
€ 468,000
This economic efficiency analysisalso includes the expensesassociated with contaminationmanagement (seminars, consultingfees, analysis costs).
Function test stands (5)
Storage conditionsCoverings for the palletsWashing machine for cleaningthe pallets
Machining processManpower/cleaningFiltration
Consulting expenses
Total:
One-off investment [€]
6,500
2,500
50,000
7501,250
10,000
109,000
7,500
25,000
2,000
1,750
75,750
32,500
5,2508,750
35,000
14,000
* 5 =
* 7 =* 7 =
* 5 =
* 7 =
Recurring costs / year [€]
9
E7.604.1/05.09

47
ContaminationManagement in Practice
In the sections above we discussedthe impacts of particulatecontamination on the service lifeand reliability of hydraulic systems,how the cleanliness of fluids oncomponents can be specified, andhow contamination monitoring isperformed.
Deploying contaminationmanagement results in thefollowing tasks for all participants inthe production process:
Suppliers:
Ensuring the defined as-suppliedcondition of products.
Selecting the packaging of productsto be supplied so that no additionalcontamination occurs duringtransportation and storage.
System vendorsand manufacturers:
Careful transportation, handling,storage and unpacking of products.
Keep products clean after they areunpacked or after seals/plugs havebeen removed.
Assemble/install the components ina suitably clean environment.
The following example shows howthese individual parts can becombined in contaminationmanagement.
Description ofthe Point of Departure:
System X has been successfullymanufactured and marketed foryears. During the past few years,System X has been developedfurther and a new generation,System Y, created. Y featuresimproved performance properties,is more compact than X, andoperates at higher systempressures than X. The result is thatSystem Y is somewhat moresensitive to particulate contamination.
This is reflected in increasedperformance deviations duringfunction testing. This deviation nolonger occurs when Y is passedthrough the test stand a second orthird time.
An investigation of the matter hasshown that this unwanted behavioris the result of coarse particulatecontamination.
The goal of contaminationmanagement is now to improve thedegree of cleanliness so that thisundesirable behavior no longeroccurs on the test stand and theassociated costs of warranty andnon-warranty courtesy work arereduced.
Step 1: Analysis of the Test Fluid
The cleanliness of the test fluid isdetermined. The analyses showthat the test fluid cleanlinessupstream of the test item amountsto a cleanliness rating of 22 / 20 /18 according to ISO 4406, thelargest metallic particles are 400µm in size, and the largest fibersmeasure 3,000 µm.
Step 2: Optimizing the FunctionTest Stand
By additionally integrating bypassmicrofiltration, which maintains testfluid cleanliness at 15 / 13 / 10,95 % of the performance deviationscan be prevented.
This also results in a drop inwarranty and non-warrantycourtesy work.
Step 3: Lowering the Filter Costsat the Test Stands
By performing a contaminationmonitoring audit, it might bedetermined a large amount ofparticulate contamination is beingtransported into the system by themanufacturing processes andsourced components. Thisparticulate contamination has to beremoved from the system at thefunction test stand, which functionshere as the last washing operation.This results in costs that couldotherwise be avoided.
A concept is developed in whichthe washing and machiningprocesses and intermediatestorage are optimized.A cleanliness specification alongwith a test plan for system fluids isdrafted. This specification isforwarded to external as well asinternal suppliers and thecomponents supplied with adefined, constant cleanliness.
Step 4: Integrating ParticleCounting in Quality Assurance
A particle sensor is integrated inthe function test stand for thepurpose of continuous qualitycontrol of the as-supplied quality ofSystem Y. A limit is defined for themaximum contamination of the testfluid in the return line. Intervention
can be done immediately if thisvalue is exceeded, thus ensuringthat no contaminated systemsleave the factory.
Random sampling is done to checkthe supplier quality and non-conformant components returnedto suppliers or washed in-house atthe supplier’s expense.
Step 5: Economic EfficiencyAnalysis
Contamination managementstarted off with analyzing the costsassociated with warranty and non-warranty courtesy work as theresult of increased malfunction atthe test stands.
These costs are reanalyzed afteroptimization and compared.
The savings achieved throughoptimization are briefly described inEconomic Efficiency Analysis.
The cost savings in that caseamounted to ca. € 468,000/year.This optimization process lastedca. 2 years.
Step 6: Documentationand New Projects
The contamination managementfindings are collected in a databaseand used in the development ofnew systems.
The defined maximum residual dirtcontent becomes standard in newsystems in the same way thatdimensions, surface grades andtolerances have been. Thisresidual dirt content is primarily inreference to the specification thatapplies to System Y.
The specification is adapted inkeeping with the experience gainedwith the prototypes. Cleanlinessand cleaning costs are primarilydetermined by the design of newsystems.
10
E7.604.1/05.09

49
Reference List
(1) H. Werries, “Einfluss vonFremdpartikeln in Wälzlagern undMaßnahmen zu ihrer Vermeidung”,University of Hanover, 1992
(2) R.W. Park, Moog Australia PtyLtd., “Contamination Control – aHydraulic OEM Perspective“,Monash University, Australia, 1997
(3) Fluid Power University of Bath,GB “Total Cleanliness Control inHydraulic Systems”
(4) ISO 4405:1991 Hydraulic fluidpower – Fluid contamination –Determination of particulatecontamination by the gravimetricmethod
(5) ISO 4406:1999 Hydraulic fluidpower – Fluids – Code for definingthe level of contamination of solidparticles
(6) ISO 4406:1987 Hydraulic fluidpower – Fluids – Methods forcoding level of contamination bysolid particles
(7) CETOP – RP 94 H –Determination of solid particulatesin hydraulic fluids using anautomatic particle counteremploying the light extinctionprinciple.
(8) ISO 4407:1991 Hydraulic fluidpower – Fluid contamination –Determination of particulatecontamination by the countingmethod using a microscope
(9) ISO 11171:1999 Hydraulic fluidpower — Calibration of liquidautomatic particle counters
(10) ISO 4402:1991 Hydraulic fluidpower — Calibration of automaticcount instruments for particlessuspended in liquids – Methodusing classified AC Fine Test Dustcontaminant.
(11) NAS 1638: Cleanlinessrequirements of parts used inhydraulic systems
(12) Acdelco – Steering, USA,“Remanufacturing Process –Cleanliness”, www.acdelco.com,2001
(13) Hydac, "Filters – Power FluidTechnology, New Test Dust, NewCalibration, New Filter TestingMethods — How This ImpactsEveryday Work", 1999
Authors
HYDAC Filtertechnik,Andreas Busch, Dipl.-Ing. (FH)
Elke Fischer, Dipl.-Ing.eficon, Bensheim
(14) University of Würzburg,Fluid Mechanics lecture
(15) Nancy Carosso, NASA – USA,Contamination Engineering Design,www.de.ksc.nasa.gov/dedev/labs/cml_lab/CONTMON_DESIGN.html#1.1
E7.604.1/05.09