Practical 5 Basic GIS geoprocessing - Helminths 5 Basic GIS geoprocessing Modern Tools for NTDs...
13
www.thiswormyworld.org Practical 5 Basic GIS geoprocessing
Transcript of Practical 5 Basic GIS geoprocessing - Helminths 5 Basic GIS geoprocessing Modern Tools for NTDs...

www.thiswormyworld.org
Practical 5
Basic GIS geoprocessing

Modern Tools for NTDs Control Programmes July 2017
www.thiswormyworld.org | 2
Aim of practical
This fifth practical aims to familiarize you with useful basic queries and techniques
in QGIS to extract information based on attribute data and using map insets.
Key learning skills
In this practical, you will learn to:
• Geoprocessing tools applicable to vector layers for extracting data using the
intersection function.
• Conduct basic queries.
• Use map composer to include a map inset to show the extent of the study
area.
This work is licensed under a Creative Commons Attribution-NonCommercial-NoDerivs 3.0 Unported
License. This means that users are free to copy and share this material with others. Requests for
creating new derivatives should be sent to Jorge Cano Ortega ([email protected]).
Modern Tools for NTDs Control Programmes July 2017
www.thiswormyworld.org | 3
Practical 5
1. Selecting data by using queries
Selecting data through queries in QGIS is a useful and quick approach for selecting
features in a vector layer. In previous sessions, you learned how to carry out this
basic operation by using a cursor to click on the desired feature.
Here, you will learn how to select data by querying its attribute values.
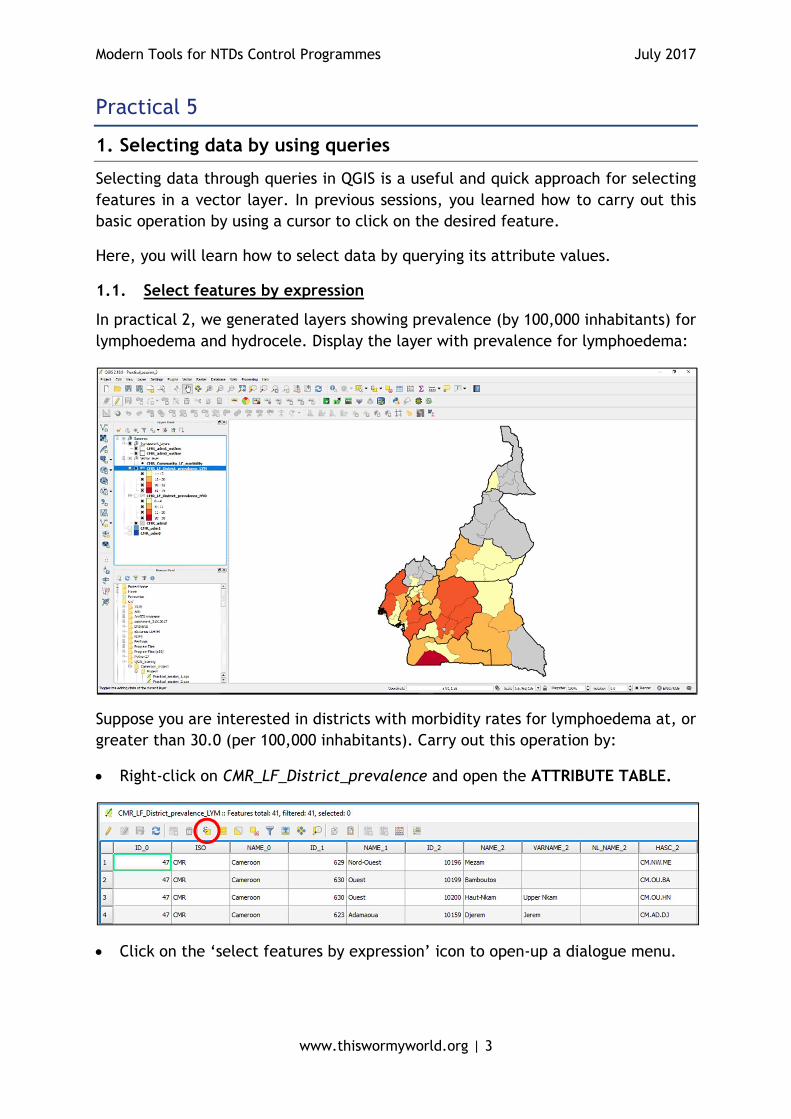
1.1. Select features by expression
In practical 2, we generated layers showing prevalence (by 100,000 inhabitants) for
lymphoedema and hydrocele. Display the layer with prevalence for lymphoedema:
Suppose you are interested in districts with morbidity rates for lymphoedema at, or
greater than 30.0 (per 100,000 inhabitants). Carry out this operation by:
• Right-click on CMR_LF_District_prevalence and open the ATTRIBUTE TABLE.
• Click on the ‘select features by expression’ icon to open-up a dialogue menu.
Modern Tools for NTDs Control Programmes July 2017
www.thiswormyworld.org | 4
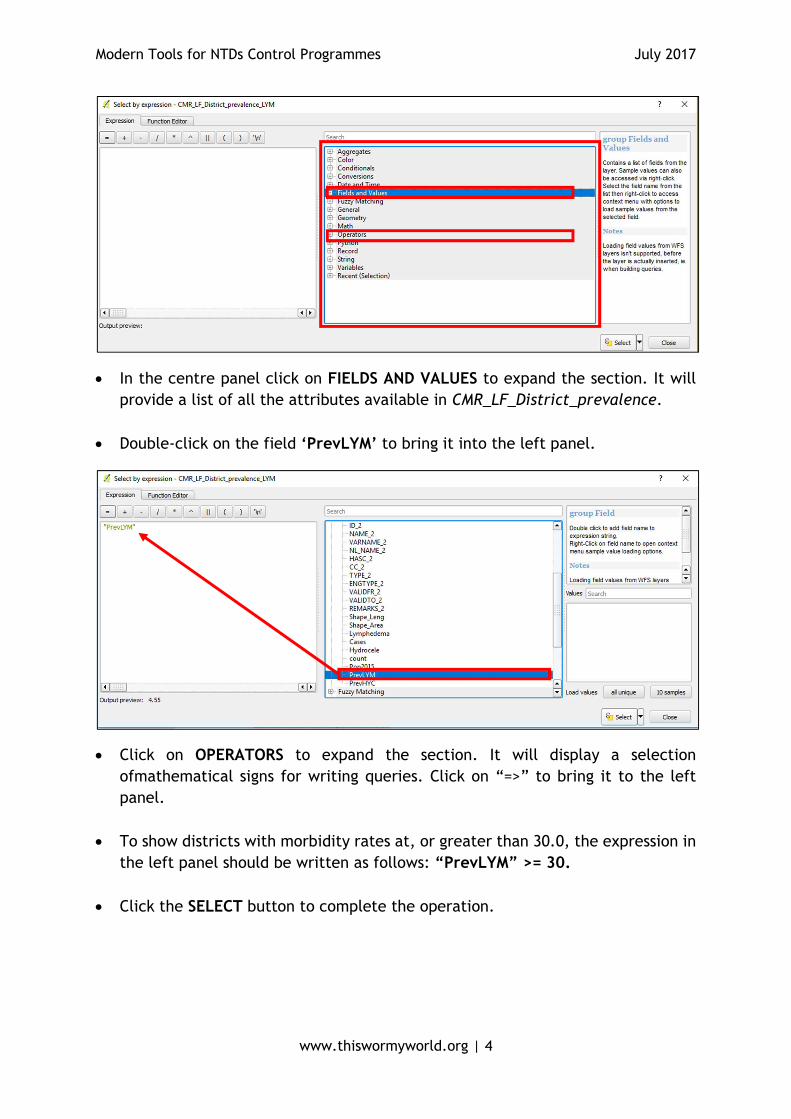
• In the centre panel click on FIELDS AND VALUES to expand the section. It will
provide a list of all the attributes available in CMR_LF_District_prevalence.
• Double-click on the field ‘PrevLYM’ to bring it into the left panel.
• Click on OPERATORS to expand the section. It will display a selection
ofmathematical signs for writing queries. Click on “=>” to bring it to the left
panel.
• To show districts with morbidity rates at, or greater than 30.0, the expression in
the left panel should be written as follows: “PrevLYM” >= 30.
• Click the SELECT button to complete the operation.

Modern Tools for NTDs Control Programmes July 2017
www.thiswormyworld.org | 5
Districts with prevalence rates of lymphoedema at, or greater than 30.0 have been
selected – 12 districts have been highlighted in yellow. You can also view the
selected features in the attributed tables, these records will typically be highlighted
in blue.
Save as CMR_HighPrevLYM.shp – we will use this layer for geoprocessing in the next
section.
Type the number ‘30’
beside the expression

Modern Tools for NTDs Control Programmes July 2017
www.thiswormyworld.org | 6
Note: Try using compounded queries to make more complex expressions in selecting
certain features. The image on the right shows adjacent regions (i.e. Sud-Ouest, Sud
and Littoral) that have boundaries faced towards the Gulf of Guinea.
The expression for this is:
"NAME_1" = 'Littoral' OR "NAME_1" = 'Sud' OR "NAME_1" = 'Sud-Ouest'
You can experiment with different conditions.
2. Geoprocessing tools applicable to Vector layers
Geoprocessing functions can be accessed from the QGIS toolbar by clicking on the
following tabs: VECTOR � GEOPROCESSING TOOLS. We will cover how to use
intersection tool for extracting features.
Layer needed for this section:
� CMR_Community_LF_morbidity.shp
� CMR_adm1.shp
� CMR_water_lines.shp
� CMR_HighPrevLYM.shp

Modern Tools for NTDs Control Programmes July 2017
www.thiswormyworld.org | 7
2.1. Intersect
Intersection is a useful function for extracting data. To extract sites that are located
within (or intersects with) districts that have morbidity rates of lymphoedema above
30.0:
• Go to the VECTOR � GEOPROCESSING TOOLS and select Intersection. When
prompted, select a layer as an INPUT and INTERSECT. In ‘Input layer’ add the
layer of interest (CMR_Community_LF_morbidity).
• In ‘Intersect layer’ add the intersecting layer (CMR_HighPrevLYM). Name the new
layer as “CMR_LF_Sites_Intersect_Districts”. Click the RUN button.

Modern Tools for NTDs Control Programmes July 2017
www.thiswormyworld.org | 8
Repeat the same process and extract the water lines and areas for the districts.
Name the output as “CMR_WaterLines_Intersect_District.shp”.
Your new output should look like:

Modern Tools for NTDs Control Programmes July 2017
www.thiswormyworld.org | 9
2.2. Inset map frame
An inset map (or insets) is a smaller map, which is featured on the same page as the
parent map. Insets are typically displayed at a much higher scale showing a broader
view of the study area. This feature is very useful as readers are able to perceive
the size and extent of the area under study.
The image in the bottom-right corner is an example of an inset. It provides an overall
view of Africa and marks out the location for Liberia and Ghana allowing the reader
to perceive the whereabouts of these countries in Africa.
Use the map composer to create a map inset. Make sure the following layers are
active to produce the MAIN MAP:
� CMR_HighPrevLYM
� CMR_LF_sites_Intersect_Districts
� CMR_WaterLines_Intersect_Districts
� CMR_adm2 (display as grey background)
� CMR_adm1 (display as transparent with black outline)

Modern Tools for NTDs Control Programmes July 2017
www.thiswormyworld.org | 10
Open map composer by clicking: Project � New Print Composer, and give it any
name you wish. We are going to add an inset at the bottom-right corner - create the
map in map composer as the MAIN MAP (refer to Practical 3).

Modern Tools for NTDs Control Programmes July 2017
www.thiswormyworld.org | 11
You can change the layout of map canvas from landscape to portrait.
• Click on ‘Map 0’ in the item section to make it active.
• Click on the Composition tab, and select ‘Portrait’, in the drop-down menu under
the ‘Orientation’.
• Remember to LOCK everything.
Steps for adding a map inset to bottom-right corner:
• Create a duplicate from CMR_HighPrevLYM by right-clicking on it and selecting
‘duplicate’. This should add ‘CMR_HighPrevLYM copy’
• Rename this layer as CMR_MapInset_only, and change the fill colour to black.
• Only have the following layers displayed in the window:
� CMR_MapInset_only
� CMR_adm1 (transparent background, and black outline)
� CMR_adm2 (grey background, and black outline)
• Go back to the map composer and add a new map in the bottom-right corner by
clicking on and expand the cursor to make the map visible. Inset will be
appear as ‘Map 1’.

Modern Tools for NTDs Control Programmes July 2017
www.thiswormyworld.org | 12
To make the study region in the main map reflected in the map inset:
• In the Item Properties for ‘Map 1’, click on Overviews to expand the menu.
• Click on the plus ‘+’ sign, this will add ‘Overview 1’. Under Map frame, select
‘Map 0’ to link the main map to the inset
map at the bottom.
• A red boarder will appear within the
insert inset frame.
• Lock the ‘Map 1’ to complete your map,
and export your map as an image.
The final output should look like:

Modern Tools for NTDs Control Programmes July 2017
www.thiswormyworld.org | 13