PPI Benefit Solutions NONPROFIT Employee Benefit … · 2009 NONPROFIT EMPLOYEE BENEFIT SURVEY Page...
23
PPI Benefit Solutions 2009 NONPROFIT Employee Benefit Survey
Transcript of PPI Benefit Solutions NONPROFIT Employee Benefit … · 2009 NONPROFIT EMPLOYEE BENEFIT SURVEY Page...
PPI Benefit Solutions
2009 NONPROFIT Employee Benefit Survey
2009 NONPROFIT EMPLOYEE BENEFIT SURVEY Page 1
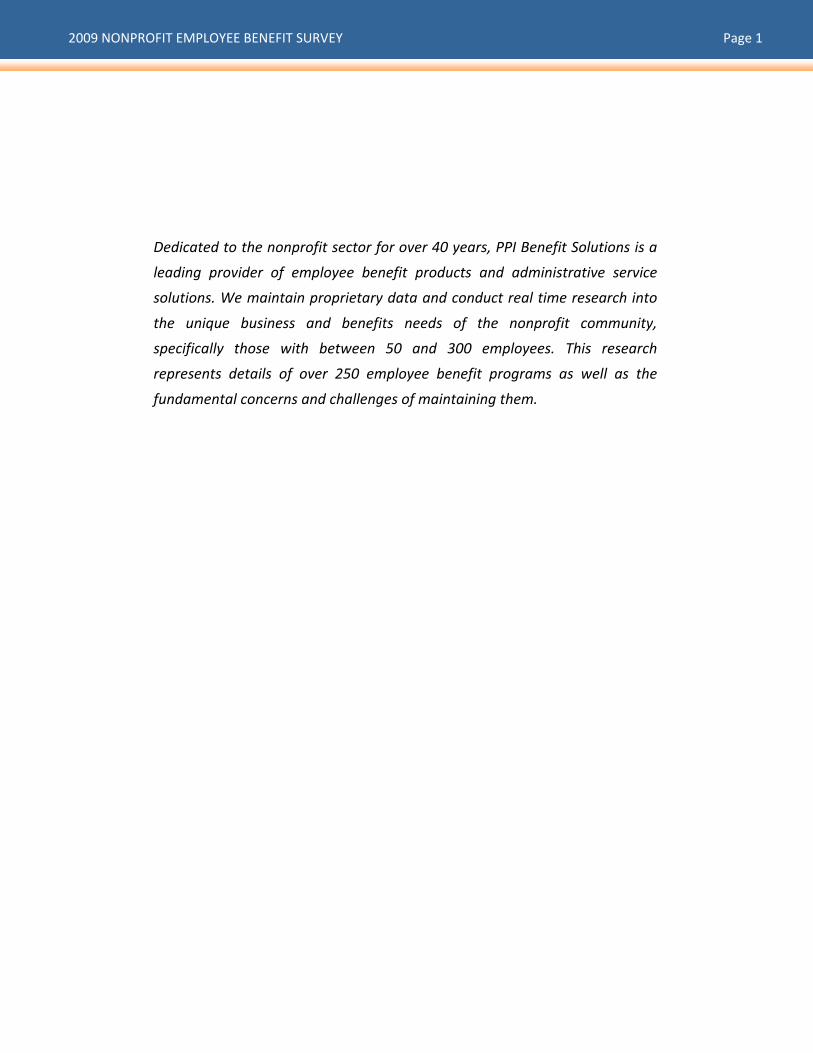
Dedicated to the nonprofit sector for over 40 years, PPI Benefit Solutions is a
leading provider of employee benefit products and administrative service
solutions. We maintain proprietary data and conduct real time research into
the unique business and benefits needs of the nonprofit community,
specifically those with between 50 and 300 employees. This research
represents details of over 250 employee benefit programs as well as the
fundamental concerns and challenges of maintaining them.
2009 NONPROFIT EMPLOYEE BENEFIT SURVEY Page 2
Table of Contents Page
Executive Summary .......................................................................................... 3 The Results ..................................................................................................4‐19
• Section I: Current Benefits ....................................................................................... 4 • Section II: Plan Services............................................................................................. 9 • Section III: Nonprofit Benefit Challenges .................................................................14 • Section IV: Benefit Plan Details ................................................................................16
Conclusion ...................................................................................................... 20 Methodology & Demographics ...................................................................... 21
2009 NONPROFIT EMPLOYEE BENEFIT SURVEY Page 3
Executive Summary Now in our second year of collecting employee benefit program data from the nonprofit sector, PPI Benefit
Solutions is pleased to present results from the 2009 Nonprofit Employee Benefit Survey. Throughout the
survey and where the data are comparable, we’ve pointed to interesting differences and similarities from
last year’s results. In 2009, we also broadened the survey to cover average contributions, voluntary benefit
plans, employee communications, and wellness programs. Lastly, in 2008, the survey included only PPI
clients; this year’s survey includes both clients and non‐clients.
A few noteworthy findings: • The number of employers with a contributory dental plan dropped from 97% in 2008 to 89% in 2009.
The number of employers with employer‐paid life and disability plans remained constant at around 94%
and 75% respectively.
• 31% of nonprofits make an employee‐paid cancer benefit available to employees, making it the most
common voluntary product offered.
• Most nonprofits (71%) do not offer benefits to retirees.
• Nonprofits ranked HSA/HRA administration and employee self‐serve as the two least important
services. The two most important services are compliance services and COBRA administration.
• Only 13% of employers include year‐round communications in their benefit communication strategy.
• To save costs, most nonprofits in the survey (39%) make plan design changes.
2009 NONPROFIT EMPLOYEE BENEFIT SURVEY Page 4
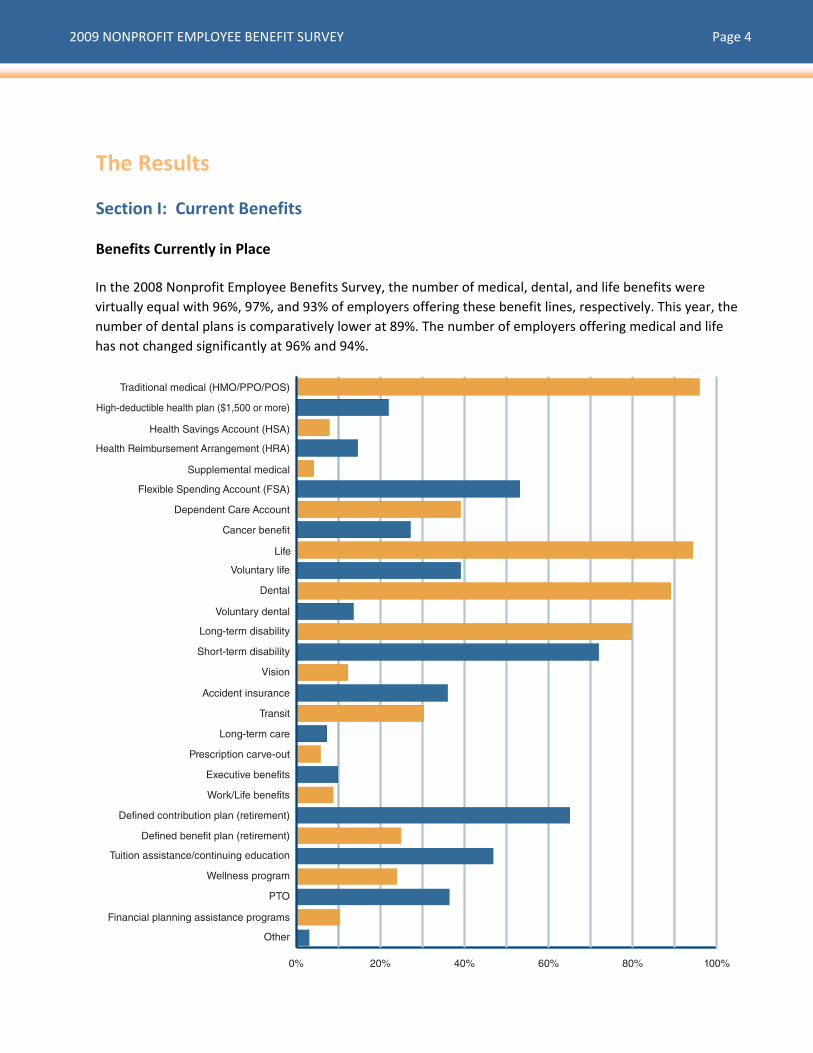
The Results Section I: Current Benefits Benefits Currently in Place In the 2008 Nonprofit Employee Benefits Survey, the number of medical, dental, and life benefits were virtually equal with 96%, 97%, and 93% of employers offering these benefit lines, respectively. This year, the number of dental plans is comparatively lower at 89%. The number of employers offering medical and life has not changed significantly at 96% and 94%.
0% 20% 40% 60% 80% 100%
Other
Financial planning assistance programs
PTO
Wellness program
Tuition assistance/continuing education
Defined benefit plan (retirement)
Defined contribution plan (retirement)
Work/Life benefits
Executive benefits
Prescription carve-out
Long-term care
Transit
Accident insurance
Vision
Short-term disability
Long-term disability
Voluntary dental
Dental
Voluntary life
Life
Cancer benefit
Dependent Care Account
Flexible Spending Account (FSA)
Supplemental medical
Health Reimbursement Arrangement (HRA)
Health Savings Account (HSA)
High-deductible health plan ($1,500 or more)
Traditional medical (HMO/PPO/POS)
2009 NONPROFIT EMPLOYEE BENEFIT SURVEY Page 5
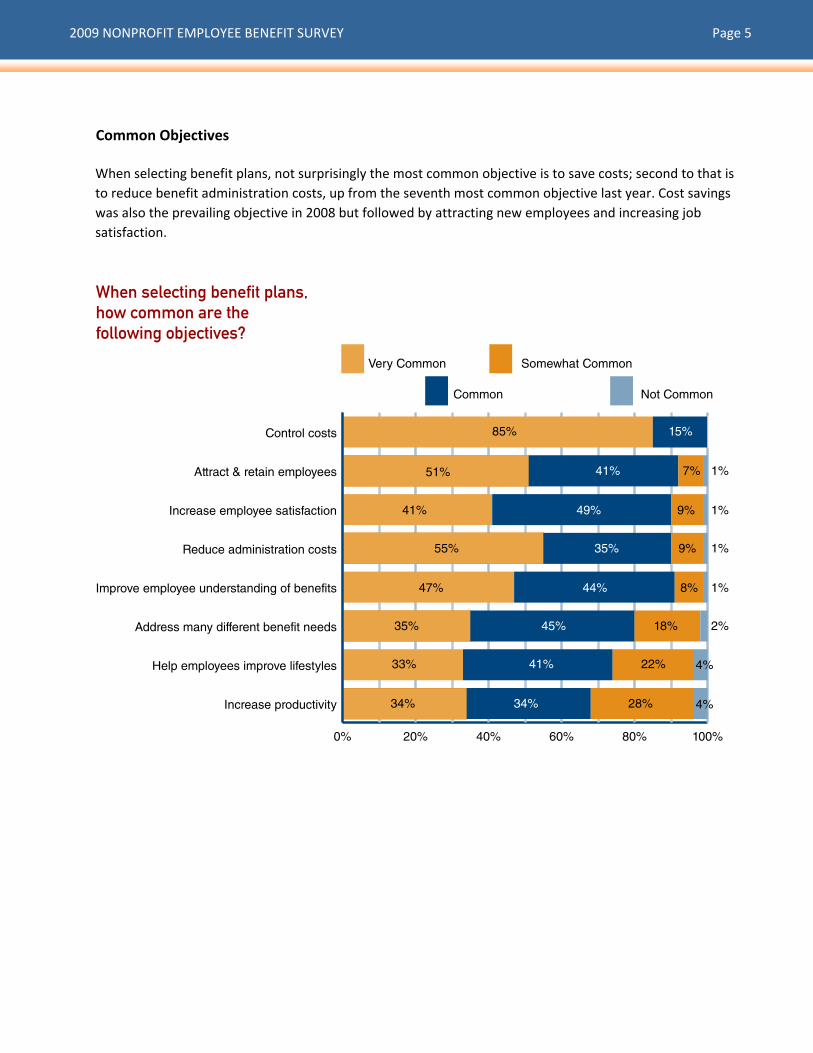
Common Objectives When selecting benefit plans, not surprisingly the most common objective is to save costs; second to that is to reduce benefit administration costs, up from the seventh most common objective last year. Cost savings was also the prevailing objective in 2008 but followed by attracting new employees and increasing job satisfaction. When selecting benefit plans, how common are the following objectives?
0% 20% 40% 60% 80% 100%
Not Common
Somewhat Common
Common
Very Common
Increase productivity
Help employees improve lifestyles
Address many different benefit needs
Improve employee understanding of benefits
Reduce administration costs
Increase employee satisfaction
Attract & retain employees
Control costs 85%
51%
41%
55%
47%
35%
34%
33%
41%
49%
35%
44%
45%
41%
34%
7%
9%
9%
8%
18%
22%
28%
1%
1%
1%
1%
4%
4%
2%
15%
2009 NONPROFIT EMPLOYEE BENEFIT SURVEY Page 6
0% 10% 20% 30% 40% 50% 60% 70% 80% 90% 100%
Both employer-paid and voluntary products
Employee-paid (voluntary)
Employer-paid base plan w/ buy-up option
Cost-shared by employer & employee
Paid in full by employer
Financial planning programs
Tuition reiumbursement/College assistance
Cancer benefit
Accident insurance
Wellness programs
Transit benefits
Executive benefits
Prescription carve-out
Vision
Long-term care
Short-term disability
Long-term disability
Life
Dental
Health ReimbursementArrangement
Health Savings Account
High-deductible medical($1,500 or more)
Traditional medical(HMO/PPO/POS) 14% 75.5% 6%
1%
3%
3%
8%
24%
79%
64%
46%
5%
14%
6%
16%
1.5%
17%
25%
11%
20%
21%
31%
5%
4%
1%
.5%
.5%
18%
5%
10%
23%
3%
4%
10% 16%
5%
7%
2%
5%
10%
1.5%
1.5%
52% 12%3%
6% 5%
15%2%
1%
1%
1.5%
.5%
.5%.5%
2%
.5%
4%.5%
7%.5%
1.5%
.5%
1.5%
1%
.5%
1%
1%
.5%
.5%
.5%
1%
3%
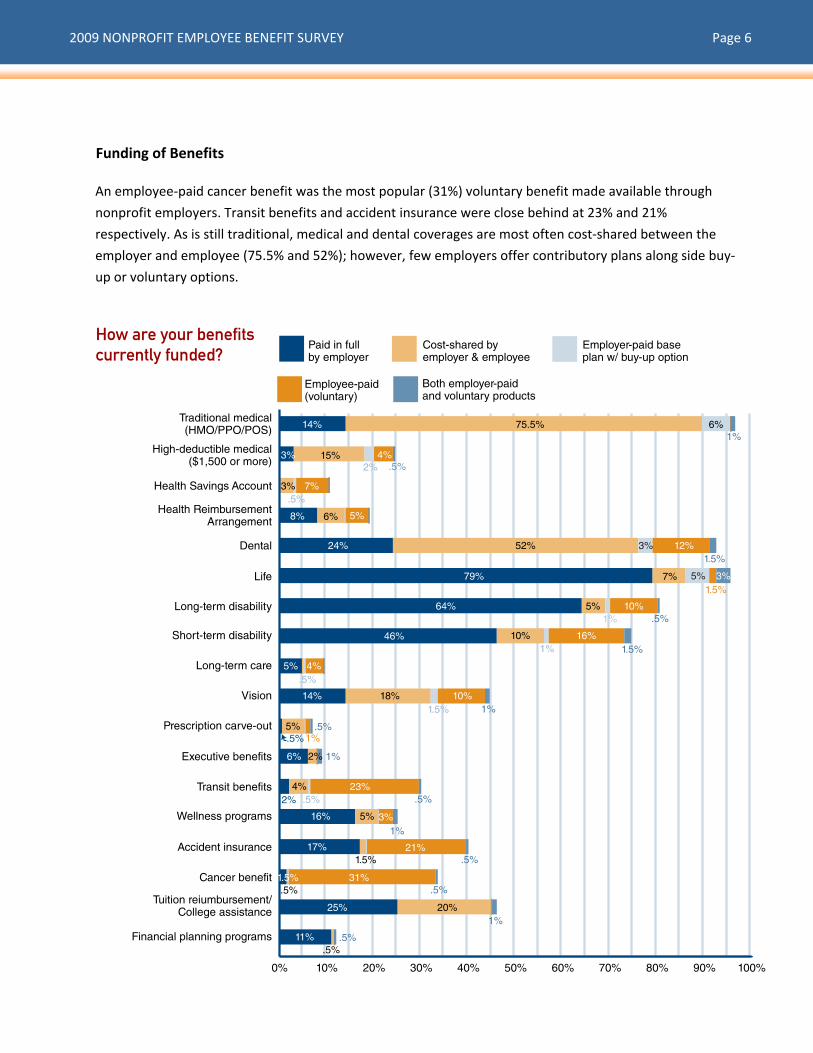
Funding of Benefits An employee‐paid cancer benefit was the most popular (31%) voluntary benefit made available through
nonprofit employers. Transit benefits and accident insurance were close behind at 23% and 21%
respectively. As is still traditional, medical and dental coverages are most often cost‐shared between the
employer and employee (75.5% and 52%); however, few employers offer contributory plans along side buy‐
up or voluntary options.
How are your benefits currently funded?
2009 NONPROFIT EMPLOYEE BENEFIT SURVEY Page 7
0% 10% 20% 30% 40% 50%
< 20 hpw
20 hpw
21 hpw
24 hpw
25 hpw
28 hpw
30 hpw
32 hpw
35 hpw
37.5 hpw
40 hours per week (hpw)
No70.5%
Yes29.5%
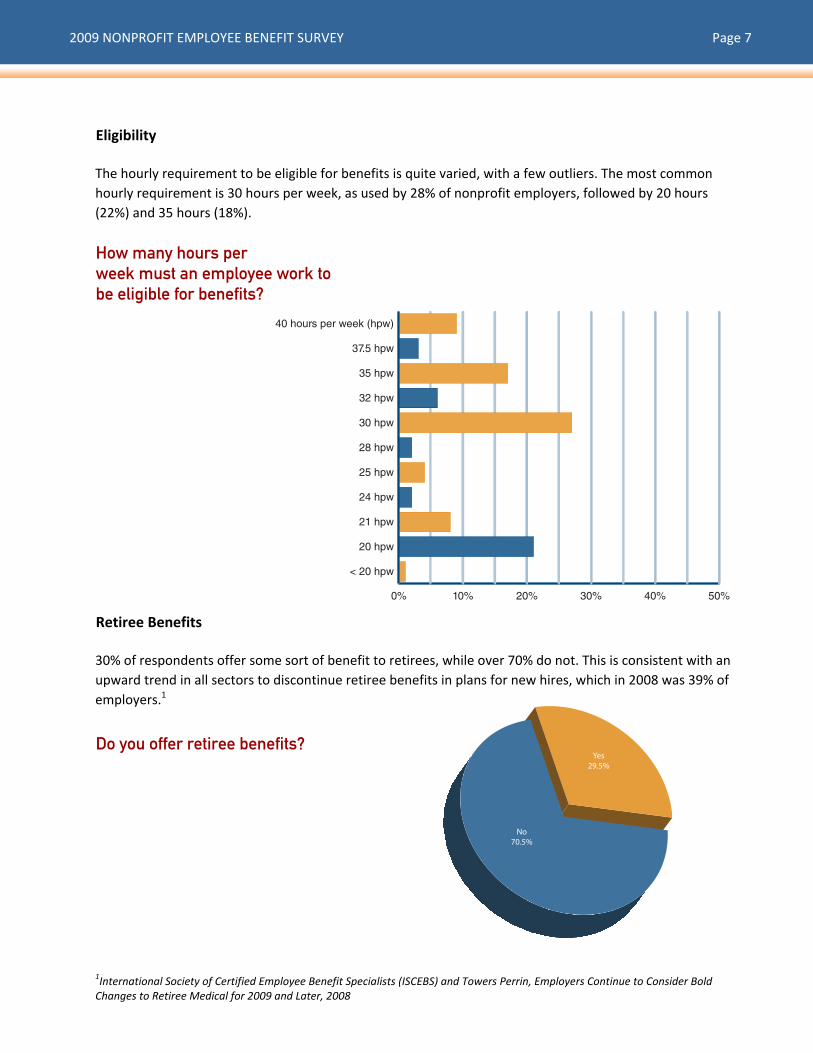
Eligibility The hourly requirement to be eligible for benefits is quite varied, with a few outliers. The most common hourly requirement is 30 hours per week, as used by 28% of nonprofit employers, followed by 20 hours (22%) and 35 hours (18%). How many hours per week must an employee work to be eligible for benefits?
Retiree Benefits 30% of respondents offer some sort of benefit to retirees, while over 70% do not. This is consistent with an upward trend in all sectors to discontinue retiree benefits in plans for new hires, which in 2008 was 39% of employers.1
Do you offer retiree benefits?
1International Society of Certified Employee Benefit Specialists (ISCEBS) and Towers Perrin, Employers Continue to Consider Bold Changes to Retiree Medical for 2009 and Later, 2008
2009 NONPROFIT EMPLOYEE BENEFIT SURVEY Page 8
Dissatisfied1.5%
Neither8%
Very Satisfied32.5%
Satisfied58%
0% 10% 20% 30% 40% 50% 60% 70% 80% 90% 100%
Not at all knowledgeable
Don't know
Very knowledgeable
Somewhat knowledgeable
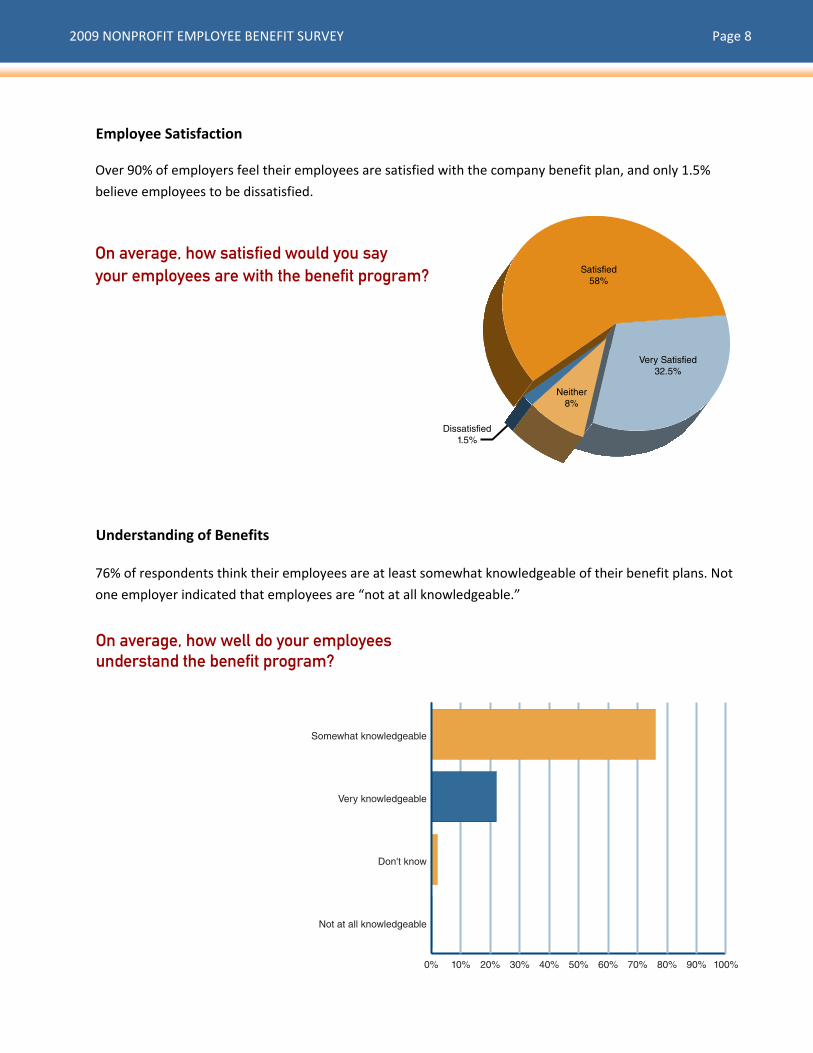
Employee Satisfaction Over 90% of employers feel their employees are satisfied with the company benefit plan, and only 1.5%
believe employees to be dissatisfied.
On average, how satisfied would you say your employees are with the benefit program?
Understanding of Benefits 76% of respondents think their employees are at least somewhat knowledgeable of their benefit plans. Not
one employer indicated that employees are “not at all knowledgeable.”
On average, how well do your employees understand the benefit program?
2009 NONPROFIT EMPLOYEE BENEFIT SURVEY Page 9
0.00 43.75 87.50 131.25 175.00
Least ImportantImportantMost Important
Year-round employee self-service
Employee self-servicefor open enrollment
Payroll/Benefits system integration
Flexible Spending Accountadministration
HSA/HRA administration
HR consulting services
Compliance services
COBRA administration
Combined billing of insurancecoverages and carriers
Consolidated administrationof benefits
32% 60% 14%
25% 52% 23%
48% 38% 14%
52% 39% 10%
15% 43% 42%
12% 27% 60%
23% 39% 37%
24% 48% 28%
17% 35% 48%
22% 40% 38%
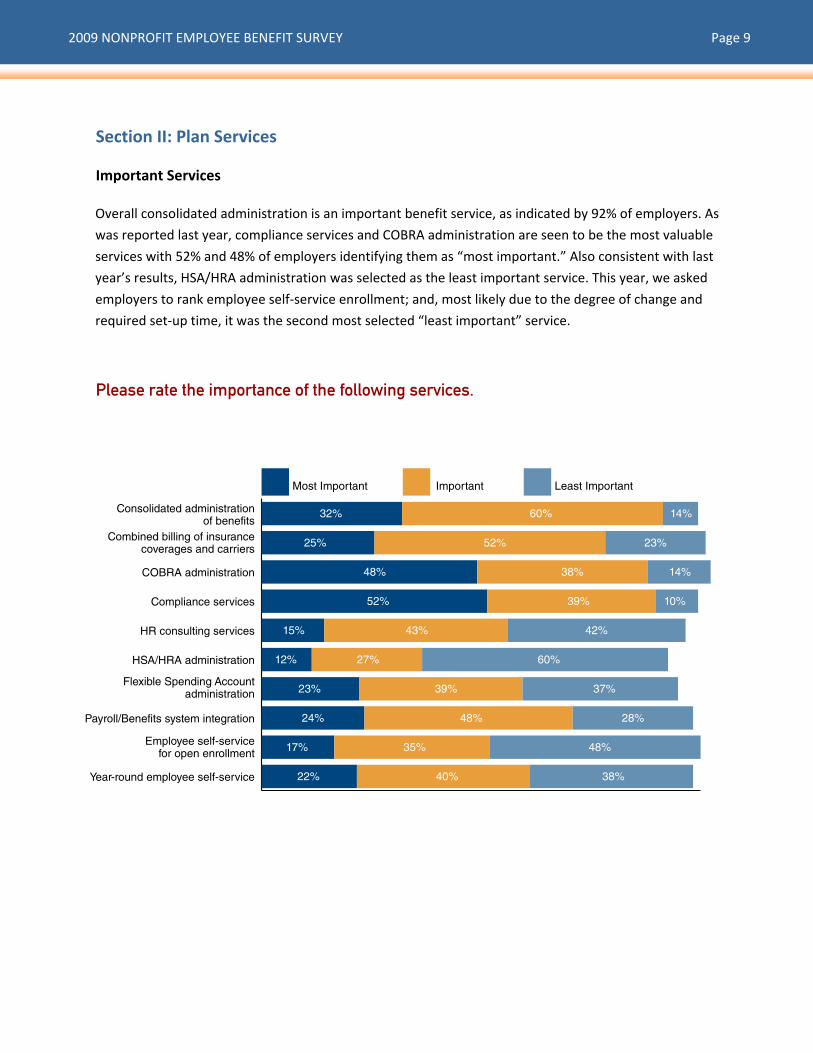
Section II: Plan Services Important Services Overall consolidated administration is an important benefit service, as indicated by 92% of employers. As
was reported last year, compliance services and COBRA administration are seen to be the most valuable
services with 52% and 48% of employers identifying them as “most important.” Also consistent with last
year’s results, HSA/HRA administration was selected as the least important service. This year, we asked
employers to rank employee self‐service enrollment; and, most likely due to the degree of change and
required set‐up time, it was the second most selected “least important” service.
Please rate the importance of the following services.
2009 NONPROFIT EMPLOYEE BENEFIT SURVEY Page 10
Never10%
Payroll/Benefits currently integrated
13%
Definitely18%
Maybe59%
0% 20% 40% 60% 80% 100%
Don't know
Not at all confident
Somewhat confindent
Confident
Very confident
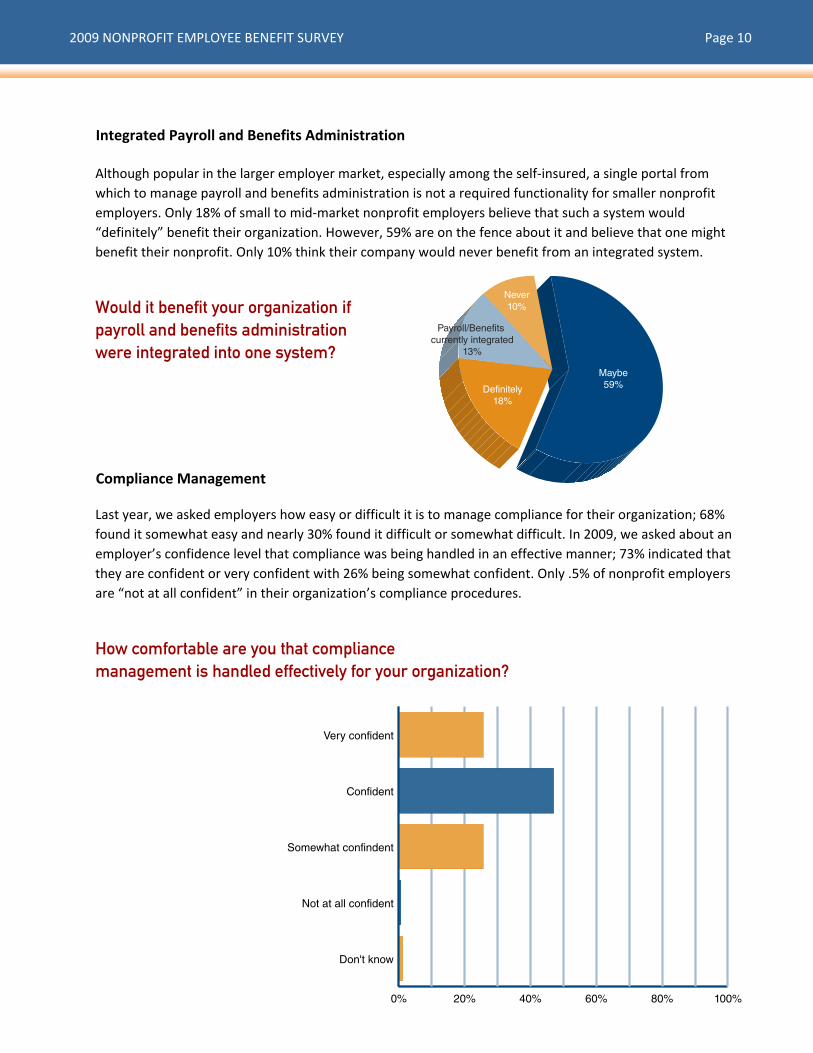
Integrated Payroll and Benefits Administration Although popular in the larger employer market, especially among the self‐insured, a single portal from which to manage payroll and benefits administration is not a required functionality for smaller nonprofit employers. Only 18% of small to mid‐market nonprofit employers believe that such a system would “definitely” benefit their organization. However, 59% are on the fence about it and believe that one might benefit their nonprofit. Only 10% think their company would never benefit from an integrated system.
Would it benefit your organization if payroll and benefits administration were integrated into one system?
Compliance Management Last year, we asked employers how easy or difficult it is to manage compliance for their organization; 68% found it somewhat easy and nearly 30% found it difficult or somewhat difficult. In 2009, we asked about an employer’s confidence level that compliance was being handled in an effective manner; 73% indicated that they are confident or very confident with 26% being somewhat confident. Only .5% of nonprofit employers are “not at all confident” in their organization’s compliance procedures.
How comfortable are you that compliance management is handled effectively for your organization?
2009 NONPROFIT EMPLOYEE BENEFIT SURVEY Page 11
0% 10% 20% 30% 40% 50%
Other
Employee benefits portal
Benefits fair
Newsletter
Wellness campaigns
Intranet
Payroll stuffers
Office posters
Year-round communications
As-needed, onsite educational sessions
Onsite enrollment meeting
Annual communication of benefit changes
0% 10% 20% 30% 40% 50%
Other
Targeted prevention
Participation incentives
Onsite gym or subsidy for off-site facility
Health fairs
Healthcare advocacy/coaching
Health screenings
Gym discounts
Flu vaccinations
EAP
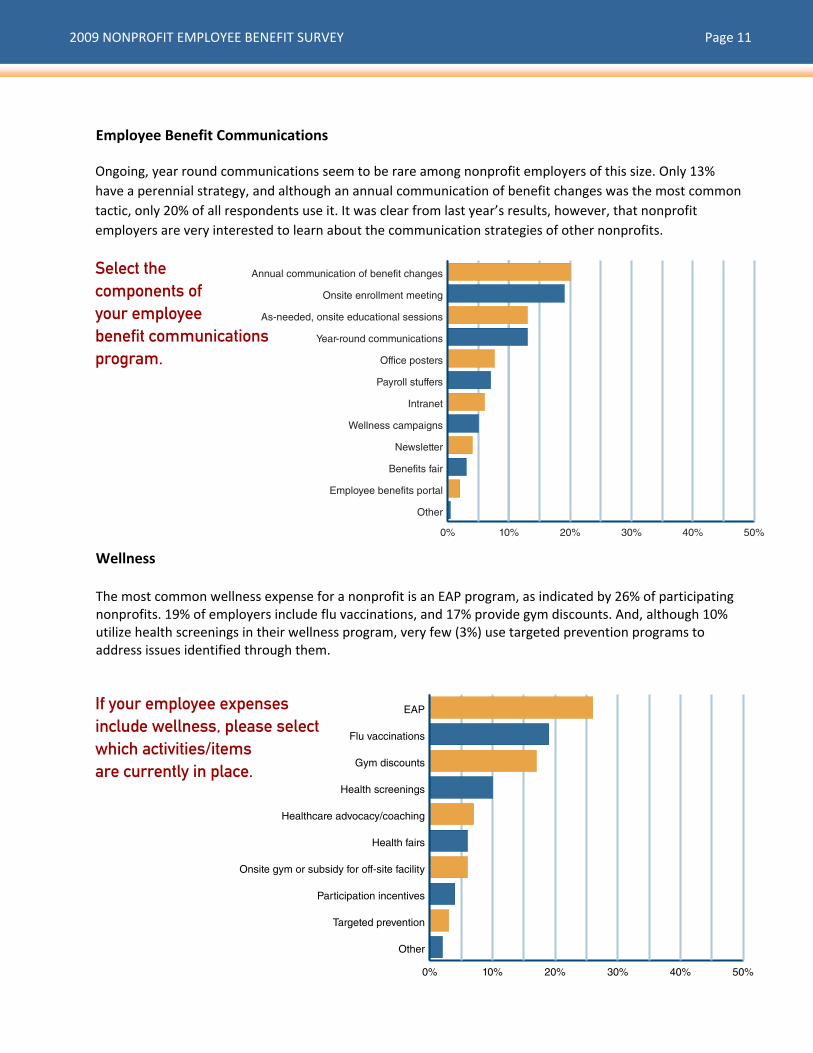
Employee Benefit Communications Ongoing, year round communications seem to be rare among nonprofit employers of this size. Only 13% have a perennial strategy, and although an annual communication of benefit changes was the most common tactic, only 20% of all respondents use it. It was clear from last year’s results, however, that nonprofit employers are very interested to learn about the communication strategies of other nonprofits.
Select the components of your employee benefit communications program.
Wellness The most common wellness expense for a nonprofit is an EAP program, as indicated by 26% of participating nonprofits. 19% of employers include flu vaccinations, and 17% provide gym discounts. And, although 10% utilize health screenings in their wellness program, very few (3%) use targeted prevention programs to address issues identified through them.
If your employee expenses include wellness, please select which activities/items are currently in place.
2009 NONPROFIT EMPLOYEE BENEFIT SURVEY Page 12
Don't Know3%
Yes12%
No85%
Don't Know11%
No34%
Yes55%
Of those who responded “Yes”55% make the system available to employees all year.
Internally managed38%
Outsourced62%
Don't know1%
COBRA vendor14%
Insurance carrier19%
Benefits broker/Consultant
23%
Benefits administrator/TPA
43%
Of the nonprofits that outsource COBRA, 43% outsource to a benefits
administrator or TPA.
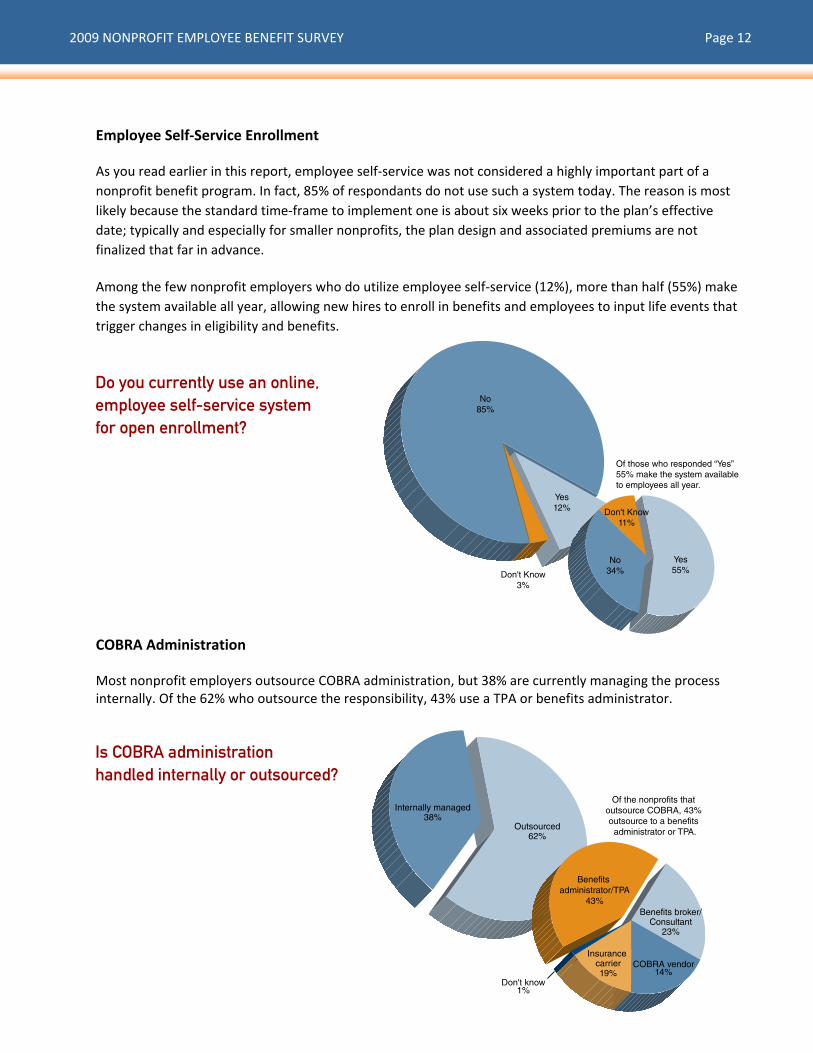
Employee Self‐Service Enrollment As you read earlier in this report, employee self‐service was not considered a highly important part of a nonprofit benefit program. In fact, 85% of respondants do not use such a system today. The reason is most likely because the standard time‐frame to implement one is about six weeks prior to the plan’s effective date; typically and especially for smaller nonprofits, the plan design and associated premiums are not finalized that far in advance. Among the few nonprofit employers who do utilize employee self‐service (12%), more than half (55%) make the system available all year, allowing new hires to enroll in benefits and employees to input life events that trigger changes in eligibility and benefits.
Do you currently use an online, employee self-service system for open enrollment?
COBRA Administration Most nonprofit employers outsource COBRA administration, but 38% are currently managing the process internally. Of the 62% who outsource the responsibility, 43% use a TPA or benefits administrator.
Is COBRA administration handled internally or outsourced?
2009 NONPROFIT EMPLOYEE BENEFIT SURVEY Page 13
Not At All Likely16%
Unlikely30%
Likely16%
Very Likely38%
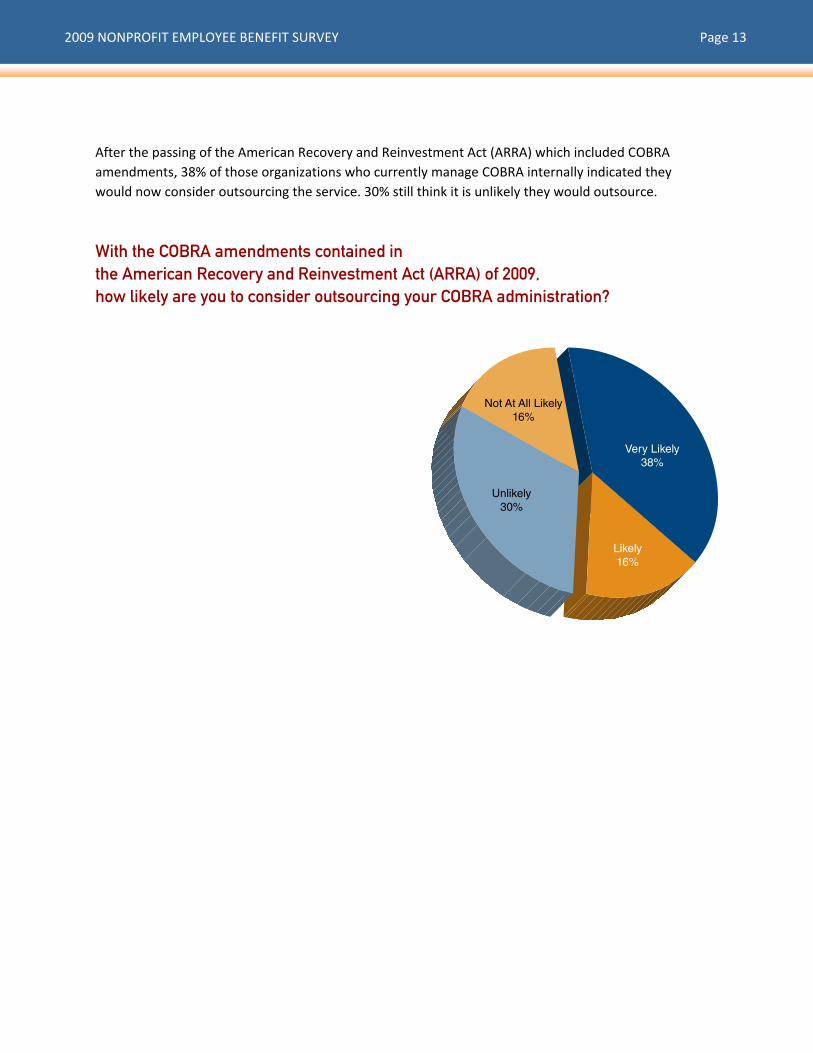
After the passing of the American Recovery and Reinvestment Act (ARRA) which included COBRA amendments, 38% of those organizations who currently manage COBRA internally indicated they would now consider outsourcing the service. 30% still think it is unlikely they would outsource. With the COBRA amendments contained in the American Recovery and Reinvestment Act (ARRA) of 2009, how likely are you to consider outsourcing your COBRA administration?

2009 NONPROFIT EMPLOYEE BENEFIT SURVEY Page 14
0% 20% 40% 60% 80% 100%
Not a SourcePast SourceMinor SourceMajor SourceAmong Top 3
Income investments
Tuition
Product sales/Fee-for-service
Foundations/Grants
Municipal sources
Corporate donations
Private donations
Special events
Board contributions
Federal
Fundraising
State
44%6%31%12%7%
74%2%8%8%8%
54%4%18%13%11%
11%5%24%31%29%
7%17%17%16%
9% 25%35%23%8%
5% 14%39%28%14%
8% 23%31%25%13%
6% 40%37%13%4%
3% 24%13%25%35%
4% 16%33%21%26%
2% 19%6%25%48%
43%
Don't Know8%
No17%
Yes75%
Section III: Nonprofit Benefit Challenges Funding Sources State funding, federal funding, and foundations and grants are the most common funding sources for the nonprofits who participated in this survey. In 2008, only 20% of employers selected foundations and grants as a top‐3 source, well behind state, federal and fundraising sources. This year, foundations and grants pulled ahead as a top‐3 by nearly 30% of employers. Fundraising wasn’t too far behind, with 26% of employers ranking it as a top‐3 source. Please rank the following funding sources.
Nonprofit Benefit Packages Historically, nonprofit organizations have offered relatively robust benefits to create a competitive total compensation package. And, although nonprofits are just as likely as corporate companies to implement cost saving strategies, they still feel the importance of offering slightly richer benefits to employees. As a nonprofit, do you feel it is important to offer a more robust benefits package to employees?
2009 NONPROFIT EMPLOYEE BENEFIT SURVEY Page 15
0% 10% 20% 30% 40% 50% 60% 70% 80% 90% 100%
Not At All Challenging
Somewhat Challenging
Challenging
Most Challenging
Employee turnover
Resistance to change
Compliance
Employee communication
Competition for talent
Employee education
Provider access/Network quality
Administrative burden
Benefit delivery/service
Plan design/Quality of benefits
Cost to employee
Cost to nonprofit
35%34%22%9%
15%37%36%12%
21%44%26%9%
12%48%35%5%
31%37%27%5%
18%49%29%4%
29%34%24%13%
20%42%28%10%
23%39%28%10%
11%21%49%19%
7%7%39%47%
2%21%77%
0% 20% 40% 60% 80% 100%
Eliminate dependent coverage when available through another employer
Conduct dependent audit
Consolidate vendors to gain negotiating leverage and streamline administration
Offer high-deductible health plan
Change contribution schedule
Change plan design
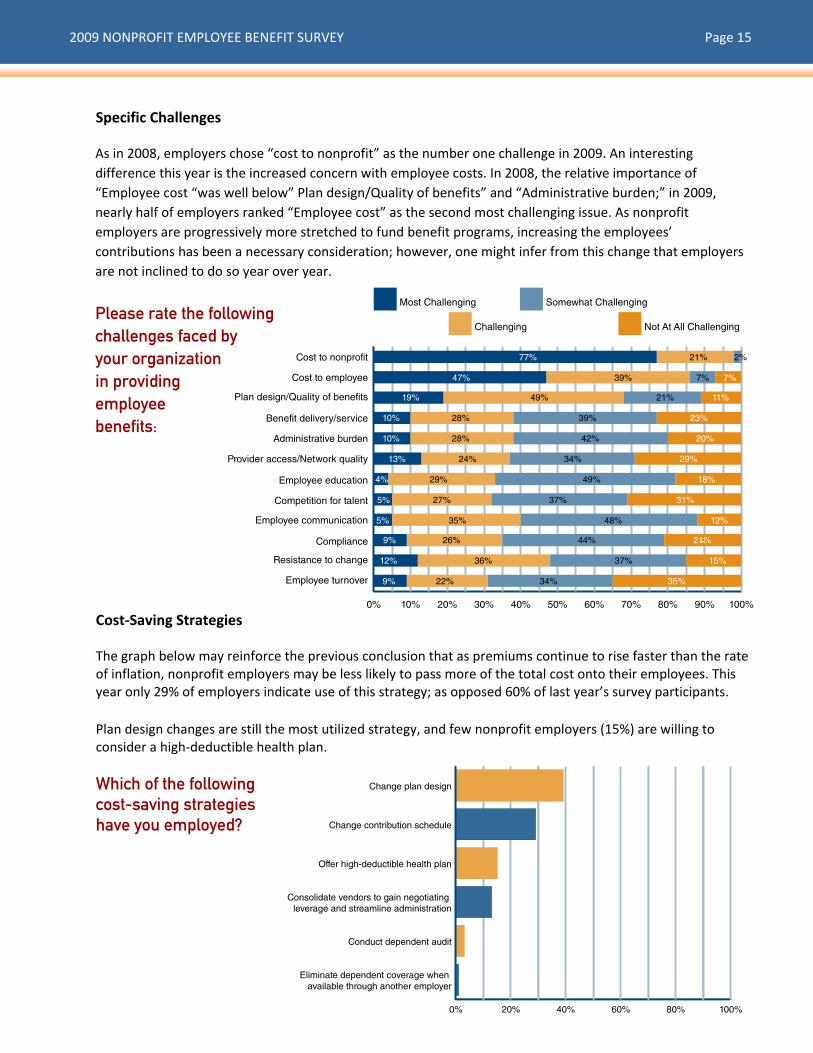
Specific Challenges As in 2008, employers chose “cost to nonprofit” as the number one challenge in 2009. An interesting difference this year is the increased concern with employee costs. In 2008, the relative importance of “Employee cost “was well below” Plan design/Quality of benefits” and “Administrative burden;” in 2009, nearly half of employers ranked “Employee cost” as the second most challenging issue. As nonprofit employers are progressively more stretched to fund benefit programs, increasing the employees’ contributions has been a necessary consideration; however, one might infer from this change that employers are not inclined to do so year over year. Please rate the following challenges faced by your organization in providing employee benefits: Cost‐Saving Strategies The graph below may reinforce the previous conclusion that as premiums continue to rise faster than the rate of inflation, nonprofit employers may be less likely to pass more of the total cost onto their employees. This year only 29% of employers indicate use of this strategy; as opposed 60% of last year’s survey participants.
Plan design changes are still the most utilized strategy, and few nonprofit employers (15%) are willing to consider a high‐deductible health plan. Which of the following cost-saving strategies have you employed?
2009 NONPROFIT EMPLOYEE BENEFIT SURVEY Page 16
0% 10% 20% 30% 40% 50%
$0
< $50
$50.01 to $100
$100.01 to $150
$150.01 to $200
$200.01 to $250
$250.01 to $299.99
$300 or more
0% 20% 40% 60% 80% 100%
$100 or less
$101 to $200
$201 to $300
$301 to $400
$401 to $500
$501 or more
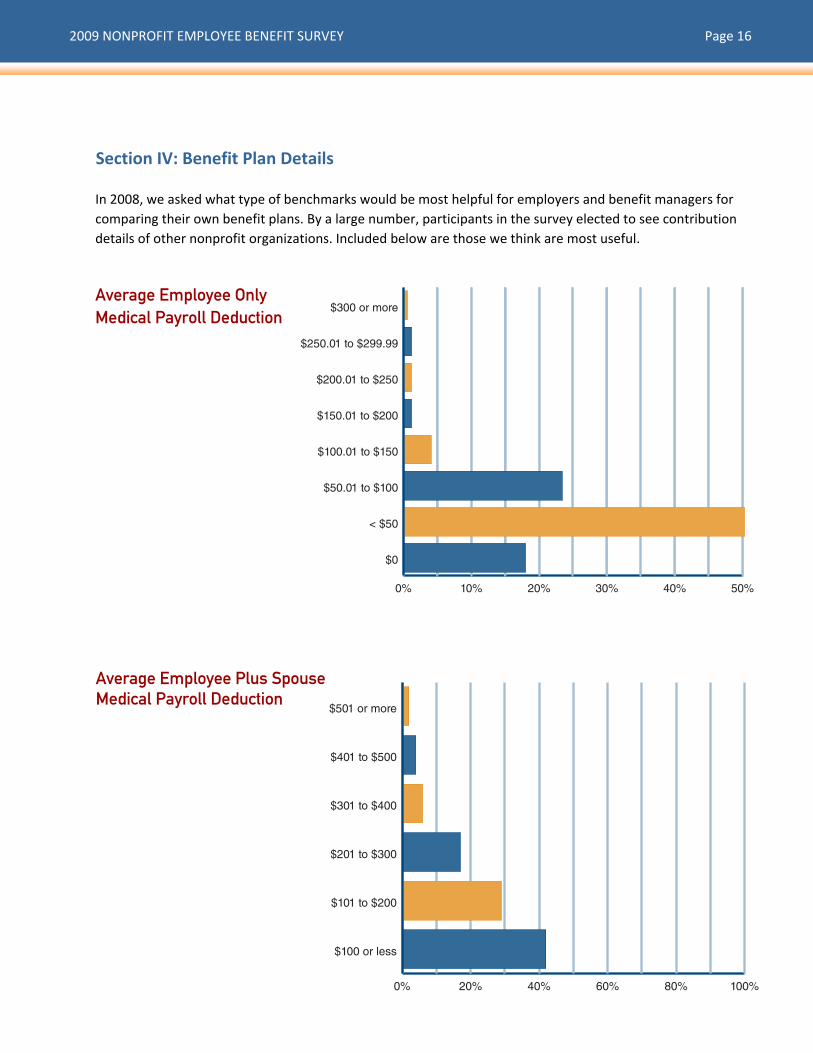
Section IV: Benefit Plan Details In 2008, we asked what type of benchmarks would be most helpful for employers and benefit managers for comparing their own benefit plans. By a large number, participants in the survey elected to see contribution details of other nonprofit organizations. Included below are those we think are most useful.
Average Employee Only Medical Payroll Deduction
Average Employee Plus Spouse Medical Payroll Deduction
2009 NONPROFIT EMPLOYEE BENEFIT SURVEY Page 17
0% 20% 40% 60% 80% 100%
$100 or less
$101 to $200
$201 to $300
$301 to $400
$401 to $500
$501 or more
0% 20% 40% 60% 80% 100%
$100 or less
$101 to $200
$201 to $300
$301 to $400
$401 to $500
$501 to $600
$601 to $750
$750 or more
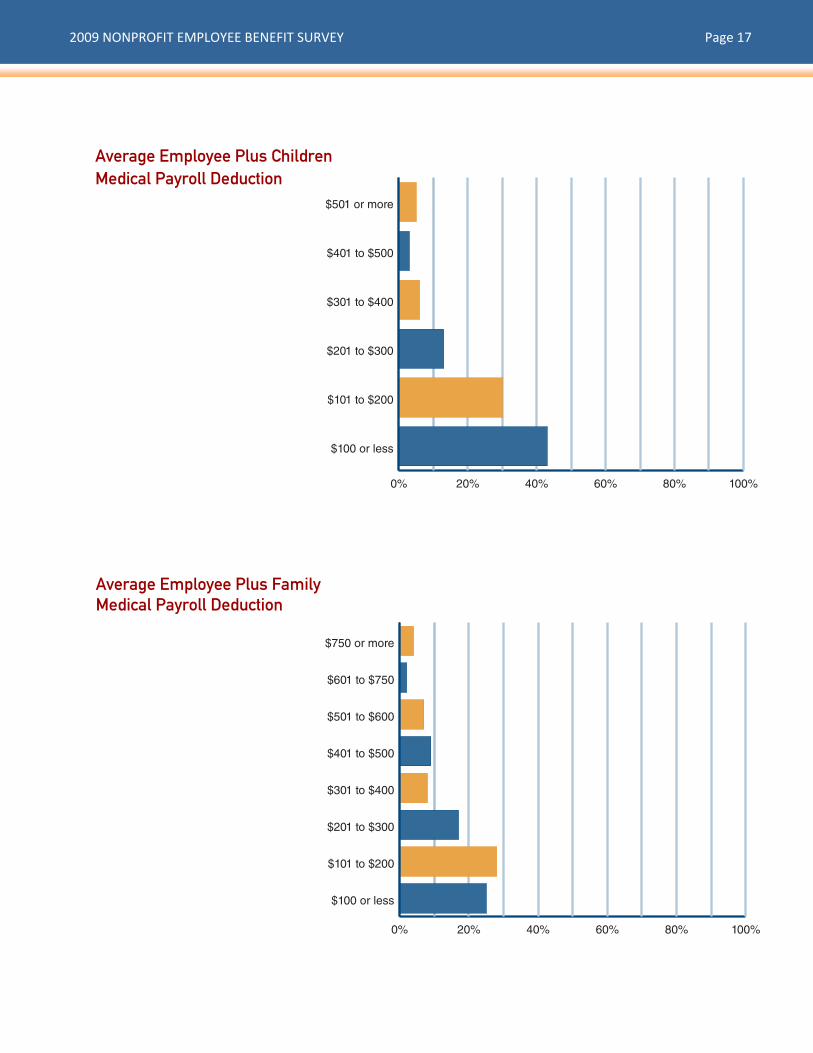
Average Employee Plus Children Medical Payroll Deduction
Average Employee Plus Family Medical Payroll Deduction
2009 NONPROFIT EMPLOYEE BENEFIT SURVEY Page 18
0% 20% 40% 60% 80% 100%
Other
No dependent coverage
Based on years of service
Based on position or salary
Fixed dollar amount with dependent buy-up
Fixed dollar amount paid by employer
Same/Similar percentage of premium paid by the employer
0% 20% 40% 60% 80% 100%
< 25%
25.1% to 45%
45.1% to 65%
65.1% to 75%
75.1% to 80%
80.1% to 85%
85.1% to 90%
90.1% to 99.9%
100%
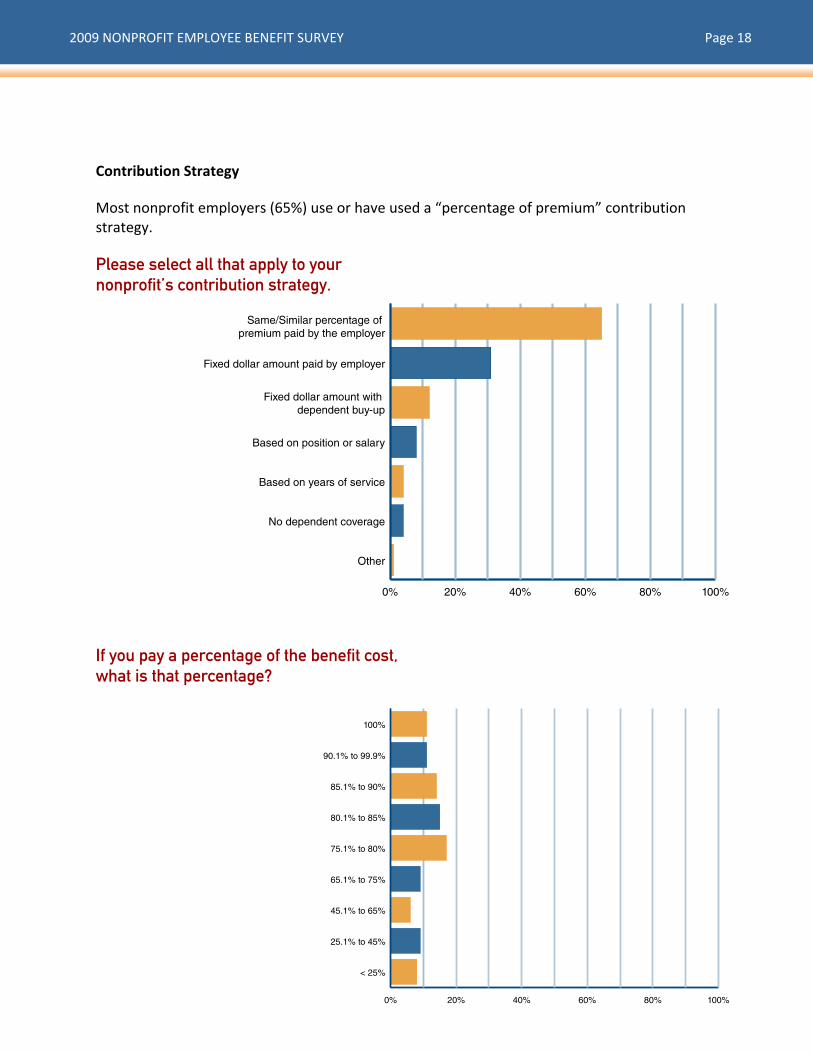
Contribution Strategy Most nonprofit employers (65%) use or have used a “percentage of premium” contribution strategy.
Please select all that apply to your nonprofit’s contribution strategy.
If you pay a percentage of the benefit cost, what is that percentage?
2009 NONPROFIT EMPLOYEE BENEFIT SURVEY Page 19
0% 20% 40% 60% 80% 100%
< $100
$101 to $250
$251 to $500
$501 to $750
$751 to $1,200
$1,201 to $1,500
$1,501 or more
0% 10% 20% 30% 40% 50%
Varies by position or benefit class
90 days from date of hire
30 days from date of hire
First of month after 90 days
First of month after 60 days
First of month after 30 days
First of month following date of hire
First day of employment
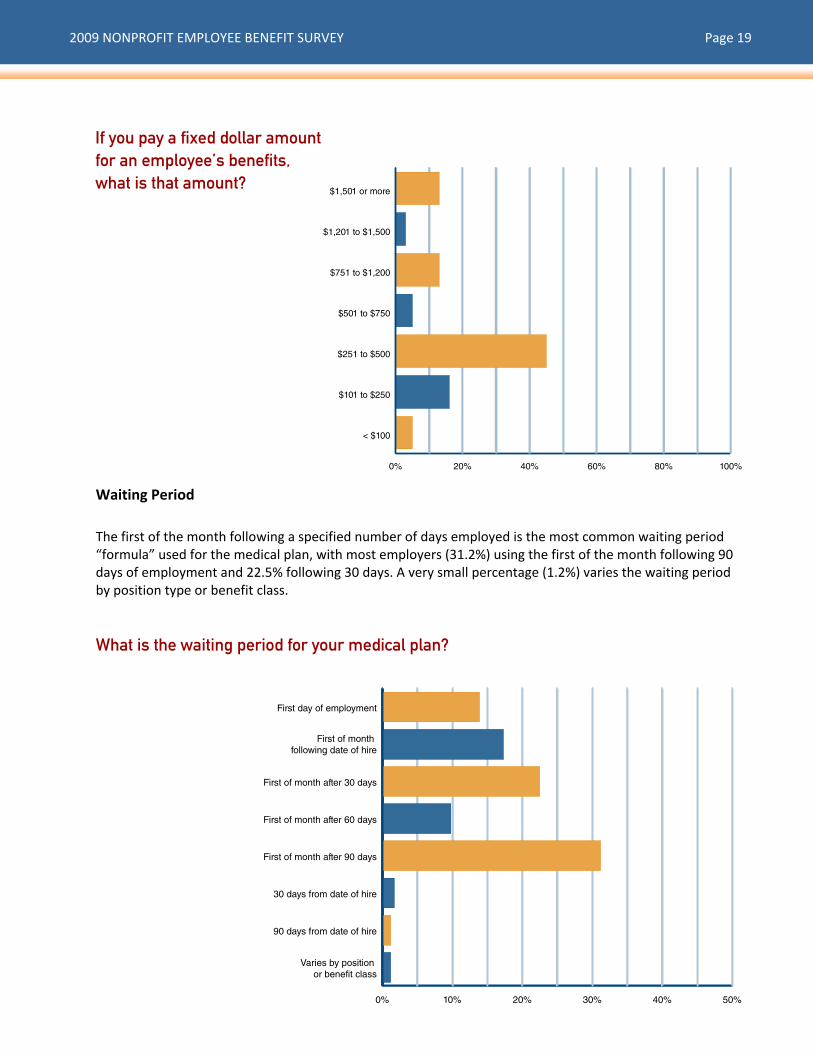
If you pay a fixed dollar amount for an employee’s benefits, what is that amount?
Waiting Period The first of the month following a specified number of days employed is the most common waiting period “formula” used for the medical plan, with most employers (31.2%) using the first of the month following 90 days of employment and 22.5% following 30 days. A very small percentage (1.2%) varies the waiting period by position type or benefit class. What is the waiting period for your medical plan?
2009 NONPROFIT EMPLOYEE BENEFIT SURVEY Page 20
Conclusion Nonprofit employers have maintained a higher level of coverage for their employees because they understand the value their employees place on those benefits. A recent survey of U.S. employers and employees revealed that employees are trying to take more control over their finances and are looking to their employers for help.2 Employees are looking for more options, such as group and employee‐paid voluntary benefits, and they are taking a greater interest in understanding those options and maximizing their choices through better control of their benefit dollars. Given the current economy and the unknown details of healthcare reform, it is not yet certain what types of plans will be available and how much they will cost. Regardless of the outcome, employees will be more engaged and will look to their employer for the information they need to make the best choices for themselves and their families.
2MetLife. (2009). Study of Employee Benefits Trends
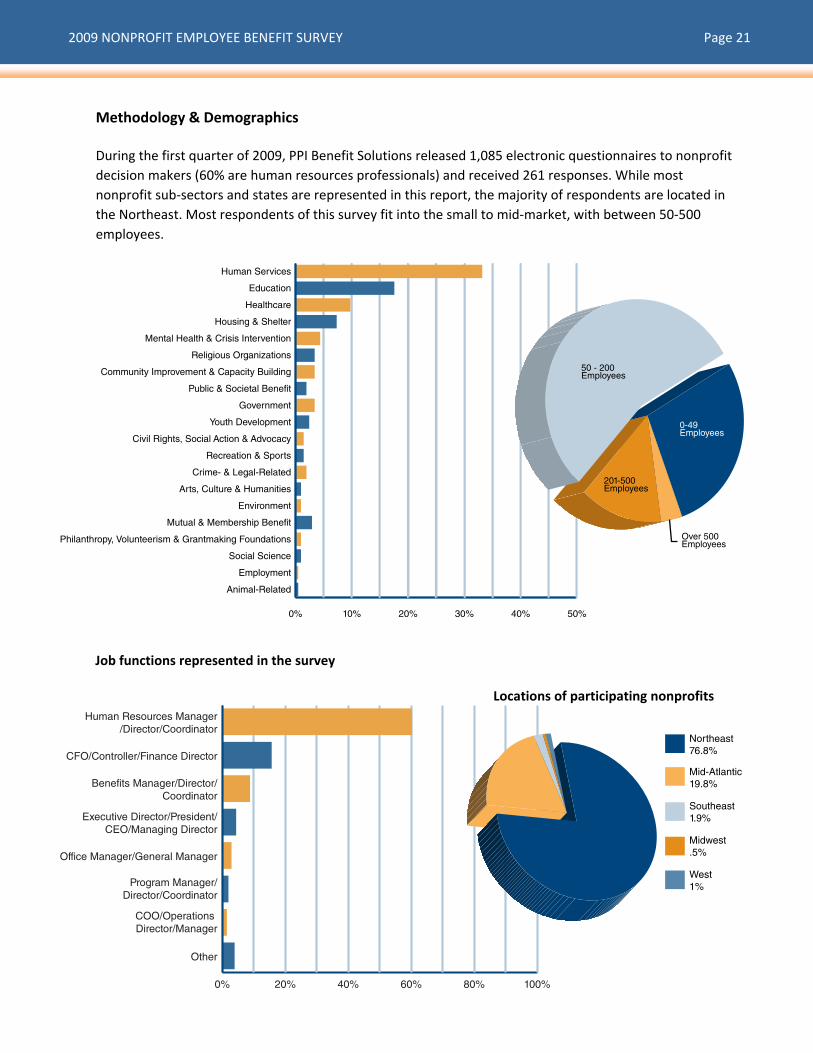
Job functions represented in the survey
2009 NONPROFIT EMPLOYEE BENEFIT SURVEY Page 21
Locations of participating nonprofits
Methodology & Demographics During the first quarter of 2009, PPI Benefit Solutions released 1,085 electronic questionnaires to nonprofit decision makers (60% are human resources professionals) and received 261 responses. While most nonprofit sub‐sectors and states are represented in this report, the majority of respondents are located in the Northeast. Most respondents of this survey fit into the small to mid‐market, with between 50‐500 employees.
0% 10% 20% 30% 40% 50%
Animal-Related
Employment
Social Science
Philanthropy, Volunteerism & Grantmaking Foundations
Mutual & Membership Benefit
Environment
Arts, Culture & Humanities
Crime- & Legal-Related
Recreation & Sports
Civil Rights, Social Action & Advocacy
Youth Development
Government
Public & Societal Benefit
Community Improvement & Capacity Building
Religious Organizations
Mental Health & Crisis Intervention
Housing & Shelter
Healthcare
Education
Human Services
50 - 200Employees
0-49Employees
201-500Employees
Over 500Employees
0% 20% 40% 60% 80% 100%
Other
COO/Operations Director/Manager
Program Manager/Director/Coordinator
Office Manager/General Manager
Executive Director/President/CEO/Managing Director
Benefits Manager/Director/Coordinator
CFO/Controller/Finance Director
Human Resources Manager/Director/Coordinator
Northeast76.8%
Mid-Atlantic19.8%
Southeast1.9%
Midwest.5%
West1%

“PPI Benefit Solutions®” and “PPI” are service marks of Professional Pensions, Inc., a subsidiary of National Financial Partners Corp.®
Copyright 2009, Professional Pensions, Inc.
Approved 11/11/2009