Powertech Labs Inc. Avenue Tel: (604)590-7500 Surrey ... · #2/0 AWG 8000 series aluminum wire for...
63
Management System Registered to ISO 9001/14001 This report shall not be reproduced except in full without the written approval of Powertech Labs Inc. Report #: PL-00236-REP1 27 June 2014 Page 1 of 63 Powertech Labs Inc. 12388 - 88 th Avenue Tel: (604)590-7500 Surrey, British Columbia Fax: (604)590-5347 Canada V3W 7R7 www.powertechlabs.com POWERTECH LABS INC. CONNECTABILITY TESTING OF COPPER AND ALUMINUM WIRING, PHASE 2: Current Cycling Tests – Mechanical Connectors PROJECT PL-00236 Prepared for the: International Copper Association Ltd. Prepared by: Reviewed by: Chris Morton, P.Eng. Logan Connaughton, P.Eng Senior Engineer, Power Labs Senior Engineer, Power Labs Signature Signature Date Date A6163
Transcript of Powertech Labs Inc. Avenue Tel: (604)590-7500 Surrey ... · #2/0 AWG 8000 series aluminum wire for...

Management System Registered to ISO 9001/14001
This report shall not be reproduced except in full without the written approval of Powertech Labs Inc.
Report #: PL-00236-REP1 27 June 2014 Page 1 of 63
Powertech Labs Inc. 12388 - 88
th Avenue Tel: (604)590-7500
Surrey, British Columbia Fax: (604)590-5347 Canada V3W 7R7 www.powertechlabs.com
POWERTECH LABS INC.
CONNECTABILITY TESTING
OF COPPER AND ALUMINUM WIRING, PHASE 2:
Current Cycling Tests – Mechanical Connectors
PROJECT PL-00236
Prepared for the:
International Copper Association Ltd.
Prepared by: Reviewed by:
Chris Morton, P.Eng. Logan Connaughton, P.Eng
Senior Engineer, Power Labs Senior Engineer, Power Labs
Signature Signature
Date Date
A6163

Connectability Testing of North American and Chinese Copper and Aluminum Wiring Powertech Labs Inc.
_____________________________________________________________________________________________
This report shall not be reproduced except in full without the written approval of Powertech Labs Inc.
Report #: PL-00236-REP1 27 June 2014 Page 2 of 63
TABLE OF CONTENTS
1. EXECUTIVE SUMMARY .................................................................................................... 3
2. INTRODUCTION .................................................................................................................. 4
3. TEST SAMPLES .................................................................................................................... 4
3.1 WIRE .............................................................................................................................. 4 3.2 CONNECTORS .............................................................................................................. 4 3.3 SAMPLE ASSEMBLIES ............................................................................................... 5 3.4 CONNECTOR PREPARATION.................................................................................... 6
3.5 TEST LOOP ASSEMBLY ............................................................................................. 6
3.6 SAMPLE LABELLING ............................................................................................... 10
4. TEST PROCEDURE ............................................................................................................ 12
5. TEST RESULTS ................................................................................................................... 13
5.1 TEMPERATURE CYCLE ........................................................................................... 13 5.2 SAMPLE RE-TORQUING .......................................................................................... 13
5.3 SAMPLE FAILURES ................................................................................................... 14 5.4 DC RESISTANCE AND PEAK TEMPERATURE RISE VALUES .......................... 15
5.5 SAMPLES REMOVED DURING TESTING DUE TO ‘FAILURE’ ......................... 49 5.6 ANALYSIS OF THE RESULTS ................................................................................. 50
6. ANALYSIS BY IEC 61238-1 METHODOLOGY .............................................................. 53
7. CONCLUSIONS .................................................................................................................. 61
7.1 IEC ANALYSIS ........................................................................................................... 61 7.2 OVERALL CONCLUSIONS ....................................................................................... 61

Connectability Testing of North American and Chinese Copper and Aluminum Wiring Powertech Labs Inc.
_____________________________________________________________________________________________
This report shall not be reproduced except in full without the written approval of Powertech Labs Inc.
Report #: PL-00236-REP1 27 June 2014 Page 3 of 63
1. EXECUTIVE SUMMARY
The objective of this study was to compare the electrical connectability of #1 AWG copper and
#2/0 AWG 8000 series aluminum wire for use in low-voltage electrical power distribution
applications. This report describes the current cycling test component on mechanical screw-type
connector samples. The test connectors were standard single screw lug connectors obtained from
local industrial electrical suppliers. The aluminum wire test samples were prepared with and
without abrasion of the conductor surface, with and without oxide inhibitor applied to the
conductor, and with the set screw tightened to 70%, 100%, and 125% of the rated torque. The
copper wire samples were prepared without abrasion and without oxide inhibitor, and with the set
screw tightened to 70%, 100%, and 125% of the rated torque.
The wire and connector samples were subjected to accelerated ageing by current cycling using the
test procedures outlined in IEC 61238-1 as a guide. Test samples were subjected to 1500 current
cycles in a high humidity environment with the temperature of the conductor cycling from room
temperature to 100°C rise above ambient and back to room temperature in a period of 2.25 hours.
Short circuit current was also applied to each sample after 200 current cycles were completed. The
dc resistance and peak temperature of each sample was monitored during the test.
The overall conclusions from the testing are as follows:
1. The copper mechanical connectors on copper wire had the most stable resistance and
temperature readings, and performed the best during the test.
2. The aluminum (dual rated) mechanical connectors on copper wire performed relatively
poorly during the test, with 1/3 of the samples failing or showing elevated resistance and
temperature levels by the end of the test.
3. The aluminum (dual rated) mechanical connectors on aluminum wire performed very
poorly during the test, and had a very high failure rate even before the mid-point of the test.
Over 90% of the samples had either failed or showed elevated resistance and temperature
levels by the end of the test. There was no clear correlation between conductor preparation
method, torque level, and failure, except that the connectors that had been torqued to 125%
of the rated torque level performed marginally better than the others.

Connectability Testing of North American and Chinese Copper and Aluminum Wiring Powertech Labs Inc.
_____________________________________________________________________________________________
This report shall not be reproduced except in full without the written approval of Powertech Labs Inc.
Report #: PL-00236-REP1 27 June 2014 Page 4 of 63
2. INTRODUCTION
The objective of this study is to compare the electrical connectability of copper and aluminum
wire for use in low-voltage (<1000 V) electrical power distribution applications. The wire and
connector samples used in the testing were obtained from local North American suppliers. The
work was done at the request of the International Copper Association Ltd. (ICA), and was
carried out at Powertech Labs, Surrey, B.C, Canada from July 2013 to February 2014.
This report describes the Phase 2 (current cycling test) component of the testing on mechanical
screw-type connector samples.
3. TEST SAMPLES
3.1 WIRE
The wire was obtained from a local industrial supplier (Texcan) by Powertech Labs. The wire was
standard, stock product that was supplied in the absence of specifying the manufacturer when
ordering.
The wire samples used for the testing are listed below in Table 1.
Table 1. Wire samples used in the testing.
Manufacturer Size Type Model Rating Voltage
BICC 1 AWG Copper Not marked RW90 600V
Alcan 2/0 AWG Aluminum Alloy NUAL RW90 600V
3.2 CONNECTORS
Connectors were obtained for the tests from local suppliers. The connectors were standard,
commonly available types from standard industrial electrical suppliers, and included the
following types:
Single screw mechanical lug connectors, CU rated, copper or brass body (plated)
Single screw mechanical lug connectors, AL/CU dual rated, aluminum body
A typical sample connector is shown in Figure 1.

Connectability Testing of North American and Chinese Copper and Aluminum Wiring Powertech Labs Inc.
_____________________________________________________________________________________________
This report shall not be reproduced except in full without the written approval of Powertech Labs Inc.
Report #: PL-00236-REP1 27 June 2014 Page 5 of 63
Figure 1. Typical connector sample (AL/CU dual rated shown).
3.3 SAMPLE ASSEMBLIES
The test sample assemblies consisted of short lengths of bare wire terminating in an electrical
connector at one end, and a current equalizer at the other end. The layout of a typical sample is
shown in Figure 2.
Reference (control) conductor samples with no connector were also included in the testing. Two
reference samples of each conductor size and type were used.
Figure 2. Typical connector test sample.
12"
connectorwire
current equalizer
weld

Connectability Testing of North American and Chinese Copper and Aluminum Wiring Powertech Labs Inc.
_____________________________________________________________________________________________
This report shall not be reproduced except in full without the written approval of Powertech Labs Inc.
Report #: PL-00236-REP1 27 June 2014 Page 6 of 63
3.4 CONNECTOR PREPARATION
The samples included an equal number of connectors that were tightened to each of the following
three torque values:
70% of rated torque.
100% of rated torque.
125% of rated torque.
Where used, contact lubricant (oxide inhibitor), was applied on the connection barrel and/or
conductor as directed in the manufacturer’s installation instructions. A commonly available
product was selected. Neither oxide inhibitor nor any other lubricant was used on the screw
threads.
Each copper wire sample was prepared with no wire brushing or abrasion of the wire or connector,
and no oxide inhibitor was used.
For the aluminum wire samples, three different preparation methods were used:
1. Wire brushing/abrasion of the bare wire surface, and application of oxide inhibitor.
2. Application of oxide inhibitor only.
3. No oxide inhibitor and no abrasion.
A summary of the combinations of preparation methods for each sample is given in Table 2.
3.5 TEST LOOP ASSEMBLY
The test sample assemblies were elevated on wooden rails, 3 ft. from the laboratory floor, and
connected together into a series loop so that the same current level could be passed through all
samples simultaneously. Samples were suspended in free air so that cooling would be by natural
convection. The plan view layout of the test loop is shown in Figure 3, and a circuit schematic is
shown in Figure 4. A photograph of some of the samples in the test is shown in Figure 5.

Connectability Testing of North American and Chinese Copper and Aluminum Wiring Powertech Labs Inc.
_____________________________________________________________________________________________
This report shall not be reproduced except in full without the written approval of Powertech Labs Inc.
Report #: PL-00236-REP1 27 June 2014 Page 7 of 63
Table 2. Sample preparation used for the current cycle tests.
Type Conductor Connector
Rating Abrasion Inhibitor Torque
Total
No.
Units
Control #1 Cu --- --- --- --- 2
Control 2/0 Al --- --- --- --- 2
Mechanical #1 Cu AL/CU N N 125% 4
Mechanical #1 Cu AL/CU N N 100% 4
Mechanical #1 Cu AL/CU N N 70% 4
Mechanical #1 Cu CU N N 125% 4
Mechanical #1 Cu CU N N 100% 4
Mechanical #1 Cu CU N N 70% 4
Mechanical 2/0 Al AL/CU Y Y 125% 4
Mechanical 2/0 Al AL/CU N Y 125% 4
Mechanical 2/0 Al AL/CU N N 125% 4
Mechanical 2/0 Al AL/CU Y Y 100% 4
Mechanical 2/0 Al AL/CU N Y 100% 4
Mechanical 2/0 Al AL/CU N N 100% 4
Mechanical 2/0 Al AL/CU Y Y 70% 4
Mechanical 2/0 Al AL/CU N Y 70% 4
Mechanical 2/0 Al AL/CU N N 70% 4
Connectability Testing of North American and Chinese Copper and Aluminum Wiring Powertech Labs Inc.
_____________________________________________________________________________________________
This report shall not be reproduced except in full without the written approval of Powertech Labs Inc.
Report #: PL-00236-REP1 27 June 2014 Page 8 of 63
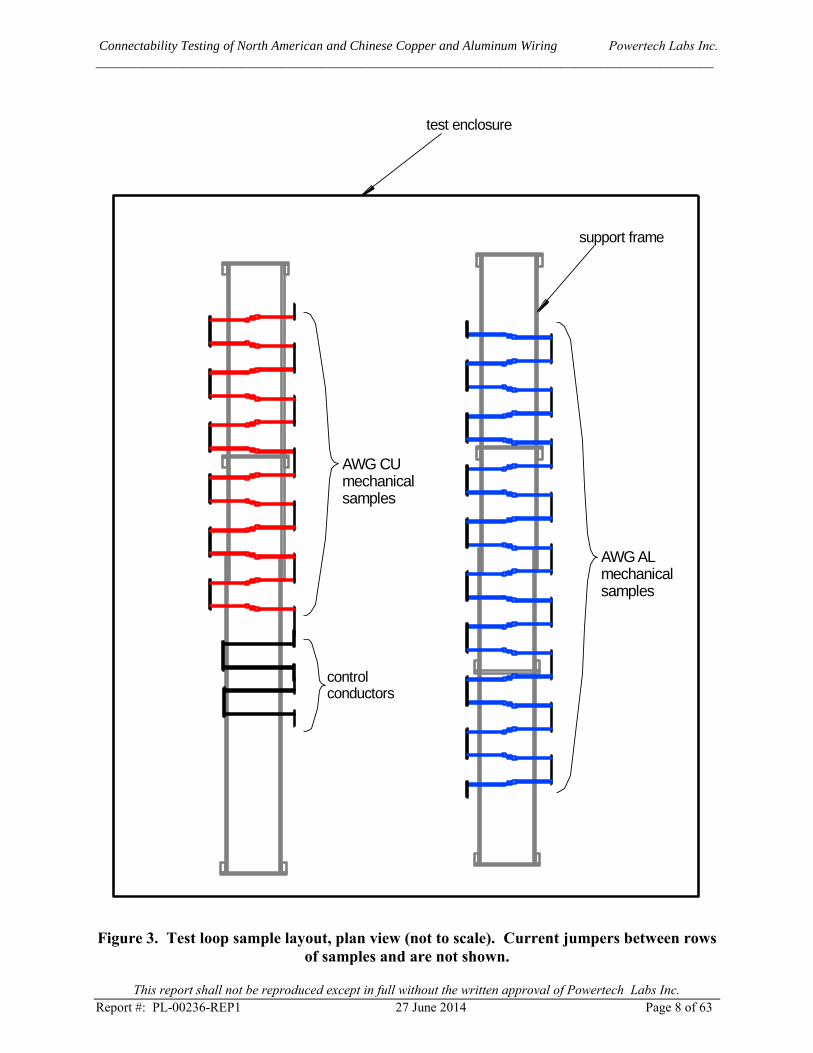
Figure 3. Test loop sample layout, plan view (not to scale). Current jumpers between rows
of samples and are not shown.
support frame
AWG ALmechanicalsamples
test enclosure
AWG CUmechanicalsamples
controlconductors

Connectability Testing of North American and Chinese Copper and Aluminum Wiring Powertech Labs Inc.
_____________________________________________________________________________________________
This report shall not be reproduced except in full without the written approval of Powertech Labs Inc.
Report #: PL-00236-REP1 27 June 2014 Page 9 of 63
Figure 4. Circuit schematic for the test loop.
Figure 5. Samples set up for the test.
thermocouple bundles
Data Acquisitionand Control
System
High CurrentTransformer
Motor DrivenVariable
Autotransformer
CurrentTransformer
test samples
600V ACSource

Connectability Testing of North American and Chinese Copper and Aluminum Wiring Powertech Labs Inc.
This report shall not be reproduced except in full without the written approval of Powertech Labs Inc.
Report #: PL-00236-REP1 27 June 2014 Page 10 of 63
3.6 SAMPLE LABELLING
Samples were labelled as indicated in Table 3.
Table 3. Sample labelling for all samples.
Sample
No.
Inhib-
itor
Abra-
sion Torque Conductor Type
Con-
nector
Rating
Manufact-
urer Model
CCtrl1 --- --- --- #1 Cu Control --- --- ---
CCtrl2 --- --- --- #1 Cu Control --- --- ---
ACtrl1 --- --- --- 2/0 Al Control --- --- ---
ACtrl2 --- --- --- 2/0 Al Control --- --- ---
CM1 N N 125% #1 Cu Mechanical AL/CU KA26U
CM2 N N 125% #1 Cu Mechanical AL/CU KA26U
CM3 N N 100% #1 Cu Mechanical AL/CU KA26U
CM4 N N 100% #1 Cu Mechanical AL/CU KA26U
CM5 N N 70% #1 Cu Mechanical AL/CU KA26U
CM6 N N 70% #1 Cu Mechanical AL/CU KA26U
CM7 N N 125% #1 Cu Mechanical AL/CU ADR21
CM8 N N 125% #1 Cu Mechanical AL/CU ADR21
CM9 N N 100% #1 Cu Mechanical AL/CU ADR21
CM10 N N 100% #1 Cu Mechanical AL/CU ADR21
CM11 N N 70% #1 Cu Mechanical AL/CU ADR21
CM12 N N 70% #1 Cu Mechanical AL/CU ADR21
CM13 N N 125% #1 Cu Mechanical CU KLU125
CM14 N N 125% #1 Cu Mechanical CU KLU125
CM15 N N 100% #1 Cu Mechanical CU KLU125
CM16 N N 100% #1 Cu Mechanical CU KLU125
CM17 N N 70% #1 Cu Mechanical CU KLU125
CM18 N N 70% #1 Cu Mechanical CU KLU125
CM19 N N 125% #1 Cu Mechanical CU STC1102
CM20 N N 125% #1 Cu Mechanical CU STC1102
CM21 N N 100% #1 Cu Mechanical CU STC1102
CM22 N N 100% #1 Cu Mechanical CU STC1102
CM23 N N 70% #1 Cu Mechanical CU STC1102
CM24 N N 70% #1 Cu Mechanical CU STC1102
Tab
le C
ontent Red
acte
d

Connectability Testing of North American and Chinese Copper and Aluminum Wiring Powertech Labs Inc.
This report shall not be reproduced except in full without the written approval of Powertech Labs Inc.
Report #: PL-00236-REP1 27 June 2014 Page 11 of 63
Sample
No.
Inhib-
itor
Abra-
sion Torque Conductor Type
Con-
nector
Rating
Manufact-
urer Model
AM1 Y Y 125% 2/0 Al Mechanical AL/CU KA26U
AM2 Y Y 125% 2/0 Al Mechanical AL/CU KA26U
AM3 Y N 125% 2/0 Al Mechanical AL/CU KA26U
AM4 Y N 125% 2/0 Al Mechanical AL/CU KA26U
AM5 N N 125% 2/0 Al Mechanical AL/CU KA26U
AM6 N N 125% 2/0 Al Mechanical AL/CU KA26U
AM7 Y Y 100% 2/0 Al Mechanical AL/CU KA26U
AM8 Y Y 100% 2/0 Al Mechanical AL/CU KA26U
AM9 Y N 100% 2/0 Al Mechanical AL/CU KA26U
AM10 Y N 100% 2/0 Al Mechanical AL/CU KA26U
AM11 N N 100% 2/0 Al Mechanical AL/CU KA26U
AM12 N N 100% 2/0 Al Mechanical AL/CU KA26U
AM13 Y Y 70% 2/0 Al Mechanical AL/CU KA26U
AM14 Y Y 70% 2/0 Al Mechanical AL/CU KA26U
AM15 Y N 70% 2/0 Al Mechanical AL/CU KA26U
AM16 Y N 70% 2/0 Al Mechanical AL/CU KA26U
AM17 N N 70% 2/0 Al Mechanical AL/CU KA26U
AM18 N N 70% 2/0 Al Mechanical AL/CU KA26U
AM19 Y Y 125% 2/0 Al Mechanical AL/CU ADR21
AM20 Y Y 125% 2/0 Al Mechanical AL/CU ADR21
AM21 Y N 125% 2/0 Al Mechanical AL/CU ADR21
AM22 Y N 125% 2/0 Al Mechanical AL/CU ADR21
AM23 N N 125% 2/0 Al Mechanical AL/CU ADR21
AM24 N N 125% 2/0 Al Mechanical AL/CU ADR21
AM25 Y Y 100% 2/0 Al Mechanical AL/CU ADR21
AM26 Y Y 100% 2/0 Al Mechanical AL/CU ADR21
AM27 Y N 100% 2/0 Al Mechanical AL/CU ADR21
AM28 Y N 100% 2/0 Al Mechanical AL/CU ADR21
AM29 N N 100% 2/0 Al Mechanical AL/CU ADR21
AM30 N N 100% 2/0 Al Mechanical AL/CU ADR21
Ta
ble C
ontent Re
da
cte
d

Connectability Testing of North American and Chinese Copper and Aluminum Wiring Powertech Labs Inc.
This report shall not be reproduced except in full without the written approval of Powertech Labs Inc.
Report #: PL-00236-REP1 27 June 2014 Page 12 of 63
Sample
No.
Inhib-
itor
Abra-
sion Torque Conductor Type
Con-
nector
Rating
Manufact-
urer Model
AM31 Y Y 70% 2/0 Al Mechanical AL/CU ADR21
AM32 Y Y 70% 2/0 Al Mechanical AL/CU ADR21
AM33 Y N 70% 2/0 Al Mechanical AL/CU ADR21
AM34 Y N 70% 2/0 Al Mechanical AL/CU ADR21
AM35 N N 70% 2/0 Al Mechanical AL/CU ADR21
AM36 N N 70% 2/0 Al Mechanical AL/CU ADR21
4. TEST PROCEDURE
The wire and connector samples were subjected to accelerated ageing by current cycling. The test
procedure IEC 61238-1 (2003-05), “Compression and mechanical connectors for power cables for
rated voltages up to 30 kV (Um = 36 kV)”, was used as a guide, with modifications and details as
listed below:
4 samples of each configuration were tested. The numbers of samples of each type used are
given in Table 2.
Welded equalizers were prepared and samples were connected together palm-to-palm in
accordance with ANSI C119.4-2011.
Samples were subjected to 1500 heating/cooling cycles, each consisting of 1 hour of heating by
applying high current followed by 1.25 hours of natural cooling with no current applied.
The current level was determined at the start of the test as the current required to heat the
control (reference) conductor samples to a temperature rise of 100-105°C above ambient
temperature. A current level of 280 A was used for the test.
One application of short-circuit current was applied to each sample after the 200th
current cycle
to achieve 250°C to 270°C on the reference conductor. Samples were tested in groups, by
location in the test loop.
Sample assemblies were tested in an enclosure with an ambient temperature of 25-30°C during
the test.
The test was conducted in a high humidity environment (>90% RH, non-condensing).
Humidity was maintained using atomizing sprayers which operated on a 20% duty cycle.
Connector DC resistance was measured approximately every 100 cycles or less, and the
temperature of connectors and reference conductors was monitored during the test.
Peak temperature rise values for each connector were measured using thermocouples attached
to the surface of the connector body with thermally conductive epoxy.
Connection performance was evaluated by the change in the corrected dc resistance and
temperature rise above the control conductor temperature over the course of the test.
Tab
le Content
Red
acte
d
Connectability Testing of North American and Chinese Copper and Aluminum Wiring Powertech Labs Inc.
_____________________________________________________________________________________________
This report shall not be reproduced except in full without the written approval of Powertech Labs Inc.
Report #: PL-00236-REP1 27 June 2014 Page 13 of 63
5. TEST RESULTS
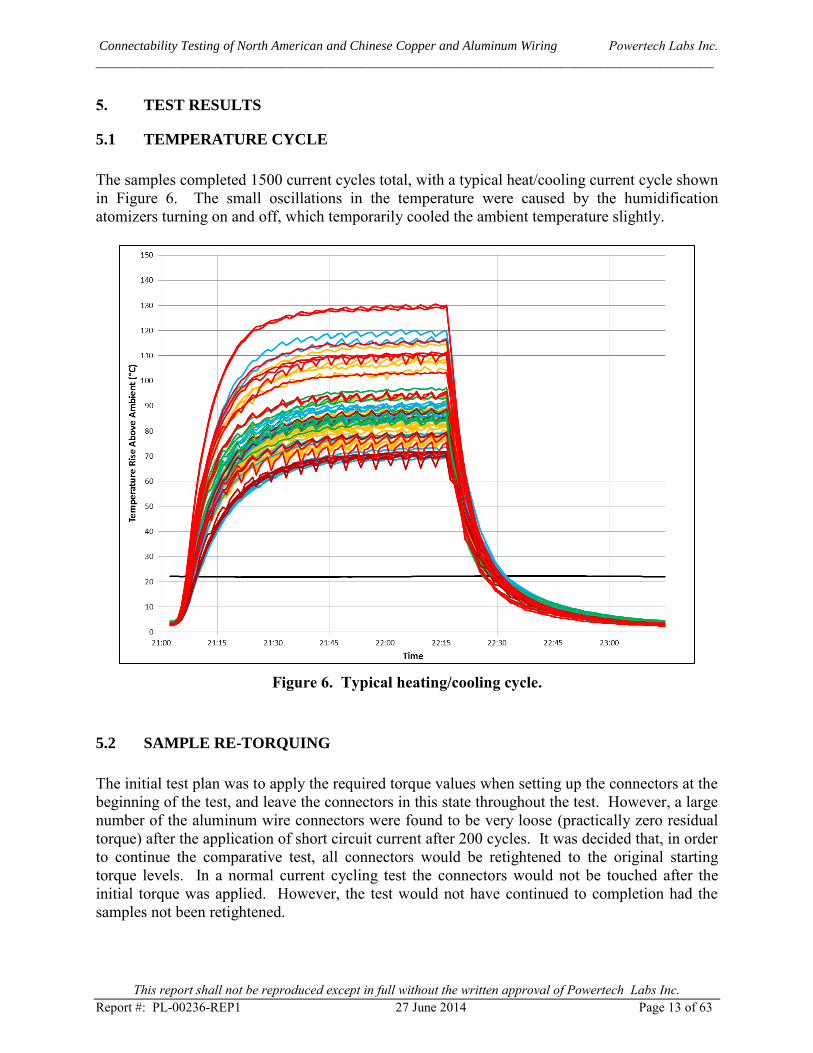
5.1 TEMPERATURE CYCLE
The samples completed 1500 current cycles total, with a typical heat/cooling current cycle shown
in Figure 6. The small oscillations in the temperature were caused by the humidification
atomizers turning on and off, which temporarily cooled the ambient temperature slightly.
Figure 6. Typical heating/cooling cycle.
5.2 SAMPLE RE-TORQUING
The initial test plan was to apply the required torque values when setting up the connectors at the
beginning of the test, and leave the connectors in this state throughout the test. However, a large
number of the aluminum wire connectors were found to be very loose (practically zero residual
torque) after the application of short circuit current after 200 cycles. It was decided that, in order
to continue the comparative test, all connectors would be retightened to the original starting
torque levels. In a normal current cycling test the connectors would not be touched after the
initial torque was applied. However, the test would not have continued to completion had the
samples not been retightened.

Connectability Testing of North American and Chinese Copper and Aluminum Wiring Powertech Labs Inc.
_____________________________________________________________________________________________
This report shall not be reproduced except in full without the written approval of Powertech Labs Inc.
Report #: PL-00236-REP1 27 June 2014 Page 14 of 63
5.3 SAMPLE FAILURES
During the test a number of connectors ‘failed’ by exceeding a peak temperature level that was
considered unsafe to allow them to continue with the testing. Although the connectors were still
intact (i.e., the conductor had not melted or separated from the connector), they were bypassed
using shunt jumpers in order to allow the test to continue. Generally, the temperature level that
was considered too high to safely continue was 250°C. An example of a bypassed sample is
shown in Figure 7.
In one case a connector actually failed completely by melting through the conductor during the
short-circuit test (see Figure 8). This sample was removed from the test.
Figure 7. Sample bypassed using a shunt jumper due to overheating during testing.

Connectability Testing of North American and Chinese Copper and Aluminum Wiring Powertech Labs Inc.
_____________________________________________________________________________________________
This report shall not be reproduced except in full without the written approval of Powertech Labs Inc.
Report #: PL-00236-REP1 27 June 2014 Page 15 of 63
Figure 8. Sample AM32 that failed during the short-circuit test.
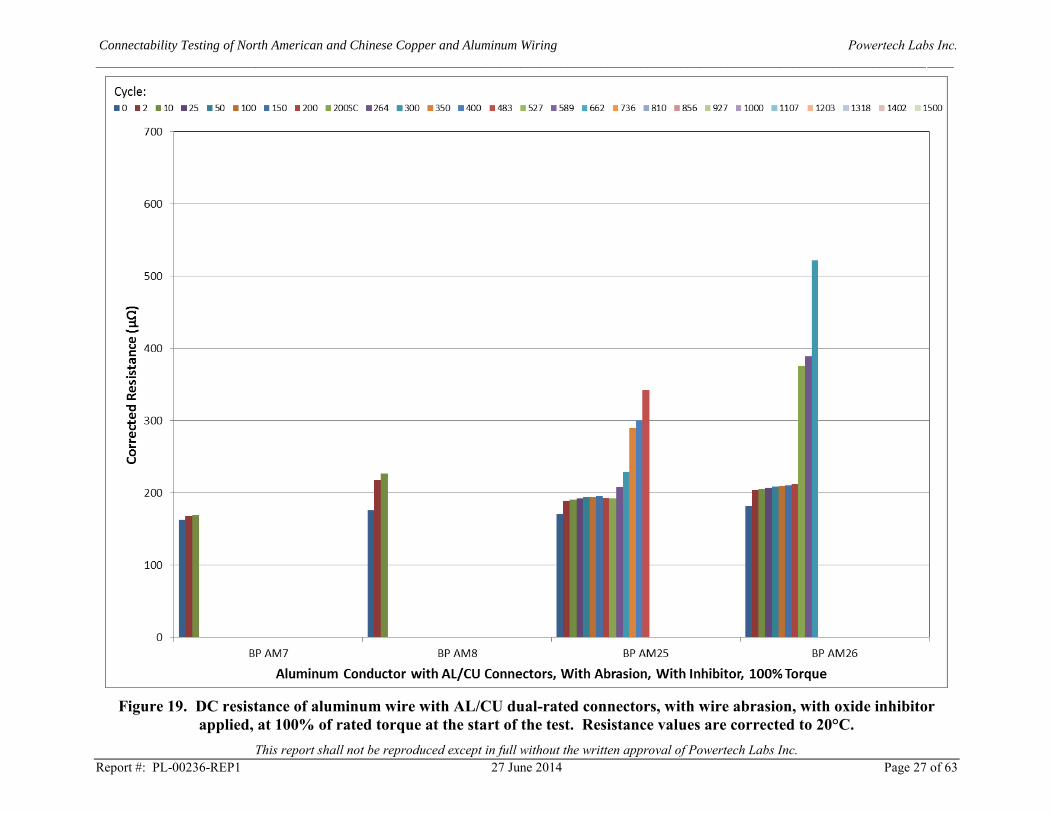
5.4 DC RESISTANCE AND PEAK TEMPERATURE RISE VALUES
DC resistance values were recorded and corrected for temperature to 20°C1. For comparison,
samples were grouped by wire type, connector type, and preparation. The resistance data for
each group of connectors is plotted in Figure 9 through Figure 24.
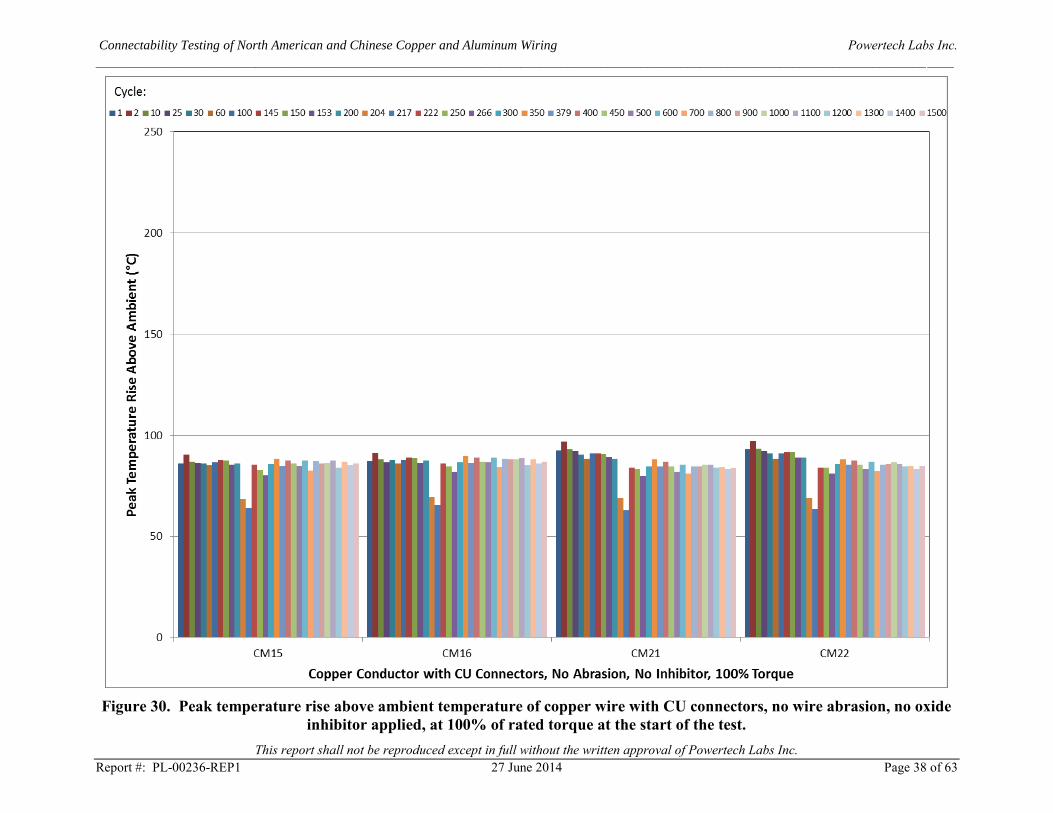
Peak temperature rise above ambient values are the maximum temperatures reached by each
connector in the selected cycles, minus the ambient temperature during that cycle. The peak
temperature rise above ambient data is plotted in Figure 25 through Figure 40.
1 Temperature correction is a standard calculation that uses the following formula to calculate the
resistance corrected to 20°C. This compensates for minor variations in the temperature at which the
connector resistance was measured.
Corrected Resistance
α = temperature coefficient of resistance
= 0.004 °C-1
θ = connector temperature at the time of measurement

Connectability Testing of North American and Chinese Copper and Aluminum Wiring Powertech Labs Inc.
_____________________________________________________________________________________________
This report shall not be reproduced except in full without the written approval of Powertech Labs Inc.
Report #: PL-00236-REP1 27 June 2014 Page 16 of 63
Comments on the plots:
Samples that overheated and were bypassed with a shunt jumper are labelled with the prefix
‘BP’. Bypassed samples had no further resistance and temperature measurements recorded
for the remainder of the test, and are considered to have ‘failed’ the test.
Samples that failed by melting through of the conductor are labelled with the prefix ‘F’.
The measurement made before the short-circuit test is labelled as ‘200’ in the legend.
The measurement made after the short-circuit test is labelled as ‘200SC’ in the legend.
There are occasional gaps in the peak temperature rise data, which are due to thermocouples
that became dislodged.
The fluctuations in the resistances and temperatures of the control samples give an indication
of the error limits of the readings and the normal random variations due to methodology.

Connectability Testing of North American and Chinese Copper and Aluminum Wiring Powertech Labs Inc.
_________________________________________________________________________________________________________________________________
This report shall not be reproduced except in full without the written approval of Powertech Labs Inc.
Report #: PL-00236-REP1 27 June 2014 Page 17 of 63
Figure 9. DC resistance of control conductor samples, corrected to 20°C.

Connectability Testing of North American and Chinese Copper and Aluminum Wiring Powertech Labs Inc.
_________________________________________________________________________________________________________________________________
This report shall not be reproduced except in full without the written approval of Powertech Labs Inc.
Report #: PL-00236-REP1 27 June 2014 Page 18 of 63
Figure 10. DC resistance of copper wire with AL/CU dual-rated connectors, no wire abrasion, no oxide inhibitor applied, at
125% of rated torque at the start of the test. Resistance values are corrected to 20°C.

Connectability Testing of North American and Chinese Copper and Aluminum Wiring Powertech Labs Inc.
_________________________________________________________________________________________________________________________________
This report shall not be reproduced except in full without the written approval of Powertech Labs Inc.
Report #: PL-00236-REP1 27 June 2014 Page 19 of 63
Figure 11. DC resistance of copper wire with AL/CU dual-rated connectors, no wire abrasion, no oxide inhibitor applied, at
100% of rated torque at the start of the test. Resistance values are corrected to 20°C.

Connectability Testing of North American and Chinese Copper and Aluminum Wiring Powertech Labs Inc.
_________________________________________________________________________________________________________________________________
This report shall not be reproduced except in full without the written approval of Powertech Labs Inc.
Report #: PL-00236-REP1 27 June 2014 Page 20 of 63
Figure 12. DC resistance of copper wire with AL/CU dual-rated connectors, no wire abrasion, no oxide inhibitor applied, at
70% of rated torque at the start of the test. Resistance values are corrected to 20°C.

Connectability Testing of North American and Chinese Copper and Aluminum Wiring Powertech Labs Inc.
_________________________________________________________________________________________________________________________________
This report shall not be reproduced except in full without the written approval of Powertech Labs Inc.
Report #: PL-00236-REP1 27 June 2014 Page 21 of 63
Figure 13. DC resistance of copper wire with CU connectors, no wire abrasion, no oxide inhibitor applied, at 125% of rated
torque at the start of the test. Resistance values are corrected to 20°C.

Connectability Testing of North American and Chinese Copper and Aluminum Wiring Powertech Labs Inc.
_________________________________________________________________________________________________________________________________
This report shall not be reproduced except in full without the written approval of Powertech Labs Inc.
Report #: PL-00236-REP1 27 June 2014 Page 22 of 63
Figure 14. DC resistance of copper wire with CU connectors, no wire abrasion, no oxide inhibitor applied, at 100% of rated
torque at the start of the test. Resistance values are corrected to 20°C.

Connectability Testing of North American and Chinese Copper and Aluminum Wiring Powertech Labs Inc.
_________________________________________________________________________________________________________________________________
This report shall not be reproduced except in full without the written approval of Powertech Labs Inc.
Report #: PL-00236-REP1 27 June 2014 Page 23 of 63
Figure 15. DC resistance of copper wire with CU connectors, no wire abrasion, no oxide inhibitor applied, at 70% of rated
torque at the start of the test. Resistance values are corrected to 20°C.

Connectability Testing of North American and Chinese Copper and Aluminum Wiring Powertech Labs Inc.
_________________________________________________________________________________________________________________________________
This report shall not be reproduced except in full without the written approval of Powertech Labs Inc.
Report #: PL-00236-REP1 27 June 2014 Page 24 of 63
Figure 16. DC resistance of aluminum wire with AL/CU dual-rated connectors, with wire abrasion, with oxide inhibitor
applied, at 125% of rated torque at the start of the test. Resistance values are corrected to 20°C.

Connectability Testing of North American and Chinese Copper and Aluminum Wiring Powertech Labs Inc.
_________________________________________________________________________________________________________________________________
This report shall not be reproduced except in full without the written approval of Powertech Labs Inc.
Report #: PL-00236-REP1 27 June 2014 Page 25 of 63
Figure 17. DC resistance of aluminum wire with AL/CU dual-rated connectors, no wire abrasion, with oxide inhibitor applied,
at 125% of rated torque at the start of the test. Resistance values are corrected to 20°C.

Connectability Testing of North American and Chinese Copper and Aluminum Wiring Powertech Labs Inc.
_________________________________________________________________________________________________________________________________
This report shall not be reproduced except in full without the written approval of Powertech Labs Inc.
Report #: PL-00236-REP1 27 June 2014 Page 26 of 63
Figure 18. DC resistance of aluminum wire with AL/CU dual-rated connectors, no wire abrasion, no oxide inhibitor applied,
at 125% of rated torque at the start of the test. Resistance values are corrected to 20°C.
Connectability Testing of North American and Chinese Copper and Aluminum Wiring Powertech Labs Inc.
_________________________________________________________________________________________________________________________________
This report shall not be reproduced except in full without the written approval of Powertech Labs Inc.
Report #: PL-00236-REP1 27 June 2014 Page 27 of 63
Figure 19. DC resistance of aluminum wire with AL/CU dual-rated connectors, with wire abrasion, with oxide inhibitor
applied, at 100% of rated torque at the start of the test. Resistance values are corrected to 20°C.

Connectability Testing of North American and Chinese Copper and Aluminum Wiring Powertech Labs Inc.
_________________________________________________________________________________________________________________________________
This report shall not be reproduced except in full without the written approval of Powertech Labs Inc.
Report #: PL-00236-REP1 27 June 2014 Page 28 of 63
Figure 20. DC resistance of aluminum wire with AL/CU dual-rated connectors, no wire abrasion, with oxide inhibitor applied,
at 100% of rated torque at the start of the test. Resistance values are corrected to 20°C.

Connectability Testing of North American and Chinese Copper and Aluminum Wiring Powertech Labs Inc.
_________________________________________________________________________________________________________________________________
This report shall not be reproduced except in full without the written approval of Powertech Labs Inc.
Report #: PL-00236-REP1 27 June 2014 Page 29 of 63
Figure 21. DC resistance of aluminum wire with AL/CU dual-rated connectors, no wire abrasion, no oxide inhibitor applied,
at 100% of rated torque at the start of the test. Resistance values are corrected to 20°C.

Connectability Testing of North American and Chinese Copper and Aluminum Wiring Powertech Labs Inc.
_________________________________________________________________________________________________________________________________
This report shall not be reproduced except in full without the written approval of Powertech Labs Inc.
Report #: PL-00236-REP1 27 June 2014 Page 30 of 63
Figure 22. DC resistance of aluminum wire with AL/CU dual-rated connectors, with wire abrasion, with oxide inhibitor
applied, at 70% of rated torque at the start of the test. Resistance values are corrected to 20°C.

Connectability Testing of North American and Chinese Copper and Aluminum Wiring Powertech Labs Inc.
_________________________________________________________________________________________________________________________________
This report shall not be reproduced except in full without the written approval of Powertech Labs Inc.
Report #: PL-00236-REP1 27 June 2014 Page 31 of 63
Figure 23. DC resistance of aluminum wire with AL/CU dual-rated connectors, no wire abrasion, with oxide inhibitor applied,
at 70% of rated torque at the start of the test. Resistance values are corrected to 20°C.

Connectability Testing of North American and Chinese Copper and Aluminum Wiring Powertech Labs Inc.
_________________________________________________________________________________________________________________________________
This report shall not be reproduced except in full without the written approval of Powertech Labs Inc.
Report #: PL-00236-REP1 27 June 2014 Page 32 of 63
Figure 24. DC resistance of aluminum wire with AL/CU dual-rated connectors, no wire abrasion, no oxide inhibitor applied,
at 70% of rated torque at the start of the test. Resistance values are corrected to 20°C.

Connectability Testing of North American and Chinese Copper and Aluminum Wiring Powertech Labs Inc.
_________________________________________________________________________________________________________________________________
This report shall not be reproduced except in full without the written approval of Powertech Labs Inc.
Report #: PL-00236-REP1 27 June 2014 Page 33 of 63
Figure 25. Peak temperature rise above ambient temperature of the control conductor samples.

Connectability Testing of North American and Chinese Copper and Aluminum Wiring Powertech Labs Inc.
_________________________________________________________________________________________________________________________________
This report shall not be reproduced except in full without the written approval of Powertech Labs Inc.
Report #: PL-00236-REP1 27 June 2014 Page 34 of 63
Figure 26. Peak temperature rise above ambient temperature of copper wire with AL/CU dual-rated connectors, no wire
abrasion, no oxide inhibitor applied, at 125% of rated torque at the start of the test.

Connectability Testing of North American and Chinese Copper and Aluminum Wiring Powertech Labs Inc.
_________________________________________________________________________________________________________________________________
This report shall not be reproduced except in full without the written approval of Powertech Labs Inc.
Report #: PL-00236-REP1 27 June 2014 Page 35 of 63
Figure 27. Peak temperature rise above ambient temperature of copper wire with AL/CU dual-rated connectors, no wire
abrasion, no oxide inhibitor applied, at 100% of rated torque at the start of the test.

Connectability Testing of North American and Chinese Copper and Aluminum Wiring Powertech Labs Inc.
_________________________________________________________________________________________________________________________________
This report shall not be reproduced except in full without the written approval of Powertech Labs Inc.
Report #: PL-00236-REP1 27 June 2014 Page 36 of 63
Figure 28. Peak temperature rise above ambient temperature of copper wire with AL/CU dual-rated connectors, no wire
abrasion, no oxide inhibitor applied, at 70% of rated torque at the start of the test.

Connectability Testing of North American and Chinese Copper and Aluminum Wiring Powertech Labs Inc.
_________________________________________________________________________________________________________________________________
This report shall not be reproduced except in full without the written approval of Powertech Labs Inc.
Report #: PL-00236-REP1 27 June 2014 Page 37 of 63
Figure 29. Peak temperature rise above ambient temperature of copper wire with CU connectors, no wire abrasion, no oxide
inhibitor applied, at 125% of rated torque at the start of the test.
Connectability Testing of North American and Chinese Copper and Aluminum Wiring Powertech Labs Inc.
_________________________________________________________________________________________________________________________________
This report shall not be reproduced except in full without the written approval of Powertech Labs Inc.
Report #: PL-00236-REP1 27 June 2014 Page 38 of 63
Figure 30. Peak temperature rise above ambient temperature of copper wire with CU connectors, no wire abrasion, no oxide
inhibitor applied, at 100% of rated torque at the start of the test.

Connectability Testing of North American and Chinese Copper and Aluminum Wiring Powertech Labs Inc.
_________________________________________________________________________________________________________________________________
This report shall not be reproduced except in full without the written approval of Powertech Labs Inc.
Report #: PL-00236-REP1 27 June 2014 Page 39 of 63
Figure 31. Peak temperature rise above ambient temperature of copper wire with CU connectors, no wire abrasion, no oxide
inhibitor applied, at 70% of rated torque at the start of the test.

Connectability Testing of North American and Chinese Copper and Aluminum Wiring Powertech Labs Inc.
_________________________________________________________________________________________________________________________________
This report shall not be reproduced except in full without the written approval of Powertech Labs Inc.
Report #: PL-00236-REP1 27 June 2014 Page 40 of 63
Figure 32. Peak temperature rise above ambient temperature of aluminum wire with AL/CU dual-rated connectors, with wire
abrasion, with oxide inhibitor applied, at 125% of rated torque at the start of the test.

Connectability Testing of North American and Chinese Copper and Aluminum Wiring Powertech Labs Inc.
_________________________________________________________________________________________________________________________________
This report shall not be reproduced except in full without the written approval of Powertech Labs Inc.
Report #: PL-00236-REP1 27 June 2014 Page 41 of 63
Figure 33. Peak temperature rise above ambient temperature of aluminum wire with AL/CU dual-rated connectors, no wire
abrasion, with oxide inhibitor applied, at 125% of rated torque at the start of the test.

Connectability Testing of North American and Chinese Copper and Aluminum Wiring Powertech Labs Inc.
_________________________________________________________________________________________________________________________________
This report shall not be reproduced except in full without the written approval of Powertech Labs Inc.
Report #: PL-00236-REP1 27 June 2014 Page 42 of 63
Figure 34. Peak temperature rise above ambient temperature of aluminum wire with AL/CU dual-rated connectors, no wire
abrasion, no oxide inhibitor applied, at 125% of rated torque at the start of the test.

Connectability Testing of North American and Chinese Copper and Aluminum Wiring Powertech Labs Inc.
_________________________________________________________________________________________________________________________________
This report shall not be reproduced except in full without the written approval of Powertech Labs Inc.
Report #: PL-00236-REP1 27 June 2014 Page 43 of 63
Figure 35. Peak temperature rise above ambient temperature of aluminum wire with AL/CU dual-rated connectors, with wire
abrasion, with oxide inhibitor applied, at 100% of rated torque at the start of the test.

Connectability Testing of North American and Chinese Copper and Aluminum Wiring Powertech Labs Inc.
_________________________________________________________________________________________________________________________________
This report shall not be reproduced except in full without the written approval of Powertech Labs Inc.
Report #: PL-00236-REP1 27 June 2014 Page 44 of 63
Figure 36. Peak temperature rise above ambient temperature of aluminum wire with AL/CU dual-rated connectors, no wire
abrasion, with oxide inhibitor applied, at 100% of rated torque at the start of the test.

Connectability Testing of North American and Chinese Copper and Aluminum Wiring Powertech Labs Inc.
_________________________________________________________________________________________________________________________________
This report shall not be reproduced except in full without the written approval of Powertech Labs Inc.
Report #: PL-00236-REP1 27 June 2014 Page 45 of 63
Figure 37. Peak temperature rise above ambient temperature of aluminum wire with AL/CU dual-rated connectors, no wire
abrasion, no oxide inhibitor applied, at 100% of rated torque at the start of the test.

Connectability Testing of North American and Chinese Copper and Aluminum Wiring Powertech Labs Inc.
_________________________________________________________________________________________________________________________________
This report shall not be reproduced except in full without the written approval of Powertech Labs Inc.
Report #: PL-00236-REP1 27 June 2014 Page 46 of 63
Figure 38. Peak temperature rise above ambient temperature of aluminum wire with AL/CU dual-rated connectors, with wire
abrasion, with oxide inhibitor applied, at 70% of rated torque at the start of the test.

Connectability Testing of North American and Chinese Copper and Aluminum Wiring Powertech Labs Inc.
_________________________________________________________________________________________________________________________________
This report shall not be reproduced except in full without the written approval of Powertech Labs Inc.
Report #: PL-00236-REP1 27 June 2014 Page 47 of 63
Figure 39. Peak temperature rise above ambient temperature of aluminum wire with AL/CU dual-rated connectors, no wire
abrasion, with oxide inhibitor applied, at 70% of rated torque at the start of the test.

Connectability Testing of North American and Chinese Copper and Aluminum Wiring Powertech Labs Inc.
_________________________________________________________________________________________________________________________________
This report shall not be reproduced except in full without the written approval of Powertech Labs Inc.
Report #: PL-00236-REP1 27 June 2014 Page 48 of 63
Figure 40. Peak temperature rise above ambient temperature of aluminum wire with AL/CU dual-rated connectors, no wire
abrasion, no oxide inhibitor applied, at 70% of rated torque at the start of the test.

Connectability Testing of North American and Chinese Copper and Aluminum Wiring Powertech Labs Inc.
_____________________________________________________________________________________________
This report shall not be reproduced except in full without the written approval of Powertech Labs Inc.
Report #: PL-00236-REP1 27 June 2014 Page 49 of 63
5.5 SAMPLES REMOVED DURING TESTING DUE TO ‘FAILURE’
The list of samples that overheated or failed during testing are listed in Table 4, in order of the
cycle in which they overheated or failed.
Table 4. Samples that were bypassed due to overheating or failure.
Failed at
cycle
Sample
No. Abrasion Inhibitor
Torque
/Compression Conductor Type
Connector
Rating
1 AM30 N N 100% 2/0 Al Mechanical AL/CU
1 AM35 N N 70% 2/0 Al Mechanical AL/CU
3 AM3 N Y 125% 2/0 Al Mechanical AL/CU
3 AM4 N Y 125% 2/0 Al Mechanical AL/CU
25 AM7 Y Y 100% 2/0 Al Mechanical AL/CU
25 AM8 Y Y 100% 2/0 Al Mechanical AL/CU
25 AM15 N Y 70% 2/0 Al Mechanical AL/CU
25 AM16 N Y 70% 2/0 Al Mechanical AL/CU
145 AM9 N Y 100% 2/0 Al Mechanical AL/CU
153 AM33 N Y 70% 2/0 Al Mechanical AL/CU
153 AM34 N Y 70% 2/0 Al Mechanical AL/CU
200 AM32 Y Y 70% 2/0 Al Mechanical AL/CU
201 AM11 N N 100% 2/0 Al Mechanical AL/CU
201 AM12 N N 100% 2/0 Al Mechanical AL/CU
204 AM6 N N 125% 2/0 Al Mechanical AL/CU
204 AM10 N Y 100% 2/0 Al Mechanical AL/CU
204 AM31 Y Y 70% 2/0 Al Mechanical AL/CU
204 AM36 N N 70% 2/0 Al Mechanical AL/CU
217 AM27 N Y 100% 2/0 Al Mechanical AL/CU
217 AM28 N Y 100% 2/0 Al Mechanical AL/CU
222 AM29 N N 100% 2/0 Al Mechanical AL/CU
266 AM13 Y Y 70% 2/0 Al Mechanical AL/CU
266 AM14 Y Y 70% 2/0 Al Mechanical AL/CU
303 AM26 Y Y 100% 2/0 Al Mechanical AL/CU
379 AM18 N N 70% 2/0 Al Mechanical AL/CU
487 AM25 Y Y 100% 2/0 Al Mechanical AL/CU
523 CM4 N N 100% #1 Cu Mechanical AL/CU
941 CM1 N N 125% #1 Cu Mechanical AL/CU

Connectability Testing of North American and Chinese Copper and Aluminum Wiring Powertech Labs Inc.
_____________________________________________________________________________________________
This report shall not be reproduced except in full without the written approval of Powertech Labs Inc.
Report #: PL-00236-REP1 27 June 2014 Page 50 of 63
5.6 ANALYSIS OF THE RESULTS
The results were analyzed by comparing the change in corrected resistances and peak
temperature rises above ambient for each type of connector sample at the end of the test. The
change in resistance was determined as the percent difference between the values after 1500
cycles compared to the values after 25 cycles. A plot of the change in resistance for each
connector after 1500 current cycles is shown in Figure 41. The peak temperature rise was
determined as the difference between the peak connector temperature and the peak control
conductor temperature at the end of the test. A plot of the temperature rise difference between
each connector and the control conductors at 1500 current cycles is shown in Figure 42.
Table 5 gives a summary of the results for the connector samples by change in resistance and
temperature, grouped by the type and preparation of the samples.
Table 5. Summary of sample performance by type and preparation.
Type Conductor Connector
Rating Abrasion Inhibitor Torque
Total
No.
Units
No.
Showing
>10%
increase in
resistance
No. with
Connector
Temp. >
Control
Temp.
No.
Failed
Mechanical #1 Cu AL/CU N N 125% 4 2 1 1
Mechanical #1 Cu AL/CU N N 100% 4 1 1 1
Mechanical #1 Cu AL/CU N N 70% 4 1 1 0
Mechanical #1 Cu CU N N 125% 4 0 0 0
Mechanical #1 Cu CU N N 100% 4 0 0 0
Mechanical #1 Cu CU N N 70% 4 0 0 0
Mechanical 2/0 Al AL/CU Y Y 125% 4 1 2 0
Mechanical 2/0 Al AL/CU N Y 125% 4 4 4 2
Mechanical 2/0 Al AL/CU N N 125% 4 2 4 1
Mechanical 2/0 Al AL/CU Y Y 100% 4 4 4 4
Mechanical 2/0 Al AL/CU N Y 100% 4 4 4 4
Mechanical 2/0 Al AL/CU N N 100% 4 4 4 4
Mechanical 2/0 Al AL/CU Y Y 70% 4 4 4 4
Mechanical 2/0 Al AL/CU N Y 70% 4 4 4 4
Mechanical 2/0 Al AL/CU N N 70% 4 4 4 3

Connectability Testing of North American and Chinese Copper and Aluminum Wiring Powertech Labs Inc.
_________________________________________________________________________________________________________________________________
This report shall not be reproduced except in full without the written approval of Powertech Labs Inc.
Report #: PL-00236-REP1 27 June 2014 Page 51 of 63
Figure 41. Change in corrected resistance from cycle 25 to cycle 1500 for each sample. Samples are grouped by type and
preparation. Solid bars indicate samples that failed and were removed from the test.

Connectability Testing of North American and Chinese Copper and Aluminum Wiring Powertech Labs Inc.
_________________________________________________________________________________________________________________________________
This report shall not be reproduced except in full without the written approval of Powertech Labs Inc.
Report #: PL-00236-REP1 27 June 2014 Page 52 of 63
Figure 42. Difference between connector temperature rise and control conductor temperature rise after cycle 1500 for each
sample. Samples are grouped by type and preparation. Solid bars indicate samples that failed and were removed from the test.

Connectability Testing of North American and Chinese Copper and Aluminum Wiring Powertech Labs Inc.
_____________________________________________________________________________________________
This report shall not be reproduced except in full without the written approval of Powertech Labs Inc.
Report #: PL-00236-REP1 27 June 2014 Page 53 of 63
6. ANALYSIS BY IEC 61238-1 METHODOLOGY
The standard IEC 61238-1 (2003-05), “Compression and mechanical connectors for power
cables for rated voltages up to 30 kV (Um = 36 kV)”, was used as a guide for evaluating
samples. The standard uses the following criteria to evaluate the performance:
Initial scatter of resistance values for all connectors of the same type at the start of the test.
Mean scatter of resistance values for all connectors of the same type throughout the test.
Change in resistance factor2 of each connector throughout the test.
Resistance factor ratio of each connector, comparing the resistance factor at the end of the
test to the start of the test.
Maximum temperature difference between each connector compared to the control
(reference) conductor temperature.
Evaluation of the values up to cycle 1000.
Of these values, the initial scatter and mean scatter are not applicable since there are not enough
samples of each type and preparation to make these values meaningful. Due to variations in the
test procedure compared to the IEC standard procedure, the change in resistance factor was not
evaluated.
The maximum values required by IEC 61238-1 are:
Resistance factor ratio ≤ 2.0
Maximum connector temperature ≤ θref (θref = max. temperature of the control conductor)
A summary of the IEC analysis is shown in Table 6. The resistance ratio values and maximum
connector temperature for each type of connector are summarized in Table 7 and Table 8
respectively, and are shown in Figure 43 and Figure 44.
2 The resistance factor is a dimensionless value that is defined as the ratio of the resistance per unit length
of the connector to that for the control conductor.

Connectability Testing of North American and Chinese Copper and Aluminum Wiring Powertech Labs Inc.
_____________________________________________________________________________________________
This report shall not be reproduced except in full without the written approval of Powertech Labs Inc.
Report #: PL-00236-REP1 27 June 2014 Page 54 of 63
Table 6. Summary of IEC Analysis.
Conductor Connector
Rating Abrasion Inhibitor Torque
Results of IEC Analysis (see Note (1) below)
Resistance Factor
Ratio
Maximum
Temperature
Difference (sample-
control)
No. Pass No. Fail
No. Pass No. Fail
#1 Cu AL/CU N N 125% 1 3 2 2
#1 Cu AL/CU N N 100% 2 2 2 2
#1 Cu AL/CU N N 70% 2 2 4 0
#1 Cu CU N N 125% 4 0 4 0
#1 Cu CU N N 100% 4 0 2 2(2)
#1 Cu CU N N 70% 4 0 3 1(2)
2/0 Al AL/CU Y Y 125% 2 2 2 2
2/0 Al AL/CU N Y 125% 1 3 0 4
2/0 Al AL/CU N N 125% 1 3 0 4
2/0 Al AL/CU Y Y 100% 0 4 0 4
2/0 Al AL/CU N Y 100% 0 4 0 4
2/0 Al AL/CU N N 100% 0 4 0 4
2/0 Al AL/CU Y Y 70% 0 4 0 4
2/0 Al AL/CU N Y 70% 0 4 0 4
2/0 Al AL/CU N N 70% 0 4 0 4
Note (1):
- Any resistance factor ratio > 2.0 or maximum connector temperature that exceeds the control
conductor temperature at any time during the test is considered a ‘failure’ by IEC. There is
no method to differentiate connectors that exceeded the limit by a small amount and those
that exceeded the limit by a large amount. There is also no allowance for connectors that
briefly exceed the limit in the middle of the test, but then drop below the limit by the end of
the test.
Note (2):
- The copper connectors on copper wire, with 100% and 70% torque applied, exceeded the
control conductor temperature by a small amount in the middle of the test, but dropped below
the control conductor temperature by the end of the test.

Connectability Testing of North American and Chinese Copper and Aluminum Wiring Powertech Labs Inc.
_____________________________________________________________________________________________
This report shall not be reproduced except in full without the written approval of Powertech Labs Inc.
Report #: PL-00236-REP1 27 June 2014 Page 55 of 63
Table 7. Results of evaluation of resistance factor ratio for IEC.
Sample
No. Conductor
Connector
Rating Abrasion Inhibitor Torque
Resistance factor
ratio Pass/Fail
BP CM1 #1 Cu AL/CU N N 125% did not finish fail
CM2 #1 Cu AL/CU N N 125% 3.17 fail
CM7 #1 Cu AL/CU N N 125% 2.07 fail
CM8 #1 Cu AL/CU N N 125% 1.72 pass
CM3 #1 Cu AL/CU N N 100% 9.16 fail
BP CM4 #1 Cu AL/CU N N 100% did not finish fail
CM9 #1 Cu AL/CU N N 100% 1.84 pass
CM10 #1 Cu AL/CU N N 100% 1.89 pass
CM5 #1 Cu AL/CU N N 70% 2.81 fail
CM6 #1 Cu AL/CU N N 70% 2.28 fail
CM11 #1 Cu AL/CU N N 70% 1.93 pass
CM12 #1 Cu AL/CU N N 70% 1.76 pass
CM13 #1 Cu CU N N 125% 1.33 pass
CM14 #1 Cu CU N N 125% 1.35 pass
CM19 #1 Cu CU N N 125% 1.18 pass
CM20 #1 Cu CU N N 125% 1.48 pass
CM15 #1 Cu CU N N 100% 1.40 pass
CM16 #1 Cu CU N N 100% 1.28 pass
CM21 #1 Cu CU N N 100% 1.17 pass
CM22 #1 Cu CU N N 100% 1.00 pass
CM17 #1 Cu CU N N 70% 1.14 pass
CM18 #1 Cu CU N N 70% 1.25 pass
CM23 #1 Cu CU N N 70% 1.41 pass
CM24 #1 Cu CU N N 70% 1.43 pass
AM1 2/0 Al AL/CU Y Y 125% 1.94 pass
AM2 2/0 Al AL/CU Y Y 125% 1.49 pass
AM19 2/0 Al AL/CU Y Y 125% 3.25 fail
AM20 2/0 Al AL/CU Y Y 125% 2.26 fail
BP AM3 2/0 Al AL/CU N Y 125% did not finish fail
BP AM4 2/0 Al AL/CU N Y 125% did not finish fail
AM21 2/0 Al AL/CU N Y 125% 3.51 fail
AM22 2/0 Al AL/CU N Y 125% 1.95 pass
AM5 2/0 Al AL/CU N N 125% 5.42 fail
BP AM6 2/0 Al AL/CU N N 125% did not finish fail
AM23 2/0 Al AL/CU N N 125% 2.77 fail
AM24 2/0 Al AL/CU N N 125% 1.58 pass

Connectability Testing of North American and Chinese Copper and Aluminum Wiring Powertech Labs Inc.
_____________________________________________________________________________________________
This report shall not be reproduced except in full without the written approval of Powertech Labs Inc.
Report #: PL-00236-REP1 27 June 2014 Page 56 of 63
Table 8. Results of evaluation of resistance factor ratio for IEC – cont’d.
Sample
No. Conductor
Connector
Rating Abrasion Inhibitor Torque
Difference Between
Connector and
Control
Temperature
Pass/Fail
BP AM7 2/0 Al AL/CU Y Y 100% did not finish fail
BP AM8 2/0 Al AL/CU Y Y 100% did not finish fail
BP AM25 2/0 Al AL/CU Y Y 100% did not finish fail
BP AM26 2/0 Al AL/CU Y Y 100% did not finish fail
BP AM9 2/0 Al AL/CU N Y 100% did not finish fail
BP AM10 2/0 Al AL/CU N Y 100% did not finish fail
BP AM27 2/0 Al AL/CU N Y 100% did not finish fail
BP AM28 2/0 Al AL/CU N Y 100% did not finish fail
BP AM11 2/0 Al AL/CU N N 100% did not finish fail
BP AM12 2/0 Al AL/CU N N 100% did not finish fail
BP AM29 2/0 Al AL/CU N N 100% did not finish fail
BP AM30 2/0 Al AL/CU N N 100% did not finish fail
BP AM13 2/0 Al AL/CU Y Y 70% did not finish fail
BP AM14 2/0 Al AL/CU Y Y 70% did not finish fail
BP AM31 2/0 Al AL/CU Y Y 70% did not finish fail
F AM32 2/0 Al AL/CU Y Y 70% did not finish fail
BP AM15 2/0 Al AL/CU N Y 70% did not finish fail
BP AM16 2/0 Al AL/CU N Y 70% did not finish fail
BP AM33 2/0 Al AL/CU N Y 70% did not finish fail
BP AM34 2/0 Al AL/CU N Y 70% did not finish fail
AM17 2/0 Al AL/CU N N 70% 5.27 fail
BP AM18 2/0 Al AL/CU N N 70% did not finish fail
BP AM35 2/0 Al AL/CU N N 70% did not finish fail
BP AM36 2/0 Al AL/CU N N 70% did not finish fail

Connectability Testing of North American and Chinese Copper and Aluminum Wiring Powertech Labs Inc.
_____________________________________________________________________________________________
This report shall not be reproduced except in full without the written approval of Powertech Labs Inc.
Report #: PL-00236-REP1 27 June 2014 Page 57 of 63
Table 9. Results of evaluation of maximum connector temperature for IEC.
Sample
No. Conductor
Connector
Rating Abrasion Inhibitor Torque
Difference Between
Connector and
Control
Temperature
Pass/Fail
BP CM1 #1 Cu AL/CU N N 125% did not finish fail
CM2 #1 Cu AL/CU N N 125% 28.95 fail
CM7 #1 Cu AL/CU N N 125% -8.55 pass
CM8 #1 Cu AL/CU N N 125% -7.95 pass
CM3 #1 Cu AL/CU N N 100% 54.45 fail
BP CM4 #1 Cu AL/CU N N 100% did not finish fail
CM9 #1 Cu AL/CU N N 100% -7.4 pass
CM10 #1 Cu AL/CU N N 100% -5.8 pass
CM5 #1 Cu AL/CU N N 70% -0.65 pass
CM6 #1 Cu AL/CU N N 70% -8.15 pass
CM11 #1 Cu AL/CU N N 70% -2.15 pass
CM12 #1 Cu AL/CU N N 70% -0.35 pass
CM13 #1 Cu CU N N 125% -3.35 pass
CM14 #1 Cu CU N N 125% -2.55 pass
CM19 #1 Cu CU N N 125% -8.05 pass
CM20 #1 Cu CU N N 125% -8.05 pass
CM15 #1 Cu CU N N 100% -3.05 pass
CM16 #1 Cu CU N N 100% -1.25 pass
CM21 #1 Cu CU N N 100% 1.35 fail
CM22 #1 Cu CU N N 100% 2.05 fail
CM17 #1 Cu CU N N 70% 3.95 fail
CM18 #1 Cu CU N N 70% -0.55 pass
CM23 #1 Cu CU N N 70% -4.95 pass
CM24 #1 Cu CU N N 70% -5.95 pass
AM1 2/0 Al AL/CU Y Y 125% -7.5 pass
AM2 2/0 Al AL/CU Y Y 125% -3.7 pass
AM19 2/0 Al AL/CU Y Y 125% 37.9 fail
AM20 2/0 Al AL/CU Y Y 125% 39.05 fail
BP AM3 2/0 Al AL/CU N Y 125% did not finish fail
BP AM4 2/0 Al AL/CU N Y 125% did not finish fail
AM21 2/0 Al AL/CU N Y 125% 45.95 fail
AM22 2/0 Al AL/CU N Y 125% 32.15 fail
AM5 2/0 Al AL/CU N N 125% 52.5 fail
BP AM6 2/0 Al AL/CU N N 125% did not finish fail
AM23 2/0 Al AL/CU N N 125% 50.15 fail
AM24 2/0 Al AL/CU N N 125% 47.35 fail

Connectability Testing of North American and Chinese Copper and Aluminum Wiring Powertech Labs Inc.
_____________________________________________________________________________________________
This report shall not be reproduced except in full without the written approval of Powertech Labs Inc.
Report #: PL-00236-REP1 27 June 2014 Page 58 of 63
Table 10. Results of evaluation of maximum connector temperature for IEC – cont’d.
Sample
No. Conductor
Connector
Rating Abrasion Inhibitor Torque
Difference Between
Connector and
Control
Temperature
Pass/Fail
BP AM7 2/0 Al AL/CU Y Y 100% did not finish fail
BP AM8 2/0 Al AL/CU Y Y 100% did not finish fail
BP AM25 2/0 Al AL/CU Y Y 100% did not finish fail
BP AM26 2/0 Al AL/CU Y Y 100% did not finish fail
BP AM9 2/0 Al AL/CU N Y 100% did not finish fail
BP AM10 2/0 Al AL/CU N Y 100% did not finish fail
BP AM27 2/0 Al AL/CU N Y 100% did not finish fail
BP AM28 2/0 Al AL/CU N Y 100% did not finish fail
BP AM11 2/0 Al AL/CU N N 100% did not finish fail
BP AM12 2/0 Al AL/CU N N 100% did not finish fail
BP AM29 2/0 Al AL/CU N N 100% did not finish fail
BP AM30 2/0 Al AL/CU N N 100% did not finish fail
BP AM13 2/0 Al AL/CU Y Y 70% did not finish fail
BP AM14 2/0 Al AL/CU Y Y 70% did not finish fail
BP AM31 2/0 Al AL/CU Y Y 70% did not finish fail
F AM32 2/0 Al AL/CU Y Y 70% did not finish fail
BP AM15 2/0 Al AL/CU N Y 70% did not finish fail
BP AM16 2/0 Al AL/CU N Y 70% did not finish fail
BP AM33 2/0 Al AL/CU N Y 70% did not finish fail
BP AM34 2/0 Al AL/CU N Y 70% did not finish fail
AM17 2/0 Al AL/CU N N 70% 116.6 fail
BP AM18 2/0 Al AL/CU N N 70% did not finish fail
BP AM35 2/0 Al AL/CU N N 70% did not finish fail
BP AM36 2/0 Al AL/CU N N 70% did not finish fail

Connectability Testing of North American and Chinese Copper and Aluminum Wiring Powertech Labs Inc.
_________________________________________________________________________________________________________________________________
This report shall not be reproduced except in full without the written approval of Powertech Labs Inc.
Report #: PL-00236-REP1 27 June 2014 Page 59 of 63
Figure 43. IEC resistance factor ratio for each sample, with the maximum IEC limit indicated by a line at 2.0. Samples are
grouped by type and preparation. Solid bars indicate samples that failed and were removed from the test.
Connectability Testing of North American and Chinese Copper and Aluminum Wiring Powertech Labs Inc.
_________________________________________________________________________________________________________________________________
This report shall not be reproduced except in full without the written approval of Powertech Labs Inc.
Report #: PL-00236-REP1 27 June 2014 Page 60 of 63
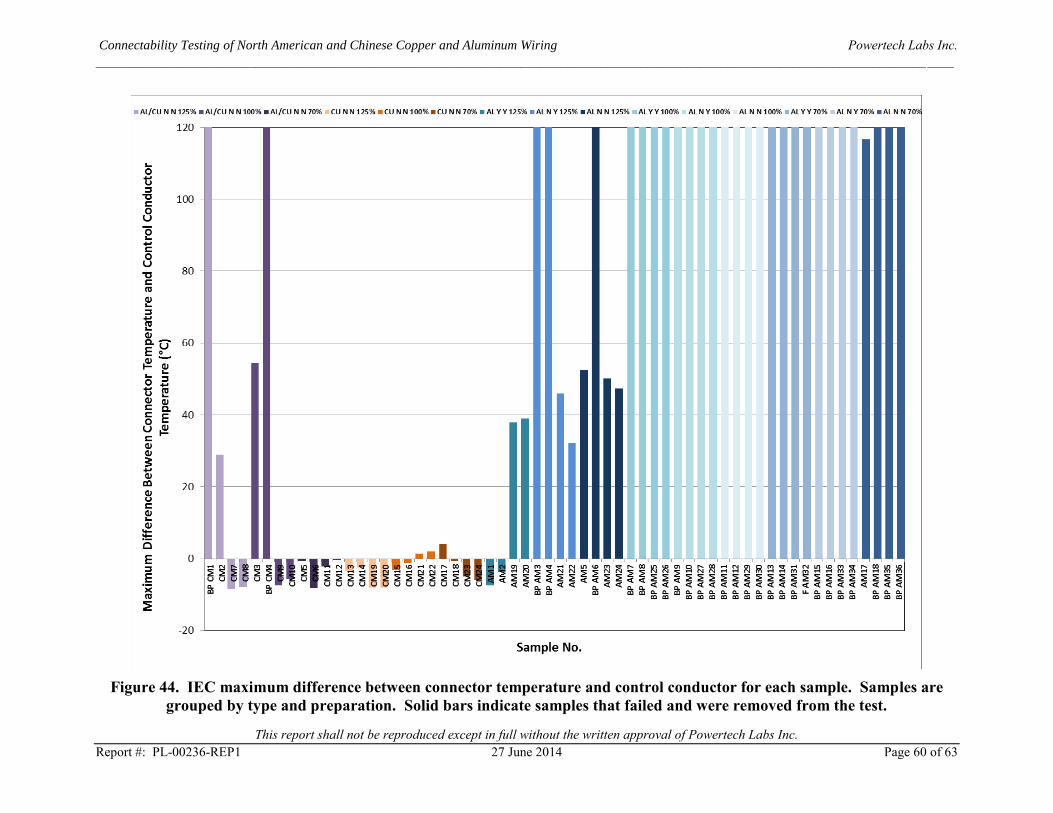
Figure 44. IEC maximum difference between connector temperature and control conductor for each sample. Samples are
grouped by type and preparation. Solid bars indicate samples that failed and were removed from the test.

Connectability Testing of North American and Chinese Copper and Aluminum Wiring Powertech Labs Inc.
_____________________________________________________________________________________________
This report shall not be reproduced except in full without the written approval of Powertech Labs Inc.
Report #: PL-00236-REP1 27 June 2014 Page 61 of 63
7. CONCLUSIONS
7.1 IEC ANALYSIS
The IEC analysis provides a quantified, standardized method of evaluating connectors.
However, because this analysis normalizes and averages the results over the full duration of the
test, it does not necessarily give a complete picture of the trends throughout the test. IEC also
considers failure of any sample in any of the evaluation criteria at any point in the test to be
failure of the test. In this test, no sample sets were able to achieve an overall ‘pass’ rating
according to IEC, so this evaluation criteria alone is not sufficient to compare the performance of
the different types of connectors. Overall, a good performing connector should exhibit a trend of
stability of resistance and temperature readings throughout the test, particularly during the latter
half of the test.
The general results of the IEC analysis were as follows:
1. Mechanical dual-rated (AL/CU) connectors on #1 AWG copper wire:
Resistance factor ratio: fail
Maximum connector temperature: fail
2. Mechanical copper (CU) connectors on #1 AWG copper wire:
Resistance factor ratio: pass
Maximum connector temperature: fail*
* Although the rating is a ‘fail’ by the strict interpretation of IEC analysis, the connector
temperatures exceeded the control conductor temperature only a small amount and for a few cycles
in the middle of the test.
3. Mechanical dual-rated (AL/CU) connectors on #2/0 AWG aluminum wire:
Resistance factor ratio: fail
Maximum connector temperature: fail
7.2 OVERALL CONCLUSIONS
The general conclusions from the testing to 1500 cycles are:
1. Mechanical dual-rated (AL/CU) connectors on #1 AWG copper wire: 33% of the
samples failed or showed a trend of significantly increasing resistance and temperature by the
end of the test. There was no definite correlation between performance and the torque level
applied to the connectors at the start of the test.
2. Mechanical copper (CU) connectors on #1 AWG copper wire: All samples had a
relatively stable resistance and temperature over the course of the test. No samples failed,
and none showed a trend of significantly increasing resistance and temperature by the end of
the test.

Connectability Testing of North American and Chinese Copper and Aluminum Wiring Powertech Labs Inc.
_____________________________________________________________________________________________
This report shall not be reproduced except in full without the written approval of Powertech Labs Inc.
Report #: PL-00236-REP1 27 June 2014 Page 62 of 63
3. Mechanical dual-rated (AL/CU) connectors on #2/0 AWG aluminum wire: 94% of the
samples failed or showed a trend of significantly increasing resistance and temperature by the
end of the test. The best performance was achieved by the samples that had been prepared
with the conductor wire brushed (abraded), oxide inhibitor applied, and a torque level of
125% of the rated torque.
A summary plot of the connector performance in the testing is shown in Figure 45.
The overall conclusions from the testing to 1500 current cycles are as follows:
1. The copper mechanical connectors on copper wire had the most stable resistance and
temperature readings, and performed the best during the test.
2. The aluminum (dual rated) mechanical connectors on copper wire performed relatively
poorly during the test, with 1/3 of the samples failing or showing elevated resistance and
temperature levels by the end of the test.
3. The aluminum (dual rated) mechanical connectors on aluminum wire performed very
poorly during the test, and had a very high failure rate even before the mid-point of the test.
Over 90% of the samples had either failed or showed elevated resistance and temperature
levels by the end of the test. There was no clear correlation between conductor preparation
method, torque level, and failure, except that the connectors that had been torqued to 125%
of the rated torque level seemed to perform slightly better than the others.

Connectability Testing of North American and Chinese Copper and Aluminum Wiring Powertech Labs Inc.
_________________________________________________________________________________________________________________________________
This report shall not be reproduced except in full without the written approval of Powertech Labs Inc.
Report #: PL-00236-REP1 27 June 2014 Page 63 of 63
Figure 45. Overall summary of the results.